Woodbury, NY Map & Demographics
Woodbury Map
Woodbury Overview
$47,790
PER CAPITA INCOME
$154,737
AVG FAMILY INCOME
$141,632
AVG HOUSEHOLD INCOME
30.9%
WAGE / INCOME GAP [ % ]
69.1¢/ $1
WAGE / INCOME GAP [ $ ]
0.37
INEQUALITY / GINI INDEX
11,371
TOTAL POPULATION
5,699
MALE POPULATION
5,672
FEMALE POPULATION
100.48
MALES / 100 FEMALES
99.53
FEMALES / 100 MALES
38.0
MEDIAN AGE
3.7
AVG FAMILY SIZE
3.2
AVG HOUSEHOLD SIZE
5,927
LABOR FORCE [ PEOPLE ]
66.1%
PERCENT IN LABOR FORCE
6.5%
UNEMPLOYMENT RATE
Woodbury Zip Codes
Income in Woodbury
Income Overview in Woodbury
Per Capita Income in Woodbury is $47,790, while median incomes of families and households are $154,737 and $141,632 respectively.
| Characteristic | Number | Measure |
| Per Capita Income | 11,371 | $47,790 |
| Median Family Income | 2,808 | $154,737 |
| Mean Family Income | 2,808 | $159,096 |
| Median Household Income | 3,517 | $141,632 |
| Mean Household Income | 3,517 | $154,258 |
| Income Deficit | 2,808 | $0 |
| Wage / Income Gap (%) | 11,371 | 30.90% |
| Wage / Income Gap ($) | 11,371 | 69.10¢ per $1 |
| Gini / Inequality Index | 11,371 | 0.37 |
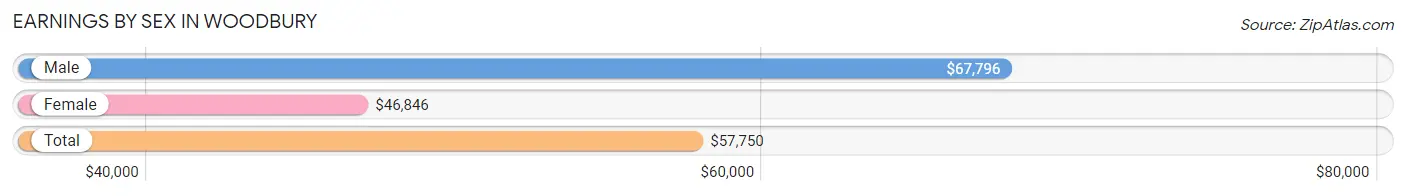
Earnings by Sex in Woodbury
Average Earnings in Woodbury are $57,750, $67,796 for men and $46,846 for women, a difference of 30.9%.
| Sex | Number | Average Earnings |
| Male | 3,403 (56.3%) | $67,796 |
| Female | 2,642 (43.7%) | $46,846 |
| Total | 6,045 (100.0%) | $57,750 |
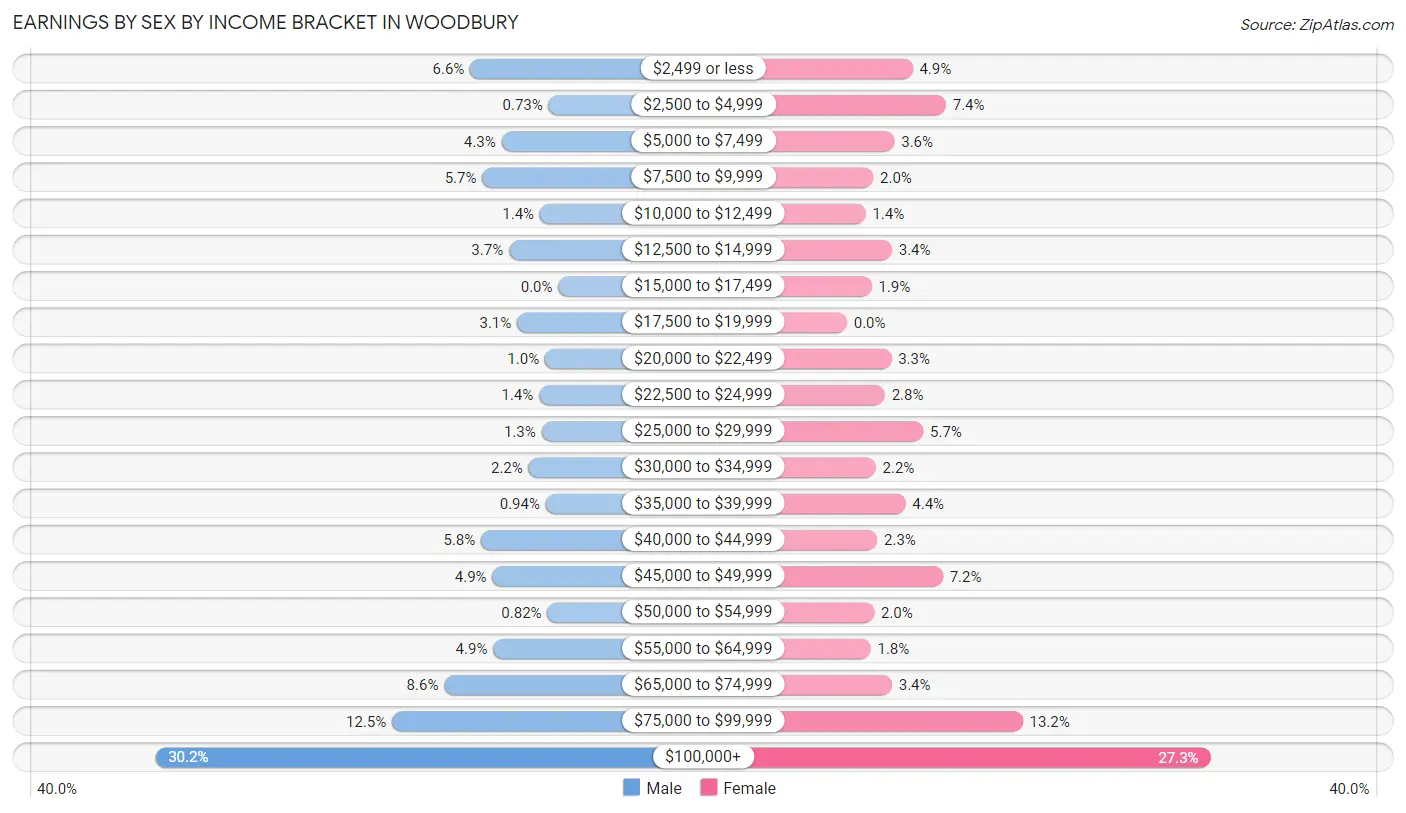
Earnings by Sex by Income Bracket in Woodbury
The most common earnings brackets in Woodbury are $100,000+ for men (1,028 | 30.2%) and $100,000+ for women (720 | 27.3%).
| Income | Male | Female |
| $2,499 or less | 225 (6.6%) | 130 (4.9%) |
| $2,500 to $4,999 | 25 (0.7%) | 196 (7.4%) |
| $5,000 to $7,499 | 145 (4.3%) | 94 (3.6%) |
| $7,500 to $9,999 | 194 (5.7%) | 52 (2.0%) |
| $10,000 to $12,499 | 47 (1.4%) | 37 (1.4%) |
| $12,500 to $14,999 | 126 (3.7%) | 89 (3.4%) |
| $15,000 to $17,499 | 0 (0.0%) | 49 (1.8%) |
| $17,500 to $19,999 | 105 (3.1%) | 0 (0.0%) |
| $20,000 to $22,499 | 34 (1.0%) | 88 (3.3%) |
| $22,500 to $24,999 | 49 (1.4%) | 75 (2.8%) |
| $25,000 to $29,999 | 43 (1.3%) | 151 (5.7%) |
| $30,000 to $34,999 | 76 (2.2%) | 57 (2.2%) |
| $35,000 to $39,999 | 32 (0.9%) | 116 (4.4%) |
| $40,000 to $44,999 | 197 (5.8%) | 60 (2.3%) |
| $45,000 to $49,999 | 168 (4.9%) | 190 (7.2%) |
| $50,000 to $54,999 | 28 (0.8%) | 54 (2.0%) |
| $55,000 to $64,999 | 166 (4.9%) | 47 (1.8%) |
| $65,000 to $74,999 | 291 (8.6%) | 89 (3.4%) |
| $75,000 to $99,999 | 424 (12.5%) | 348 (13.2%) |
| $100,000+ | 1,028 (30.2%) | 720 (27.3%) |
| Total | 3,403 (100.0%) | 2,642 (100.0%) |
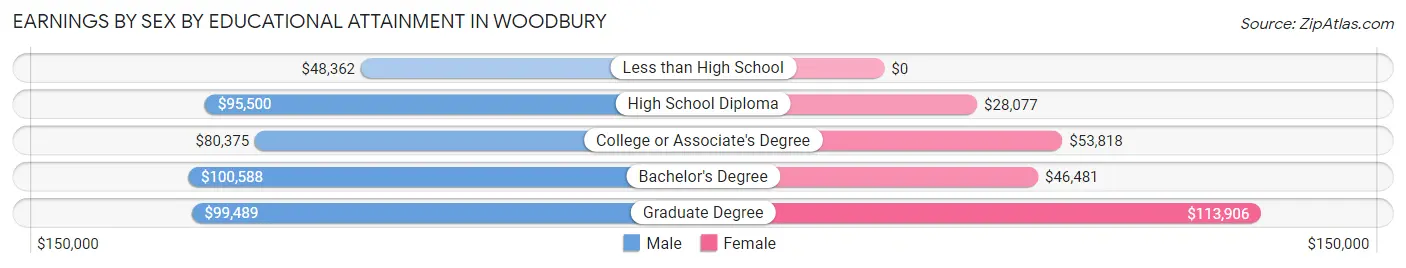
Earnings by Sex by Educational Attainment in Woodbury
Average earnings in Woodbury are $90,435 for men and $67,100 for women, a difference of 25.8%. Men with an educational attainment of bachelor's degree enjoy the highest average annual earnings of $100,588, while those with less than high school education earn the least with $48,362. Women with an educational attainment of graduate degree earn the most with the average annual earnings of $113,906, while those with high school diploma education have the smallest earnings of $28,077.
| Educational Attainment | Male Income | Female Income |
| Less than High School | $48,362 | $0 |
| High School Diploma | $95,500 | $28,077 |
| College or Associate's Degree | $80,375 | $53,818 |
| Bachelor's Degree | $100,588 | $46,481 |
| Graduate Degree | $99,489 | $113,906 |
| Total | $90,435 | $67,100 |
Family Income in Woodbury
Family Income Brackets in Woodbury
According to the Woodbury family income data, there are 1,033 families falling into the $200,000+ income range, which is the most common income bracket and makes up 36.8% of all families. Conversely, the less than $10,000 income bracket is the least frequent group with only 11 families (0.4%) belonging to this category.
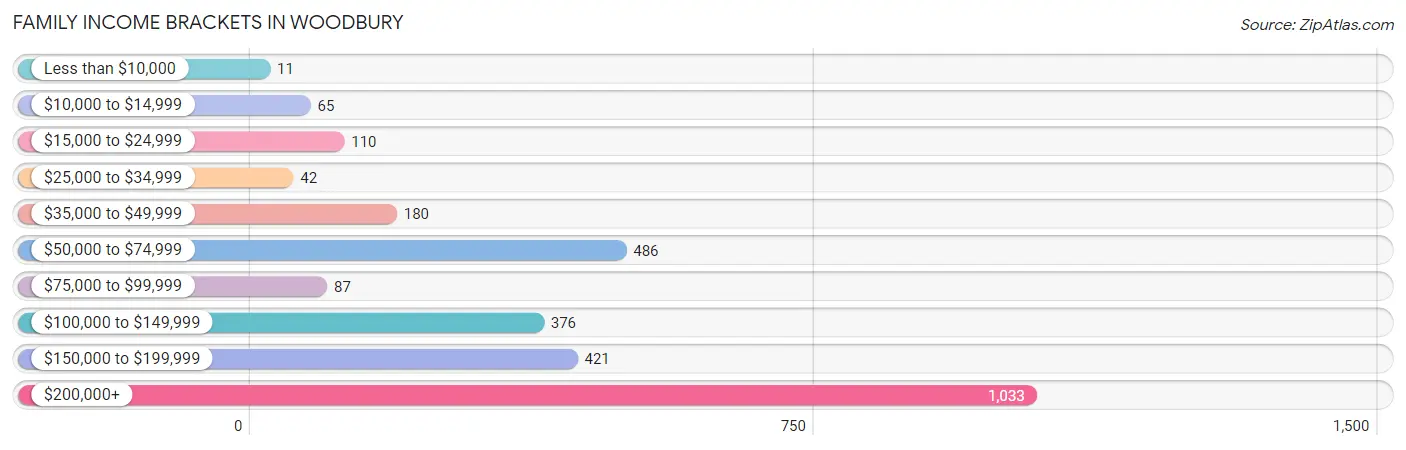
| Income Bracket | # Families | % Families |
| Less than $10,000 | 11 | 0.4% |
| $10,000 to $14,999 | 65 | 2.3% |
| $15,000 to $24,999 | 110 | 3.9% |
| $25,000 to $34,999 | 42 | 1.5% |
| $35,000 to $49,999 | 180 | 6.4% |
| $50,000 to $74,999 | 486 | 17.3% |
| $75,000 to $99,999 | 87 | 3.1% |
| $100,000 to $149,999 | 376 | 13.4% |
| $150,000 to $199,999 | 421 | 15.0% |
| $200,000+ | 1,033 | 36.8% |
Family Income by Famaliy Size in Woodbury
7+ person families (132 | 4.7%) account for the highest median family income in Woodbury with $221,029 per family, while 2-person families (707 | 25.2%) have the highest median income of $57,120 per family member.
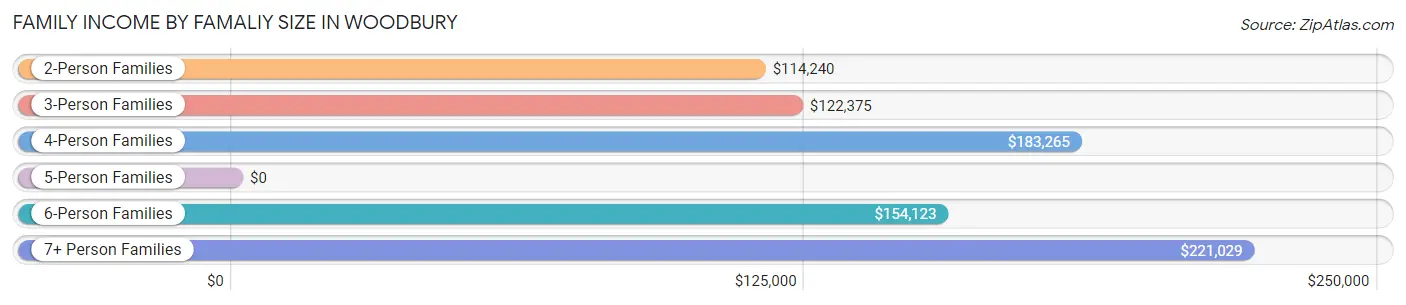
| Income Bracket | # Families | Median Income |
| 2-Person Families | 707 (25.2%) | $114,240 |
| 3-Person Families | 805 (28.7%) | $122,375 |
| 4-Person Families | 832 (29.6%) | $183,265 |
| 5-Person Families | 236 (8.4%) | $0 |
| 6-Person Families | 96 (3.4%) | $154,123 |
| 7+ Person Families | 132 (4.7%) | $221,029 |
| Total | 2,808 (100.0%) | $154,737 |
Family Income by Number of Earners in Woodbury
The median family income in Woodbury is $154,737, with families comprising 3+ earners (665) having the highest median family income of $220,625, while families with no earners (314) have the lowest median family income of $65,625, accounting for 23.7% and 11.2% of families, respectively.
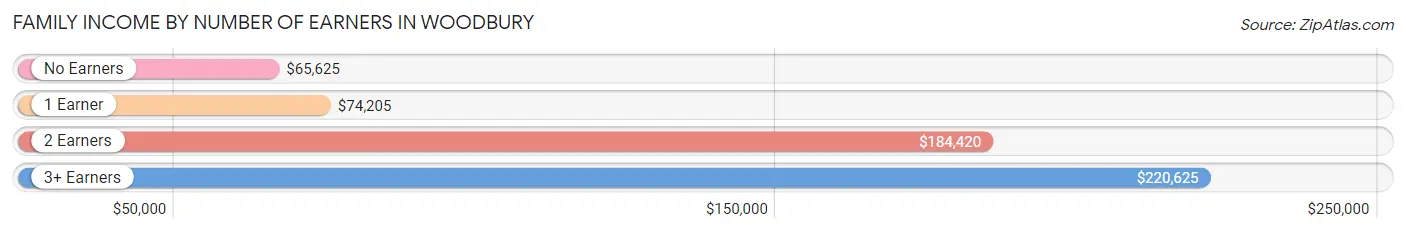
| Number of Earners | # Families | Median Income |
| No Earners | 314 (11.2%) | $65,625 |
| 1 Earner | 889 (31.7%) | $74,205 |
| 2 Earners | 940 (33.5%) | $184,420 |
| 3+ Earners | 665 (23.7%) | $220,625 |
| Total | 2,808 (100.0%) | $154,737 |
Household Income in Woodbury
Household Income Brackets in Woodbury
With 1,164 households falling in the category, the $200,000+ income range is the most frequent in Woodbury, accounting for 33.1% of all households. In contrast, only 63 households (1.8%) fall into the $25,000 to $34,999 income bracket, making it the least populous group.
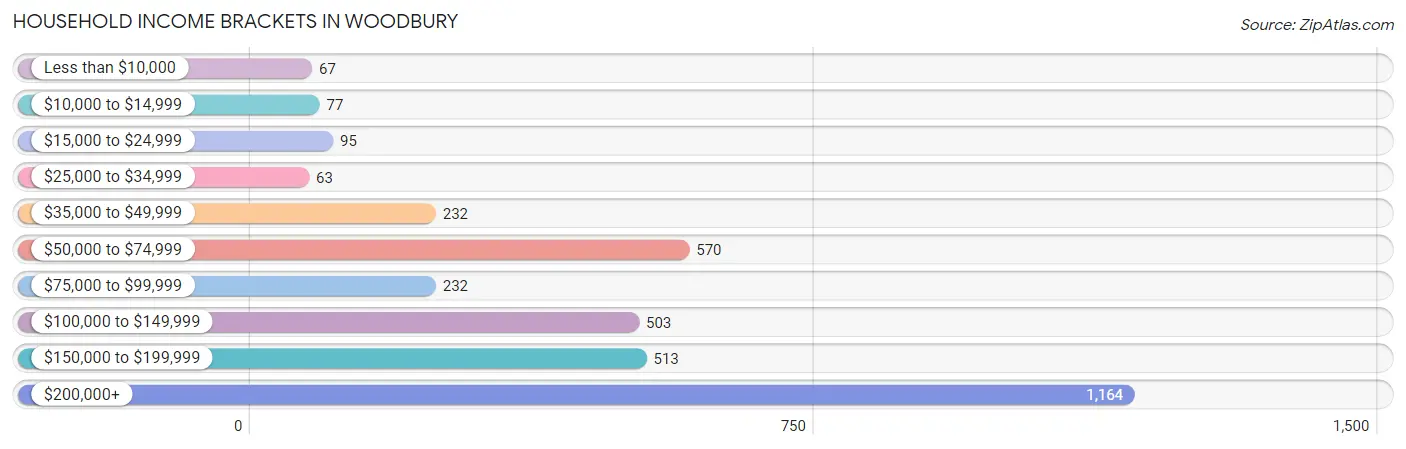
| Income Bracket | # Households | % Households |
| Less than $10,000 | 67 | 1.9% |
| $10,000 to $14,999 | 77 | 2.2% |
| $15,000 to $24,999 | 95 | 2.7% |
| $25,000 to $34,999 | 63 | 1.8% |
| $35,000 to $49,999 | 232 | 6.6% |
| $50,000 to $74,999 | 570 | 16.2% |
| $75,000 to $99,999 | 232 | 6.6% |
| $100,000 to $149,999 | 503 | 14.3% |
| $150,000 to $199,999 | 513 | 14.6% |
| $200,000+ | 1,164 | 33.1% |
Household Income by Householder Age in Woodbury
The median household income in Woodbury is $141,632, with the highest median household income of $159,099 found in the 45 to 64 years age bracket for the primary householder. A total of 1,921 households (54.6%) fall into this category. Meanwhile, the 15 to 24 years age bracket for the primary householder has the lowest median household income of $0, with 32 households (0.9%) in this group.
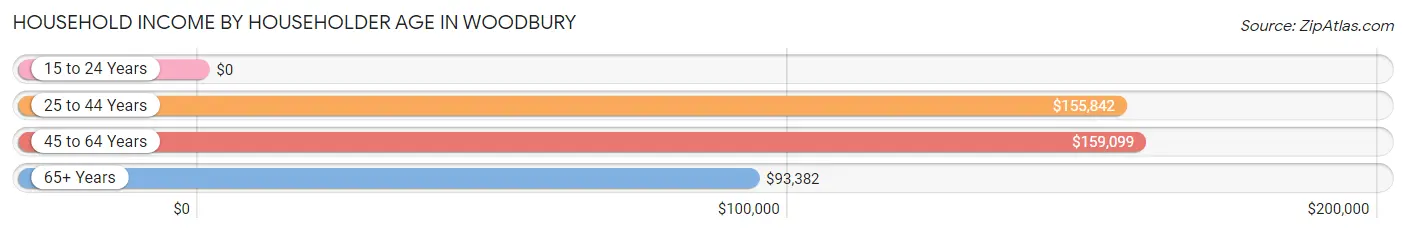
| Income Bracket | # Households | Median Income |
| 15 to 24 Years | 32 (0.9%) | $0 |
| 25 to 44 Years | 856 (24.3%) | $155,842 |
| 45 to 64 Years | 1,921 (54.6%) | $159,099 |
| 65+ Years | 708 (20.1%) | $93,382 |
| Total | 3,517 (100.0%) | $141,632 |
Poverty in Woodbury
Income Below Poverty by Sex and Age in Woodbury
With 2.9% poverty level for males and 5.9% for females among the residents of Woodbury, 6 to 11 year old males and 35 to 44 year old females are the most vulnerable to poverty, with 112 males (15.4%) and 146 females (18.8%) in their respective age groups living below the poverty level.
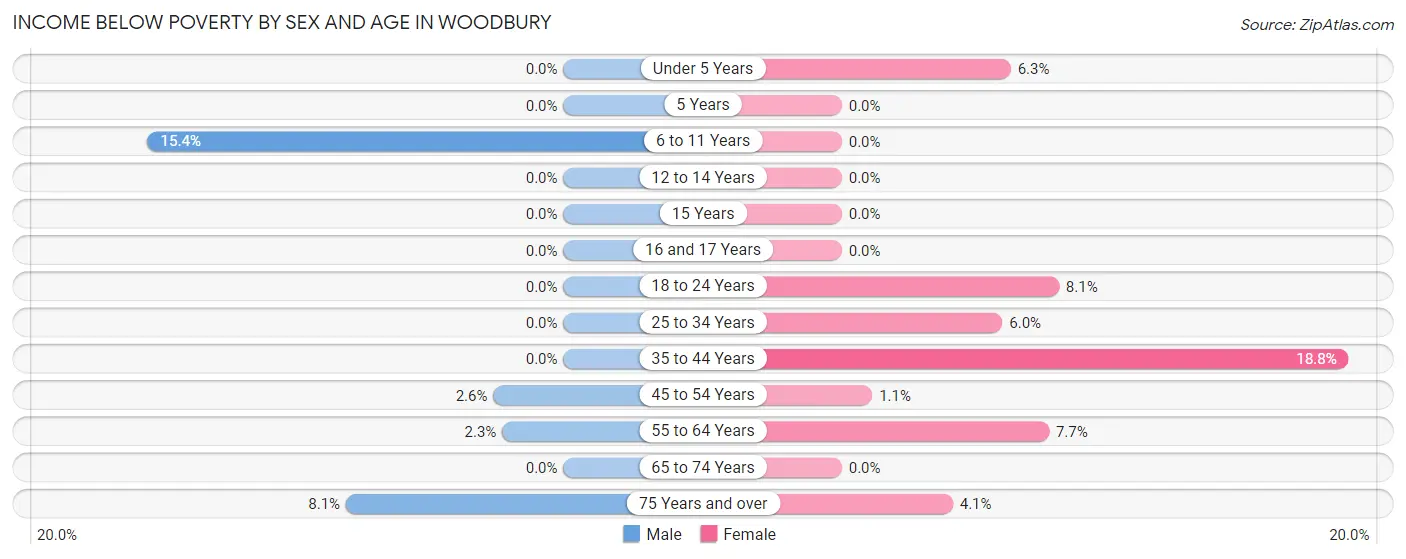
| Age Bracket | Male | Female |
| Under 5 Years | 0 (0.0%) | 22 (6.3%) |
| 5 Years | 0 (0.0%) | 0 (0.0%) |
| 6 to 11 Years | 112 (15.4%) | 0 (0.0%) |
| 12 to 14 Years | 0 (0.0%) | 0 (0.0%) |
| 15 Years | 0 (0.0%) | 0 (0.0%) |
| 16 and 17 Years | 0 (0.0%) | 0 (0.0%) |
| 18 to 24 Years | 0 (0.0%) | 69 (8.1%) |
| 25 to 34 Years | 0 (0.0%) | 19 (6.0%) |
| 35 to 44 Years | 0 (0.0%) | 146 (18.8%) |
| 45 to 54 Years | 20 (2.6%) | 13 (1.1%) |
| 55 to 64 Years | 15 (2.3%) | 55 (7.7%) |
| 65 to 74 Years | 0 (0.0%) | 0 (0.0%) |
| 75 Years and over | 18 (8.1%) | 12 (4.1%) |
| Total | 165 (2.9%) | 336 (5.9%) |
Income Above Poverty by Sex and Age in Woodbury
According to the poverty statistics in Woodbury, males aged under 5 years and females aged 6 to 11 years are the age groups that are most secure financially, with 100.0% of males and 100.0% of females in these age groups living above the poverty line.
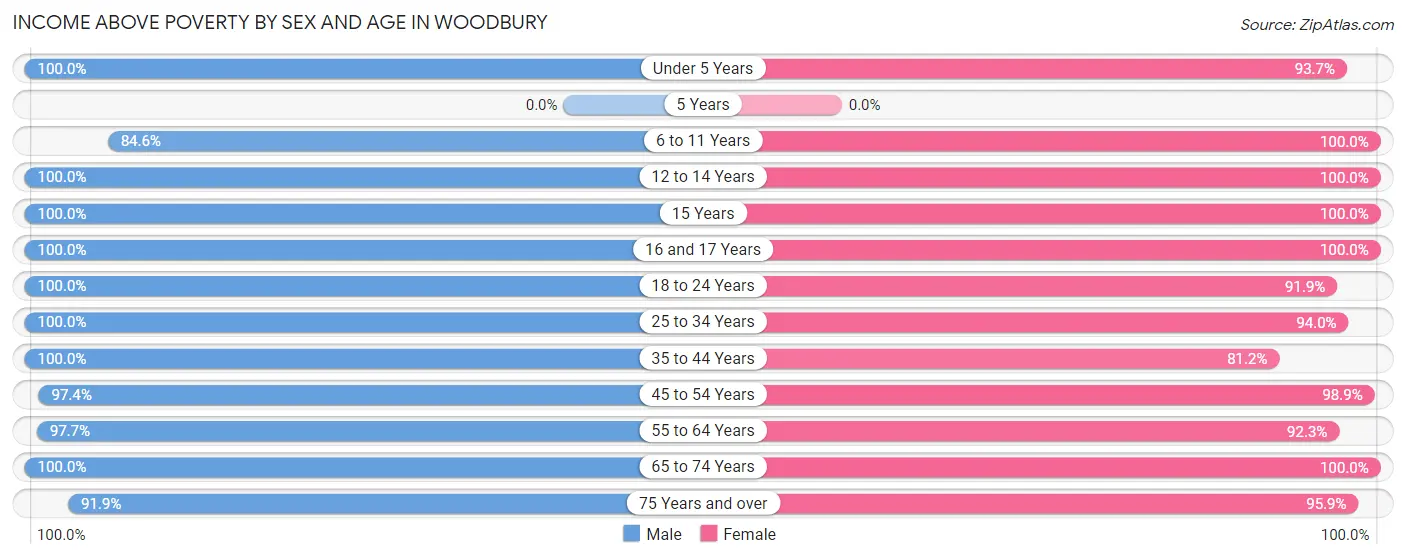
| Age Bracket | Male | Female |
| Under 5 Years | 217 (100.0%) | 329 (93.7%) |
| 5 Years | 0 (0.0%) | 0 (0.0%) |
| 6 to 11 Years | 614 (84.6%) | 374 (100.0%) |
| 12 to 14 Years | 265 (100.0%) | 143 (100.0%) |
| 15 Years | 129 (100.0%) | 180 (100.0%) |
| 16 and 17 Years | 180 (100.0%) | 89 (100.0%) |
| 18 to 24 Years | 913 (100.0%) | 787 (91.9%) |
| 25 to 34 Years | 689 (100.0%) | 300 (94.0%) |
| 35 to 44 Years | 570 (100.0%) | 630 (81.2%) |
| 45 to 54 Years | 748 (97.4%) | 1,133 (98.9%) |
| 55 to 64 Years | 645 (97.7%) | 660 (92.3%) |
| 65 to 74 Years | 359 (100.0%) | 413 (100.0%) |
| 75 Years and over | 205 (91.9%) | 279 (95.9%) |
| Total | 5,534 (97.1%) | 5,317 (94.1%) |
Income Below Poverty Among Married-Couple Families in Woodbury
The poverty statistics for married-couple families in Woodbury show that 1.1% or 26 of the total 2,262 families live below the poverty line. Families with no children have the highest poverty rate of 2.4%, comprising of 26 families. On the other hand, families with 1 or 2 children have the lowest poverty rate of 0.0%, which includes 0 families.
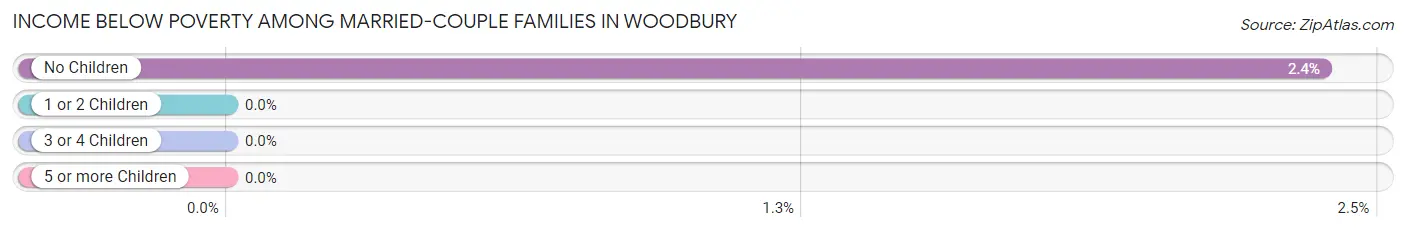
| Children | Above Poverty | Below Poverty |
| No Children | 1,067 (97.6%) | 26 (2.4%) |
| 1 or 2 Children | 850 (100.0%) | 0 (0.0%) |
| 3 or 4 Children | 304 (100.0%) | 0 (0.0%) |
| 5 or more Children | 15 (100.0%) | 0 (0.0%) |
| Total | 2,236 (98.9%) | 26 (1.1%) |
Income Below Poverty Among Single-Parent Households in Woodbury
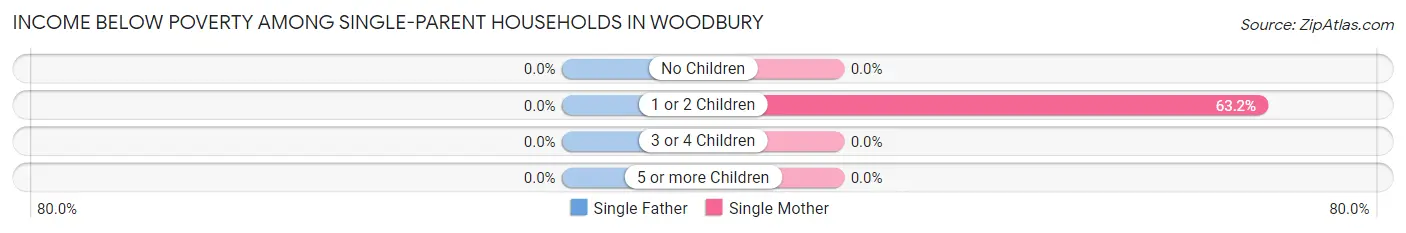
| Children | Single Father | Single Mother |
| No Children | 0 (0.0%) | 0 (0.0%) |
| 1 or 2 Children | 0 (0.0%) | 146 (63.2%) |
| 3 or 4 Children | 0 (0.0%) | 0 (0.0%) |
| 5 or more Children | 0 (0.0%) | 0 (0.0%) |
| Total | 0 (0.0%) | 146 (28.4%) |
Income Below Poverty Among Married-Couple vs Single-Parent Households in Woodbury
The poverty data for Woodbury shows that 26 of the married-couple family households (1.1%) and 146 of the single-parent households (26.7%) are living below the poverty level. Within the married-couple family households, those with no children have the highest poverty rate, with 26 households (2.4%) falling below the poverty line. Among the single-parent households, those with 1 or 2 children have the highest poverty rate, with 146 household (55.5%) living below poverty.
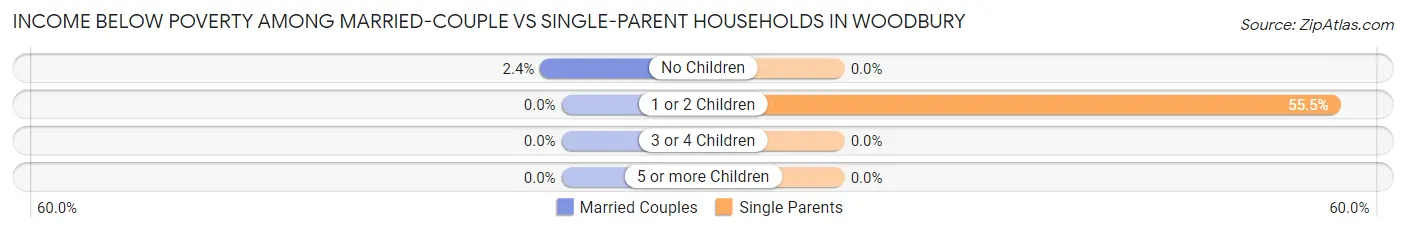
| Children | Married-Couple Families | Single-Parent Households |
| No Children | 26 (2.4%) | 0 (0.0%) |
| 1 or 2 Children | 0 (0.0%) | 146 (55.5%) |
| 3 or 4 Children | 0 (0.0%) | 0 (0.0%) |
| 5 or more Children | 0 (0.0%) | 0 (0.0%) |
| Total | 26 (1.1%) | 146 (26.7%) |
Race in Woodbury
The most populous races in Woodbury are White / Caucasian (7,315 | 64.3%), Hispanic or Latino (3,289 | 28.9%), and Two or more Races (1,159 | 10.2%).
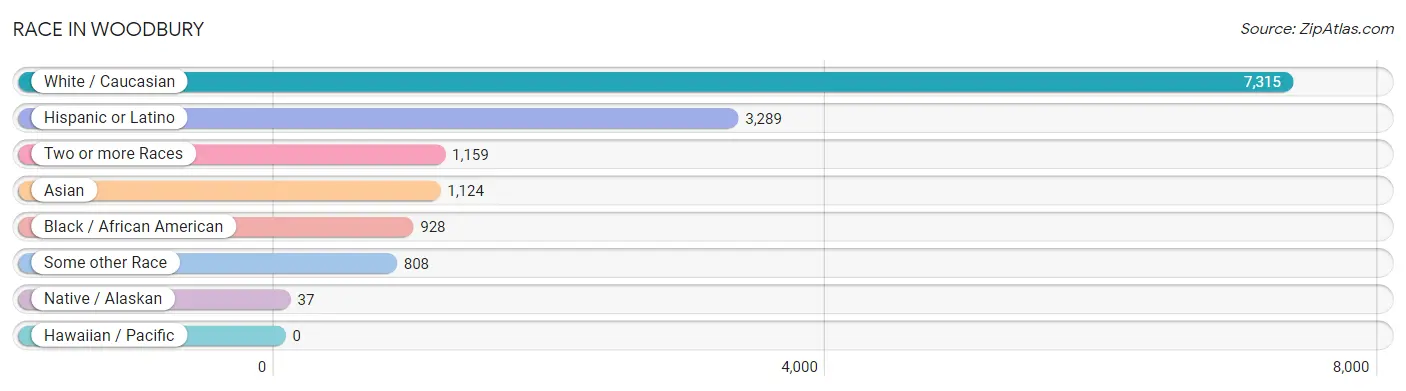
| Race | # Population | % Population |
| Asian | 1,124 | 9.9% |
| Black / African American | 928 | 8.2% |
| Hawaiian / Pacific | 0 | 0.0% |
| Hispanic or Latino | 3,289 | 28.9% |
| Native / Alaskan | 37 | 0.3% |
| White / Caucasian | 7,315 | 64.3% |
| Two or more Races | 1,159 | 10.2% |
| Some other Race | 808 | 7.1% |
| Total | 11,371 | 100.0% |
Ancestry in Woodbury
The most populous ancestries reported in Woodbury are Puerto Rican (1,987 | 17.5%), Italian (1,704 | 15.0%), Irish (1,640 | 14.4%), German (1,050 | 9.2%), and Thai (982 | 8.6%), together accounting for 64.7% of all Woodbury residents.
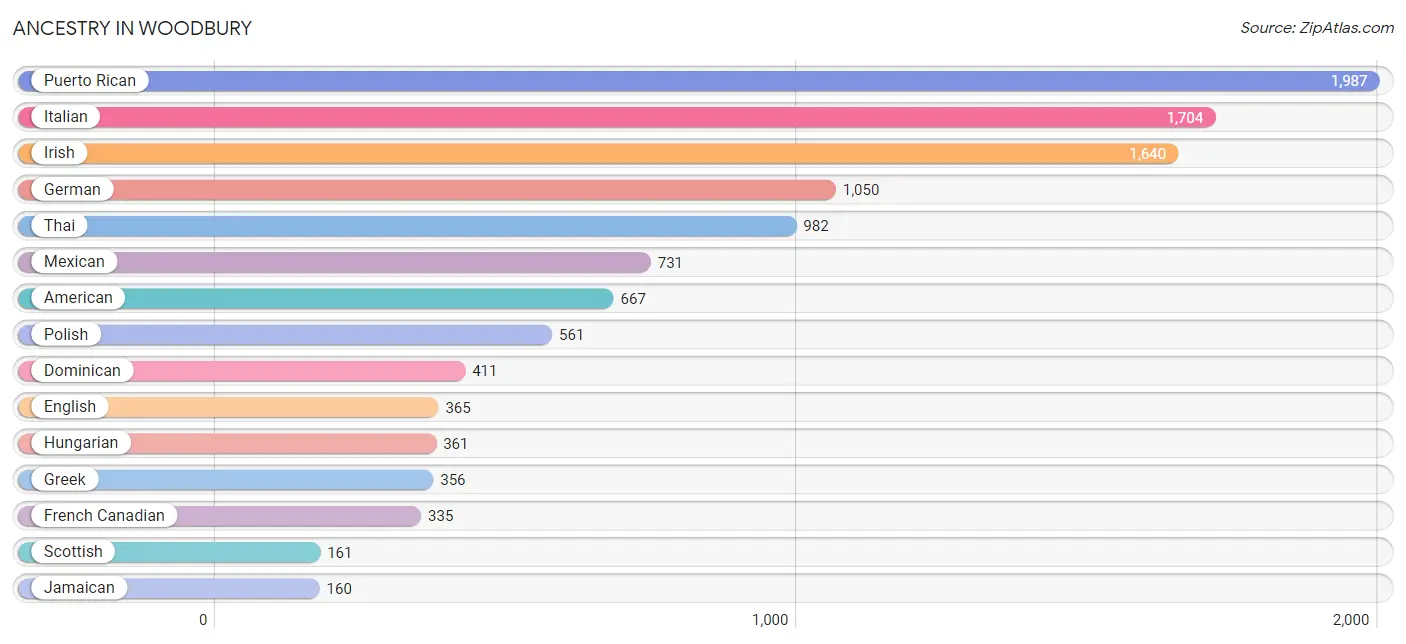
| Ancestry | # Population | % Population |
| American | 667 | 5.9% |
| Austrian | 34 | 0.3% |
| Brazilian | 16 | 0.1% |
| Burmese | 9 | 0.1% |
| Colombian | 60 | 0.5% |
| Cuban | 36 | 0.3% |
| Cypriot | 12 | 0.1% |
| Czech | 21 | 0.2% |
| Danish | 44 | 0.4% |
| Dominican | 411 | 3.6% |
| Dutch | 49 | 0.4% |
| Eastern European | 14 | 0.1% |
| English | 365 | 3.2% |
| European | 71 | 0.6% |
| French | 132 | 1.2% |
| French Canadian | 335 | 2.9% |
| German | 1,050 | 9.2% |
| Ghanaian | 45 | 0.4% |
| Greek | 356 | 3.1% |
| Guyanese | 89 | 0.8% |
| Haitian | 3 | 0.0% |
| Hungarian | 361 | 3.2% |
| Indian (Asian) | 105 | 0.9% |
| Iranian | 14 | 0.1% |
| Irish | 1,640 | 14.4% |
| Italian | 1,704 | 15.0% |
| Jamaican | 160 | 1.4% |
| Korean | 143 | 1.3% |
| Latvian | 10 | 0.1% |
| Lithuanian | 90 | 0.8% |
| Mexican | 731 | 6.4% |
| Nigerian | 64 | 0.6% |
| Norwegian | 24 | 0.2% |
| Peruvian | 10 | 0.1% |
| Polish | 561 | 4.9% |
| Portuguese | 127 | 1.1% |
| Puerto Rican | 1,987 | 17.5% |
| Romanian | 117 | 1.0% |
| Russian | 89 | 0.8% |
| Scottish | 161 | 1.4% |
| Slavic | 21 | 0.2% |
| Slovak | 6 | 0.1% |
| South American | 70 | 0.6% |
| Spaniard | 32 | 0.3% |
| Spanish | 22 | 0.2% |
| Subsaharan African | 109 | 1.0% |
| Swedish | 44 | 0.4% |
| Thai | 982 | 8.6% |
| Trinidadian and Tobagonian | 66 | 0.6% |
| Ukrainian | 53 | 0.5% |
| Welsh | 9 | 0.1% |
| Yugoslavian | 13 | 0.1% | View All 52 Rows |
Immigrants in Woodbury
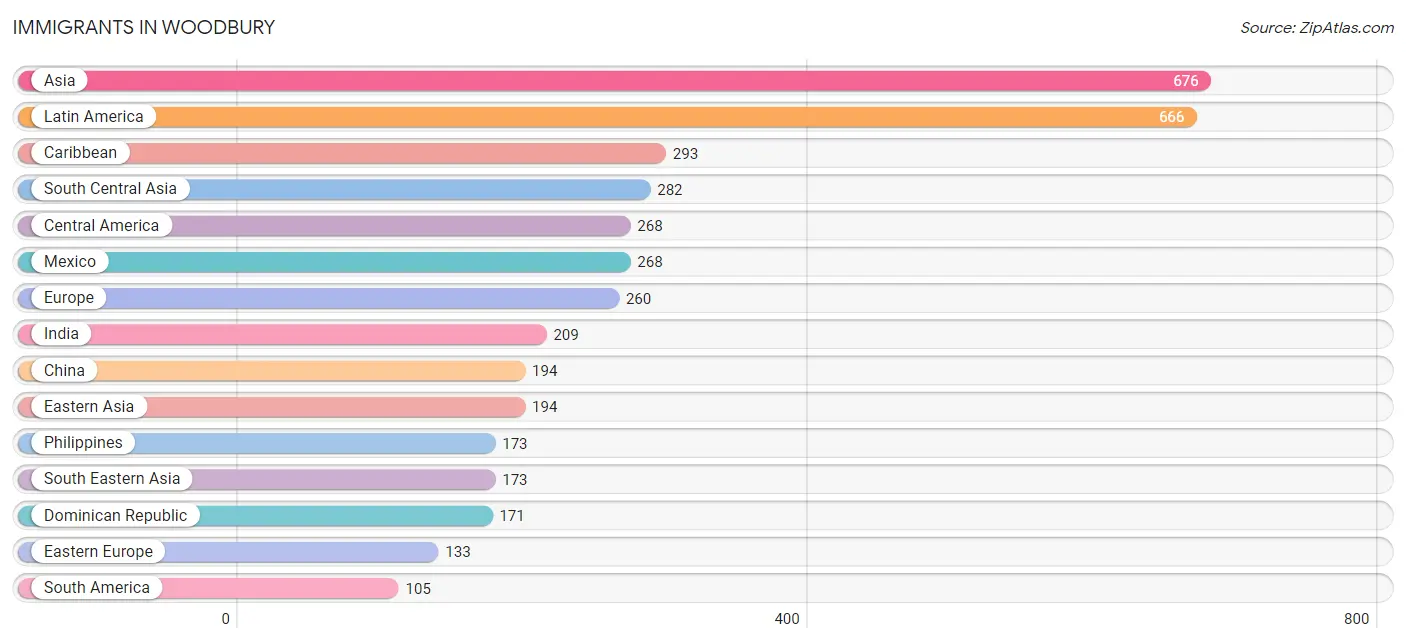
The most numerous immigrant groups reported in Woodbury came from Asia (676 | 5.9%), Latin America (666 | 5.9%), Caribbean (293 | 2.6%), South Central Asia (282 | 2.5%), and Central America (268 | 2.4%), together accounting for 19.2% of all Woodbury residents.
| Immigration Origin | # Population | % Population |
| Africa | 91 | 0.8% |
| Asia | 676 | 5.9% |
| Bangladesh | 17 | 0.2% |
| Bosnia and Herzegovina | 6 | 0.1% |
| Brazil | 16 | 0.1% |
| Caribbean | 293 | 2.6% |
| Central America | 268 | 2.4% |
| China | 194 | 1.7% |
| Colombia | 39 | 0.3% |
| Cuba | 36 | 0.3% |
| Dominican Republic | 171 | 1.5% |
| Eastern Asia | 194 | 1.7% |
| Eastern Europe | 133 | 1.2% |
| Europe | 260 | 2.3% |
| Germany | 31 | 0.3% |
| Ghana | 14 | 0.1% |
| Greece | 25 | 0.2% |
| Guyana | 40 | 0.4% |
| Haiti | 2 | 0.0% |
| Hungary | 91 | 0.8% |
| India | 209 | 1.8% |
| Ireland | 8 | 0.1% |
| Israel | 15 | 0.1% |
| Italy | 31 | 0.3% |
| Jamaica | 69 | 0.6% |
| Latin America | 666 | 5.9% |
| Mexico | 268 | 2.4% |
| Middle Africa | 13 | 0.1% |
| Nigeria | 64 | 0.6% |
| Northern Europe | 26 | 0.2% |
| Pakistan | 56 | 0.5% |
| Peru | 10 | 0.1% |
| Philippines | 173 | 1.5% |
| Portugal | 14 | 0.1% |
| Russia | 29 | 0.3% |
| South America | 105 | 0.9% |
| South Central Asia | 282 | 2.5% |
| South Eastern Asia | 173 | 1.5% |
| Southern Europe | 70 | 0.6% |
| Taiwan | 78 | 0.7% |
| Trinidad and Tobago | 15 | 0.1% |
| Western Africa | 78 | 0.7% |
| Western Asia | 27 | 0.2% |
| Western Europe | 31 | 0.3% | View All 44 Rows |
Sex and Age in Woodbury
Sex and Age in Woodbury
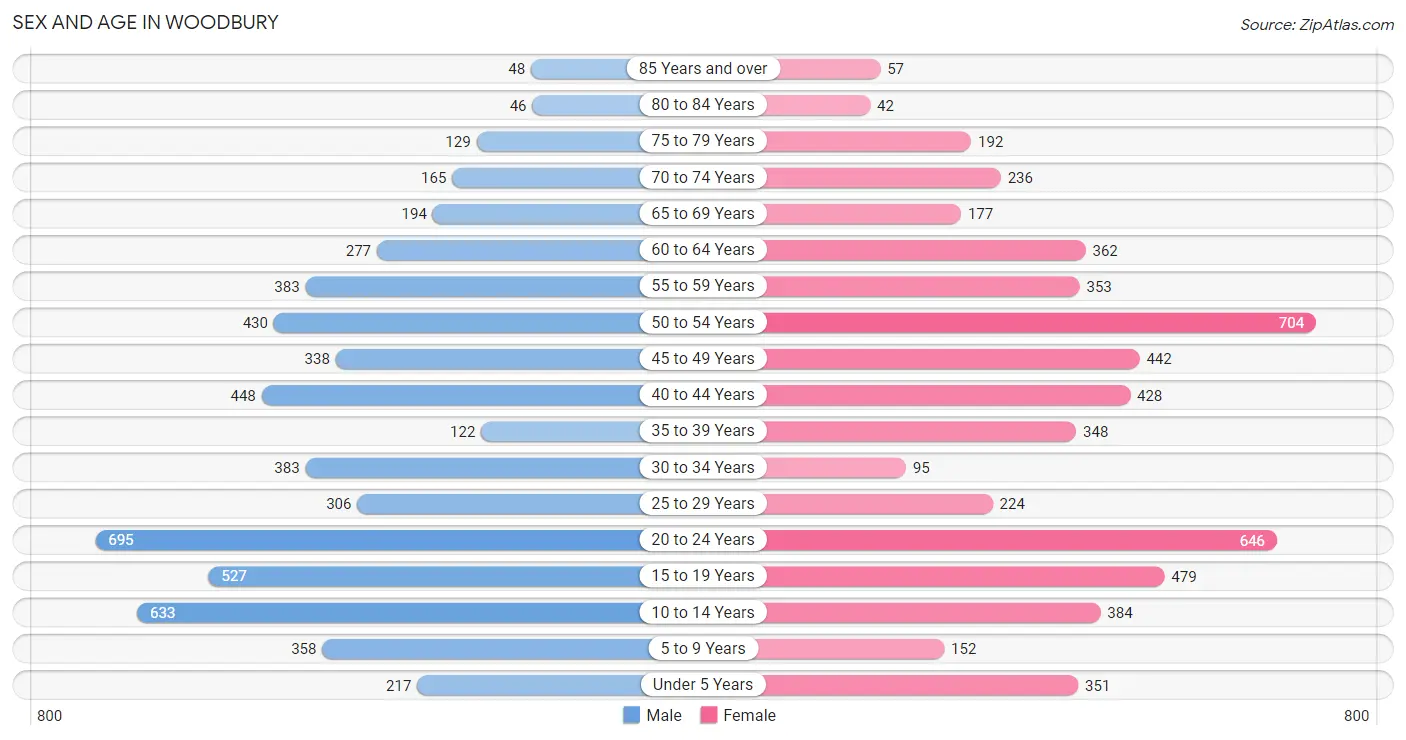
The most populous age groups in Woodbury are 20 to 24 Years (695 | 12.2%) for men and 50 to 54 Years (704 | 12.4%) for women.
| Age Bracket | Male | Female |
| Under 5 Years | 217 (3.8%) | 351 (6.2%) |
| 5 to 9 Years | 358 (6.3%) | 152 (2.7%) |
| 10 to 14 Years | 633 (11.1%) | 384 (6.8%) |
| 15 to 19 Years | 527 (9.2%) | 479 (8.4%) |
| 20 to 24 Years | 695 (12.2%) | 646 (11.4%) |
| 25 to 29 Years | 306 (5.4%) | 224 (4.0%) |
| 30 to 34 Years | 383 (6.7%) | 95 (1.7%) |
| 35 to 39 Years | 122 (2.1%) | 348 (6.1%) |
| 40 to 44 Years | 448 (7.9%) | 428 (7.5%) |
| 45 to 49 Years | 338 (5.9%) | 442 (7.8%) |
| 50 to 54 Years | 430 (7.5%) | 704 (12.4%) |
| 55 to 59 Years | 383 (6.7%) | 353 (6.2%) |
| 60 to 64 Years | 277 (4.9%) | 362 (6.4%) |
| 65 to 69 Years | 194 (3.4%) | 177 (3.1%) |
| 70 to 74 Years | 165 (2.9%) | 236 (4.2%) |
| 75 to 79 Years | 129 (2.3%) | 192 (3.4%) |
| 80 to 84 Years | 46 (0.8%) | 42 (0.7%) |
| 85 Years and over | 48 (0.8%) | 57 (1.0%) |
| Total | 5,699 (100.0%) | 5,672 (100.0%) |
Families and Households in Woodbury
Median Family Size in Woodbury
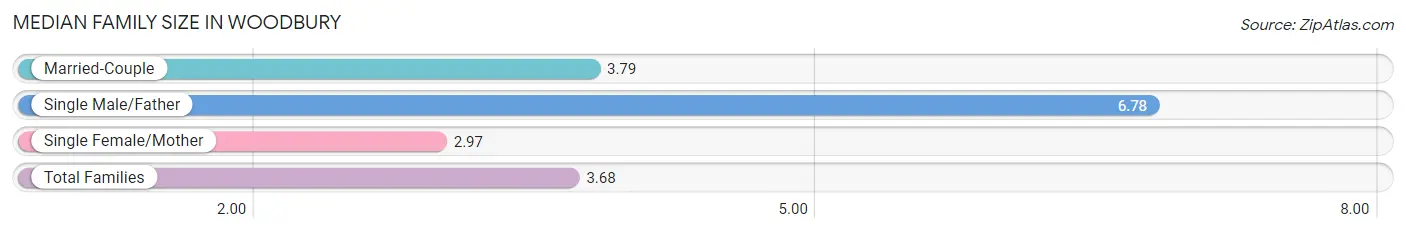
The median family size in Woodbury is 3.68 persons per family, with single male/father families (32 | 1.1%) accounting for the largest median family size of 6.78 persons per family. On the other hand, single female/mother families (514 | 18.3%) represent the smallest median family size with 2.97 persons per family.
| Family Type | # Families | Family Size |
| Married-Couple | 2,262 (80.6%) | 3.79 |
| Single Male/Father | 32 (1.1%) | 6.78 |
| Single Female/Mother | 514 (18.3%) | 2.97 |
| Total Families | 2,808 (100.0%) | 3.68 |
Median Household Size in Woodbury
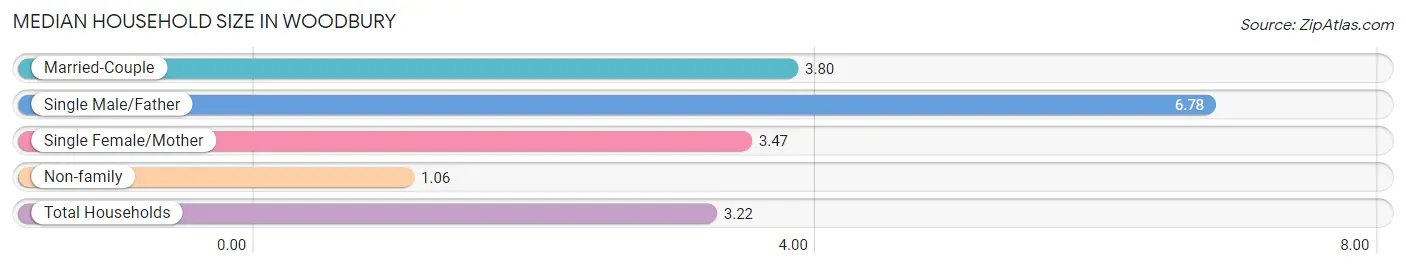
The median household size in Woodbury is 3.22 persons per household, with single male/father households (32 | 0.9%) accounting for the largest median household size of 6.78 persons per household. non-family households (709 | 20.2%) represent the smallest median household size with 1.06 persons per household.
| Household Type | # Households | Household Size |
| Married-Couple | 2,262 (64.3%) | 3.80 |
| Single Male/Father | 32 (0.9%) | 6.78 |
| Single Female/Mother | 514 (14.6%) | 3.47 |
| Non-family | 709 (20.2%) | 1.06 |
| Total Households | 3,517 (100.0%) | 3.22 |
Household Size by Marriage Status in Woodbury
Out of a total of 3,517 households in Woodbury, 2,808 (79.8%) are family households, while 709 (20.2%) are nonfamily households. The most numerous type of family households are 4-person households, comprising 880, and the most common type of nonfamily households are 1-person households, comprising 680.
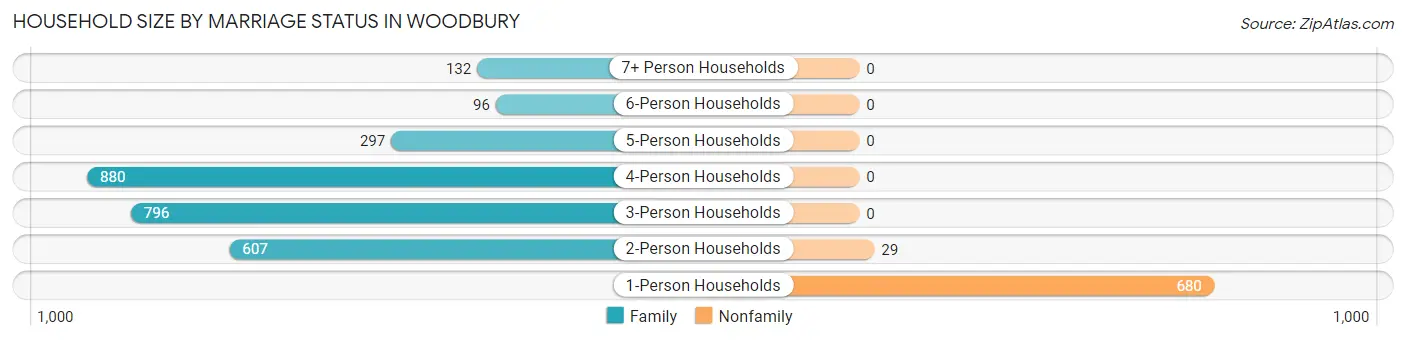
| Household Size | Family Households | Nonfamily Households |
| 1-Person Households | - | 680 (19.3%) |
| 2-Person Households | 607 (17.3%) | 29 (0.8%) |
| 3-Person Households | 796 (22.6%) | 0 (0.0%) |
| 4-Person Households | 880 (25.0%) | 0 (0.0%) |
| 5-Person Households | 297 (8.4%) | 0 (0.0%) |
| 6-Person Households | 96 (2.7%) | 0 (0.0%) |
| 7+ Person Households | 132 (3.7%) | 0 (0.0%) |
| Total | 2,808 (79.8%) | 709 (20.2%) |
Female Fertility in Woodbury
Fertility by Age in Woodbury
Average fertility rate in Woodbury is 13.0 births per 1,000 women. Women in the age bracket of 35 to 50 years have the highest fertility rate with 27.0 births per 1,000 women. Women in the age bracket of 35 to 50 years acount for 100.0% of all women with births.
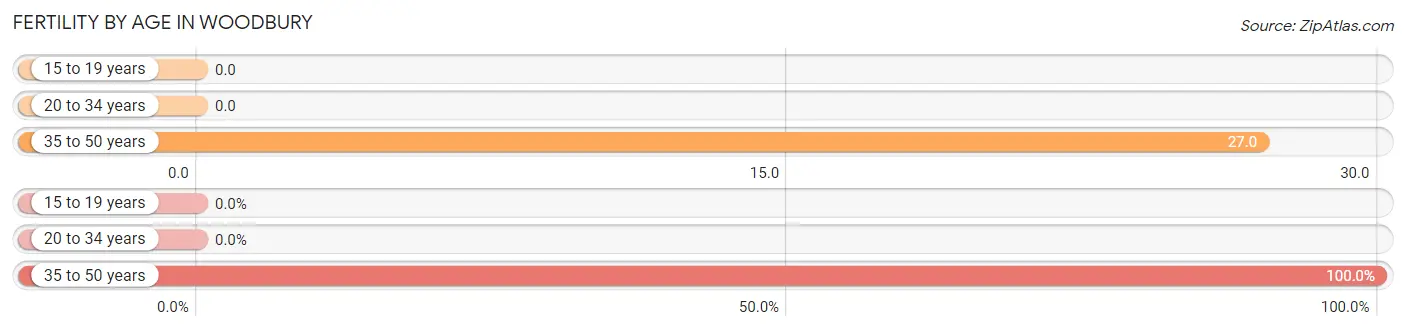
| Age Bracket | Women with Births | Births / 1,000 Women |
| 15 to 19 years | 0 (0.0%) | 0.0 |
| 20 to 34 years | 0 (0.0%) | 0.0 |
| 35 to 50 years | 38 (100.0%) | 27.0 |
| Total | 38 (100.0%) | 13.0 |
Fertility by Age by Marriage Status in Woodbury
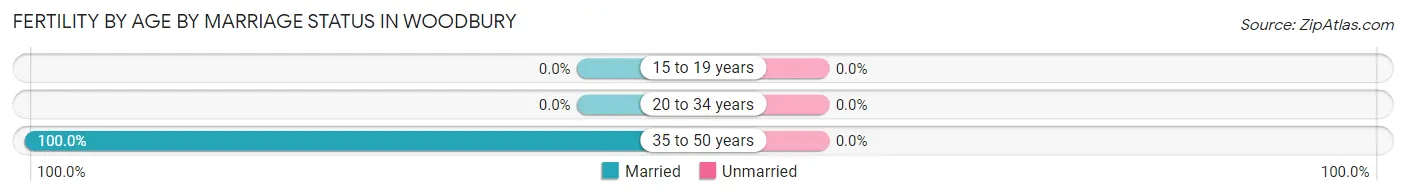
| Age Bracket | Married | Unmarried |
| 15 to 19 years | 0 (0.0%) | 0 (0.0%) |
| 20 to 34 years | 0 (0.0%) | 0 (0.0%) |
| 35 to 50 years | 38 (100.0%) | 0 (0.0%) |
| Total | 38 (100.0%) | 0 (0.0%) |
Fertility by Education in Woodbury
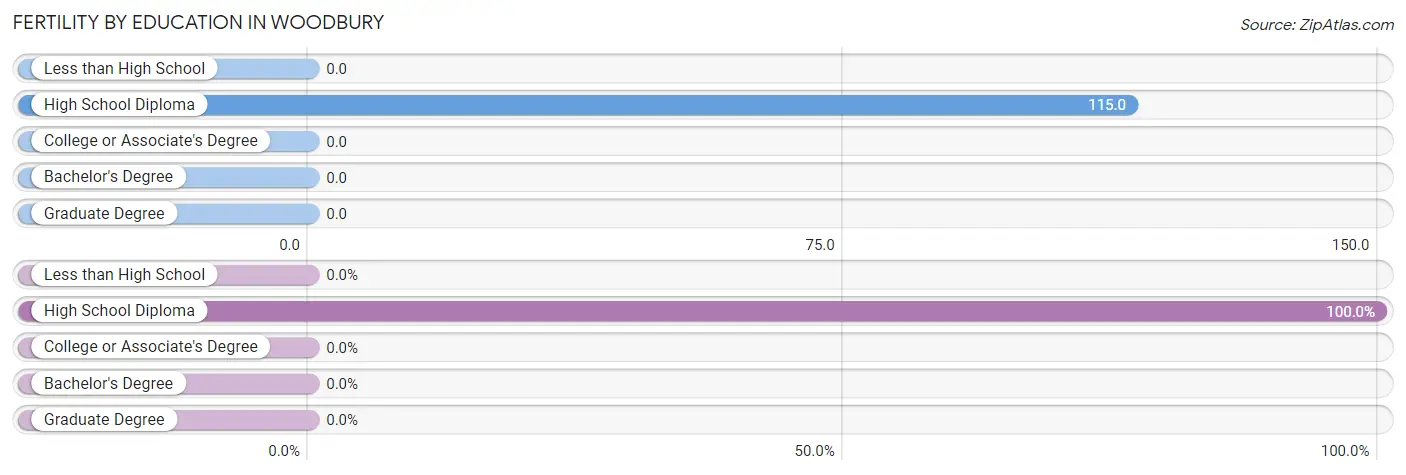
| Educational Attainment | Women with Births | Births / 1,000 Women |
| Less than High School | 0 (0.0%) | 0.0 |
| High School Diploma | 38 (100.0%) | 115.0 |
| College or Associate's Degree | 0 (0.0%) | 0.0 |
| Bachelor's Degree | 0 (0.0%) | 0.0 |
| Graduate Degree | 0 (0.0%) | 0.0 |
| Total | 38 (100.0%) | 13.0 |
Fertility by Education by Marriage Status in Woodbury
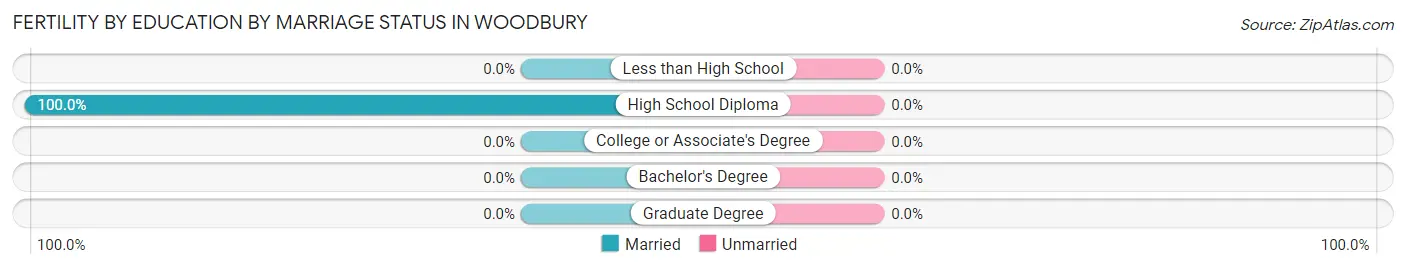
| Educational Attainment | Married | Unmarried |
| Less than High School | 0 (0.0%) | 0 (0.0%) |
| High School Diploma | 38 (100.0%) | 0 (0.0%) |
| College or Associate's Degree | 0 (0.0%) | 0 (0.0%) |
| Bachelor's Degree | 0 (0.0%) | 0 (0.0%) |
| Graduate Degree | 0 (0.0%) | 0 (0.0%) |
| Total | 38 (100.0%) | 0 (0.0%) |
Employment Characteristics in Woodbury
Employment by Class of Employer in Woodbury
Among the 5,468 employed individuals in Woodbury, private company employees (3,476 | 63.6%), local government employees (863 | 15.8%), and not-for-profit organizations (436 | 8.0%) make up the most common classes of employment.
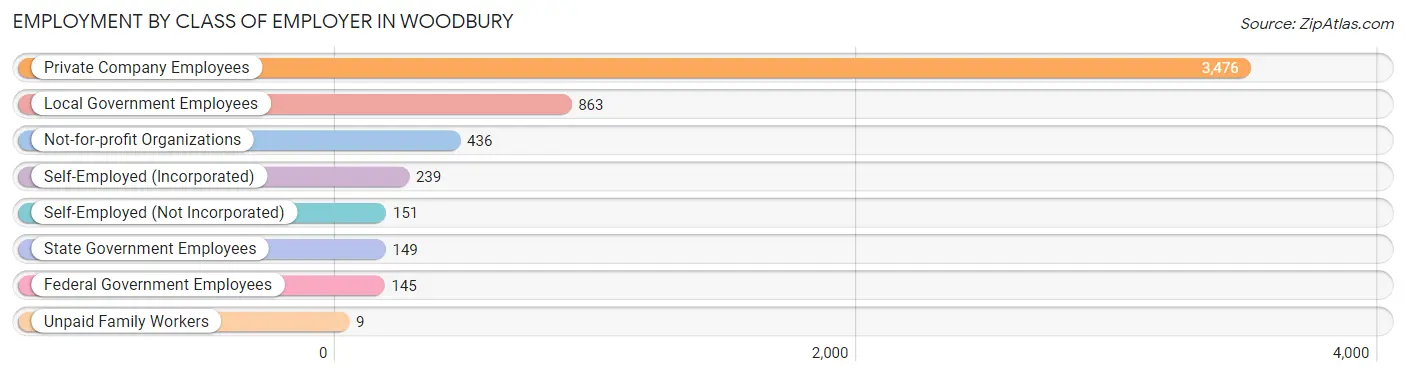
| Employer Class | # Employees | % Employees |
| Private Company Employees | 3,476 | 63.6% |
| Self-Employed (Incorporated) | 239 | 4.4% |
| Self-Employed (Not Incorporated) | 151 | 2.8% |
| Not-for-profit Organizations | 436 | 8.0% |
| Local Government Employees | 863 | 15.8% |
| State Government Employees | 149 | 2.7% |
| Federal Government Employees | 145 | 2.6% |
| Unpaid Family Workers | 9 | 0.2% |
| Total | 5,468 | 100.0% |
Employment Status by Age in Woodbury
According to the labor force statistics for Woodbury, out of the total population over 16 years of age (8,967), 66.1% or 5,927 individuals are in the labor force, with 6.5% or 385 of them unemployed. The age group with the highest labor force participation rate is 55 to 59 years, with 93.2% or 686 individuals in the labor force. Within the labor force, the 25 to 29 years age range has the highest percentage of unemployed individuals, with 35.1% or 170 of them being unemployed.
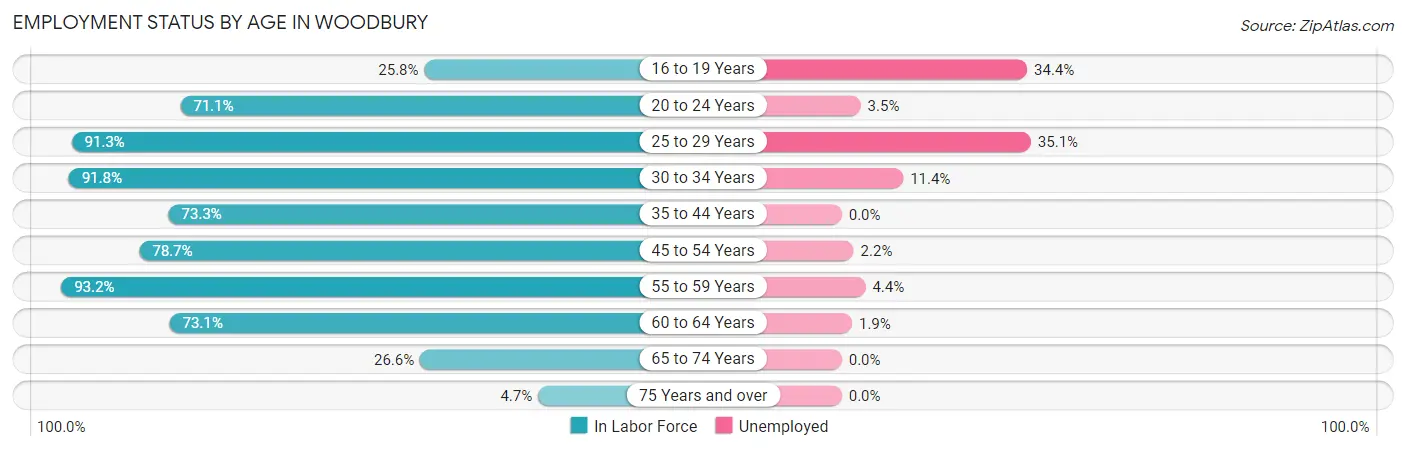
| Age Bracket | In Labor Force | Unemployed |
| 16 to 19 Years | 180 (25.8%) | 62 (34.4%) |
| 20 to 24 Years | 953 (71.1%) | 33 (3.5%) |
| 25 to 29 Years | 484 (91.3%) | 170 (35.1%) |
| 30 to 34 Years | 439 (91.8%) | 50 (11.4%) |
| 35 to 44 Years | 987 (73.3%) | 0 (0.0%) |
| 45 to 54 Years | 1,506 (78.7%) | 33 (2.2%) |
| 55 to 59 Years | 686 (93.2%) | 30 (4.4%) |
| 60 to 64 Years | 467 (73.1%) | 9 (1.9%) |
| 65 to 74 Years | 205 (26.6%) | 0 (0.0%) |
| 75 Years and over | 24 (4.7%) | 0 (0.0%) |
| Total | 5,927 (66.1%) | 385 (6.5%) |
Employment Status by Educational Attainment in Woodbury
According to labor force statistics for Woodbury, 80.9% of individuals (4,565) out of the total population between 25 and 64 years of age (5,643) are in the labor force, with 6.4% or 292 of them being unemployed. The group with the highest labor force participation rate are those with the educational attainment of bachelor's degree or higher, with 87.6% or 2,123 individuals in the labor force. Within the labor force, individuals with college / associate degree education have the highest percentage of unemployment, with 11.4% or 174 of them being unemployed.
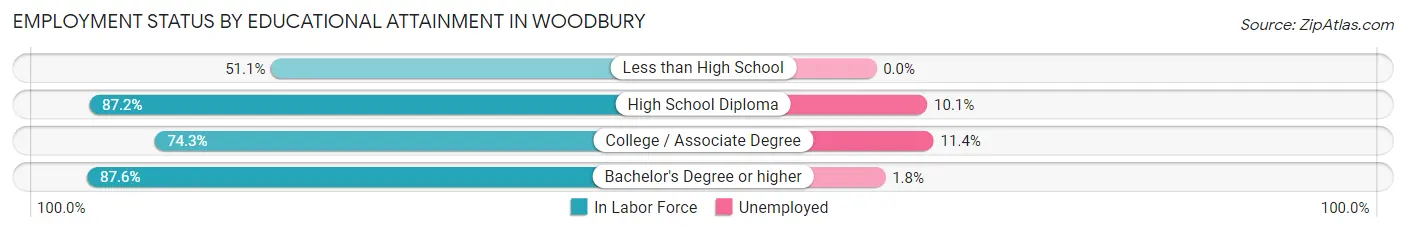
| Educational Attainment | In Labor Force | Unemployed |
| Less than High School | 139 (51.1%) | 0 (0.0%) |
| High School Diploma | 781 (87.2%) | 90 (10.1%) |
| College / Associate Degree | 1,524 (74.3%) | 234 (11.4%) |
| Bachelor's Degree or higher | 2,123 (87.6%) | 44 (1.8%) |
| Total | 4,565 (80.9%) | 361 (6.4%) |
Employment Occupations by Sex in Woodbury
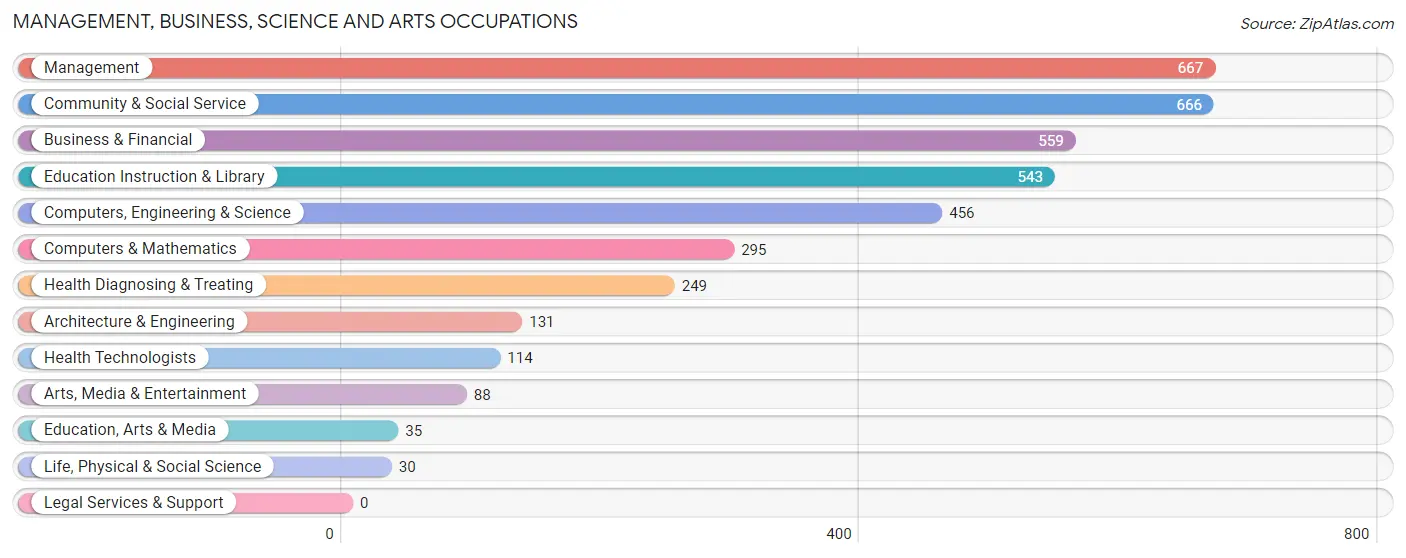
Management, Business, Science and Arts Occupations
The most common Management, Business, Science and Arts occupations in Woodbury are Management (667 | 12.0%), Community & Social Service (666 | 12.0%), Business & Financial (559 | 10.1%), Education Instruction & Library (543 | 9.8%), and Computers, Engineering & Science (456 | 8.2%).
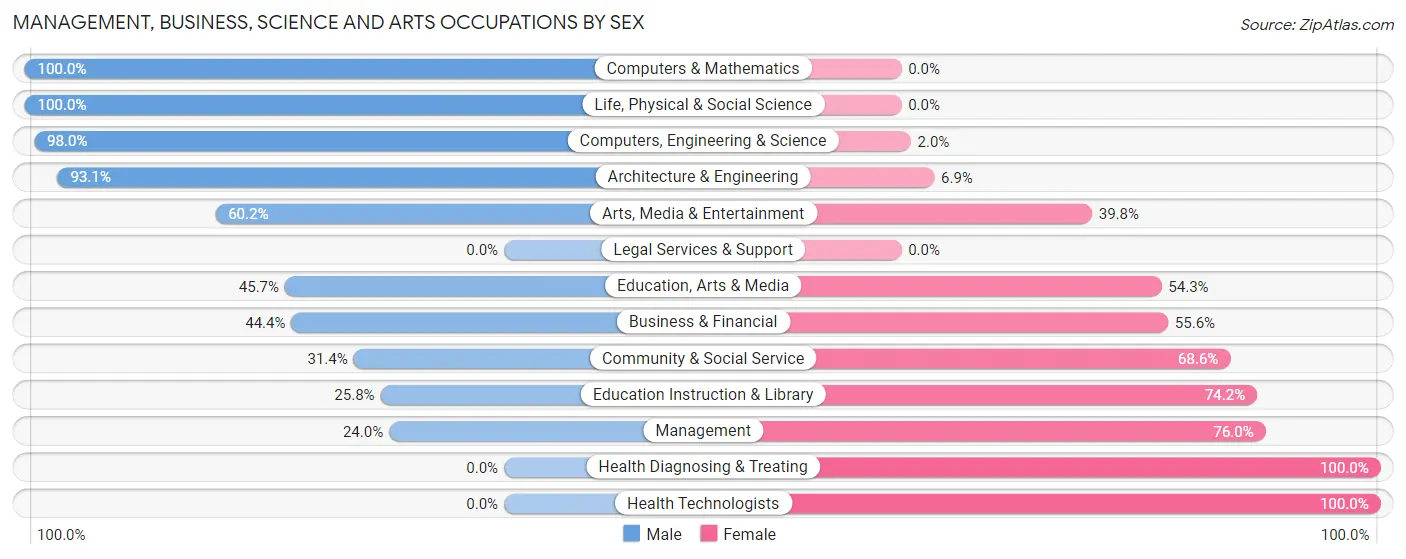
Management, Business, Science and Arts Occupations by Sex
Within the Management, Business, Science and Arts occupations in Woodbury, the most male-oriented occupations are Computers & Mathematics (100.0%), Life, Physical & Social Science (100.0%), and Computers, Engineering & Science (98.0%), while the most female-oriented occupations are Health Diagnosing & Treating (100.0%), Health Technologists (100.0%), and Management (76.0%).
| Occupation | Male | Female |
| Management | 160 (24.0%) | 507 (76.0%) |
| Business & Financial | 248 (44.4%) | 311 (55.6%) |
| Computers, Engineering & Science | 447 (98.0%) | 9 (2.0%) |
| Computers & Mathematics | 295 (100.0%) | 0 (0.0%) |
| Architecture & Engineering | 122 (93.1%) | 9 (6.9%) |
| Life, Physical & Social Science | 30 (100.0%) | 0 (0.0%) |
| Community & Social Service | 209 (31.4%) | 457 (68.6%) |
| Education, Arts & Media | 16 (45.7%) | 19 (54.3%) |
| Legal Services & Support | 0 (0.0%) | 0 (0.0%) |
| Education Instruction & Library | 140 (25.8%) | 403 (74.2%) |
| Arts, Media & Entertainment | 53 (60.2%) | 35 (39.8%) |
| Health Diagnosing & Treating | 0 (0.0%) | 249 (100.0%) |
| Health Technologists | 0 (0.0%) | 114 (100.0%) |
| Total (Category) | 1,064 (41.0%) | 1,533 (59.0%) |
| Total (Overall) | 3,088 (55.7%) | 2,456 (44.3%) |
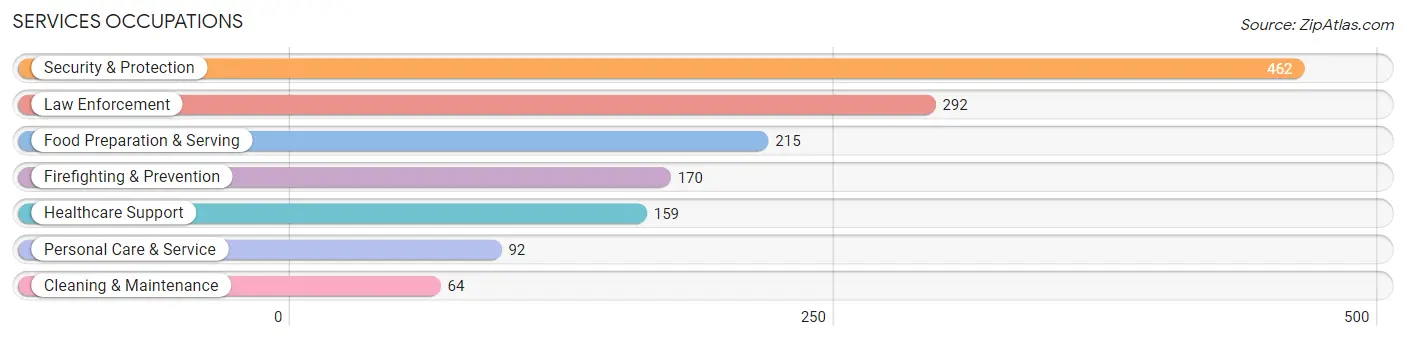
Services Occupations
The most common Services occupations in Woodbury are Security & Protection (462 | 8.3%), Law Enforcement (292 | 5.3%), Food Preparation & Serving (215 | 3.9%), Firefighting & Prevention (170 | 3.1%), and Healthcare Support (159 | 2.9%).
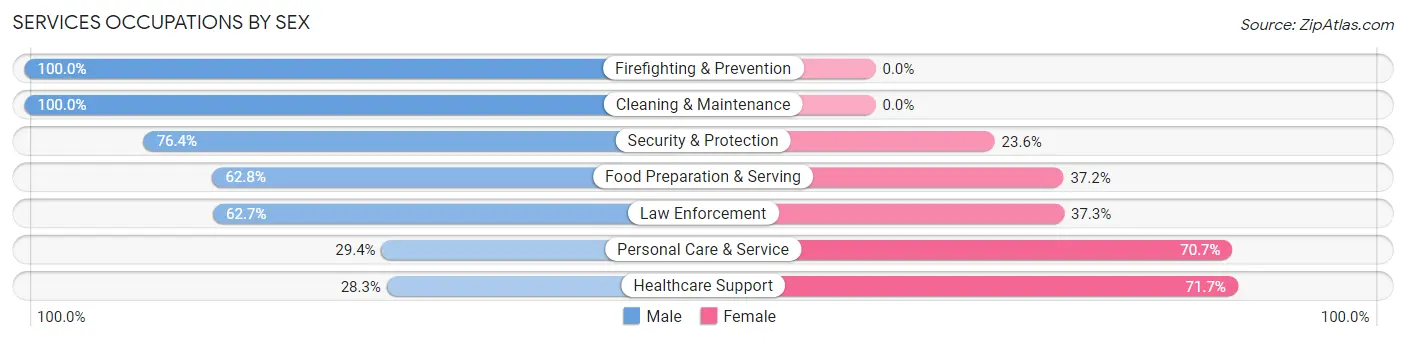
Services Occupations by Sex
Within the Services occupations in Woodbury, the most male-oriented occupations are Firefighting & Prevention (100.0%), Cleaning & Maintenance (100.0%), and Security & Protection (76.4%), while the most female-oriented occupations are Healthcare Support (71.7%), Personal Care & Service (70.7%), and Law Enforcement (37.3%).
| Occupation | Male | Female |
| Healthcare Support | 45 (28.3%) | 114 (71.7%) |
| Security & Protection | 353 (76.4%) | 109 (23.6%) |
| Firefighting & Prevention | 170 (100.0%) | 0 (0.0%) |
| Law Enforcement | 183 (62.7%) | 109 (37.3%) |
| Food Preparation & Serving | 135 (62.8%) | 80 (37.2%) |
| Cleaning & Maintenance | 64 (100.0%) | 0 (0.0%) |
| Personal Care & Service | 27 (29.3%) | 65 (70.7%) |
| Total (Category) | 624 (62.9%) | 368 (37.1%) |
| Total (Overall) | 3,088 (55.7%) | 2,456 (44.3%) |
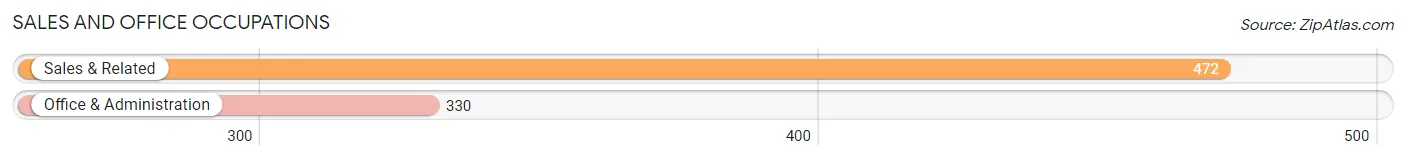
Sales and Office Occupations
The most common Sales and Office occupations in Woodbury are Sales & Related (472 | 8.5%), and Office & Administration (330 | 5.9%).
Sales and Office Occupations by Sex
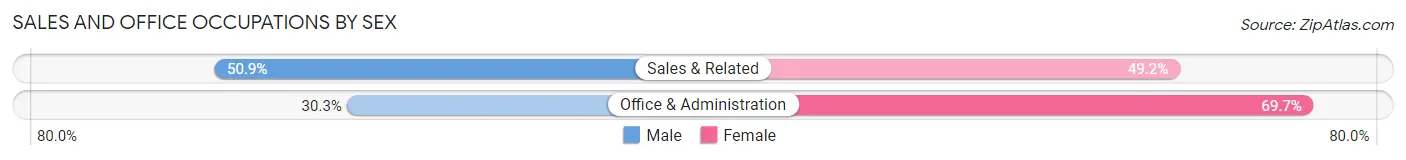
| Occupation | Male | Female |
| Sales & Related | 240 (50.8%) | 232 (49.1%) |
| Office & Administration | 100 (30.3%) | 230 (69.7%) |
| Total (Category) | 340 (42.4%) | 462 (57.6%) |
| Total (Overall) | 3,088 (55.7%) | 2,456 (44.3%) |
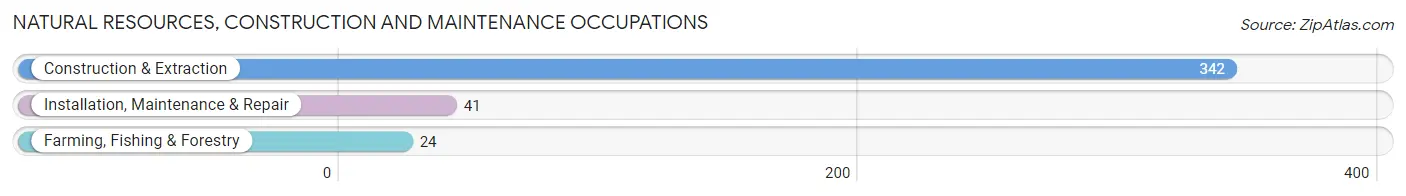
Natural Resources, Construction and Maintenance Occupations
The most common Natural Resources, Construction and Maintenance occupations in Woodbury are Construction & Extraction (342 | 6.2%), Installation, Maintenance & Repair (41 | 0.7%), and Farming, Fishing & Forestry (24 | 0.4%).
Natural Resources, Construction and Maintenance Occupations by Sex
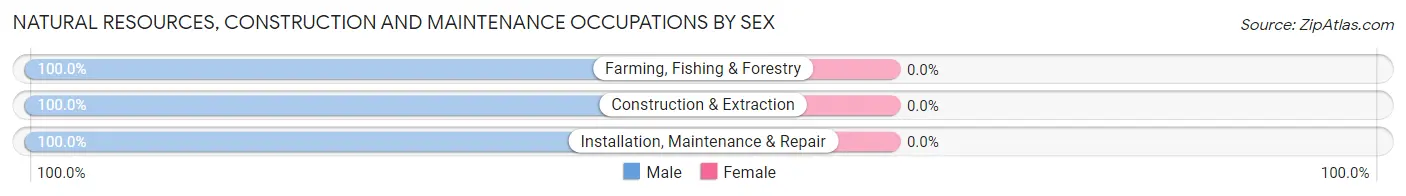
| Occupation | Male | Female |
| Farming, Fishing & Forestry | 24 (100.0%) | 0 (0.0%) |
| Construction & Extraction | 342 (100.0%) | 0 (0.0%) |
| Installation, Maintenance & Repair | 41 (100.0%) | 0 (0.0%) |
| Total (Category) | 407 (100.0%) | 0 (0.0%) |
| Total (Overall) | 3,088 (55.7%) | 2,456 (44.3%) |
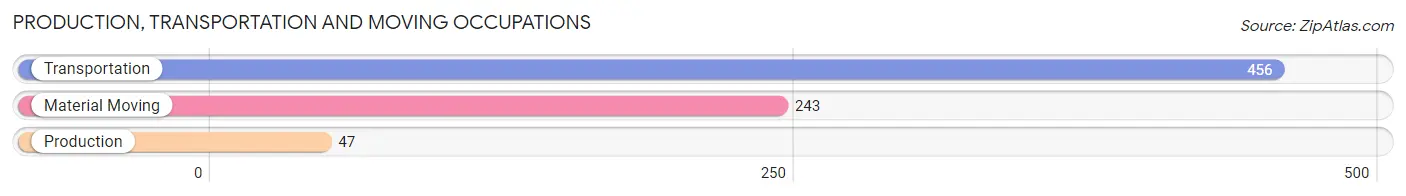
Production, Transportation and Moving Occupations
The most common Production, Transportation and Moving occupations in Woodbury are Transportation (456 | 8.2%), Material Moving (243 | 4.4%), and Production (47 | 0.9%).
Production, Transportation and Moving Occupations by Sex
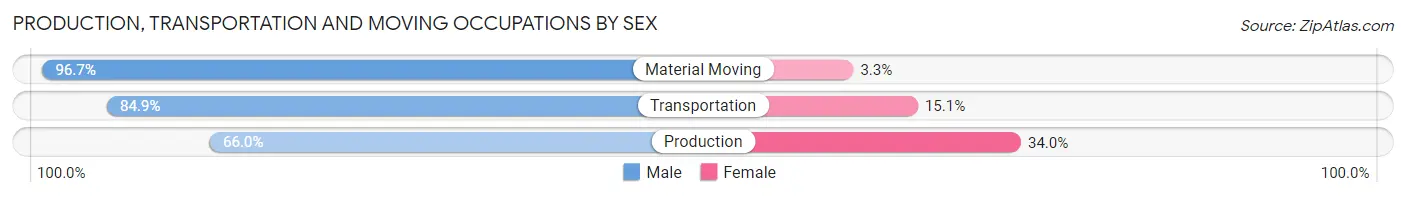
| Occupation | Male | Female |
| Production | 31 (66.0%) | 16 (34.0%) |
| Transportation | 387 (84.9%) | 69 (15.1%) |
| Material Moving | 235 (96.7%) | 8 (3.3%) |
| Total (Category) | 653 (87.5%) | 93 (12.5%) |
| Total (Overall) | 3,088 (55.7%) | 2,456 (44.3%) |
Employment Industries by Sex in Woodbury
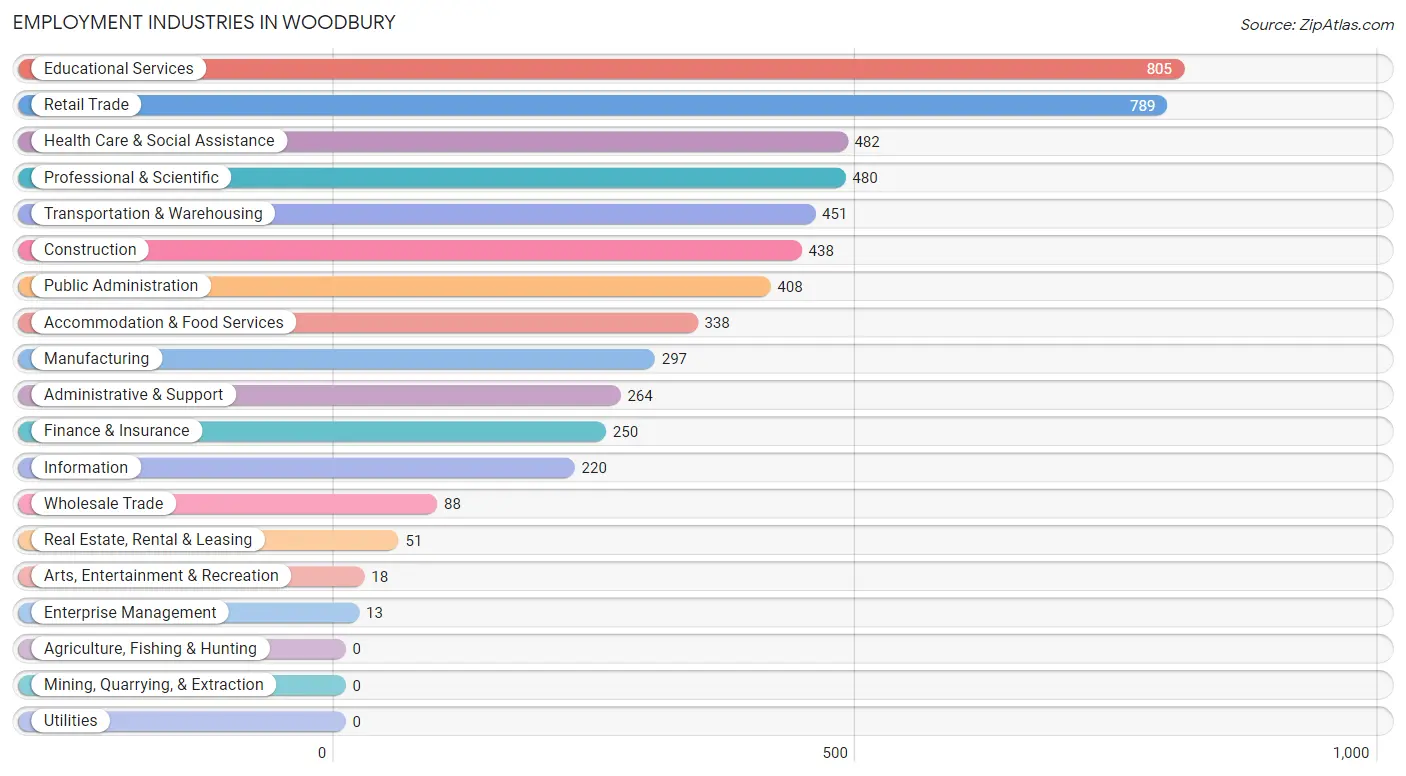
Employment Industries in Woodbury
The major employment industries in Woodbury include Educational Services (805 | 14.5%), Retail Trade (789 | 14.2%), Health Care & Social Assistance (482 | 8.7%), Professional & Scientific (480 | 8.7%), and Transportation & Warehousing (451 | 8.1%).
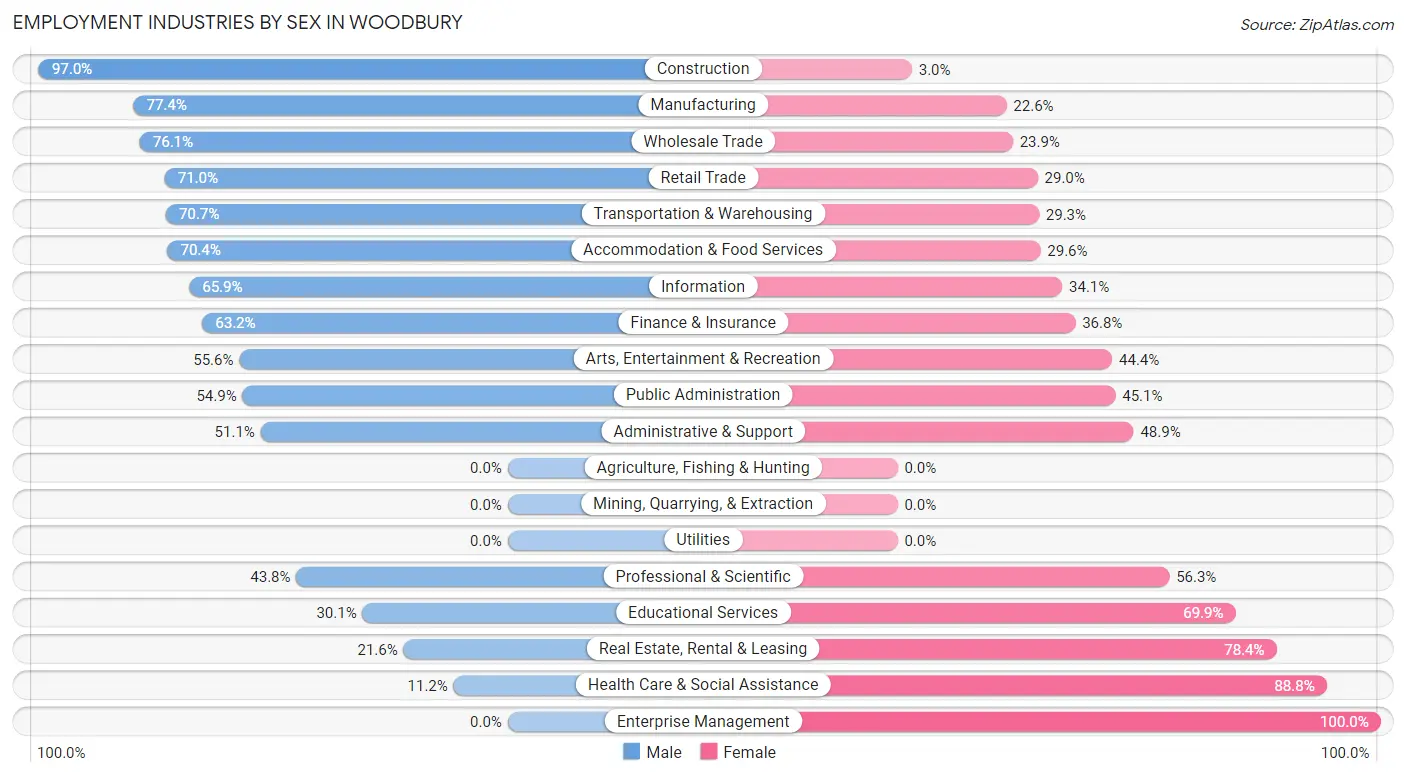
Employment Industries by Sex in Woodbury
The Woodbury industries that see more men than women are Construction (97.0%), Manufacturing (77.4%), and Wholesale Trade (76.1%), whereas the industries that tend to have a higher number of women are Enterprise Management (100.0%), Health Care & Social Assistance (88.8%), and Real Estate, Rental & Leasing (78.4%).
| Industry | Male | Female |
| Agriculture, Fishing & Hunting | 0 (0.0%) | 0 (0.0%) |
| Mining, Quarrying, & Extraction | 0 (0.0%) | 0 (0.0%) |
| Construction | 425 (97.0%) | 13 (3.0%) |
| Manufacturing | 230 (77.4%) | 67 (22.6%) |
| Wholesale Trade | 67 (76.1%) | 21 (23.9%) |
| Retail Trade | 560 (71.0%) | 229 (29.0%) |
| Transportation & Warehousing | 319 (70.7%) | 132 (29.3%) |
| Utilities | 0 (0.0%) | 0 (0.0%) |
| Information | 145 (65.9%) | 75 (34.1%) |
| Finance & Insurance | 158 (63.2%) | 92 (36.8%) |
| Real Estate, Rental & Leasing | 11 (21.6%) | 40 (78.4%) |
| Professional & Scientific | 210 (43.8%) | 270 (56.2%) |
| Enterprise Management | 0 (0.0%) | 13 (100.0%) |
| Administrative & Support | 135 (51.1%) | 129 (48.9%) |
| Educational Services | 242 (30.1%) | 563 (69.9%) |
| Health Care & Social Assistance | 54 (11.2%) | 428 (88.8%) |
| Arts, Entertainment & Recreation | 10 (55.6%) | 8 (44.4%) |
| Accommodation & Food Services | 238 (70.4%) | 100 (29.6%) |
| Public Administration | 224 (54.9%) | 184 (45.1%) |
| Total | 3,088 (55.7%) | 2,456 (44.3%) |
Education in Woodbury
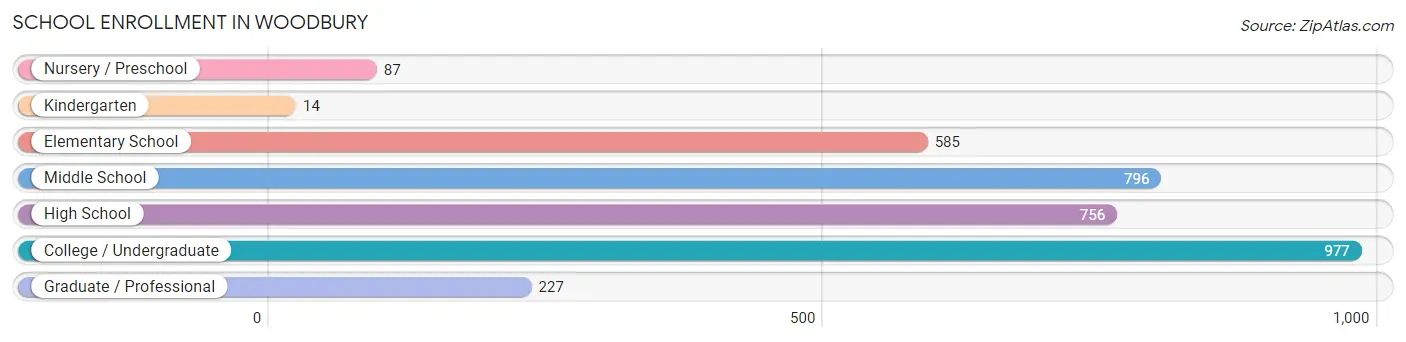
School Enrollment in Woodbury
The most common levels of schooling among the 3,442 students in Woodbury are college / undergraduate (977 | 28.4%), middle school (796 | 23.1%), and high school (756 | 22.0%).
| School Level | # Students | % Students |
| Nursery / Preschool | 87 | 2.5% |
| Kindergarten | 14 | 0.4% |
| Elementary School | 585 | 17.0% |
| Middle School | 796 | 23.1% |
| High School | 756 | 22.0% |
| College / Undergraduate | 977 | 28.4% |
| Graduate / Professional | 227 | 6.6% |
| Total | 3,442 | 100.0% |
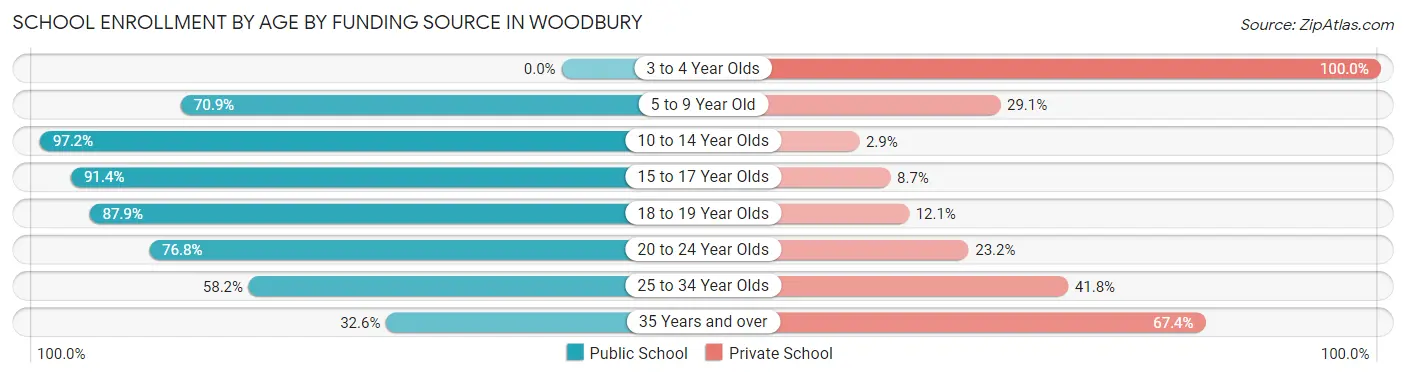
School Enrollment by Age by Funding Source in Woodbury
Out of a total of 3,442 students who are enrolled in schools in Woodbury, 664 (19.3%) attend a private institution, while the remaining 2,778 (80.7%) are enrolled in public schools. The age group of 3 to 4 year olds has the highest likelihood of being enrolled in private schools, with 87 (100.0% in the age bracket) enrolled. Conversely, the age group of 10 to 14 year olds has the lowest likelihood of being enrolled in a private school, with 988 (97.2% in the age bracket) attending a public institution.
| Age Bracket | Public School | Private School |
| 3 to 4 Year Olds | 0 (0.0%) | 87 (100.0%) |
| 5 to 9 Year Old | 348 (70.9%) | 143 (29.1%) |
| 10 to 14 Year Olds | 988 (97.2%) | 29 (2.9%) |
| 15 to 17 Year Olds | 528 (91.3%) | 50 (8.6%) |
| 18 to 19 Year Olds | 312 (87.9%) | 43 (12.1%) |
| 20 to 24 Year Olds | 493 (76.8%) | 149 (23.2%) |
| 25 to 34 Year Olds | 46 (58.2%) | 33 (41.8%) |
| 35 Years and over | 63 (32.6%) | 130 (67.4%) |
| Total | 2,778 (80.7%) | 664 (19.3%) |
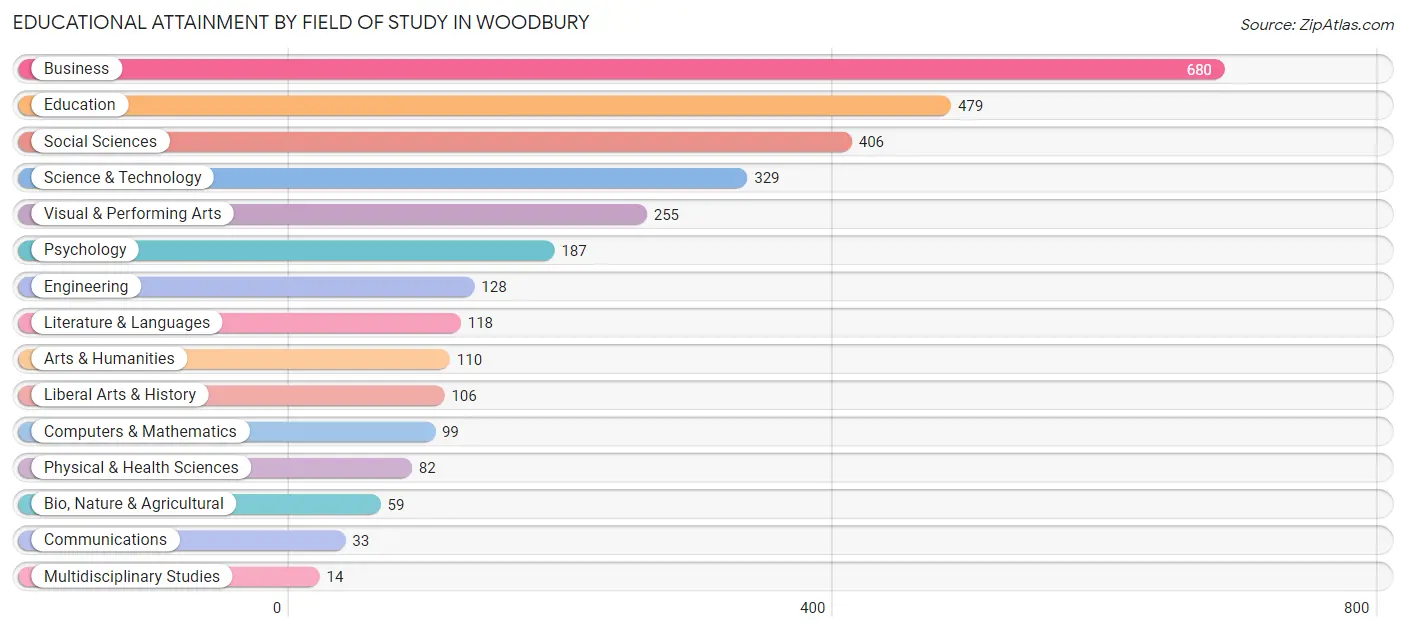
Educational Attainment by Field of Study in Woodbury
Business (680 | 22.0%), education (479 | 15.5%), social sciences (406 | 13.2%), science & technology (329 | 10.7%), and visual & performing arts (255 | 8.3%) are the most common fields of study among 3,085 individuals in Woodbury who have obtained a bachelor's degree or higher.
| Field of Study | # Graduates | % Graduates |
| Computers & Mathematics | 99 | 3.2% |
| Bio, Nature & Agricultural | 59 | 1.9% |
| Physical & Health Sciences | 82 | 2.7% |
| Psychology | 187 | 6.1% |
| Social Sciences | 406 | 13.2% |
| Engineering | 128 | 4.2% |
| Multidisciplinary Studies | 14 | 0.4% |
| Science & Technology | 329 | 10.7% |
| Business | 680 | 22.0% |
| Education | 479 | 15.5% |
| Literature & Languages | 118 | 3.8% |
| Liberal Arts & History | 106 | 3.4% |
| Visual & Performing Arts | 255 | 8.3% |
| Communications | 33 | 1.1% |
| Arts & Humanities | 110 | 3.6% |
| Total | 3,085 | 100.0% |
Transportation & Commute in Woodbury
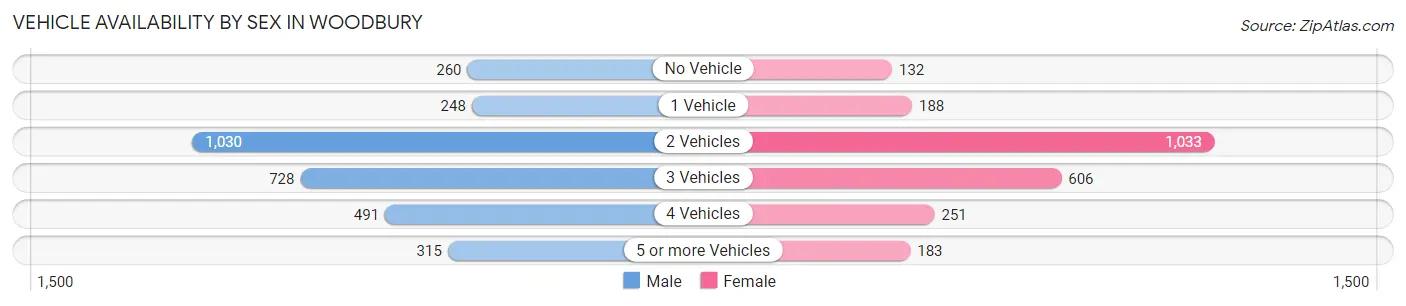
Vehicle Availability by Sex in Woodbury
The most prevalent vehicle ownership categories in Woodbury are males with 2 vehicles (1,030, accounting for 33.5%) and females with 2 vehicles (1,033, making up 43.0%).
| Vehicles Available | Male | Female |
| No Vehicle | 260 (8.5%) | 132 (5.5%) |
| 1 Vehicle | 248 (8.1%) | 188 (7.9%) |
| 2 Vehicles | 1,030 (33.5%) | 1,033 (43.2%) |
| 3 Vehicles | 728 (23.7%) | 606 (25.3%) |
| 4 Vehicles | 491 (16.0%) | 251 (10.5%) |
| 5 or more Vehicles | 315 (10.2%) | 183 (7.6%) |
| Total | 3,072 (100.0%) | 2,393 (100.0%) |
Commute Time in Woodbury
The most frequently occuring commute durations in Woodbury are 45 to 59 minutes (893 commuters, 17.7%), 60 to 89 minutes (872 commuters, 17.3%), and 30 to 34 minutes (558 commuters, 11.1%).
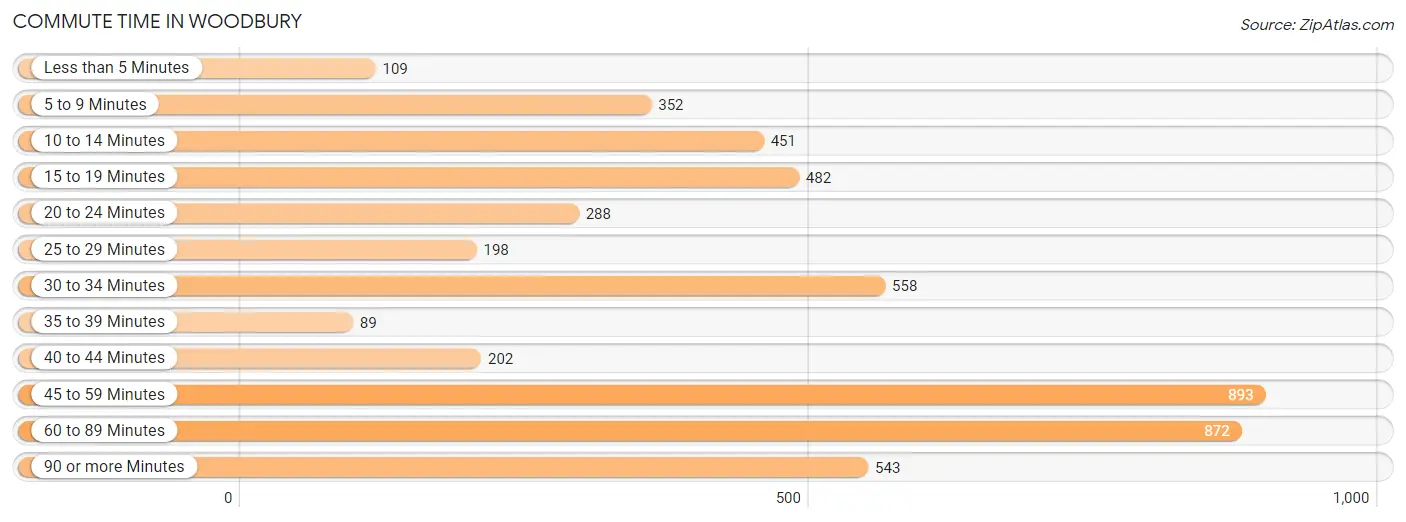
| Commute Time | # Commuters | % Commuters |
| Less than 5 Minutes | 109 | 2.2% |
| 5 to 9 Minutes | 352 | 7.0% |
| 10 to 14 Minutes | 451 | 8.9% |
| 15 to 19 Minutes | 482 | 9.6% |
| 20 to 24 Minutes | 288 | 5.7% |
| 25 to 29 Minutes | 198 | 3.9% |
| 30 to 34 Minutes | 558 | 11.1% |
| 35 to 39 Minutes | 89 | 1.8% |
| 40 to 44 Minutes | 202 | 4.0% |
| 45 to 59 Minutes | 893 | 17.7% |
| 60 to 89 Minutes | 872 | 17.3% |
| 90 or more Minutes | 543 | 10.8% |
Commute Time by Sex in Woodbury
The most common commute times in Woodbury are 60 to 89 minutes (643 commuters, 22.0%) for males and 45 to 59 minutes (405 commuters, 19.2%) for females.
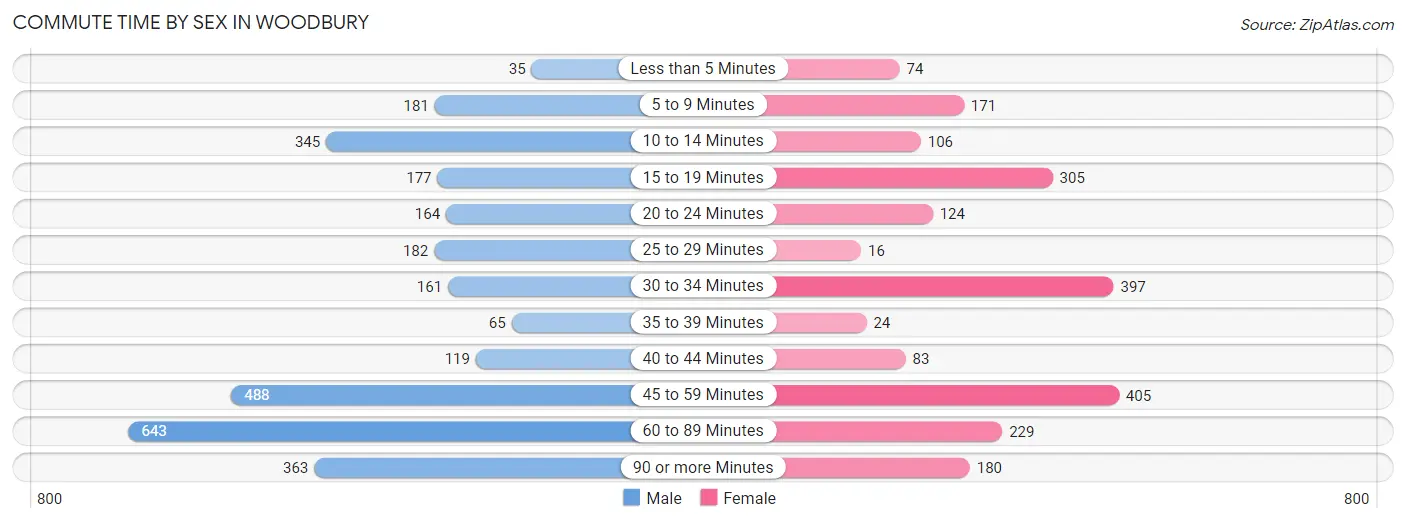
| Commute Time | Male | Female |
| Less than 5 Minutes | 35 (1.2%) | 74 (3.5%) |
| 5 to 9 Minutes | 181 (6.2%) | 171 (8.1%) |
| 10 to 14 Minutes | 345 (11.8%) | 106 (5.0%) |
| 15 to 19 Minutes | 177 (6.1%) | 305 (14.4%) |
| 20 to 24 Minutes | 164 (5.6%) | 124 (5.9%) |
| 25 to 29 Minutes | 182 (6.2%) | 16 (0.8%) |
| 30 to 34 Minutes | 161 (5.5%) | 397 (18.8%) |
| 35 to 39 Minutes | 65 (2.2%) | 24 (1.1%) |
| 40 to 44 Minutes | 119 (4.1%) | 83 (3.9%) |
| 45 to 59 Minutes | 488 (16.7%) | 405 (19.2%) |
| 60 to 89 Minutes | 643 (22.0%) | 229 (10.8%) |
| 90 or more Minutes | 363 (12.4%) | 180 (8.5%) |
Time of Departure to Work by Sex in Woodbury
The most frequent times of departure to work in Woodbury are 8:00 AM to 8:29 AM (520, 17.8%) for males and 7:30 AM to 7:59 AM (357, 16.9%) for females.
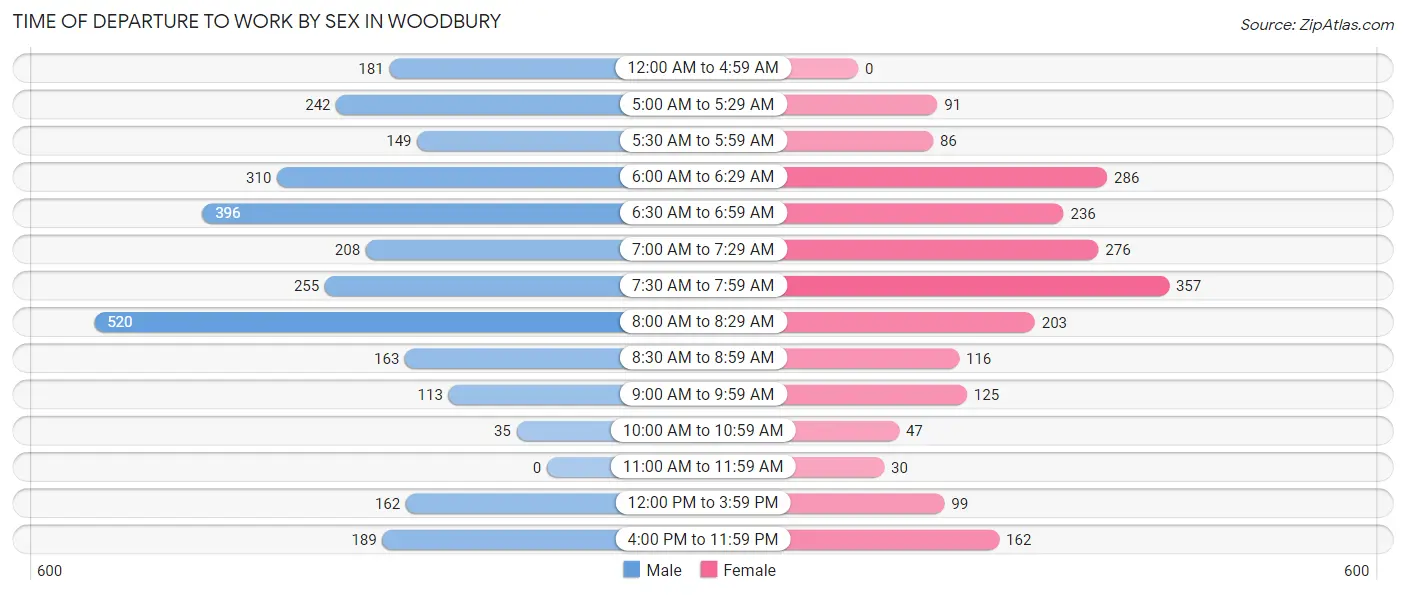
| Time of Departure | Male | Female |
| 12:00 AM to 4:59 AM | 181 (6.2%) | 0 (0.0%) |
| 5:00 AM to 5:29 AM | 242 (8.3%) | 91 (4.3%) |
| 5:30 AM to 5:59 AM | 149 (5.1%) | 86 (4.1%) |
| 6:00 AM to 6:29 AM | 310 (10.6%) | 286 (13.5%) |
| 6:30 AM to 6:59 AM | 396 (13.6%) | 236 (11.2%) |
| 7:00 AM to 7:29 AM | 208 (7.1%) | 276 (13.1%) |
| 7:30 AM to 7:59 AM | 255 (8.7%) | 357 (16.9%) |
| 8:00 AM to 8:29 AM | 520 (17.8%) | 203 (9.6%) |
| 8:30 AM to 8:59 AM | 163 (5.6%) | 116 (5.5%) |
| 9:00 AM to 9:59 AM | 113 (3.9%) | 125 (5.9%) |
| 10:00 AM to 10:59 AM | 35 (1.2%) | 47 (2.2%) |
| 11:00 AM to 11:59 AM | 0 (0.0%) | 30 (1.4%) |
| 12:00 PM to 3:59 PM | 162 (5.5%) | 99 (4.7%) |
| 4:00 PM to 11:59 PM | 189 (6.5%) | 162 (7.7%) |
| Total | 2,923 (100.0%) | 2,114 (100.0%) |
Housing Occupancy in Woodbury
Occupancy by Ownership in Woodbury
Of the total 3,517 dwellings in Woodbury, owner-occupied units account for 3,256 (92.6%), while renter-occupied units make up 261 (7.4%).
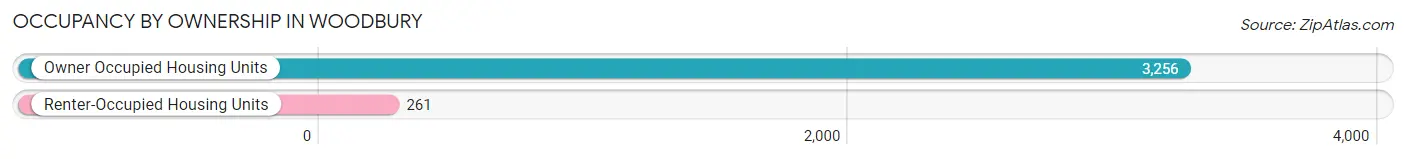
| Occupancy | # Housing Units | % Housing Units |
| Owner Occupied Housing Units | 3,256 | 92.6% |
| Renter-Occupied Housing Units | 261 | 7.4% |
| Total Occupied Housing Units | 3,517 | 100.0% |
Occupancy by Household Size in Woodbury
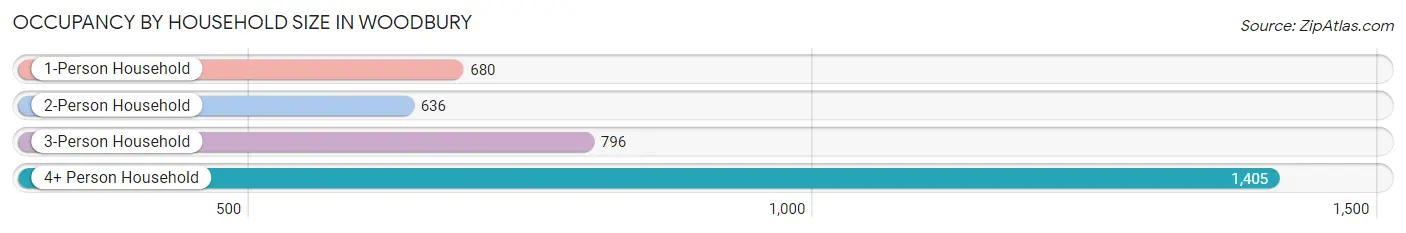
| Household Size | # Housing Units | % Housing Units |
| 1-Person Household | 680 | 19.3% |
| 2-Person Household | 636 | 18.1% |
| 3-Person Household | 796 | 22.6% |
| 4+ Person Household | 1,405 | 40.0% |
| Total Housing Units | 3,517 | 100.0% |
Occupancy by Ownership by Household Size in Woodbury
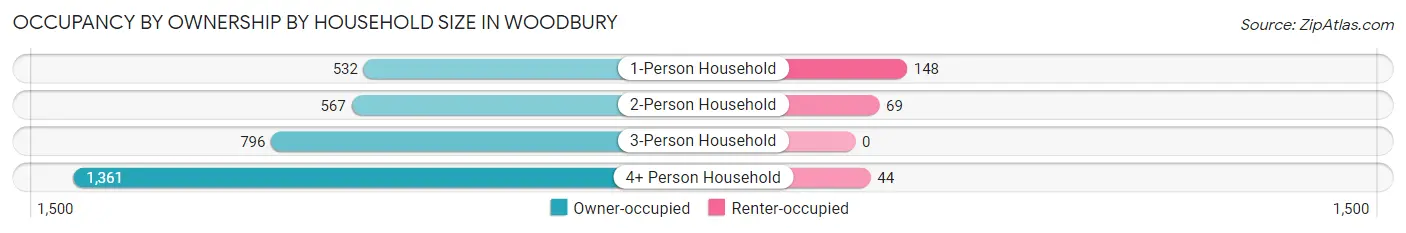
| Household Size | Owner-occupied | Renter-occupied |
| 1-Person Household | 532 (78.2%) | 148 (21.8%) |
| 2-Person Household | 567 (89.1%) | 69 (10.8%) |
| 3-Person Household | 796 (100.0%) | 0 (0.0%) |
| 4+ Person Household | 1,361 (96.9%) | 44 (3.1%) |
| Total Housing Units | 3,256 (92.6%) | 261 (7.4%) |
Occupancy by Educational Attainment in Woodbury
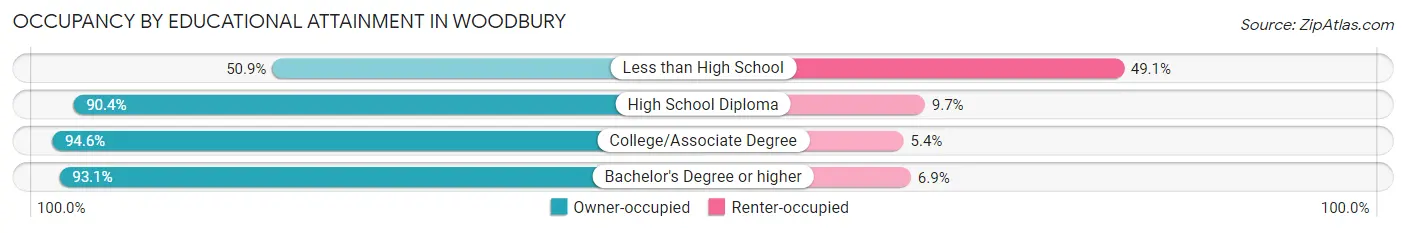
| Household Size | Owner-occupied | Renter-occupied |
| Less than High School | 28 (50.9%) | 27 (49.1%) |
| High School Diploma | 468 (90.3%) | 50 (9.7%) |
| College/Associate Degree | 1,219 (94.6%) | 70 (5.4%) |
| Bachelor's Degree or higher | 1,541 (93.1%) | 114 (6.9%) |
Occupancy by Age of Householder in Woodbury
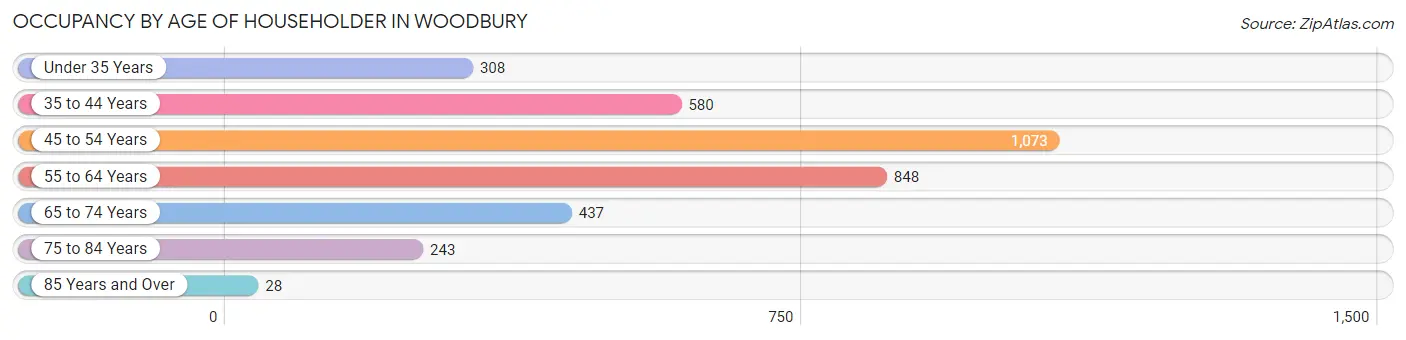
| Age Bracket | # Households | % Households |
| Under 35 Years | 308 | 8.8% |
| 35 to 44 Years | 580 | 16.5% |
| 45 to 54 Years | 1,073 | 30.5% |
| 55 to 64 Years | 848 | 24.1% |
| 65 to 74 Years | 437 | 12.4% |
| 75 to 84 Years | 243 | 6.9% |
| 85 Years and Over | 28 | 0.8% |
| Total | 3,517 | 100.0% |
Housing Finances in Woodbury
Median Income by Occupancy in Woodbury
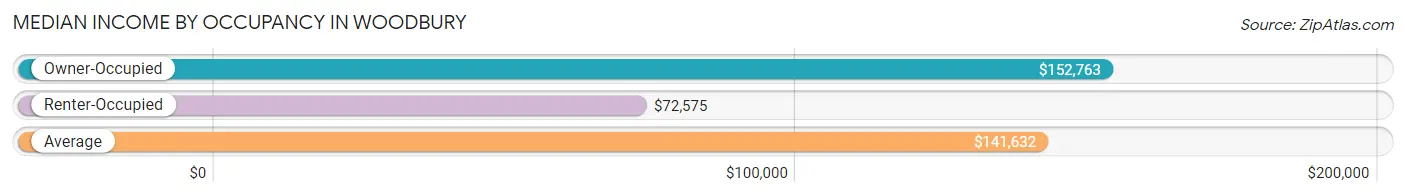
| Occupancy Type | # Households | Median Income |
| Owner-Occupied | 3,256 (92.6%) | $152,763 |
| Renter-Occupied | 261 (7.4%) | $72,575 |
| Average | 3,517 (100.0%) | $141,632 |
Occupancy by Householder Income Bracket in Woodbury
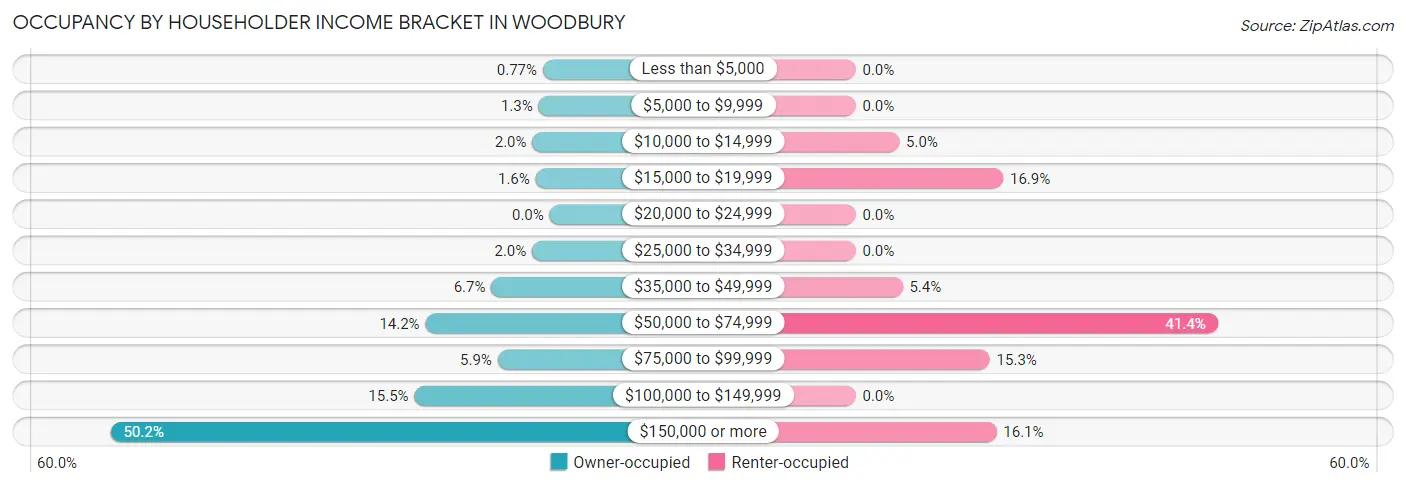
| Income Bracket | Owner-occupied | Renter-occupied |
| Less than $5,000 | 25 (0.8%) | 0 (0.0%) |
| $5,000 to $9,999 | 41 (1.3%) | 0 (0.0%) |
| $10,000 to $14,999 | 64 (2.0%) | 13 (5.0%) |
| $15,000 to $19,999 | 52 (1.6%) | 44 (16.9%) |
| $20,000 to $24,999 | 0 (0.0%) | 0 (0.0%) |
| $25,000 to $34,999 | 65 (2.0%) | 0 (0.0%) |
| $35,000 to $49,999 | 217 (6.7%) | 14 (5.4%) |
| $50,000 to $74,999 | 462 (14.2%) | 108 (41.4%) |
| $75,000 to $99,999 | 193 (5.9%) | 40 (15.3%) |
| $100,000 to $149,999 | 503 (15.4%) | 0 (0.0%) |
| $150,000 or more | 1,634 (50.2%) | 42 (16.1%) |
| Total | 3,256 (100.0%) | 261 (100.0%) |
Monthly Housing Cost Tiers in Woodbury
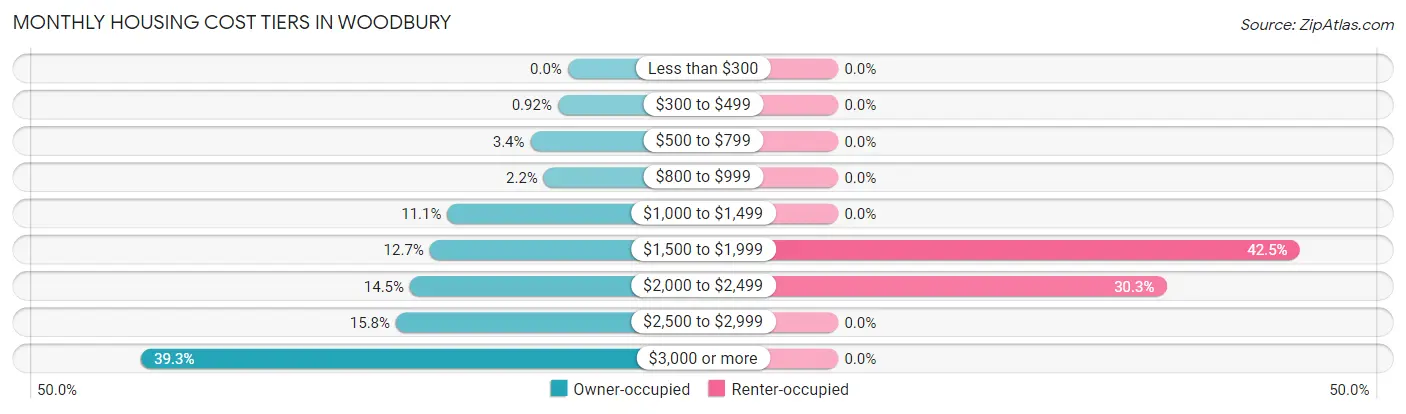
| Monthly Cost | Owner-occupied | Renter-occupied |
| Less than $300 | 0 (0.0%) | 0 (0.0%) |
| $300 to $499 | 30 (0.9%) | 0 (0.0%) |
| $500 to $799 | 112 (3.4%) | 0 (0.0%) |
| $800 to $999 | 72 (2.2%) | 0 (0.0%) |
| $1,000 to $1,499 | 361 (11.1%) | 0 (0.0%) |
| $1,500 to $1,999 | 414 (12.7%) | 111 (42.5%) |
| $2,000 to $2,499 | 473 (14.5%) | 79 (30.3%) |
| $2,500 to $2,999 | 515 (15.8%) | 0 (0.0%) |
| $3,000 or more | 1,279 (39.3%) | 0 (0.0%) |
| Total | 3,256 (100.0%) | 261 (100.0%) |
Physical Housing Characteristics in Woodbury
Housing Structures in Woodbury
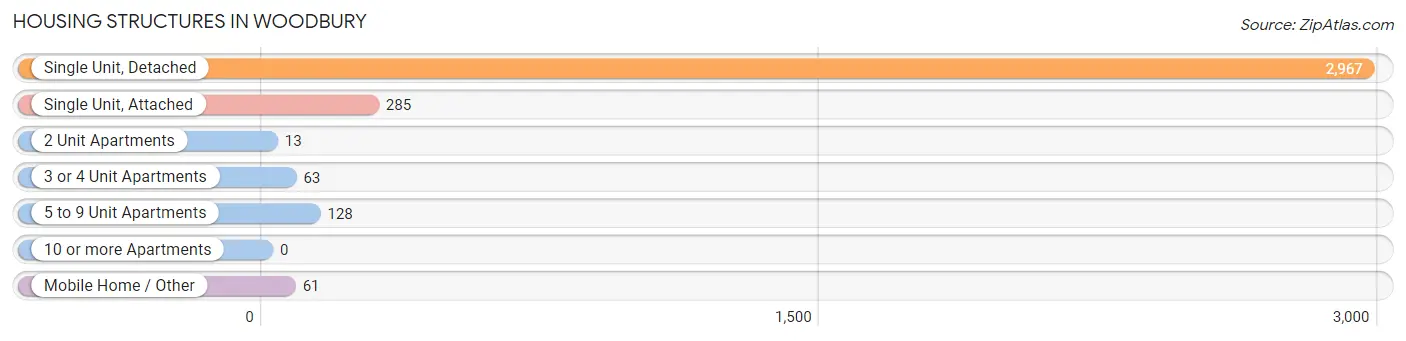
| Structure Type | # Housing Units | % Housing Units |
| Single Unit, Detached | 2,967 | 84.4% |
| Single Unit, Attached | 285 | 8.1% |
| 2 Unit Apartments | 13 | 0.4% |
| 3 or 4 Unit Apartments | 63 | 1.8% |
| 5 to 9 Unit Apartments | 128 | 3.6% |
| 10 or more Apartments | 0 | 0.0% |
| Mobile Home / Other | 61 | 1.7% |
| Total | 3,517 | 100.0% |
Housing Structures by Occupancy in Woodbury
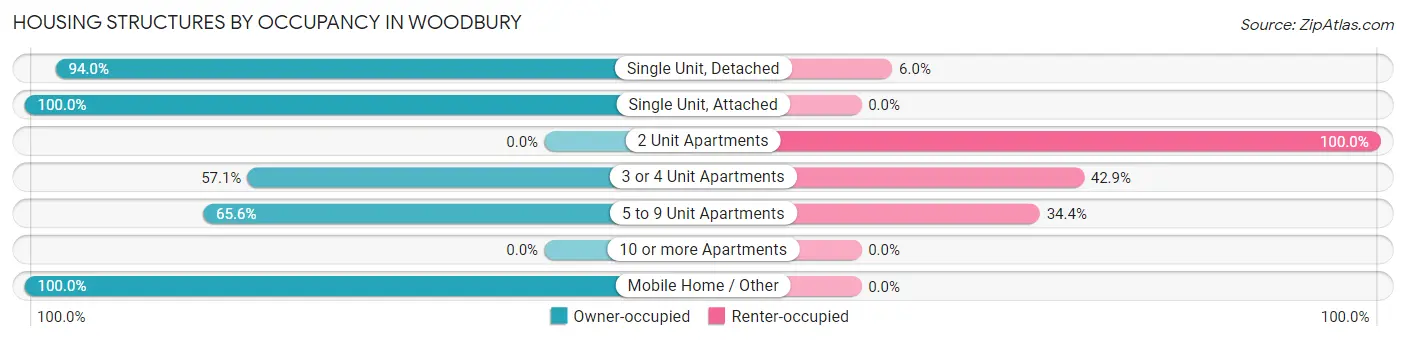
| Structure Type | Owner-occupied | Renter-occupied |
| Single Unit, Detached | 2,790 (94.0%) | 177 (6.0%) |
| Single Unit, Attached | 285 (100.0%) | 0 (0.0%) |
| 2 Unit Apartments | 0 (0.0%) | 13 (100.0%) |
| 3 or 4 Unit Apartments | 36 (57.1%) | 27 (42.9%) |
| 5 to 9 Unit Apartments | 84 (65.6%) | 44 (34.4%) |
| 10 or more Apartments | 0 (0.0%) | 0 (0.0%) |
| Mobile Home / Other | 61 (100.0%) | 0 (0.0%) |
| Total | 3,256 (92.6%) | 261 (7.4%) |
Housing Structures by Number of Rooms in Woodbury
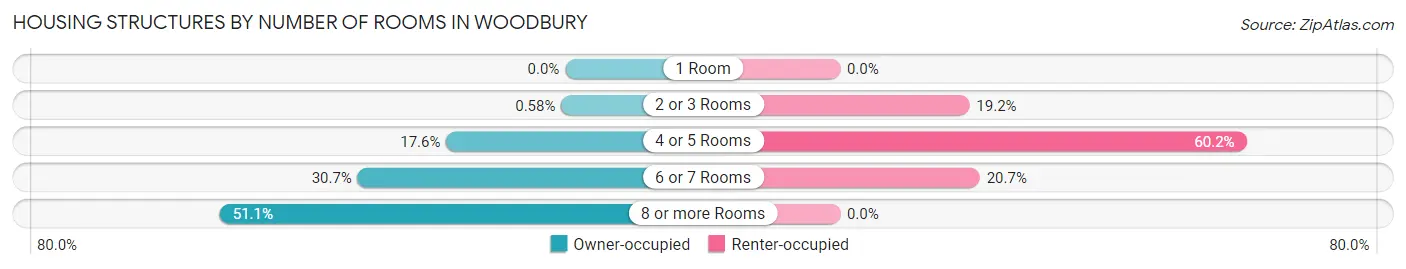
| Number of Rooms | Owner-occupied | Renter-occupied |
| 1 Room | 0 (0.0%) | 0 (0.0%) |
| 2 or 3 Rooms | 19 (0.6%) | 50 (19.2%) |
| 4 or 5 Rooms | 573 (17.6%) | 157 (60.2%) |
| 6 or 7 Rooms | 1,000 (30.7%) | 54 (20.7%) |
| 8 or more Rooms | 1,664 (51.1%) | 0 (0.0%) |
| Total | 3,256 (100.0%) | 261 (100.0%) |
Housing Structure by Heating Type in Woodbury
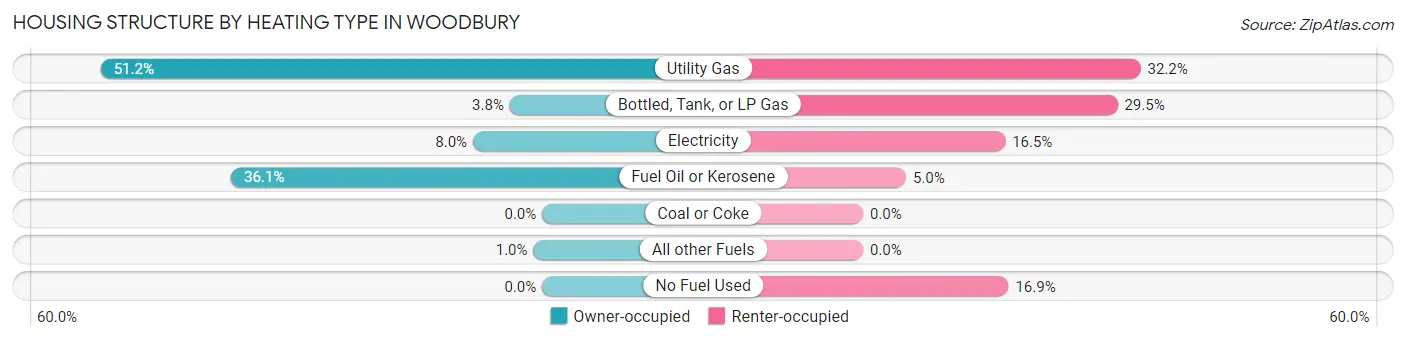
| Heating Type | Owner-occupied | Renter-occupied |
| Utility Gas | 1,666 (51.2%) | 84 (32.2%) |
| Bottled, Tank, or LP Gas | 122 (3.7%) | 77 (29.5%) |
| Electricity | 261 (8.0%) | 43 (16.5%) |
| Fuel Oil or Kerosene | 1,174 (36.1%) | 13 (5.0%) |
| Coal or Coke | 0 (0.0%) | 0 (0.0%) |
| All other Fuels | 33 (1.0%) | 0 (0.0%) |
| No Fuel Used | 0 (0.0%) | 44 (16.9%) |
| Total | 3,256 (100.0%) | 261 (100.0%) |
Household Vehicle Usage in Woodbury
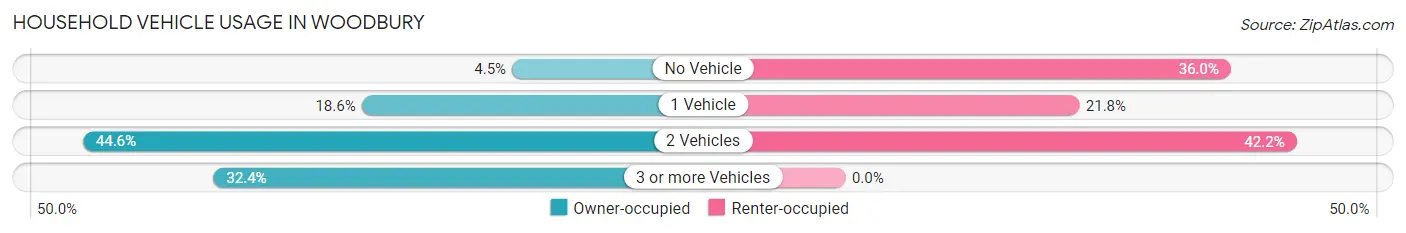
| Vehicles per Household | Owner-occupied | Renter-occupied |
| No Vehicle | 147 (4.5%) | 94 (36.0%) |
| 1 Vehicle | 604 (18.5%) | 57 (21.8%) |
| 2 Vehicles | 1,451 (44.6%) | 110 (42.1%) |
| 3 or more Vehicles | 1,054 (32.4%) | 0 (0.0%) |
| Total | 3,256 (100.0%) | 261 (100.0%) |
Real Estate & Mortgages in Woodbury
Real Estate and Mortgage Overview in Woodbury
| Characteristic | Without Mortgage | With Mortgage |
| Housing Units | 917 | 2,339 |
| Median Property Value | $371,200 | $416,900 |
| Median Household Income | $114,181 | $1,317 |
| Monthly Housing Costs | $1,455 | $1,279 |
| Real Estate Taxes | $10,001 | $16 |
Property Value by Mortgage Status in Woodbury
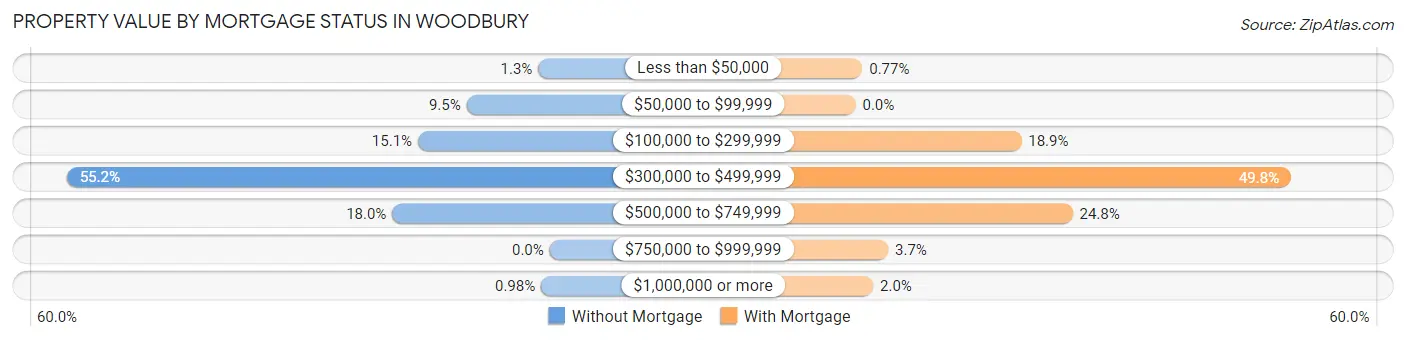
| Property Value | Without Mortgage | With Mortgage |
| Less than $50,000 | 12 (1.3%) | 18 (0.8%) |
| $50,000 to $99,999 | 87 (9.5%) | 0 (0.0%) |
| $100,000 to $299,999 | 138 (15.0%) | 443 (18.9%) |
| $300,000 to $499,999 | 506 (55.2%) | 1,164 (49.8%) |
| $500,000 to $749,999 | 165 (18.0%) | 580 (24.8%) |
| $750,000 to $999,999 | 0 (0.0%) | 87 (3.7%) |
| $1,000,000 or more | 9 (1.0%) | 47 (2.0%) |
| Total | 917 (100.0%) | 2,339 (100.0%) |
Household Income by Mortgage Status in Woodbury
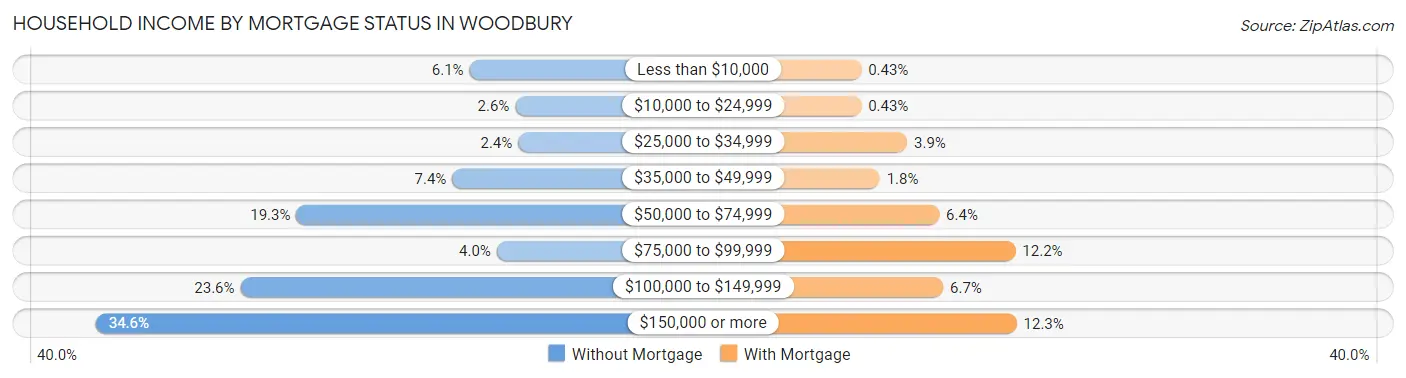
| Household Income | Without Mortgage | With Mortgage |
| Less than $10,000 | 56 (6.1%) | 10 (0.4%) |
| $10,000 to $24,999 | 24 (2.6%) | 10 (0.4%) |
| $25,000 to $34,999 | 22 (2.4%) | 92 (3.9%) |
| $35,000 to $49,999 | 68 (7.4%) | 43 (1.8%) |
| $50,000 to $74,999 | 177 (19.3%) | 149 (6.4%) |
| $75,000 to $99,999 | 37 (4.0%) | 285 (12.2%) |
| $100,000 to $149,999 | 216 (23.6%) | 156 (6.7%) |
| $150,000 or more | 317 (34.6%) | 287 (12.3%) |
| Total | 917 (100.0%) | 2,339 (100.0%) |
Property Value to Household Income Ratio in Woodbury
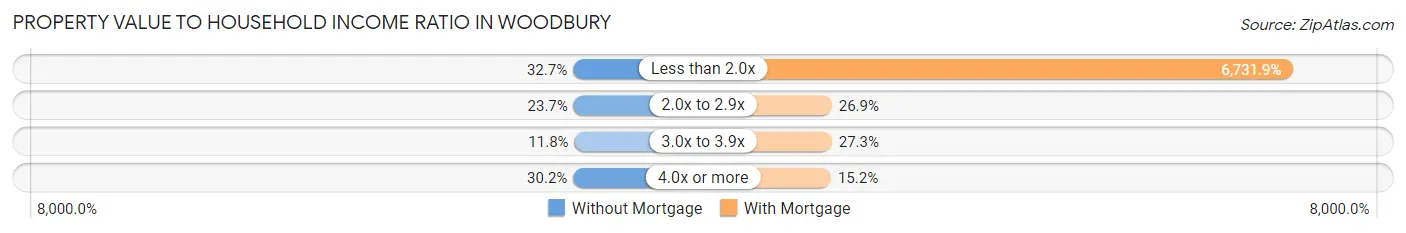
| Value-to-Income Ratio | Without Mortgage | With Mortgage |
| Less than 2.0x | 300 (32.7%) | 157,459 (6,731.9%) |
| 2.0x to 2.9x | 217 (23.7%) | 629 (26.9%) |
| 3.0x to 3.9x | 108 (11.8%) | 638 (27.3%) |
| 4.0x or more | 277 (30.2%) | 355 (15.2%) |
| Total | 917 (100.0%) | 2,339 (100.0%) |
Real Estate Taxes by Mortgage Status in Woodbury
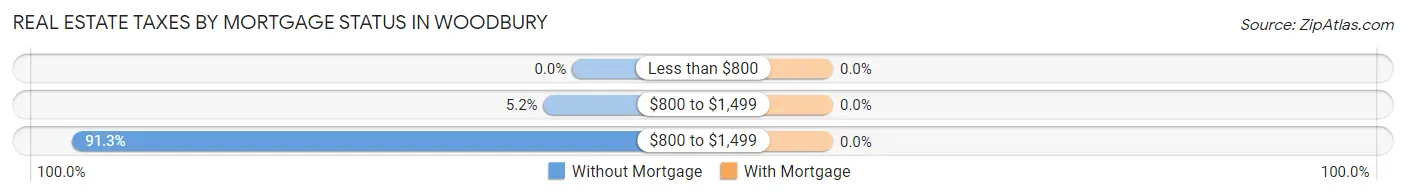
| Property Taxes | Without Mortgage | With Mortgage |
| Less than $800 | 0 (0.0%) | 0 (0.0%) |
| $800 to $1,499 | 48 (5.2%) | 0 (0.0%) |
| $800 to $1,499 | 837 (91.3%) | 0 (0.0%) |
| Total | 917 (100.0%) | 2,339 (100.0%) |
Health & Disability in Woodbury
Health Insurance Coverage by Age in Woodbury
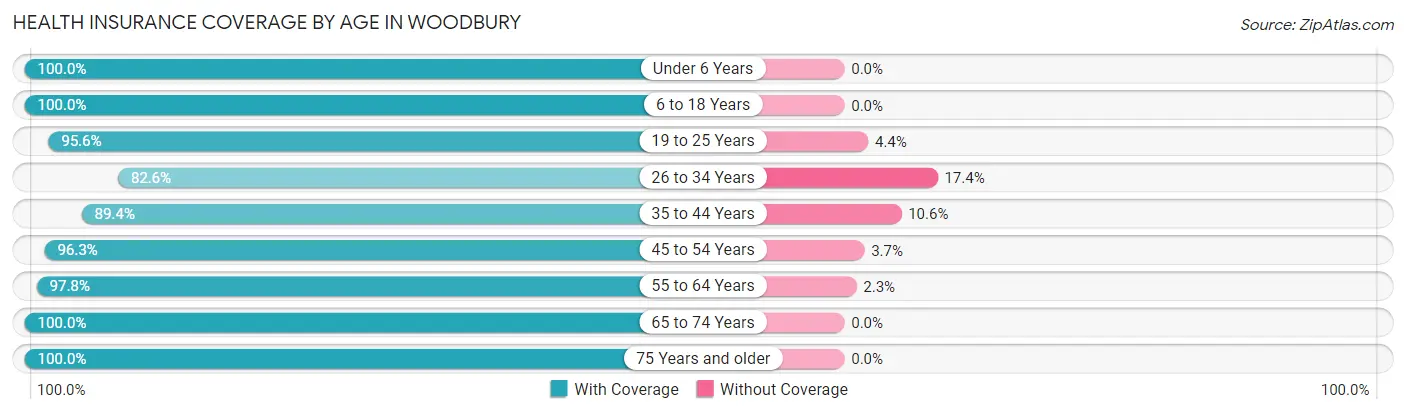
| Age Bracket | With Coverage | Without Coverage |
| Under 6 Years | 587 (100.0%) | 0 (0.0%) |
| 6 to 18 Years | 2,329 (100.0%) | 0 (0.0%) |
| 19 to 25 Years | 1,553 (95.6%) | 72 (4.4%) |
| 26 to 34 Years | 751 (82.6%) | 158 (17.4%) |
| 35 to 44 Years | 1,203 (89.4%) | 143 (10.6%) |
| 45 to 54 Years | 1,843 (96.3%) | 71 (3.7%) |
| 55 to 64 Years | 1,344 (97.8%) | 31 (2.2%) |
| 65 to 74 Years | 772 (100.0%) | 0 (0.0%) |
| 75 Years and older | 514 (100.0%) | 0 (0.0%) |
| Total | 10,896 (95.8%) | 475 (4.2%) |
Health Insurance Coverage by Citizenship Status in Woodbury
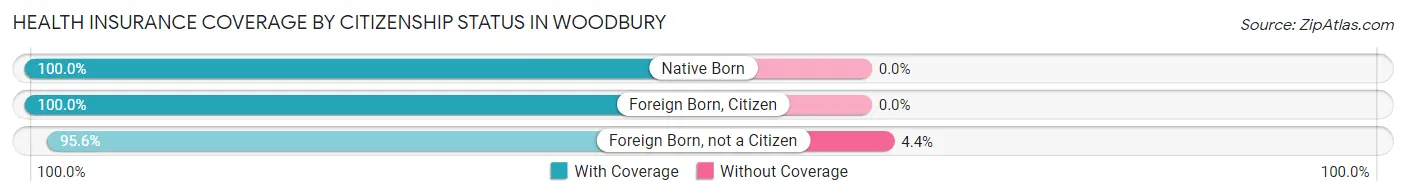
| Citizenship Status | With Coverage | Without Coverage |
| Native Born | 587 (100.0%) | 0 (0.0%) |
| Foreign Born, Citizen | 2,329 (100.0%) | 0 (0.0%) |
| Foreign Born, not a Citizen | 1,553 (95.6%) | 72 (4.4%) |
Health Insurance Coverage by Household Income in Woodbury
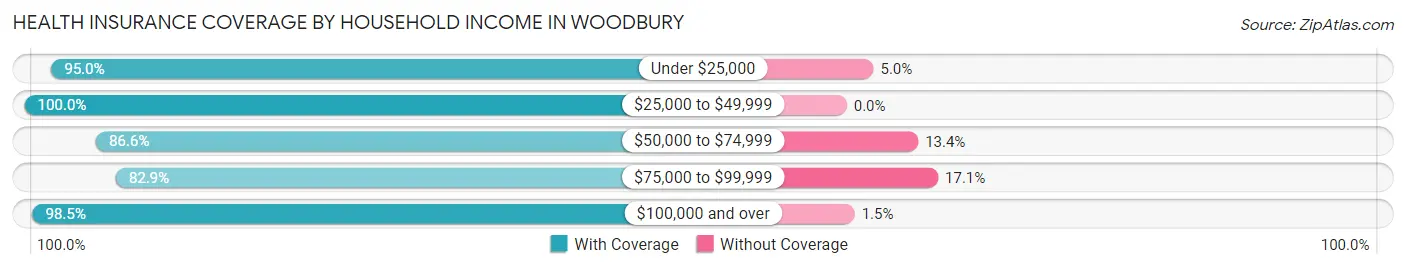
| Household Income | With Coverage | Without Coverage |
| Under $25,000 | 360 (95.0%) | 19 (5.0%) |
| $25,000 to $49,999 | 665 (100.0%) | 0 (0.0%) |
| $50,000 to $74,999 | 1,534 (86.6%) | 237 (13.4%) |
| $75,000 to $99,999 | 494 (82.9%) | 102 (17.1%) |
| $100,000 and over | 7,814 (98.5%) | 117 (1.5%) |
Public vs Private Health Insurance Coverage by Age in Woodbury
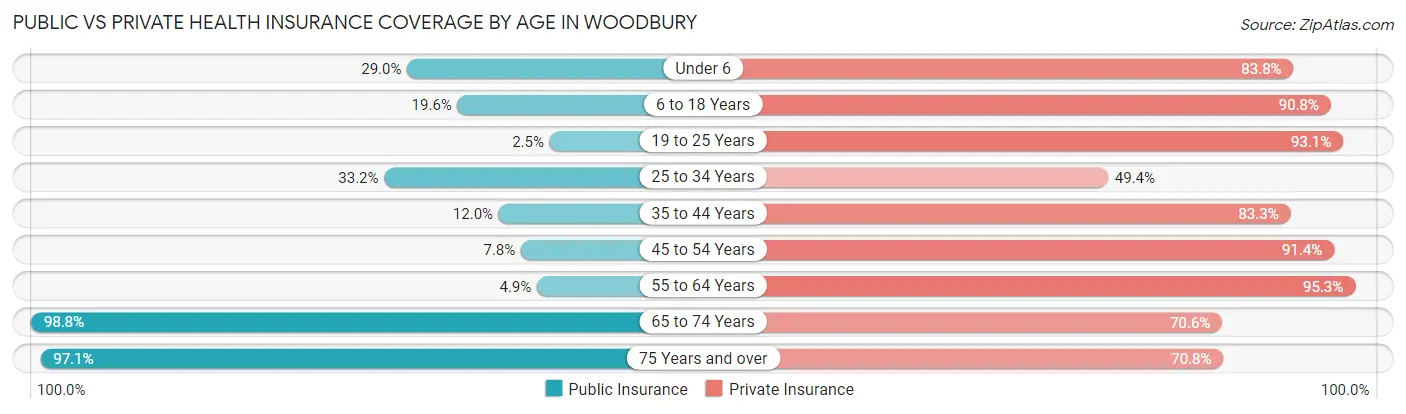
| Age Bracket | Public Insurance | Private Insurance |
| Under 6 | 170 (29.0%) | 492 (83.8%) |
| 6 to 18 Years | 457 (19.6%) | 2,114 (90.8%) |
| 19 to 25 Years | 41 (2.5%) | 1,512 (93.0%) |
| 25 to 34 Years | 302 (33.2%) | 449 (49.4%) |
| 35 to 44 Years | 161 (12.0%) | 1,121 (83.3%) |
| 45 to 54 Years | 150 (7.8%) | 1,749 (91.4%) |
| 55 to 64 Years | 67 (4.9%) | 1,310 (95.3%) |
| 65 to 74 Years | 763 (98.8%) | 545 (70.6%) |
| 75 Years and over | 499 (97.1%) | 364 (70.8%) |
| Total | 2,610 (23.0%) | 9,656 (84.9%) |
Disability Status by Sex by Age in Woodbury
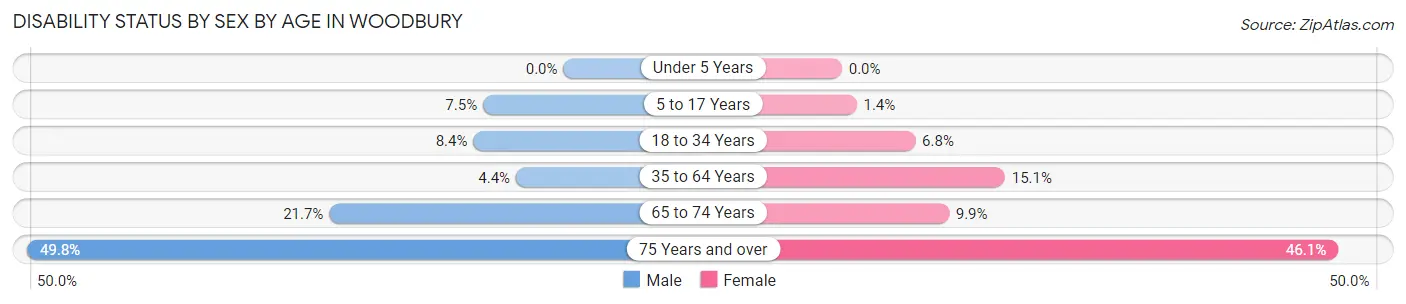
| Age Bracket | Male | Female |
| Under 5 Years | 0 (0.0%) | 0 (0.0%) |
| 5 to 17 Years | 97 (7.5%) | 11 (1.4%) |
| 18 to 34 Years | 134 (8.4%) | 80 (6.8%) |
| 35 to 64 Years | 88 (4.4%) | 399 (15.1%) |
| 65 to 74 Years | 78 (21.7%) | 41 (9.9%) |
| 75 Years and over | 111 (49.8%) | 134 (46.1%) |
Disability Class by Sex by Age in Woodbury
Disability Class: Hearing Difficulty
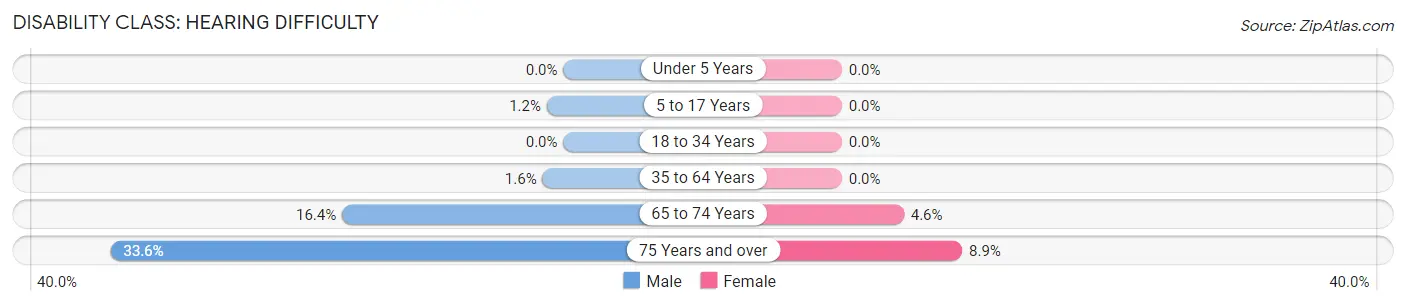
| Age Bracket | Male | Female |
| Under 5 Years | 0 (0.0%) | 0 (0.0%) |
| 5 to 17 Years | 16 (1.2%) | 0 (0.0%) |
| 18 to 34 Years | 0 (0.0%) | 0 (0.0%) |
| 35 to 64 Years | 31 (1.5%) | 0 (0.0%) |
| 65 to 74 Years | 59 (16.4%) | 19 (4.6%) |
| 75 Years and over | 75 (33.6%) | 26 (8.9%) |
Disability Class: Vision Difficulty
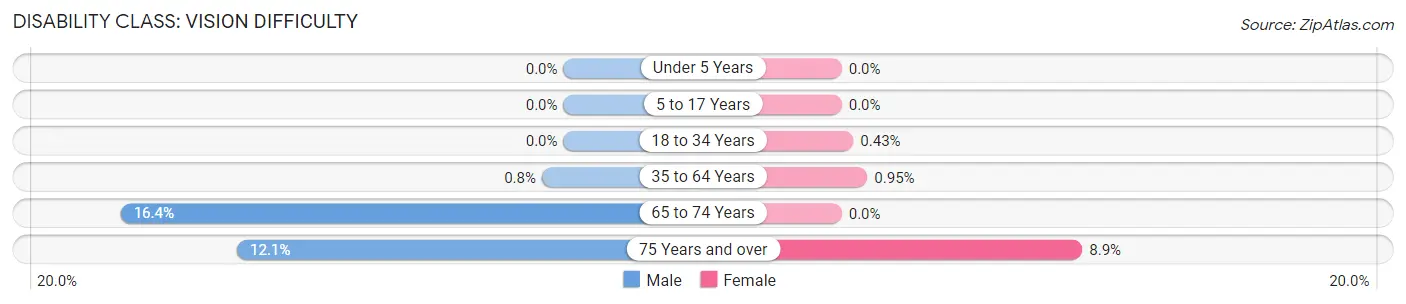
| Age Bracket | Male | Female |
| Under 5 Years | 0 (0.0%) | 0 (0.0%) |
| 5 to 17 Years | 0 (0.0%) | 0 (0.0%) |
| 18 to 34 Years | 0 (0.0%) | 5 (0.4%) |
| 35 to 64 Years | 16 (0.8%) | 25 (0.9%) |
| 65 to 74 Years | 59 (16.4%) | 0 (0.0%) |
| 75 Years and over | 27 (12.1%) | 26 (8.9%) |
Disability Class: Cognitive Difficulty
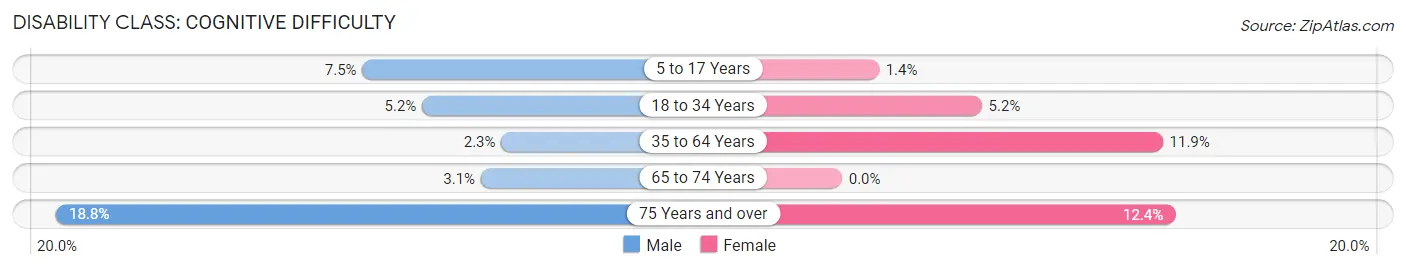
| Age Bracket | Male | Female |
| 5 to 17 Years | 97 (7.5%) | 11 (1.4%) |
| 18 to 34 Years | 84 (5.2%) | 61 (5.2%) |
| 35 to 64 Years | 46 (2.3%) | 314 (11.9%) |
| 65 to 74 Years | 11 (3.1%) | 0 (0.0%) |
| 75 Years and over | 42 (18.8%) | 36 (12.4%) |
Disability Class: Ambulatory Difficulty
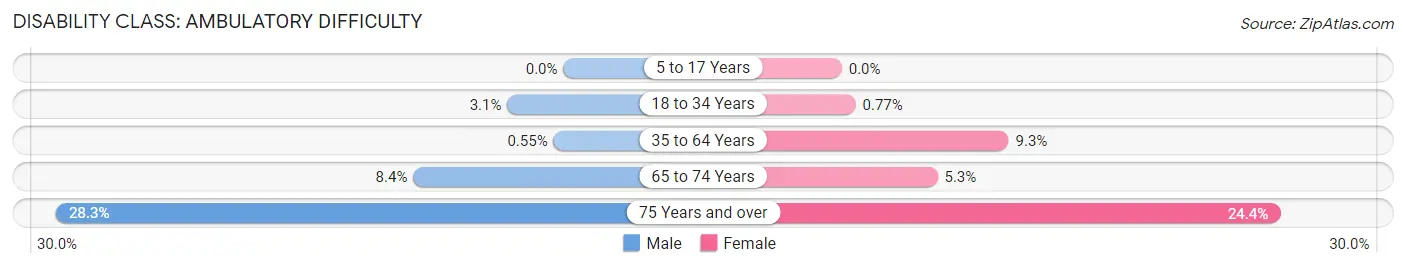
| Age Bracket | Male | Female |
| 5 to 17 Years | 0 (0.0%) | 0 (0.0%) |
| 18 to 34 Years | 50 (3.1%) | 9 (0.8%) |
| 35 to 64 Years | 11 (0.5%) | 245 (9.3%) |
| 65 to 74 Years | 30 (8.4%) | 22 (5.3%) |
| 75 Years and over | 63 (28.2%) | 71 (24.4%) |
Disability Class: Self-Care Difficulty
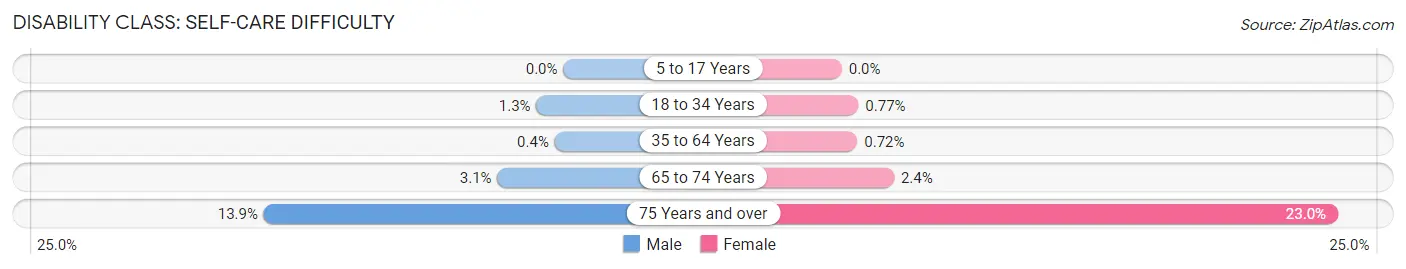
| Age Bracket | Male | Female |
| 5 to 17 Years | 0 (0.0%) | 0 (0.0%) |
| 18 to 34 Years | 20 (1.3%) | 9 (0.8%) |
| 35 to 64 Years | 8 (0.4%) | 19 (0.7%) |
| 65 to 74 Years | 11 (3.1%) | 10 (2.4%) |
| 75 Years and over | 31 (13.9%) | 67 (23.0%) |
Technology Access in Woodbury
Computing Device Access in Woodbury
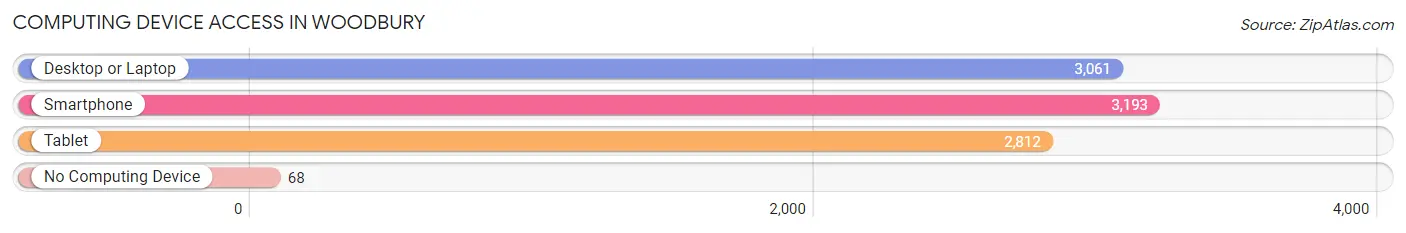
| Device Type | # Households | % Households |
| Desktop or Laptop | 3,061 | 87.0% |
| Smartphone | 3,193 | 90.8% |
| Tablet | 2,812 | 79.9% |
| No Computing Device | 68 | 1.9% |
| Total | 3,517 | 100.0% |
Internet Access in Woodbury
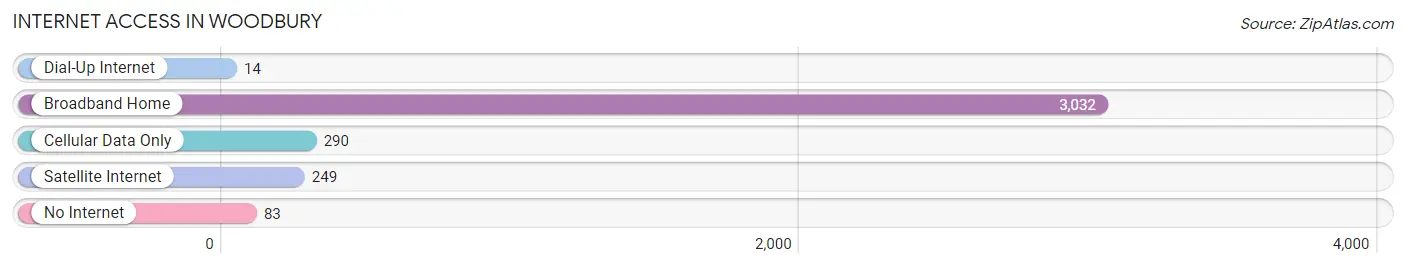
| Internet Type | # Households | % Households |
| Dial-Up Internet | 14 | 0.4% |
| Broadband Home | 3,032 | 86.2% |
| Cellular Data Only | 290 | 8.3% |
| Satellite Internet | 249 | 7.1% |
| No Internet | 83 | 2.4% |
| Total | 3,517 | 100.0% |
Woodbury Summary
Woodbury, NY is a hamlet located in the Town of Oyster Bay in Nassau County, New York. It is located on the north shore of Long Island, approximately 25 miles east of Manhattan. The hamlet is home to approximately 10,000 people and is part of the larger Greater New York City metropolitan area.
History
Woodbury was first settled in 1658 by English settlers from Connecticut. The hamlet was originally known as Woodbury Neck and was part of the Town of Oyster Bay. The hamlet was officially incorporated in 1882 and was named after the Woodbury family, who were prominent landowners in the area.
In the late 19th century, Woodbury was a popular summer resort destination for wealthy New Yorkers. The hamlet was home to several large estates, including the Woodbury Estate, which was owned by the prominent Woodbury family. The estate was later sold to the Sisters of St. Dominic, who established a convent and school on the property.
In the early 20th century, Woodbury began to develop into a residential community. The hamlet was home to several large estates, including the Woodbury Estate, which was owned by the prominent Woodbury family. The estate was later sold to the Sisters of St. Dominic, who established a convent and school on the property.
Geography
Woodbury is located on the north shore of Long Island, approximately 25 miles east of Manhattan. The hamlet is bordered by the Town of Oyster Bay to the west, the Town of Huntington to the east, and the Town of Smithtown to the south. The hamlet is located on the Oyster Bay-Cold Spring Harbor watershed, which is part of the Long Island Sound watershed.
The hamlet is home to several parks, including the Woodbury Park, which is located on the former Woodbury Estate. The park features a playground, picnic area, and walking trails. The hamlet is also home to the Woodbury Country Club, which is a private golf course.
Economy
Woodbury is home to several businesses, including retail stores, restaurants, and professional services. The hamlet is also home to several corporate offices, including the headquarters of the Long Island Power Authority.
The hamlet is home to several large employers, including the North Shore-LIJ Health System, which is the largest employer in the hamlet. The health system operates several hospitals and medical centers in the area. The hamlet is also home to the Woodbury Common Premium Outlets, which is a large shopping center.
Demographics
As of the 2010 census, the population of Woodbury was 10,686. The population is predominantly white (90.2%), with a small percentage of African Americans (2.3%), Asians (3.2%), and Hispanics (4.3%). The median household income in the hamlet is $107,813, which is significantly higher than the national median of $53,482.
The hamlet is home to several religious institutions, including the Woodbury Jewish Center, which is an Orthodox synagogue. The hamlet is also home to several Catholic churches, including St. Patrick's Church and St. Dominic's Church.
Conclusion
Woodbury, NY is a hamlet located in the Town of Oyster Bay in Nassau County, New York. It is located on the north shore of Long Island, approximately 25 miles east of Manhattan. The hamlet is home to approximately 10,000 people and is part of the larger Greater New York City metropolitan area. Woodbury was first settled in 1658 by English settlers from Connecticut and was officially incorporated in 1882. The hamlet is home to several businesses, including retail stores, restaurants, and professional services. The population of Woodbury is predominantly white (90.2%), with a small percentage of African Americans (2.3%), Asians (3.2%), and Hispanics (4.3%). The median household income in the hamlet is $107,813, which is significantly higher than the national median of $53,482. Woodbury is home to several parks, corporate offices, and religious institutions.
Common Questions
What is Per Capita Income in Woodbury?
Per Capita income in Woodbury is $47,790.
What is the Median Family Income in Woodbury?
Median Family Income in Woodbury is $154,737.
What is the Median Household income in Woodbury?
Median Household Income in Woodbury is $141,632.
What is Income or Wage Gap in Woodbury?
Income or Wage Gap in Woodbury is 30.9%.
Women in Woodbury earn 69.1 cents for every dollar earned by a man.
What is Inequality or Gini Index in Woodbury?
Inequality or Gini Index in Woodbury is 0.37.
What is the Total Population of Woodbury?
Total Population of Woodbury is 11,371.
What is the Total Male Population of Woodbury?
Total Male Population of Woodbury is 5,699.
What is the Total Female Population of Woodbury?
Total Female Population of Woodbury is 5,672.
What is the Ratio of Males per 100 Females in Woodbury?
There are 100.48 Males per 100 Females in Woodbury.
What is the Ratio of Females per 100 Males in Woodbury?
There are 99.53 Females per 100 Males in Woodbury.
What is the Median Population Age in Woodbury?
Median Population Age in Woodbury is 38.0 Years.
What is the Average Family Size in Woodbury
Average Family Size in Woodbury is 3.7 People.
What is the Average Household Size in Woodbury
Average Household Size in Woodbury is 3.2 People.
How Large is the Labor Force in Woodbury?
There are 5,927 People in the Labor Forcein in Woodbury.
What is the Percentage of People in the Labor Force in Woodbury?
66.1% of People are in the Labor Force in Woodbury.
What is the Unemployment Rate in Woodbury?
Unemployment Rate in Woodbury is 6.5%.