Draper, UT Map & Demographics
Draper Map
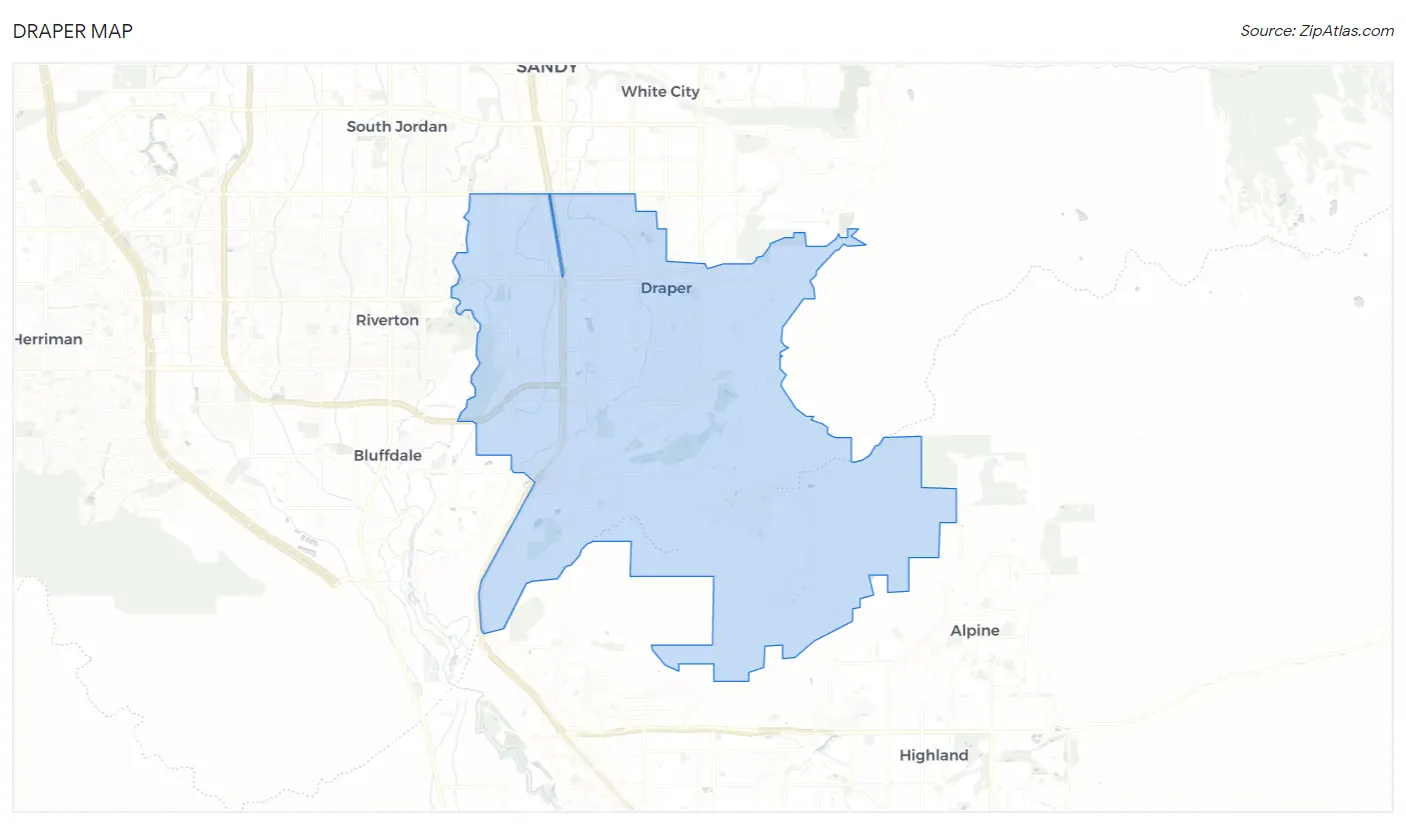
Draper Overview
$52,914
PER CAPITA INCOME
$137,558
AVG FAMILY INCOME
$126,041
AVG HOUSEHOLD INCOME
48.9%
WAGE / INCOME GAP [ % ]
51.1¢/ $1
WAGE / INCOME GAP [ $ ]
$12,270
FAMILY INCOME DEFICIT
0.43
INEQUALITY / GINI INDEX
50,635
TOTAL POPULATION
26,525
MALE POPULATION
24,110
FEMALE POPULATION
110.02
MALES / 100 FEMALES
90.90
FEMALES / 100 MALES
33.6
MEDIAN AGE
3.5
AVG FAMILY SIZE
3.0
AVG HOUSEHOLD SIZE
24,961
LABOR FORCE [ PEOPLE ]
66.8%
PERCENT IN LABOR FORCE
2.2%
UNEMPLOYMENT RATE
Draper Zip Codes
Draper Area Codes
Income in Draper
Income Overview in Draper
Per Capita Income in Draper is $52,914, while median incomes of families and households are $137,558 and $126,041 respectively.
| Characteristic | Number | Measure |
| Per Capita Income | 50,635 | $52,914 |
| Median Family Income | 12,221 | $137,558 |
| Mean Family Income | 12,221 | $183,147 |
| Median Household Income | 15,861 | $126,041 |
| Mean Household Income | 15,861 | $164,948 |
| Income Deficit | 12,221 | $12,270 |
| Wage / Income Gap (%) | 50,635 | 48.94% |
| Wage / Income Gap ($) | 50,635 | 51.06¢ per $1 |
| Gini / Inequality Index | 50,635 | 0.43 |
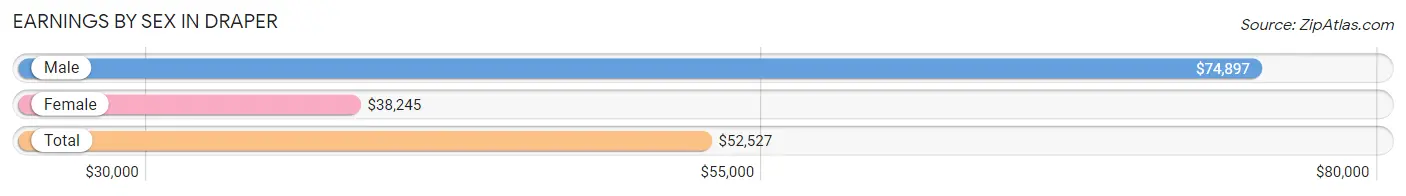
Earnings by Sex in Draper
Average Earnings in Draper are $52,527, $74,897 for men and $38,245 for women, a difference of 48.9%.
| Sex | Number | Average Earnings |
| Male | 15,338 (56.8%) | $74,897 |
| Female | 11,684 (43.2%) | $38,245 |
| Total | 27,022 (100.0%) | $52,527 |
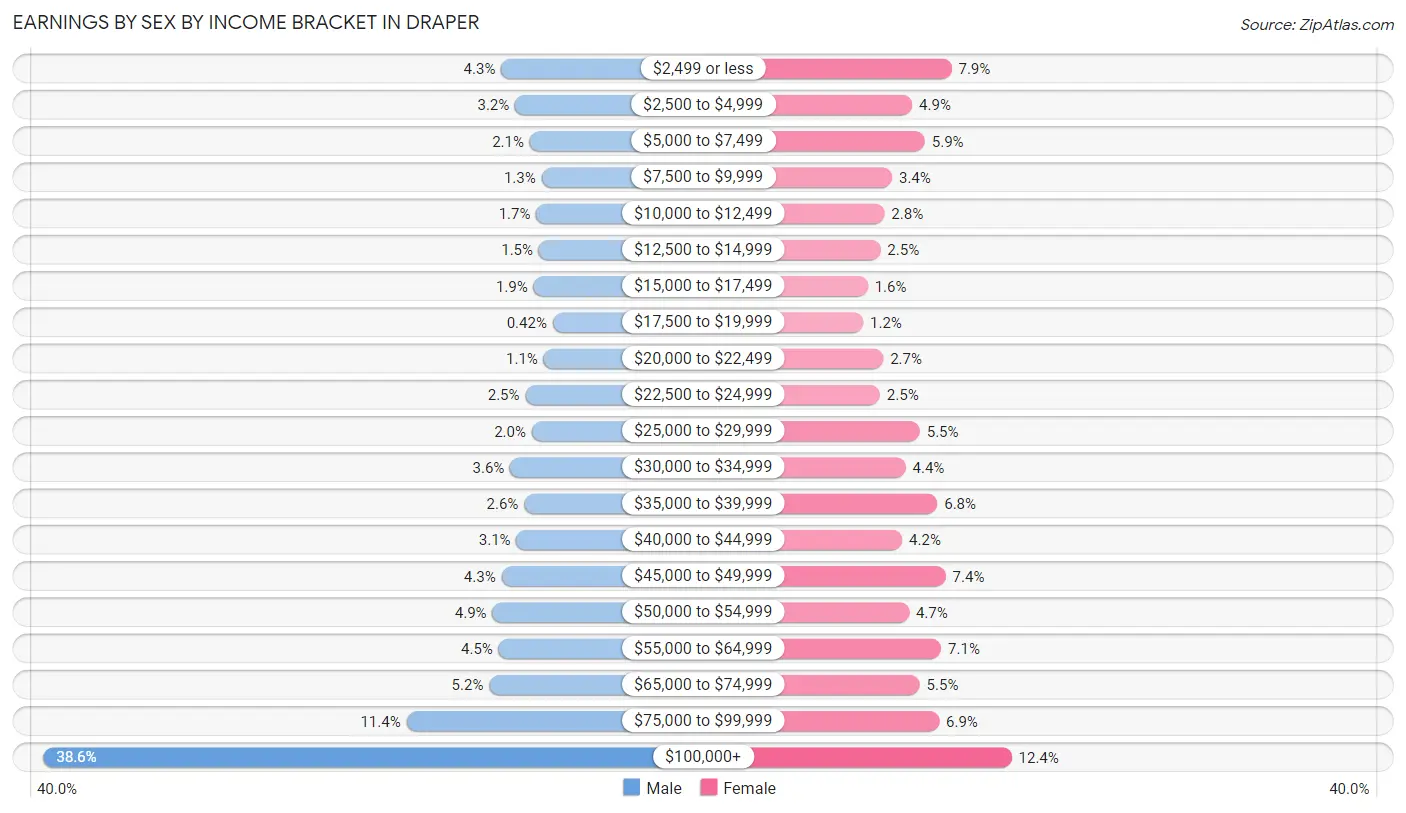
Earnings by Sex by Income Bracket in Draper
The most common earnings brackets in Draper are $100,000+ for men (5,919 | 38.6%) and $100,000+ for women (1,443 | 12.3%).
| Income | Male | Female |
| $2,499 or less | 657 (4.3%) | 917 (7.9%) |
| $2,500 to $4,999 | 497 (3.2%) | 572 (4.9%) |
| $5,000 to $7,499 | 329 (2.1%) | 683 (5.9%) |
| $7,500 to $9,999 | 194 (1.3%) | 396 (3.4%) |
| $10,000 to $12,499 | 253 (1.7%) | 329 (2.8%) |
| $12,500 to $14,999 | 224 (1.5%) | 295 (2.5%) |
| $15,000 to $17,499 | 285 (1.9%) | 184 (1.6%) |
| $17,500 to $19,999 | 64 (0.4%) | 142 (1.2%) |
| $20,000 to $22,499 | 169 (1.1%) | 319 (2.7%) |
| $22,500 to $24,999 | 379 (2.5%) | 290 (2.5%) |
| $25,000 to $29,999 | 305 (2.0%) | 639 (5.5%) |
| $30,000 to $34,999 | 553 (3.6%) | 515 (4.4%) |
| $35,000 to $39,999 | 393 (2.6%) | 792 (6.8%) |
| $40,000 to $44,999 | 482 (3.1%) | 485 (4.2%) |
| $45,000 to $49,999 | 653 (4.3%) | 866 (7.4%) |
| $50,000 to $54,999 | 757 (4.9%) | 545 (4.7%) |
| $55,000 to $64,999 | 685 (4.5%) | 826 (7.1%) |
| $65,000 to $74,999 | 794 (5.2%) | 638 (5.5%) |
| $75,000 to $99,999 | 1,746 (11.4%) | 808 (6.9%) |
| $100,000+ | 5,919 (38.6%) | 1,443 (12.3%) |
| Total | 15,338 (100.0%) | 11,684 (100.0%) |
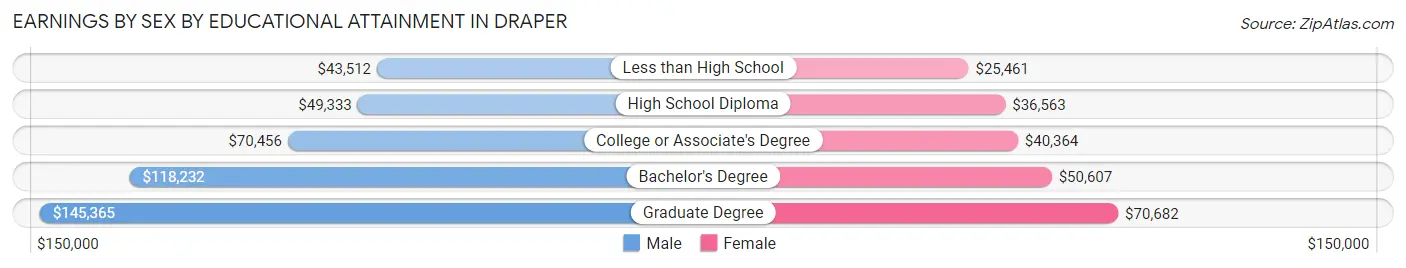
Earnings by Sex by Educational Attainment in Draper
Average earnings in Draper are $89,135 for men and $45,890 for women, a difference of 48.5%. Men with an educational attainment of graduate degree enjoy the highest average annual earnings of $145,365, while those with less than high school education earn the least with $43,512. Women with an educational attainment of graduate degree earn the most with the average annual earnings of $70,682, while those with less than high school education have the smallest earnings of $25,461.
| Educational Attainment | Male Income | Female Income |
| Less than High School | $43,512 | $25,461 |
| High School Diploma | $49,333 | $36,563 |
| College or Associate's Degree | $70,456 | $40,364 |
| Bachelor's Degree | $118,232 | $50,607 |
| Graduate Degree | $145,365 | $70,682 |
| Total | $89,135 | $45,890 |
Family Income in Draper
Family Income Brackets in Draper
According to the Draper family income data, there are 3,996 families falling into the $200,000+ income range, which is the most common income bracket and makes up 32.7% of all families. Conversely, the $10,000 to $14,999 income bracket is the least frequent group with only 110 families (0.9%) belonging to this category.
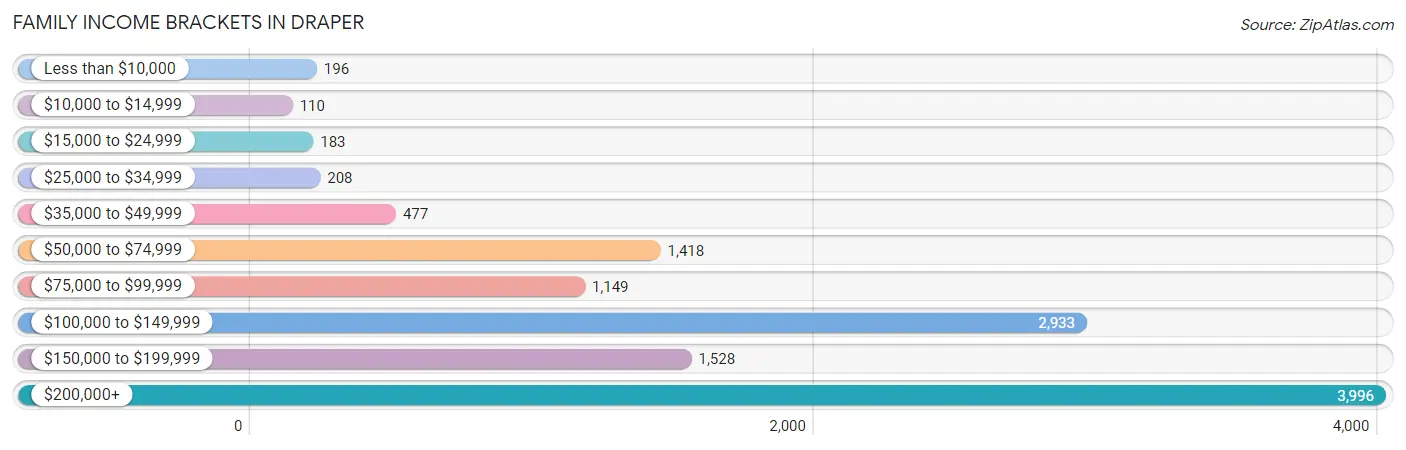
| Income Bracket | # Families | % Families |
| Less than $10,000 | 196 | 1.6% |
| $10,000 to $14,999 | 110 | 0.9% |
| $15,000 to $24,999 | 183 | 1.5% |
| $25,000 to $34,999 | 208 | 1.7% |
| $35,000 to $49,999 | 477 | 3.9% |
| $50,000 to $74,999 | 1,418 | 11.6% |
| $75,000 to $99,999 | 1,149 | 9.4% |
| $100,000 to $149,999 | 2,933 | 24.0% |
| $150,000 to $199,999 | 1,528 | 12.5% |
| $200,000+ | 3,996 | 32.7% |
Family Income by Famaliy Size in Draper
6-person families (950 | 7.8%) account for the highest median family income in Draper with $200,455 per family, while 2-person families (4,557 | 37.3%) have the highest median income of $56,665 per family member.
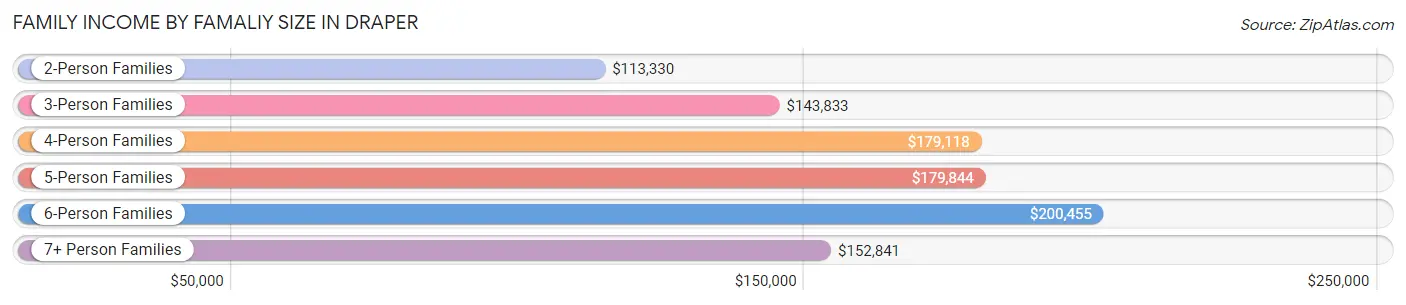
| Income Bracket | # Families | Median Income |
| 2-Person Families | 4,557 (37.3%) | $113,330 |
| 3-Person Families | 2,434 (19.9%) | $143,833 |
| 4-Person Families | 2,200 (18.0%) | $179,118 |
| 5-Person Families | 1,665 (13.6%) | $179,844 |
| 6-Person Families | 950 (7.8%) | $200,455 |
| 7+ Person Families | 415 (3.4%) | $152,841 |
| Total | 12,221 (100.0%) | $137,558 |
Family Income by Number of Earners in Draper
The median family income in Draper is $137,558, with families comprising 3+ earners (2,249) having the highest median family income of $213,024, while families with no earners (932) have the lowest median family income of $69,329, accounting for 18.4% and 7.6% of families, respectively.
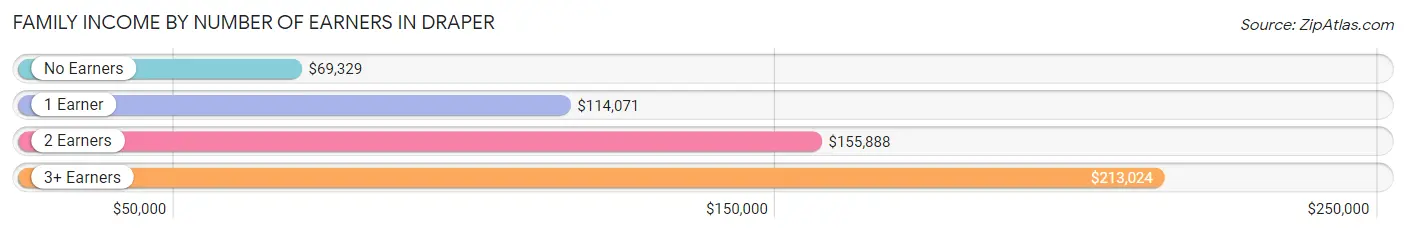
| Number of Earners | # Families | Median Income |
| No Earners | 932 (7.6%) | $69,329 |
| 1 Earner | 3,801 (31.1%) | $114,071 |
| 2 Earners | 5,239 (42.9%) | $155,888 |
| 3+ Earners | 2,249 (18.4%) | $213,024 |
| Total | 12,221 (100.0%) | $137,558 |
Household Income in Draper
Household Income Brackets in Draper
With 4,282 households falling in the category, the $200,000+ income range is the most frequent in Draper, accounting for 27.0% of all households. In contrast, only 174 households (1.1%) fall into the $10,000 to $14,999 income bracket, making it the least populous group.
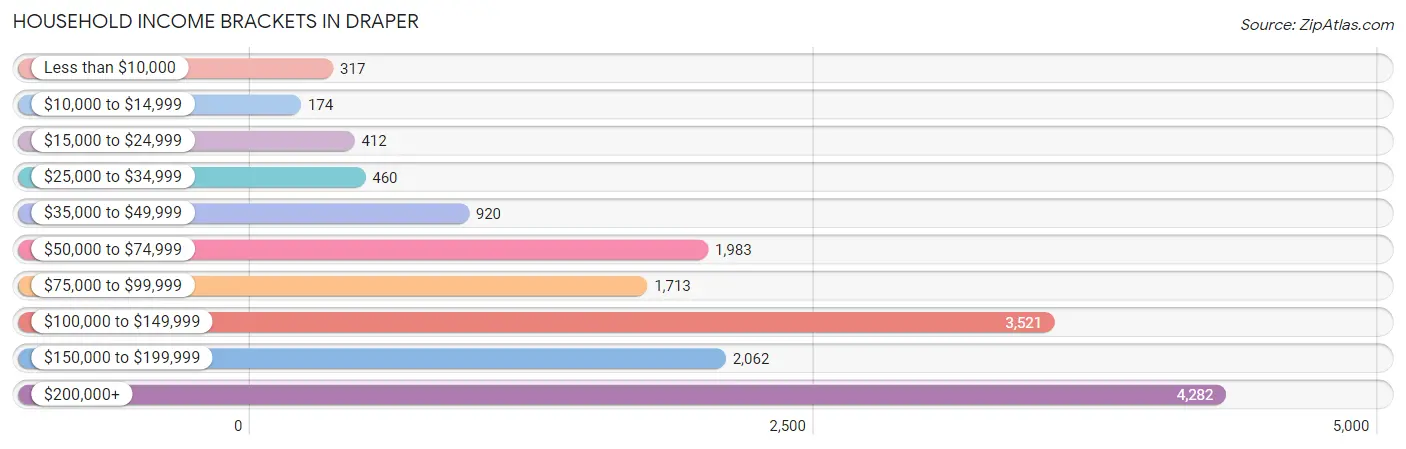
| Income Bracket | # Households | % Households |
| Less than $10,000 | 317 | 2.0% |
| $10,000 to $14,999 | 174 | 1.1% |
| $15,000 to $24,999 | 412 | 2.6% |
| $25,000 to $34,999 | 460 | 2.9% |
| $35,000 to $49,999 | 920 | 5.8% |
| $50,000 to $74,999 | 1,983 | 12.5% |
| $75,000 to $99,999 | 1,713 | 10.8% |
| $100,000 to $149,999 | 3,521 | 22.2% |
| $150,000 to $199,999 | 2,062 | 13.0% |
| $200,000+ | 4,282 | 27.0% |
Household Income by Householder Age in Draper
The median household income in Draper is $126,041, with the highest median household income of $164,907 found in the 45 to 64 years age bracket for the primary householder. A total of 6,242 households (39.4%) fall into this category. Meanwhile, the 65+ years age bracket for the primary householder has the lowest median household income of $78,597, with 2,589 households (16.3%) in this group.
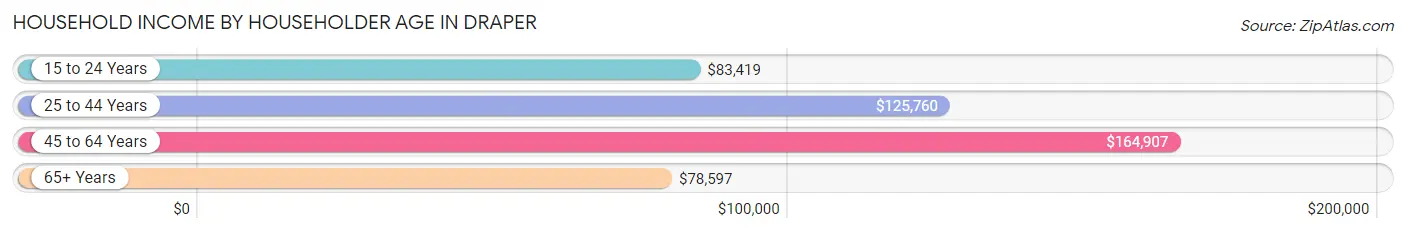
| Income Bracket | # Households | Median Income |
| 15 to 24 Years | 587 (3.7%) | $83,419 |
| 25 to 44 Years | 6,443 (40.6%) | $125,760 |
| 45 to 64 Years | 6,242 (39.4%) | $164,907 |
| 65+ Years | 2,589 (16.3%) | $78,597 |
| Total | 15,861 (100.0%) | $126,041 |
Poverty in Draper
Income Below Poverty by Sex and Age in Draper
With 4.0% poverty level for males and 4.2% for females among the residents of Draper, 55 to 64 year old males and 18 to 24 year old females are the most vulnerable to poverty, with 292 males (11.7%) and 197 females (10.1%) in their respective age groups living below the poverty level.
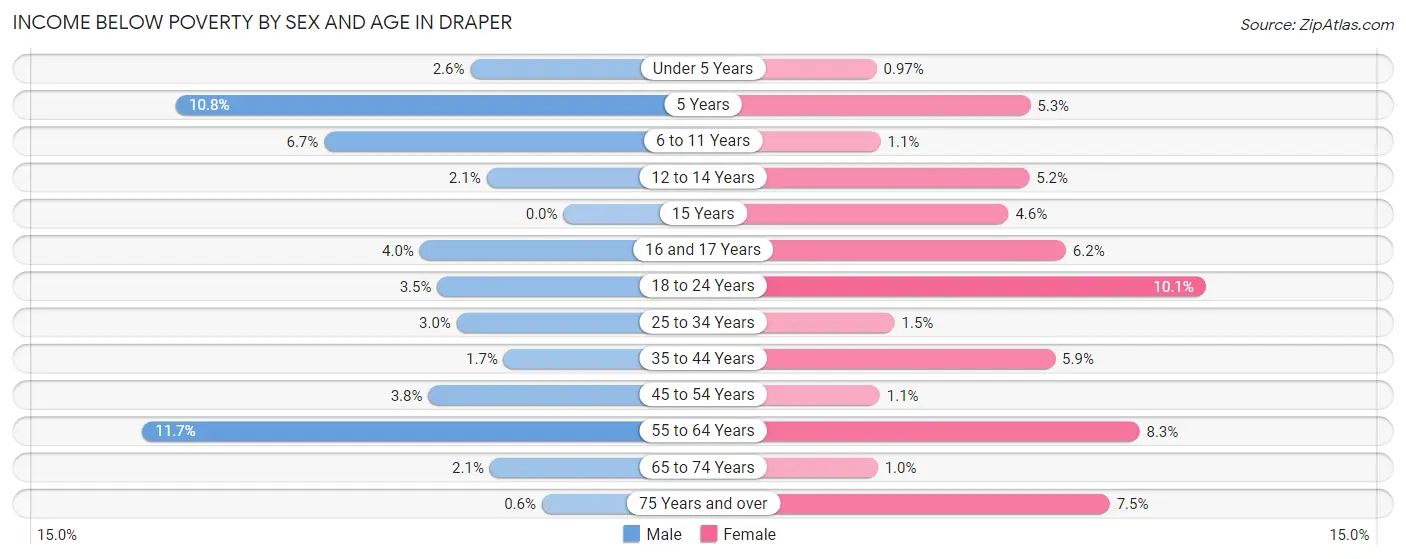
| Age Bracket | Male | Female |
| Under 5 Years | 49 (2.6%) | 15 (1.0%) |
| 5 Years | 11 (10.8%) | 23 (5.2%) |
| 6 to 11 Years | 188 (6.7%) | 26 (1.1%) |
| 12 to 14 Years | 28 (2.1%) | 66 (5.2%) |
| 15 Years | 0 (0.0%) | 26 (4.6%) |
| 16 and 17 Years | 43 (4.0%) | 56 (6.2%) |
| 18 to 24 Years | 69 (3.5%) | 197 (10.1%) |
| 25 to 34 Years | 94 (3.0%) | 45 (1.5%) |
| 35 to 44 Years | 59 (1.7%) | 243 (5.9%) |
| 45 to 54 Years | 127 (3.8%) | 32 (1.1%) |
| 55 to 64 Years | 292 (11.7%) | 188 (8.3%) |
| 65 to 74 Years | 26 (2.1%) | 16 (1.0%) |
| 75 Years and over | 4 (0.6%) | 63 (7.5%) |
| Total | 990 (4.0%) | 996 (4.2%) |
Income Above Poverty by Sex and Age in Draper
According to the poverty statistics in Draper, males aged 15 years and females aged under 5 years are the age groups that are most secure financially, with 100.0% of males and 99.0% of females in these age groups living above the poverty line.
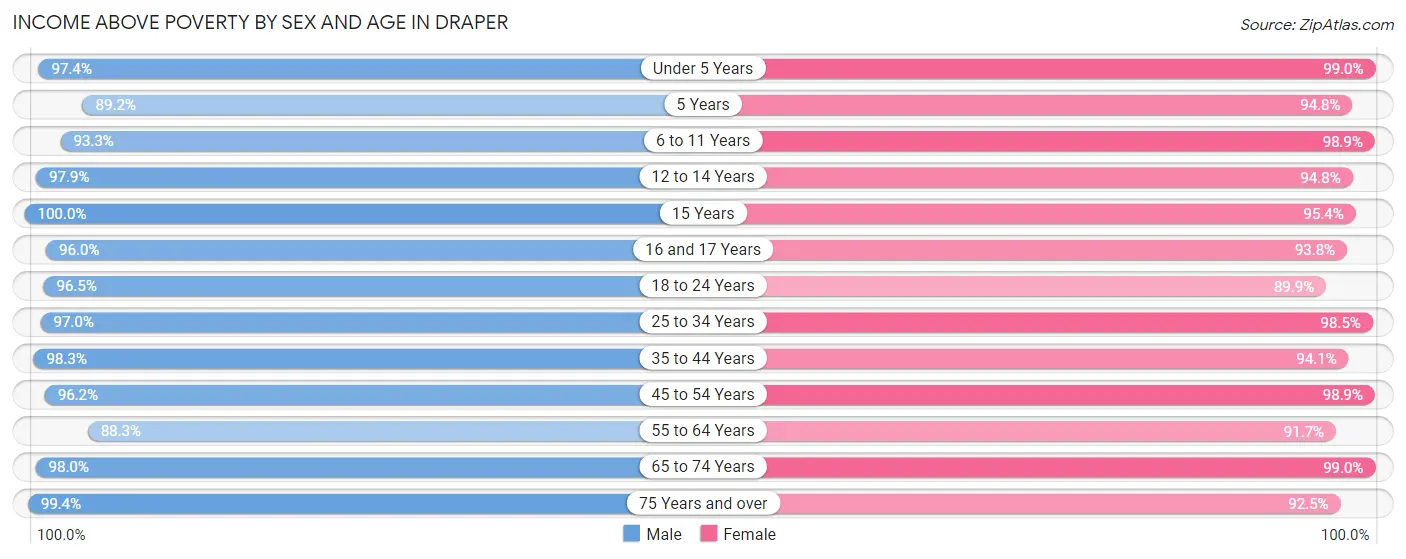
| Age Bracket | Male | Female |
| Under 5 Years | 1,846 (97.4%) | 1,524 (99.0%) |
| 5 Years | 91 (89.2%) | 415 (94.8%) |
| 6 to 11 Years | 2,636 (93.3%) | 2,372 (98.9%) |
| 12 to 14 Years | 1,283 (97.9%) | 1,198 (94.8%) |
| 15 Years | 867 (100.0%) | 534 (95.4%) |
| 16 and 17 Years | 1,032 (96.0%) | 841 (93.8%) |
| 18 to 24 Years | 1,898 (96.5%) | 1,747 (89.9%) |
| 25 to 34 Years | 3,067 (97.0%) | 3,014 (98.5%) |
| 35 to 44 Years | 3,495 (98.3%) | 3,846 (94.1%) |
| 45 to 54 Years | 3,248 (96.2%) | 2,996 (98.9%) |
| 55 to 64 Years | 2,199 (88.3%) | 2,079 (91.7%) |
| 65 to 74 Years | 1,242 (98.0%) | 1,584 (99.0%) |
| 75 Years and over | 666 (99.4%) | 782 (92.5%) |
| Total | 23,570 (96.0%) | 22,932 (95.8%) |
Income Below Poverty Among Married-Couple Families in Draper
The poverty statistics for married-couple families in Draper show that 3.5% or 365 of the total 10,489 families live below the poverty line. Families with 1 or 2 children have the highest poverty rate of 5.0%, comprising of 169 families. On the other hand, families with 3 or 4 children have the lowest poverty rate of 0.0%, which includes 0 families.
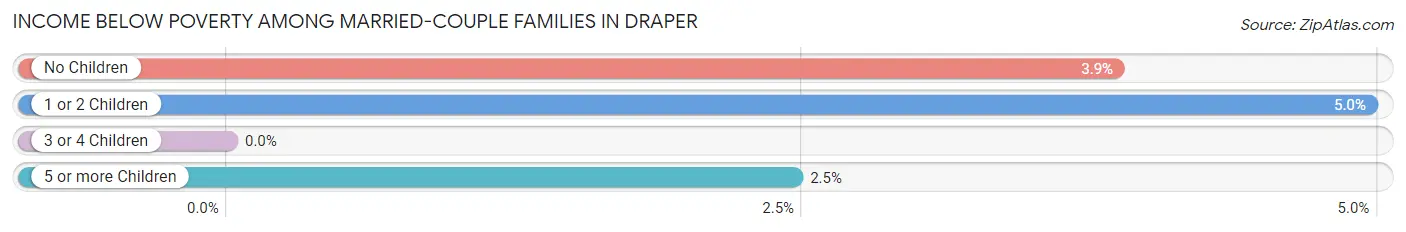
| Children | Above Poverty | Below Poverty |
| No Children | 4,703 (96.1%) | 189 (3.9%) |
| 1 or 2 Children | 3,240 (95.0%) | 169 (5.0%) |
| 3 or 4 Children | 1,904 (100.0%) | 0 (0.0%) |
| 5 or more Children | 277 (97.5%) | 7 (2.5%) |
| Total | 10,124 (96.5%) | 365 (3.5%) |
Income Below Poverty Among Single-Parent Households in Draper
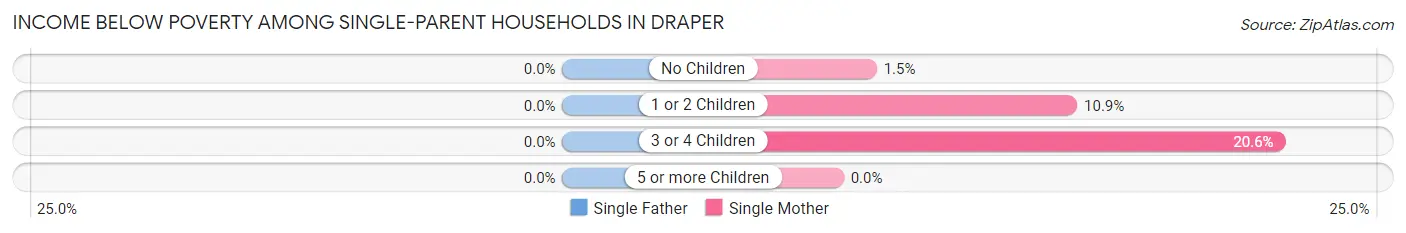
| Children | Single Father | Single Mother |
| No Children | 0 (0.0%) | 9 (1.5%) |
| 1 or 2 Children | 0 (0.0%) | 59 (10.9%) |
| 3 or 4 Children | 0 (0.0%) | 29 (20.6%) |
| 5 or more Children | 0 (0.0%) | 0 (0.0%) |
| Total | 0 (0.0%) | 97 (7.7%) |
Income Below Poverty Among Married-Couple vs Single-Parent Households in Draper
The poverty data for Draper shows that 365 of the married-couple family households (3.5%) and 97 of the single-parent households (5.6%) are living below the poverty level. Within the married-couple family households, those with 1 or 2 children have the highest poverty rate, with 169 households (5.0%) falling below the poverty line. Among the single-parent households, those with 3 or 4 children have the highest poverty rate, with 29 household (16.8%) living below poverty.
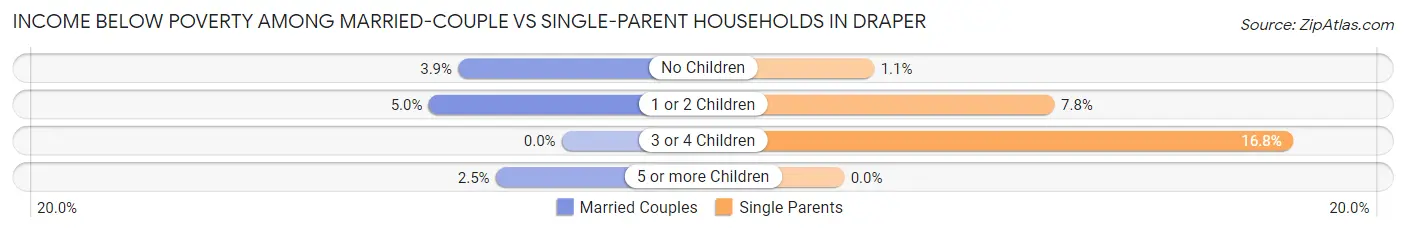
| Children | Married-Couple Families | Single-Parent Households |
| No Children | 189 (3.9%) | 9 (1.1%) |
| 1 or 2 Children | 169 (5.0%) | 59 (7.8%) |
| 3 or 4 Children | 0 (0.0%) | 29 (16.8%) |
| 5 or more Children | 7 (2.5%) | 0 (0.0%) |
| Total | 365 (3.5%) | 97 (5.6%) |
Race in Draper
The most populous races in Draper are White / Caucasian (42,712 | 84.4%), Hispanic or Latino (3,630 | 7.2%), and Two or more Races (2,888 | 5.7%).
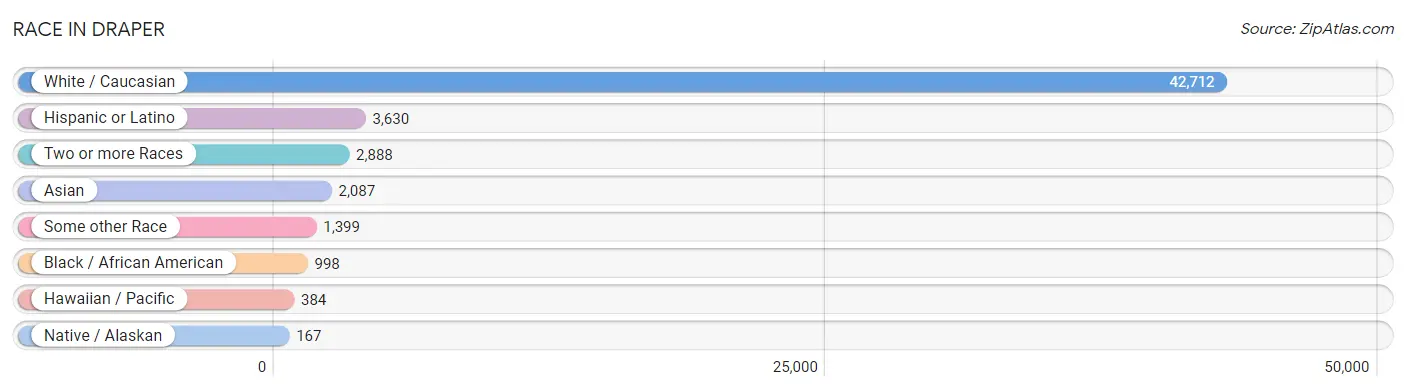
| Race | # Population | % Population |
| Asian | 2,087 | 4.1% |
| Black / African American | 998 | 2.0% |
| Hawaiian / Pacific | 384 | 0.8% |
| Hispanic or Latino | 3,630 | 7.2% |
| Native / Alaskan | 167 | 0.3% |
| White / Caucasian | 42,712 | 84.4% |
| Two or more Races | 2,888 | 5.7% |
| Some other Race | 1,399 | 2.8% |
| Total | 50,635 | 100.0% |
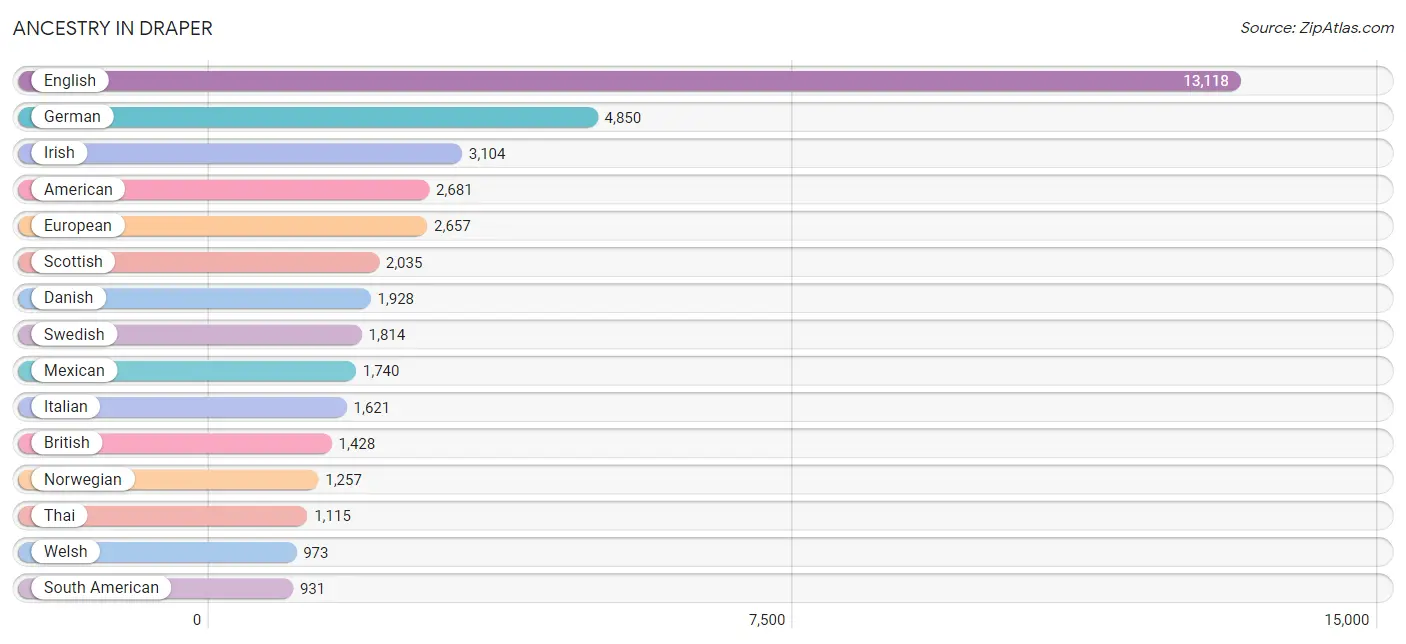
Ancestry in Draper
The most populous ancestries reported in Draper are English (13,118 | 25.9%), German (4,850 | 9.6%), Irish (3,104 | 6.1%), American (2,681 | 5.3%), and European (2,657 | 5.2%), together accounting for 52.2% of all Draper residents.
| Ancestry | # Population | % Population |
| African | 8 | 0.0% |
| American | 2,681 | 5.3% |
| Apache | 44 | 0.1% |
| Arab | 140 | 0.3% |
| Argentinean | 352 | 0.7% |
| Armenian | 41 | 0.1% |
| Australian | 58 | 0.1% |
| Austrian | 44 | 0.1% |
| Bangladeshi | 214 | 0.4% |
| Basque | 75 | 0.2% |
| Belgian | 18 | 0.0% |
| Bhutanese | 136 | 0.3% |
| Blackfeet | 44 | 0.1% |
| Bolivian | 70 | 0.1% |
| Brazilian | 406 | 0.8% |
| British | 1,428 | 2.8% |
| Bulgarian | 36 | 0.1% |
| Burmese | 311 | 0.6% |
| Cambodian | 57 | 0.1% |
| Canadian | 82 | 0.2% |
| Cape Verdean | 68 | 0.1% |
| Central American | 108 | 0.2% |
| Central American Indian | 54 | 0.1% |
| Cherokee | 49 | 0.1% |
| Chickasaw | 38 | 0.1% |
| Chilean | 46 | 0.1% |
| Colombian | 90 | 0.2% |
| Croatian | 130 | 0.3% |
| Cuban | 140 | 0.3% |
| Czech | 14 | 0.0% |
| Danish | 1,928 | 3.8% |
| Dutch | 748 | 1.5% |
| Eastern European | 44 | 0.1% |
| Egyptian | 55 | 0.1% |
| English | 13,118 | 25.9% |
| European | 2,657 | 5.2% |
| Filipino | 46 | 0.1% |
| Finnish | 190 | 0.4% |
| French | 733 | 1.5% |
| French Canadian | 27 | 0.1% |
| German | 4,850 | 9.6% |
| Greek | 202 | 0.4% |
| Guamanian / Chamorro | 119 | 0.2% |
| Guatemalan | 32 | 0.1% |
| Guyanese | 22 | 0.0% |
| Haitian | 19 | 0.0% |
| Honduran | 30 | 0.1% |
| Hopi | 18 | 0.0% |
| Hungarian | 284 | 0.6% |
| Icelander | 26 | 0.1% |
| Indian (Asian) | 451 | 0.9% |
| Iranian | 101 | 0.2% |
| Iraqi | 11 | 0.0% |
| Irish | 3,104 | 6.1% |
| Italian | 1,621 | 3.2% |
| Japanese | 19 | 0.0% |
| Korean | 380 | 0.7% |
| Lebanese | 13 | 0.0% |
| Liberian | 30 | 0.1% |
| Lithuanian | 54 | 0.1% |
| Malaysian | 54 | 0.1% |
| Marshallese | 41 | 0.1% |
| Mexican | 1,740 | 3.4% |
| Mexican American Indian | 17 | 0.0% |
| Native Hawaiian | 124 | 0.2% |
| Navajo | 35 | 0.1% |
| Nicaraguan | 46 | 0.1% |
| Northern European | 110 | 0.2% |
| Norwegian | 1,257 | 2.5% |
| Palestinian | 61 | 0.1% |
| Peruvian | 204 | 0.4% |
| Polish | 620 | 1.2% |
| Portuguese | 162 | 0.3% |
| Puerto Rican | 234 | 0.5% |
| Romanian | 125 | 0.3% |
| Russian | 172 | 0.3% |
| Samoan | 213 | 0.4% |
| Scandinavian | 703 | 1.4% |
| Scotch-Irish | 213 | 0.4% |
| Scottish | 2,035 | 4.0% |
| Sioux | 39 | 0.1% |
| Slavic | 13 | 0.0% |
| Slovak | 73 | 0.1% |
| Somali | 54 | 0.1% |
| South African | 10 | 0.0% |
| South American | 931 | 1.8% |
| Spaniard | 134 | 0.3% |
| Spanish | 197 | 0.4% |
| Sri Lankan | 104 | 0.2% |
| Subsaharan African | 745 | 1.5% |
| Sudanese | 558 | 1.1% |
| Swedish | 1,814 | 3.6% |
| Swiss | 230 | 0.4% |
| Thai | 1,115 | 2.2% |
| Tongan | 169 | 0.3% |
| Ukrainian | 188 | 0.4% |
| Ute | 18 | 0.0% |
| Venezuelan | 150 | 0.3% |
| Welsh | 973 | 1.9% |
| West Indian | 45 | 0.1% |
| Yugoslavian | 154 | 0.3% | View All 101 Rows |
Immigrants in Draper
The most numerous immigrant groups reported in Draper came from Latin America (1,540 | 3.0%), Asia (1,525 | 3.0%), Europe (1,093 | 2.2%), South America (944 | 1.9%), and South Central Asia (827 | 1.6%), together accounting for 11.7% of all Draper residents.
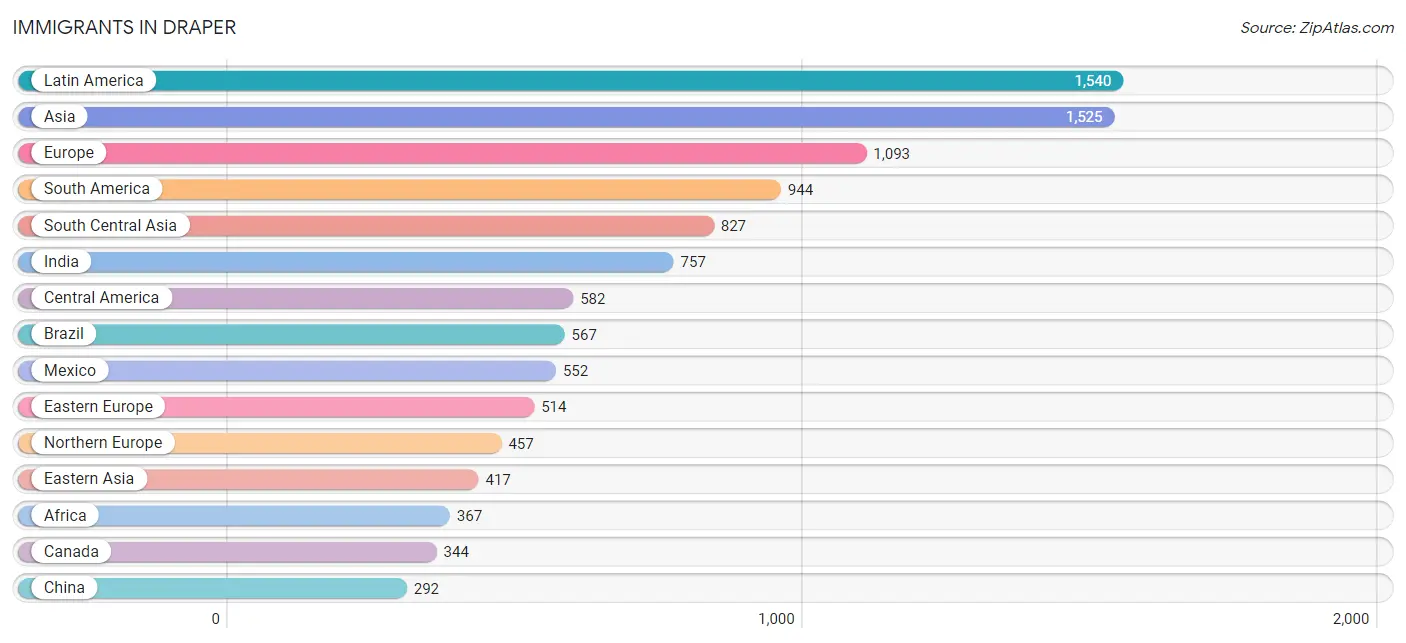
| Immigration Origin | # Population | % Population |
| Africa | 367 | 0.7% |
| Argentina | 84 | 0.2% |
| Asia | 1,525 | 3.0% |
| Australia | 43 | 0.1% |
| Belarus | 46 | 0.1% |
| Bosnia and Herzegovina | 112 | 0.2% |
| Brazil | 567 | 1.1% |
| Bulgaria | 36 | 0.1% |
| Canada | 344 | 0.7% |
| Caribbean | 14 | 0.0% |
| Central America | 582 | 1.1% |
| China | 292 | 0.6% |
| Colombia | 57 | 0.1% |
| Cuba | 9 | 0.0% |
| Denmark | 38 | 0.1% |
| Eastern Africa | 234 | 0.5% |
| Eastern Asia | 417 | 0.8% |
| Eastern Europe | 514 | 1.0% |
| Egypt | 73 | 0.1% |
| England | 192 | 0.4% |
| Europe | 1,093 | 2.2% |
| Germany | 92 | 0.2% |
| Greece | 9 | 0.0% |
| Guyana | 22 | 0.0% |
| Haiti | 5 | 0.0% |
| Honduras | 30 | 0.1% |
| Hong Kong | 21 | 0.0% |
| Hungary | 224 | 0.4% |
| India | 757 | 1.5% |
| Iran | 38 | 0.1% |
| Iraq | 11 | 0.0% |
| Italy | 12 | 0.0% |
| Japan | 72 | 0.1% |
| Korea | 38 | 0.1% |
| Laos | 92 | 0.2% |
| Latin America | 1,540 | 3.0% |
| Mexico | 552 | 1.1% |
| Nepal | 26 | 0.1% |
| Netherlands | 9 | 0.0% |
| Northern Africa | 73 | 0.1% |
| Northern Europe | 457 | 0.9% |
| Norway | 28 | 0.1% |
| Oceania | 212 | 0.4% |
| Pakistan | 6 | 0.0% |
| Peru | 76 | 0.2% |
| Philippines | 46 | 0.1% |
| Romania | 64 | 0.1% |
| Russia | 11 | 0.0% |
| Saudi Arabia | 13 | 0.0% |
| South Africa | 60 | 0.1% |
| South America | 944 | 1.9% |
| South Central Asia | 827 | 1.6% |
| South Eastern Asia | 234 | 0.5% |
| Southern Europe | 21 | 0.0% |
| Sweden | 136 | 0.3% |
| Syria | 23 | 0.1% |
| Taiwan | 33 | 0.1% |
| Ukraine | 21 | 0.0% |
| Venezuela | 138 | 0.3% |
| Vietnam | 96 | 0.2% |
| Western Asia | 47 | 0.1% |
| Western Europe | 101 | 0.2% | View All 62 Rows |
Sex and Age in Draper
Sex and Age in Draper
The most populous age groups in Draper are 15 to 19 Years (2,607 | 9.8%) for men and 40 to 44 Years (2,198 | 9.1%) for women.
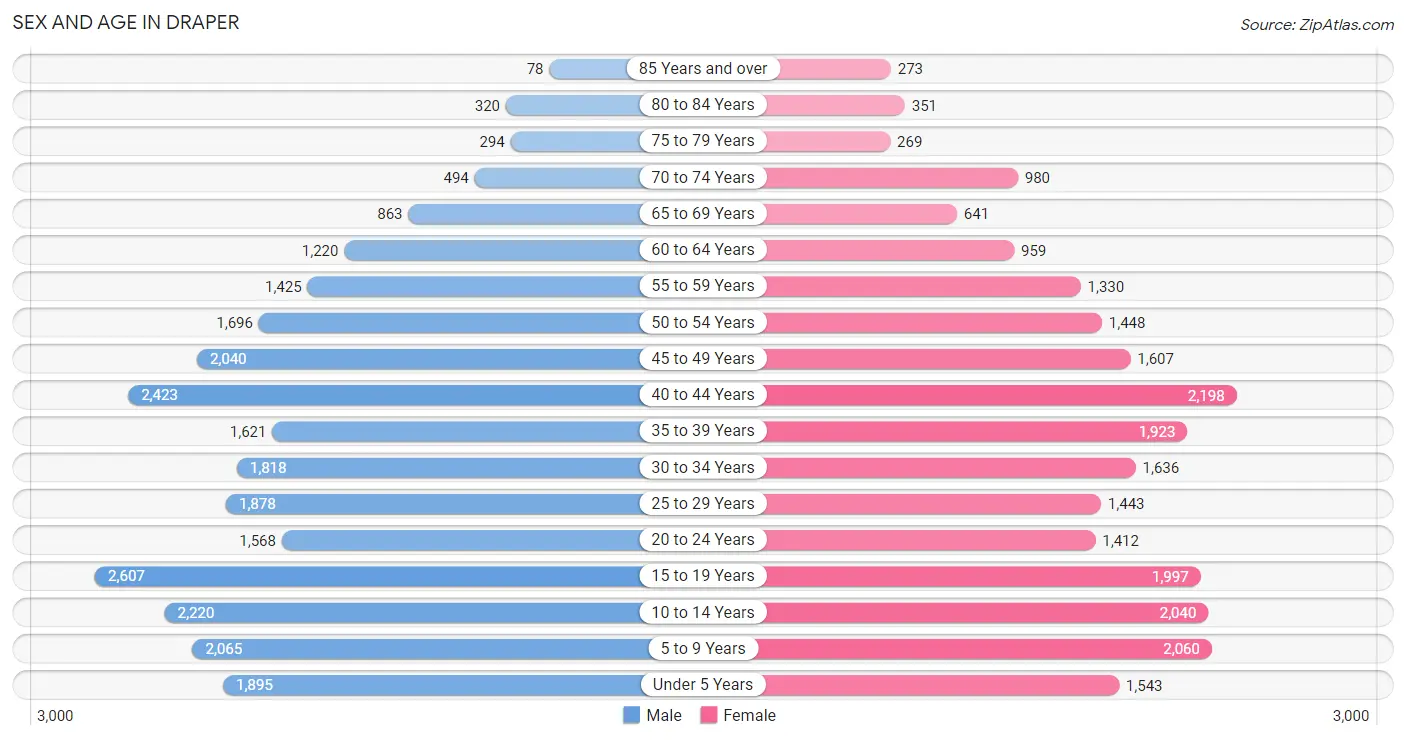
| Age Bracket | Male | Female |
| Under 5 Years | 1,895 (7.1%) | 1,543 (6.4%) |
| 5 to 9 Years | 2,065 (7.8%) | 2,060 (8.5%) |
| 10 to 14 Years | 2,220 (8.4%) | 2,040 (8.5%) |
| 15 to 19 Years | 2,607 (9.8%) | 1,997 (8.3%) |
| 20 to 24 Years | 1,568 (5.9%) | 1,412 (5.9%) |
| 25 to 29 Years | 1,878 (7.1%) | 1,443 (6.0%) |
| 30 to 34 Years | 1,818 (6.9%) | 1,636 (6.8%) |
| 35 to 39 Years | 1,621 (6.1%) | 1,923 (8.0%) |
| 40 to 44 Years | 2,423 (9.1%) | 2,198 (9.1%) |
| 45 to 49 Years | 2,040 (7.7%) | 1,607 (6.7%) |
| 50 to 54 Years | 1,696 (6.4%) | 1,448 (6.0%) |
| 55 to 59 Years | 1,425 (5.4%) | 1,330 (5.5%) |
| 60 to 64 Years | 1,220 (4.6%) | 959 (4.0%) |
| 65 to 69 Years | 863 (3.3%) | 641 (2.7%) |
| 70 to 74 Years | 494 (1.9%) | 980 (4.1%) |
| 75 to 79 Years | 294 (1.1%) | 269 (1.1%) |
| 80 to 84 Years | 320 (1.2%) | 351 (1.5%) |
| 85 Years and over | 78 (0.3%) | 273 (1.1%) |
| Total | 26,525 (100.0%) | 24,110 (100.0%) |
Families and Households in Draper
Median Family Size in Draper
The median family size in Draper is 3.54 persons per family, with married-couple families (10,489 | 85.8%) accounting for the largest median family size of 3.65 persons per family. On the other hand, single male/father families (465 | 3.8%) represent the smallest median family size with 2.79 persons per family.
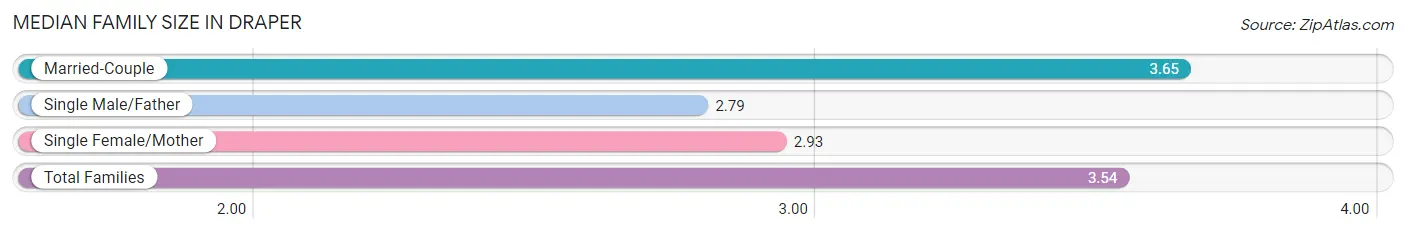
| Family Type | # Families | Family Size |
| Married-Couple | 10,489 (85.8%) | 3.65 |
| Single Male/Father | 465 (3.8%) | 2.79 |
| Single Female/Mother | 1,267 (10.4%) | 2.93 |
| Total Families | 12,221 (100.0%) | 3.54 |
Median Household Size in Draper
The median household size in Draper is 3.05 persons per household, with married-couple households (10,489 | 66.1%) accounting for the largest median household size of 3.67 persons per household. non-family households (3,640 | 23.0%) represent the smallest median household size with 1.28 persons per household.
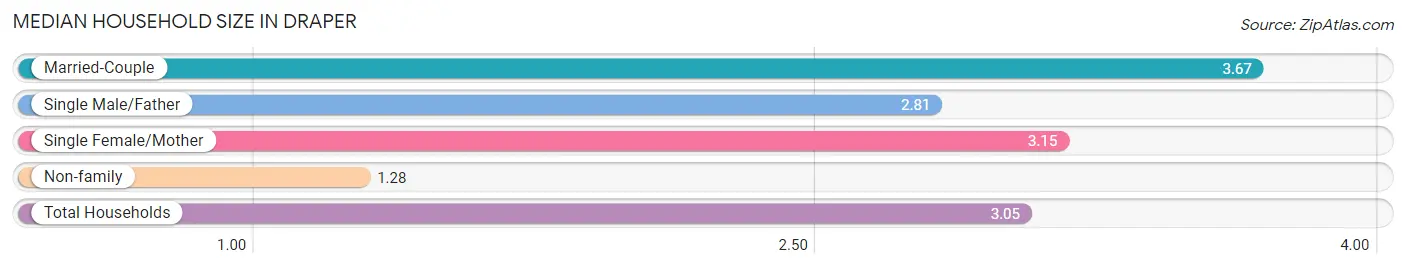
| Household Type | # Households | Household Size |
| Married-Couple | 10,489 (66.1%) | 3.67 |
| Single Male/Father | 465 (2.9%) | 2.81 |
| Single Female/Mother | 1,267 (8.0%) | 3.15 |
| Non-family | 3,640 (23.0%) | 1.28 |
| Total Households | 15,861 (100.0%) | 3.05 |
Household Size by Marriage Status in Draper
Out of a total of 15,861 households in Draper, 12,221 (77.0%) are family households, while 3,640 (23.0%) are nonfamily households. The most numerous type of family households are 2-person households, comprising 4,375, and the most common type of nonfamily households are 1-person households, comprising 2,814.
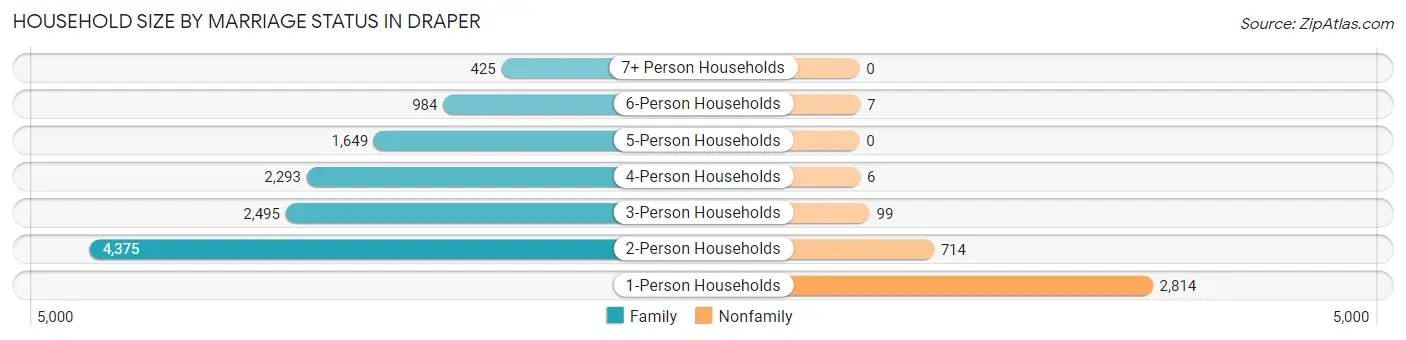
| Household Size | Family Households | Nonfamily Households |
| 1-Person Households | - | 2,814 (17.7%) |
| 2-Person Households | 4,375 (27.6%) | 714 (4.5%) |
| 3-Person Households | 2,495 (15.7%) | 99 (0.6%) |
| 4-Person Households | 2,293 (14.5%) | 6 (0.0%) |
| 5-Person Households | 1,649 (10.4%) | 0 (0.0%) |
| 6-Person Households | 984 (6.2%) | 7 (0.0%) |
| 7+ Person Households | 425 (2.7%) | 0 (0.0%) |
| Total | 12,221 (77.0%) | 3,640 (23.0%) |
Female Fertility in Draper
Fertility by Age in Draper
Average fertility rate in Draper is 46.0 births per 1,000 women. Women in the age bracket of 20 to 34 years have the highest fertility rate with 91.0 births per 1,000 women. Women in the age bracket of 20 to 34 years acount for 71.4% of all women with births.
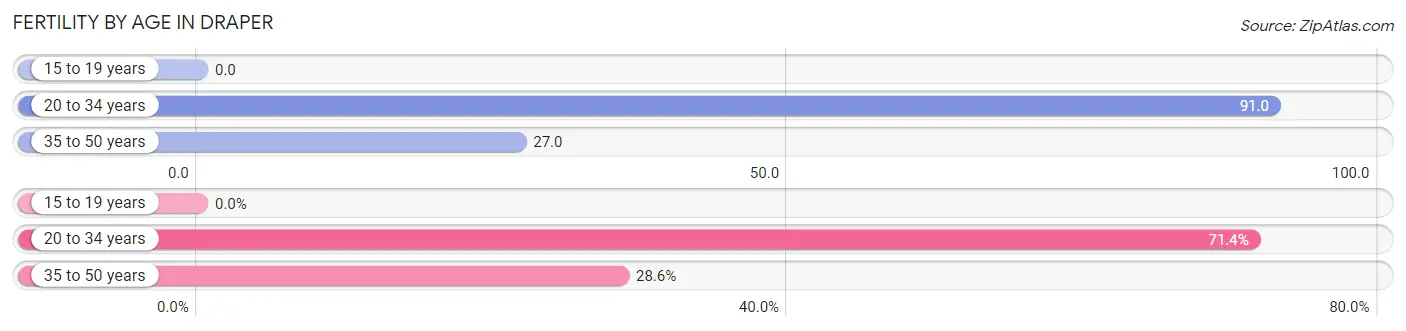
| Age Bracket | Women with Births | Births / 1,000 Women |
| 15 to 19 years | 0 (0.0%) | 0.0 |
| 20 to 34 years | 410 (71.4%) | 91.0 |
| 35 to 50 years | 164 (28.6%) | 27.0 |
| Total | 574 (100.0%) | 46.0 |
Fertility by Age by Marriage Status in Draper
98.4% of women with births (574) in Draper are married. The highest percentage of unmarried women with births falls into 20 to 34 years age bracket with 2.2% of them unmarried at the time of birth, while the lowest percentage of unmarried women with births belong to 35 to 50 years age bracket with 0.0% of them unmarried.
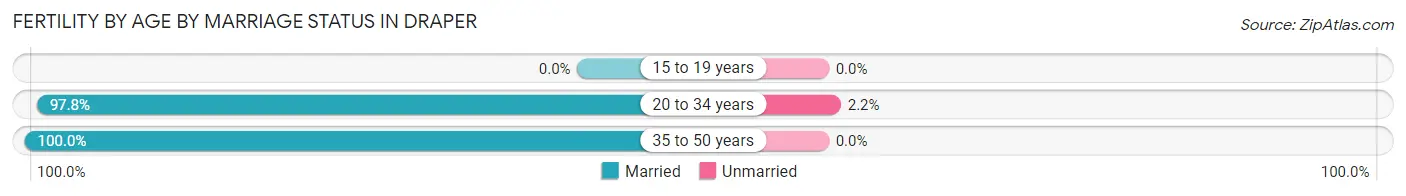
| Age Bracket | Married | Unmarried |
| 15 to 19 years | 0 (0.0%) | 0 (0.0%) |
| 20 to 34 years | 401 (97.8%) | 9 (2.2%) |
| 35 to 50 years | 164 (100.0%) | 0 (0.0%) |
| Total | 565 (98.4%) | 9 (1.6%) |
Fertility by Education in Draper
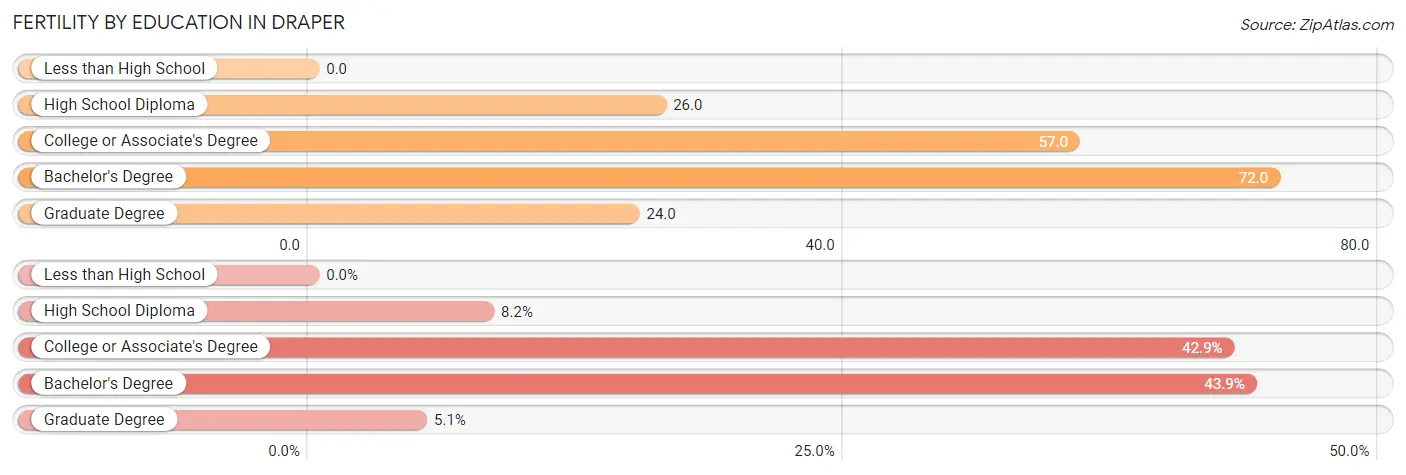
| Educational Attainment | Women with Births | Births / 1,000 Women |
| Less than High School | 0 (0.0%) | 0.0 |
| High School Diploma | 47 (8.2%) | 26.0 |
| College or Associate's Degree | 246 (42.9%) | 57.0 |
| Bachelor's Degree | 252 (43.9%) | 72.0 |
| Graduate Degree | 29 (5.1%) | 24.0 |
| Total | 574 (100.0%) | 46.0 |
Fertility by Education by Marriage Status in Draper
1.6% of women with births in Draper are unmarried. Women with the educational attainment of college or associate's degree are most likely to be married with 100.0% of them married at childbirth, while women with the educational attainment of high school diploma are least likely to be married with 19.2% of them unmarried at childbirth.
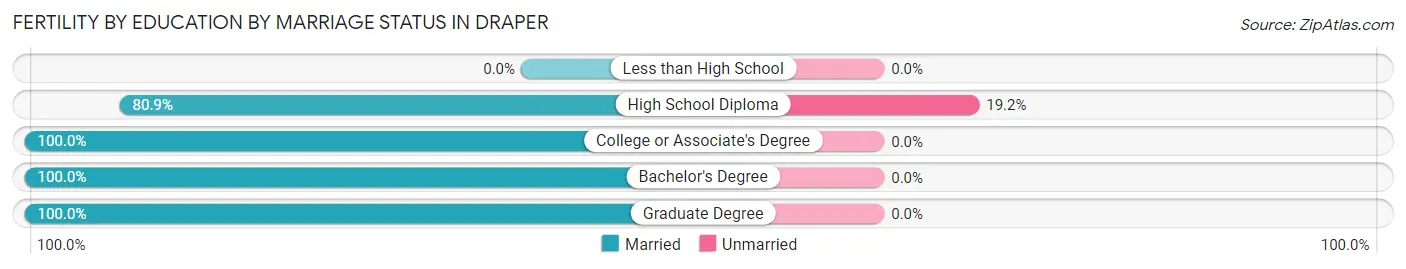
| Educational Attainment | Married | Unmarried |
| Less than High School | 0 (0.0%) | 0 (0.0%) |
| High School Diploma | 38 (80.8%) | 9 (19.2%) |
| College or Associate's Degree | 246 (100.0%) | 0 (0.0%) |
| Bachelor's Degree | 252 (100.0%) | 0 (0.0%) |
| Graduate Degree | 29 (100.0%) | 0 (0.0%) |
| Total | 565 (98.4%) | 9 (1.6%) |
Employment Characteristics in Draper
Employment by Class of Employer in Draper
Among the 24,064 employed individuals in Draper, private company employees (16,584 | 68.9%), self-employed (incorporated) (2,223 | 9.2%), and not-for-profit organizations (1,865 | 7.7%) make up the most common classes of employment.
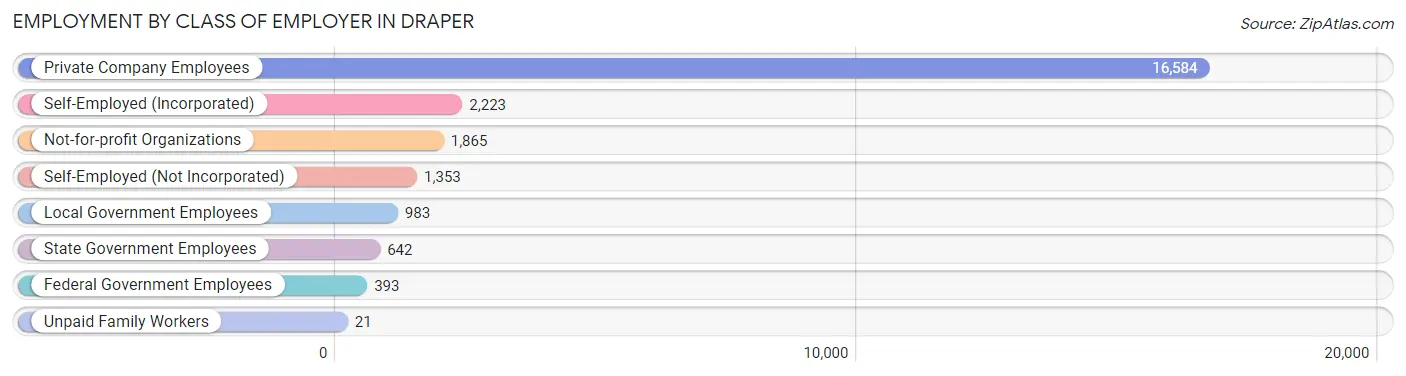
| Employer Class | # Employees | % Employees |
| Private Company Employees | 16,584 | 68.9% |
| Self-Employed (Incorporated) | 2,223 | 9.2% |
| Self-Employed (Not Incorporated) | 1,353 | 5.6% |
| Not-for-profit Organizations | 1,865 | 7.7% |
| Local Government Employees | 983 | 4.1% |
| State Government Employees | 642 | 2.7% |
| Federal Government Employees | 393 | 1.6% |
| Unpaid Family Workers | 21 | 0.1% |
| Total | 24,064 | 100.0% |
Employment Status by Age in Draper
According to the labor force statistics for Draper, out of the total population over 16 years of age (37,367), 66.8% or 24,961 individuals are in the labor force, with 2.2% or 549 of them unemployed. The age group with the highest labor force participation rate is 25 to 29 years, with 89.9% or 2,986 individuals in the labor force. Within the labor force, the 16 to 19 years age range has the highest percentage of unemployed individuals, with 12.6% or 208 of them being unemployed.
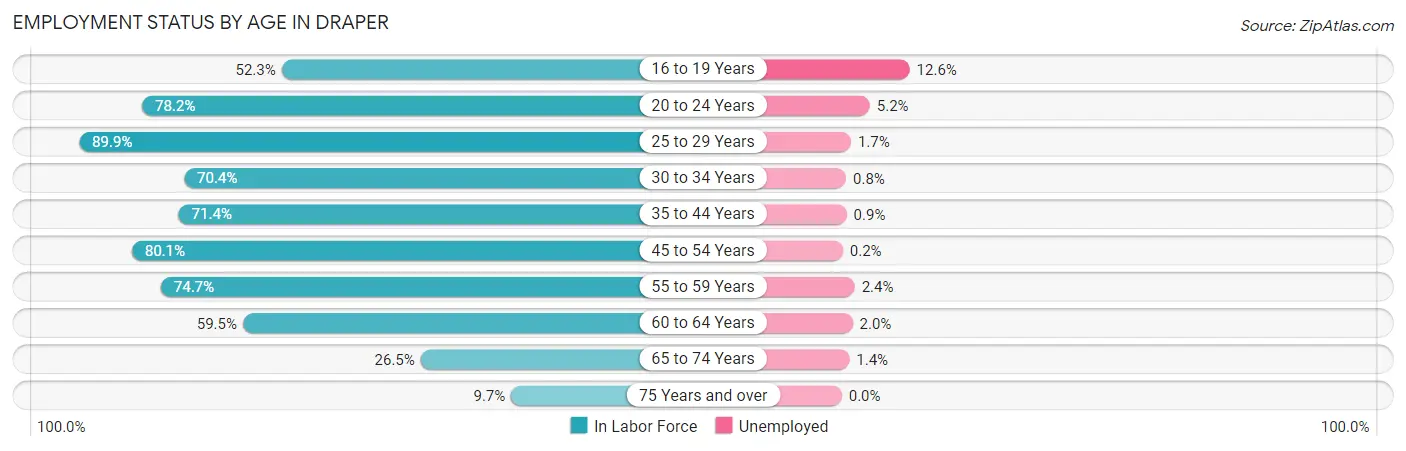
| Age Bracket | In Labor Force | Unemployed |
| 16 to 19 Years | 1,652 (52.3%) | 208 (12.6%) |
| 20 to 24 Years | 2,330 (78.2%) | 121 (5.2%) |
| 25 to 29 Years | 2,986 (89.9%) | 51 (1.7%) |
| 30 to 34 Years | 2,432 (70.4%) | 19 (0.8%) |
| 35 to 44 Years | 5,830 (71.4%) | 52 (0.9%) |
| 45 to 54 Years | 5,440 (80.1%) | 11 (0.2%) |
| 55 to 59 Years | 2,058 (74.7%) | 49 (2.4%) |
| 60 to 64 Years | 1,297 (59.5%) | 26 (2.0%) |
| 65 to 74 Years | 789 (26.5%) | 11 (1.4%) |
| 75 Years and over | 154 (9.7%) | 0 (0.0%) |
| Total | 24,961 (66.8%) | 549 (2.2%) |
Employment Status by Educational Attainment in Draper
According to labor force statistics for Draper, 75.2% of individuals (20,052) out of the total population between 25 and 64 years of age (26,665) are in the labor force, with 1.0% or 201 of them being unemployed. The group with the highest labor force participation rate are those with the educational attainment of bachelor's degree or higher, with 81.8% or 10,913 individuals in the labor force. Within the labor force, individuals with college / associate degree education have the highest percentage of unemployment, with 1.6% or 100 of them being unemployed.
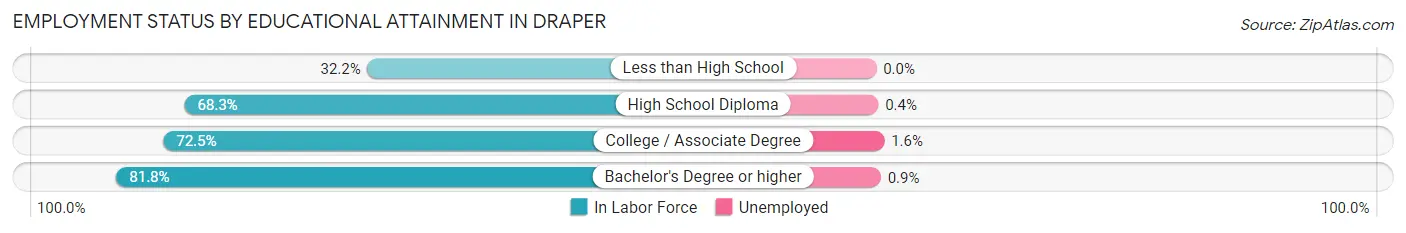
| Educational Attainment | In Labor Force | Unemployed |
| Less than High School | 298 (32.2%) | 0 (0.0%) |
| High School Diploma | 2,602 (68.3%) | 15 (0.4%) |
| College / Associate Degree | 6,227 (72.5%) | 137 (1.6%) |
| Bachelor's Degree or higher | 10,913 (81.8%) | 120 (0.9%) |
| Total | 20,052 (75.2%) | 267 (1.0%) |
Employment Occupations by Sex in Draper
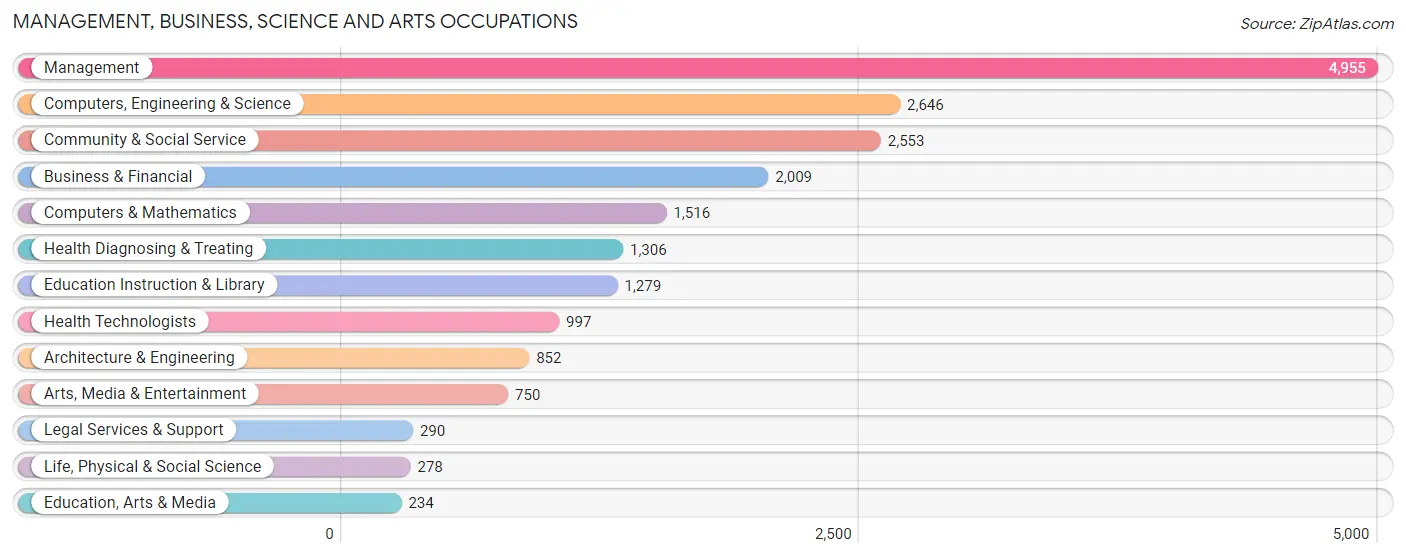
Management, Business, Science and Arts Occupations
The most common Management, Business, Science and Arts occupations in Draper are Management (4,955 | 20.3%), Computers, Engineering & Science (2,646 | 10.8%), Community & Social Service (2,553 | 10.5%), Business & Financial (2,009 | 8.2%), and Computers & Mathematics (1,516 | 6.2%).
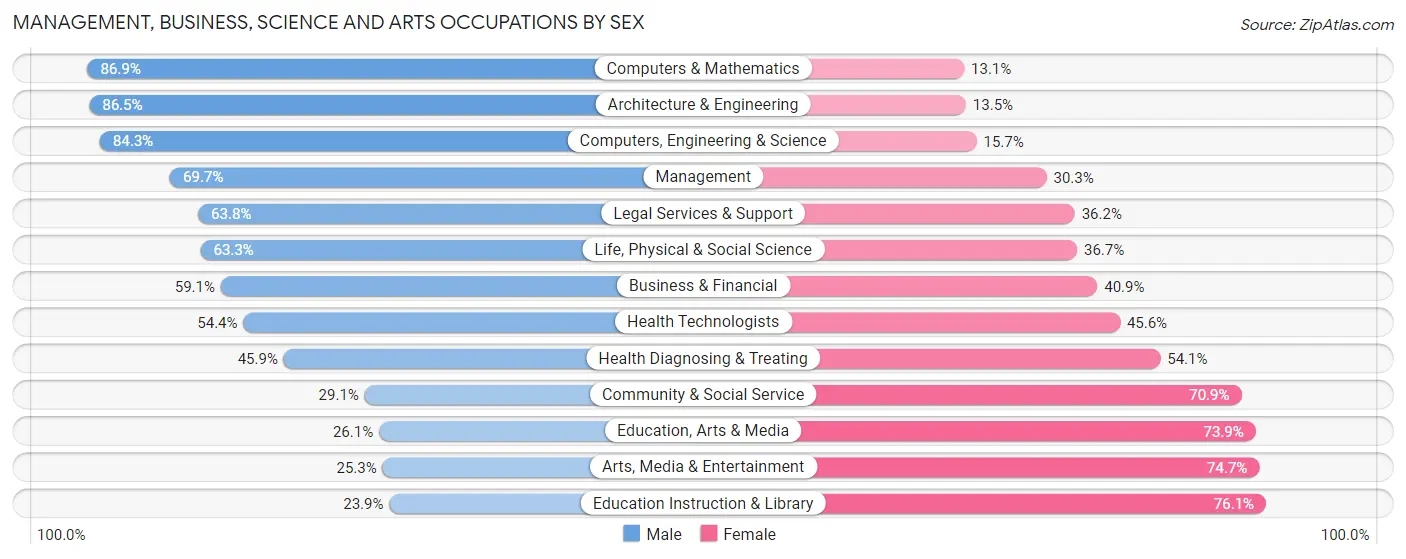
Management, Business, Science and Arts Occupations by Sex
Within the Management, Business, Science and Arts occupations in Draper, the most male-oriented occupations are Computers & Mathematics (86.9%), Architecture & Engineering (86.5%), and Computers, Engineering & Science (84.3%), while the most female-oriented occupations are Education Instruction & Library (76.1%), Arts, Media & Entertainment (74.7%), and Education, Arts & Media (73.9%).
| Occupation | Male | Female |
| Management | 3,452 (69.7%) | 1,503 (30.3%) |
| Business & Financial | 1,187 (59.1%) | 822 (40.9%) |
| Computers, Engineering & Science | 2,230 (84.3%) | 416 (15.7%) |
| Computers & Mathematics | 1,317 (86.9%) | 199 (13.1%) |
| Architecture & Engineering | 737 (86.5%) | 115 (13.5%) |
| Life, Physical & Social Science | 176 (63.3%) | 102 (36.7%) |
| Community & Social Service | 742 (29.1%) | 1,811 (70.9%) |
| Education, Arts & Media | 61 (26.1%) | 173 (73.9%) |
| Legal Services & Support | 185 (63.8%) | 105 (36.2%) |
| Education Instruction & Library | 306 (23.9%) | 973 (76.1%) |
| Arts, Media & Entertainment | 190 (25.3%) | 560 (74.7%) |
| Health Diagnosing & Treating | 600 (45.9%) | 706 (54.1%) |
| Health Technologists | 542 (54.4%) | 455 (45.6%) |
| Total (Category) | 8,211 (61.0%) | 5,258 (39.0%) |
| Total (Overall) | 13,845 (56.7%) | 10,560 (43.3%) |
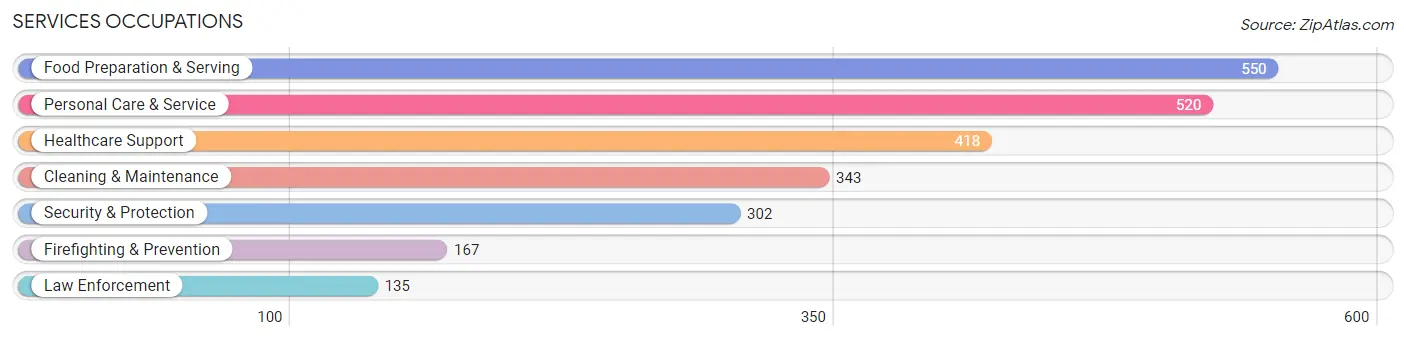
Services Occupations
The most common Services occupations in Draper are Food Preparation & Serving (550 | 2.2%), Personal Care & Service (520 | 2.1%), Healthcare Support (418 | 1.7%), Cleaning & Maintenance (343 | 1.4%), and Security & Protection (302 | 1.2%).
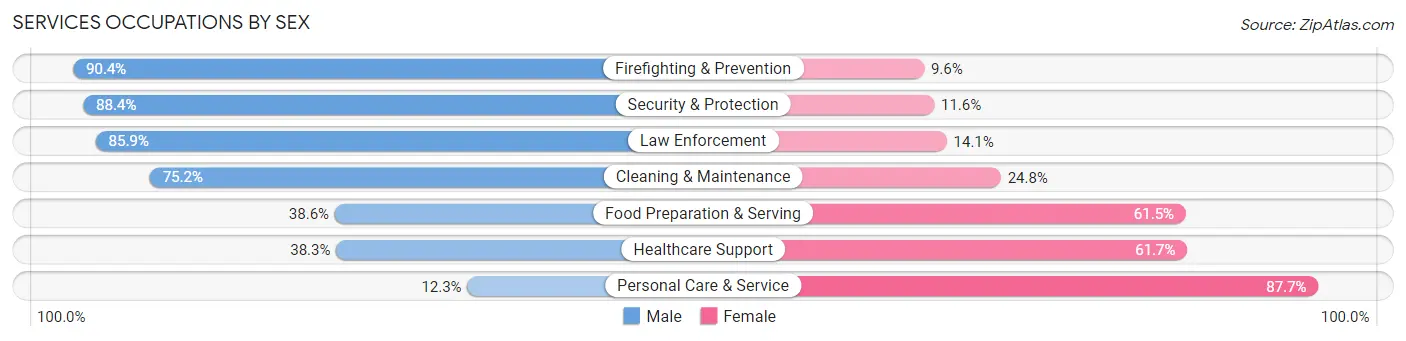
Services Occupations by Sex
Within the Services occupations in Draper, the most male-oriented occupations are Firefighting & Prevention (90.4%), Security & Protection (88.4%), and Law Enforcement (85.9%), while the most female-oriented occupations are Personal Care & Service (87.7%), Healthcare Support (61.7%), and Food Preparation & Serving (61.5%).
| Occupation | Male | Female |
| Healthcare Support | 160 (38.3%) | 258 (61.7%) |
| Security & Protection | 267 (88.4%) | 35 (11.6%) |
| Firefighting & Prevention | 151 (90.4%) | 16 (9.6%) |
| Law Enforcement | 116 (85.9%) | 19 (14.1%) |
| Food Preparation & Serving | 212 (38.6%) | 338 (61.5%) |
| Cleaning & Maintenance | 258 (75.2%) | 85 (24.8%) |
| Personal Care & Service | 64 (12.3%) | 456 (87.7%) |
| Total (Category) | 961 (45.1%) | 1,172 (54.9%) |
| Total (Overall) | 13,845 (56.7%) | 10,560 (43.3%) |
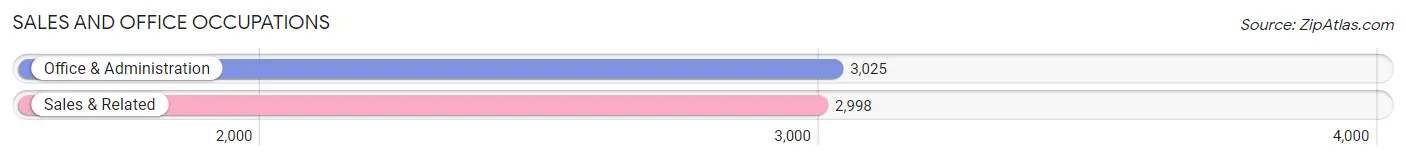
Sales and Office Occupations
The most common Sales and Office occupations in Draper are Office & Administration (3,025 | 12.4%), and Sales & Related (2,998 | 12.3%).
Sales and Office Occupations by Sex
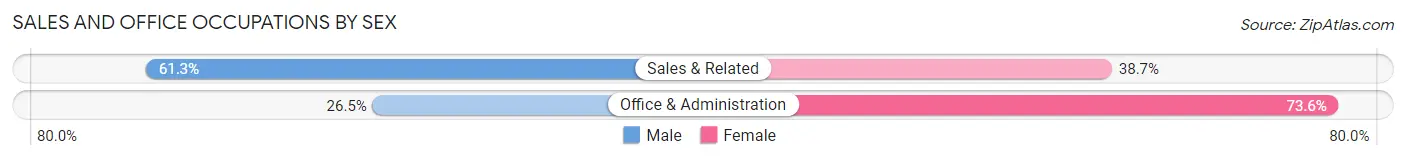
| Occupation | Male | Female |
| Sales & Related | 1,839 (61.3%) | 1,159 (38.7%) |
| Office & Administration | 800 (26.5%) | 2,225 (73.6%) |
| Total (Category) | 2,639 (43.8%) | 3,384 (56.2%) |
| Total (Overall) | 13,845 (56.7%) | 10,560 (43.3%) |
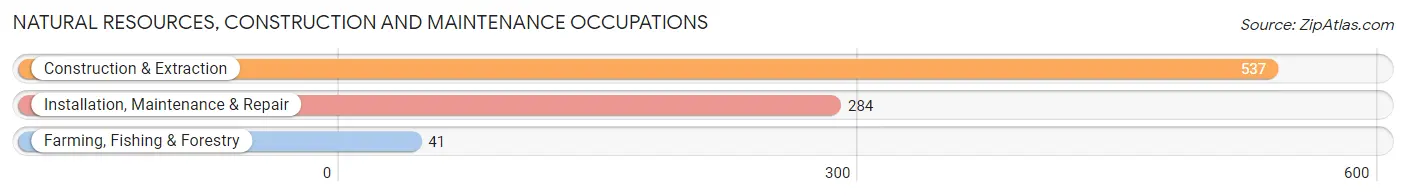
Natural Resources, Construction and Maintenance Occupations
The most common Natural Resources, Construction and Maintenance occupations in Draper are Construction & Extraction (537 | 2.2%), Installation, Maintenance & Repair (284 | 1.2%), and Farming, Fishing & Forestry (41 | 0.2%).
Natural Resources, Construction and Maintenance Occupations by Sex
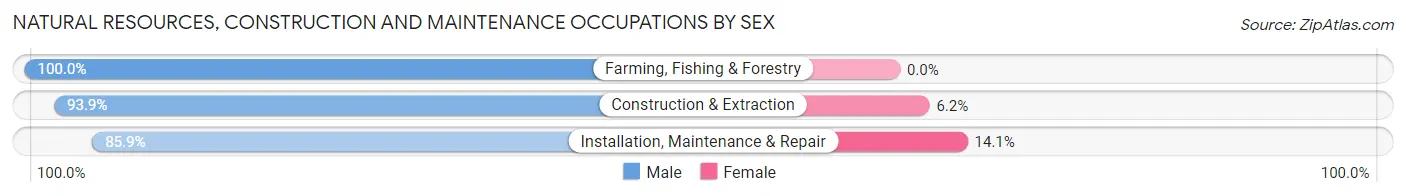
| Occupation | Male | Female |
| Farming, Fishing & Forestry | 41 (100.0%) | 0 (0.0%) |
| Construction & Extraction | 504 (93.9%) | 33 (6.1%) |
| Installation, Maintenance & Repair | 244 (85.9%) | 40 (14.1%) |
| Total (Category) | 789 (91.5%) | 73 (8.5%) |
| Total (Overall) | 13,845 (56.7%) | 10,560 (43.3%) |
Production, Transportation and Moving Occupations
The most common Production, Transportation and Moving occupations in Draper are Production (755 | 3.1%), Transportation (650 | 2.7%), and Material Moving (513 | 2.1%).
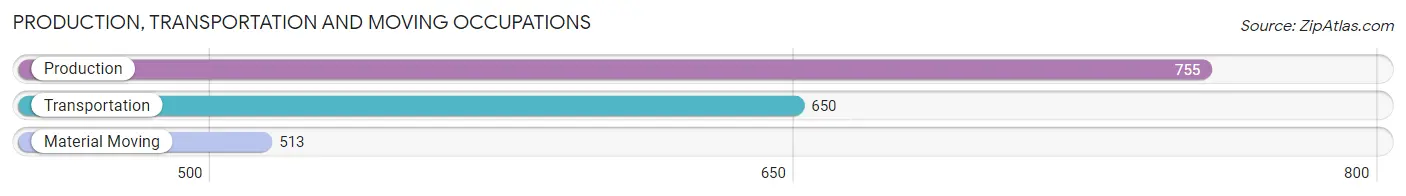
Production, Transportation and Moving Occupations by Sex
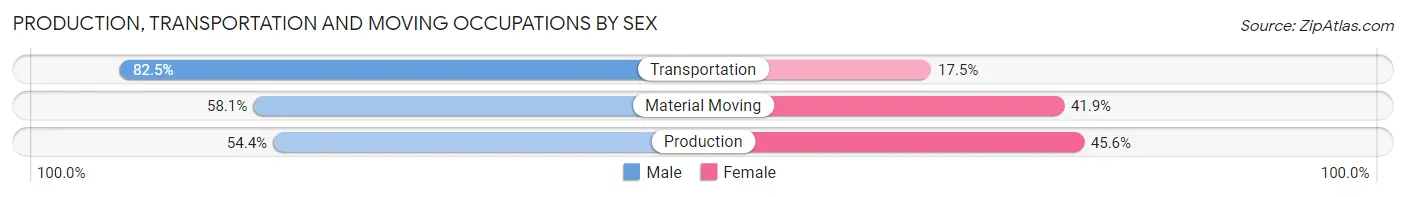
| Occupation | Male | Female |
| Production | 411 (54.4%) | 344 (45.6%) |
| Transportation | 536 (82.5%) | 114 (17.5%) |
| Material Moving | 298 (58.1%) | 215 (41.9%) |
| Total (Category) | 1,245 (64.9%) | 673 (35.1%) |
| Total (Overall) | 13,845 (56.7%) | 10,560 (43.3%) |
Employment Industries by Sex in Draper
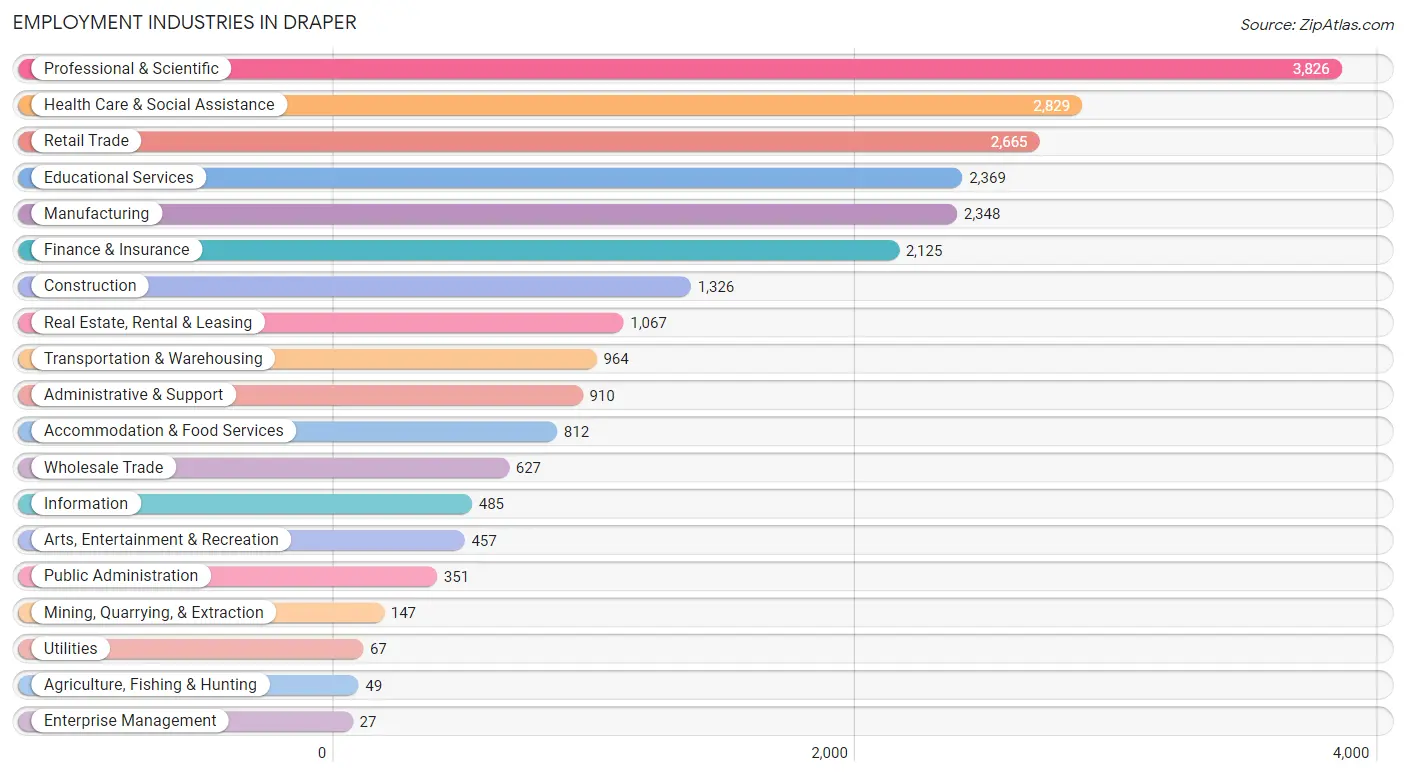
Employment Industries in Draper
The major employment industries in Draper include Professional & Scientific (3,826 | 15.7%), Health Care & Social Assistance (2,829 | 11.6%), Retail Trade (2,665 | 10.9%), Educational Services (2,369 | 9.7%), and Manufacturing (2,348 | 9.6%).
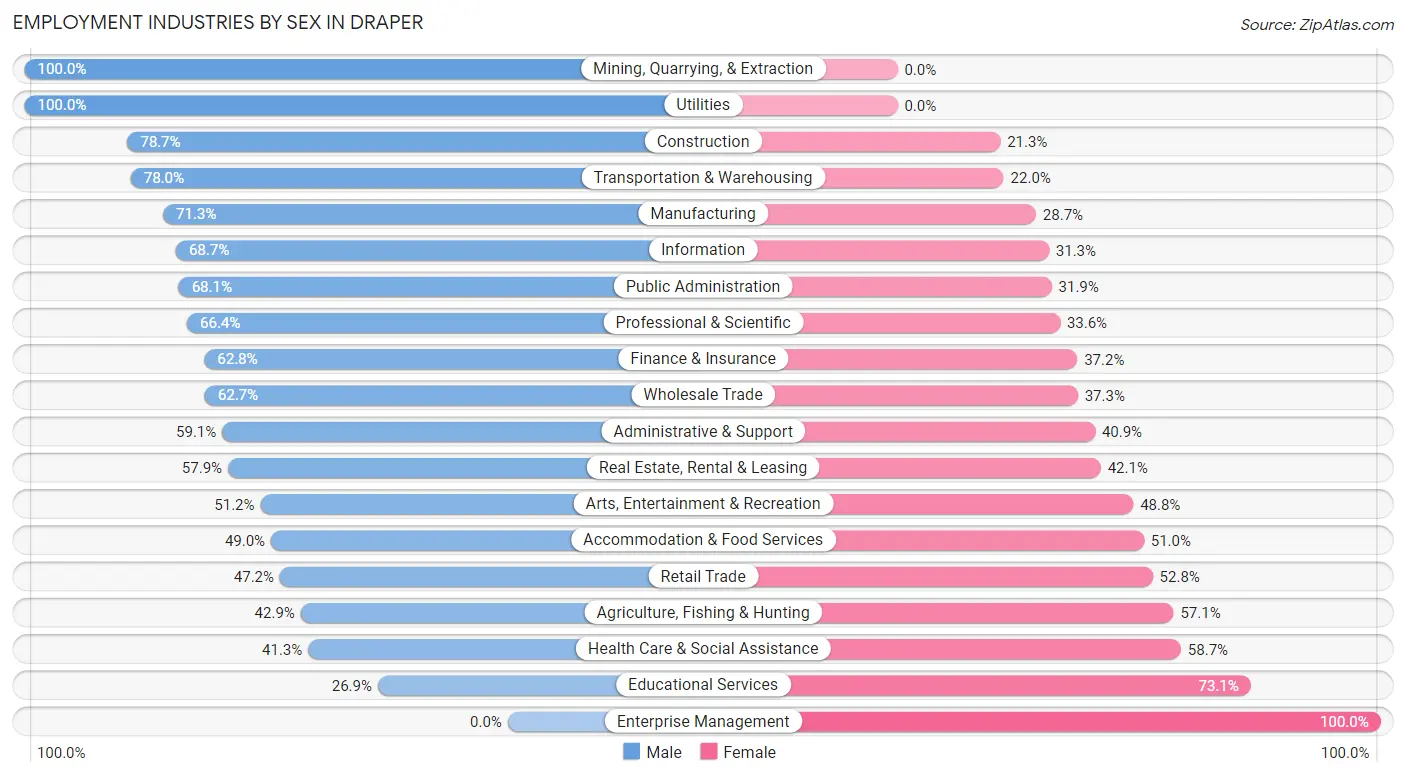
Employment Industries by Sex in Draper
The Draper industries that see more men than women are Mining, Quarrying, & Extraction (100.0%), Utilities (100.0%), and Construction (78.7%), whereas the industries that tend to have a higher number of women are Enterprise Management (100.0%), Educational Services (73.1%), and Health Care & Social Assistance (58.7%).
| Industry | Male | Female |
| Agriculture, Fishing & Hunting | 21 (42.9%) | 28 (57.1%) |
| Mining, Quarrying, & Extraction | 147 (100.0%) | 0 (0.0%) |
| Construction | 1,044 (78.7%) | 282 (21.3%) |
| Manufacturing | 1,675 (71.3%) | 673 (28.7%) |
| Wholesale Trade | 393 (62.7%) | 234 (37.3%) |
| Retail Trade | 1,257 (47.2%) | 1,408 (52.8%) |
| Transportation & Warehousing | 752 (78.0%) | 212 (22.0%) |
| Utilities | 67 (100.0%) | 0 (0.0%) |
| Information | 333 (68.7%) | 152 (31.3%) |
| Finance & Insurance | 1,334 (62.8%) | 791 (37.2%) |
| Real Estate, Rental & Leasing | 618 (57.9%) | 449 (42.1%) |
| Professional & Scientific | 2,539 (66.4%) | 1,287 (33.6%) |
| Enterprise Management | 0 (0.0%) | 27 (100.0%) |
| Administrative & Support | 538 (59.1%) | 372 (40.9%) |
| Educational Services | 637 (26.9%) | 1,732 (73.1%) |
| Health Care & Social Assistance | 1,169 (41.3%) | 1,660 (58.7%) |
| Arts, Entertainment & Recreation | 234 (51.2%) | 223 (48.8%) |
| Accommodation & Food Services | 398 (49.0%) | 414 (51.0%) |
| Public Administration | 239 (68.1%) | 112 (31.9%) |
| Total | 13,845 (56.7%) | 10,560 (43.3%) |
Education in Draper
School Enrollment in Draper
The most common levels of schooling among the 16,601 students in Draper are high school (4,483 | 27.0%), elementary school (3,547 | 21.4%), and middle school (3,516 | 21.2%).
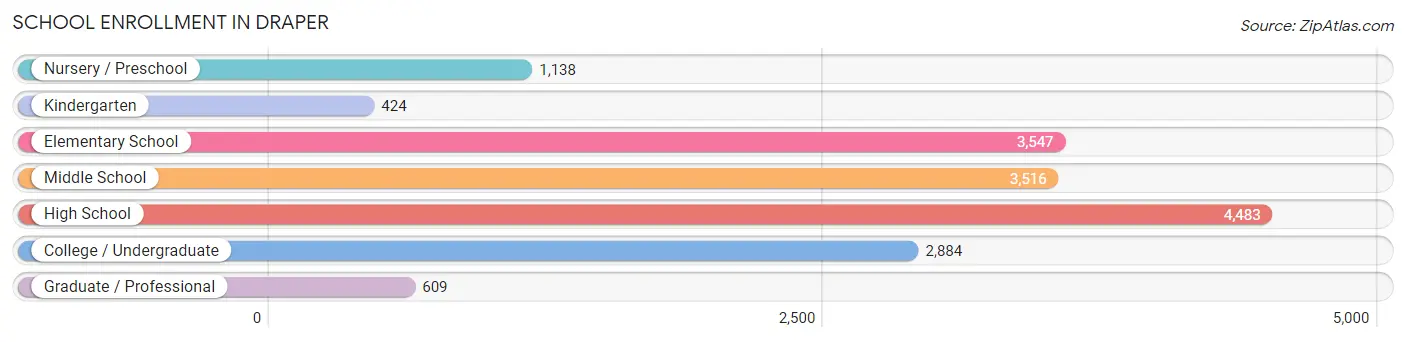
| School Level | # Students | % Students |
| Nursery / Preschool | 1,138 | 6.9% |
| Kindergarten | 424 | 2.5% |
| Elementary School | 3,547 | 21.4% |
| Middle School | 3,516 | 21.2% |
| High School | 4,483 | 27.0% |
| College / Undergraduate | 2,884 | 17.4% |
| Graduate / Professional | 609 | 3.7% |
| Total | 16,601 | 100.0% |
School Enrollment by Age by Funding Source in Draper
Out of a total of 16,601 students who are enrolled in schools in Draper, 3,138 (18.9%) attend a private institution, while the remaining 13,463 (81.1%) are enrolled in public schools. The age group of 3 to 4 year olds has the highest likelihood of being enrolled in private schools, with 600 (71.9% in the age bracket) enrolled. Conversely, the age group of 15 to 17 year olds has the lowest likelihood of being enrolled in a private school, with 3,171 (93.6% in the age bracket) attending a public institution.
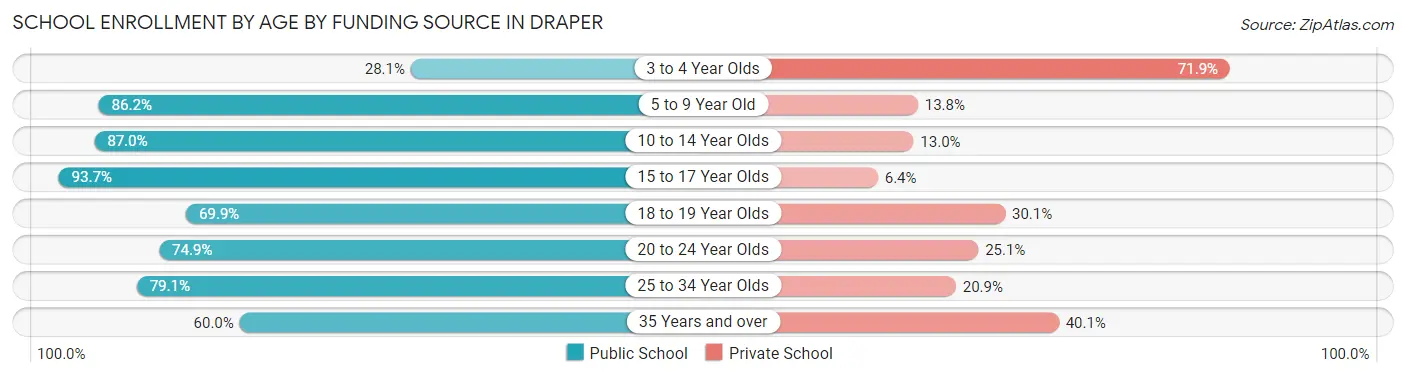
| Age Bracket | Public School | Private School |
| 3 to 4 Year Olds | 234 (28.1%) | 600 (71.9%) |
| 5 to 9 Year Old | 3,468 (86.2%) | 555 (13.8%) |
| 10 to 14 Year Olds | 3,651 (87.0%) | 545 (13.0%) |
| 15 to 17 Year Olds | 3,171 (93.6%) | 215 (6.4%) |
| 18 to 19 Year Olds | 556 (69.9%) | 239 (30.1%) |
| 20 to 24 Year Olds | 885 (74.9%) | 296 (25.1%) |
| 25 to 34 Year Olds | 799 (79.1%) | 211 (20.9%) |
| 35 Years and over | 705 (60.0%) | 471 (40.1%) |
| Total | 13,463 (81.1%) | 3,138 (18.9%) |
Educational Attainment by Field of Study in Draper
Business (3,185 | 19.2%), education (1,655 | 10.0%), science & technology (1,575 | 9.5%), social sciences (1,395 | 8.4%), and engineering (1,339 | 8.1%) are the most common fields of study among 16,620 individuals in Draper who have obtained a bachelor's degree or higher.
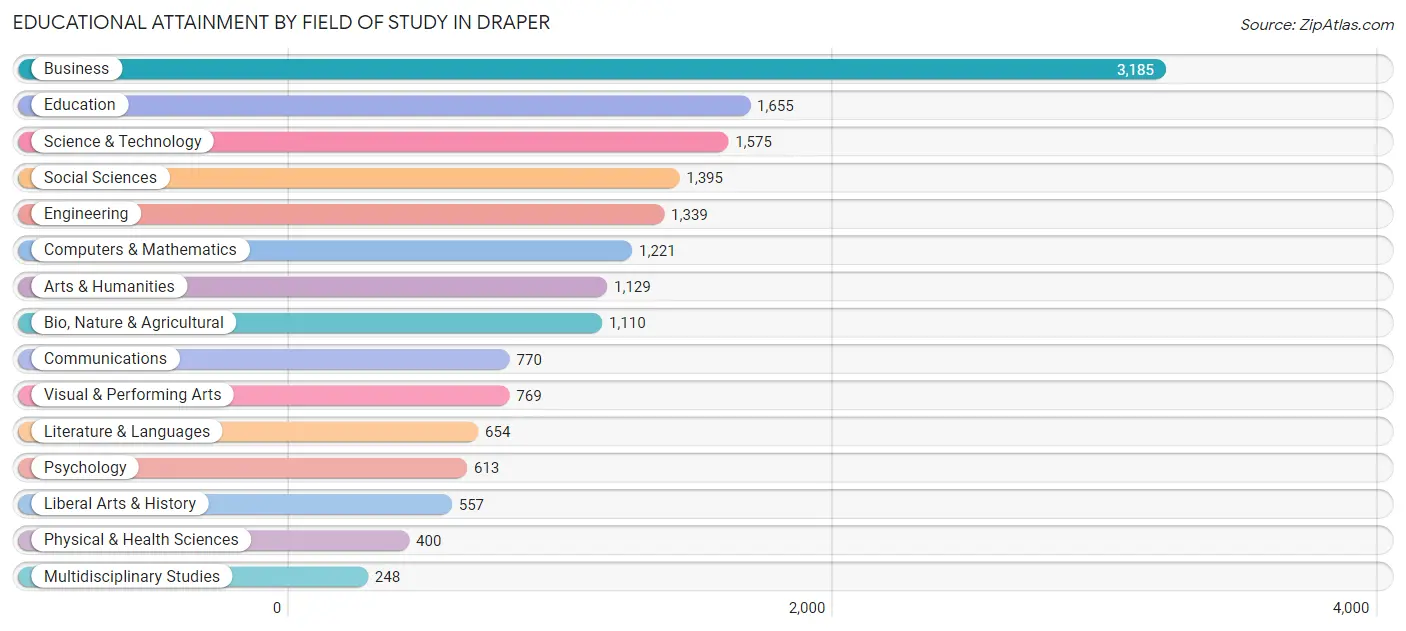
| Field of Study | # Graduates | % Graduates |
| Computers & Mathematics | 1,221 | 7.3% |
| Bio, Nature & Agricultural | 1,110 | 6.7% |
| Physical & Health Sciences | 400 | 2.4% |
| Psychology | 613 | 3.7% |
| Social Sciences | 1,395 | 8.4% |
| Engineering | 1,339 | 8.1% |
| Multidisciplinary Studies | 248 | 1.5% |
| Science & Technology | 1,575 | 9.5% |
| Business | 3,185 | 19.2% |
| Education | 1,655 | 10.0% |
| Literature & Languages | 654 | 3.9% |
| Liberal Arts & History | 557 | 3.4% |
| Visual & Performing Arts | 769 | 4.6% |
| Communications | 770 | 4.6% |
| Arts & Humanities | 1,129 | 6.8% |
| Total | 16,620 | 100.0% |
Transportation & Commute in Draper
Vehicle Availability by Sex in Draper
The most prevalent vehicle ownership categories in Draper are males with 2 vehicles (5,996, accounting for 43.6%) and females with 2 vehicles (4,382, making up 58.4%).
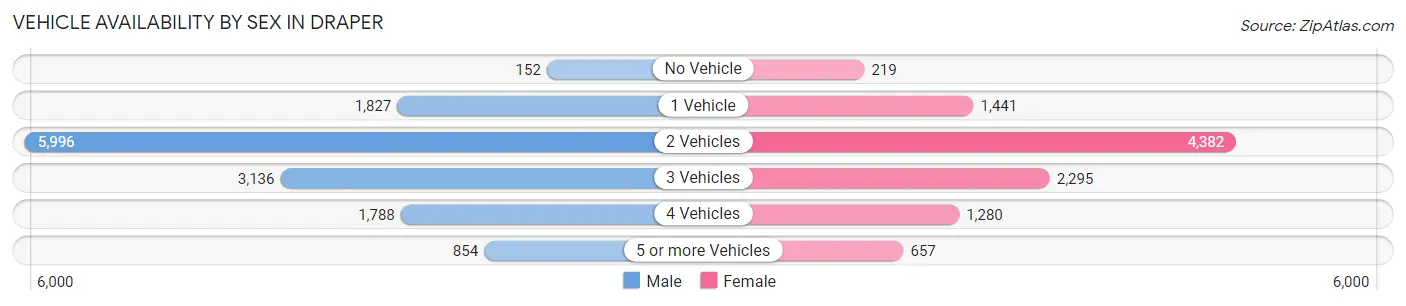
| Vehicles Available | Male | Female |
| No Vehicle | 152 (1.1%) | 219 (2.1%) |
| 1 Vehicle | 1,827 (13.3%) | 1,441 (14.0%) |
| 2 Vehicles | 5,996 (43.6%) | 4,382 (42.6%) |
| 3 Vehicles | 3,136 (22.8%) | 2,295 (22.3%) |
| 4 Vehicles | 1,788 (13.0%) | 1,280 (12.5%) |
| 5 or more Vehicles | 854 (6.2%) | 657 (6.4%) |
| Total | 13,753 (100.0%) | 10,274 (100.0%) |
Commute Time in Draper
The most frequently occuring commute durations in Draper are 20 to 24 minutes (2,981 commuters, 15.6%), 30 to 34 minutes (2,972 commuters, 15.5%), and 10 to 14 minutes (2,738 commuters, 14.3%).
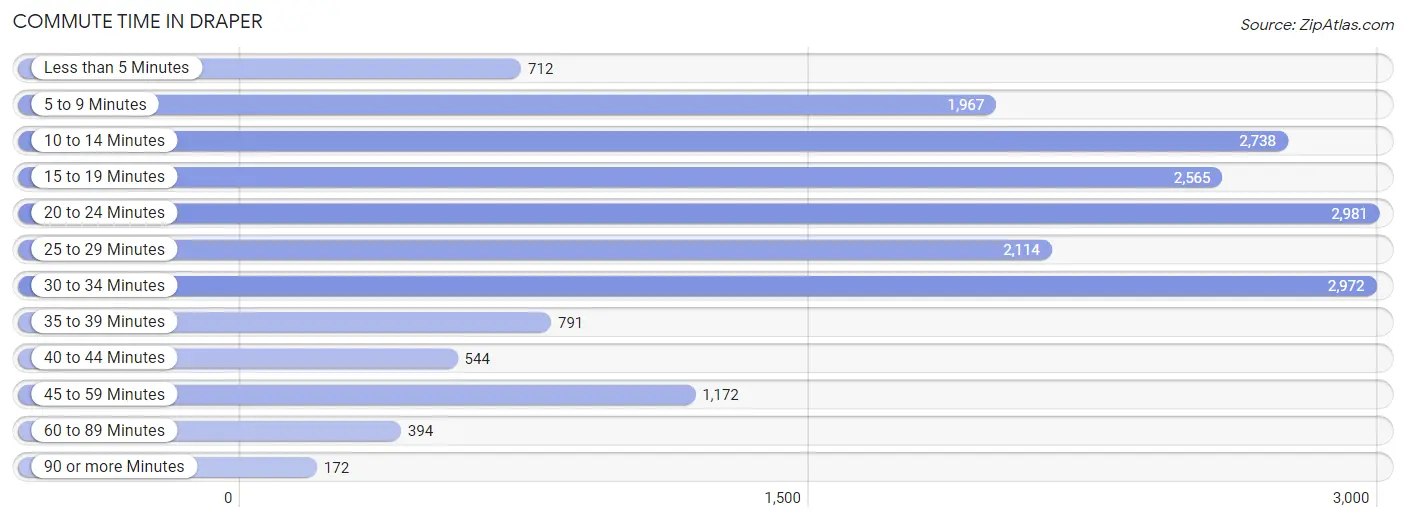
| Commute Time | # Commuters | % Commuters |
| Less than 5 Minutes | 712 | 3.7% |
| 5 to 9 Minutes | 1,967 | 10.3% |
| 10 to 14 Minutes | 2,738 | 14.3% |
| 15 to 19 Minutes | 2,565 | 13.4% |
| 20 to 24 Minutes | 2,981 | 15.6% |
| 25 to 29 Minutes | 2,114 | 11.1% |
| 30 to 34 Minutes | 2,972 | 15.5% |
| 35 to 39 Minutes | 791 | 4.1% |
| 40 to 44 Minutes | 544 | 2.8% |
| 45 to 59 Minutes | 1,172 | 6.1% |
| 60 to 89 Minutes | 394 | 2.1% |
| 90 or more Minutes | 172 | 0.9% |
Commute Time by Sex in Draper
The most common commute times in Draper are 20 to 24 minutes (1,775 commuters, 15.8%) for males and 30 to 34 minutes (1,416 commuters, 18.0%) for females.
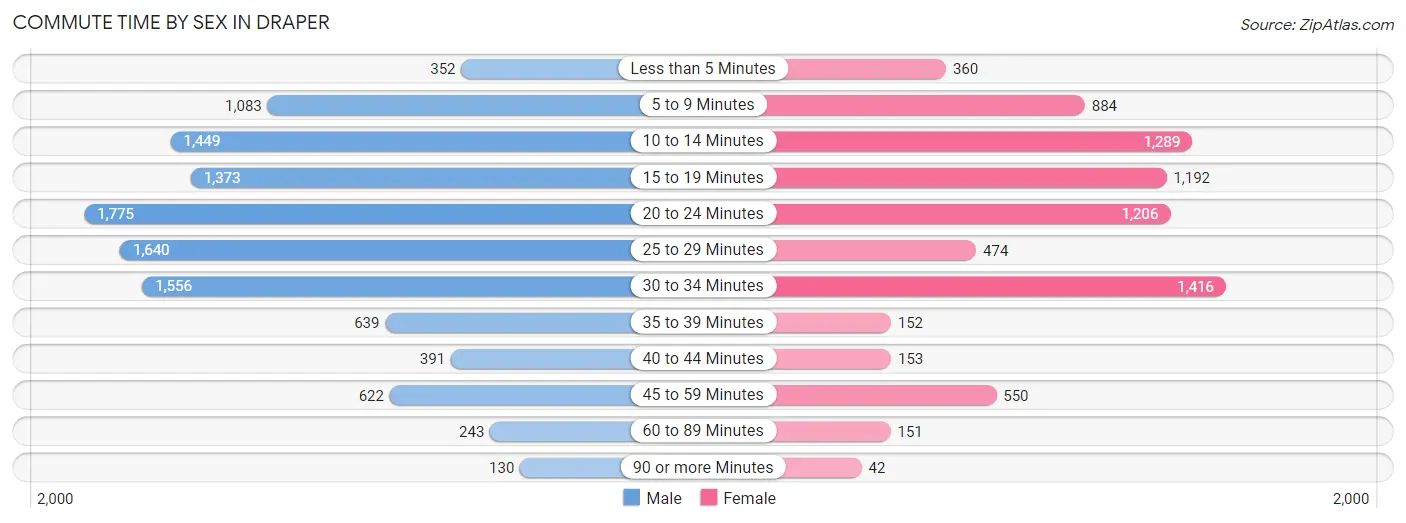
| Commute Time | Male | Female |
| Less than 5 Minutes | 352 (3.1%) | 360 (4.6%) |
| 5 to 9 Minutes | 1,083 (9.6%) | 884 (11.2%) |
| 10 to 14 Minutes | 1,449 (12.9%) | 1,289 (16.4%) |
| 15 to 19 Minutes | 1,373 (12.2%) | 1,192 (15.1%) |
| 20 to 24 Minutes | 1,775 (15.8%) | 1,206 (15.3%) |
| 25 to 29 Minutes | 1,640 (14.6%) | 474 (6.0%) |
| 30 to 34 Minutes | 1,556 (13.8%) | 1,416 (18.0%) |
| 35 to 39 Minutes | 639 (5.7%) | 152 (1.9%) |
| 40 to 44 Minutes | 391 (3.5%) | 153 (1.9%) |
| 45 to 59 Minutes | 622 (5.5%) | 550 (7.0%) |
| 60 to 89 Minutes | 243 (2.2%) | 151 (1.9%) |
| 90 or more Minutes | 130 (1.2%) | 42 (0.5%) |
Time of Departure to Work by Sex in Draper
The most frequent times of departure to work in Draper are 7:30 AM to 7:59 AM (1,747, 15.5%) for males and 8:00 AM to 8:29 AM (1,527, 19.4%) for females.
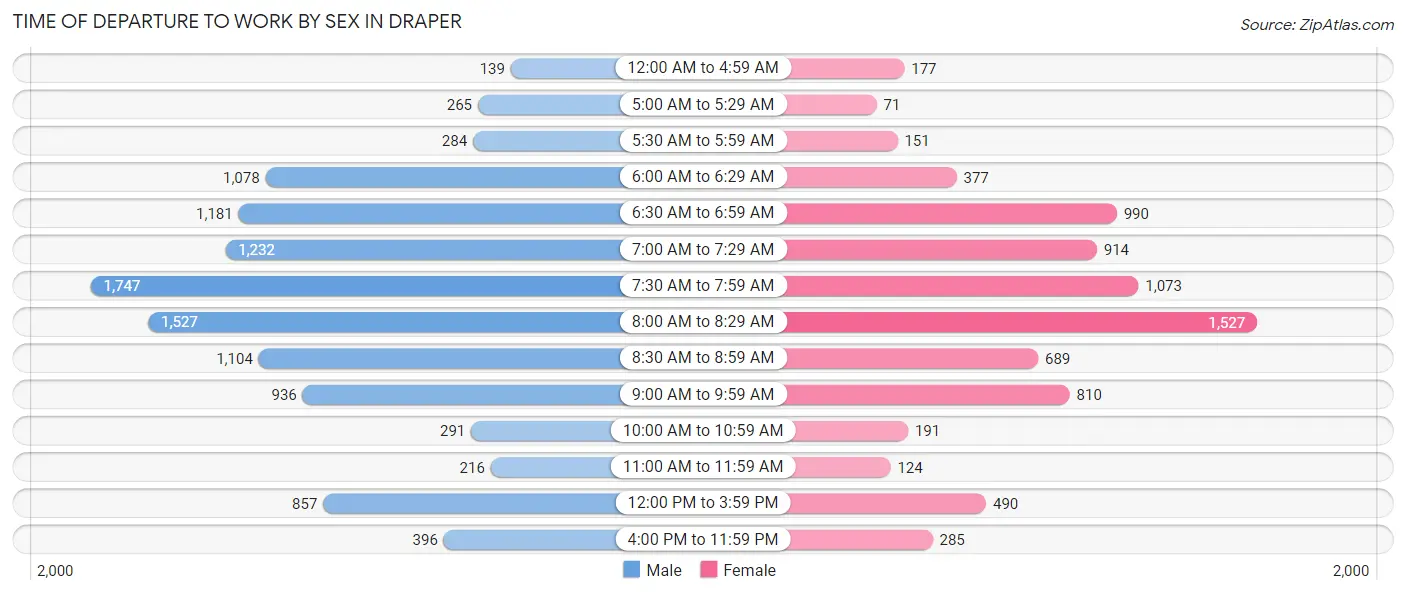
| Time of Departure | Male | Female |
| 12:00 AM to 4:59 AM | 139 (1.2%) | 177 (2.2%) |
| 5:00 AM to 5:29 AM | 265 (2.4%) | 71 (0.9%) |
| 5:30 AM to 5:59 AM | 284 (2.5%) | 151 (1.9%) |
| 6:00 AM to 6:29 AM | 1,078 (9.6%) | 377 (4.8%) |
| 6:30 AM to 6:59 AM | 1,181 (10.5%) | 990 (12.6%) |
| 7:00 AM to 7:29 AM | 1,232 (11.0%) | 914 (11.6%) |
| 7:30 AM to 7:59 AM | 1,747 (15.5%) | 1,073 (13.6%) |
| 8:00 AM to 8:29 AM | 1,527 (13.6%) | 1,527 (19.4%) |
| 8:30 AM to 8:59 AM | 1,104 (9.8%) | 689 (8.8%) |
| 9:00 AM to 9:59 AM | 936 (8.3%) | 810 (10.3%) |
| 10:00 AM to 10:59 AM | 291 (2.6%) | 191 (2.4%) |
| 11:00 AM to 11:59 AM | 216 (1.9%) | 124 (1.6%) |
| 12:00 PM to 3:59 PM | 857 (7.6%) | 490 (6.2%) |
| 4:00 PM to 11:59 PM | 396 (3.5%) | 285 (3.6%) |
| Total | 11,253 (100.0%) | 7,869 (100.0%) |
Housing Occupancy in Draper
Occupancy by Ownership in Draper
Of the total 15,861 dwellings in Draper, owner-occupied units account for 11,586 (73.1%), while renter-occupied units make up 4,275 (27.0%).
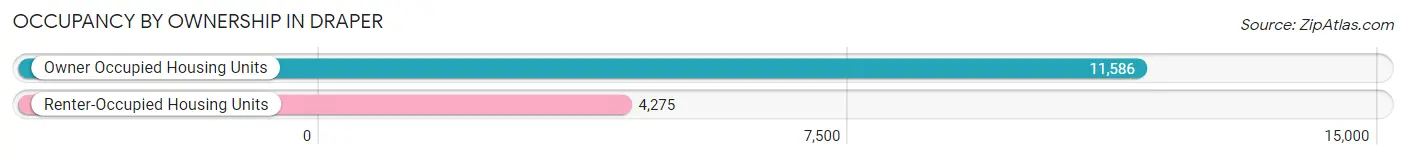
| Occupancy | # Housing Units | % Housing Units |
| Owner Occupied Housing Units | 11,586 | 73.1% |
| Renter-Occupied Housing Units | 4,275 | 27.0% |
| Total Occupied Housing Units | 15,861 | 100.0% |
Occupancy by Household Size in Draper
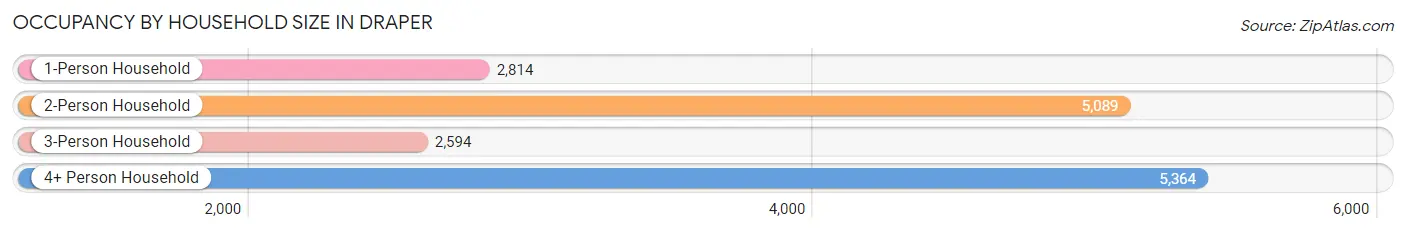
| Household Size | # Housing Units | % Housing Units |
| 1-Person Household | 2,814 | 17.7% |
| 2-Person Household | 5,089 | 32.1% |
| 3-Person Household | 2,594 | 16.4% |
| 4+ Person Household | 5,364 | 33.8% |
| Total Housing Units | 15,861 | 100.0% |
Occupancy by Ownership by Household Size in Draper
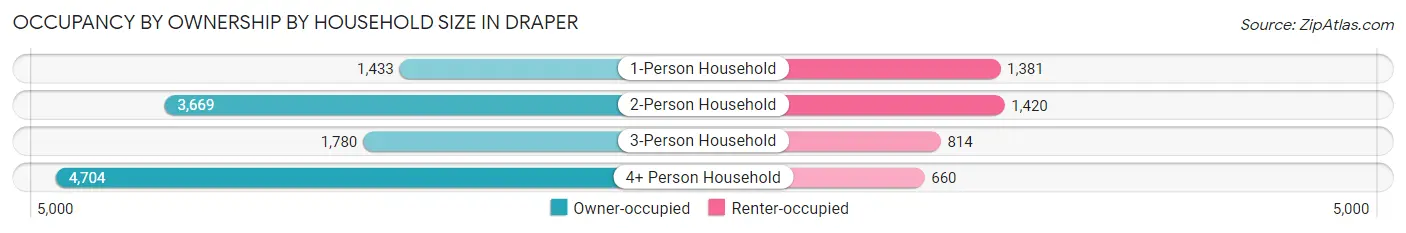
| Household Size | Owner-occupied | Renter-occupied |
| 1-Person Household | 1,433 (50.9%) | 1,381 (49.1%) |
| 2-Person Household | 3,669 (72.1%) | 1,420 (27.9%) |
| 3-Person Household | 1,780 (68.6%) | 814 (31.4%) |
| 4+ Person Household | 4,704 (87.7%) | 660 (12.3%) |
| Total Housing Units | 11,586 (73.1%) | 4,275 (27.0%) |
Occupancy by Educational Attainment in Draper
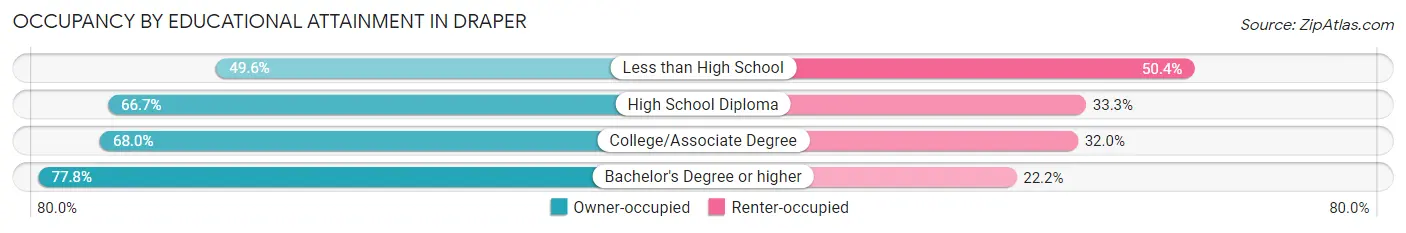
| Household Size | Owner-occupied | Renter-occupied |
| Less than High School | 116 (49.6%) | 118 (50.4%) |
| High School Diploma | 1,198 (66.7%) | 597 (33.3%) |
| College/Associate Degree | 3,385 (68.0%) | 1,591 (32.0%) |
| Bachelor's Degree or higher | 6,887 (77.8%) | 1,969 (22.2%) |
Occupancy by Age of Householder in Draper
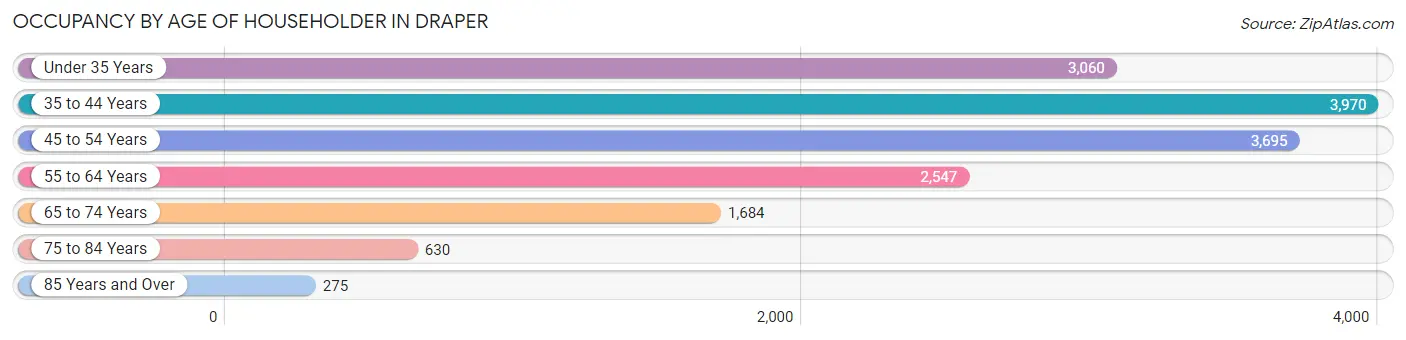
| Age Bracket | # Households | % Households |
| Under 35 Years | 3,060 | 19.3% |
| 35 to 44 Years | 3,970 | 25.0% |
| 45 to 54 Years | 3,695 | 23.3% |
| 55 to 64 Years | 2,547 | 16.1% |
| 65 to 74 Years | 1,684 | 10.6% |
| 75 to 84 Years | 630 | 4.0% |
| 85 Years and Over | 275 | 1.7% |
| Total | 15,861 | 100.0% |
Housing Finances in Draper
Median Income by Occupancy in Draper
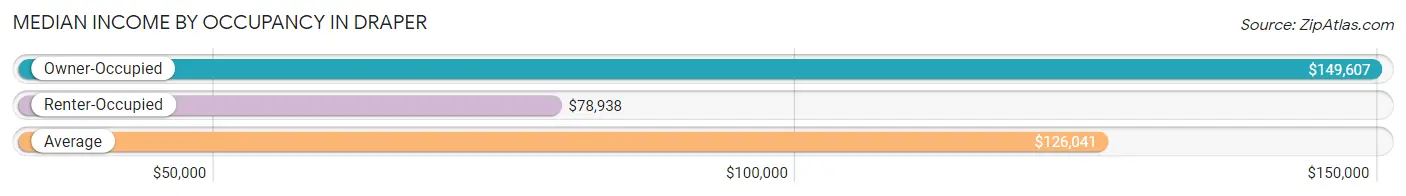
| Occupancy Type | # Households | Median Income |
| Owner-Occupied | 11,586 (73.1%) | $149,607 |
| Renter-Occupied | 4,275 (27.0%) | $78,938 |
| Average | 15,861 (100.0%) | $126,041 |
Occupancy by Householder Income Bracket in Draper
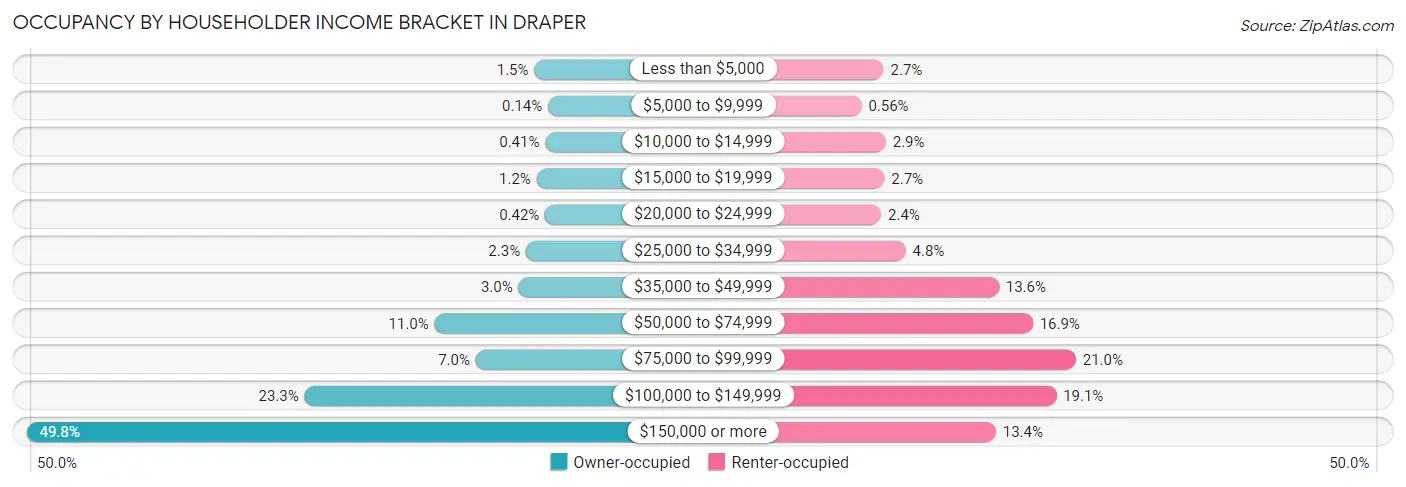
| Income Bracket | Owner-occupied | Renter-occupied |
| Less than $5,000 | 168 (1.5%) | 114 (2.7%) |
| $5,000 to $9,999 | 16 (0.1%) | 24 (0.6%) |
| $10,000 to $14,999 | 48 (0.4%) | 123 (2.9%) |
| $15,000 to $19,999 | 142 (1.2%) | 117 (2.7%) |
| $20,000 to $24,999 | 49 (0.4%) | 104 (2.4%) |
| $25,000 to $34,999 | 261 (2.2%) | 204 (4.8%) |
| $35,000 to $49,999 | 343 (3.0%) | 583 (13.6%) |
| $50,000 to $74,999 | 1,269 (11.0%) | 721 (16.9%) |
| $75,000 to $99,999 | 815 (7.0%) | 897 (21.0%) |
| $100,000 to $149,999 | 2,704 (23.3%) | 817 (19.1%) |
| $150,000 or more | 5,771 (49.8%) | 571 (13.4%) |
| Total | 11,586 (100.0%) | 4,275 (100.0%) |
Monthly Housing Cost Tiers in Draper
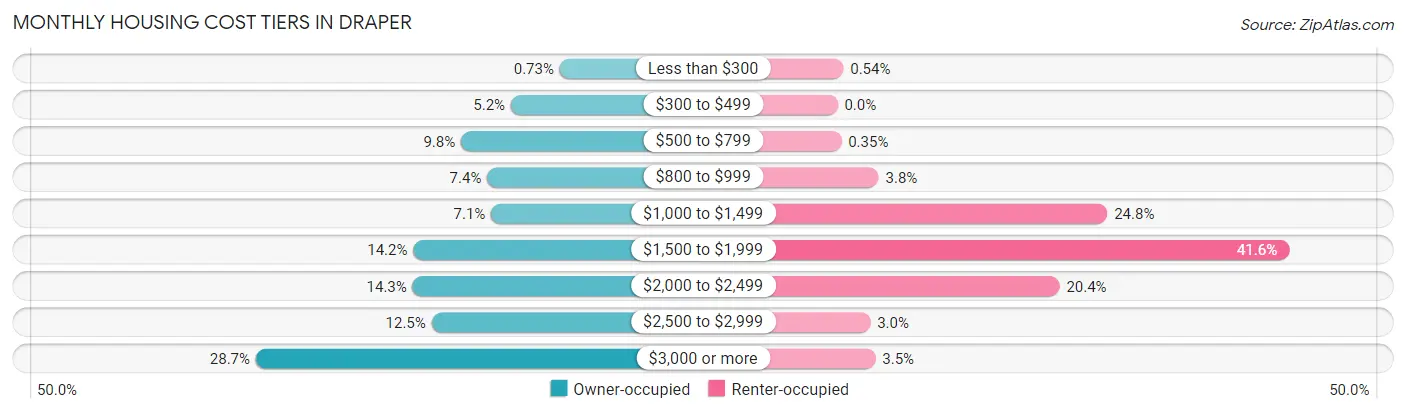
| Monthly Cost | Owner-occupied | Renter-occupied |
| Less than $300 | 85 (0.7%) | 23 (0.5%) |
| $300 to $499 | 606 (5.2%) | 0 (0.0%) |
| $500 to $799 | 1,138 (9.8%) | 15 (0.4%) |
| $800 to $999 | 859 (7.4%) | 162 (3.8%) |
| $1,000 to $1,499 | 817 (7.0%) | 1,062 (24.8%) |
| $1,500 to $1,999 | 1,648 (14.2%) | 1,777 (41.6%) |
| $2,000 to $2,499 | 1,655 (14.3%) | 874 (20.4%) |
| $2,500 to $2,999 | 1,452 (12.5%) | 129 (3.0%) |
| $3,000 or more | 3,326 (28.7%) | 149 (3.5%) |
| Total | 11,586 (100.0%) | 4,275 (100.0%) |
Physical Housing Characteristics in Draper
Housing Structures in Draper
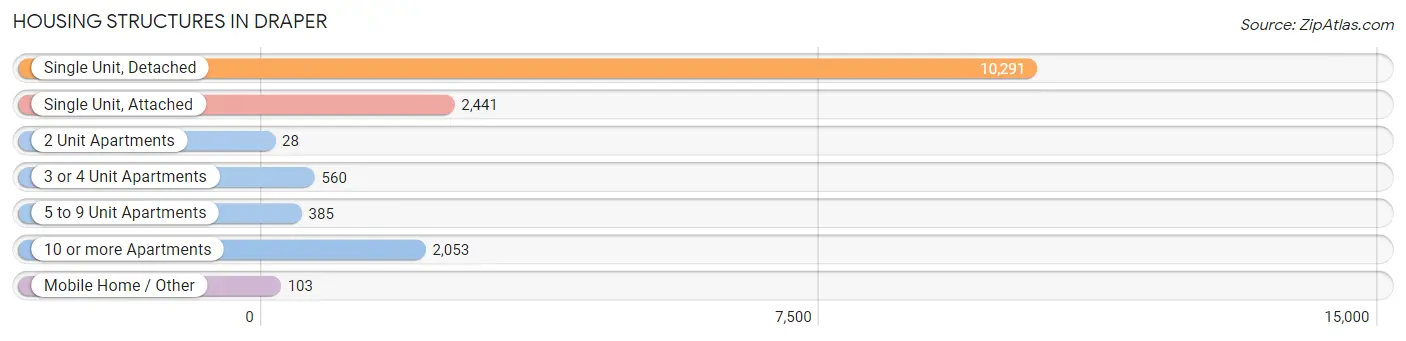
| Structure Type | # Housing Units | % Housing Units |
| Single Unit, Detached | 10,291 | 64.9% |
| Single Unit, Attached | 2,441 | 15.4% |
| 2 Unit Apartments | 28 | 0.2% |
| 3 or 4 Unit Apartments | 560 | 3.5% |
| 5 to 9 Unit Apartments | 385 | 2.4% |
| 10 or more Apartments | 2,053 | 12.9% |
| Mobile Home / Other | 103 | 0.6% |
| Total | 15,861 | 100.0% |
Housing Structures by Occupancy in Draper
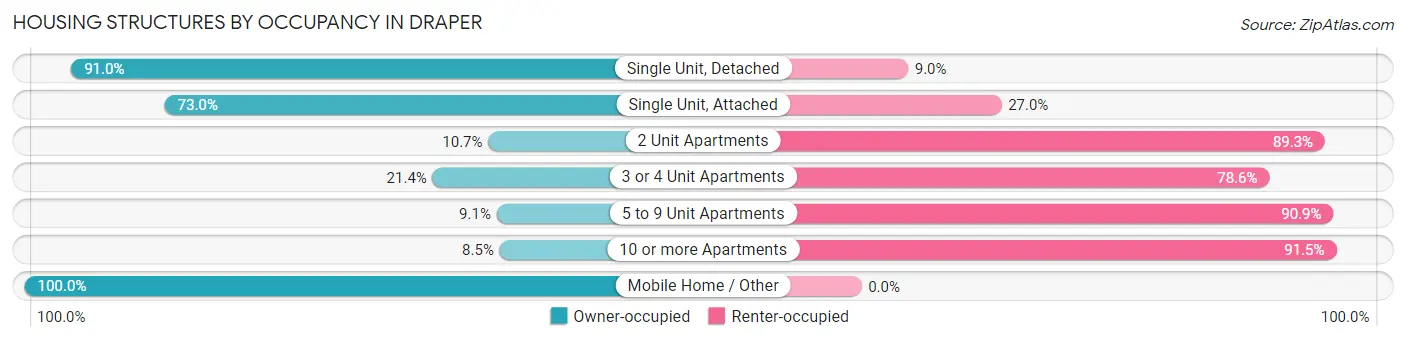
| Structure Type | Owner-occupied | Renter-occupied |
| Single Unit, Detached | 9,367 (91.0%) | 924 (9.0%) |
| Single Unit, Attached | 1,783 (73.0%) | 658 (27.0%) |
| 2 Unit Apartments | 3 (10.7%) | 25 (89.3%) |
| 3 or 4 Unit Apartments | 120 (21.4%) | 440 (78.6%) |
| 5 to 9 Unit Apartments | 35 (9.1%) | 350 (90.9%) |
| 10 or more Apartments | 175 (8.5%) | 1,878 (91.5%) |
| Mobile Home / Other | 103 (100.0%) | 0 (0.0%) |
| Total | 11,586 (73.1%) | 4,275 (27.0%) |
Housing Structures by Number of Rooms in Draper
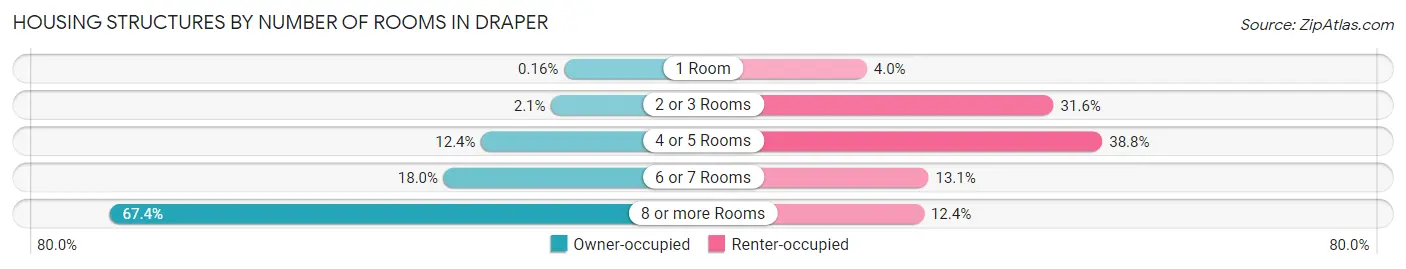
| Number of Rooms | Owner-occupied | Renter-occupied |
| 1 Room | 19 (0.2%) | 170 (4.0%) |
| 2 or 3 Rooms | 238 (2.1%) | 1,352 (31.6%) |
| 4 or 5 Rooms | 1,438 (12.4%) | 1,660 (38.8%) |
| 6 or 7 Rooms | 2,081 (18.0%) | 561 (13.1%) |
| 8 or more Rooms | 7,810 (67.4%) | 532 (12.4%) |
| Total | 11,586 (100.0%) | 4,275 (100.0%) |
Housing Structure by Heating Type in Draper
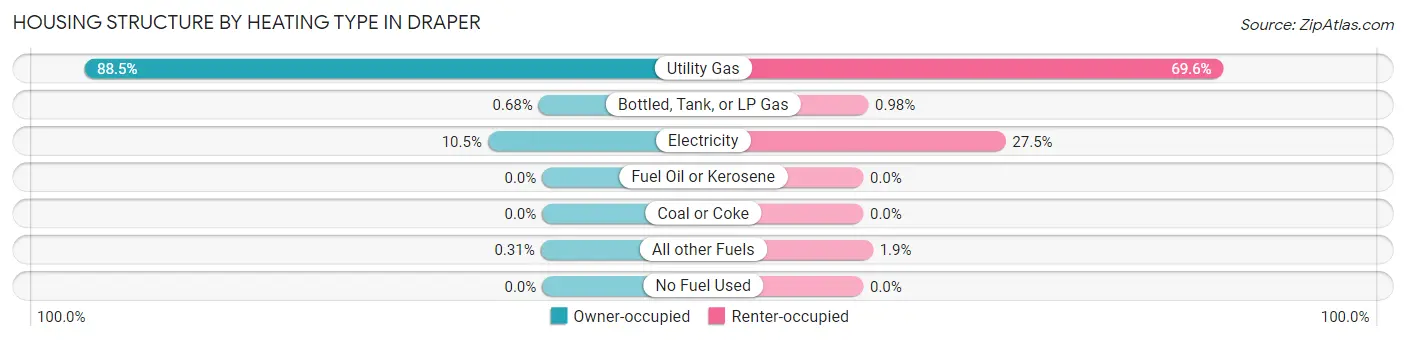
| Heating Type | Owner-occupied | Renter-occupied |
| Utility Gas | 10,255 (88.5%) | 2,977 (69.6%) |
| Bottled, Tank, or LP Gas | 79 (0.7%) | 42 (1.0%) |
| Electricity | 1,216 (10.5%) | 1,176 (27.5%) |
| Fuel Oil or Kerosene | 0 (0.0%) | 0 (0.0%) |
| Coal or Coke | 0 (0.0%) | 0 (0.0%) |
| All other Fuels | 36 (0.3%) | 80 (1.9%) |
| No Fuel Used | 0 (0.0%) | 0 (0.0%) |
| Total | 11,586 (100.0%) | 4,275 (100.0%) |
Household Vehicle Usage in Draper
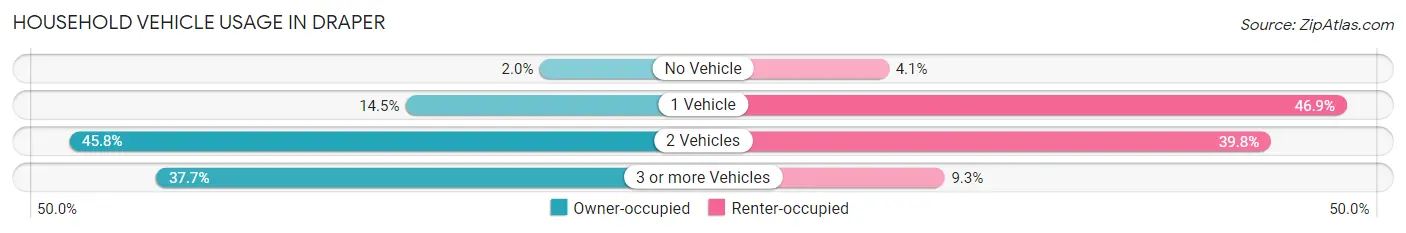
| Vehicles per Household | Owner-occupied | Renter-occupied |
| No Vehicle | 227 (2.0%) | 175 (4.1%) |
| 1 Vehicle | 1,677 (14.5%) | 2,003 (46.9%) |
| 2 Vehicles | 5,311 (45.8%) | 1,700 (39.8%) |
| 3 or more Vehicles | 4,371 (37.7%) | 397 (9.3%) |
| Total | 11,586 (100.0%) | 4,275 (100.0%) |
Real Estate & Mortgages in Draper
Real Estate and Mortgage Overview in Draper
| Characteristic | Without Mortgage | With Mortgage |
| Housing Units | 2,806 | 8,780 |
| Median Property Value | $663,000 | $663,500 |
| Median Household Income | $114,524 | $4,801 |
| Monthly Housing Costs | $712 | $3,277 |
| Real Estate Taxes | $3,445 | $80 |
Property Value by Mortgage Status in Draper
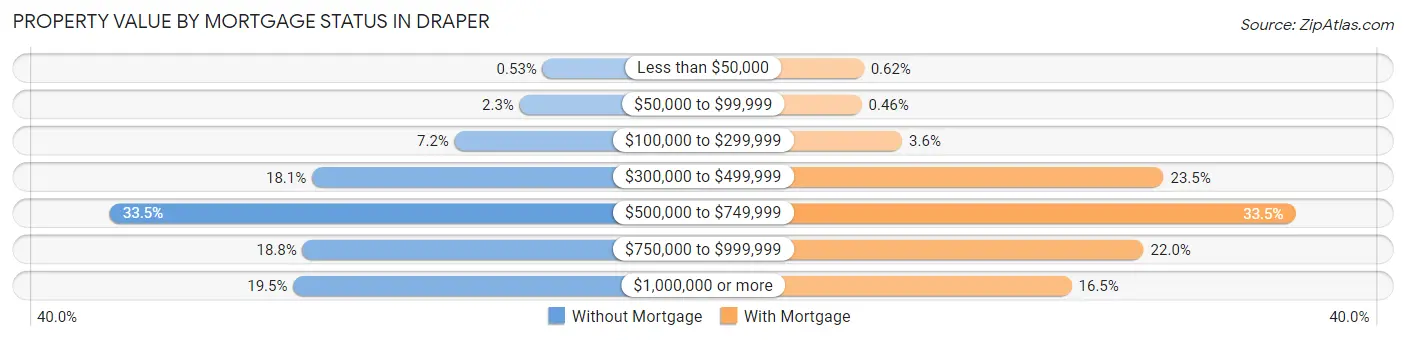
| Property Value | Without Mortgage | With Mortgage |
| Less than $50,000 | 15 (0.5%) | 54 (0.6%) |
| $50,000 to $99,999 | 64 (2.3%) | 40 (0.5%) |
| $100,000 to $299,999 | 203 (7.2%) | 312 (3.5%) |
| $300,000 to $499,999 | 508 (18.1%) | 2,061 (23.5%) |
| $500,000 to $749,999 | 940 (33.5%) | 2,941 (33.5%) |
| $750,000 to $999,999 | 528 (18.8%) | 1,927 (22.0%) |
| $1,000,000 or more | 548 (19.5%) | 1,445 (16.5%) |
| Total | 2,806 (100.0%) | 8,780 (100.0%) |
Household Income by Mortgage Status in Draper
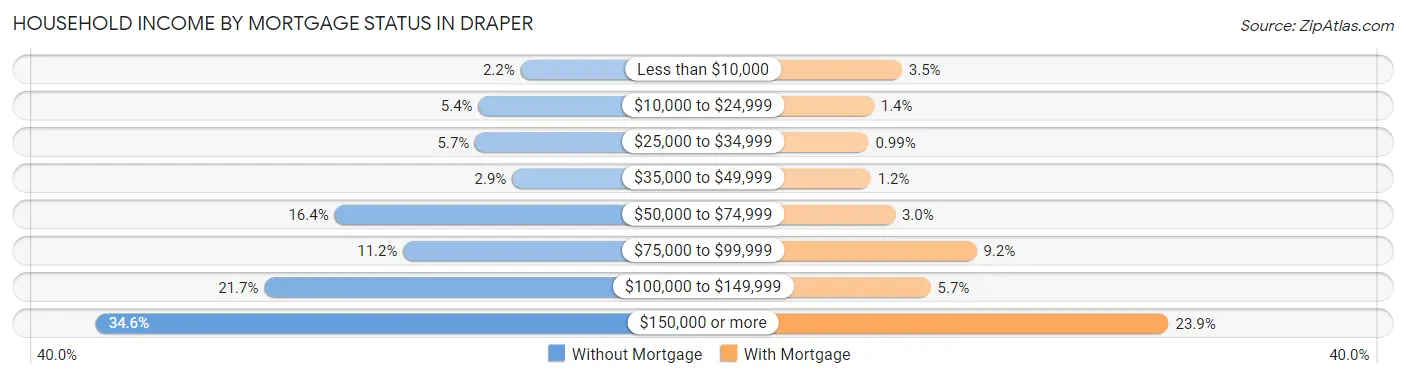
| Household Income | Without Mortgage | With Mortgage |
| Less than $10,000 | 62 (2.2%) | 310 (3.5%) |
| $10,000 to $24,999 | 152 (5.4%) | 122 (1.4%) |
| $25,000 to $34,999 | 159 (5.7%) | 87 (1.0%) |
| $35,000 to $49,999 | 80 (2.9%) | 102 (1.2%) |
| $50,000 to $74,999 | 460 (16.4%) | 263 (3.0%) |
| $75,000 to $99,999 | 313 (11.2%) | 809 (9.2%) |
| $100,000 to $149,999 | 610 (21.7%) | 502 (5.7%) |
| $150,000 or more | 970 (34.6%) | 2,094 (23.8%) |
| Total | 2,806 (100.0%) | 8,780 (100.0%) |
Property Value to Household Income Ratio in Draper
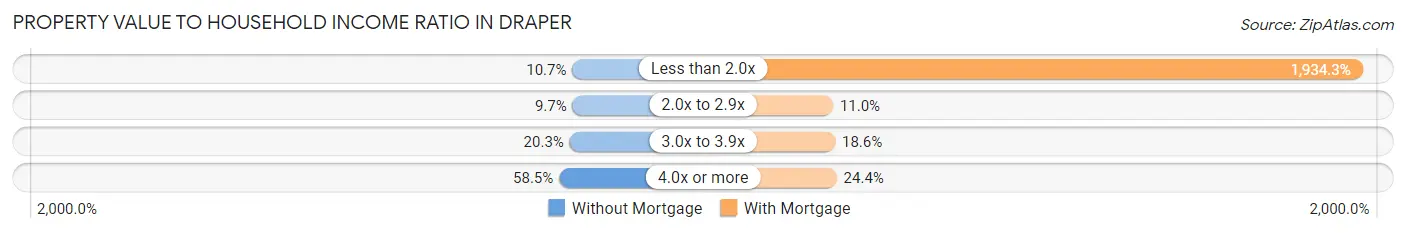
| Value-to-Income Ratio | Without Mortgage | With Mortgage |
| Less than 2.0x | 301 (10.7%) | 169,833 (1,934.3%) |
| 2.0x to 2.9x | 271 (9.7%) | 965 (11.0%) |
| 3.0x to 3.9x | 569 (20.3%) | 1,637 (18.6%) |
| 4.0x or more | 1,641 (58.5%) | 2,146 (24.4%) |
| Total | 2,806 (100.0%) | 8,780 (100.0%) |
Real Estate Taxes by Mortgage Status in Draper
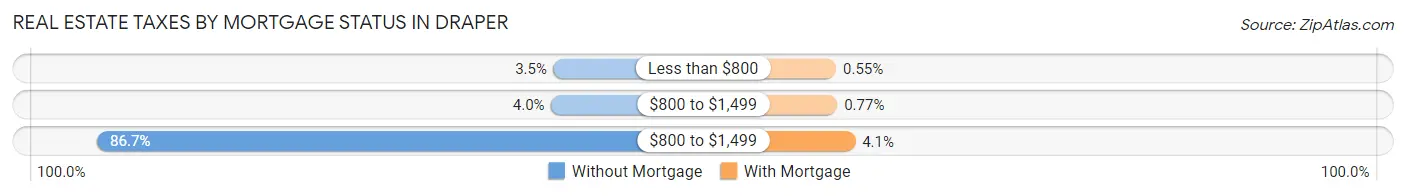
| Property Taxes | Without Mortgage | With Mortgage |
| Less than $800 | 99 (3.5%) | 48 (0.5%) |
| $800 to $1,499 | 111 (4.0%) | 68 (0.8%) |
| $800 to $1,499 | 2,434 (86.7%) | 356 (4.1%) |
| Total | 2,806 (100.0%) | 8,780 (100.0%) |
Health & Disability in Draper
Health Insurance Coverage by Age in Draper
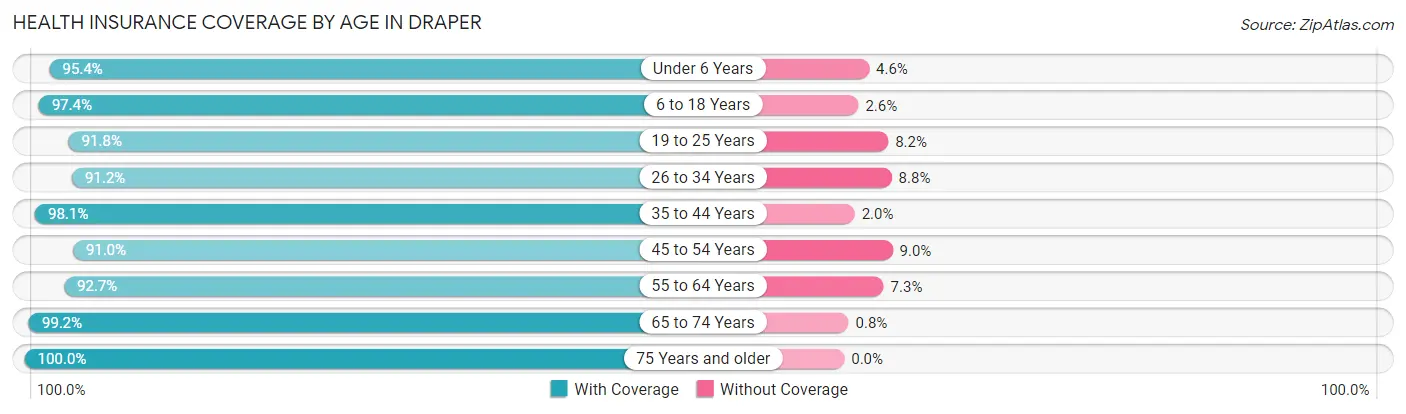
| Age Bracket | With Coverage | Without Coverage |
| Under 6 Years | 3,794 (95.4%) | 184 (4.6%) |
| 6 to 18 Years | 11,633 (97.4%) | 316 (2.6%) |
| 19 to 25 Years | 3,612 (91.8%) | 322 (8.2%) |
| 26 to 34 Years | 4,988 (91.2%) | 483 (8.8%) |
| 35 to 44 Years | 7,484 (98.1%) | 149 (1.9%) |
| 45 to 54 Years | 5,826 (91.0%) | 577 (9.0%) |
| 55 to 64 Years | 4,409 (92.7%) | 349 (7.3%) |
| 65 to 74 Years | 2,845 (99.2%) | 23 (0.8%) |
| 75 Years and older | 1,515 (100.0%) | 0 (0.0%) |
| Total | 46,106 (95.1%) | 2,403 (5.0%) |
Health Insurance Coverage by Citizenship Status in Draper
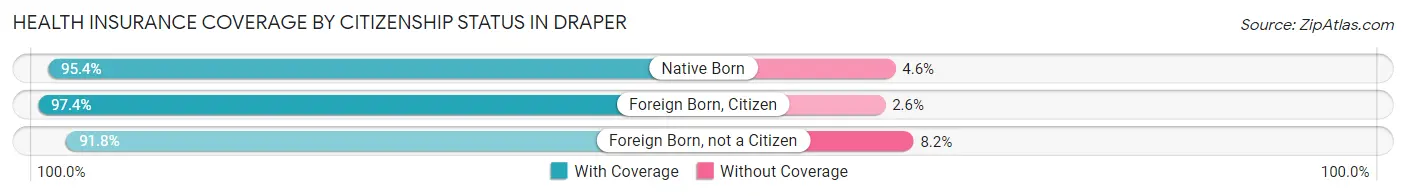
| Citizenship Status | With Coverage | Without Coverage |
| Native Born | 3,794 (95.4%) | 184 (4.6%) |
| Foreign Born, Citizen | 11,633 (97.4%) | 316 (2.6%) |
| Foreign Born, not a Citizen | 3,612 (91.8%) | 322 (8.2%) |
Health Insurance Coverage by Household Income in Draper
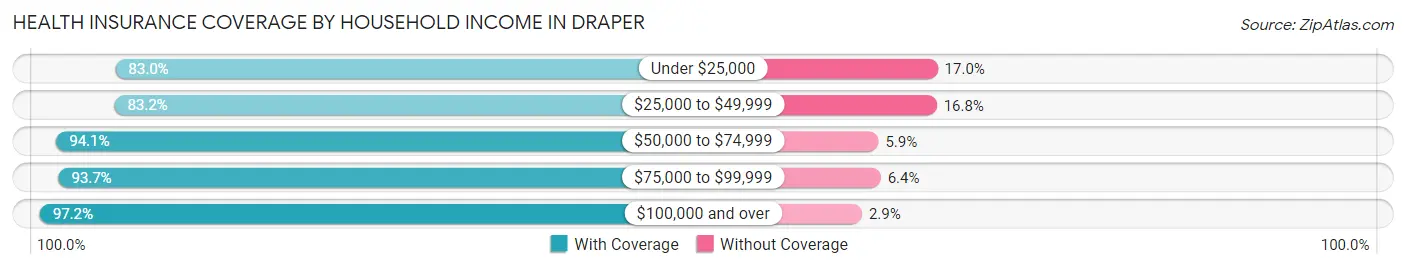
| Household Income | With Coverage | Without Coverage |
| Under $25,000 | 1,604 (83.0%) | 329 (17.0%) |
| $25,000 to $49,999 | 2,568 (83.2%) | 520 (16.8%) |
| $50,000 to $74,999 | 3,738 (94.1%) | 236 (5.9%) |
| $75,000 to $99,999 | 4,250 (93.6%) | 288 (6.4%) |
| $100,000 and over | 33,909 (97.2%) | 993 (2.9%) |
Public vs Private Health Insurance Coverage by Age in Draper
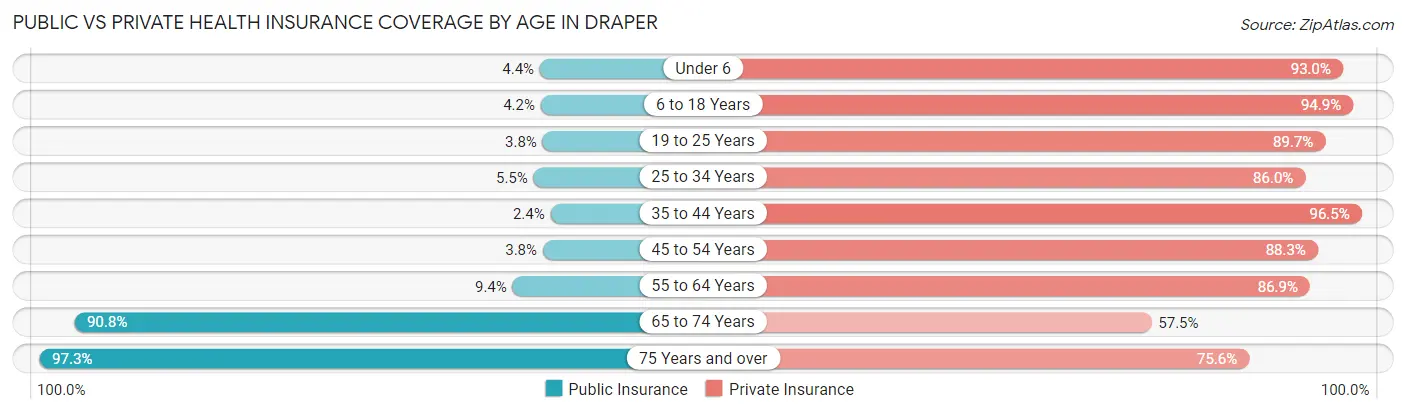
| Age Bracket | Public Insurance | Private Insurance |
| Under 6 | 173 (4.3%) | 3,699 (93.0%) |
| 6 to 18 Years | 501 (4.2%) | 11,338 (94.9%) |
| 19 to 25 Years | 151 (3.8%) | 3,529 (89.7%) |
| 25 to 34 Years | 302 (5.5%) | 4,705 (86.0%) |
| 35 to 44 Years | 182 (2.4%) | 7,363 (96.5%) |
| 45 to 54 Years | 243 (3.8%) | 5,656 (88.3%) |
| 55 to 64 Years | 448 (9.4%) | 4,133 (86.9%) |
| 65 to 74 Years | 2,605 (90.8%) | 1,648 (57.5%) |
| 75 Years and over | 1,474 (97.3%) | 1,145 (75.6%) |
| Total | 6,079 (12.5%) | 43,216 (89.1%) |
Disability Status by Sex by Age in Draper
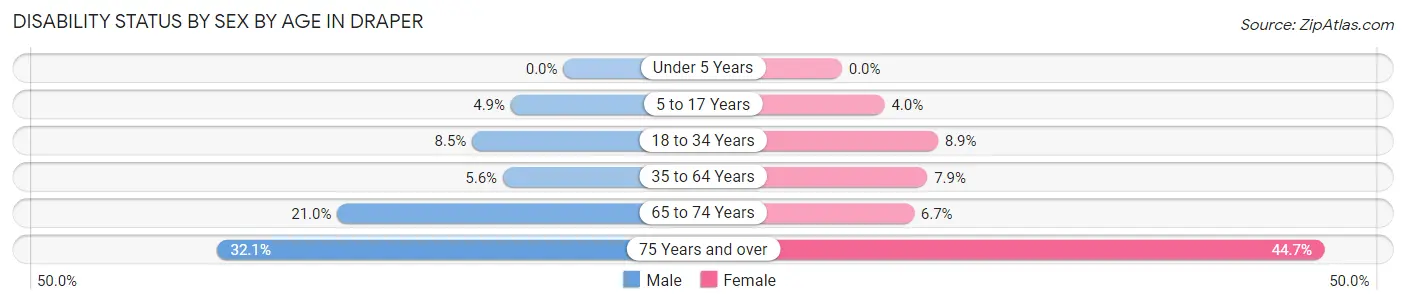
| Age Bracket | Male | Female |
| Under 5 Years | 0 (0.0%) | 0 (0.0%) |
| 5 to 17 Years | 302 (4.9%) | 220 (4.0%) |
| 18 to 34 Years | 434 (8.5%) | 446 (8.9%) |
| 35 to 64 Years | 528 (5.6%) | 744 (7.9%) |
| 65 to 74 Years | 266 (21.0%) | 107 (6.7%) |
| 75 Years and over | 215 (32.1%) | 378 (44.7%) |
Disability Class by Sex by Age in Draper
Disability Class: Hearing Difficulty
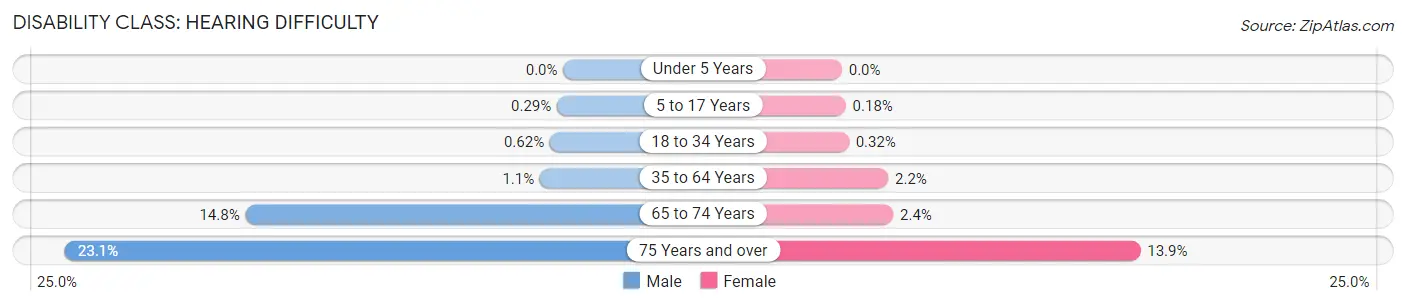
| Age Bracket | Male | Female |
| Under 5 Years | 0 (0.0%) | 0 (0.0%) |
| 5 to 17 Years | 18 (0.3%) | 10 (0.2%) |
| 18 to 34 Years | 32 (0.6%) | 16 (0.3%) |
| 35 to 64 Years | 102 (1.1%) | 202 (2.1%) |
| 65 to 74 Years | 187 (14.7%) | 38 (2.4%) |
| 75 Years and over | 155 (23.1%) | 117 (13.9%) |
Disability Class: Vision Difficulty
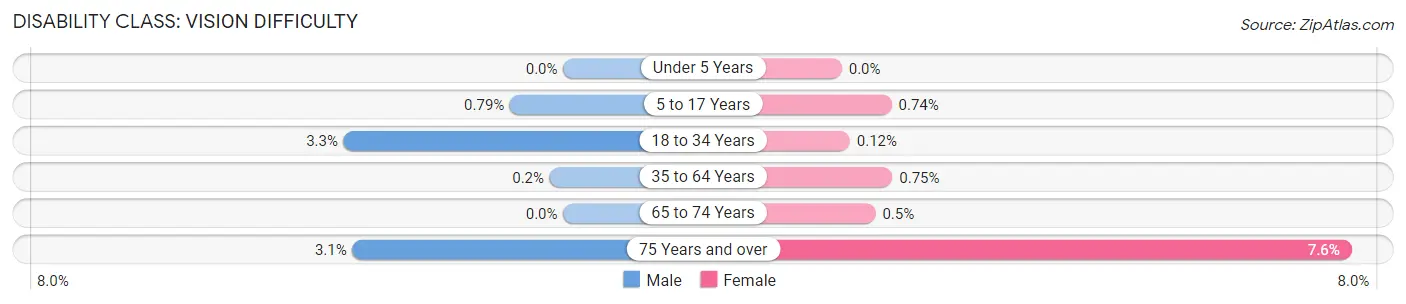
| Age Bracket | Male | Female |
| Under 5 Years | 0 (0.0%) | 0 (0.0%) |
| 5 to 17 Years | 49 (0.8%) | 41 (0.7%) |
| 18 to 34 Years | 167 (3.3%) | 6 (0.1%) |
| 35 to 64 Years | 19 (0.2%) | 70 (0.7%) |
| 65 to 74 Years | 0 (0.0%) | 8 (0.5%) |
| 75 Years and over | 21 (3.1%) | 64 (7.6%) |
Disability Class: Cognitive Difficulty
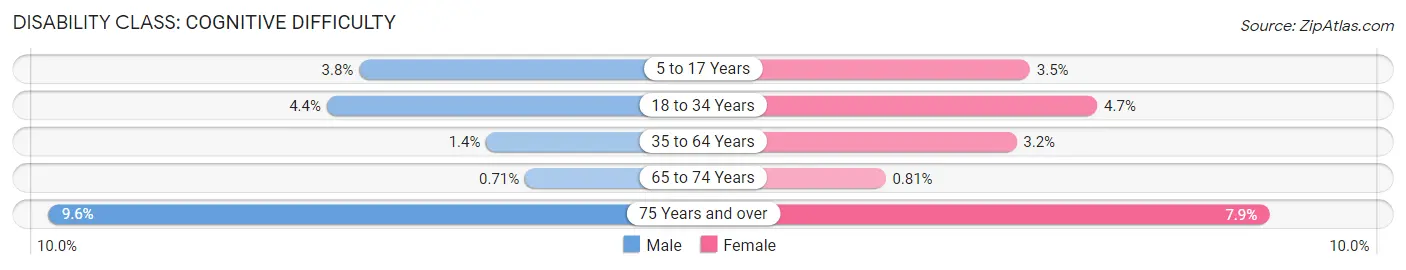
| Age Bracket | Male | Female |
| 5 to 17 Years | 235 (3.8%) | 194 (3.5%) |
| 18 to 34 Years | 225 (4.4%) | 237 (4.7%) |
| 35 to 64 Years | 135 (1.4%) | 304 (3.2%) |
| 65 to 74 Years | 9 (0.7%) | 13 (0.8%) |
| 75 Years and over | 64 (9.6%) | 67 (7.9%) |
Disability Class: Ambulatory Difficulty
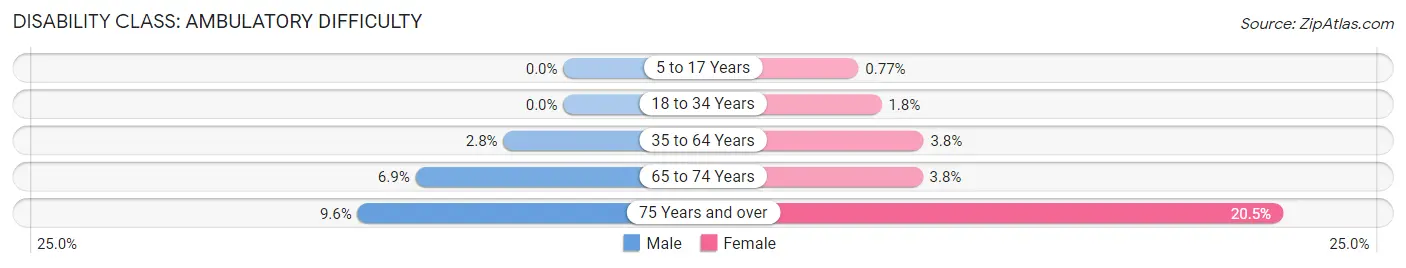
| Age Bracket | Male | Female |
| 5 to 17 Years | 0 (0.0%) | 43 (0.8%) |
| 18 to 34 Years | 0 (0.0%) | 92 (1.8%) |
| 35 to 64 Years | 262 (2.8%) | 356 (3.8%) |
| 65 to 74 Years | 87 (6.9%) | 60 (3.7%) |
| 75 Years and over | 64 (9.6%) | 173 (20.5%) |
Disability Class: Self-Care Difficulty
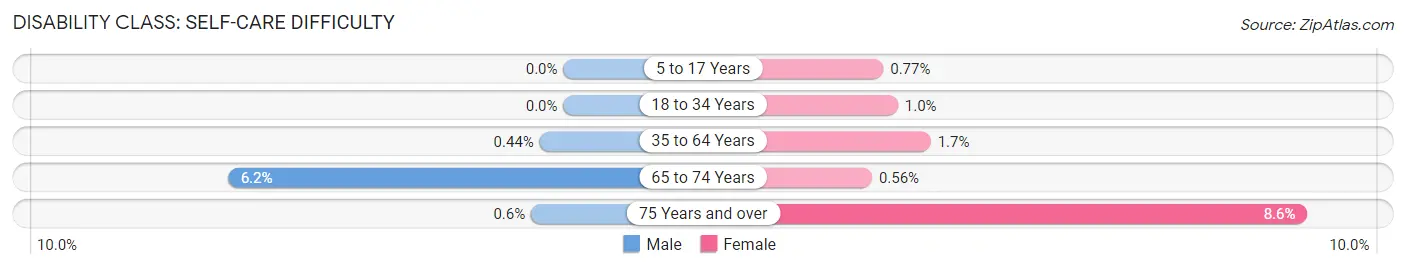
| Age Bracket | Male | Female |
| 5 to 17 Years | 0 (0.0%) | 43 (0.8%) |
| 18 to 34 Years | 0 (0.0%) | 52 (1.0%) |
| 35 to 64 Years | 41 (0.4%) | 155 (1.7%) |
| 65 to 74 Years | 79 (6.2%) | 9 (0.6%) |
| 75 Years and over | 4 (0.6%) | 73 (8.6%) |
Technology Access in Draper
Computing Device Access in Draper
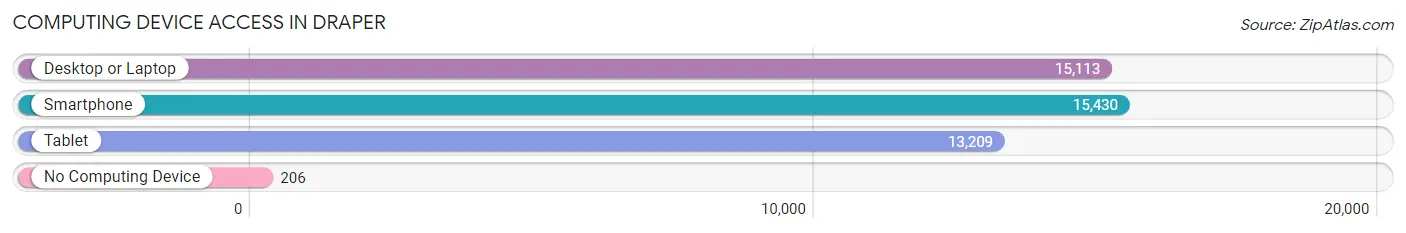
| Device Type | # Households | % Households |
| Desktop or Laptop | 15,113 | 95.3% |
| Smartphone | 15,430 | 97.3% |
| Tablet | 13,209 | 83.3% |
| No Computing Device | 206 | 1.3% |
| Total | 15,861 | 100.0% |
Internet Access in Draper
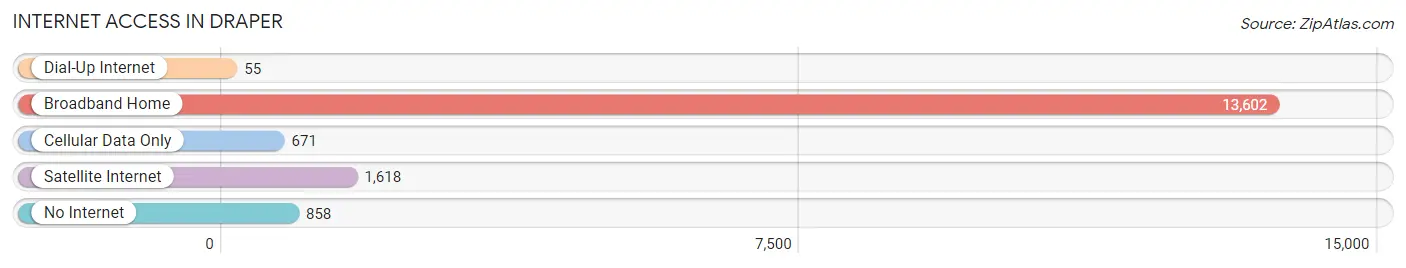
| Internet Type | # Households | % Households |
| Dial-Up Internet | 55 | 0.4% |
| Broadband Home | 13,602 | 85.8% |
| Cellular Data Only | 671 | 4.2% |
| Satellite Internet | 1,618 | 10.2% |
| No Internet | 858 | 5.4% |
| Total | 15,861 | 100.0% |
Draper Summary
Draper, Utah is a city located in Salt Lake County, Utah, United States. It is part of the Salt Lake City metropolitan area. The population was 42,274 at the 2010 census, making it the sixth-largest city in Utah.
History
Draper was first settled in 1849 by William Draper III, a Mormon pioneer. The city was named after him. Draper was incorporated in 1978 and has since grown to become one of the largest cities in the Salt Lake Valley.
Geography
Draper is located in the south-central part of Salt Lake County, about 20 miles south of Salt Lake City. It is bordered by Riverton and Bluffdale to the north, South Jordan to the east, Sandy to the south, and Lehi to the west. The city covers an area of about 33 square miles.
The terrain of Draper is mostly flat, with some hills in the western part of the city. The city is located in the Wasatch Front, a region of the Rocky Mountains that stretches from northern Utah to southern Idaho.
Climate
Draper has a semi-arid climate, with hot summers and cold winters. The average high temperature in July is 90°F, and the average low temperature in January is 22°F. The city receives an average of 17 inches of precipitation per year.
Demographics
As of the 2010 census, there were 42,274 people, 13,717 households, and 11,068 families living in Draper. The population density was 1,279.3 people per square mile. The racial makeup of the city was 87.2% White, 2.2% African American, 0.7% Native American, 2.7% Asian, 0.2% Pacific Islander, 4.7% from other races, and 2.5% from two or more races. Hispanic or Latino of any race were 8.7% of the population.
Economy
Draper is home to several major employers, including Adobe, eBay, Goldman Sachs, and Oracle. The city also has a thriving retail sector, with several shopping centers and malls.
The median household income in Draper was $87,845 in 2019, and the median family income was $97,845. The per capita income was $37,845.
Conclusion
Draper, Utah is a city located in Salt Lake County, Utah, United States. It is part of the Salt Lake City metropolitan area. The city was first settled in 1849 by William Draper III, a Mormon pioneer, and has since grown to become one of the largest cities in the Salt Lake Valley. Draper has a semi-arid climate, with hot summers and cold winters. As of the 2010 census, there were 42,274 people, 13,717 households, and 11,068 families living in Draper. The city is home to several major employers, including Adobe, eBay, Goldman Sachs, and Oracle. The median household income in Draper was $87,845 in 2019, and the median family income was $97,845.
Common Questions
What is Per Capita Income in Draper?
Per Capita income in Draper is $52,914.
What is the Median Family Income in Draper?
Median Family Income in Draper is $137,558.
What is the Median Household income in Draper?
Median Household Income in Draper is $126,041.
What is Income or Wage Gap in Draper?
Income or Wage Gap in Draper is 48.9%.
Women in Draper earn 51.1 cents for every dollar earned by a man.
What is Family Income Deficit in Draper?
Family Income Deficit in Draper is $12,270.
Families that are below poverty line in Draper earn $12,270 less on average than the poverty threshold level.
What is Inequality or Gini Index in Draper?
Inequality or Gini Index in Draper is 0.43.
What is the Total Population of Draper?
Total Population of Draper is 50,635.
What is the Total Male Population of Draper?
Total Male Population of Draper is 26,525.
What is the Total Female Population of Draper?
Total Female Population of Draper is 24,110.
What is the Ratio of Males per 100 Females in Draper?
There are 110.02 Males per 100 Females in Draper.
What is the Ratio of Females per 100 Males in Draper?
There are 90.90 Females per 100 Males in Draper.
What is the Median Population Age in Draper?
Median Population Age in Draper is 33.6 Years.
What is the Average Family Size in Draper
Average Family Size in Draper is 3.5 People.
What is the Average Household Size in Draper
Average Household Size in Draper is 3.0 People.
How Large is the Labor Force in Draper?
There are 24,961 People in the Labor Forcein in Draper.
What is the Percentage of People in the Labor Force in Draper?
66.8% of People are in the Labor Force in Draper.
What is the Unemployment Rate in Draper?
Unemployment Rate in Draper is 2.2%.