Housatonic, MA Map & Demographics
Housatonic Map
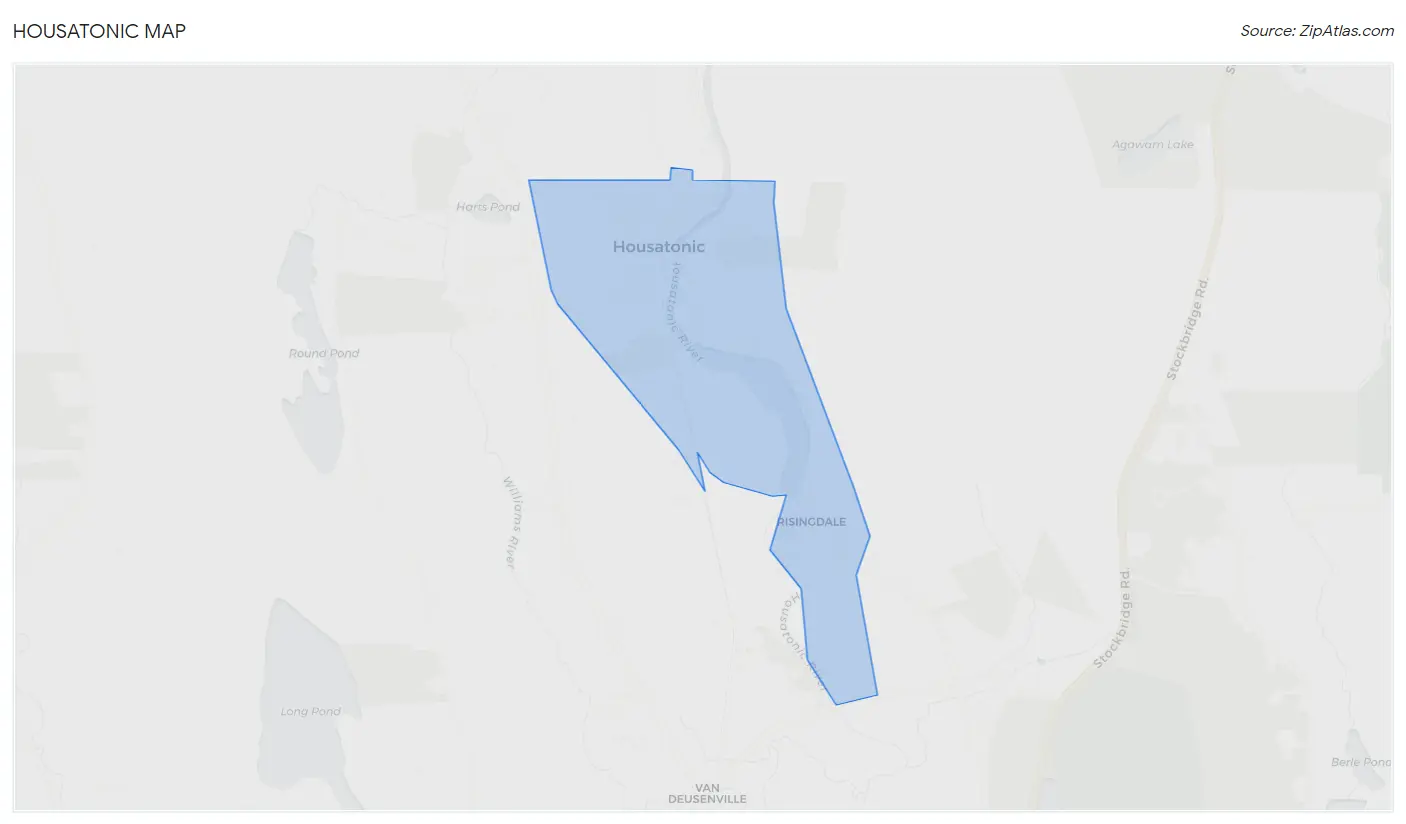
Housatonic Overview
$66,455
PER CAPITA INCOME
$138,323
AVG FAMILY INCOME
$80,000
AVG HOUSEHOLD INCOME
0.48
INEQUALITY / GINI INDEX
985
TOTAL POPULATION
398
MALE POPULATION
587
FEMALE POPULATION
67.80
MALES / 100 FEMALES
147.49
FEMALES / 100 MALES
54.7
MEDIAN AGE
2.3
AVG FAMILY SIZE
1.9
AVG HOUSEHOLD SIZE
758
LABOR FORCE [ PEOPLE ]
84.2%
PERCENT IN LABOR FORCE
Housatonic Zip Codes
Housatonic Area Codes
Income in Housatonic
Income Overview in Housatonic
Per Capita Income in Housatonic is $66,455, while median incomes of families and households are $138,323 and $80,000 respectively.
| Characteristic | Number | Measure |
| Per Capita Income | 985 | $66,455 |
| Median Family Income | 347 | $138,323 |
| Mean Family Income | 347 | $174,475 |
| Median Household Income | 522 | $80,000 |
| Mean Household Income | 522 | $127,053 |
| Income Deficit | 347 | $0 |
| Wage / Income Gap (%) | 985 | 0.00% |
| Wage / Income Gap ($) | 985 | 100.00¢ per $1 |
| Gini / Inequality Index | 985 | 0.48 |
Earnings by Sex in Housatonic
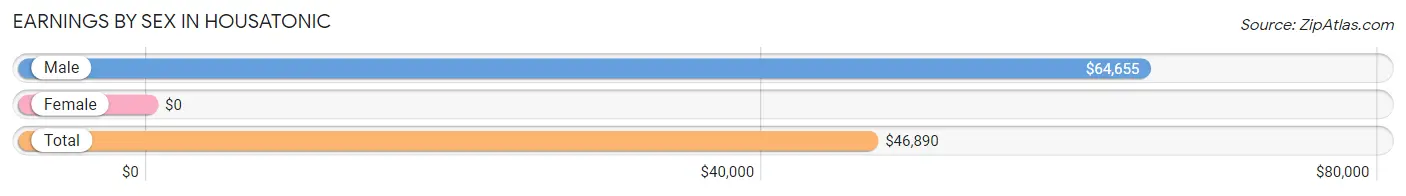
| Sex | Number | Average Earnings |
| Male | 362 (47.8%) | $64,655 |
| Female | 396 (52.2%) | $0 |
| Total | 758 (100.0%) | $46,890 |
Earnings by Sex by Income Bracket in Housatonic
The most common earnings brackets in Housatonic are $100,000+ for men (130 | 35.9%) and $100,000+ for women (75 | 18.9%).
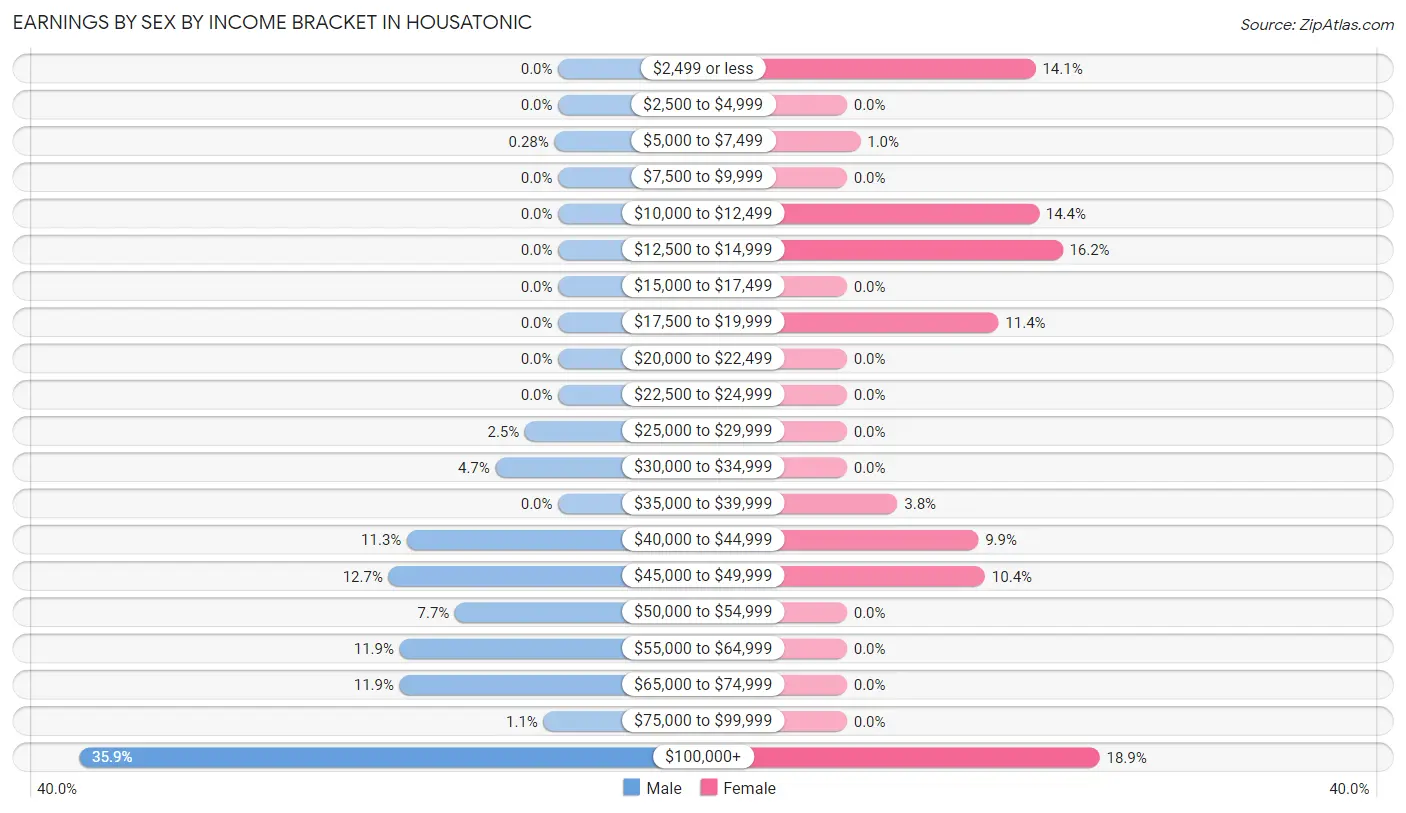
| Income | Male | Female |
| $2,499 or less | 0 (0.0%) | 56 (14.1%) |
| $2,500 to $4,999 | 0 (0.0%) | 0 (0.0%) |
| $5,000 to $7,499 | 1 (0.3%) | 4 (1.0%) |
| $7,500 to $9,999 | 0 (0.0%) | 0 (0.0%) |
| $10,000 to $12,499 | 0 (0.0%) | 57 (14.4%) |
| $12,500 to $14,999 | 0 (0.0%) | 64 (16.2%) |
| $15,000 to $17,499 | 0 (0.0%) | 0 (0.0%) |
| $17,500 to $19,999 | 0 (0.0%) | 45 (11.4%) |
| $20,000 to $22,499 | 0 (0.0%) | 0 (0.0%) |
| $22,500 to $24,999 | 0 (0.0%) | 0 (0.0%) |
| $25,000 to $29,999 | 9 (2.5%) | 0 (0.0%) |
| $30,000 to $34,999 | 17 (4.7%) | 0 (0.0%) |
| $35,000 to $39,999 | 0 (0.0%) | 15 (3.8%) |
| $40,000 to $44,999 | 41 (11.3%) | 39 (9.9%) |
| $45,000 to $49,999 | 46 (12.7%) | 41 (10.3%) |
| $50,000 to $54,999 | 28 (7.7%) | 0 (0.0%) |
| $55,000 to $64,999 | 43 (11.9%) | 0 (0.0%) |
| $65,000 to $74,999 | 43 (11.9%) | 0 (0.0%) |
| $75,000 to $99,999 | 4 (1.1%) | 0 (0.0%) |
| $100,000+ | 130 (35.9%) | 75 (18.9%) |
| Total | 362 (100.0%) | 396 (100.0%) |
Earnings by Sex by Educational Attainment in Housatonic
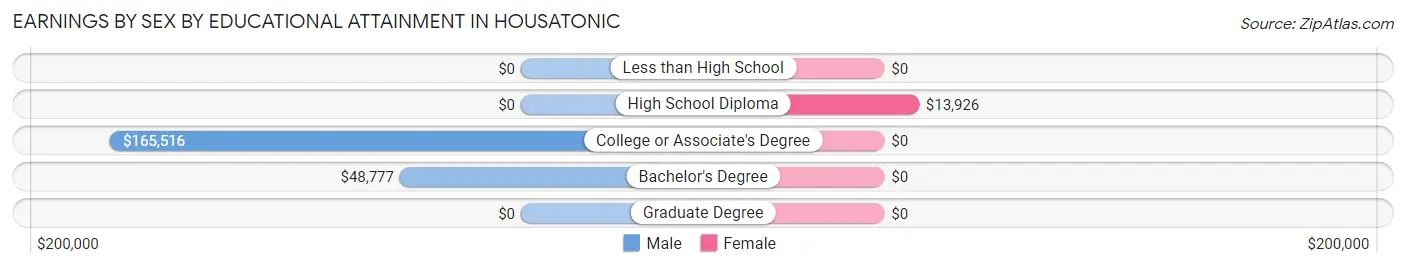
| Educational Attainment | Male Income | Female Income |
| Less than High School | - | - |
| High School Diploma | - | - |
| College or Associate's Degree | $165,516 | $0 |
| Bachelor's Degree | $48,777 | $0 |
| Graduate Degree | - | - |
| Total | $64,655 | $0 |
Family Income in Housatonic
Family Income Brackets in Housatonic
According to the Housatonic family income data, there are 146 families falling into the $200,000+ income range, which is the most common income bracket and makes up 42.1% of all families.
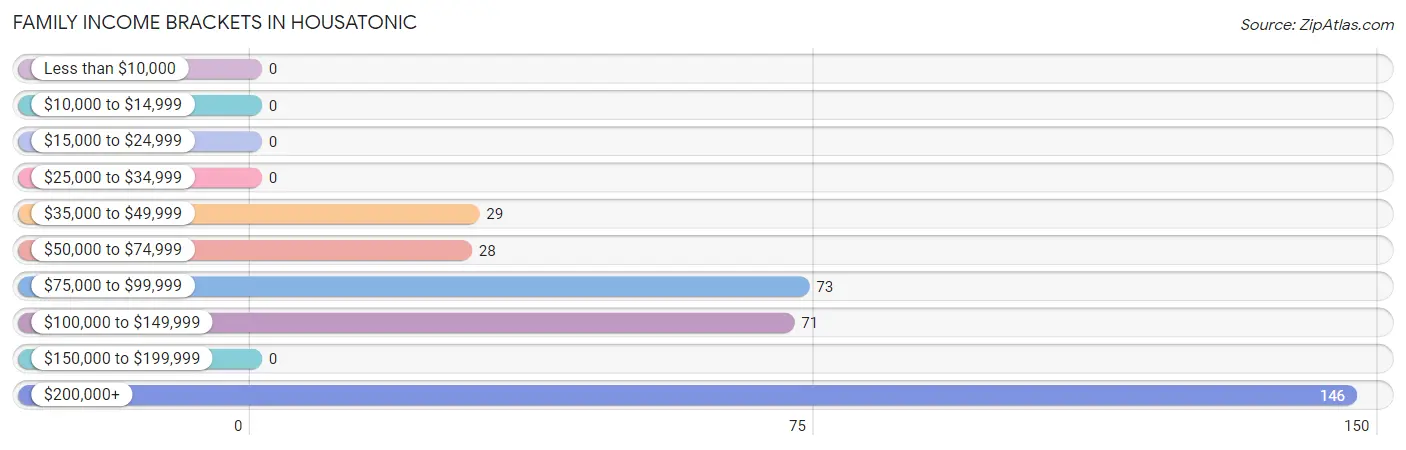
| Income Bracket | # Families | % Families |
| Less than $10,000 | 0 | 0.0% |
| $10,000 to $14,999 | 0 | 0.0% |
| $15,000 to $24,999 | 0 | 0.0% |
| $25,000 to $34,999 | 0 | 0.0% |
| $35,000 to $49,999 | 29 | 8.4% |
| $50,000 to $74,999 | 28 | 8.1% |
| $75,000 to $99,999 | 73 | 21.0% |
| $100,000 to $149,999 | 71 | 20.5% |
| $150,000 to $199,999 | 0 | 0.0% |
| $200,000+ | 146 | 42.1% |
Family Income by Famaliy Size in Housatonic
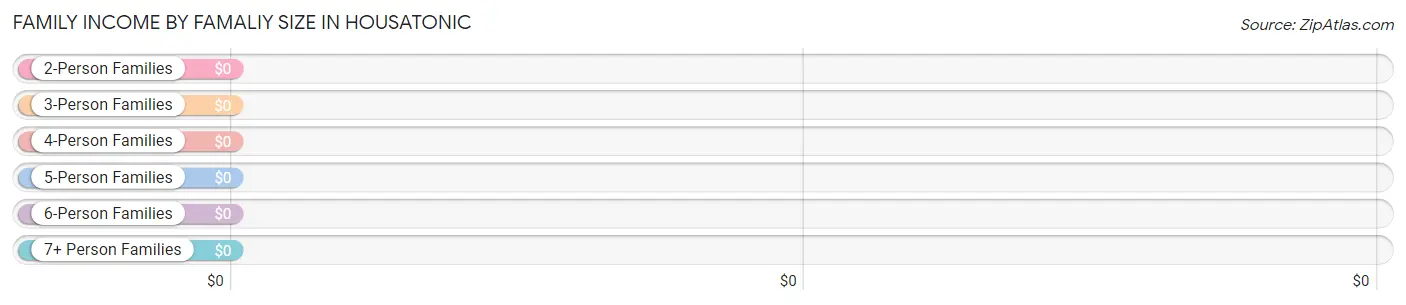
| Income Bracket | # Families | Median Income |
| 2-Person Families | 260 (74.9%) | $0 |
| 3-Person Families | 41 (11.8%) | $0 |
| 4-Person Families | 42 (12.1%) | $0 |
| 5-Person Families | 4 (1.1%) | $0 |
| 6-Person Families | 0 (0.0%) | $0 |
| 7+ Person Families | 0 (0.0%) | $0 |
| Total | 347 (100.0%) | $138,323 |
Family Income by Number of Earners in Housatonic
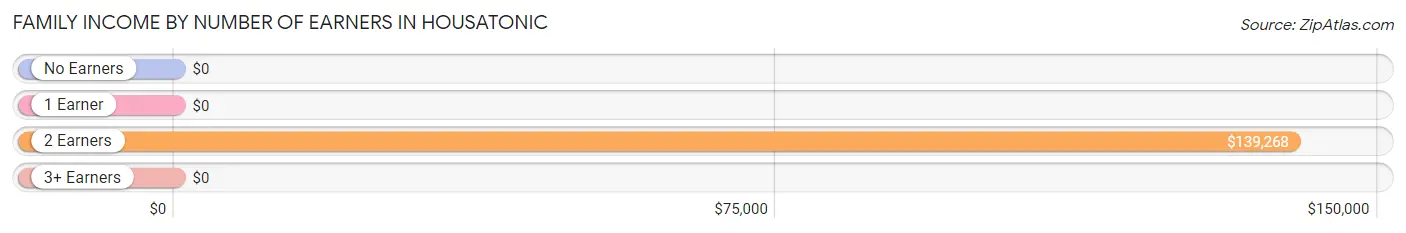
| Number of Earners | # Families | Median Income |
| No Earners | 15 (4.3%) | $0 |
| 1 Earner | 12 (3.5%) | $0 |
| 2 Earners | 316 (91.1%) | $139,268 |
| 3+ Earners | 4 (1.1%) | $0 |
| Total | 347 (100.0%) | $138,323 |
Household Income in Housatonic
Household Income Brackets in Housatonic
With 146 households falling in the category, the $200,000+ income range is the most frequent in Housatonic, accounting for 28.0% of all households.
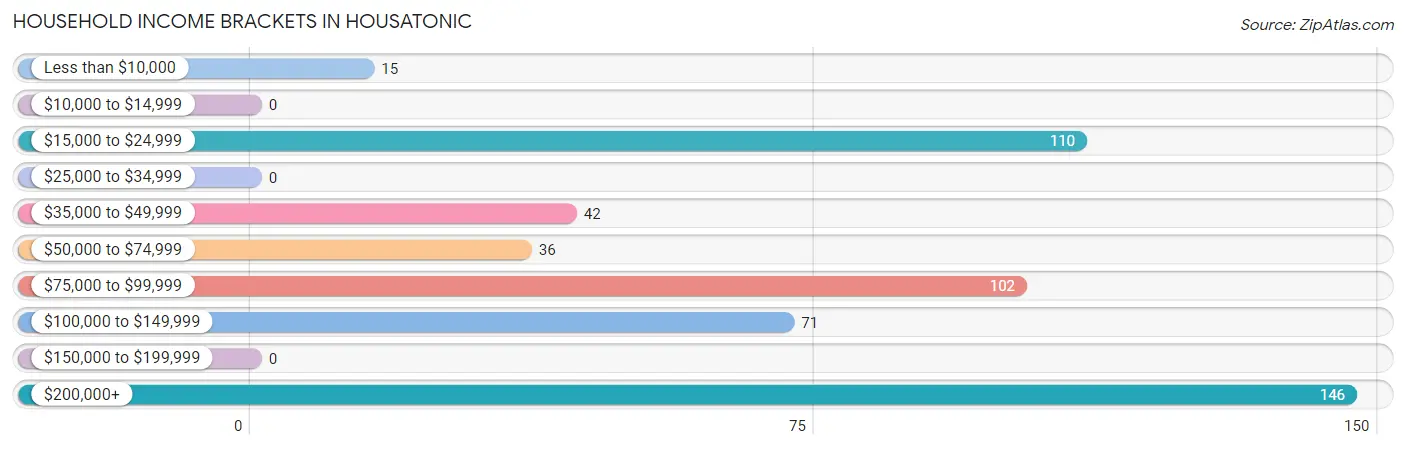
| Income Bracket | # Households | % Households |
| Less than $10,000 | 15 | 2.9% |
| $10,000 to $14,999 | 0 | 0.0% |
| $15,000 to $24,999 | 110 | 21.1% |
| $25,000 to $34,999 | 0 | 0.0% |
| $35,000 to $49,999 | 42 | 8.0% |
| $50,000 to $74,999 | 36 | 6.9% |
| $75,000 to $99,999 | 102 | 19.5% |
| $100,000 to $149,999 | 71 | 13.6% |
| $150,000 to $199,999 | 0 | 0.0% |
| $200,000+ | 146 | 28.0% |
Household Income by Householder Age in Housatonic
The median household income in Housatonic is $80,000, with the highest median household income of $76,386 found in the 45 to 64 years age bracket for the primary householder. A total of 213 households (40.8%) fall into this category. Meanwhile, the 15 to 24 years age bracket for the primary householder has the lowest median household income of $0, with 45 households (8.6%) in this group.
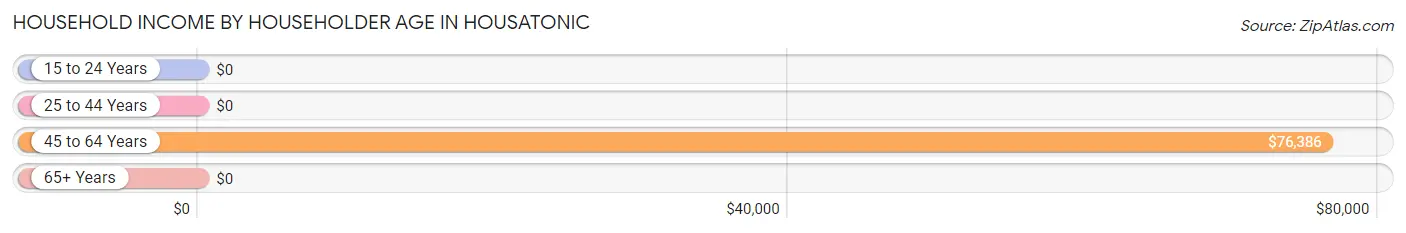
| Income Bracket | # Households | Median Income |
| 15 to 24 Years | 45 (8.6%) | $0 |
| 25 to 44 Years | 148 (28.3%) | $0 |
| 45 to 64 Years | 213 (40.8%) | $76,386 |
| 65+ Years | 116 (22.2%) | $0 |
| Total | 522 (100.0%) | $80,000 |
Poverty in Housatonic
Income Below Poverty by Sex and Age in Housatonic
With 2.0% poverty level for males and 2.6% for females among the residents of Housatonic, 25 to 34 year old males and 75 year old and over females are the most vulnerable to poverty, with 5 males (13.5%) and 15 females (18.5%) in their respective age groups living below the poverty level.
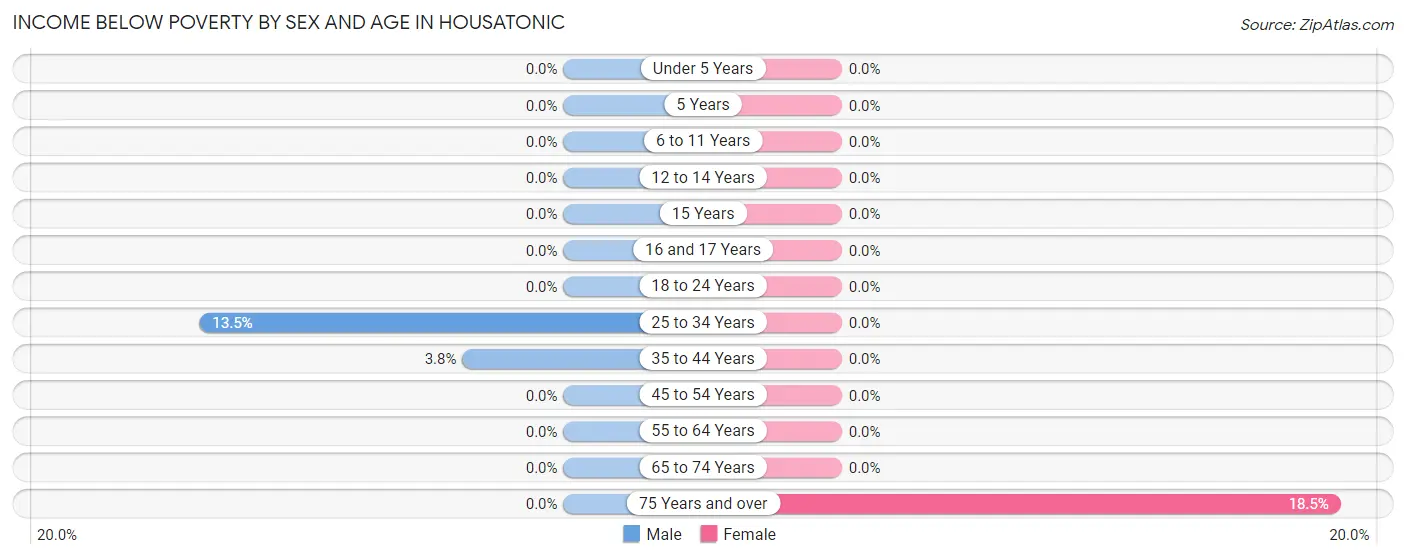
| Age Bracket | Male | Female |
| Under 5 Years | 0 (0.0%) | 0 (0.0%) |
| 5 Years | 0 (0.0%) | 0 (0.0%) |
| 6 to 11 Years | 0 (0.0%) | 0 (0.0%) |
| 12 to 14 Years | 0 (0.0%) | 0 (0.0%) |
| 15 Years | 0 (0.0%) | 0 (0.0%) |
| 16 and 17 Years | 0 (0.0%) | 0 (0.0%) |
| 18 to 24 Years | 0 (0.0%) | 0 (0.0%) |
| 25 to 34 Years | 5 (13.5%) | 0 (0.0%) |
| 35 to 44 Years | 3 (3.7%) | 0 (0.0%) |
| 45 to 54 Years | 0 (0.0%) | 0 (0.0%) |
| 55 to 64 Years | 0 (0.0%) | 0 (0.0%) |
| 65 to 74 Years | 0 (0.0%) | 0 (0.0%) |
| 75 Years and over | 0 (0.0%) | 15 (18.5%) |
| Total | 8 (2.0%) | 15 (2.6%) |
Income Above Poverty by Sex and Age in Housatonic
According to the poverty statistics in Housatonic, males aged 45 to 54 years and females aged 6 to 11 years are the age groups that are most secure financially, with 100.0% of males and 100.0% of females in these age groups living above the poverty line.
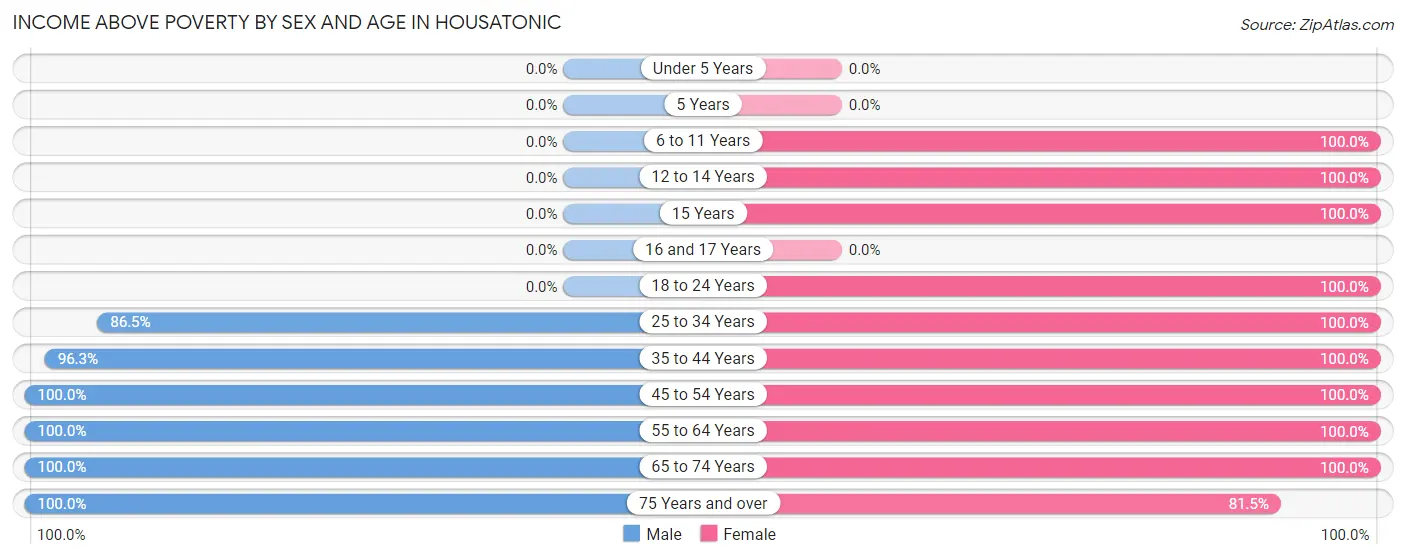
| Age Bracket | Male | Female |
| Under 5 Years | 0 (0.0%) | 0 (0.0%) |
| 5 Years | 0 (0.0%) | 0 (0.0%) |
| 6 to 11 Years | 0 (0.0%) | 24 (100.0%) |
| 12 to 14 Years | 0 (0.0%) | 37 (100.0%) |
| 15 Years | 0 (0.0%) | 24 (100.0%) |
| 16 and 17 Years | 0 (0.0%) | 0 (0.0%) |
| 18 to 24 Years | 0 (0.0%) | 45 (100.0%) |
| 25 to 34 Years | 32 (86.5%) | 49 (100.0%) |
| 35 to 44 Years | 77 (96.3%) | 101 (100.0%) |
| 45 to 54 Years | 50 (100.0%) | 53 (100.0%) |
| 55 to 64 Years | 205 (100.0%) | 107 (100.0%) |
| 65 to 74 Years | 14 (100.0%) | 66 (100.0%) |
| 75 Years and over | 12 (100.0%) | 66 (81.5%) |
| Total | 390 (98.0%) | 572 (97.4%) |
Income Below Poverty Among Married-Couple Families in Housatonic
| Children | Above Poverty | Below Poverty |
| No Children | 252 (100.0%) | 0 (0.0%) |
| 1 or 2 Children | 56 (100.0%) | 0 (0.0%) |
| 3 or 4 Children | 0 (0.0%) | 0 (0.0%) |
| 5 or more Children | 0 (0.0%) | 0 (0.0%) |
| Total | 308 (100.0%) | 0 (0.0%) |
Income Below Poverty Among Single-Parent Households in Housatonic
| Children | Single Father | Single Mother |
| No Children | 0 (0.0%) | 0 (0.0%) |
| 1 or 2 Children | 0 (0.0%) | 0 (0.0%) |
| 3 or 4 Children | 0 (0.0%) | 0 (0.0%) |
| 5 or more Children | 0 (0.0%) | 0 (0.0%) |
| Total | 0 (0.0%) | 0 (0.0%) |
Income Below Poverty Among Married-Couple vs Single-Parent Households in Housatonic
| Children | Married-Couple Families | Single-Parent Households |
| No Children | 0 (0.0%) | 0 (0.0%) |
| 1 or 2 Children | 0 (0.0%) | 0 (0.0%) |
| 3 or 4 Children | 0 (0.0%) | 0 (0.0%) |
| 5 or more Children | 0 (0.0%) | 0 (0.0%) |
| Total | 0 (0.0%) | 0 (0.0%) |
Race in Housatonic
The most populous races in Housatonic are White / Caucasian (807 | 81.9%), Two or more Races (69 | 7.0%), and Hispanic or Latino (65 | 6.6%).
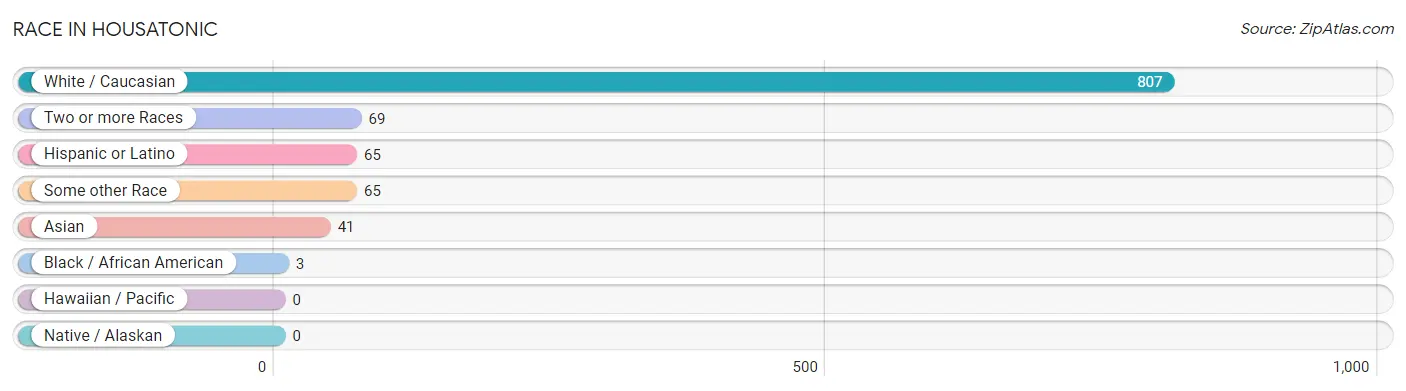
| Race | # Population | % Population |
| Asian | 41 | 4.2% |
| Black / African American | 3 | 0.3% |
| Hawaiian / Pacific | 0 | 0.0% |
| Hispanic or Latino | 65 | 6.6% |
| Native / Alaskan | 0 | 0.0% |
| White / Caucasian | 807 | 81.9% |
| Two or more Races | 69 | 7.0% |
| Some other Race | 65 | 6.6% |
| Total | 985 | 100.0% |
Ancestry in Housatonic
The most populous ancestries reported in Housatonic are Polish (140 | 14.2%), Subsaharan African (123 | 12.5%), South African (120 | 12.2%), German (113 | 11.5%), and Italian (87 | 8.8%), together accounting for 59.2% of all Housatonic residents.
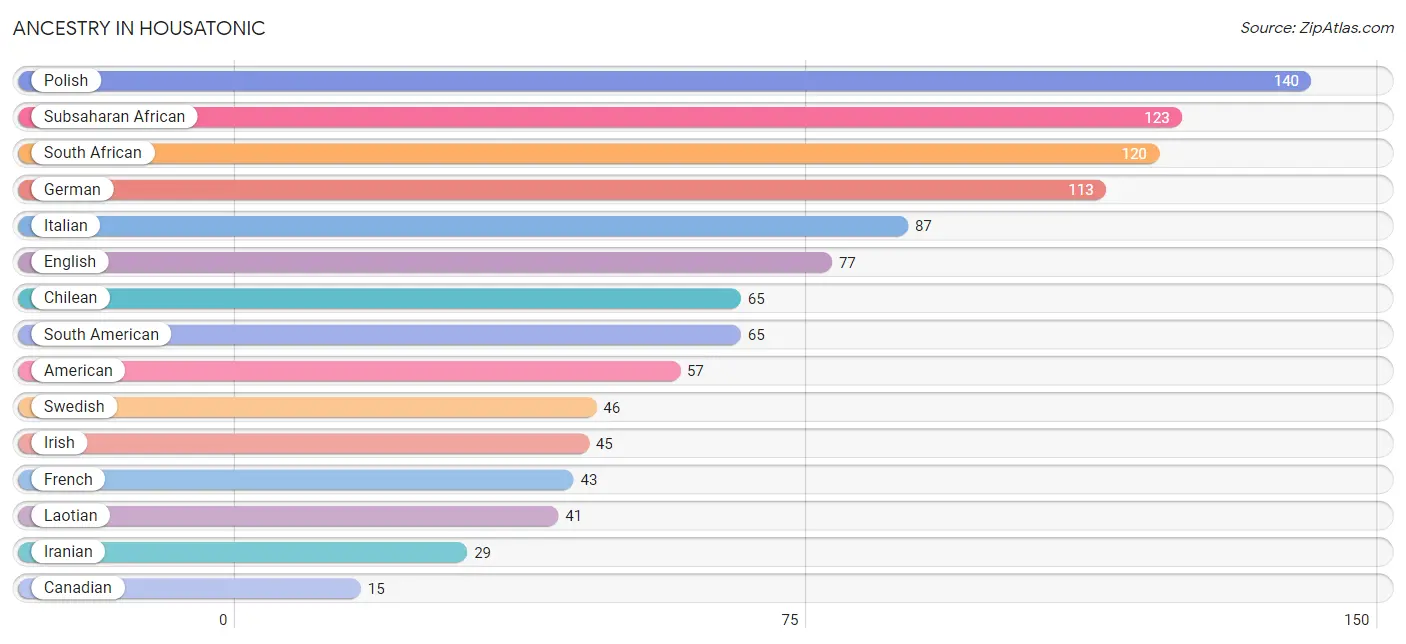
| Ancestry | # Population | % Population |
| African | 3 | 0.3% |
| American | 57 | 5.8% |
| Blackfeet | 9 | 0.9% |
| British | 8 | 0.8% |
| Canadian | 15 | 1.5% |
| Chilean | 65 | 6.6% |
| English | 77 | 7.8% |
| French | 43 | 4.4% |
| German | 113 | 11.5% |
| Inupiat | 9 | 0.9% |
| Iranian | 29 | 2.9% |
| Irish | 45 | 4.6% |
| Italian | 87 | 8.8% |
| Laotian | 41 | 4.2% |
| Northern European | 8 | 0.8% |
| Polish | 140 | 14.2% |
| Scottish | 15 | 1.5% |
| South African | 120 | 12.2% |
| South American | 65 | 6.6% |
| Subsaharan African | 123 | 12.5% |
| Swedish | 46 | 4.7% |
| Welsh | 14 | 1.4% | View All 22 Rows |
Immigrants in Housatonic
The most numerous immigrant groups reported in Housatonic came from Asia (41 | 4.2%), Chile (41 | 4.2%), Indonesia (41 | 4.2%), Latin America (41 | 4.2%), and South America (41 | 4.2%), together accounting for 20.8% of all Housatonic residents.
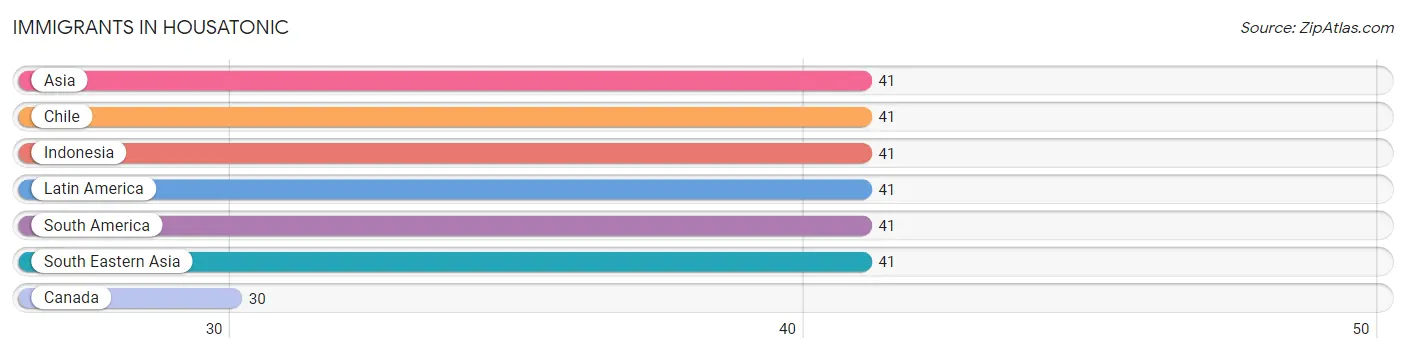
| Immigration Origin | # Population | % Population |
| Asia | 41 | 4.2% |
| Canada | 30 | 3.0% |
| Chile | 41 | 4.2% |
| Indonesia | 41 | 4.2% |
| Latin America | 41 | 4.2% |
| South America | 41 | 4.2% |
| South Eastern Asia | 41 | 4.2% | View All 7 Rows |
Sex and Age in Housatonic
Sex and Age in Housatonic
The most populous age groups in Housatonic are 60 to 64 Years (151 | 37.9%) for men and 40 to 44 Years (101 | 17.2%) for women.
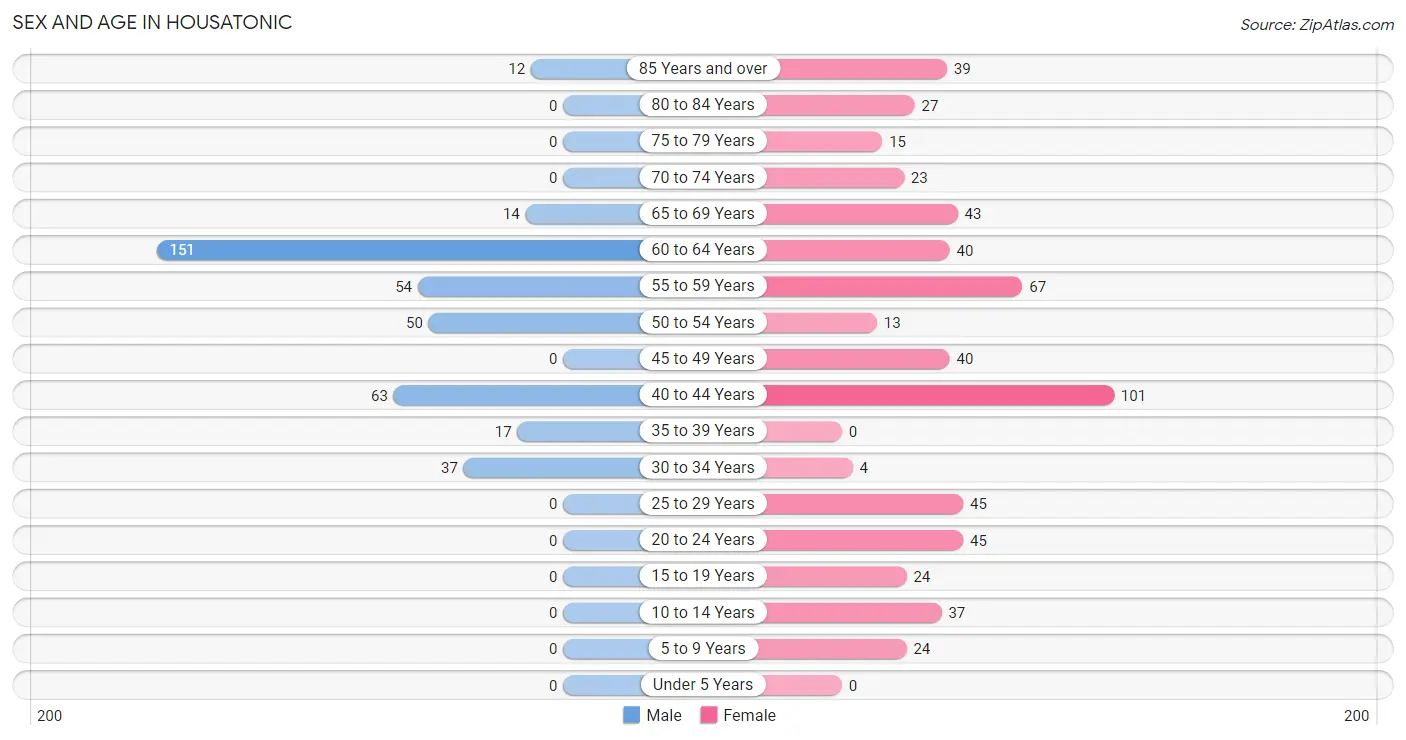
| Age Bracket | Male | Female |
| Under 5 Years | 0 (0.0%) | 0 (0.0%) |
| 5 to 9 Years | 0 (0.0%) | 24 (4.1%) |
| 10 to 14 Years | 0 (0.0%) | 37 (6.3%) |
| 15 to 19 Years | 0 (0.0%) | 24 (4.1%) |
| 20 to 24 Years | 0 (0.0%) | 45 (7.7%) |
| 25 to 29 Years | 0 (0.0%) | 45 (7.7%) |
| 30 to 34 Years | 37 (9.3%) | 4 (0.7%) |
| 35 to 39 Years | 17 (4.3%) | 0 (0.0%) |
| 40 to 44 Years | 63 (15.8%) | 101 (17.2%) |
| 45 to 49 Years | 0 (0.0%) | 40 (6.8%) |
| 50 to 54 Years | 50 (12.6%) | 13 (2.2%) |
| 55 to 59 Years | 54 (13.6%) | 67 (11.4%) |
| 60 to 64 Years | 151 (37.9%) | 40 (6.8%) |
| 65 to 69 Years | 14 (3.5%) | 43 (7.3%) |
| 70 to 74 Years | 0 (0.0%) | 23 (3.9%) |
| 75 to 79 Years | 0 (0.0%) | 15 (2.6%) |
| 80 to 84 Years | 0 (0.0%) | 27 (4.6%) |
| 85 Years and over | 12 (3.0%) | 39 (6.6%) |
| Total | 398 (100.0%) | 587 (100.0%) |
Families and Households in Housatonic
Median Family Size in Housatonic
The median family size in Housatonic is 2.31 persons per family, with single female/mother families (27 | 7.8%) accounting for the largest median family size of 4.44 persons per family. On the other hand, married-couple families (308 | 88.8%) represent the smallest median family size with 2.13 persons per family.
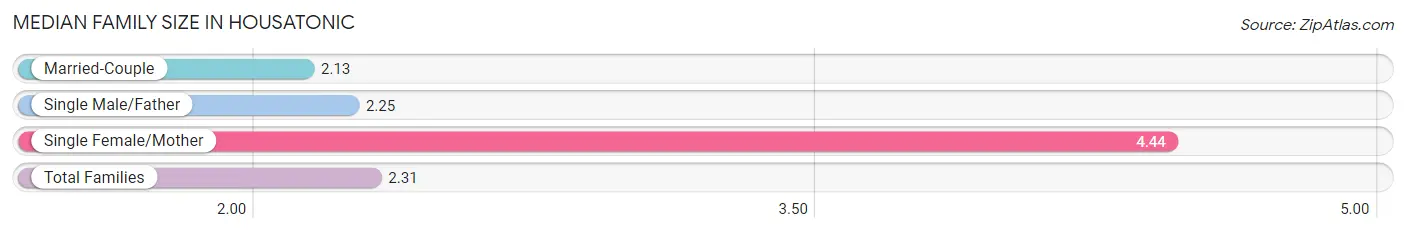
| Family Type | # Families | Family Size |
| Married-Couple | 308 (88.8%) | 2.13 |
| Single Male/Father | 12 (3.5%) | 2.25 |
| Single Female/Mother | 27 (7.8%) | 4.44 |
| Total Families | 347 (100.0%) | 2.31 |
Median Household Size in Housatonic
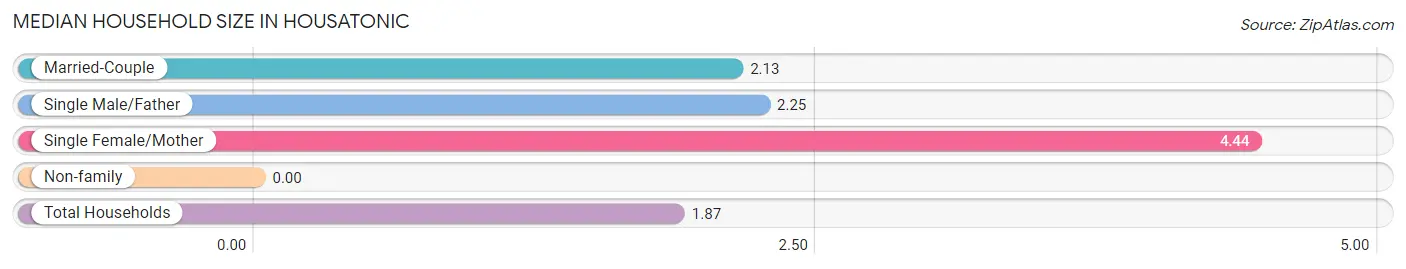
| Household Type | # Households | Household Size |
| Married-Couple | 308 (59.0%) | 2.13 |
| Single Male/Father | 12 (2.3%) | 2.25 |
| Single Female/Mother | 27 (5.2%) | 4.44 |
| Non-family | 175 (33.5%) | - |
| Total Households | 522 (100.0%) | 1.87 |
Household Size by Marriage Status in Housatonic
Out of a total of 522 households in Housatonic, 347 (66.5%) are family households, while 175 (33.5%) are nonfamily households. The most numerous type of family households are 2-person households, comprising 260, and the most common type of nonfamily households are 1-person households, comprising 175.
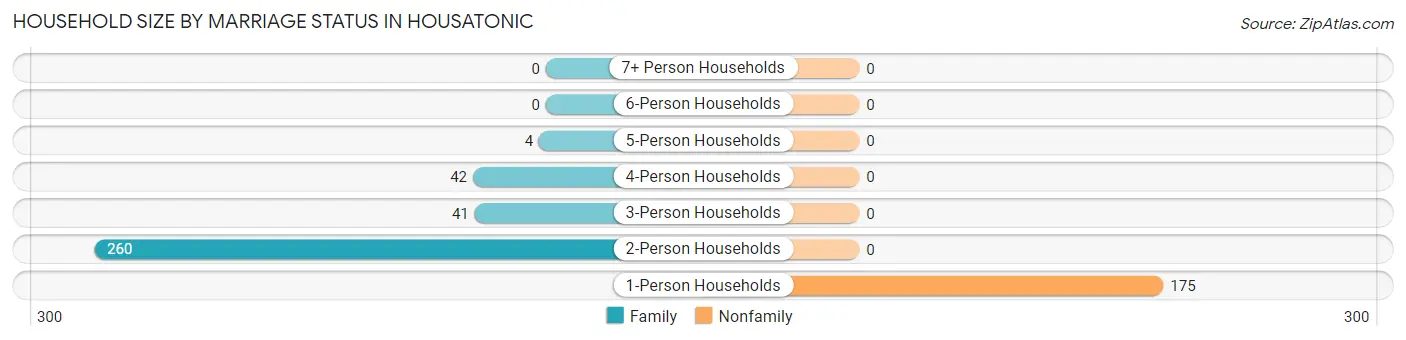
| Household Size | Family Households | Nonfamily Households |
| 1-Person Households | - | 175 (33.5%) |
| 2-Person Households | 260 (49.8%) | 0 (0.0%) |
| 3-Person Households | 41 (7.9%) | 0 (0.0%) |
| 4-Person Households | 42 (8.1%) | 0 (0.0%) |
| 5-Person Households | 4 (0.8%) | 0 (0.0%) |
| 6-Person Households | 0 (0.0%) | 0 (0.0%) |
| 7+ Person Households | 0 (0.0%) | 0 (0.0%) |
| Total | 347 (66.5%) | 175 (33.5%) |
Female Fertility in Housatonic
Fertility by Age in Housatonic
| Age Bracket | Women with Births | Births / 1,000 Women |
| 15 to 19 years | 0 (0.0%) | 0.0 |
| 20 to 34 years | 0 (0.0%) | 0.0 |
| 35 to 50 years | 0 (0.0%) | 0.0 |
| Total | 0 (0.0%) | 0.0 |
Fertility by Age by Marriage Status in Housatonic
| Age Bracket | Married | Unmarried |
| 15 to 19 years | 0 (0.0%) | 0 (0.0%) |
| 20 to 34 years | 0 (0.0%) | 0 (0.0%) |
| 35 to 50 years | 0 (0.0%) | 0 (0.0%) |
| Total | 0 (0.0%) | 0 (0.0%) |
Fertility by Education in Housatonic
| Educational Attainment | Women with Births | Births / 1,000 Women |
| Less than High School | 0 (0.0%) | 0.0 |
| High School Diploma | 0 (0.0%) | 0.0 |
| College or Associate's Degree | 0 (0.0%) | 0.0 |
| Bachelor's Degree | 0 (0.0%) | 0.0 |
| Graduate Degree | 0 (0.0%) | 0.0 |
| Total | 0 (0.0%) | 0.0 |
Fertility by Education by Marriage Status in Housatonic
| Educational Attainment | Married | Unmarried |
| Less than High School | 0 (0.0%) | 0 (0.0%) |
| High School Diploma | 0 (0.0%) | 0 (0.0%) |
| College or Associate's Degree | 0 (0.0%) | 0 (0.0%) |
| Bachelor's Degree | 0 (0.0%) | 0 (0.0%) |
| Graduate Degree | 0 (0.0%) | 0 (0.0%) |
| Total | 0 (0.0%) | 0 (0.0%) |
Employment Characteristics in Housatonic
Employment by Class of Employer in Housatonic
Among the 758 employed individuals in Housatonic, private company employees (337 | 44.5%), self-employed (not incorporated) (237 | 31.3%), and not-for-profit organizations (158 | 20.8%) make up the most common classes of employment.
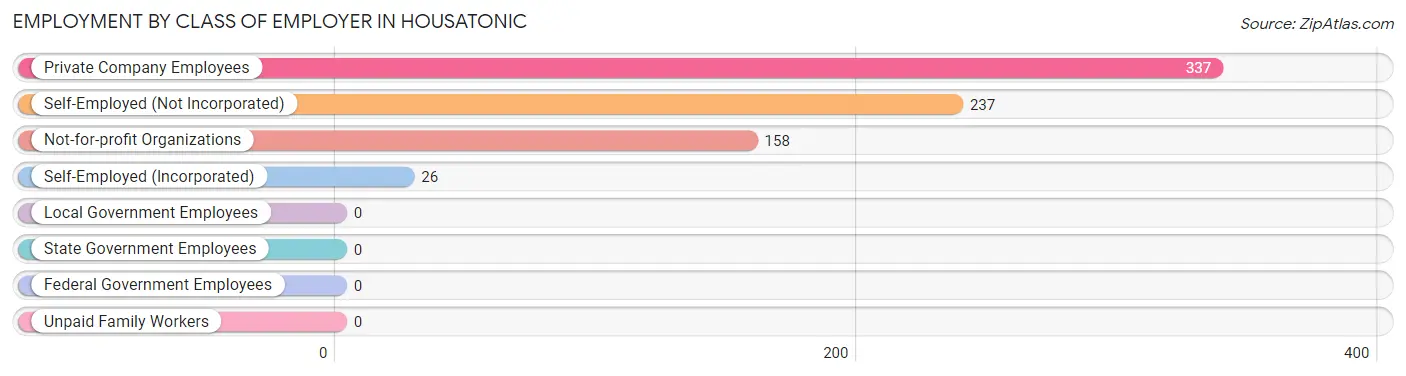
| Employer Class | # Employees | % Employees |
| Private Company Employees | 337 | 44.5% |
| Self-Employed (Incorporated) | 26 | 3.4% |
| Self-Employed (Not Incorporated) | 237 | 31.3% |
| Not-for-profit Organizations | 158 | 20.8% |
| Local Government Employees | 0 | 0.0% |
| State Government Employees | 0 | 0.0% |
| Federal Government Employees | 0 | 0.0% |
| Unpaid Family Workers | 0 | 0.0% |
| Total | 758 | 100.0% |
Employment Status by Age in Housatonic
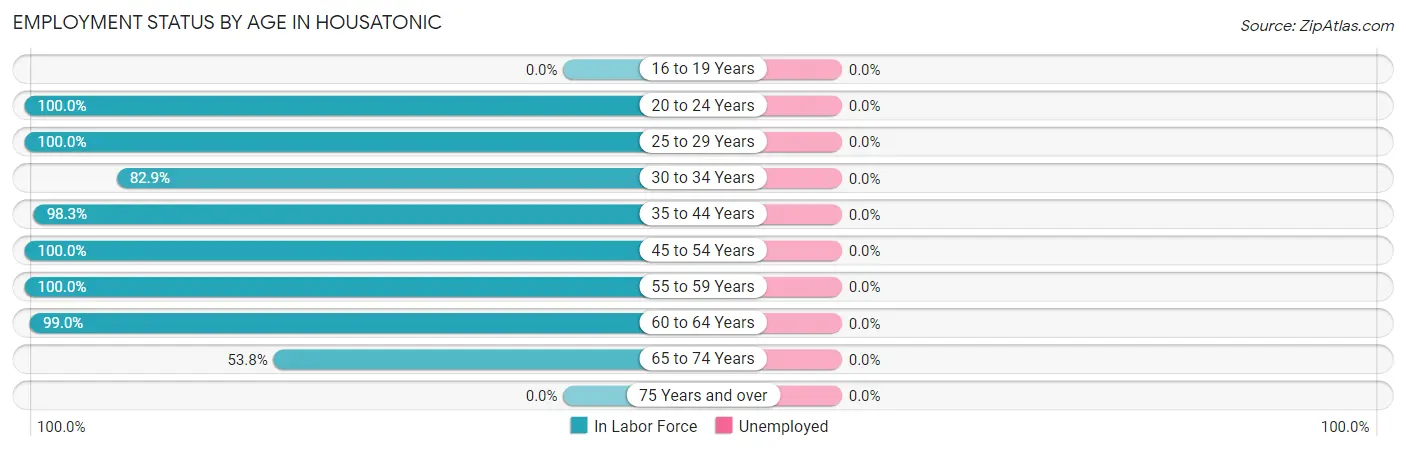
| Age Bracket | In Labor Force | Unemployed |
| 16 to 19 Years | 0 (0.0%) | 0 (0.0%) |
| 20 to 24 Years | 45 (100.0%) | 0 (0.0%) |
| 25 to 29 Years | 45 (100.0%) | 0 (0.0%) |
| 30 to 34 Years | 34 (82.9%) | 0 (0.0%) |
| 35 to 44 Years | 178 (98.3%) | 0 (0.0%) |
| 45 to 54 Years | 103 (100.0%) | 0 (0.0%) |
| 55 to 59 Years | 121 (100.0%) | 0 (0.0%) |
| 60 to 64 Years | 189 (99.0%) | 0 (0.0%) |
| 65 to 74 Years | 43 (53.8%) | 0 (0.0%) |
| 75 Years and over | 0 (0.0%) | 0 (0.0%) |
| Total | 758 (84.2%) | 0 (0.0%) |
Employment Status by Educational Attainment in Housatonic
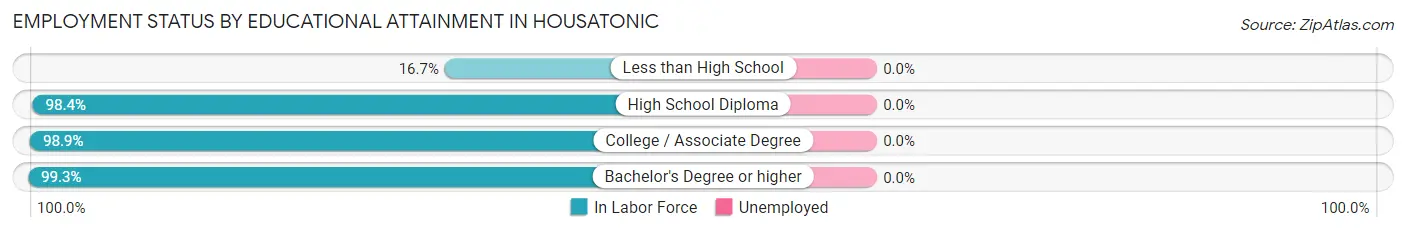
| Educational Attainment | In Labor Force | Unemployed |
| Less than High School | 1 (16.7%) | 0 (0.0%) |
| High School Diploma | 124 (98.4%) | 0 (0.0%) |
| College / Associate Degree | 264 (98.9%) | 0 (0.0%) |
| Bachelor's Degree or higher | 281 (99.3%) | 0 (0.0%) |
| Total | 670 (98.2%) | 0 (0.0%) |
Employment Occupations by Sex in Housatonic
Management, Business, Science and Arts Occupations
The most common Management, Business, Science and Arts occupations in Housatonic are Computers, Engineering & Science (164 | 21.6%), Architecture & Engineering (164 | 21.6%), Community & Social Service (91 | 12.0%), Education Instruction & Library (45 | 5.9%), and Health Diagnosing & Treating (41 | 5.4%).
Management, Business, Science and Arts Occupations by Sex
Within the Management, Business, Science and Arts occupations in Housatonic, the most male-oriented occupations are Education, Arts & Media (100.0%), Arts, Media & Entertainment (100.0%), and Computers, Engineering & Science (63.4%), while the most female-oriented occupations are Management (100.0%), Education Instruction & Library (100.0%), and Health Diagnosing & Treating (100.0%).
| Occupation | Male | Female |
| Management | 0 (0.0%) | 29 (100.0%) |
| Business & Financial | 0 (0.0%) | 0 (0.0%) |
| Computers, Engineering & Science | 104 (63.4%) | 60 (36.6%) |
| Computers & Mathematics | 0 (0.0%) | 0 (0.0%) |
| Architecture & Engineering | 104 (63.4%) | 60 (36.6%) |
| Life, Physical & Social Science | 0 (0.0%) | 0 (0.0%) |
| Community & Social Service | 46 (50.5%) | 45 (49.4%) |
| Education, Arts & Media | 29 (100.0%) | 0 (0.0%) |
| Legal Services & Support | 0 (0.0%) | 0 (0.0%) |
| Education Instruction & Library | 0 (0.0%) | 45 (100.0%) |
| Arts, Media & Entertainment | 17 (100.0%) | 0 (0.0%) |
| Health Diagnosing & Treating | 0 (0.0%) | 41 (100.0%) |
| Health Technologists | 0 (0.0%) | 41 (100.0%) |
| Total (Category) | 150 (46.2%) | 175 (53.8%) |
| Total (Overall) | 362 (47.8%) | 396 (52.2%) |
Services Occupations
The most common Services occupations in Housatonic are Food Preparation & Serving (49 | 6.5%), Personal Care & Service (38 | 5.0%), Security & Protection (15 | 2.0%), Firefighting & Prevention (15 | 2.0%), and Cleaning & Maintenance (9 | 1.2%).
Services Occupations by Sex
Within the Services occupations in Housatonic, the most male-oriented occupations are Security & Protection (100.0%), Firefighting & Prevention (100.0%), and Cleaning & Maintenance (100.0%), while the most female-oriented occupations are Food Preparation & Serving (100.0%), and Personal Care & Service (100.0%).
| Occupation | Male | Female |
| Healthcare Support | 0 (0.0%) | 0 (0.0%) |
| Security & Protection | 15 (100.0%) | 0 (0.0%) |
| Firefighting & Prevention | 15 (100.0%) | 0 (0.0%) |
| Law Enforcement | 0 (0.0%) | 0 (0.0%) |
| Food Preparation & Serving | 0 (0.0%) | 49 (100.0%) |
| Cleaning & Maintenance | 9 (100.0%) | 0 (0.0%) |
| Personal Care & Service | 0 (0.0%) | 38 (100.0%) |
| Total (Category) | 24 (21.6%) | 87 (78.4%) |
| Total (Overall) | 362 (47.8%) | 396 (52.2%) |
Sales and Office Occupations
The most common Sales and Office occupations in Housatonic are Office & Administration (81 | 10.7%), and Sales & Related (43 | 5.7%).
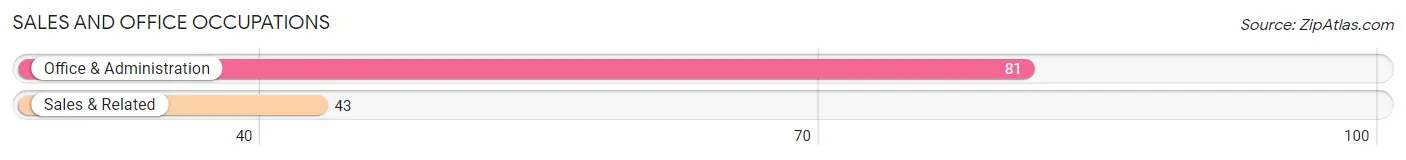
Sales and Office Occupations by Sex
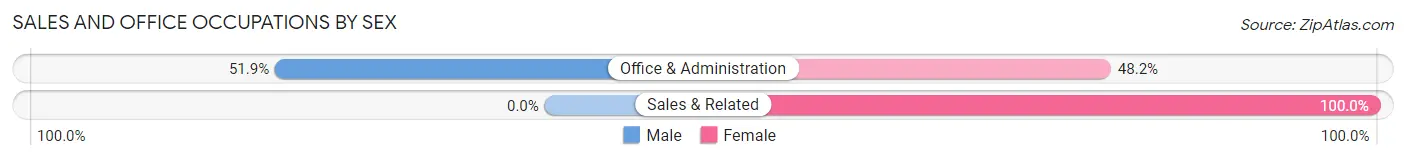
| Occupation | Male | Female |
| Sales & Related | 0 (0.0%) | 43 (100.0%) |
| Office & Administration | 42 (51.8%) | 39 (48.1%) |
| Total (Category) | 42 (33.9%) | 82 (66.1%) |
| Total (Overall) | 362 (47.8%) | 396 (52.2%) |
Natural Resources, Construction and Maintenance Occupations
The most common Natural Resources, Construction and Maintenance occupations in Housatonic are , and Construction & Extraction (76 | 10.0%).
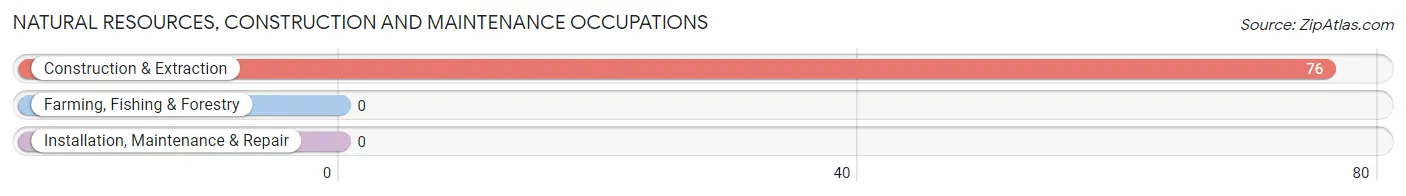
Natural Resources, Construction and Maintenance Occupations by Sex
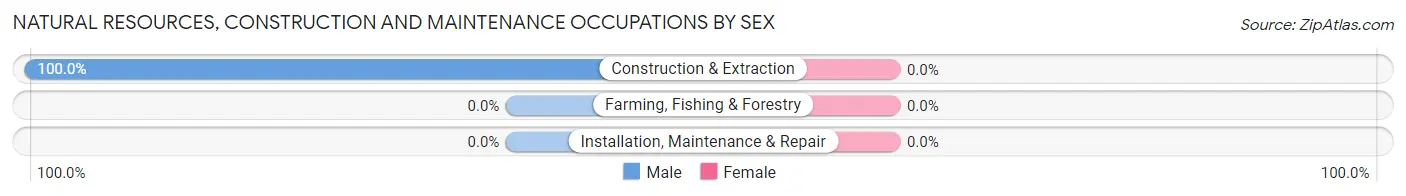
| Occupation | Male | Female |
| Farming, Fishing & Forestry | 0 (0.0%) | 0 (0.0%) |
| Construction & Extraction | 76 (100.0%) | 0 (0.0%) |
| Installation, Maintenance & Repair | 0 (0.0%) | 0 (0.0%) |
| Total (Category) | 76 (100.0%) | 0 (0.0%) |
| Total (Overall) | 362 (47.8%) | 396 (52.2%) |
Production, Transportation and Moving Occupations
The most common Production, Transportation and Moving occupations in Housatonic are Production (68 | 9.0%), Transportation (28 | 3.7%), and Material Moving (26 | 3.4%).
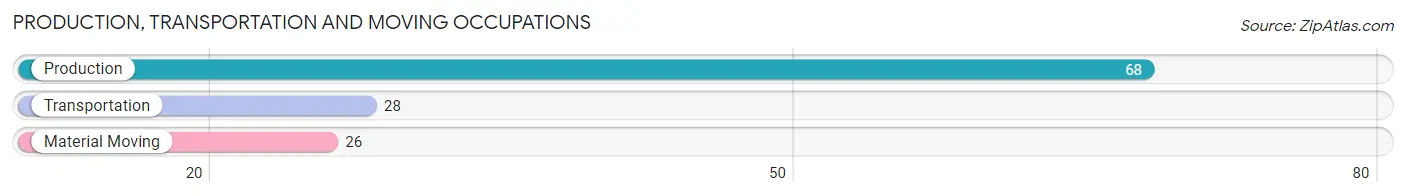
Production, Transportation and Moving Occupations by Sex
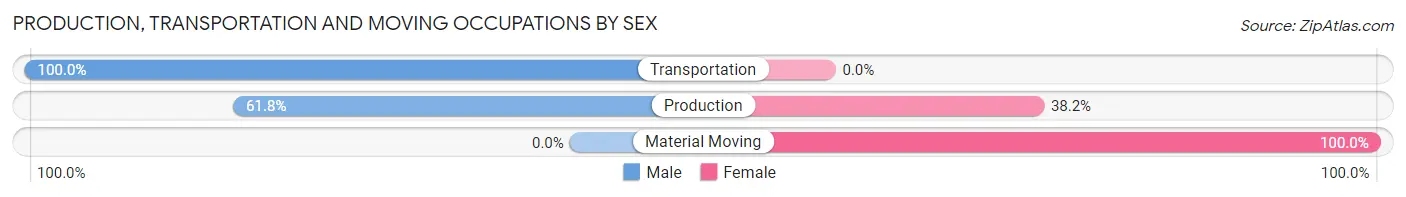
| Occupation | Male | Female |
| Production | 42 (61.8%) | 26 (38.2%) |
| Transportation | 28 (100.0%) | 0 (0.0%) |
| Material Moving | 0 (0.0%) | 26 (100.0%) |
| Total (Category) | 70 (57.4%) | 52 (42.6%) |
| Total (Overall) | 362 (47.8%) | 396 (52.2%) |
Employment Industries by Sex in Housatonic
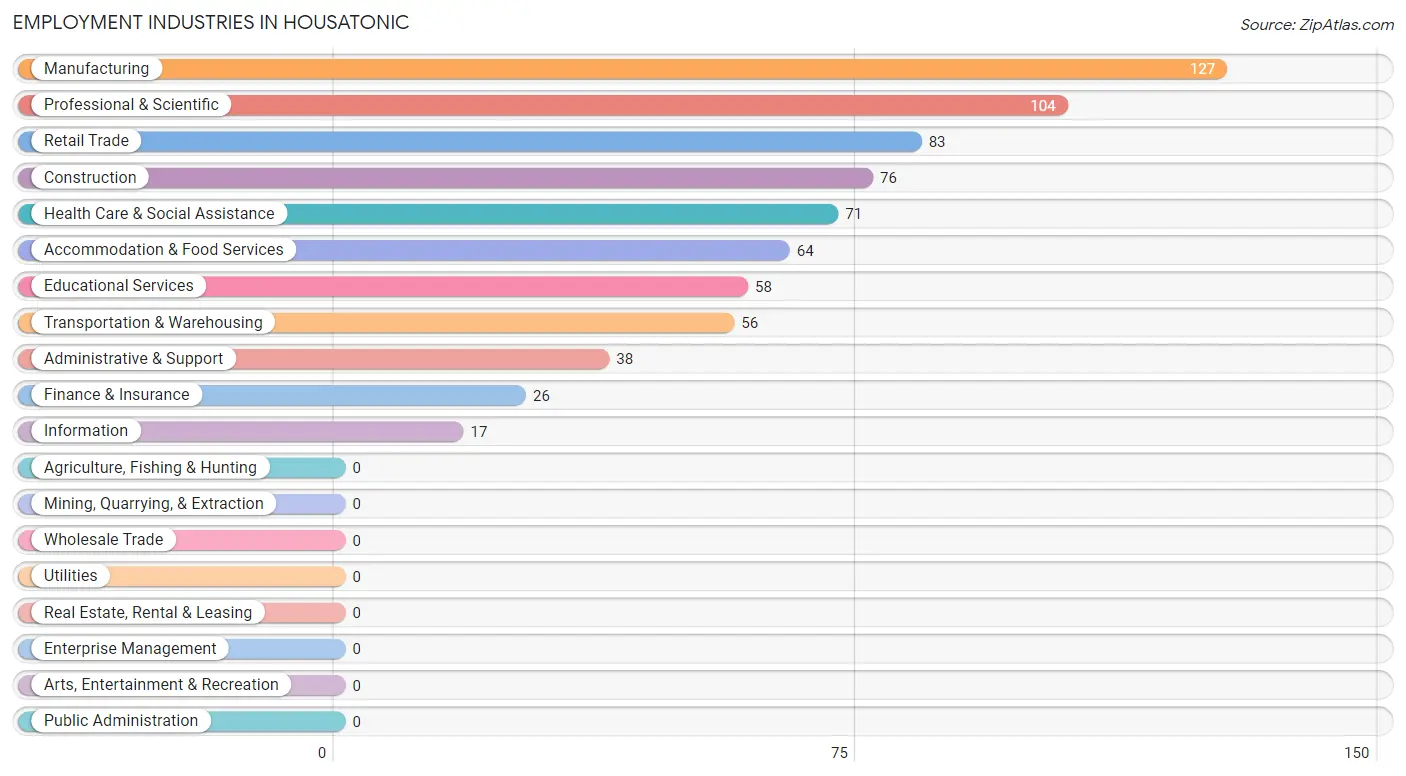
Employment Industries in Housatonic
The major employment industries in Housatonic include Manufacturing (127 | 16.8%), Professional & Scientific (104 | 13.7%), Retail Trade (83 | 11.0%), Construction (76 | 10.0%), and Health Care & Social Assistance (71 | 9.4%).
Employment Industries by Sex in Housatonic
The Housatonic industries that see more men than women are Construction (100.0%), Transportation & Warehousing (100.0%), and Information (100.0%), whereas the industries that tend to have a higher number of women are Finance & Insurance (100.0%), Educational Services (100.0%), and Accommodation & Food Services (100.0%).
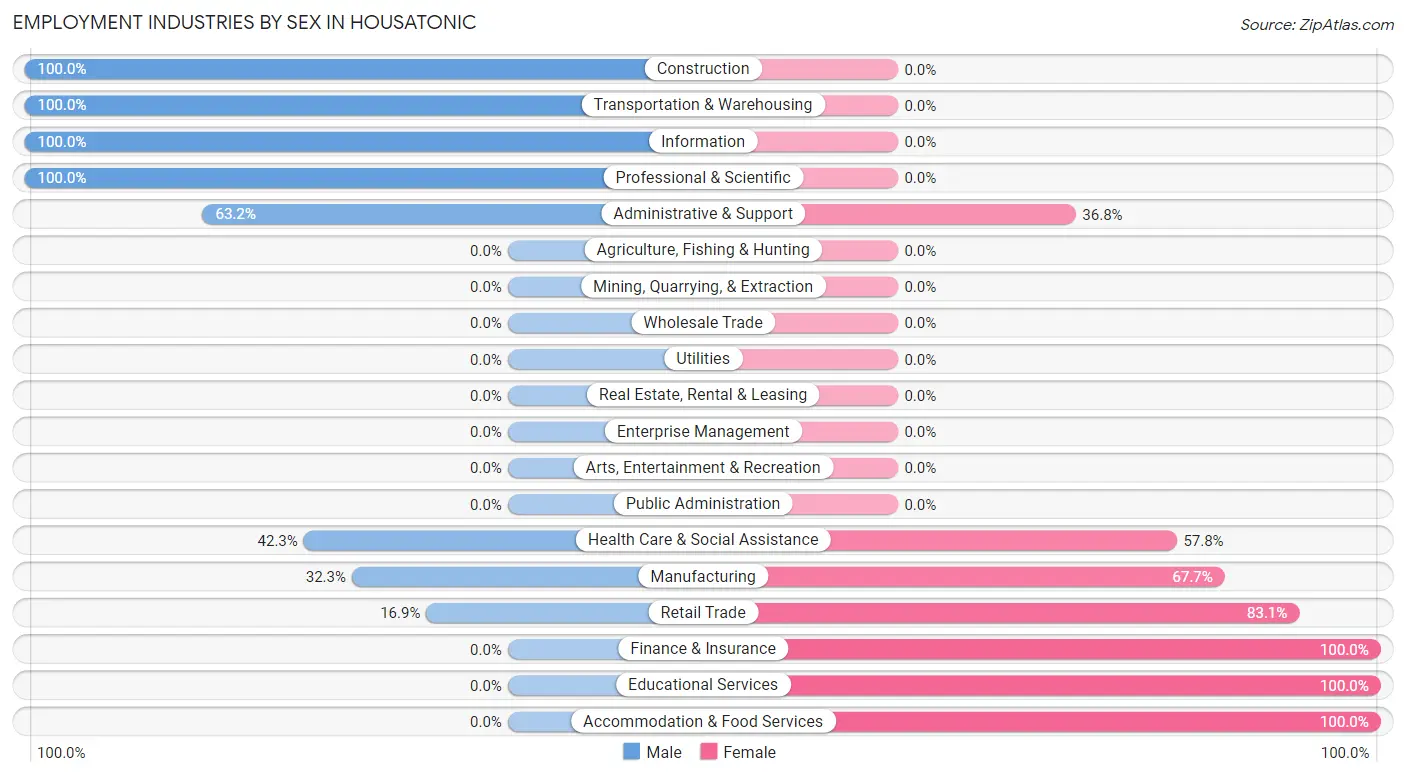
| Industry | Male | Female |
| Agriculture, Fishing & Hunting | 0 (0.0%) | 0 (0.0%) |
| Mining, Quarrying, & Extraction | 0 (0.0%) | 0 (0.0%) |
| Construction | 76 (100.0%) | 0 (0.0%) |
| Manufacturing | 41 (32.3%) | 86 (67.7%) |
| Wholesale Trade | 0 (0.0%) | 0 (0.0%) |
| Retail Trade | 14 (16.9%) | 69 (83.1%) |
| Transportation & Warehousing | 56 (100.0%) | 0 (0.0%) |
| Utilities | 0 (0.0%) | 0 (0.0%) |
| Information | 17 (100.0%) | 0 (0.0%) |
| Finance & Insurance | 0 (0.0%) | 26 (100.0%) |
| Real Estate, Rental & Leasing | 0 (0.0%) | 0 (0.0%) |
| Professional & Scientific | 104 (100.0%) | 0 (0.0%) |
| Enterprise Management | 0 (0.0%) | 0 (0.0%) |
| Administrative & Support | 24 (63.2%) | 14 (36.8%) |
| Educational Services | 0 (0.0%) | 58 (100.0%) |
| Health Care & Social Assistance | 30 (42.2%) | 41 (57.8%) |
| Arts, Entertainment & Recreation | 0 (0.0%) | 0 (0.0%) |
| Accommodation & Food Services | 0 (0.0%) | 64 (100.0%) |
| Public Administration | 0 (0.0%) | 0 (0.0%) |
| Total | 362 (47.8%) | 396 (52.2%) |
Education in Housatonic
School Enrollment in Housatonic
The most common levels of schooling among the 126 students in Housatonic are college / undergraduate (41 | 32.5%), middle school (37 | 29.4%), and elementary school (24 | 19.1%).
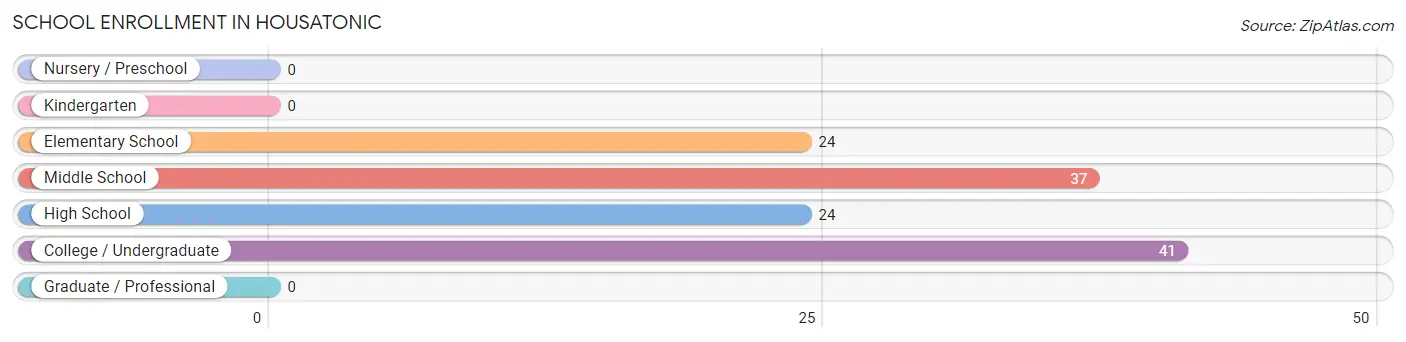
| School Level | # Students | % Students |
| Nursery / Preschool | 0 | 0.0% |
| Kindergarten | 0 | 0.0% |
| Elementary School | 24 | 19.1% |
| Middle School | 37 | 29.4% |
| High School | 24 | 19.1% |
| College / Undergraduate | 41 | 32.5% |
| Graduate / Professional | 0 | 0.0% |
| Total | 126 | 100.0% |
School Enrollment by Age by Funding Source in Housatonic
Out of a total of 126 students who are enrolled in schools in Housatonic, 41 (32.5%) attend a private institution, while the remaining 85 (67.5%) are enrolled in public schools. The age group of 35 years and over has the highest likelihood of being enrolled in private schools, with 41 (100.0% in the age bracket) enrolled. Conversely, the age group of 5 to 9 year old has the lowest likelihood of being enrolled in a private school, with 24 (100.0% in the age bracket) attending a public institution.
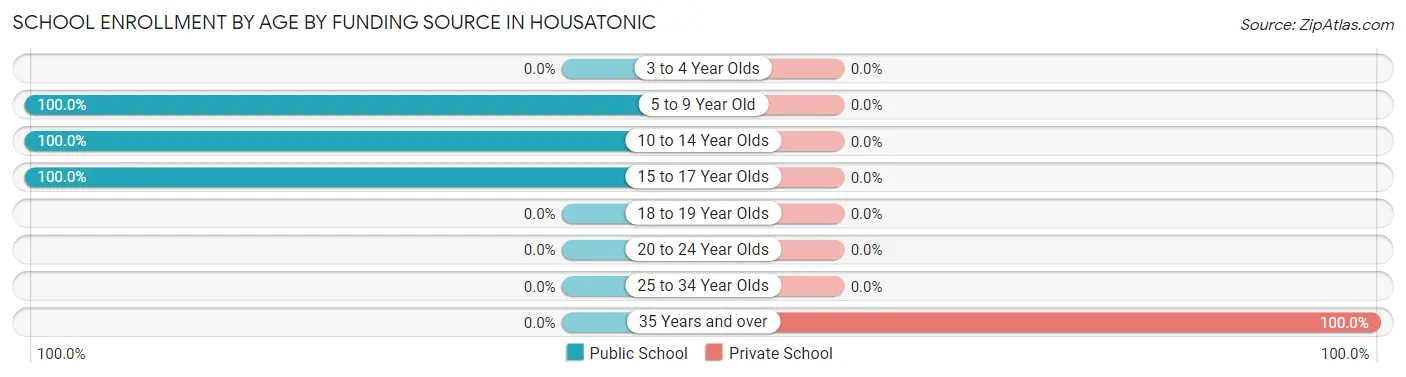
| Age Bracket | Public School | Private School |
| 3 to 4 Year Olds | 0 (0.0%) | 0 (0.0%) |
| 5 to 9 Year Old | 24 (100.0%) | 0 (0.0%) |
| 10 to 14 Year Olds | 37 (100.0%) | 0 (0.0%) |
| 15 to 17 Year Olds | 24 (100.0%) | 0 (0.0%) |
| 18 to 19 Year Olds | 0 (0.0%) | 0 (0.0%) |
| 20 to 24 Year Olds | 0 (0.0%) | 0 (0.0%) |
| 25 to 34 Year Olds | 0 (0.0%) | 0 (0.0%) |
| 35 Years and over | 0 (0.0%) | 41 (100.0%) |
| Total | 85 (67.5%) | 41 (32.5%) |
Educational Attainment by Field of Study in Housatonic
Liberal arts & history (117 | 29.5%), literature & languages (84 | 21.2%), engineering (60 | 15.1%), education (55 | 13.9%), and psychology (44 | 11.1%) are the most common fields of study among 397 individuals in Housatonic who have obtained a bachelor's degree or higher.
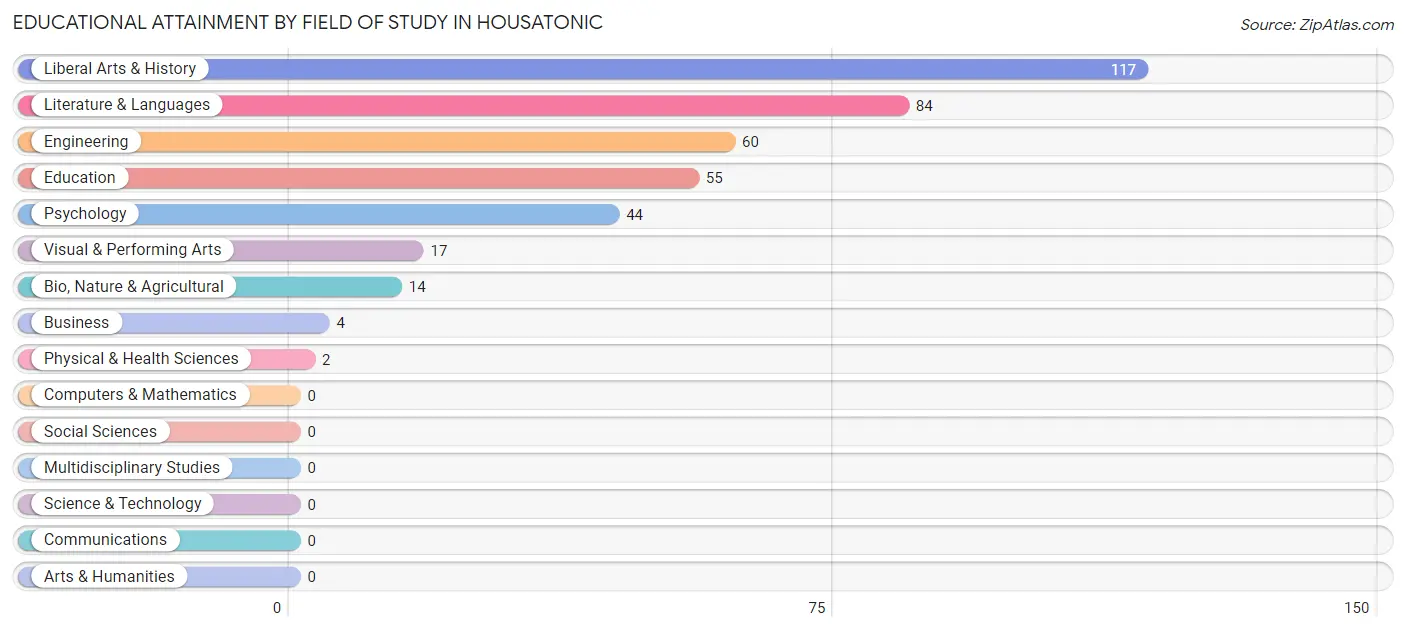
| Field of Study | # Graduates | % Graduates |
| Computers & Mathematics | 0 | 0.0% |
| Bio, Nature & Agricultural | 14 | 3.5% |
| Physical & Health Sciences | 2 | 0.5% |
| Psychology | 44 | 11.1% |
| Social Sciences | 0 | 0.0% |
| Engineering | 60 | 15.1% |
| Multidisciplinary Studies | 0 | 0.0% |
| Science & Technology | 0 | 0.0% |
| Business | 4 | 1.0% |
| Education | 55 | 13.9% |
| Literature & Languages | 84 | 21.2% |
| Liberal Arts & History | 117 | 29.5% |
| Visual & Performing Arts | 17 | 4.3% |
| Communications | 0 | 0.0% |
| Arts & Humanities | 0 | 0.0% |
| Total | 397 | 100.0% |
Transportation & Commute in Housatonic
Vehicle Availability by Sex in Housatonic
The most prevalent vehicle ownership categories in Housatonic are males with 2 vehicles (183, accounting for 50.5%) and females with 2 vehicles (192, making up 46.2%).
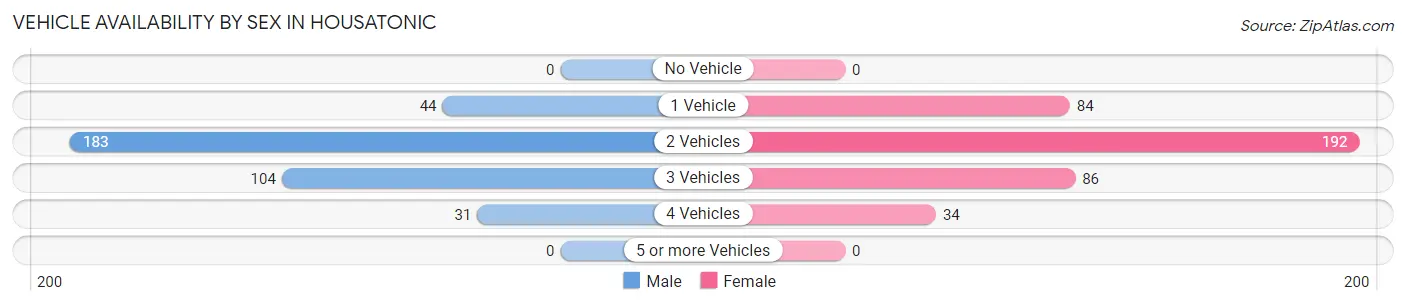
| Vehicles Available | Male | Female |
| No Vehicle | 0 (0.0%) | 0 (0.0%) |
| 1 Vehicle | 44 (12.1%) | 84 (21.2%) |
| 2 Vehicles | 183 (50.5%) | 192 (48.5%) |
| 3 Vehicles | 104 (28.7%) | 86 (21.7%) |
| 4 Vehicles | 31 (8.6%) | 34 (8.6%) |
| 5 or more Vehicles | 0 (0.0%) | 0 (0.0%) |
| Total | 362 (100.0%) | 396 (100.0%) |
Commute Time in Housatonic
The most frequently occuring commute durations in Housatonic are 10 to 14 minutes (128 commuters, 22.2%), 60 to 89 minutes (104 commuters, 18.1%), and 20 to 24 minutes (101 commuters, 17.5%).
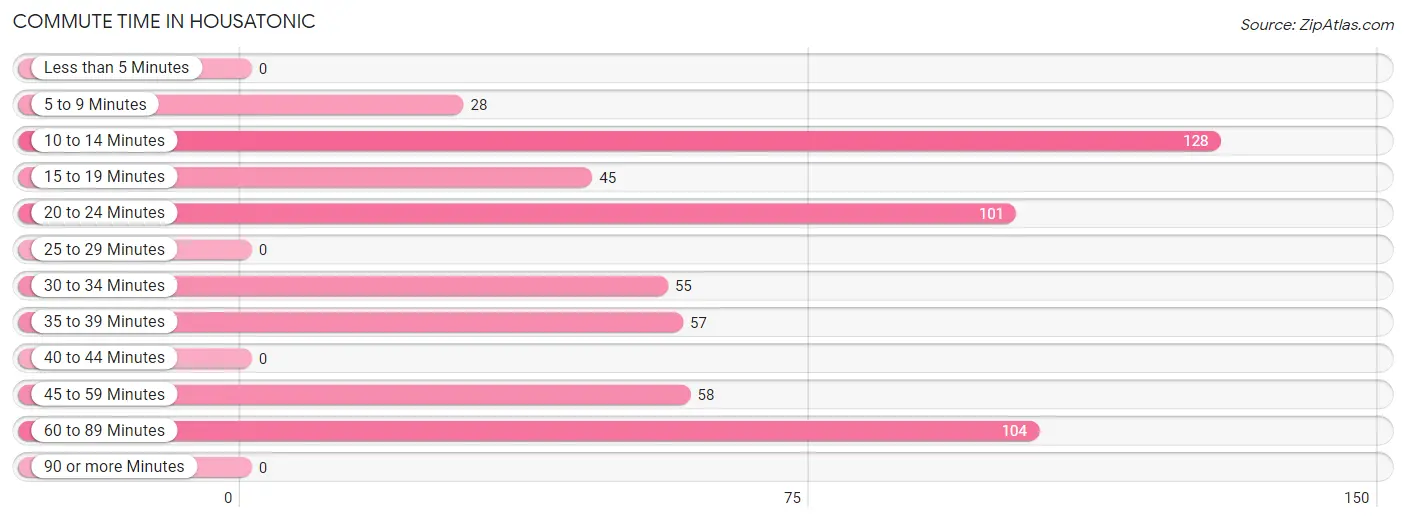
| Commute Time | # Commuters | % Commuters |
| Less than 5 Minutes | 0 | 0.0% |
| 5 to 9 Minutes | 28 | 4.9% |
| 10 to 14 Minutes | 128 | 22.2% |
| 15 to 19 Minutes | 45 | 7.8% |
| 20 to 24 Minutes | 101 | 17.5% |
| 25 to 29 Minutes | 0 | 0.0% |
| 30 to 34 Minutes | 55 | 9.6% |
| 35 to 39 Minutes | 57 | 9.9% |
| 40 to 44 Minutes | 0 | 0.0% |
| 45 to 59 Minutes | 58 | 10.1% |
| 60 to 89 Minutes | 104 | 18.1% |
| 90 or more Minutes | 0 | 0.0% |
Commute Time by Sex in Housatonic
The most common commute times in Housatonic are 60 to 89 minutes (63 commuters, 24.4%) for males and 10 to 14 minutes (114 commuters, 35.8%) for females.
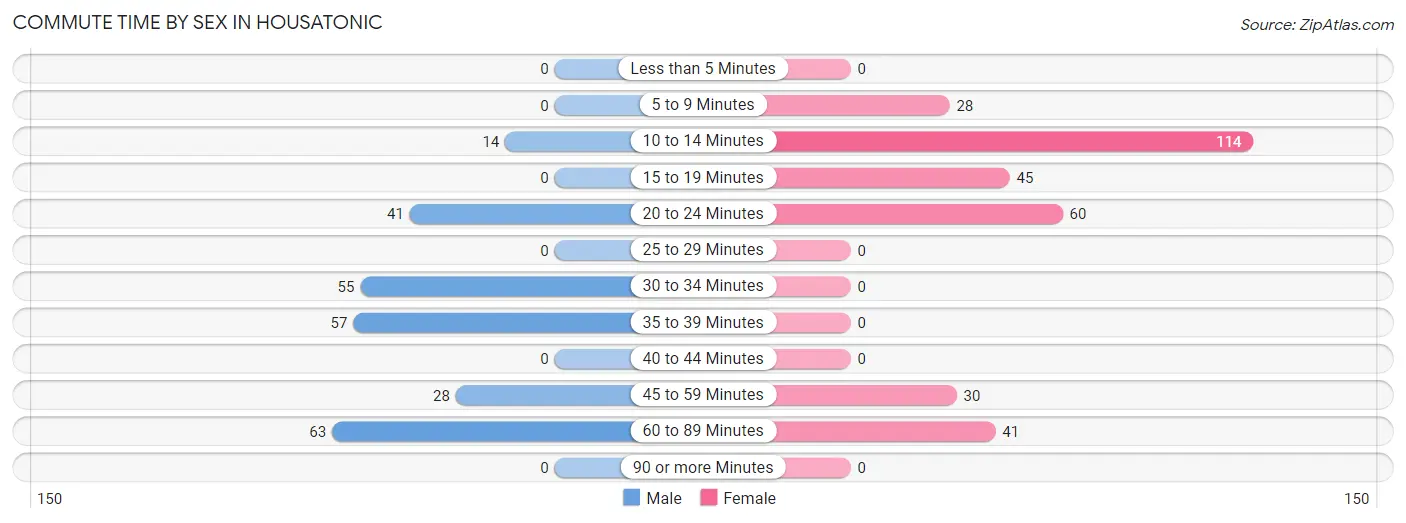
| Commute Time | Male | Female |
| Less than 5 Minutes | 0 (0.0%) | 0 (0.0%) |
| 5 to 9 Minutes | 0 (0.0%) | 28 (8.8%) |
| 10 to 14 Minutes | 14 (5.4%) | 114 (35.8%) |
| 15 to 19 Minutes | 0 (0.0%) | 45 (14.1%) |
| 20 to 24 Minutes | 41 (15.9%) | 60 (18.9%) |
| 25 to 29 Minutes | 0 (0.0%) | 0 (0.0%) |
| 30 to 34 Minutes | 55 (21.3%) | 0 (0.0%) |
| 35 to 39 Minutes | 57 (22.1%) | 0 (0.0%) |
| 40 to 44 Minutes | 0 (0.0%) | 0 (0.0%) |
| 45 to 59 Minutes | 28 (10.8%) | 30 (9.4%) |
| 60 to 89 Minutes | 63 (24.4%) | 41 (12.9%) |
| 90 or more Minutes | 0 (0.0%) | 0 (0.0%) |
Time of Departure to Work by Sex in Housatonic
The most frequent times of departure to work in Housatonic are 7:00 AM to 7:29 AM (83, 32.2%) for males and 7:30 AM to 7:59 AM (159, 50.0%) for females.
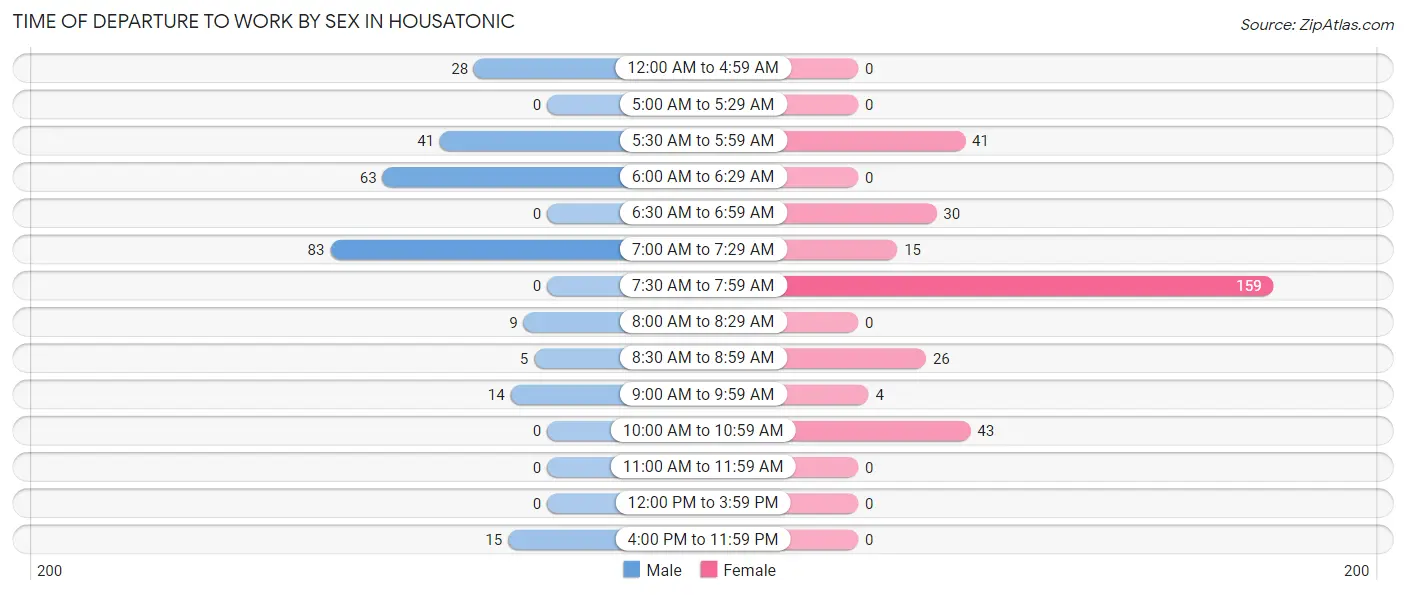
| Time of Departure | Male | Female |
| 12:00 AM to 4:59 AM | 28 (10.8%) | 0 (0.0%) |
| 5:00 AM to 5:29 AM | 0 (0.0%) | 0 (0.0%) |
| 5:30 AM to 5:59 AM | 41 (15.9%) | 41 (12.9%) |
| 6:00 AM to 6:29 AM | 63 (24.4%) | 0 (0.0%) |
| 6:30 AM to 6:59 AM | 0 (0.0%) | 30 (9.4%) |
| 7:00 AM to 7:29 AM | 83 (32.2%) | 15 (4.7%) |
| 7:30 AM to 7:59 AM | 0 (0.0%) | 159 (50.0%) |
| 8:00 AM to 8:29 AM | 9 (3.5%) | 0 (0.0%) |
| 8:30 AM to 8:59 AM | 5 (1.9%) | 26 (8.2%) |
| 9:00 AM to 9:59 AM | 14 (5.4%) | 4 (1.3%) |
| 10:00 AM to 10:59 AM | 0 (0.0%) | 43 (13.5%) |
| 11:00 AM to 11:59 AM | 0 (0.0%) | 0 (0.0%) |
| 12:00 PM to 3:59 PM | 0 (0.0%) | 0 (0.0%) |
| 4:00 PM to 11:59 PM | 15 (5.8%) | 0 (0.0%) |
| Total | 258 (100.0%) | 318 (100.0%) |
Housing Occupancy in Housatonic
Occupancy by Ownership in Housatonic
Of the total 522 dwellings in Housatonic, owner-occupied units account for 385 (73.8%), while renter-occupied units make up 137 (26.3%).
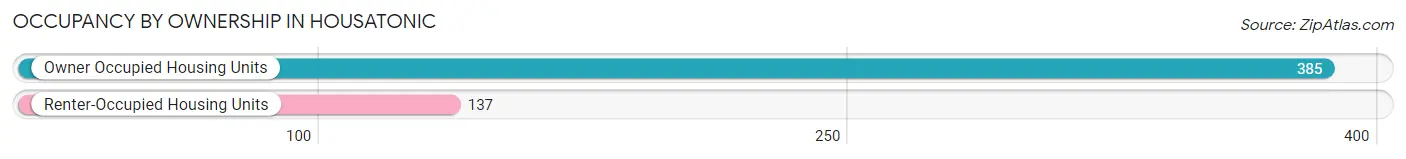
| Occupancy | # Housing Units | % Housing Units |
| Owner Occupied Housing Units | 385 | 73.8% |
| Renter-Occupied Housing Units | 137 | 26.3% |
| Total Occupied Housing Units | 522 | 100.0% |
Occupancy by Household Size in Housatonic
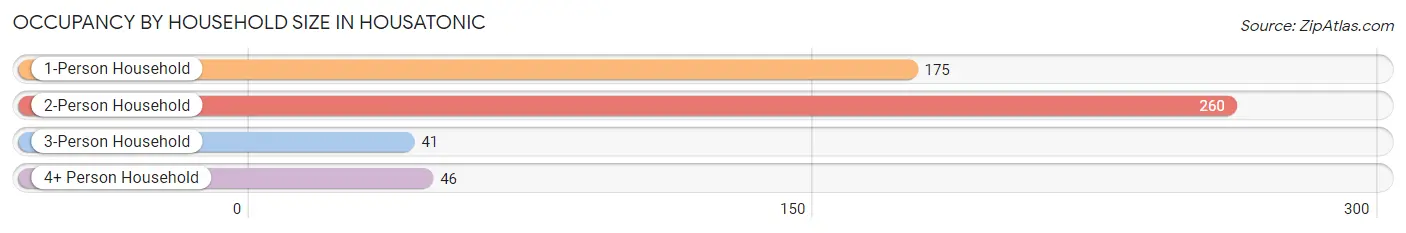
| Household Size | # Housing Units | % Housing Units |
| 1-Person Household | 175 | 33.5% |
| 2-Person Household | 260 | 49.8% |
| 3-Person Household | 41 | 7.9% |
| 4+ Person Household | 46 | 8.8% |
| Total Housing Units | 522 | 100.0% |
Occupancy by Ownership by Household Size in Housatonic
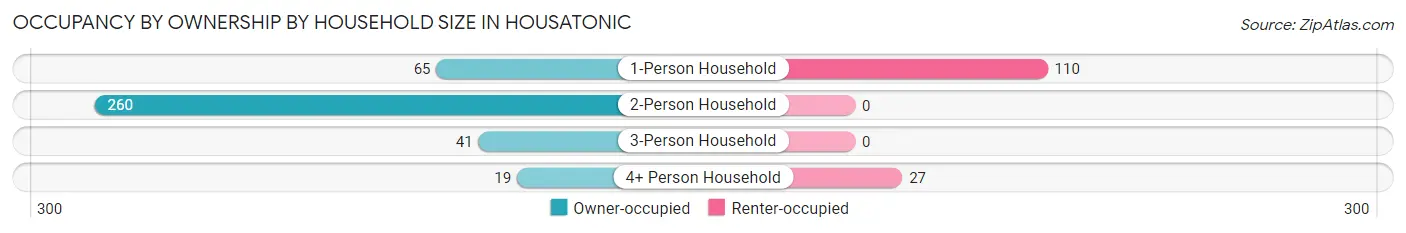
| Household Size | Owner-occupied | Renter-occupied |
| 1-Person Household | 65 (37.1%) | 110 (62.9%) |
| 2-Person Household | 260 (100.0%) | 0 (0.0%) |
| 3-Person Household | 41 (100.0%) | 0 (0.0%) |
| 4+ Person Household | 19 (41.3%) | 27 (58.7%) |
| Total Housing Units | 385 (73.8%) | 137 (26.3%) |
Occupancy by Educational Attainment in Housatonic
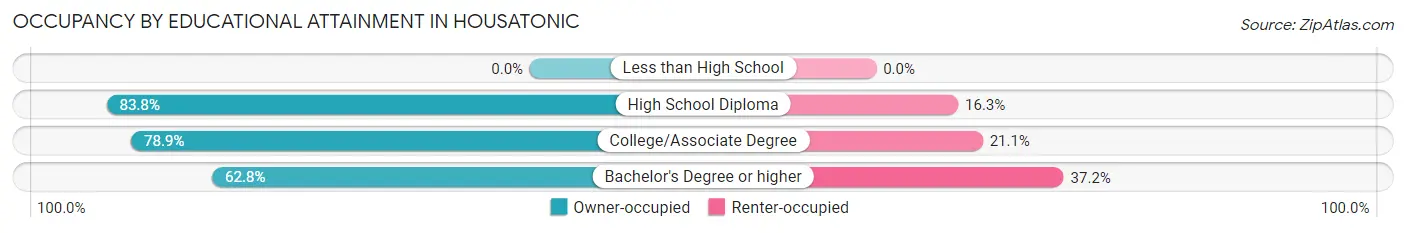
| Household Size | Owner-occupied | Renter-occupied |
| Less than High School | 0 (0.0%) | 0 (0.0%) |
| High School Diploma | 67 (83.8%) | 13 (16.3%) |
| College/Associate Degree | 198 (78.9%) | 53 (21.1%) |
| Bachelor's Degree or higher | 120 (62.8%) | 71 (37.2%) |
Occupancy by Age of Householder in Housatonic
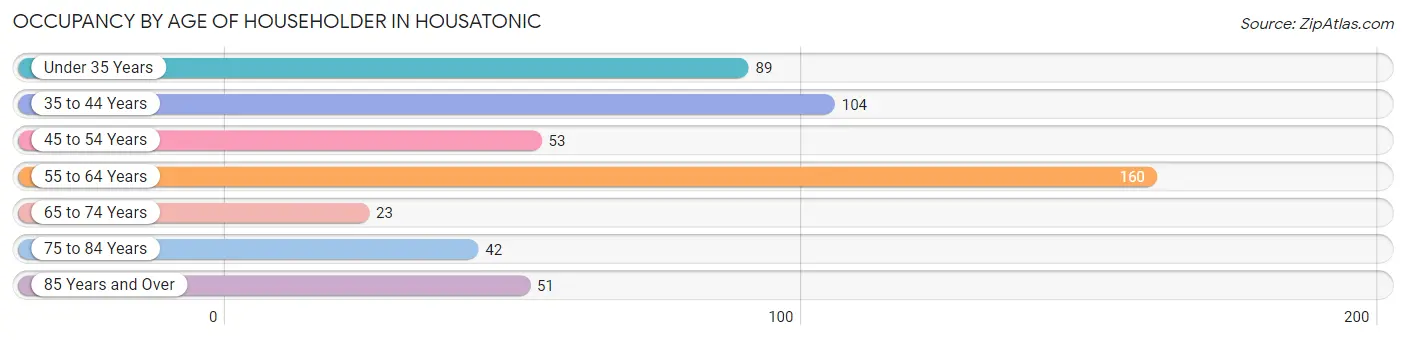
| Age Bracket | # Households | % Households |
| Under 35 Years | 89 | 17.1% |
| 35 to 44 Years | 104 | 19.9% |
| 45 to 54 Years | 53 | 10.2% |
| 55 to 64 Years | 160 | 30.6% |
| 65 to 74 Years | 23 | 4.4% |
| 75 to 84 Years | 42 | 8.1% |
| 85 Years and Over | 51 | 9.8% |
| Total | 522 | 100.0% |
Housing Finances in Housatonic
Median Income by Occupancy in Housatonic
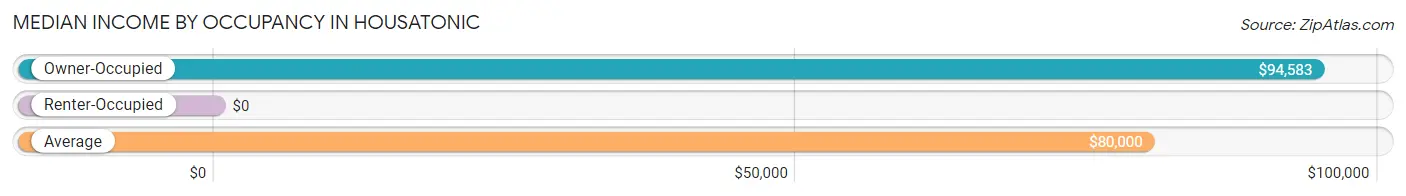
| Occupancy Type | # Households | Median Income |
| Owner-Occupied | 385 (73.8%) | $94,583 |
| Renter-Occupied | 137 (26.3%) | $0 |
| Average | 522 (100.0%) | $80,000 |
Occupancy by Householder Income Bracket in Housatonic
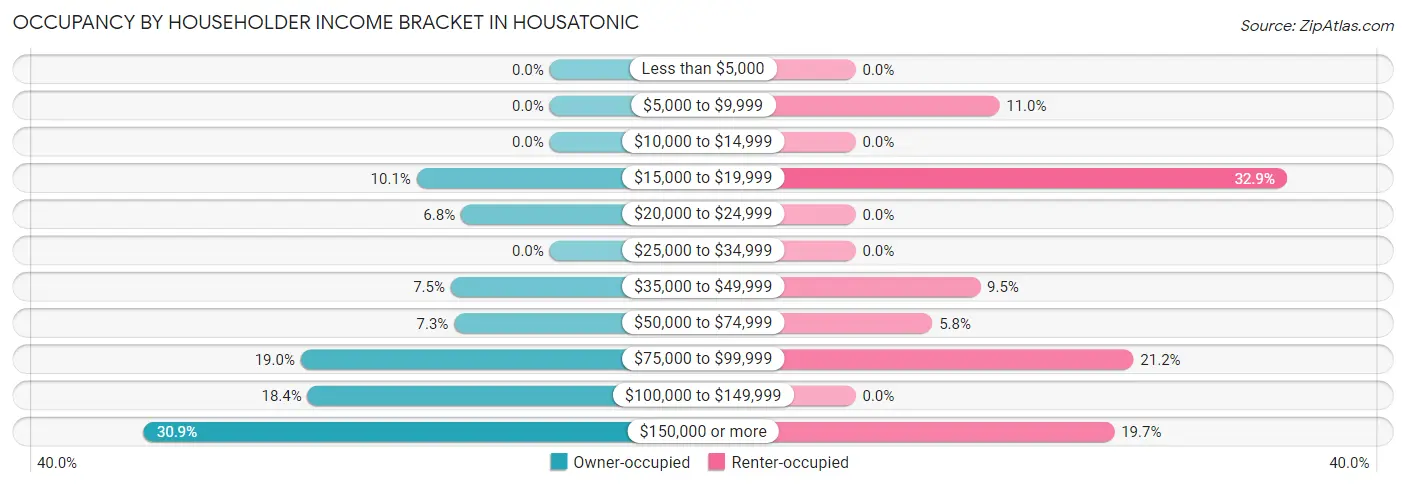
| Income Bracket | Owner-occupied | Renter-occupied |
| Less than $5,000 | 0 (0.0%) | 0 (0.0%) |
| $5,000 to $9,999 | 0 (0.0%) | 15 (11.0%) |
| $10,000 to $14,999 | 0 (0.0%) | 0 (0.0%) |
| $15,000 to $19,999 | 39 (10.1%) | 45 (32.9%) |
| $20,000 to $24,999 | 26 (6.8%) | 0 (0.0%) |
| $25,000 to $34,999 | 0 (0.0%) | 0 (0.0%) |
| $35,000 to $49,999 | 29 (7.5%) | 13 (9.5%) |
| $50,000 to $74,999 | 28 (7.3%) | 8 (5.8%) |
| $75,000 to $99,999 | 73 (19.0%) | 29 (21.2%) |
| $100,000 to $149,999 | 71 (18.4%) | 0 (0.0%) |
| $150,000 or more | 119 (30.9%) | 27 (19.7%) |
| Total | 385 (100.0%) | 137 (100.0%) |
Monthly Housing Cost Tiers in Housatonic
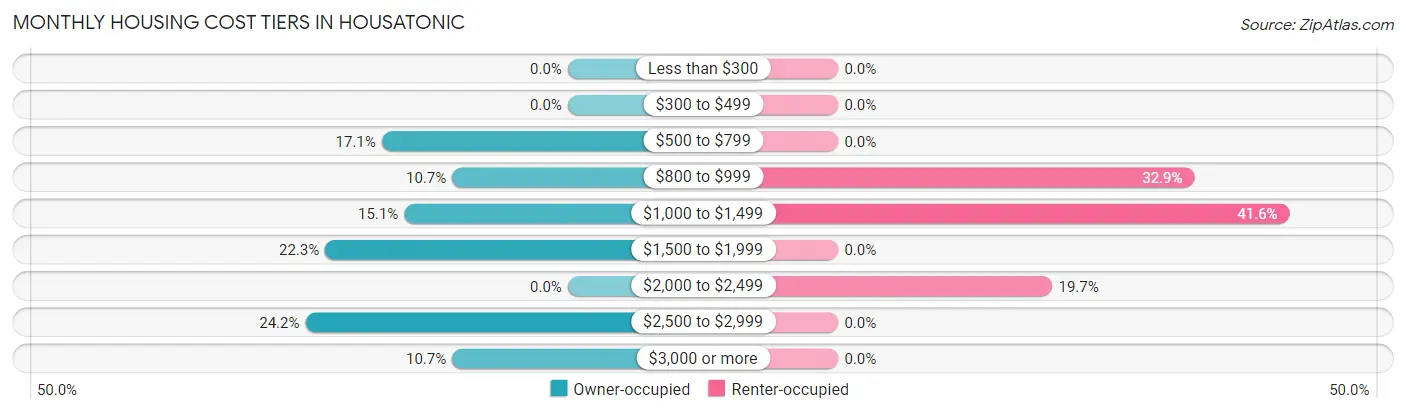
| Monthly Cost | Owner-occupied | Renter-occupied |
| Less than $300 | 0 (0.0%) | 0 (0.0%) |
| $300 to $499 | 0 (0.0%) | 0 (0.0%) |
| $500 to $799 | 66 (17.1%) | 0 (0.0%) |
| $800 to $999 | 41 (10.6%) | 45 (32.9%) |
| $1,000 to $1,499 | 58 (15.1%) | 57 (41.6%) |
| $1,500 to $1,999 | 86 (22.3%) | 0 (0.0%) |
| $2,000 to $2,499 | 0 (0.0%) | 27 (19.7%) |
| $2,500 to $2,999 | 93 (24.2%) | 0 (0.0%) |
| $3,000 or more | 41 (10.6%) | 0 (0.0%) |
| Total | 385 (100.0%) | 137 (100.0%) |
Physical Housing Characteristics in Housatonic
Housing Structures in Housatonic
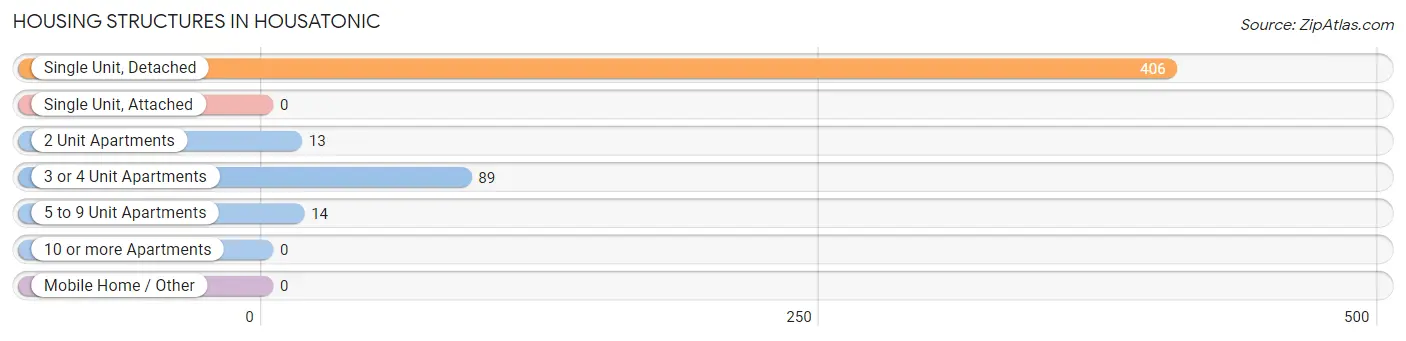
| Structure Type | # Housing Units | % Housing Units |
| Single Unit, Detached | 406 | 77.8% |
| Single Unit, Attached | 0 | 0.0% |
| 2 Unit Apartments | 13 | 2.5% |
| 3 or 4 Unit Apartments | 89 | 17.1% |
| 5 to 9 Unit Apartments | 14 | 2.7% |
| 10 or more Apartments | 0 | 0.0% |
| Mobile Home / Other | 0 | 0.0% |
| Total | 522 | 100.0% |
Housing Structures by Occupancy in Housatonic
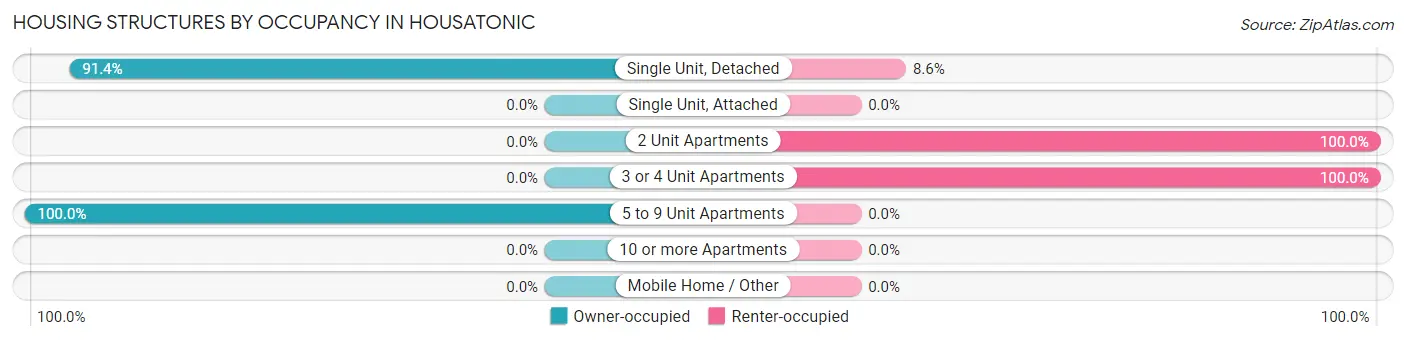
| Structure Type | Owner-occupied | Renter-occupied |
| Single Unit, Detached | 371 (91.4%) | 35 (8.6%) |
| Single Unit, Attached | 0 (0.0%) | 0 (0.0%) |
| 2 Unit Apartments | 0 (0.0%) | 13 (100.0%) |
| 3 or 4 Unit Apartments | 0 (0.0%) | 89 (100.0%) |
| 5 to 9 Unit Apartments | 14 (100.0%) | 0 (0.0%) |
| 10 or more Apartments | 0 (0.0%) | 0 (0.0%) |
| Mobile Home / Other | 0 (0.0%) | 0 (0.0%) |
| Total | 385 (73.8%) | 137 (26.3%) |
Housing Structures by Number of Rooms in Housatonic
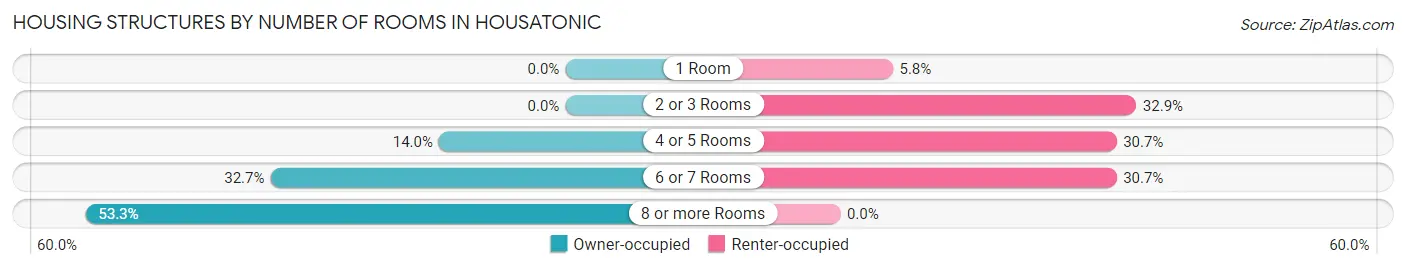
| Number of Rooms | Owner-occupied | Renter-occupied |
| 1 Room | 0 (0.0%) | 8 (5.8%) |
| 2 or 3 Rooms | 0 (0.0%) | 45 (32.9%) |
| 4 or 5 Rooms | 54 (14.0%) | 42 (30.7%) |
| 6 or 7 Rooms | 126 (32.7%) | 42 (30.7%) |
| 8 or more Rooms | 205 (53.2%) | 0 (0.0%) |
| Total | 385 (100.0%) | 137 (100.0%) |
Housing Structure by Heating Type in Housatonic
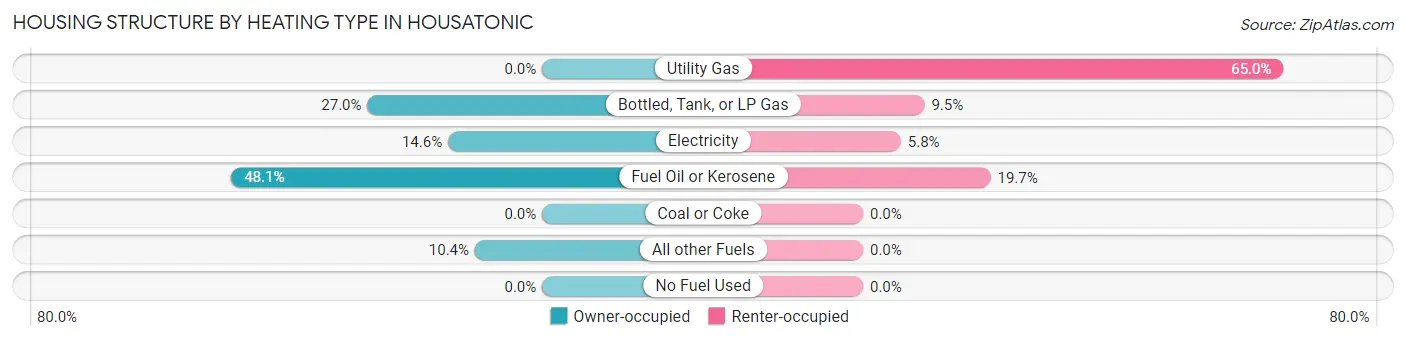
| Heating Type | Owner-occupied | Renter-occupied |
| Utility Gas | 0 (0.0%) | 89 (65.0%) |
| Bottled, Tank, or LP Gas | 104 (27.0%) | 13 (9.5%) |
| Electricity | 56 (14.5%) | 8 (5.8%) |
| Fuel Oil or Kerosene | 185 (48.0%) | 27 (19.7%) |
| Coal or Coke | 0 (0.0%) | 0 (0.0%) |
| All other Fuels | 40 (10.4%) | 0 (0.0%) |
| No Fuel Used | 0 (0.0%) | 0 (0.0%) |
| Total | 385 (100.0%) | 137 (100.0%) |
Household Vehicle Usage in Housatonic
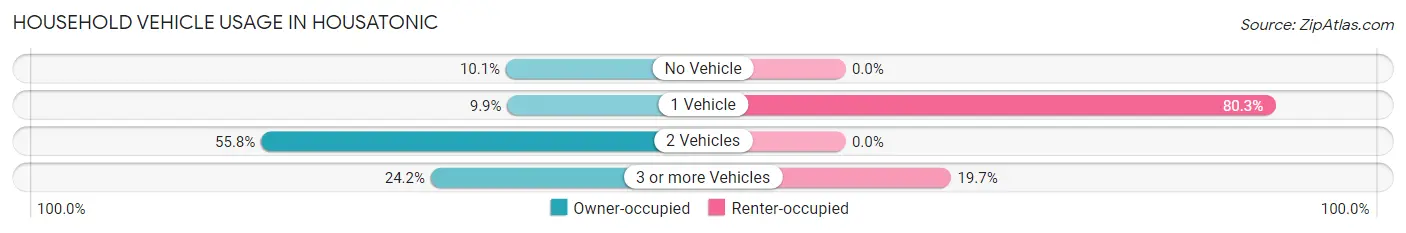
| Vehicles per Household | Owner-occupied | Renter-occupied |
| No Vehicle | 39 (10.1%) | 0 (0.0%) |
| 1 Vehicle | 38 (9.9%) | 110 (80.3%) |
| 2 Vehicles | 215 (55.8%) | 0 (0.0%) |
| 3 or more Vehicles | 93 (24.2%) | 27 (19.7%) |
| Total | 385 (100.0%) | 137 (100.0%) |
Real Estate & Mortgages in Housatonic
Real Estate and Mortgage Overview in Housatonic
| Characteristic | Without Mortgage | With Mortgage |
| Housing Units | 139 | 246 |
| Median Property Value | $391,900 | $420,200 |
| Median Household Income | - | - |
| Monthly Housing Costs | $909 | $41 |
| Real Estate Taxes | $4,424 | $0 |
Property Value by Mortgage Status in Housatonic
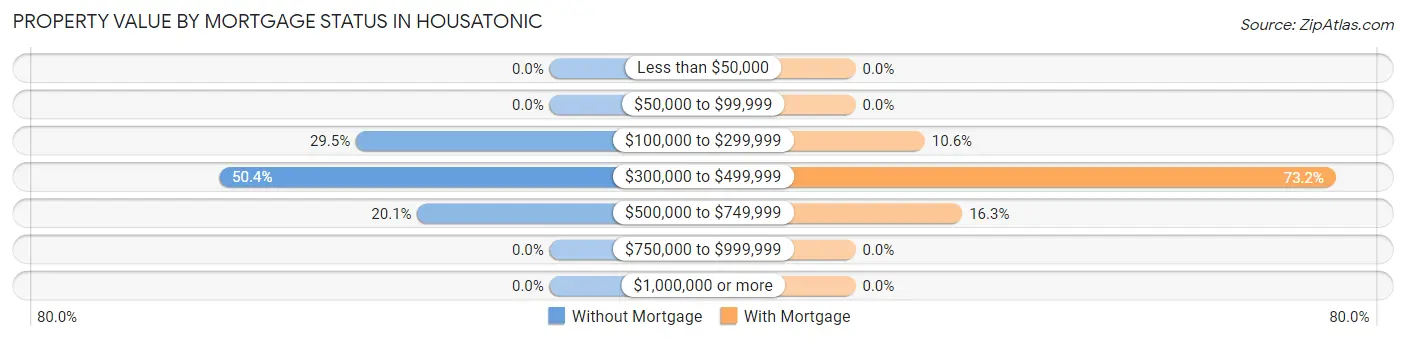
| Property Value | Without Mortgage | With Mortgage |
| Less than $50,000 | 0 (0.0%) | 0 (0.0%) |
| $50,000 to $99,999 | 0 (0.0%) | 0 (0.0%) |
| $100,000 to $299,999 | 41 (29.5%) | 26 (10.6%) |
| $300,000 to $499,999 | 70 (50.4%) | 180 (73.2%) |
| $500,000 to $749,999 | 28 (20.1%) | 40 (16.3%) |
| $750,000 to $999,999 | 0 (0.0%) | 0 (0.0%) |
| $1,000,000 or more | 0 (0.0%) | 0 (0.0%) |
| Total | 139 (100.0%) | 246 (100.0%) |
Household Income by Mortgage Status in Housatonic
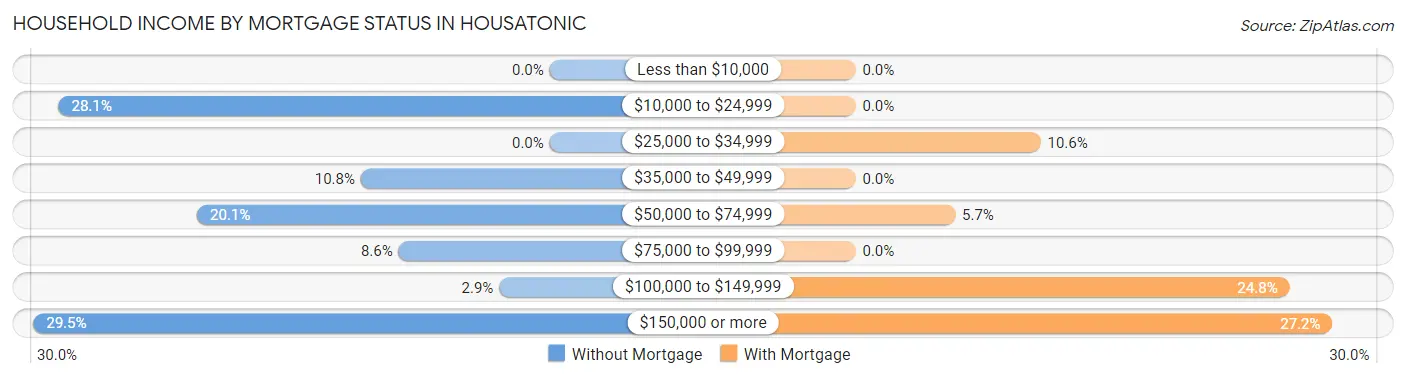
| Household Income | Without Mortgage | With Mortgage |
| Less than $10,000 | 0 (0.0%) | 0 (0.0%) |
| $10,000 to $24,999 | 39 (28.1%) | 0 (0.0%) |
| $25,000 to $34,999 | 0 (0.0%) | 26 (10.6%) |
| $35,000 to $49,999 | 15 (10.8%) | 0 (0.0%) |
| $50,000 to $74,999 | 28 (20.1%) | 14 (5.7%) |
| $75,000 to $99,999 | 12 (8.6%) | 0 (0.0%) |
| $100,000 to $149,999 | 4 (2.9%) | 61 (24.8%) |
| $150,000 or more | 41 (29.5%) | 67 (27.2%) |
| Total | 139 (100.0%) | 246 (100.0%) |
Property Value to Household Income Ratio in Housatonic
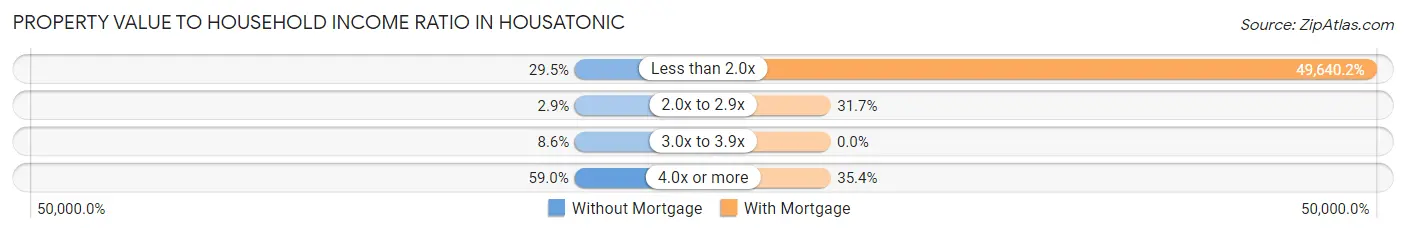
| Value-to-Income Ratio | Without Mortgage | With Mortgage |
| Less than 2.0x | 41 (29.5%) | 122,115 (49,640.2%) |
| 2.0x to 2.9x | 4 (2.9%) | 78 (31.7%) |
| 3.0x to 3.9x | 12 (8.6%) | 0 (0.0%) |
| 4.0x or more | 82 (59.0%) | 87 (35.4%) |
| Total | 139 (100.0%) | 246 (100.0%) |
Real Estate Taxes by Mortgage Status in Housatonic
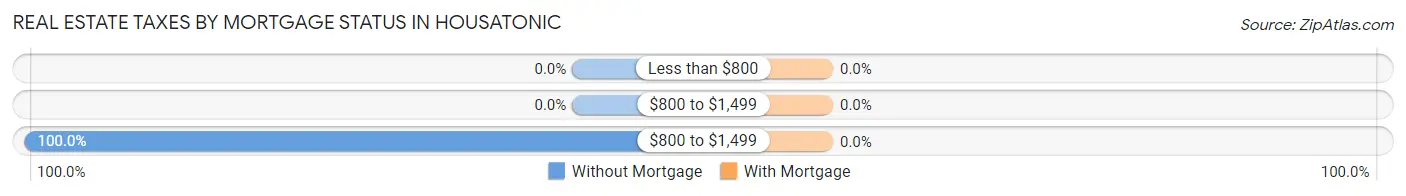
| Property Taxes | Without Mortgage | With Mortgage |
| Less than $800 | 0 (0.0%) | 0 (0.0%) |
| $800 to $1,499 | 0 (0.0%) | 0 (0.0%) |
| $800 to $1,499 | 139 (100.0%) | 0 (0.0%) |
| Total | 139 (100.0%) | 246 (100.0%) |
Health & Disability in Housatonic
Health Insurance Coverage by Age in Housatonic
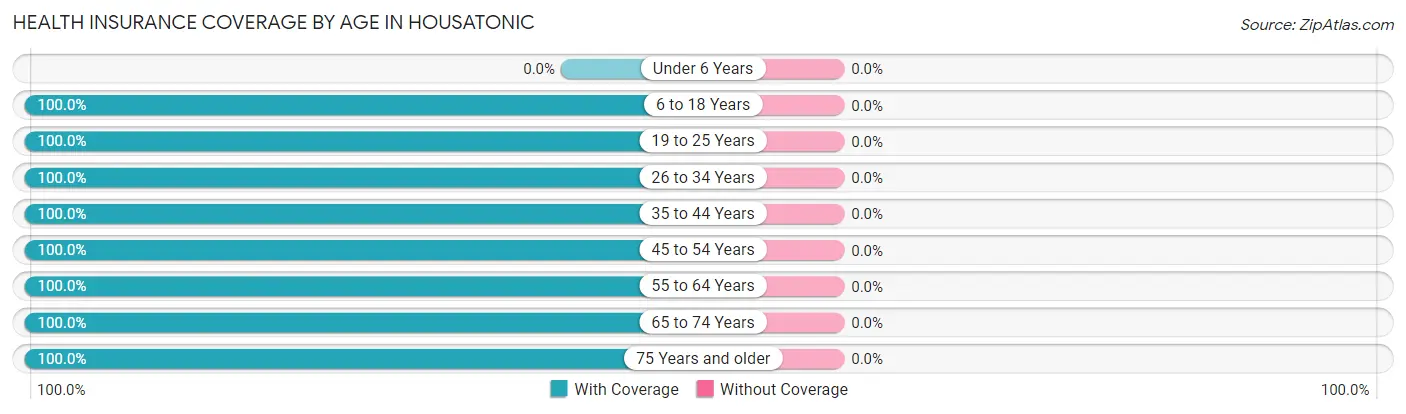
| Age Bracket | With Coverage | Without Coverage |
| Under 6 Years | 0 (0.0%) | 0 (0.0%) |
| 6 to 18 Years | 85 (100.0%) | 0 (0.0%) |
| 19 to 25 Years | 45 (100.0%) | 0 (0.0%) |
| 26 to 34 Years | 86 (100.0%) | 0 (0.0%) |
| 35 to 44 Years | 181 (100.0%) | 0 (0.0%) |
| 45 to 54 Years | 103 (100.0%) | 0 (0.0%) |
| 55 to 64 Years | 312 (100.0%) | 0 (0.0%) |
| 65 to 74 Years | 80 (100.0%) | 0 (0.0%) |
| 75 Years and older | 93 (100.0%) | 0 (0.0%) |
| Total | 985 (100.0%) | 0 (0.0%) |
Health Insurance Coverage by Citizenship Status in Housatonic
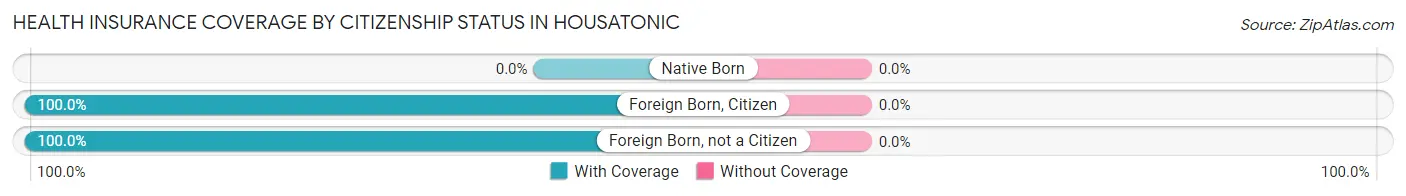
| Citizenship Status | With Coverage | Without Coverage |
| Native Born | 0 (0.0%) | 0 (0.0%) |
| Foreign Born, Citizen | 85 (100.0%) | 0 (0.0%) |
| Foreign Born, not a Citizen | 45 (100.0%) | 0 (0.0%) |
Health Insurance Coverage by Household Income in Housatonic
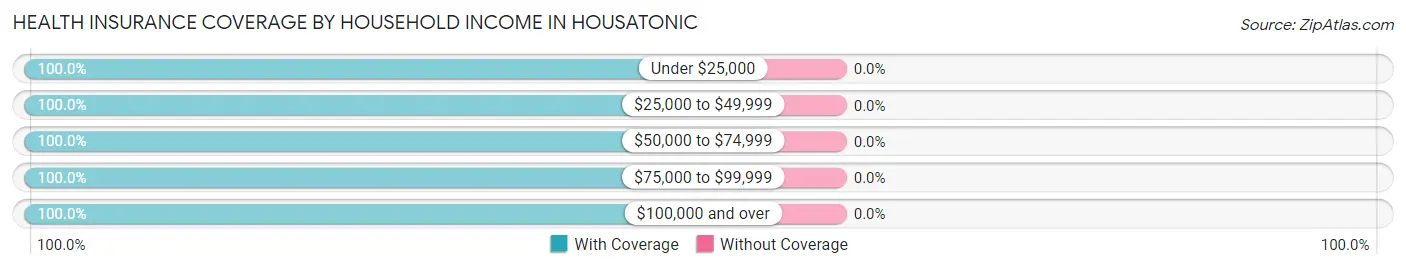
| Household Income | With Coverage | Without Coverage |
| Under $25,000 | 125 (100.0%) | 0 (0.0%) |
| $25,000 to $49,999 | 65 (100.0%) | 0 (0.0%) |
| $50,000 to $74,999 | 62 (100.0%) | 0 (0.0%) |
| $75,000 to $99,999 | 198 (100.0%) | 0 (0.0%) |
| $100,000 and over | 527 (100.0%) | 0 (0.0%) |
Public vs Private Health Insurance Coverage by Age in Housatonic
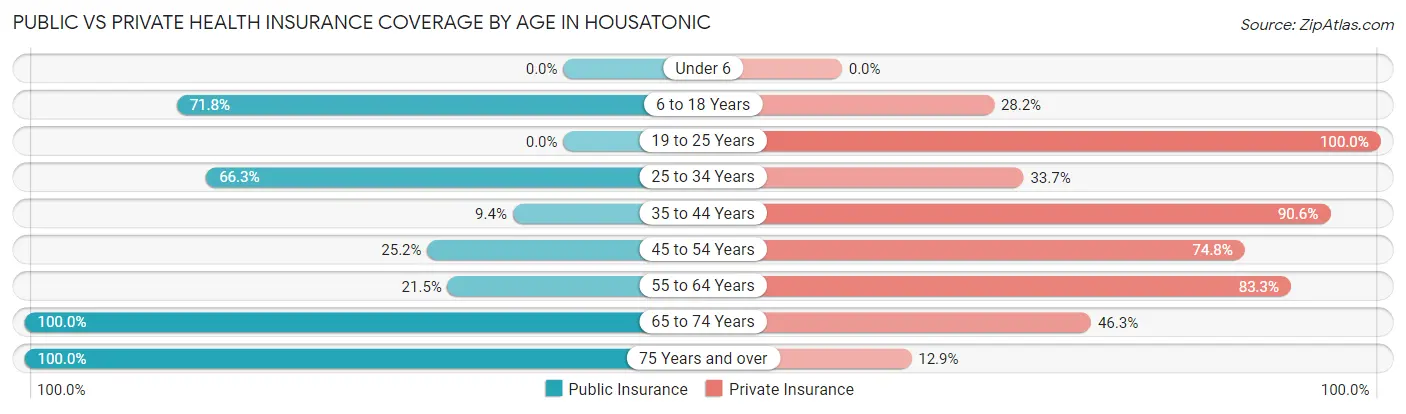
| Age Bracket | Public Insurance | Private Insurance |
| Under 6 | 0 (0.0%) | 0 (0.0%) |
| 6 to 18 Years | 61 (71.8%) | 24 (28.2%) |
| 19 to 25 Years | 0 (0.0%) | 45 (100.0%) |
| 25 to 34 Years | 57 (66.3%) | 29 (33.7%) |
| 35 to 44 Years | 17 (9.4%) | 164 (90.6%) |
| 45 to 54 Years | 26 (25.2%) | 77 (74.8%) |
| 55 to 64 Years | 67 (21.5%) | 260 (83.3%) |
| 65 to 74 Years | 80 (100.0%) | 37 (46.3%) |
| 75 Years and over | 93 (100.0%) | 12 (12.9%) |
| Total | 401 (40.7%) | 648 (65.8%) |
Disability Status by Sex by Age in Housatonic
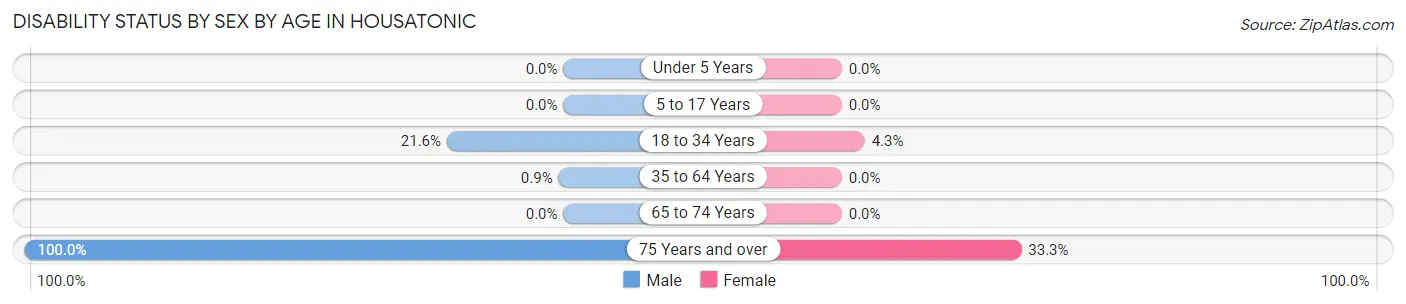
| Age Bracket | Male | Female |
| Under 5 Years | 0 (0.0%) | 0 (0.0%) |
| 5 to 17 Years | 0 (0.0%) | 0 (0.0%) |
| 18 to 34 Years | 8 (21.6%) | 4 (4.3%) |
| 35 to 64 Years | 3 (0.9%) | 0 (0.0%) |
| 65 to 74 Years | 0 (0.0%) | 0 (0.0%) |
| 75 Years and over | 12 (100.0%) | 27 (33.3%) |
Disability Class by Sex by Age in Housatonic
Disability Class: Hearing Difficulty
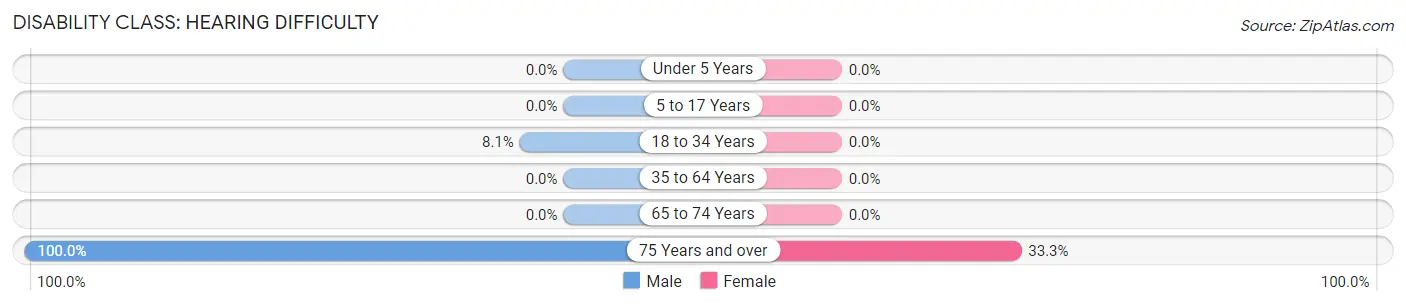
| Age Bracket | Male | Female |
| Under 5 Years | 0 (0.0%) | 0 (0.0%) |
| 5 to 17 Years | 0 (0.0%) | 0 (0.0%) |
| 18 to 34 Years | 3 (8.1%) | 0 (0.0%) |
| 35 to 64 Years | 0 (0.0%) | 0 (0.0%) |
| 65 to 74 Years | 0 (0.0%) | 0 (0.0%) |
| 75 Years and over | 12 (100.0%) | 27 (33.3%) |
Disability Class: Vision Difficulty
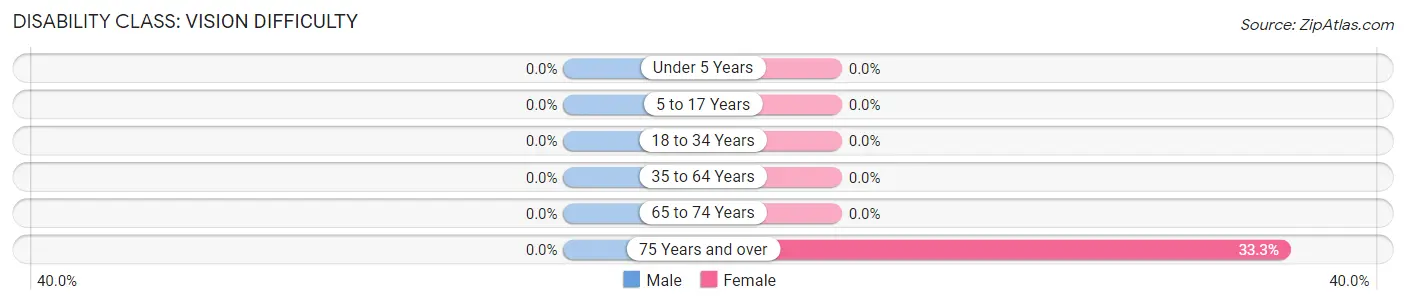
| Age Bracket | Male | Female |
| Under 5 Years | 0 (0.0%) | 0 (0.0%) |
| 5 to 17 Years | 0 (0.0%) | 0 (0.0%) |
| 18 to 34 Years | 0 (0.0%) | 0 (0.0%) |
| 35 to 64 Years | 0 (0.0%) | 0 (0.0%) |
| 65 to 74 Years | 0 (0.0%) | 0 (0.0%) |
| 75 Years and over | 0 (0.0%) | 27 (33.3%) |
Disability Class: Cognitive Difficulty
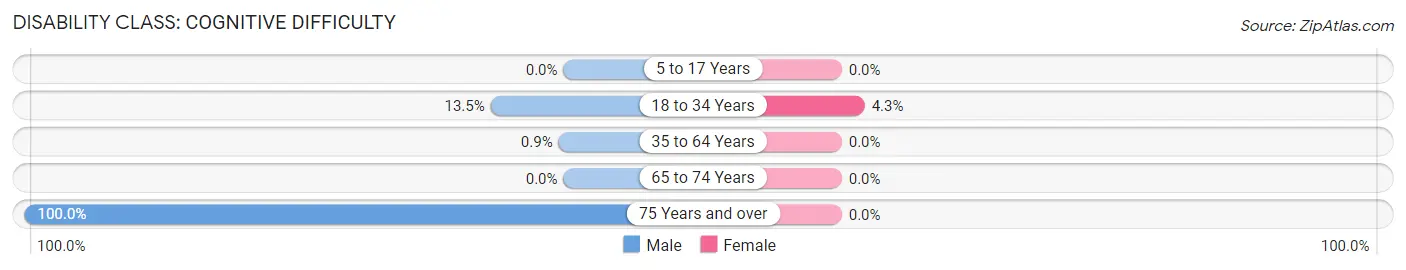
| Age Bracket | Male | Female |
| 5 to 17 Years | 0 (0.0%) | 0 (0.0%) |
| 18 to 34 Years | 5 (13.5%) | 4 (4.3%) |
| 35 to 64 Years | 3 (0.9%) | 0 (0.0%) |
| 65 to 74 Years | 0 (0.0%) | 0 (0.0%) |
| 75 Years and over | 12 (100.0%) | 0 (0.0%) |
Disability Class: Ambulatory Difficulty
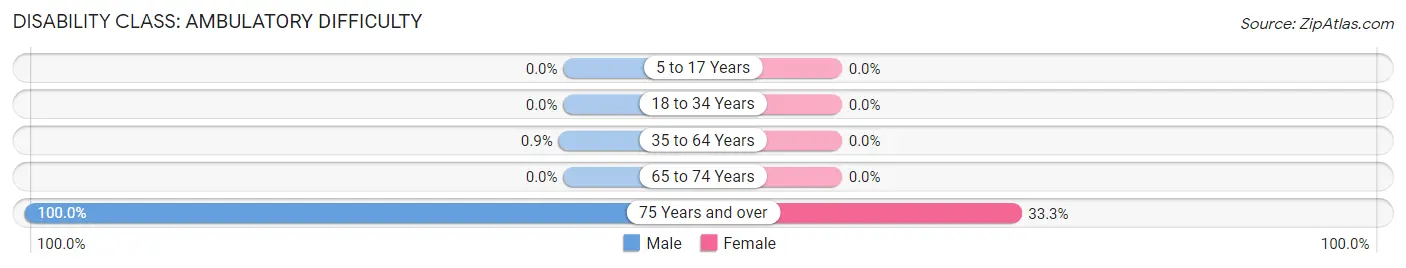
| Age Bracket | Male | Female |
| 5 to 17 Years | 0 (0.0%) | 0 (0.0%) |
| 18 to 34 Years | 0 (0.0%) | 0 (0.0%) |
| 35 to 64 Years | 3 (0.9%) | 0 (0.0%) |
| 65 to 74 Years | 0 (0.0%) | 0 (0.0%) |
| 75 Years and over | 12 (100.0%) | 27 (33.3%) |
Disability Class: Self-Care Difficulty
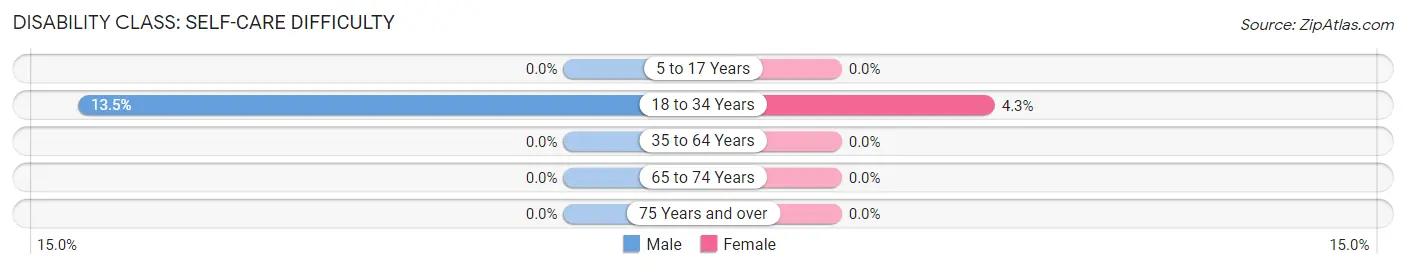
| Age Bracket | Male | Female |
| 5 to 17 Years | 0 (0.0%) | 0 (0.0%) |
| 18 to 34 Years | 5 (13.5%) | 4 (4.3%) |
| 35 to 64 Years | 0 (0.0%) | 0 (0.0%) |
| 65 to 74 Years | 0 (0.0%) | 0 (0.0%) |
| 75 Years and over | 0 (0.0%) | 0 (0.0%) |
Technology Access in Housatonic
Computing Device Access in Housatonic
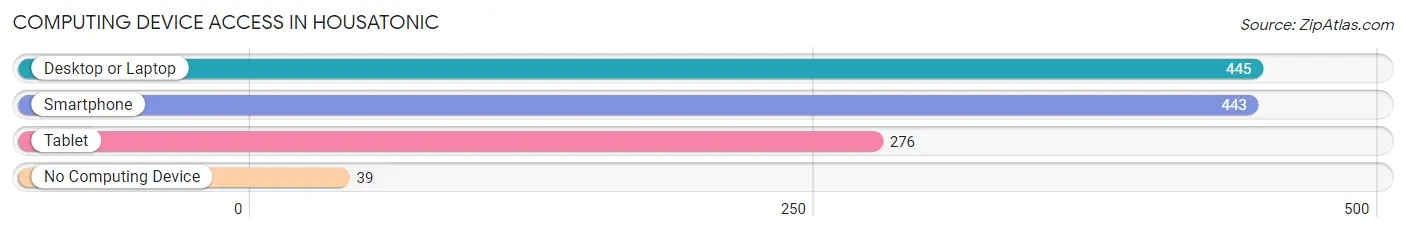
| Device Type | # Households | % Households |
| Desktop or Laptop | 445 | 85.3% |
| Smartphone | 443 | 84.9% |
| Tablet | 276 | 52.9% |
| No Computing Device | 39 | 7.5% |
| Total | 522 | 100.0% |
Internet Access in Housatonic
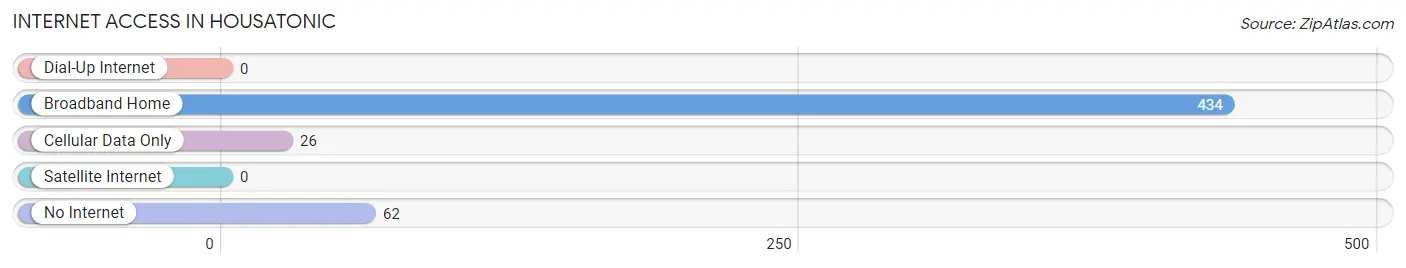
| Internet Type | # Households | % Households |
| Dial-Up Internet | 0 | 0.0% |
| Broadband Home | 434 | 83.1% |
| Cellular Data Only | 26 | 5.0% |
| Satellite Internet | 0 | 0.0% |
| No Internet | 62 | 11.9% |
| Total | 522 | 100.0% |
Housatonic Summary
Housatonic, Massachusetts is a small town located in the Berkshire Hills of western Massachusetts. It is situated in the southeastern corner of Berkshire County, and is bordered by the towns of Great Barrington, Sheffield, and Egremont. The town has a population of 1,717 people, according to the 2010 census.
History
Housatonic was first settled in 1762 by a group of settlers from Connecticut. The town was originally part of Great Barrington, but was incorporated as its own town in 1776. The town was named after the Housatonic River, which runs through the town.
The town was primarily an agricultural community for much of its history, with dairy farming being the main industry. In the late 19th century, the town began to develop a small manufacturing industry, with several small factories producing textiles, paper, and other goods.
Geography
Housatonic is located in the southeastern corner of Berkshire County, and is bordered by the towns of Great Barrington, Sheffield, and Egremont. The town is situated in the Berkshire Hills, and is surrounded by rolling hills and forests. The town is located at the confluence of the Housatonic and Green Rivers, and is home to several small lakes and ponds.
The town has a total area of 10.2 square miles, of which 10.1 square miles is land and 0.1 square miles is water. The town is located approximately 90 miles west of Boston, and is accessible by Route 7 and Route 20.
Economy
Housatonic is a small, rural town with a limited economy. The town is primarily a bedroom community, with many of its residents commuting to nearby towns and cities for work. The town does have a few small businesses, including a few restaurants, a grocery store, and a few small retail stores.
The town is also home to several small manufacturing companies, including a paper mill, a textile mill, and a plastics factory. The town is also home to a small airport, which is used for private and recreational flights.
Demographics
According to the 2010 census, Housatonic has a population of 1,717 people. The town has a median household income of $50,000, and a median family income of $60,000. The town has a poverty rate of 8.3%, and a median age of 44.7 years.
The town is predominantly white, with 92.3% of the population identifying as white. The town also has a small Hispanic population, with 4.2% of the population identifying as Hispanic or Latino. The town also has a small African American population, with 1.2% of the population identifying as African American.
Conclusion
Housatonic, Massachusetts is a small town located in the Berkshire Hills of western Massachusetts. It has a population of 1,717 people, and is primarily a bedroom community, with many of its residents commuting to nearby towns and cities for work. The town has a limited economy, with a few small businesses and manufacturing companies. The town is predominantly white, with 92.3% of the population identifying as white. The town also has a small Hispanic population, with 4.2% of the population identifying as Hispanic or Latino.
Common Questions
What is Per Capita Income in Housatonic?
Per Capita income in Housatonic is $66,455.
What is the Median Family Income in Housatonic?
Median Family Income in Housatonic is $138,323.
What is the Median Household income in Housatonic?
Median Household Income in Housatonic is $80,000.
What is Inequality or Gini Index in Housatonic?
Inequality or Gini Index in Housatonic is 0.48.
What is the Total Population of Housatonic?
Total Population of Housatonic is 985.
What is the Total Male Population of Housatonic?
Total Male Population of Housatonic is 398.
What is the Total Female Population of Housatonic?
Total Female Population of Housatonic is 587.
What is the Ratio of Males per 100 Females in Housatonic?
There are 67.80 Males per 100 Females in Housatonic.
What is the Ratio of Females per 100 Males in Housatonic?
There are 147.49 Females per 100 Males in Housatonic.
What is the Median Population Age in Housatonic?
Median Population Age in Housatonic is 54.7 Years.
What is the Average Family Size in Housatonic
Average Family Size in Housatonic is 2.3 People.
What is the Average Household Size in Housatonic
Average Household Size in Housatonic is 1.9 People.
How Large is the Labor Force in Housatonic?
There are 758 People in the Labor Forcein in Housatonic.
What is the Percentage of People in the Labor Force in Housatonic?
84.2% of People are in the Labor Force in Housatonic.