St Helena, CA Map & Demographics
St Helena Map
St Helena Overview
$105,719
PER CAPITA INCOME
$161,833
AVG FAMILY INCOME
$135,781
AVG HOUSEHOLD INCOME
39.3%
WAGE / INCOME GAP [ % ]
60.7¢/ $1
WAGE / INCOME GAP [ $ ]
0.54
INEQUALITY / GINI INDEX
5,426
TOTAL POPULATION
2,683
MALE POPULATION
2,743
FEMALE POPULATION
97.81
MALES / 100 FEMALES
102.24
FEMALES / 100 MALES
48.4
MEDIAN AGE
2.6
AVG FAMILY SIZE
2.2
AVG HOUSEHOLD SIZE
2,653
LABOR FORCE [ PEOPLE ]
56.6%
PERCENT IN LABOR FORCE
3.2%
UNEMPLOYMENT RATE
Income in St Helena
Income Overview in St Helena
Per Capita Income in St Helena is $105,719, while median incomes of families and households are $161,833 and $135,781 respectively.
| Characteristic | Number | Measure |
| Per Capita Income | 5,426 | $105,719 |
| Median Family Income | 1,616 | $161,833 |
| Mean Family Income | 1,616 | $290,156 |
| Median Household Income | 2,466 | $135,781 |
| Mean Household Income | 2,466 | $231,877 |
| Income Deficit | 1,616 | $0 |
| Wage / Income Gap (%) | 5,426 | 39.27% |
| Wage / Income Gap ($) | 5,426 | 60.73¢ per $1 |
| Gini / Inequality Index | 5,426 | 0.54 |
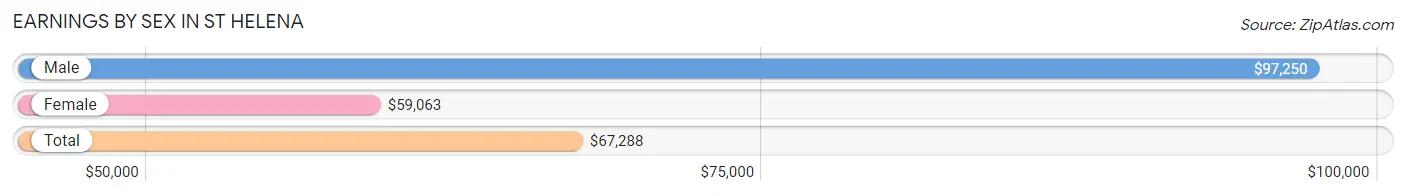
Earnings by Sex in St Helena
Average Earnings in St Helena are $67,288, $97,250 for men and $59,063 for women, a difference of 39.3%.
| Sex | Number | Average Earnings |
| Male | 1,582 (56.2%) | $97,250 |
| Female | 1,235 (43.8%) | $59,063 |
| Total | 2,817 (100.0%) | $67,288 |
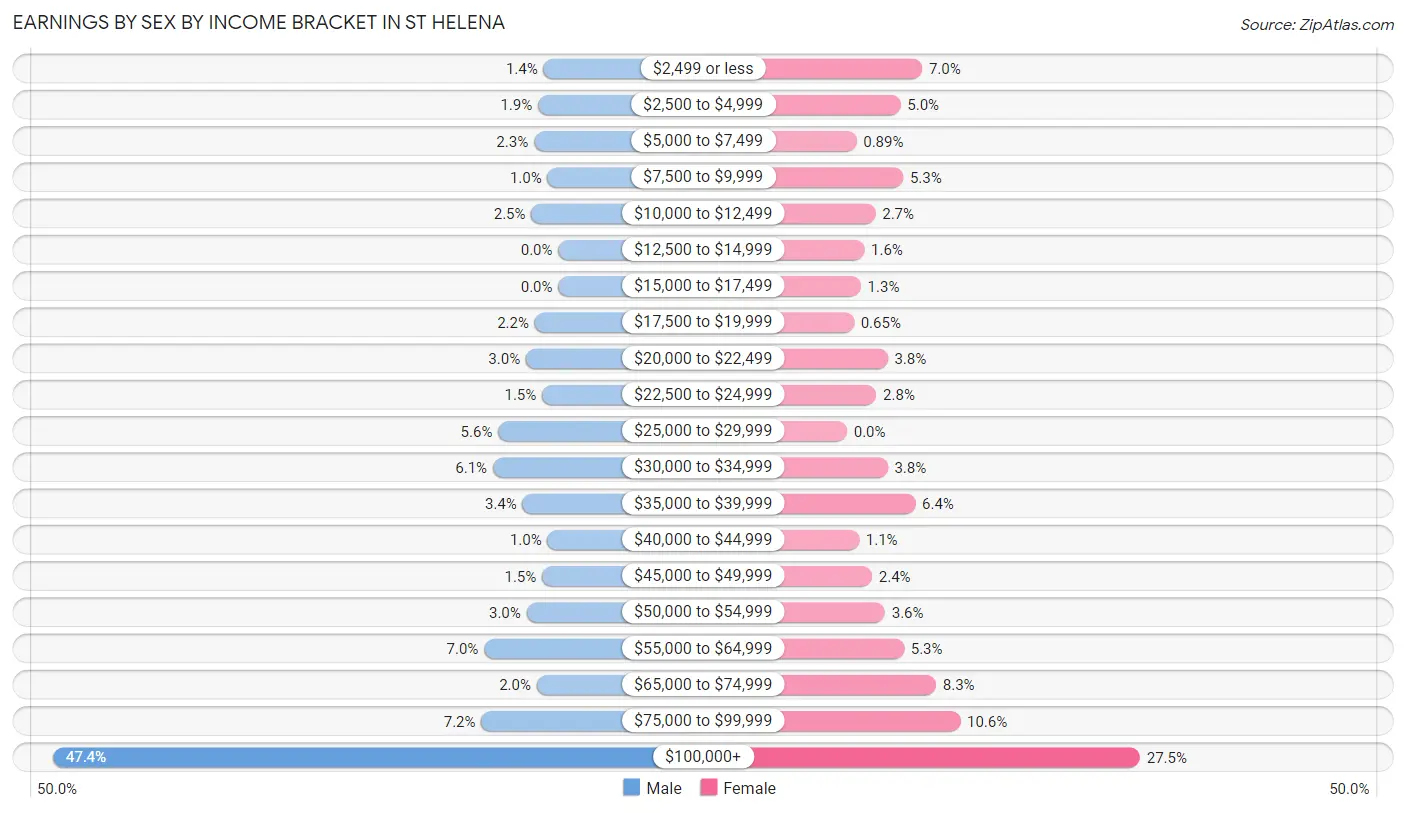
Earnings by Sex by Income Bracket in St Helena
The most common earnings brackets in St Helena are $100,000+ for men (749 | 47.3%) and $100,000+ for women (339 | 27.5%).
| Income | Male | Female |
| $2,499 or less | 22 (1.4%) | 87 (7.0%) |
| $2,500 to $4,999 | 30 (1.9%) | 62 (5.0%) |
| $5,000 to $7,499 | 36 (2.3%) | 11 (0.9%) |
| $7,500 to $9,999 | 16 (1.0%) | 65 (5.3%) |
| $10,000 to $12,499 | 40 (2.5%) | 33 (2.7%) |
| $12,500 to $14,999 | 0 (0.0%) | 20 (1.6%) |
| $15,000 to $17,499 | 0 (0.0%) | 16 (1.3%) |
| $17,500 to $19,999 | 35 (2.2%) | 8 (0.6%) |
| $20,000 to $22,499 | 48 (3.0%) | 47 (3.8%) |
| $22,500 to $24,999 | 24 (1.5%) | 34 (2.8%) |
| $25,000 to $29,999 | 89 (5.6%) | 0 (0.0%) |
| $30,000 to $34,999 | 97 (6.1%) | 47 (3.8%) |
| $35,000 to $39,999 | 53 (3.4%) | 79 (6.4%) |
| $40,000 to $44,999 | 16 (1.0%) | 14 (1.1%) |
| $45,000 to $49,999 | 24 (1.5%) | 29 (2.4%) |
| $50,000 to $54,999 | 47 (3.0%) | 44 (3.6%) |
| $55,000 to $64,999 | 110 (7.0%) | 66 (5.3%) |
| $65,000 to $74,999 | 32 (2.0%) | 103 (8.3%) |
| $75,000 to $99,999 | 114 (7.2%) | 131 (10.6%) |
| $100,000+ | 749 (47.3%) | 339 (27.5%) |
| Total | 1,582 (100.0%) | 1,235 (100.0%) |
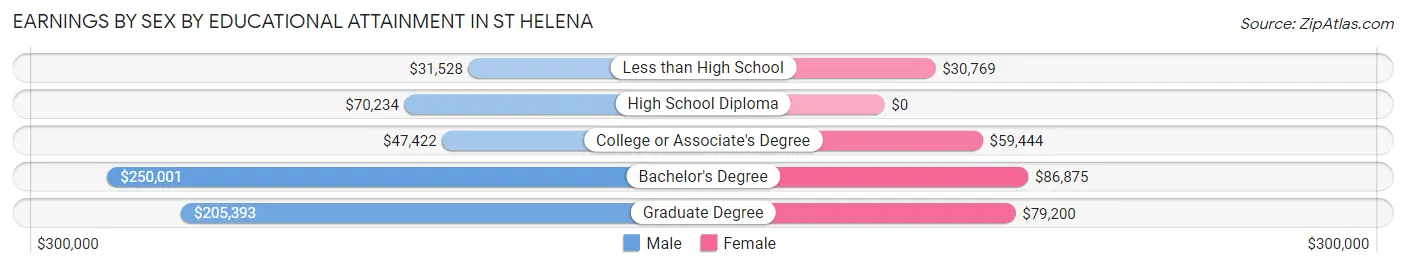
Earnings by Sex by Educational Attainment in St Helena
Average earnings in St Helena are $108,618 for men and $65,763 for women, a difference of 39.5%. Men with an educational attainment of bachelor's degree enjoy the highest average annual earnings of $250,001, while those with less than high school education earn the least with $31,528. Women with an educational attainment of bachelor's degree earn the most with the average annual earnings of $86,875, while those with less than high school education have the smallest earnings of $30,769.
| Educational Attainment | Male Income | Female Income |
| Less than High School | $31,528 | $30,769 |
| High School Diploma | $70,234 | $0 |
| College or Associate's Degree | $47,422 | $59,444 |
| Bachelor's Degree | $250,001 | $86,875 |
| Graduate Degree | $205,393 | $79,200 |
| Total | $108,618 | $65,763 |
Family Income in St Helena
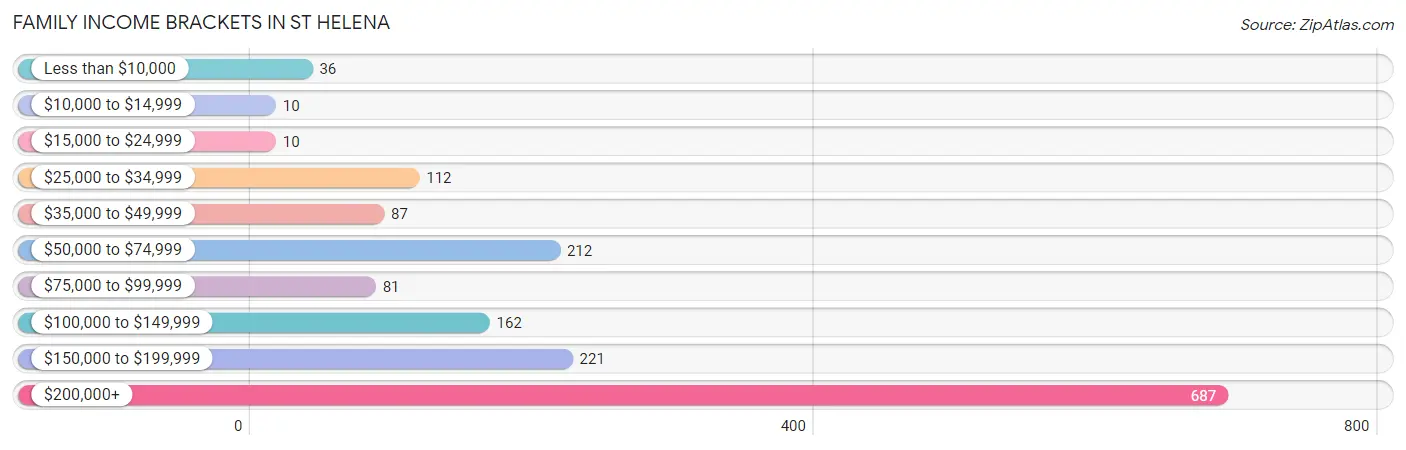
Family Income Brackets in St Helena
According to the St Helena family income data, there are 687 families falling into the $200,000+ income range, which is the most common income bracket and makes up 42.5% of all families. Conversely, the $10,000 to $14,999 income bracket is the least frequent group with only 10 families (0.6%) belonging to this category.
| Income Bracket | # Families | % Families |
| Less than $10,000 | 36 | 2.2% |
| $10,000 to $14,999 | 10 | 0.6% |
| $15,000 to $24,999 | 10 | 0.6% |
| $25,000 to $34,999 | 112 | 6.9% |
| $35,000 to $49,999 | 87 | 5.4% |
| $50,000 to $74,999 | 212 | 13.1% |
| $75,000 to $99,999 | 81 | 5.0% |
| $100,000 to $149,999 | 162 | 10.0% |
| $150,000 to $199,999 | 221 | 13.7% |
| $200,000+ | 687 | 42.5% |
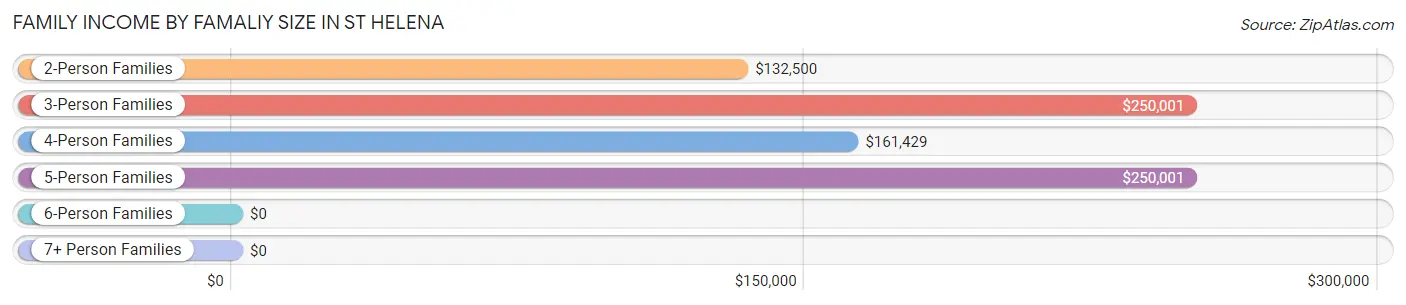
Family Income by Famaliy Size in St Helena
3-person families (393 | 24.3%) account for the highest median family income in St Helena with $250,001 per family, while 3-person families (393 | 24.3%) have the highest median income of $83,334 per family member.
| Income Bracket | # Families | Median Income |
| 2-Person Families | 956 (59.2%) | $132,500 |
| 3-Person Families | 393 (24.3%) | $250,001 |
| 4-Person Families | 196 (12.1%) | $161,429 |
| 5-Person Families | 28 (1.7%) | $250,001 |
| 6-Person Families | 22 (1.4%) | $0 |
| 7+ Person Families | 21 (1.3%) | $0 |
| Total | 1,616 (100.0%) | $161,833 |
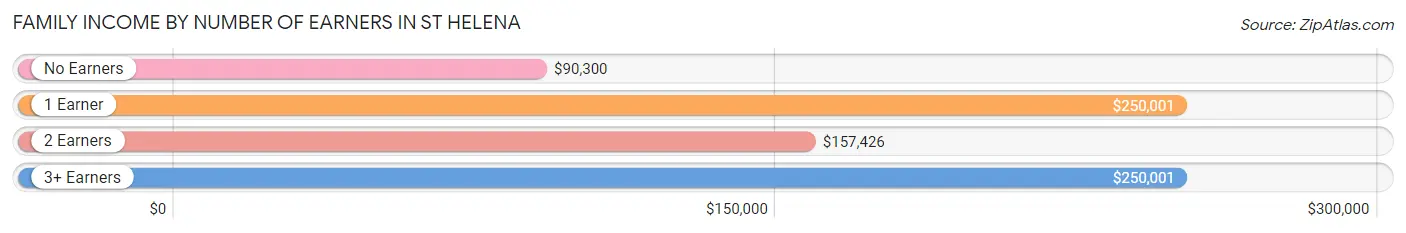
Family Income by Number of Earners in St Helena
The median family income in St Helena is $161,833, with families comprising 1 earner (786) having the highest median family income of $250,001, while families with no earners (274) have the lowest median family income of $90,300, accounting for 48.6% and 17.0% of families, respectively.
| Number of Earners | # Families | Median Income |
| No Earners | 274 (17.0%) | $90,300 |
| 1 Earner | 786 (48.6%) | $250,001 |
| 2 Earners | 489 (30.3%) | $157,426 |
| 3+ Earners | 67 (4.2%) | $250,001 |
| Total | 1,616 (100.0%) | $161,833 |
Household Income in St Helena
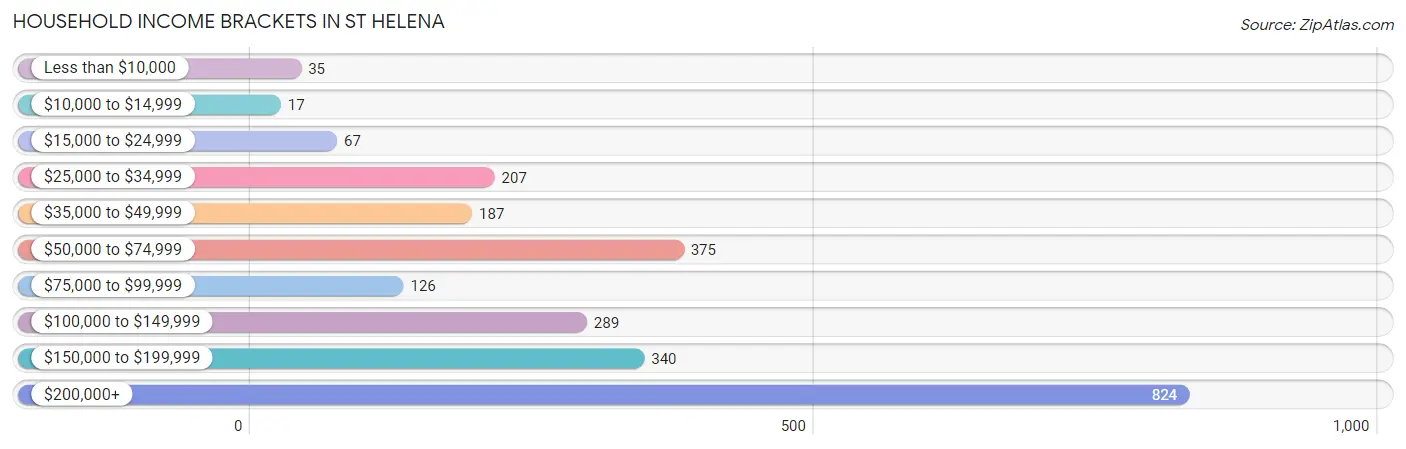
Household Income Brackets in St Helena
With 824 households falling in the category, the $200,000+ income range is the most frequent in St Helena, accounting for 33.4% of all households. In contrast, only 17 households (0.7%) fall into the $10,000 to $14,999 income bracket, making it the least populous group.
| Income Bracket | # Households | % Households |
| Less than $10,000 | 35 | 1.4% |
| $10,000 to $14,999 | 17 | 0.7% |
| $15,000 to $24,999 | 67 | 2.7% |
| $25,000 to $34,999 | 207 | 8.4% |
| $35,000 to $49,999 | 187 | 7.6% |
| $50,000 to $74,999 | 375 | 15.2% |
| $75,000 to $99,999 | 126 | 5.1% |
| $100,000 to $149,999 | 289 | 11.7% |
| $150,000 to $199,999 | 340 | 13.8% |
| $200,000+ | 824 | 33.4% |
Household Income by Householder Age in St Helena
The median household income in St Helena is $135,781, with the highest median household income of $183,125 found in the 25 to 44 years age bracket for the primary householder. A total of 617 households (25.0%) fall into this category. Meanwhile, the 15 to 24 years age bracket for the primary householder has the lowest median household income of $0, with 15 households (0.6%) in this group.
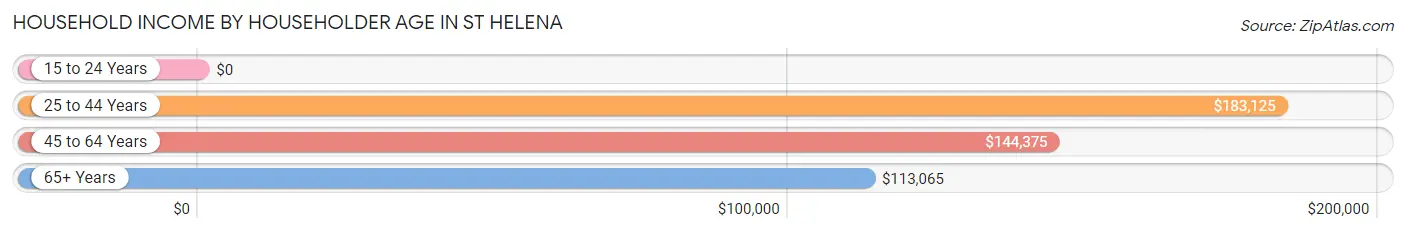
| Income Bracket | # Households | Median Income |
| 15 to 24 Years | 15 (0.6%) | $0 |
| 25 to 44 Years | 617 (25.0%) | $183,125 |
| 45 to 64 Years | 760 (30.8%) | $144,375 |
| 65+ Years | 1,074 (43.5%) | $113,065 |
| Total | 2,466 (100.0%) | $135,781 |
Poverty in St Helena
Income Below Poverty by Sex and Age in St Helena
With 4.2% poverty level for males and 7.1% for females among the residents of St Helena, 5 year old males and 16 and 17 year old females are the most vulnerable to poverty, with 22 males (56.4%) and 22 females (40.0%) in their respective age groups living below the poverty level.
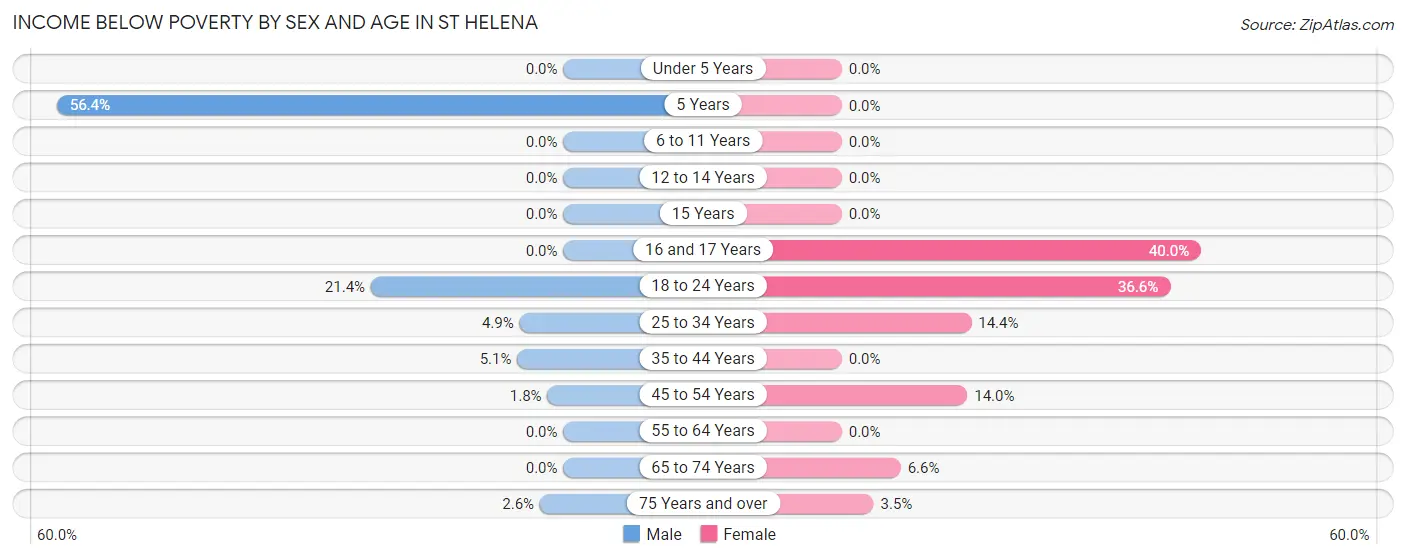
| Age Bracket | Male | Female |
| Under 5 Years | 0 (0.0%) | 0 (0.0%) |
| 5 Years | 22 (56.4%) | 0 (0.0%) |
| 6 to 11 Years | 0 (0.0%) | 0 (0.0%) |
| 12 to 14 Years | 0 (0.0%) | 0 (0.0%) |
| 15 Years | 0 (0.0%) | 0 (0.0%) |
| 16 and 17 Years | 0 (0.0%) | 22 (40.0%) |
| 18 to 24 Years | 39 (21.4%) | 34 (36.6%) |
| 25 to 34 Years | 10 (4.9%) | 45 (14.4%) |
| 35 to 44 Years | 23 (5.1%) | 0 (0.0%) |
| 45 to 54 Years | 5 (1.8%) | 46 (14.0%) |
| 55 to 64 Years | 0 (0.0%) | 0 (0.0%) |
| 65 to 74 Years | 0 (0.0%) | 34 (6.6%) |
| 75 Years and over | 11 (2.6%) | 14 (3.5%) |
| Total | 110 (4.2%) | 195 (7.1%) |
Income Above Poverty by Sex and Age in St Helena
According to the poverty statistics in St Helena, males aged under 5 years and females aged under 5 years are the age groups that are most secure financially, with 100.0% of males and 100.0% of females in these age groups living above the poverty line.
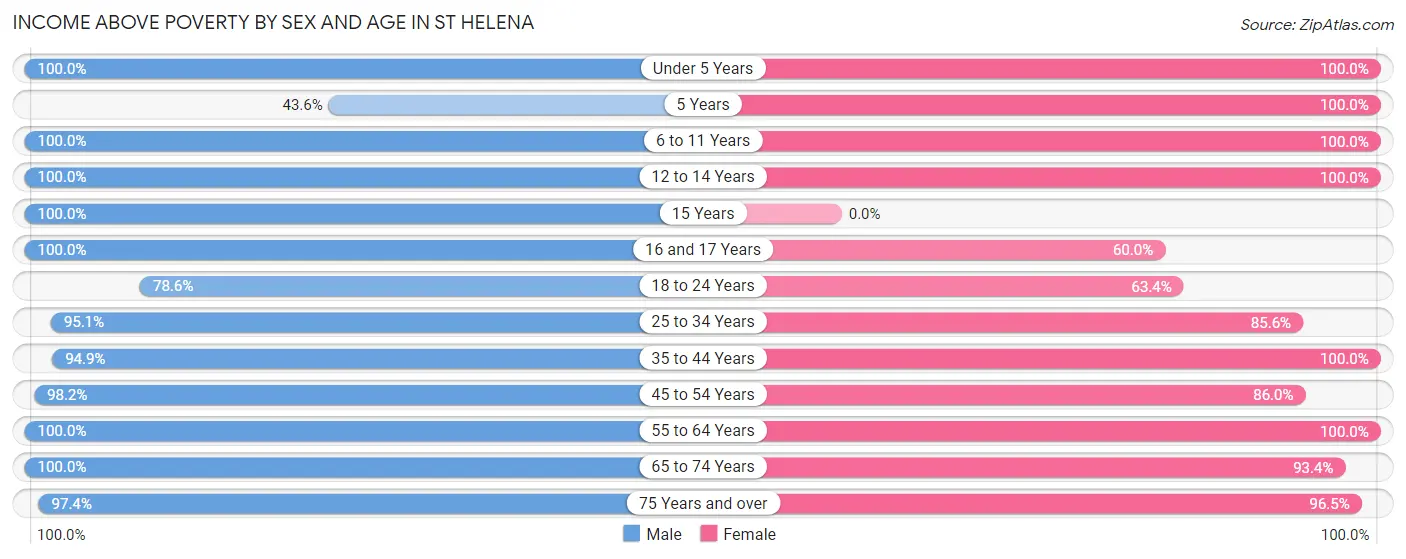
| Age Bracket | Male | Female |
| Under 5 Years | 133 (100.0%) | 128 (100.0%) |
| 5 Years | 17 (43.6%) | 10 (100.0%) |
| 6 to 11 Years | 145 (100.0%) | 129 (100.0%) |
| 12 to 14 Years | 36 (100.0%) | 96 (100.0%) |
| 15 Years | 23 (100.0%) | 0 (0.0%) |
| 16 and 17 Years | 66 (100.0%) | 33 (60.0%) |
| 18 to 24 Years | 143 (78.6%) | 59 (63.4%) |
| 25 to 34 Years | 195 (95.1%) | 267 (85.6%) |
| 35 to 44 Years | 425 (94.9%) | 342 (100.0%) |
| 45 to 54 Years | 278 (98.2%) | 283 (86.0%) |
| 55 to 64 Years | 223 (100.0%) | 320 (100.0%) |
| 65 to 74 Years | 431 (100.0%) | 484 (93.4%) |
| 75 Years and over | 411 (97.4%) | 382 (96.5%) |
| Total | 2,526 (95.8%) | 2,533 (92.8%) |
Income Below Poverty Among Married-Couple Families in St Helena
The poverty statistics for married-couple families in St Helena show that 1.3% or 16 of the total 1,238 families live below the poverty line. Families with no children have the highest poverty rate of 2.0%, comprising of 16 families. On the other hand, families with 1 or 2 children have the lowest poverty rate of 0.0%, which includes 0 families.
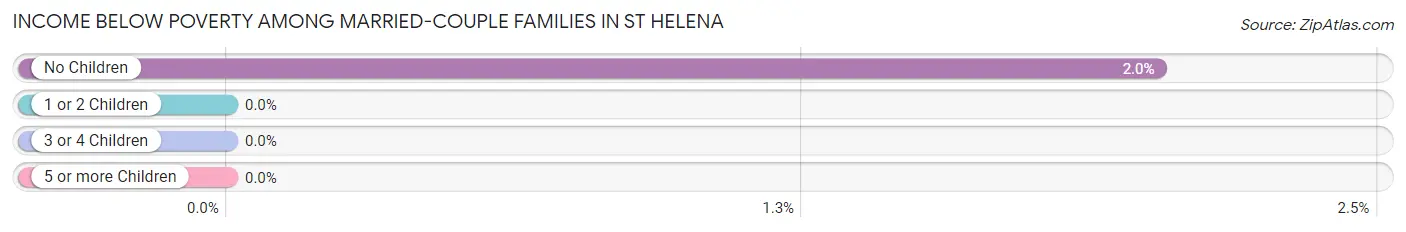
| Children | Above Poverty | Below Poverty |
| No Children | 777 (98.0%) | 16 (2.0%) |
| 1 or 2 Children | 380 (100.0%) | 0 (0.0%) |
| 3 or 4 Children | 44 (100.0%) | 0 (0.0%) |
| 5 or more Children | 21 (100.0%) | 0 (0.0%) |
| Total | 1,222 (98.7%) | 16 (1.3%) |
Income Below Poverty Among Single-Parent Households in St Helena
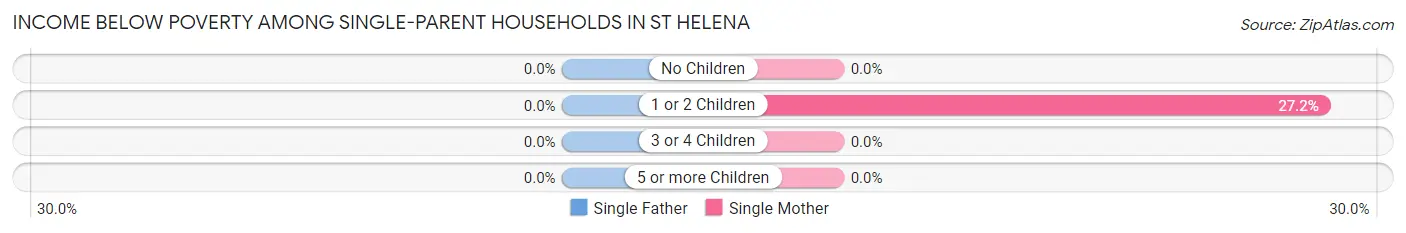
| Children | Single Father | Single Mother |
| No Children | 0 (0.0%) | 0 (0.0%) |
| 1 or 2 Children | 0 (0.0%) | 34 (27.2%) |
| 3 or 4 Children | 0 (0.0%) | 0 (0.0%) |
| 5 or more Children | 0 (0.0%) | 0 (0.0%) |
| Total | 0 (0.0%) | 34 (18.0%) |
Income Below Poverty Among Married-Couple vs Single-Parent Households in St Helena
The poverty data for St Helena shows that 16 of the married-couple family households (1.3%) and 34 of the single-parent households (9.0%) are living below the poverty level. Within the married-couple family households, those with no children have the highest poverty rate, with 16 households (2.0%) falling below the poverty line. Among the single-parent households, those with 1 or 2 children have the highest poverty rate, with 34 household (19.5%) living below poverty.
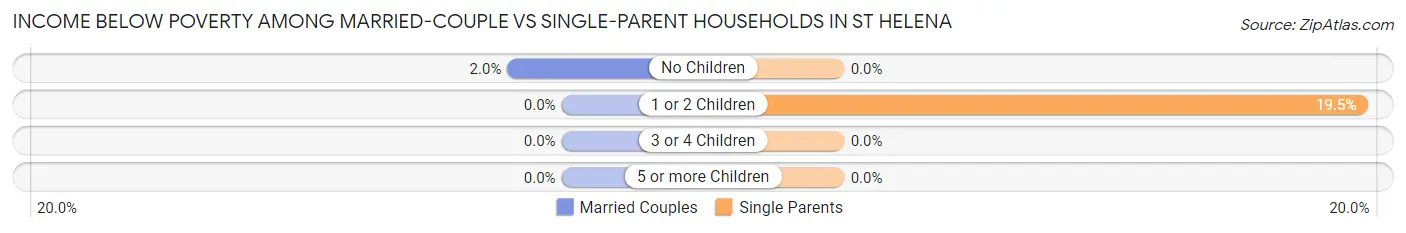
| Children | Married-Couple Families | Single-Parent Households |
| No Children | 16 (2.0%) | 0 (0.0%) |
| 1 or 2 Children | 0 (0.0%) | 34 (19.5%) |
| 3 or 4 Children | 0 (0.0%) | 0 (0.0%) |
| 5 or more Children | 0 (0.0%) | 0 (0.0%) |
| Total | 16 (1.3%) | 34 (9.0%) |
Race in St Helena
The most populous races in St Helena are White / Caucasian (4,255 | 78.4%), Hispanic or Latino (1,251 | 23.1%), and Some other Race (634 | 11.7%).
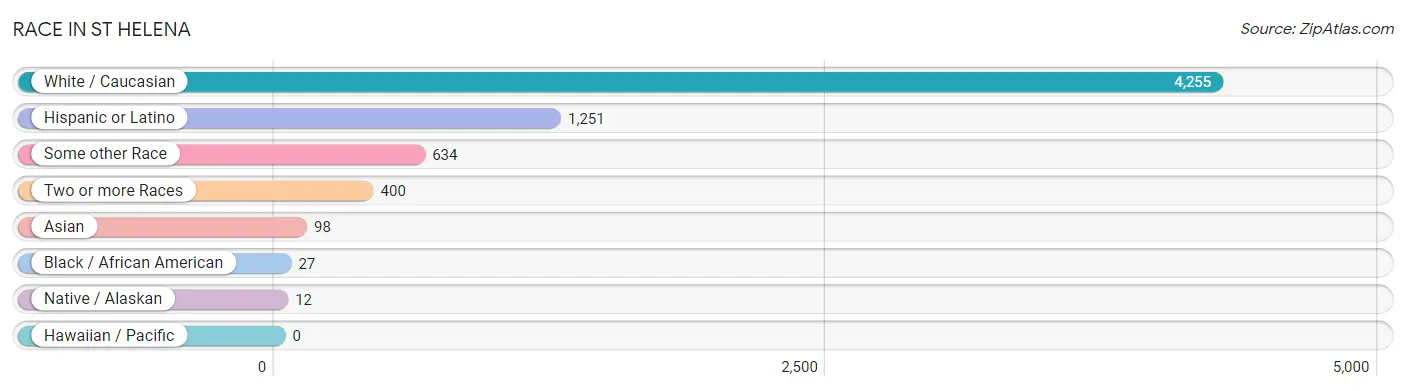
| Race | # Population | % Population |
| Asian | 98 | 1.8% |
| Black / African American | 27 | 0.5% |
| Hawaiian / Pacific | 0 | 0.0% |
| Hispanic or Latino | 1,251 | 23.1% |
| Native / Alaskan | 12 | 0.2% |
| White / Caucasian | 4,255 | 78.4% |
| Two or more Races | 400 | 7.4% |
| Some other Race | 634 | 11.7% |
| Total | 5,426 | 100.0% |
Ancestry in St Helena
The most populous ancestries reported in St Helena are English (831 | 15.3%), Mexican (760 | 14.0%), German (648 | 11.9%), Irish (630 | 11.6%), and Italian (394 | 7.3%), together accounting for 60.1% of all St Helena residents.
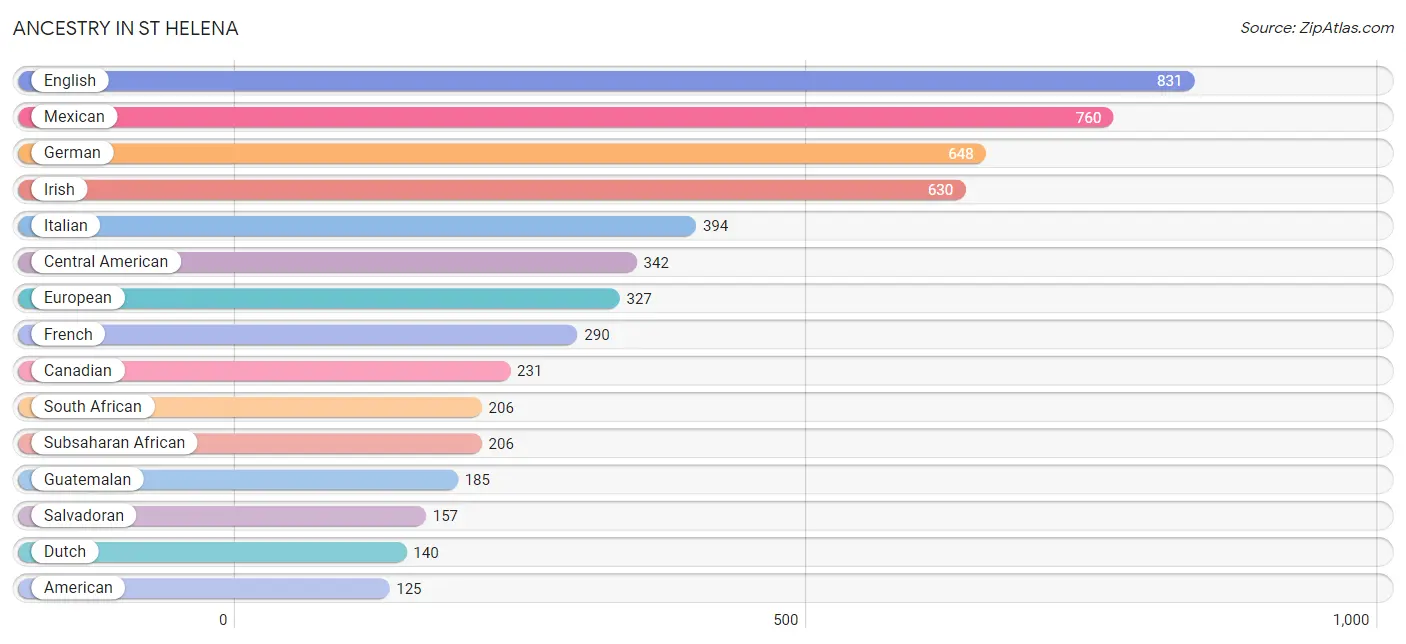
| Ancestry | # Population | % Population |
| American | 125 | 2.3% |
| Arab | 11 | 0.2% |
| Argentinean | 14 | 0.3% |
| Armenian | 26 | 0.5% |
| Australian | 64 | 1.2% |
| Austrian | 13 | 0.2% |
| Belgian | 9 | 0.2% |
| Bhutanese | 17 | 0.3% |
| British | 51 | 0.9% |
| Burmese | 36 | 0.7% |
| Canadian | 231 | 4.3% |
| Central American | 342 | 6.3% |
| Central American Indian | 64 | 1.2% |
| Cherokee | 34 | 0.6% |
| Choctaw | 9 | 0.2% |
| Colombian | 8 | 0.2% |
| Croatian | 8 | 0.2% |
| Czech | 7 | 0.1% |
| Danish | 64 | 1.2% |
| Dutch | 140 | 2.6% |
| Eastern European | 76 | 1.4% |
| English | 831 | 15.3% |
| European | 327 | 6.0% |
| Filipino | 12 | 0.2% |
| French | 290 | 5.3% |
| French Canadian | 116 | 2.1% |
| German | 648 | 11.9% |
| Greek | 47 | 0.9% |
| Guatemalan | 185 | 3.4% |
| Hungarian | 15 | 0.3% |
| Iranian | 68 | 1.3% |
| Irish | 630 | 11.6% |
| Italian | 394 | 7.3% |
| Korean | 73 | 1.3% |
| Laotian | 7 | 0.1% |
| Lebanese | 11 | 0.2% |
| Macedonian | 11 | 0.2% |
| Mexican | 760 | 14.0% |
| New Zealander | 9 | 0.2% |
| Northern European | 3 | 0.1% |
| Norwegian | 107 | 2.0% |
| Polish | 98 | 1.8% |
| Portuguese | 104 | 1.9% |
| Puerto Rican | 5 | 0.1% |
| Romanian | 5 | 0.1% |
| Russian | 22 | 0.4% |
| Salvadoran | 157 | 2.9% |
| Scandinavian | 31 | 0.6% |
| Scotch-Irish | 61 | 1.1% |
| Scottish | 122 | 2.2% |
| Slovak | 6 | 0.1% |
| Slovene | 8 | 0.2% |
| South African | 206 | 3.8% |
| South American | 22 | 0.4% |
| Spanish | 49 | 0.9% |
| Sri Lankan | 5 | 0.1% |
| Subsaharan African | 206 | 3.8% |
| Swedish | 57 | 1.1% |
| Swiss | 39 | 0.7% |
| Thai | 36 | 0.7% |
| Ukrainian | 7 | 0.1% |
| Welsh | 48 | 0.9% |
| Yaqui | 64 | 1.2% |
| Yugoslavian | 9 | 0.2% | View All 64 Rows |
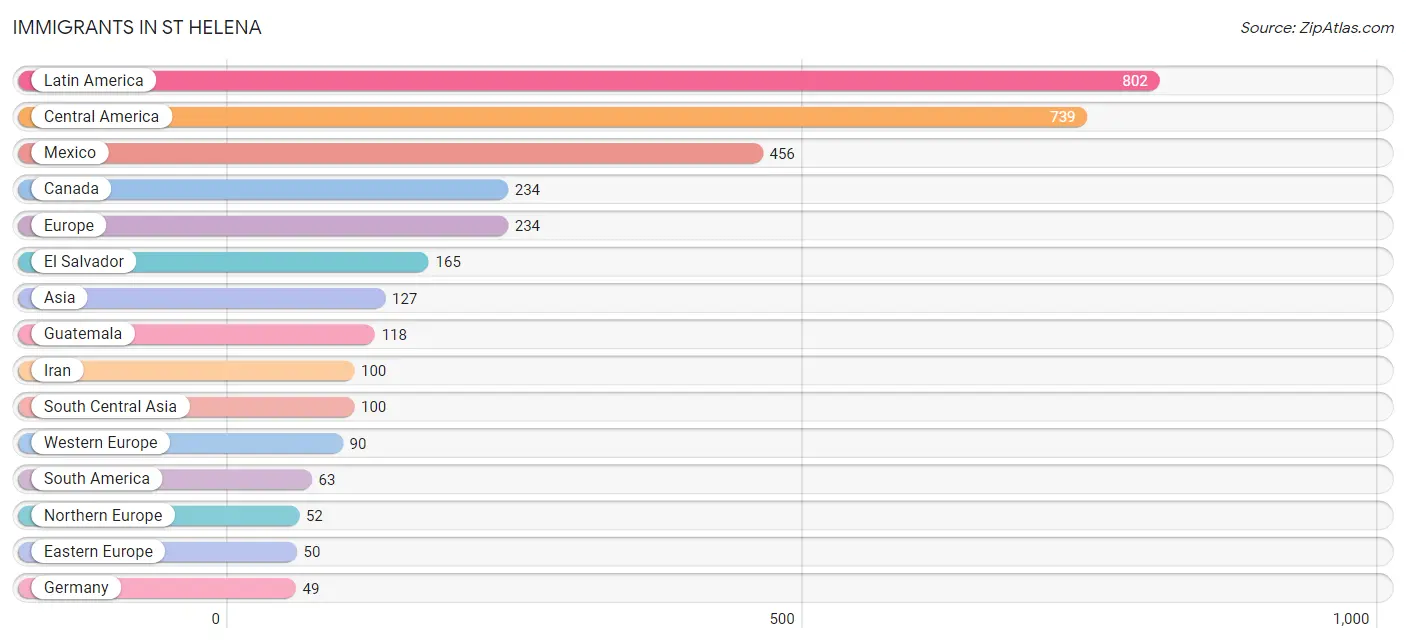
Immigrants in St Helena
The most numerous immigrant groups reported in St Helena came from Latin America (802 | 14.8%), Central America (739 | 13.6%), Mexico (456 | 8.4%), Canada (234 | 4.3%), and Europe (234 | 4.3%), together accounting for 45.4% of all St Helena residents.
| Immigration Origin | # Population | % Population |
| Africa | 11 | 0.2% |
| Argentina | 42 | 0.8% |
| Asia | 127 | 2.3% |
| Australia | 33 | 0.6% |
| Belgium | 9 | 0.2% |
| Bosnia and Herzegovina | 9 | 0.2% |
| Brazil | 21 | 0.4% |
| Canada | 234 | 4.3% |
| Central America | 739 | 13.6% |
| Denmark | 11 | 0.2% |
| Eastern Africa | 11 | 0.2% |
| Eastern Asia | 15 | 0.3% |
| Eastern Europe | 50 | 0.9% |
| El Salvador | 165 | 3.0% |
| England | 36 | 0.7% |
| Europe | 234 | 4.3% |
| France | 7 | 0.1% |
| Germany | 49 | 0.9% |
| Greece | 26 | 0.5% |
| Guatemala | 118 | 2.2% |
| Indonesia | 7 | 0.1% |
| Iran | 100 | 1.8% |
| Italy | 16 | 0.3% |
| Korea | 15 | 0.3% |
| Latin America | 802 | 14.8% |
| Mexico | 456 | 8.4% |
| Northern Europe | 52 | 1.0% |
| Oceania | 49 | 0.9% |
| Poland | 30 | 0.5% |
| South America | 63 | 1.2% |
| South Central Asia | 100 | 1.8% |
| South Eastern Asia | 12 | 0.2% |
| Southern Europe | 42 | 0.8% |
| Switzerland | 25 | 0.5% |
| Vietnam | 5 | 0.1% |
| Western Europe | 90 | 1.7% | View All 36 Rows |
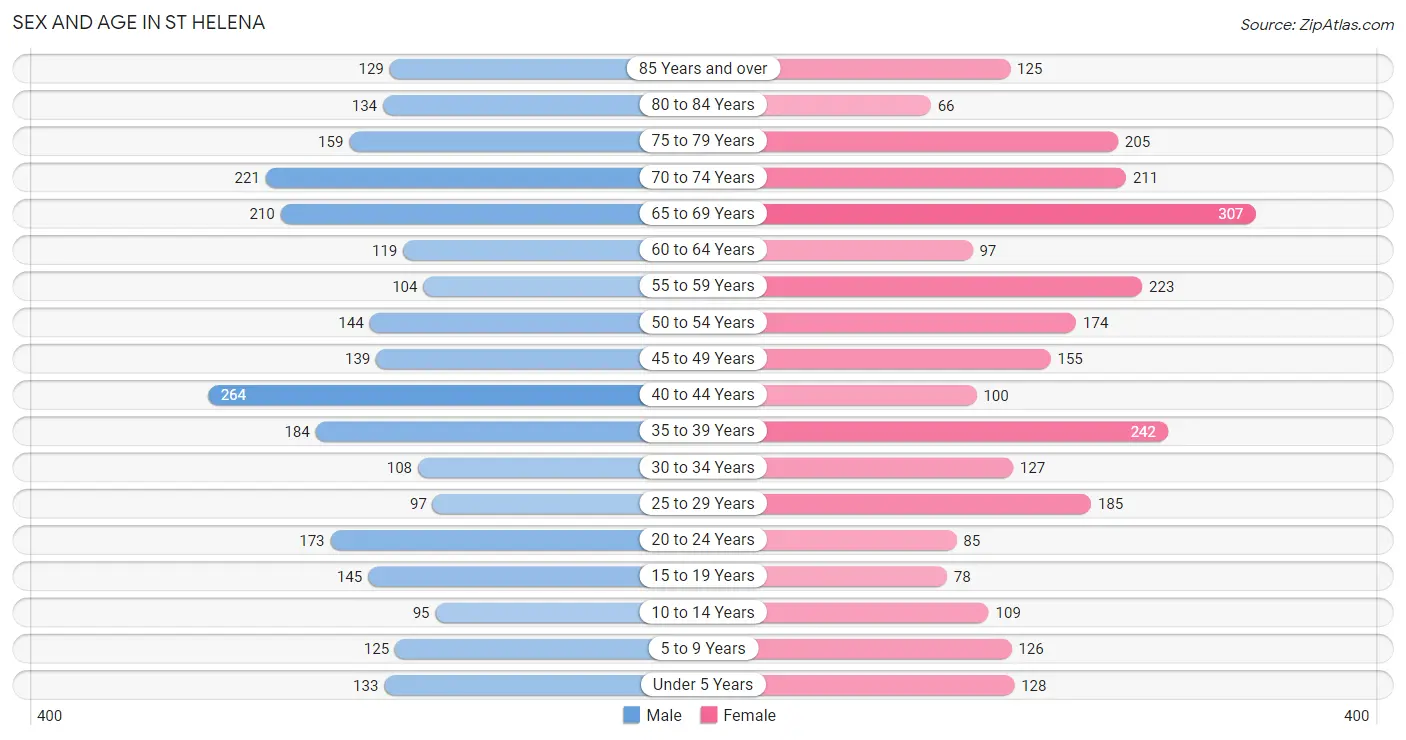
Sex and Age in St Helena
Sex and Age in St Helena
The most populous age groups in St Helena are 40 to 44 Years (264 | 9.8%) for men and 65 to 69 Years (307 | 11.2%) for women.
| Age Bracket | Male | Female |
| Under 5 Years | 133 (5.0%) | 128 (4.7%) |
| 5 to 9 Years | 125 (4.7%) | 126 (4.6%) |
| 10 to 14 Years | 95 (3.5%) | 109 (4.0%) |
| 15 to 19 Years | 145 (5.4%) | 78 (2.8%) |
| 20 to 24 Years | 173 (6.5%) | 85 (3.1%) |
| 25 to 29 Years | 97 (3.6%) | 185 (6.7%) |
| 30 to 34 Years | 108 (4.0%) | 127 (4.6%) |
| 35 to 39 Years | 184 (6.9%) | 242 (8.8%) |
| 40 to 44 Years | 264 (9.8%) | 100 (3.6%) |
| 45 to 49 Years | 139 (5.2%) | 155 (5.7%) |
| 50 to 54 Years | 144 (5.4%) | 174 (6.3%) |
| 55 to 59 Years | 104 (3.9%) | 223 (8.1%) |
| 60 to 64 Years | 119 (4.4%) | 97 (3.5%) |
| 65 to 69 Years | 210 (7.8%) | 307 (11.2%) |
| 70 to 74 Years | 221 (8.2%) | 211 (7.7%) |
| 75 to 79 Years | 159 (5.9%) | 205 (7.5%) |
| 80 to 84 Years | 134 (5.0%) | 66 (2.4%) |
| 85 Years and over | 129 (4.8%) | 125 (4.6%) |
| Total | 2,683 (100.0%) | 2,743 (100.0%) |
Families and Households in St Helena
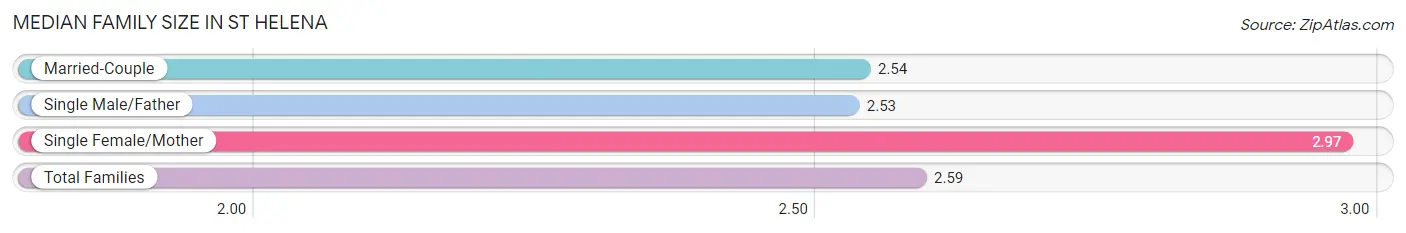
Median Family Size in St Helena
The median family size in St Helena is 2.59 persons per family, with single female/mother families (189 | 11.7%) accounting for the largest median family size of 2.97 persons per family. On the other hand, single male/father families (189 | 11.7%) represent the smallest median family size with 2.53 persons per family.
| Family Type | # Families | Family Size |
| Married-Couple | 1,238 (76.6%) | 2.54 |
| Single Male/Father | 189 (11.7%) | 2.53 |
| Single Female/Mother | 189 (11.7%) | 2.97 |
| Total Families | 1,616 (100.0%) | 2.59 |
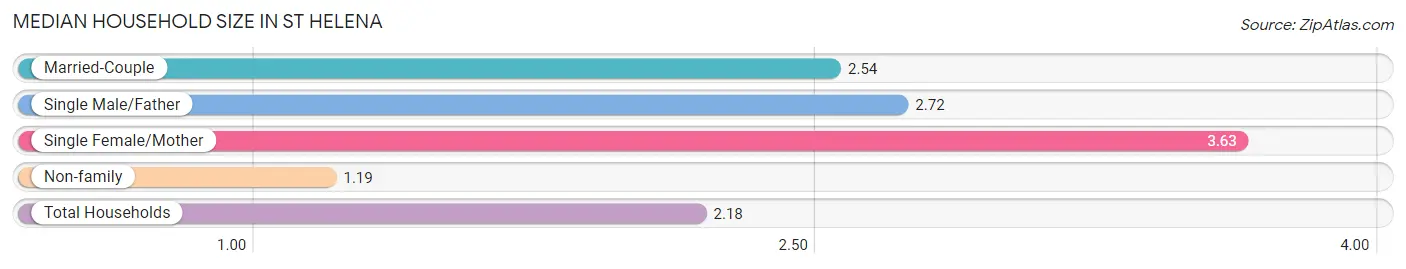
Median Household Size in St Helena
The median household size in St Helena is 2.18 persons per household, with single female/mother households (189 | 7.7%) accounting for the largest median household size of 3.63 persons per household. non-family households (850 | 34.5%) represent the smallest median household size with 1.19 persons per household.
| Household Type | # Households | Household Size |
| Married-Couple | 1,238 (50.2%) | 2.54 |
| Single Male/Father | 189 (7.7%) | 2.72 |
| Single Female/Mother | 189 (7.7%) | 3.63 |
| Non-family | 850 (34.5%) | 1.19 |
| Total Households | 2,466 (100.0%) | 2.18 |
Household Size by Marriage Status in St Helena
Out of a total of 2,466 households in St Helena, 1,616 (65.5%) are family households, while 850 (34.5%) are nonfamily households. The most numerous type of family households are 2-person households, comprising 927, and the most common type of nonfamily households are 1-person households, comprising 708.
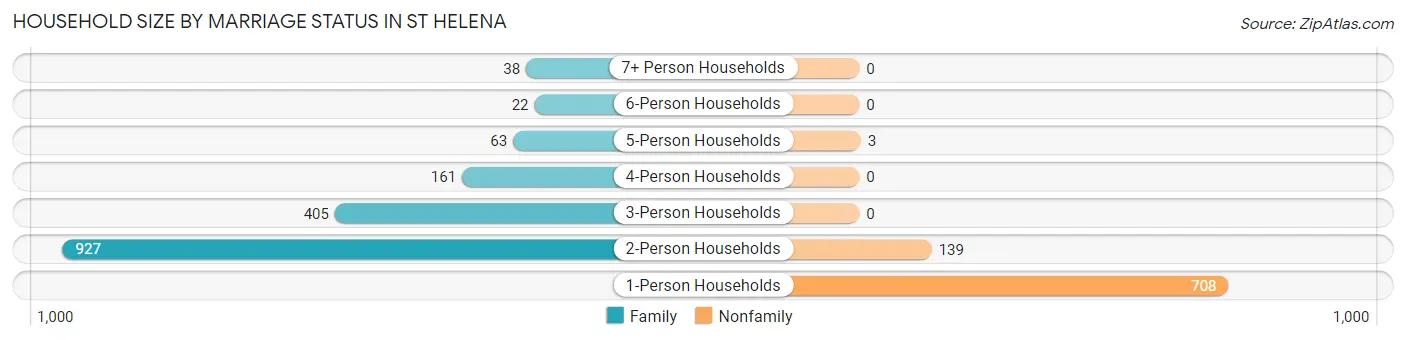
| Household Size | Family Households | Nonfamily Households |
| 1-Person Households | - | 708 (28.7%) |
| 2-Person Households | 927 (37.6%) | 139 (5.6%) |
| 3-Person Households | 405 (16.4%) | 0 (0.0%) |
| 4-Person Households | 161 (6.5%) | 0 (0.0%) |
| 5-Person Households | 63 (2.5%) | 3 (0.1%) |
| 6-Person Households | 22 (0.9%) | 0 (0.0%) |
| 7+ Person Households | 38 (1.5%) | 0 (0.0%) |
| Total | 1,616 (65.5%) | 850 (34.5%) |
Female Fertility in St Helena
Fertility by Age in St Helena
Average fertility rate in St Helena is 153.0 births per 1,000 women. Women in the age bracket of 35 to 50 years have the highest fertility rate with 272.0 births per 1,000 women. Women in the age bracket of 35 to 50 years acount for 91.3% of all women with births.
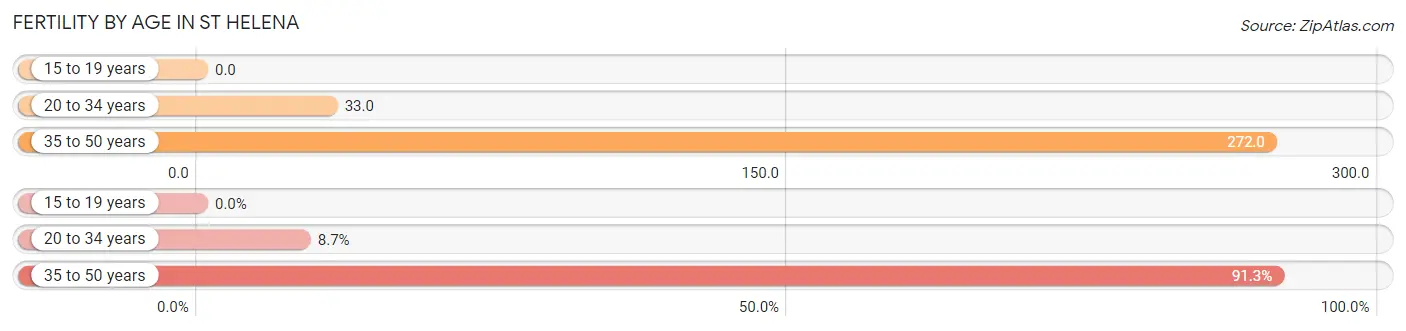
| Age Bracket | Women with Births | Births / 1,000 Women |
| 15 to 19 years | 0 (0.0%) | 0.0 |
| 20 to 34 years | 13 (8.7%) | 33.0 |
| 35 to 50 years | 136 (91.3%) | 272.0 |
| Total | 149 (100.0%) | 153.0 |
Fertility by Age by Marriage Status in St Helena
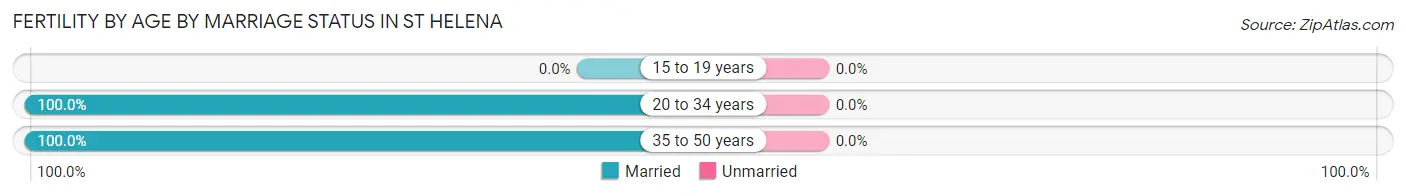
| Age Bracket | Married | Unmarried |
| 15 to 19 years | 0 (0.0%) | 0 (0.0%) |
| 20 to 34 years | 13 (100.0%) | 0 (0.0%) |
| 35 to 50 years | 136 (100.0%) | 0 (0.0%) |
| Total | 149 (100.0%) | 0 (0.0%) |
Fertility by Education in St Helena
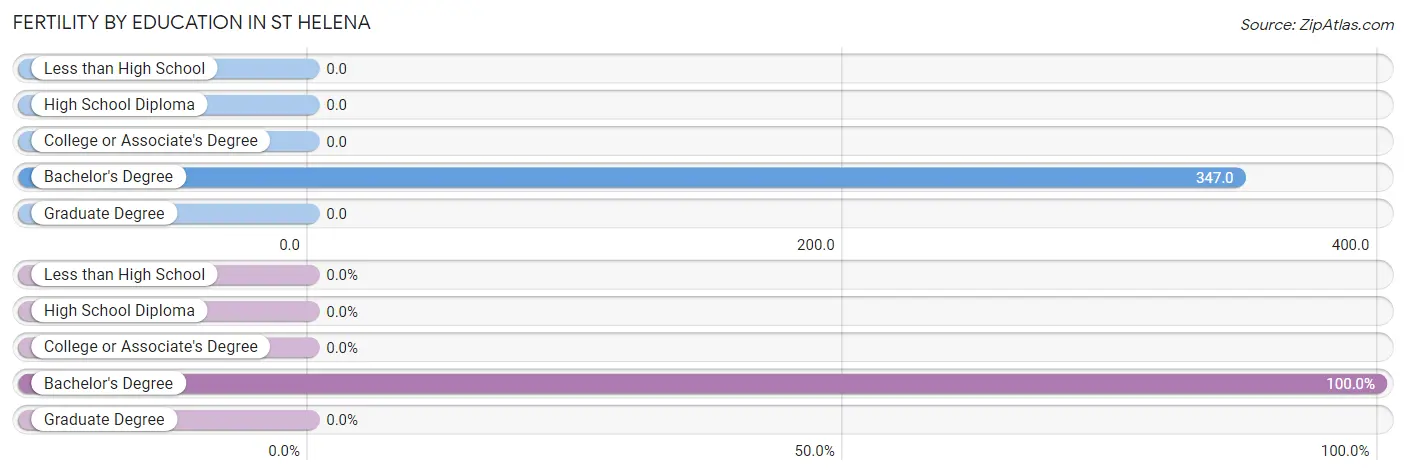
| Educational Attainment | Women with Births | Births / 1,000 Women |
| Less than High School | 0 (0.0%) | 0.0 |
| High School Diploma | 0 (0.0%) | 0.0 |
| College or Associate's Degree | 0 (0.0%) | 0.0 |
| Bachelor's Degree | 149 (100.0%) | 347.0 |
| Graduate Degree | 0 (0.0%) | 0.0 |
| Total | 149 (100.0%) | 153.0 |
Fertility by Education by Marriage Status in St Helena
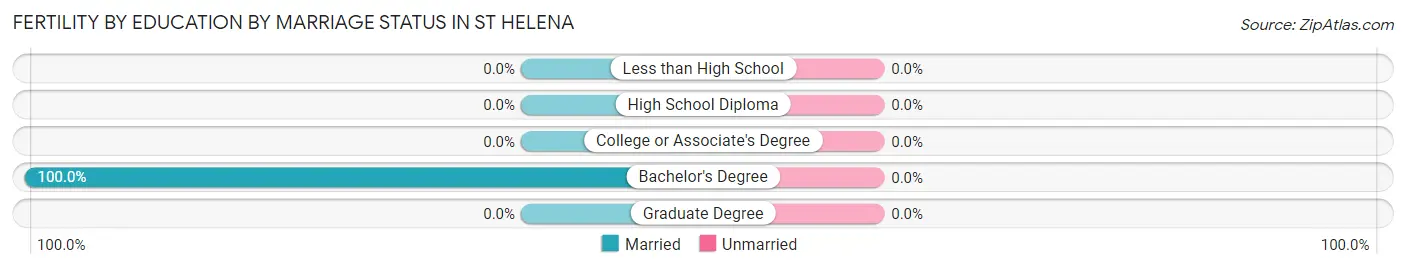
| Educational Attainment | Married | Unmarried |
| Less than High School | 0 (0.0%) | 0 (0.0%) |
| High School Diploma | 0 (0.0%) | 0 (0.0%) |
| College or Associate's Degree | 0 (0.0%) | 0 (0.0%) |
| Bachelor's Degree | 149 (100.0%) | 0 (0.0%) |
| Graduate Degree | 0 (0.0%) | 0 (0.0%) |
| Total | 149 (100.0%) | 0 (0.0%) |
Employment Characteristics in St Helena
Employment by Class of Employer in St Helena
Among the 2,540 employed individuals in St Helena, private company employees (1,698 | 66.8%), self-employed (not incorporated) (357 | 14.1%), and self-employed (incorporated) (194 | 7.6%) make up the most common classes of employment.
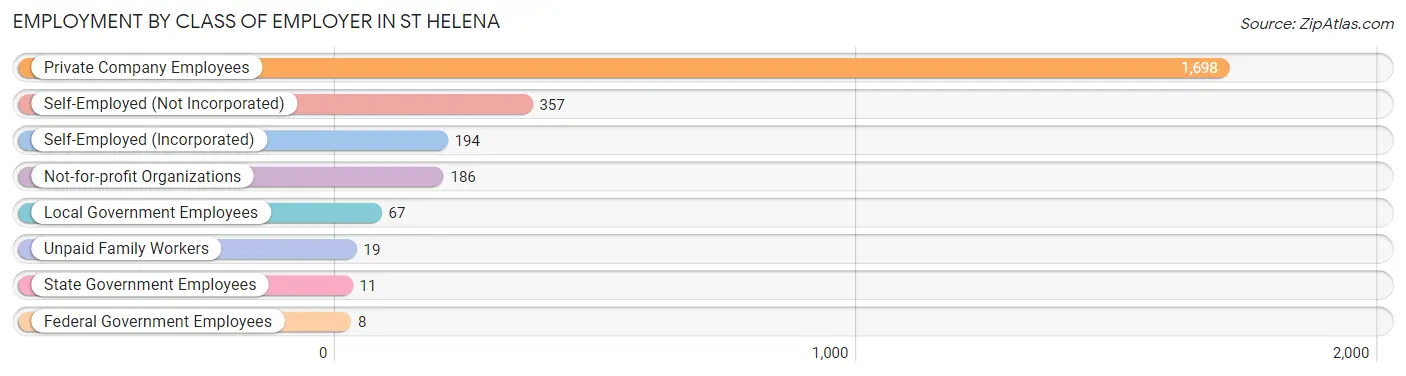
| Employer Class | # Employees | % Employees |
| Private Company Employees | 1,698 | 66.8% |
| Self-Employed (Incorporated) | 194 | 7.6% |
| Self-Employed (Not Incorporated) | 357 | 14.1% |
| Not-for-profit Organizations | 186 | 7.3% |
| Local Government Employees | 67 | 2.6% |
| State Government Employees | 11 | 0.4% |
| Federal Government Employees | 8 | 0.3% |
| Unpaid Family Workers | 19 | 0.7% |
| Total | 2,540 | 100.0% |
Employment Status by Age in St Helena
According to the labor force statistics for St Helena, out of the total population over 16 years of age (4,687), 56.6% or 2,653 individuals are in the labor force, with 3.2% or 85 of them unemployed. The age group with the highest labor force participation rate is 55 to 59 years, with 93.3% or 305 individuals in the labor force. Within the labor force, the 45 to 54 years age range has the highest percentage of unemployed individuals, with 12.8% or 69 of them being unemployed.
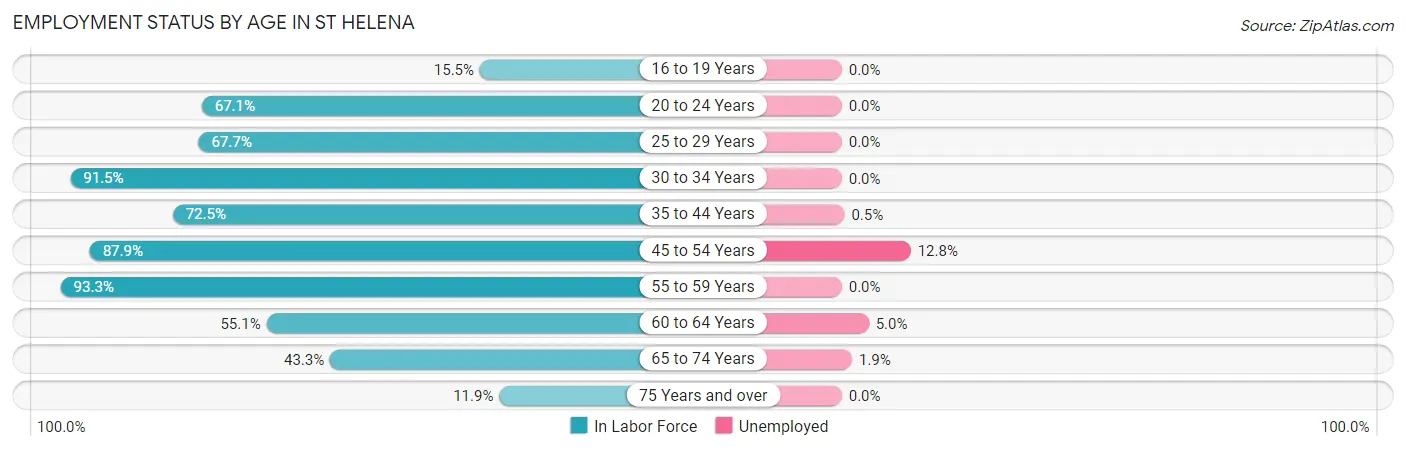
| Age Bracket | In Labor Force | Unemployed |
| 16 to 19 Years | 31 (15.5%) | 0 (0.0%) |
| 20 to 24 Years | 173 (67.1%) | 0 (0.0%) |
| 25 to 29 Years | 191 (67.7%) | 0 (0.0%) |
| 30 to 34 Years | 215 (91.5%) | 0 (0.0%) |
| 35 to 44 Years | 573 (72.5%) | 3 (0.5%) |
| 45 to 54 Years | 538 (87.9%) | 69 (12.8%) |
| 55 to 59 Years | 305 (93.3%) | 0 (0.0%) |
| 60 to 64 Years | 119 (55.1%) | 6 (5.0%) |
| 65 to 74 Years | 411 (43.3%) | 8 (1.9%) |
| 75 Years and over | 97 (11.9%) | 0 (0.0%) |
| Total | 2,653 (56.6%) | 85 (3.2%) |
Employment Status by Educational Attainment in St Helena
According to labor force statistics for St Helena, 78.8% of individuals (1,940) out of the total population between 25 and 64 years of age (2,462) are in the labor force, with 4.0% or 78 of them being unemployed. The group with the highest labor force participation rate are those with the educational attainment of college / associate degree, with 87.7% or 327 individuals in the labor force. Within the labor force, individuals with less than high school education have the highest percentage of unemployment, with 13.1% or 32 of them being unemployed.
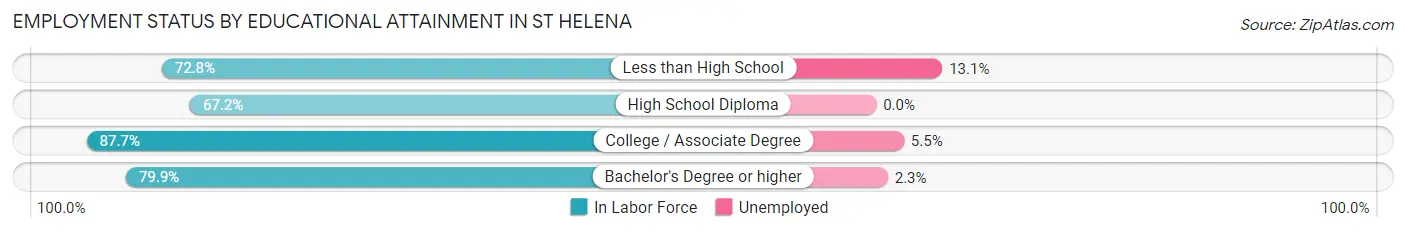
| Educational Attainment | In Labor Force | Unemployed |
| Less than High School | 244 (72.8%) | 44 (13.1%) |
| High School Diploma | 164 (67.2%) | 0 (0.0%) |
| College / Associate Degree | 327 (87.7%) | 21 (5.5%) |
| Bachelor's Degree or higher | 1,206 (79.9%) | 35 (2.3%) |
| Total | 1,940 (78.8%) | 98 (4.0%) |
Employment Occupations by Sex in St Helena
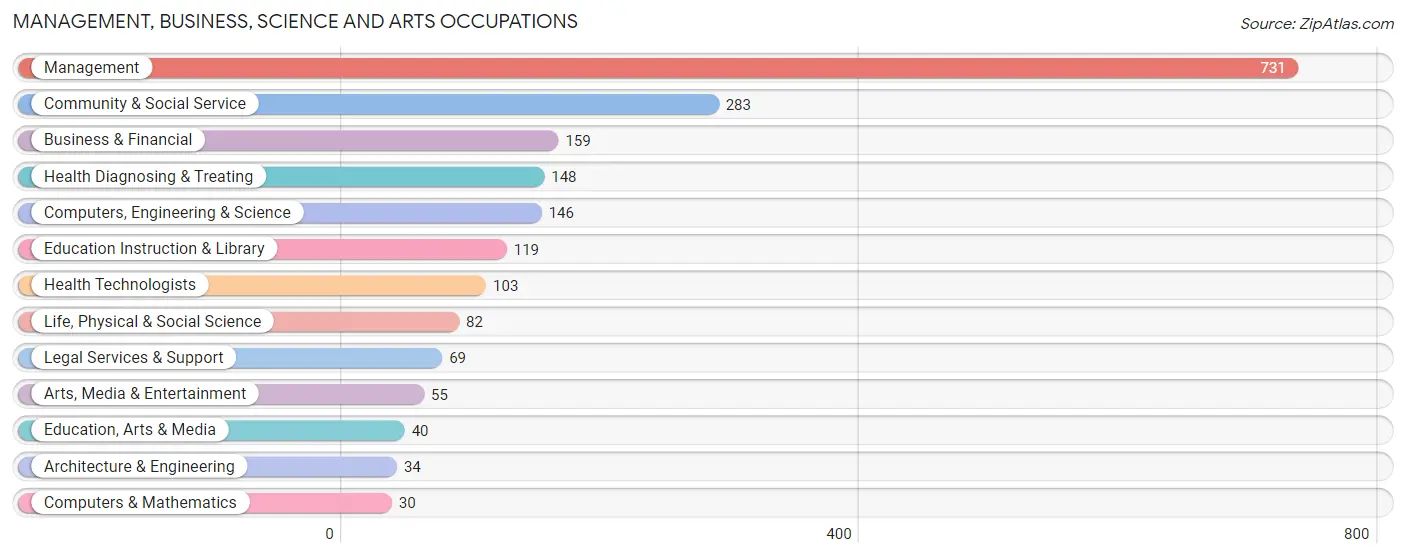
Management, Business, Science and Arts Occupations
The most common Management, Business, Science and Arts occupations in St Helena are Management (731 | 28.5%), Community & Social Service (283 | 11.0%), Business & Financial (159 | 6.2%), Health Diagnosing & Treating (148 | 5.8%), and Computers, Engineering & Science (146 | 5.7%).
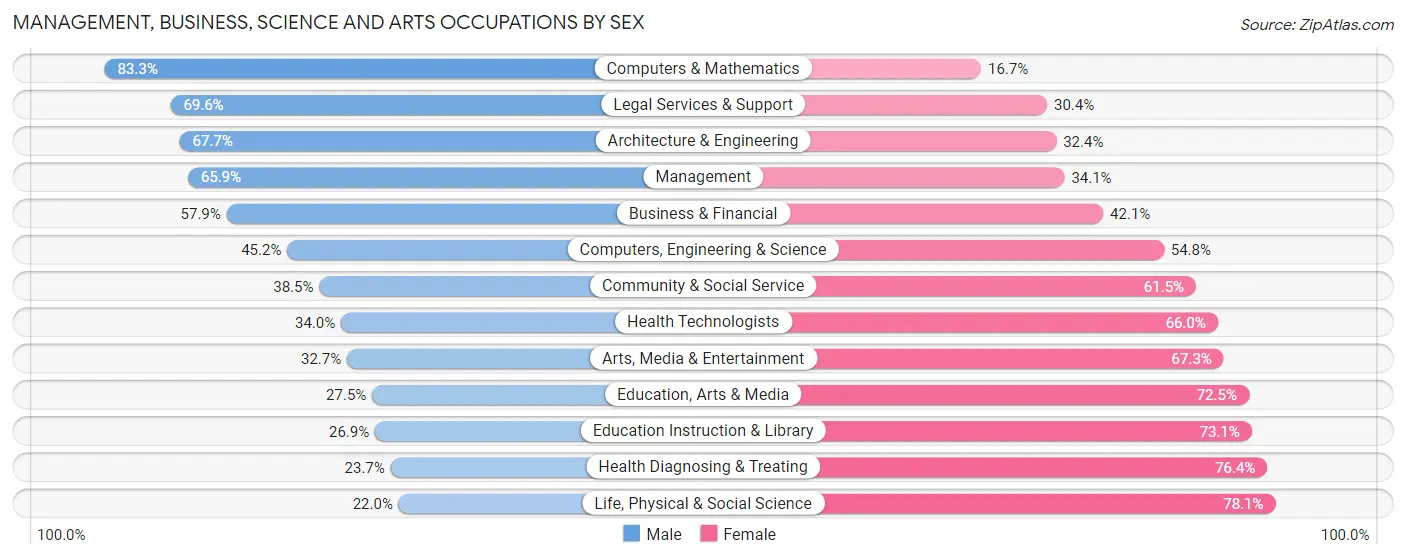
Management, Business, Science and Arts Occupations by Sex
Within the Management, Business, Science and Arts occupations in St Helena, the most male-oriented occupations are Computers & Mathematics (83.3%), Legal Services & Support (69.6%), and Architecture & Engineering (67.6%), while the most female-oriented occupations are Life, Physical & Social Science (78.0%), Health Diagnosing & Treating (76.3%), and Education Instruction & Library (73.1%).
| Occupation | Male | Female |
| Management | 482 (65.9%) | 249 (34.1%) |
| Business & Financial | 92 (57.9%) | 67 (42.1%) |
| Computers, Engineering & Science | 66 (45.2%) | 80 (54.8%) |
| Computers & Mathematics | 25 (83.3%) | 5 (16.7%) |
| Architecture & Engineering | 23 (67.6%) | 11 (32.4%) |
| Life, Physical & Social Science | 18 (22.0%) | 64 (78.0%) |
| Community & Social Service | 109 (38.5%) | 174 (61.5%) |
| Education, Arts & Media | 11 (27.5%) | 29 (72.5%) |
| Legal Services & Support | 48 (69.6%) | 21 (30.4%) |
| Education Instruction & Library | 32 (26.9%) | 87 (73.1%) |
| Arts, Media & Entertainment | 18 (32.7%) | 37 (67.3%) |
| Health Diagnosing & Treating | 35 (23.6%) | 113 (76.3%) |
| Health Technologists | 35 (34.0%) | 68 (66.0%) |
| Total (Category) | 784 (53.4%) | 683 (46.6%) |
| Total (Overall) | 1,447 (56.4%) | 1,120 (43.6%) |
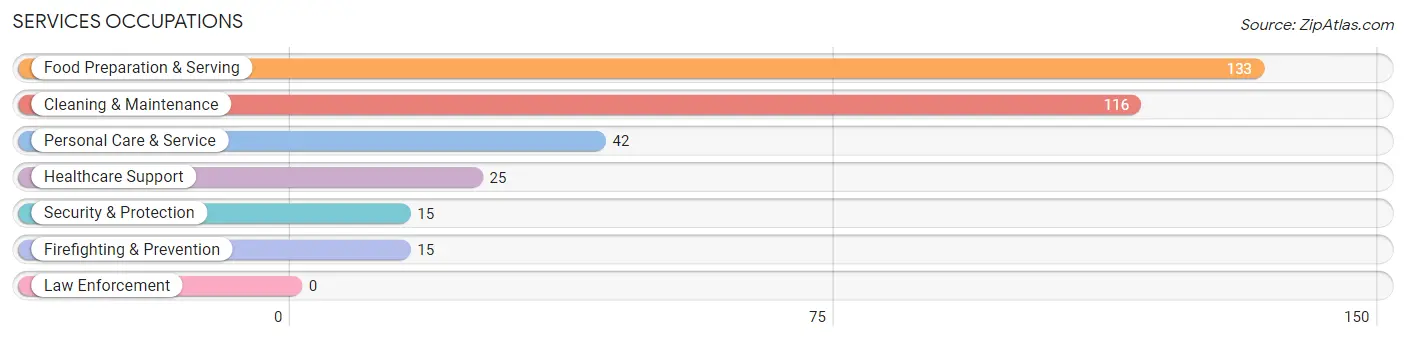
Services Occupations
The most common Services occupations in St Helena are Food Preparation & Serving (133 | 5.2%), Cleaning & Maintenance (116 | 4.5%), Personal Care & Service (42 | 1.6%), Healthcare Support (25 | 1.0%), and Security & Protection (15 | 0.6%).
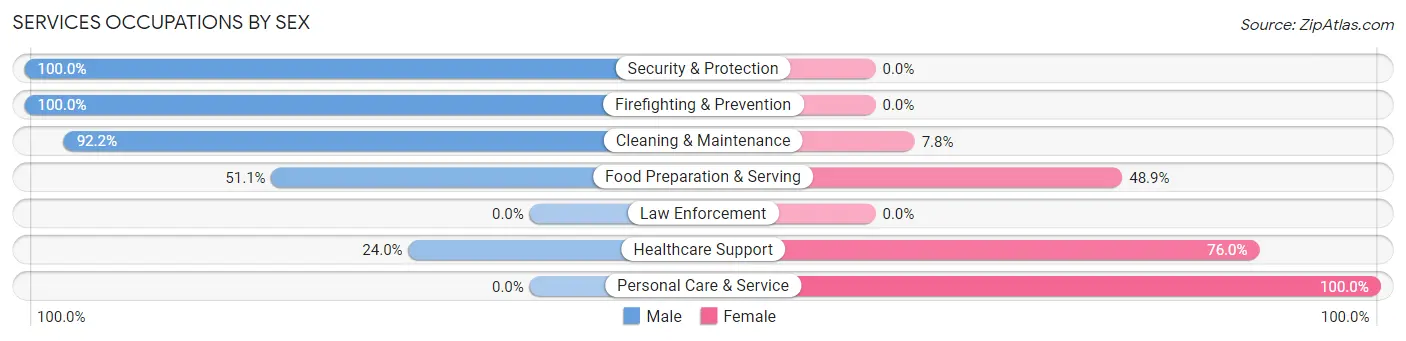
Services Occupations by Sex
Within the Services occupations in St Helena, the most male-oriented occupations are Security & Protection (100.0%), Firefighting & Prevention (100.0%), and Cleaning & Maintenance (92.2%), while the most female-oriented occupations are Personal Care & Service (100.0%), Healthcare Support (76.0%), and Food Preparation & Serving (48.9%).
| Occupation | Male | Female |
| Healthcare Support | 6 (24.0%) | 19 (76.0%) |
| Security & Protection | 15 (100.0%) | 0 (0.0%) |
| Firefighting & Prevention | 15 (100.0%) | 0 (0.0%) |
| Law Enforcement | 0 (0.0%) | 0 (0.0%) |
| Food Preparation & Serving | 68 (51.1%) | 65 (48.9%) |
| Cleaning & Maintenance | 107 (92.2%) | 9 (7.8%) |
| Personal Care & Service | 0 (0.0%) | 42 (100.0%) |
| Total (Category) | 196 (59.2%) | 135 (40.8%) |
| Total (Overall) | 1,447 (56.4%) | 1,120 (43.6%) |
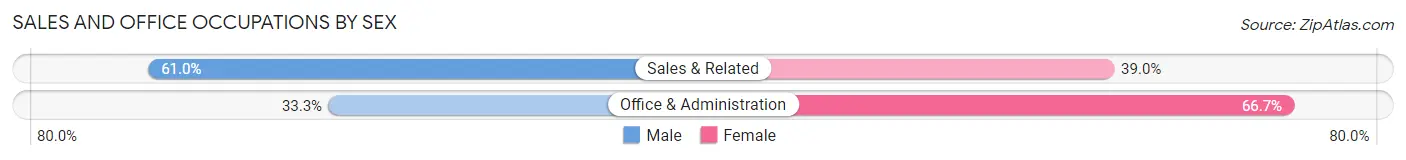
Sales and Office Occupations
The most common Sales and Office occupations in St Helena are Sales & Related (346 | 13.5%), and Office & Administration (189 | 7.4%).
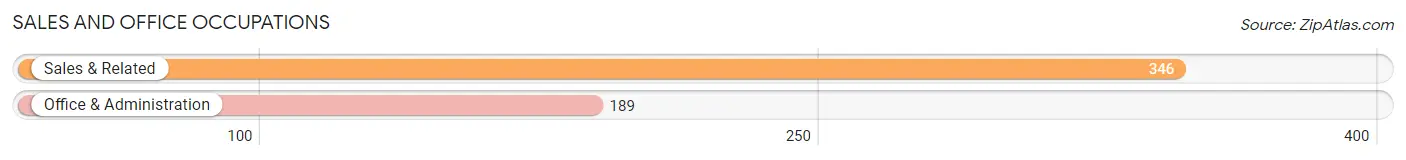
Sales and Office Occupations by Sex
| Occupation | Male | Female |
| Sales & Related | 211 (61.0%) | 135 (39.0%) |
| Office & Administration | 63 (33.3%) | 126 (66.7%) |
| Total (Category) | 274 (51.2%) | 261 (48.8%) |
| Total (Overall) | 1,447 (56.4%) | 1,120 (43.6%) |
Natural Resources, Construction and Maintenance Occupations
The most common Natural Resources, Construction and Maintenance occupations in St Helena are Construction & Extraction (63 | 2.5%), Installation, Maintenance & Repair (56 | 2.2%), and Farming, Fishing & Forestry (27 | 1.1%).
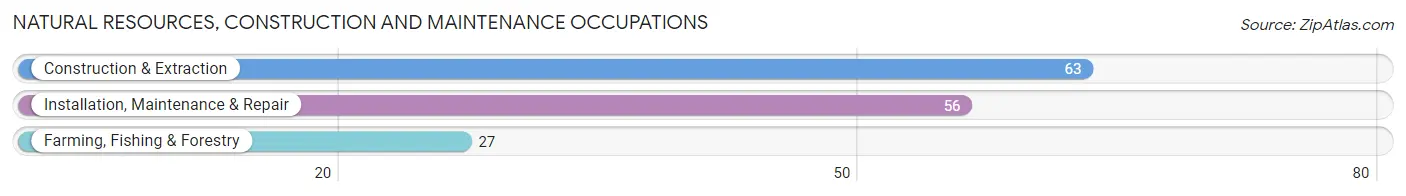
Natural Resources, Construction and Maintenance Occupations by Sex
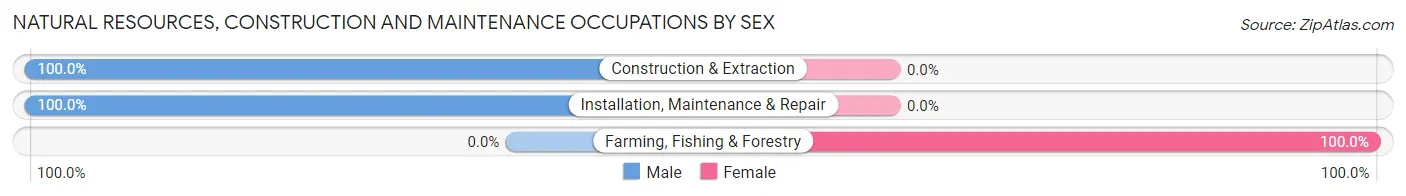
| Occupation | Male | Female |
| Farming, Fishing & Forestry | 0 (0.0%) | 27 (100.0%) |
| Construction & Extraction | 63 (100.0%) | 0 (0.0%) |
| Installation, Maintenance & Repair | 56 (100.0%) | 0 (0.0%) |
| Total (Category) | 119 (81.5%) | 27 (18.5%) |
| Total (Overall) | 1,447 (56.4%) | 1,120 (43.6%) |
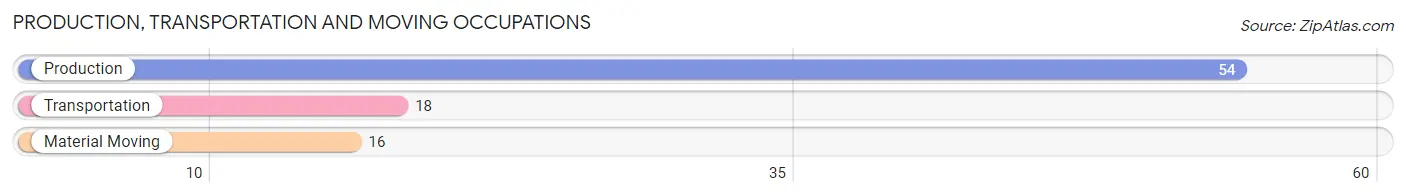
Production, Transportation and Moving Occupations
The most common Production, Transportation and Moving occupations in St Helena are Production (54 | 2.1%), Transportation (18 | 0.7%), and Material Moving (16 | 0.6%).
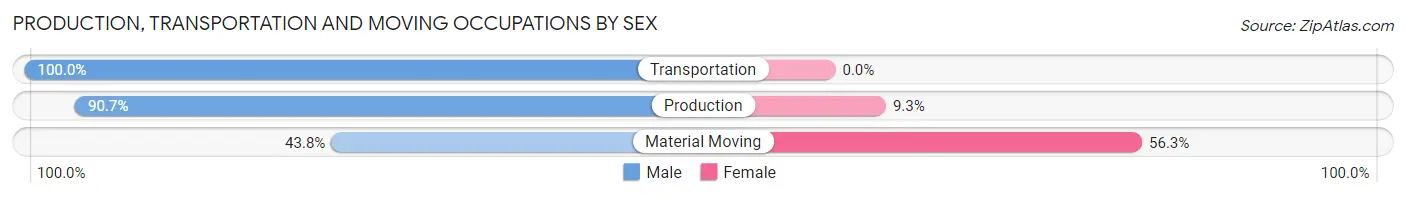
Production, Transportation and Moving Occupations by Sex
| Occupation | Male | Female |
| Production | 49 (90.7%) | 5 (9.3%) |
| Transportation | 18 (100.0%) | 0 (0.0%) |
| Material Moving | 7 (43.8%) | 9 (56.2%) |
| Total (Category) | 74 (84.1%) | 14 (15.9%) |
| Total (Overall) | 1,447 (56.4%) | 1,120 (43.6%) |
Employment Industries by Sex in St Helena
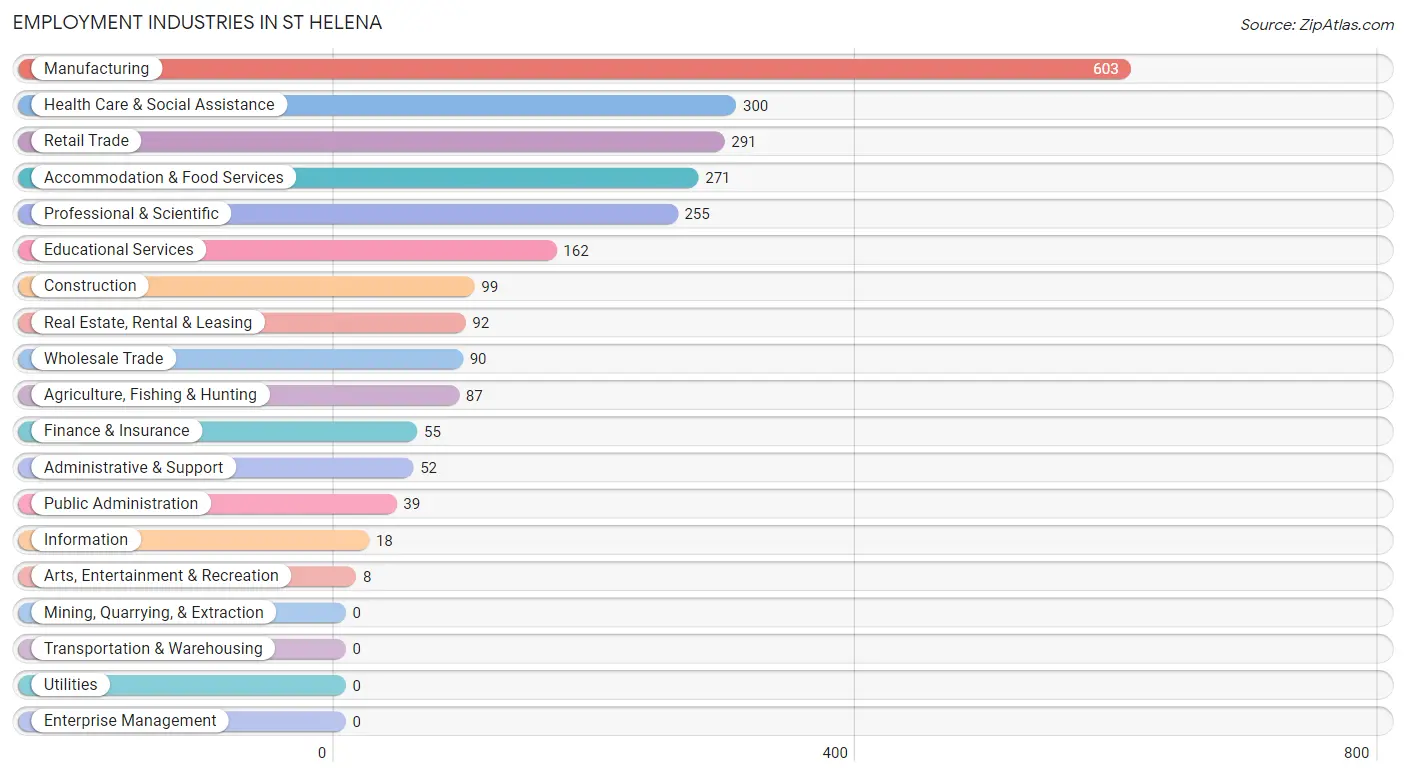
Employment Industries in St Helena
The major employment industries in St Helena include Manufacturing (603 | 23.5%), Health Care & Social Assistance (300 | 11.7%), Retail Trade (291 | 11.3%), Accommodation & Food Services (271 | 10.6%), and Professional & Scientific (255 | 9.9%).
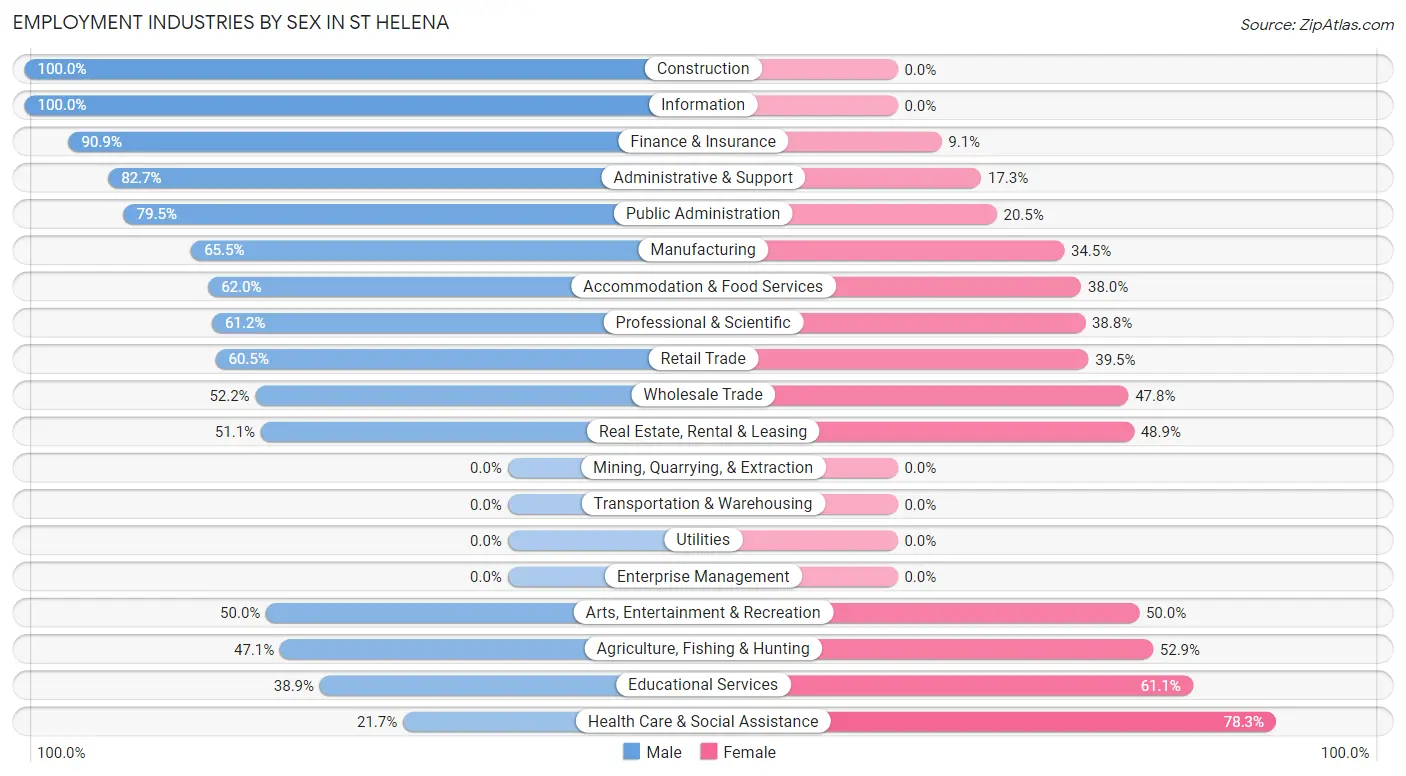
Employment Industries by Sex in St Helena
The St Helena industries that see more men than women are Construction (100.0%), Information (100.0%), and Finance & Insurance (90.9%), whereas the industries that tend to have a higher number of women are Health Care & Social Assistance (78.3%), Educational Services (61.1%), and Agriculture, Fishing & Hunting (52.9%).
| Industry | Male | Female |
| Agriculture, Fishing & Hunting | 41 (47.1%) | 46 (52.9%) |
| Mining, Quarrying, & Extraction | 0 (0.0%) | 0 (0.0%) |
| Construction | 99 (100.0%) | 0 (0.0%) |
| Manufacturing | 395 (65.5%) | 208 (34.5%) |
| Wholesale Trade | 47 (52.2%) | 43 (47.8%) |
| Retail Trade | 176 (60.5%) | 115 (39.5%) |
| Transportation & Warehousing | 0 (0.0%) | 0 (0.0%) |
| Utilities | 0 (0.0%) | 0 (0.0%) |
| Information | 18 (100.0%) | 0 (0.0%) |
| Finance & Insurance | 50 (90.9%) | 5 (9.1%) |
| Real Estate, Rental & Leasing | 47 (51.1%) | 45 (48.9%) |
| Professional & Scientific | 156 (61.2%) | 99 (38.8%) |
| Enterprise Management | 0 (0.0%) | 0 (0.0%) |
| Administrative & Support | 43 (82.7%) | 9 (17.3%) |
| Educational Services | 63 (38.9%) | 99 (61.1%) |
| Health Care & Social Assistance | 65 (21.7%) | 235 (78.3%) |
| Arts, Entertainment & Recreation | 4 (50.0%) | 4 (50.0%) |
| Accommodation & Food Services | 168 (62.0%) | 103 (38.0%) |
| Public Administration | 31 (79.5%) | 8 (20.5%) |
| Total | 1,447 (56.4%) | 1,120 (43.6%) |
Education in St Helena
School Enrollment in St Helena
The most common levels of schooling among the 988 students in St Helena are college / undergraduate (307 | 31.1%), high school (198 | 20.0%), and elementary school (167 | 16.9%).
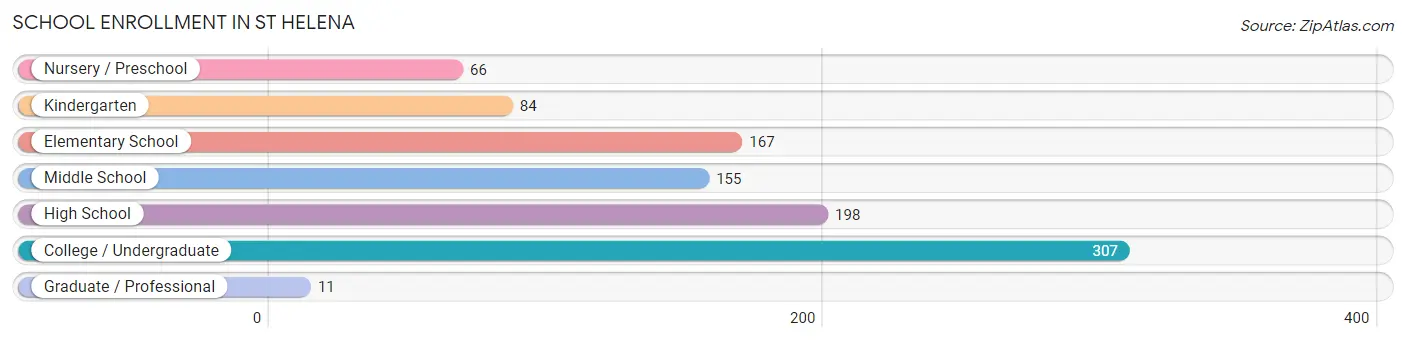
| School Level | # Students | % Students |
| Nursery / Preschool | 66 | 6.7% |
| Kindergarten | 84 | 8.5% |
| Elementary School | 167 | 16.9% |
| Middle School | 155 | 15.7% |
| High School | 198 | 20.0% |
| College / Undergraduate | 307 | 31.1% |
| Graduate / Professional | 11 | 1.1% |
| Total | 988 | 100.0% |
School Enrollment by Age by Funding Source in St Helena
Out of a total of 988 students who are enrolled in schools in St Helena, 314 (31.8%) attend a private institution, while the remaining 674 (68.2%) are enrolled in public schools. The age group of 5 to 9 year old has the highest likelihood of being enrolled in private schools, with 120 (47.8% in the age bracket) enrolled. Conversely, the age group of 10 to 14 year olds has the lowest likelihood of being enrolled in a private school, with 204 (100.0% in the age bracket) attending a public institution.
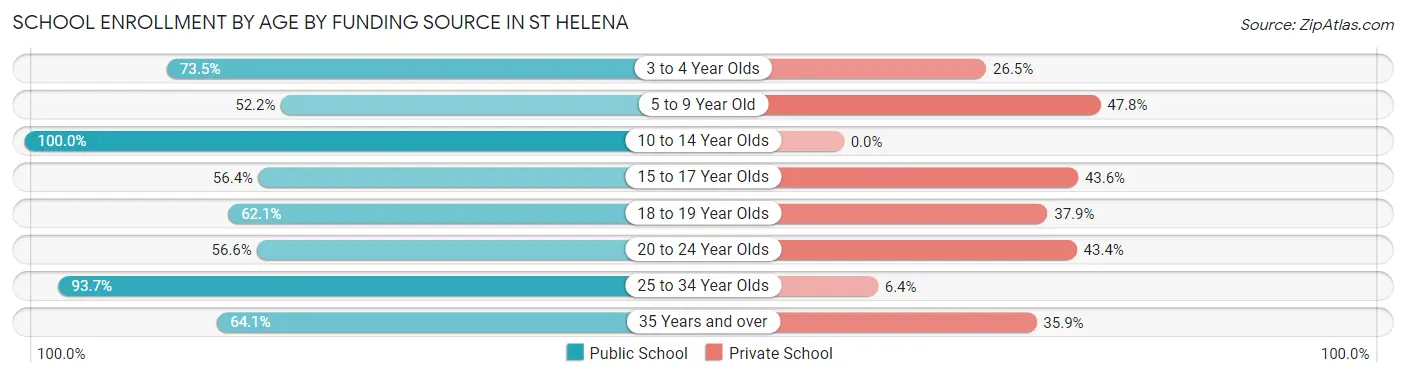
| Age Bracket | Public School | Private School |
| 3 to 4 Year Olds | 36 (73.5%) | 13 (26.5%) |
| 5 to 9 Year Old | 131 (52.2%) | 120 (47.8%) |
| 10 to 14 Year Olds | 204 (100.0%) | 0 (0.0%) |
| 15 to 17 Year Olds | 93 (56.4%) | 72 (43.6%) |
| 18 to 19 Year Olds | 36 (62.1%) | 22 (37.9%) |
| 20 to 24 Year Olds | 90 (56.6%) | 69 (43.4%) |
| 25 to 34 Year Olds | 59 (93.6%) | 4 (6.4%) |
| 35 Years and over | 25 (64.1%) | 14 (35.9%) |
| Total | 674 (68.2%) | 314 (31.8%) |
Educational Attainment by Field of Study in St Helena
Business (594 | 22.6%), bio, nature & agricultural (413 | 15.7%), social sciences (308 | 11.7%), liberal arts & history (195 | 7.4%), and literature & languages (186 | 7.1%) are the most common fields of study among 2,634 individuals in St Helena who have obtained a bachelor's degree or higher.
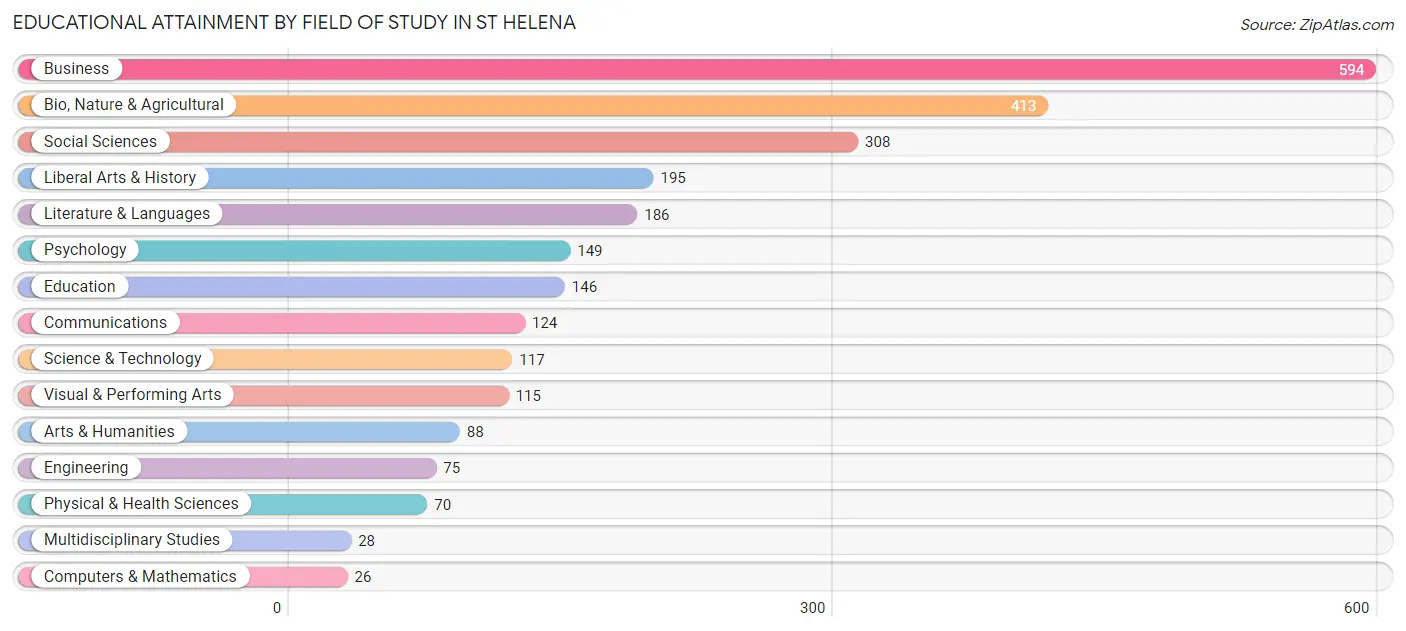
| Field of Study | # Graduates | % Graduates |
| Computers & Mathematics | 26 | 1.0% |
| Bio, Nature & Agricultural | 413 | 15.7% |
| Physical & Health Sciences | 70 | 2.7% |
| Psychology | 149 | 5.7% |
| Social Sciences | 308 | 11.7% |
| Engineering | 75 | 2.9% |
| Multidisciplinary Studies | 28 | 1.1% |
| Science & Technology | 117 | 4.4% |
| Business | 594 | 22.6% |
| Education | 146 | 5.5% |
| Literature & Languages | 186 | 7.1% |
| Liberal Arts & History | 195 | 7.4% |
| Visual & Performing Arts | 115 | 4.4% |
| Communications | 124 | 4.7% |
| Arts & Humanities | 88 | 3.3% |
| Total | 2,634 | 100.0% |
Transportation & Commute in St Helena
Vehicle Availability by Sex in St Helena
The most prevalent vehicle ownership categories in St Helena are males with 2 vehicles (603, accounting for 42.3%) and females with 2 vehicles (522, making up 55.7%).
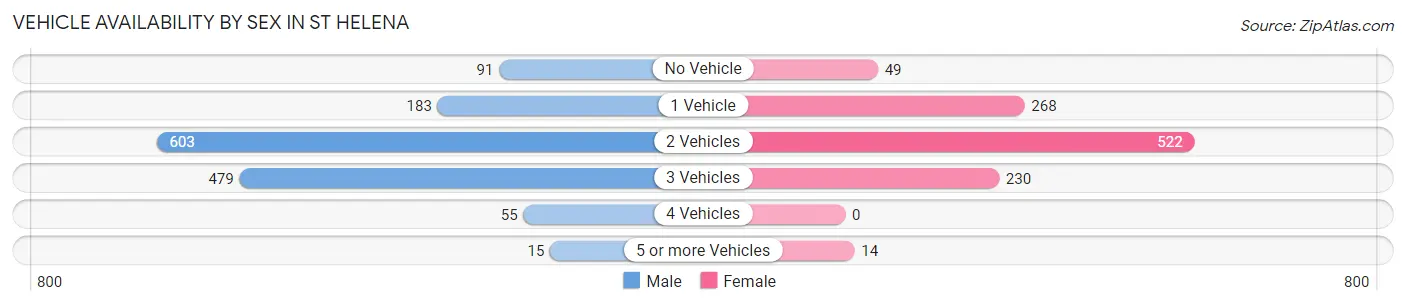
| Vehicles Available | Male | Female |
| No Vehicle | 91 (6.4%) | 49 (4.5%) |
| 1 Vehicle | 183 (12.8%) | 268 (24.7%) |
| 2 Vehicles | 603 (42.3%) | 522 (48.2%) |
| 3 Vehicles | 479 (33.6%) | 230 (21.2%) |
| 4 Vehicles | 55 (3.9%) | 0 (0.0%) |
| 5 or more Vehicles | 15 (1.1%) | 14 (1.3%) |
| Total | 1,426 (100.0%) | 1,083 (100.0%) |
Commute Time in St Helena
The most frequently occuring commute durations in St Helena are 5 to 9 minutes (676 commuters, 30.5%), 15 to 19 minutes (485 commuters, 21.9%), and 10 to 14 minutes (290 commuters, 13.1%).
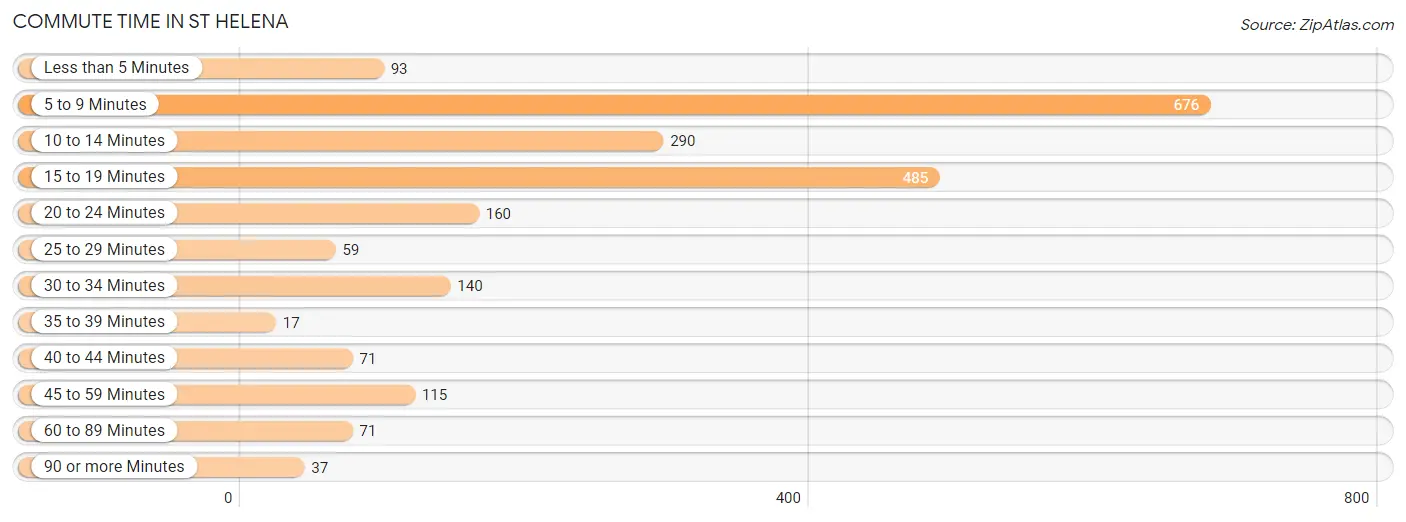
| Commute Time | # Commuters | % Commuters |
| Less than 5 Minutes | 93 | 4.2% |
| 5 to 9 Minutes | 676 | 30.5% |
| 10 to 14 Minutes | 290 | 13.1% |
| 15 to 19 Minutes | 485 | 21.9% |
| 20 to 24 Minutes | 160 | 7.2% |
| 25 to 29 Minutes | 59 | 2.7% |
| 30 to 34 Minutes | 140 | 6.3% |
| 35 to 39 Minutes | 17 | 0.8% |
| 40 to 44 Minutes | 71 | 3.2% |
| 45 to 59 Minutes | 115 | 5.2% |
| 60 to 89 Minutes | 71 | 3.2% |
| 90 or more Minutes | 37 | 1.7% |
Commute Time by Sex in St Helena
The most common commute times in St Helena are 15 to 19 minutes (402 commuters, 31.8%) for males and 5 to 9 minutes (427 commuters, 45.0%) for females.
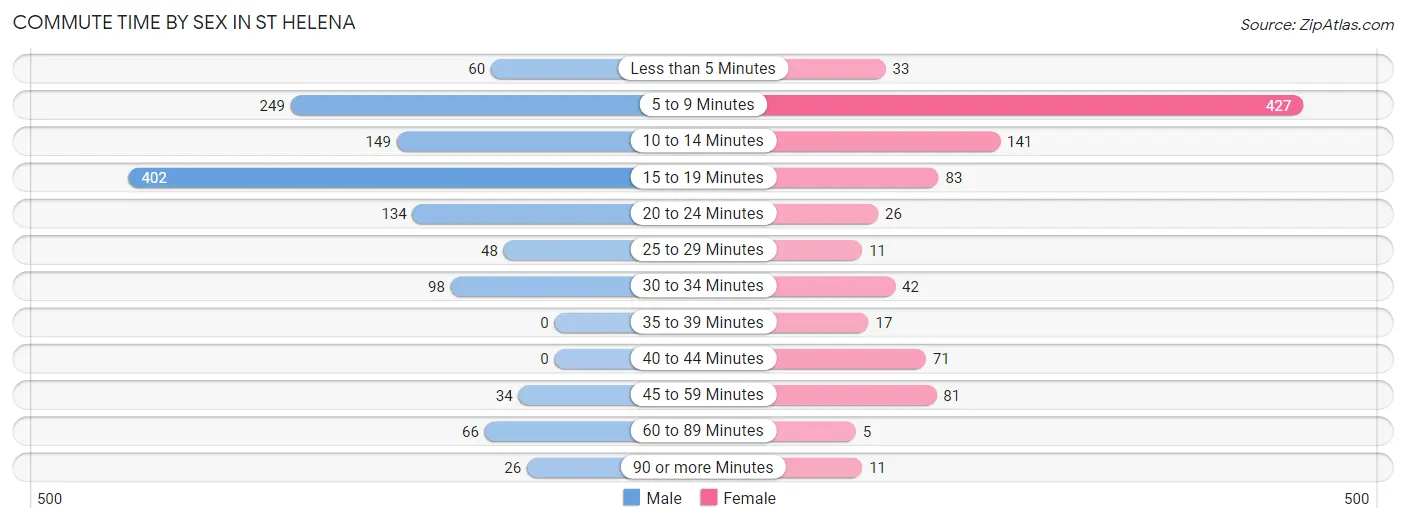
| Commute Time | Male | Female |
| Less than 5 Minutes | 60 (4.7%) | 33 (3.5%) |
| 5 to 9 Minutes | 249 (19.7%) | 427 (45.0%) |
| 10 to 14 Minutes | 149 (11.8%) | 141 (14.9%) |
| 15 to 19 Minutes | 402 (31.8%) | 83 (8.8%) |
| 20 to 24 Minutes | 134 (10.6%) | 26 (2.7%) |
| 25 to 29 Minutes | 48 (3.8%) | 11 (1.2%) |
| 30 to 34 Minutes | 98 (7.7%) | 42 (4.4%) |
| 35 to 39 Minutes | 0 (0.0%) | 17 (1.8%) |
| 40 to 44 Minutes | 0 (0.0%) | 71 (7.5%) |
| 45 to 59 Minutes | 34 (2.7%) | 81 (8.5%) |
| 60 to 89 Minutes | 66 (5.2%) | 5 (0.5%) |
| 90 or more Minutes | 26 (2.1%) | 11 (1.2%) |
Time of Departure to Work by Sex in St Helena
The most frequent times of departure to work in St Helena are 8:30 AM to 8:59 AM (336, 26.5%) for males and 8:00 AM to 8:29 AM (308, 32.5%) for females.
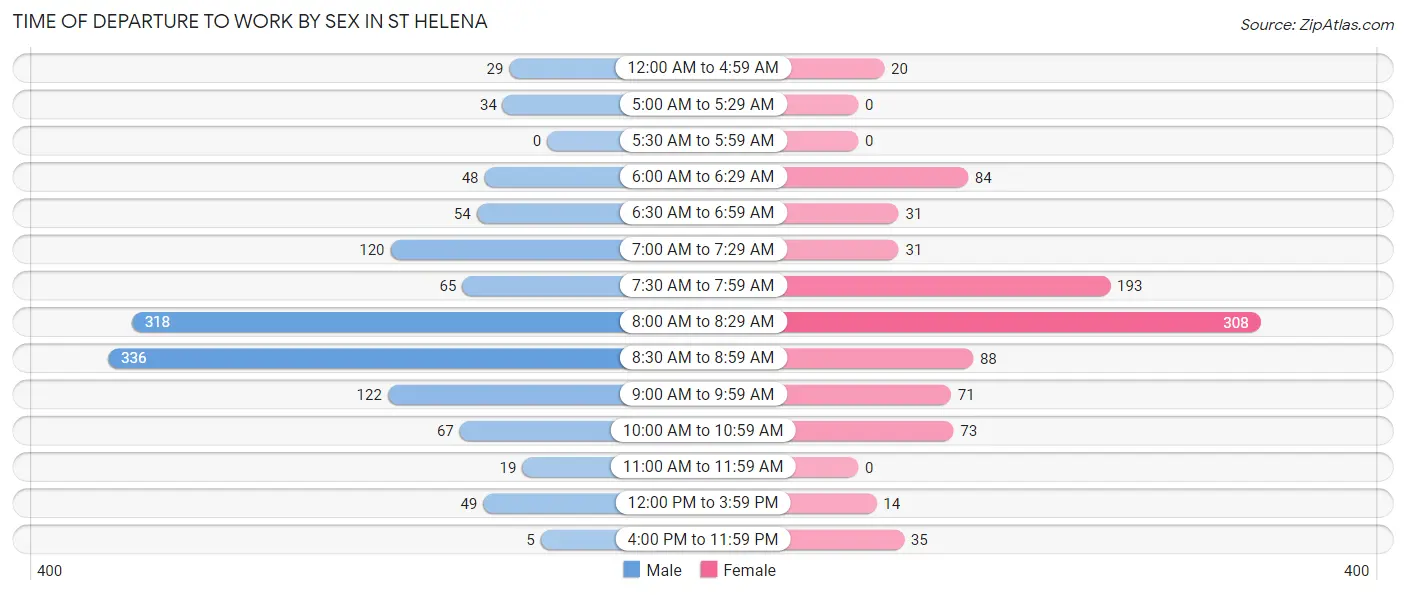
| Time of Departure | Male | Female |
| 12:00 AM to 4:59 AM | 29 (2.3%) | 20 (2.1%) |
| 5:00 AM to 5:29 AM | 34 (2.7%) | 0 (0.0%) |
| 5:30 AM to 5:59 AM | 0 (0.0%) | 0 (0.0%) |
| 6:00 AM to 6:29 AM | 48 (3.8%) | 84 (8.9%) |
| 6:30 AM to 6:59 AM | 54 (4.3%) | 31 (3.3%) |
| 7:00 AM to 7:29 AM | 120 (9.5%) | 31 (3.3%) |
| 7:30 AM to 7:59 AM | 65 (5.1%) | 193 (20.4%) |
| 8:00 AM to 8:29 AM | 318 (25.1%) | 308 (32.5%) |
| 8:30 AM to 8:59 AM | 336 (26.5%) | 88 (9.3%) |
| 9:00 AM to 9:59 AM | 122 (9.6%) | 71 (7.5%) |
| 10:00 AM to 10:59 AM | 67 (5.3%) | 73 (7.7%) |
| 11:00 AM to 11:59 AM | 19 (1.5%) | 0 (0.0%) |
| 12:00 PM to 3:59 PM | 49 (3.9%) | 14 (1.5%) |
| 4:00 PM to 11:59 PM | 5 (0.4%) | 35 (3.7%) |
| Total | 1,266 (100.0%) | 948 (100.0%) |
Housing Occupancy in St Helena
Occupancy by Ownership in St Helena
Of the total 2,466 dwellings in St Helena, owner-occupied units account for 1,674 (67.9%), while renter-occupied units make up 792 (32.1%).
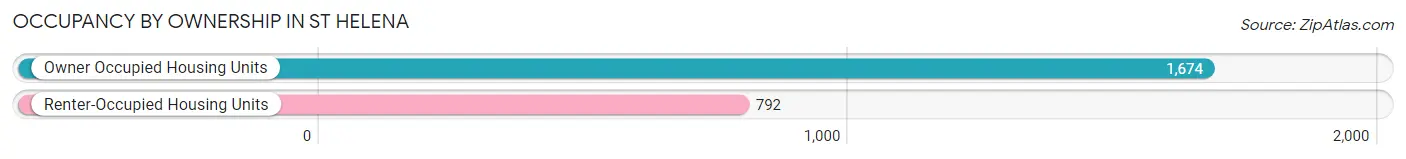
| Occupancy | # Housing Units | % Housing Units |
| Owner Occupied Housing Units | 1,674 | 67.9% |
| Renter-Occupied Housing Units | 792 | 32.1% |
| Total Occupied Housing Units | 2,466 | 100.0% |
Occupancy by Household Size in St Helena
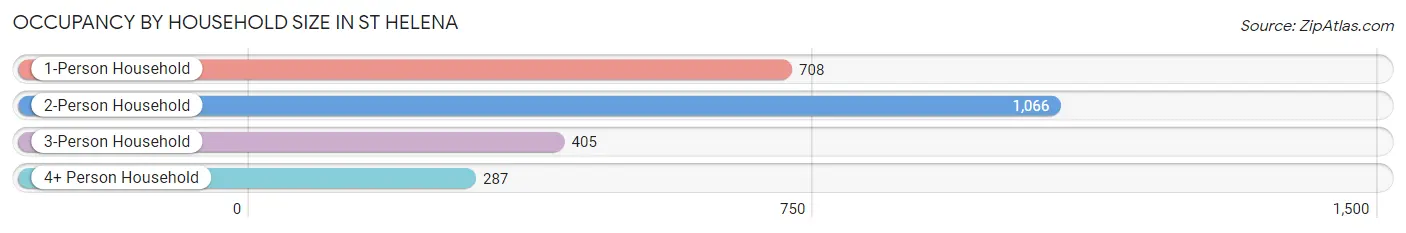
| Household Size | # Housing Units | % Housing Units |
| 1-Person Household | 708 | 28.7% |
| 2-Person Household | 1,066 | 43.2% |
| 3-Person Household | 405 | 16.4% |
| 4+ Person Household | 287 | 11.6% |
| Total Housing Units | 2,466 | 100.0% |
Occupancy by Ownership by Household Size in St Helena
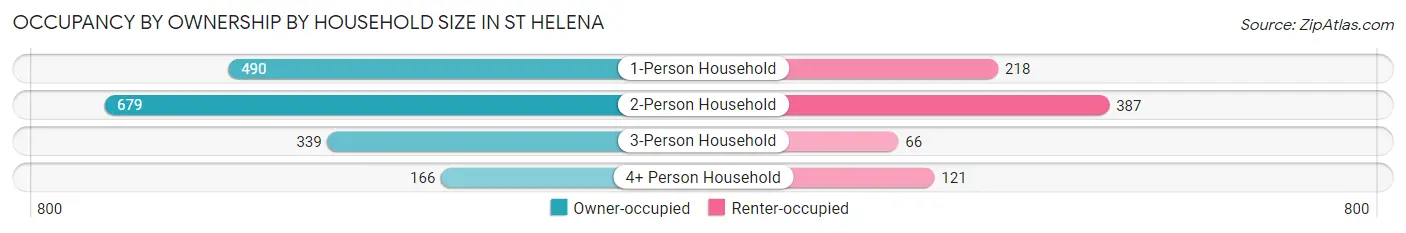
| Household Size | Owner-occupied | Renter-occupied |
| 1-Person Household | 490 (69.2%) | 218 (30.8%) |
| 2-Person Household | 679 (63.7%) | 387 (36.3%) |
| 3-Person Household | 339 (83.7%) | 66 (16.3%) |
| 4+ Person Household | 166 (57.8%) | 121 (42.2%) |
| Total Housing Units | 1,674 (67.9%) | 792 (32.1%) |
Occupancy by Educational Attainment in St Helena
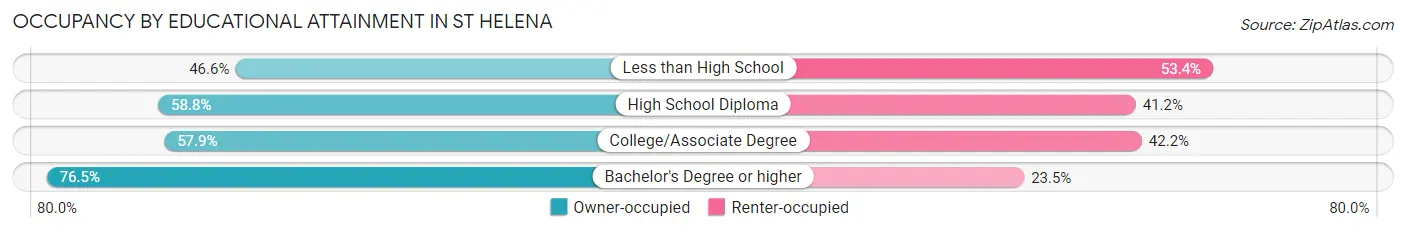
| Household Size | Owner-occupied | Renter-occupied |
| Less than High School | 130 (46.6%) | 149 (53.4%) |
| High School Diploma | 130 (58.8%) | 91 (41.2%) |
| College/Associate Degree | 280 (57.9%) | 204 (42.1%) |
| Bachelor's Degree or higher | 1,134 (76.5%) | 348 (23.5%) |
Occupancy by Age of Householder in St Helena
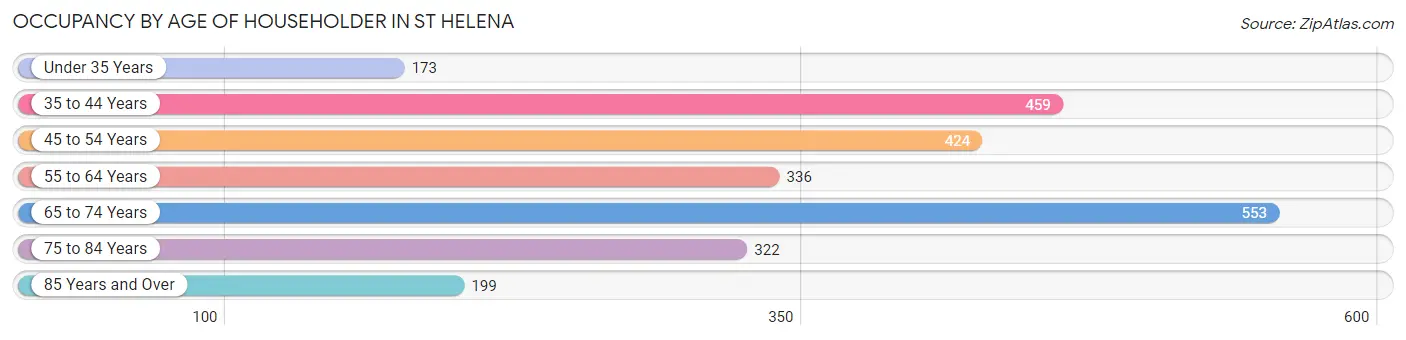
| Age Bracket | # Households | % Households |
| Under 35 Years | 173 | 7.0% |
| 35 to 44 Years | 459 | 18.6% |
| 45 to 54 Years | 424 | 17.2% |
| 55 to 64 Years | 336 | 13.6% |
| 65 to 74 Years | 553 | 22.4% |
| 75 to 84 Years | 322 | 13.1% |
| 85 Years and Over | 199 | 8.1% |
| Total | 2,466 | 100.0% |
Housing Finances in St Helena
Median Income by Occupancy in St Helena
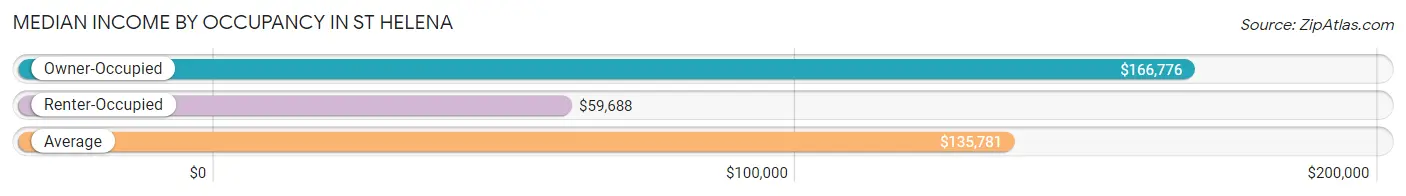
| Occupancy Type | # Households | Median Income |
| Owner-Occupied | 1,674 (67.9%) | $166,776 |
| Renter-Occupied | 792 (32.1%) | $59,688 |
| Average | 2,466 (100.0%) | $135,781 |
Occupancy by Householder Income Bracket in St Helena
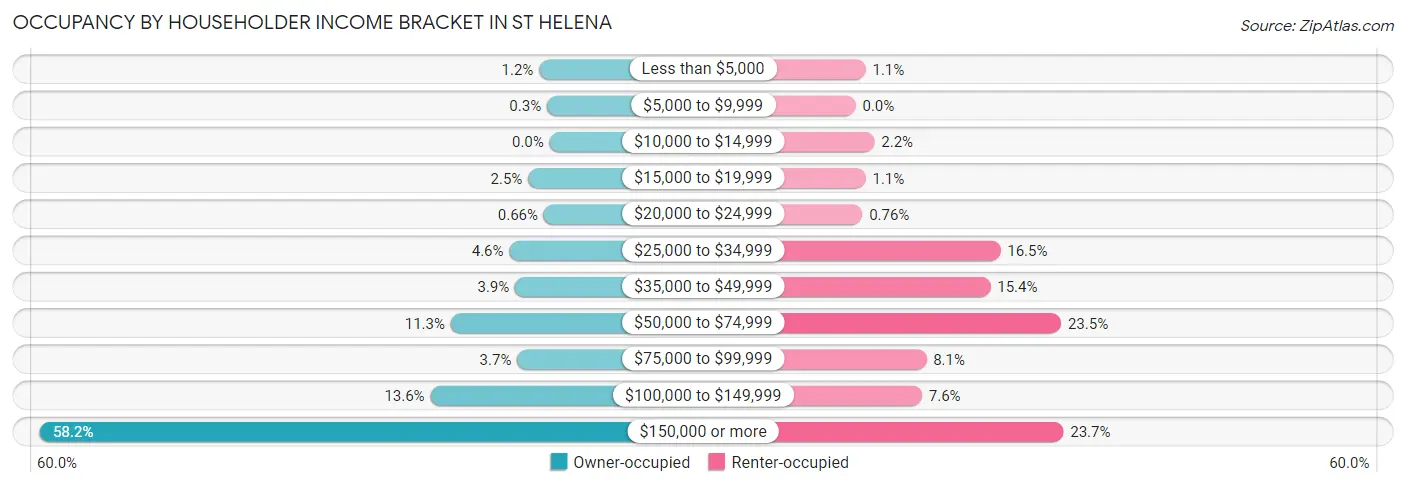
| Income Bracket | Owner-occupied | Renter-occupied |
| Less than $5,000 | 20 (1.2%) | 9 (1.1%) |
| $5,000 to $9,999 | 5 (0.3%) | 0 (0.0%) |
| $10,000 to $14,999 | 0 (0.0%) | 17 (2.1%) |
| $15,000 to $19,999 | 41 (2.5%) | 9 (1.1%) |
| $20,000 to $24,999 | 11 (0.7%) | 6 (0.8%) |
| $25,000 to $34,999 | 77 (4.6%) | 131 (16.5%) |
| $35,000 to $49,999 | 66 (3.9%) | 122 (15.4%) |
| $50,000 to $74,999 | 189 (11.3%) | 186 (23.5%) |
| $75,000 to $99,999 | 62 (3.7%) | 64 (8.1%) |
| $100,000 to $149,999 | 228 (13.6%) | 60 (7.6%) |
| $150,000 or more | 975 (58.2%) | 188 (23.7%) |
| Total | 1,674 (100.0%) | 792 (100.0%) |
Monthly Housing Cost Tiers in St Helena
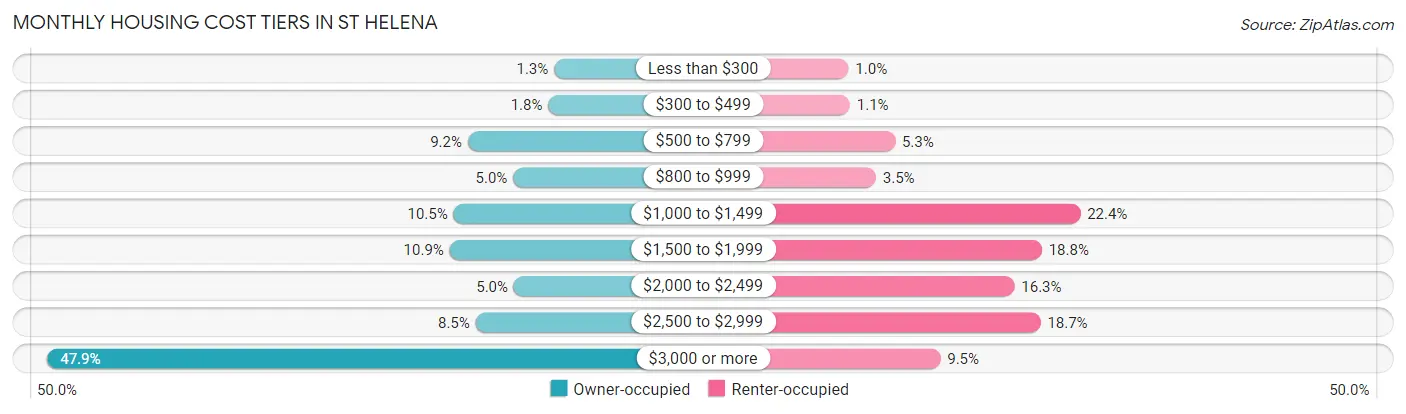
| Monthly Cost | Owner-occupied | Renter-occupied |
| Less than $300 | 21 (1.3%) | 8 (1.0%) |
| $300 to $499 | 30 (1.8%) | 9 (1.1%) |
| $500 to $799 | 154 (9.2%) | 42 (5.3%) |
| $800 to $999 | 84 (5.0%) | 28 (3.5%) |
| $1,000 to $1,499 | 176 (10.5%) | 177 (22.4%) |
| $1,500 to $1,999 | 182 (10.9%) | 149 (18.8%) |
| $2,000 to $2,499 | 83 (5.0%) | 129 (16.3%) |
| $2,500 to $2,999 | 142 (8.5%) | 148 (18.7%) |
| $3,000 or more | 802 (47.9%) | 75 (9.5%) |
| Total | 1,674 (100.0%) | 792 (100.0%) |
Physical Housing Characteristics in St Helena
Housing Structures in St Helena
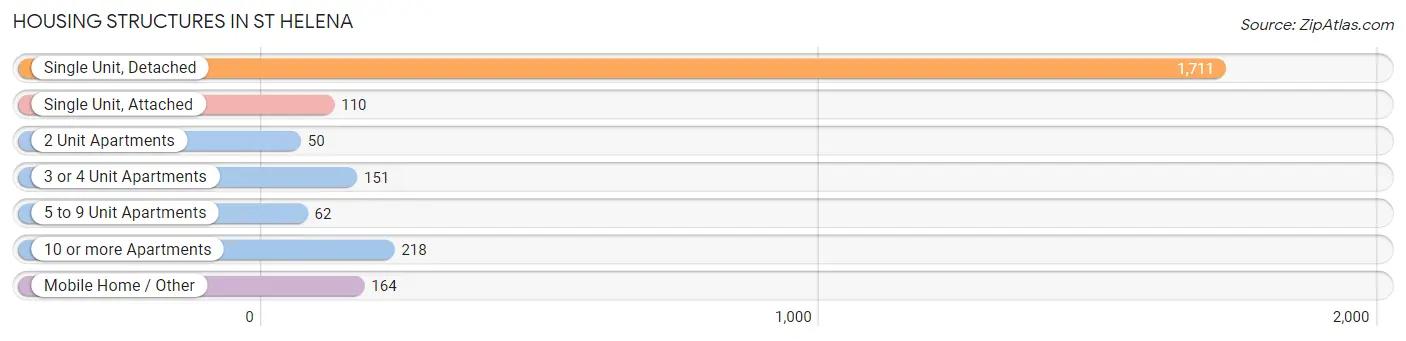
| Structure Type | # Housing Units | % Housing Units |
| Single Unit, Detached | 1,711 | 69.4% |
| Single Unit, Attached | 110 | 4.5% |
| 2 Unit Apartments | 50 | 2.0% |
| 3 or 4 Unit Apartments | 151 | 6.1% |
| 5 to 9 Unit Apartments | 62 | 2.5% |
| 10 or more Apartments | 218 | 8.8% |
| Mobile Home / Other | 164 | 6.7% |
| Total | 2,466 | 100.0% |
Housing Structures by Occupancy in St Helena
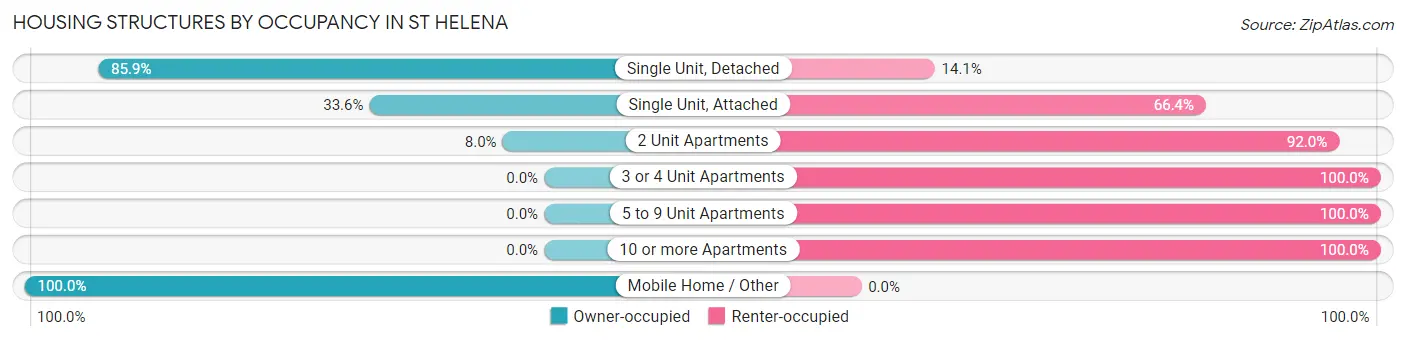
| Structure Type | Owner-occupied | Renter-occupied |
| Single Unit, Detached | 1,469 (85.9%) | 242 (14.1%) |
| Single Unit, Attached | 37 (33.6%) | 73 (66.4%) |
| 2 Unit Apartments | 4 (8.0%) | 46 (92.0%) |
| 3 or 4 Unit Apartments | 0 (0.0%) | 151 (100.0%) |
| 5 to 9 Unit Apartments | 0 (0.0%) | 62 (100.0%) |
| 10 or more Apartments | 0 (0.0%) | 218 (100.0%) |
| Mobile Home / Other | 164 (100.0%) | 0 (0.0%) |
| Total | 1,674 (67.9%) | 792 (32.1%) |
Housing Structures by Number of Rooms in St Helena
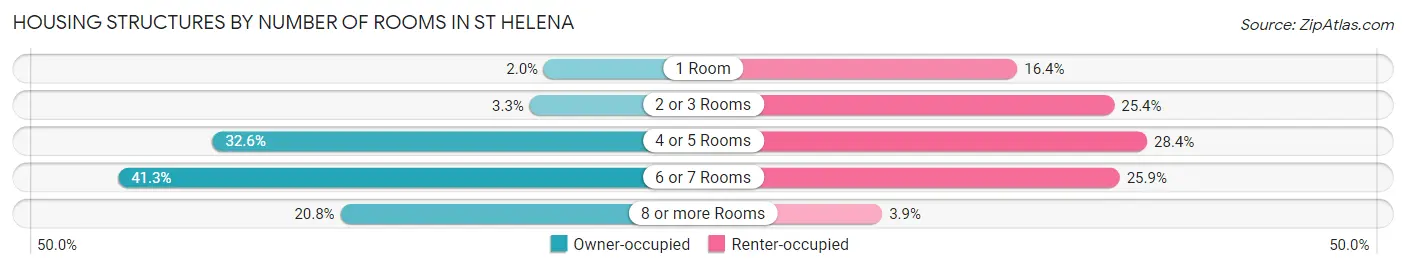
| Number of Rooms | Owner-occupied | Renter-occupied |
| 1 Room | 33 (2.0%) | 130 (16.4%) |
| 2 or 3 Rooms | 55 (3.3%) | 201 (25.4%) |
| 4 or 5 Rooms | 546 (32.6%) | 225 (28.4%) |
| 6 or 7 Rooms | 692 (41.3%) | 205 (25.9%) |
| 8 or more Rooms | 348 (20.8%) | 31 (3.9%) |
| Total | 1,674 (100.0%) | 792 (100.0%) |
Housing Structure by Heating Type in St Helena
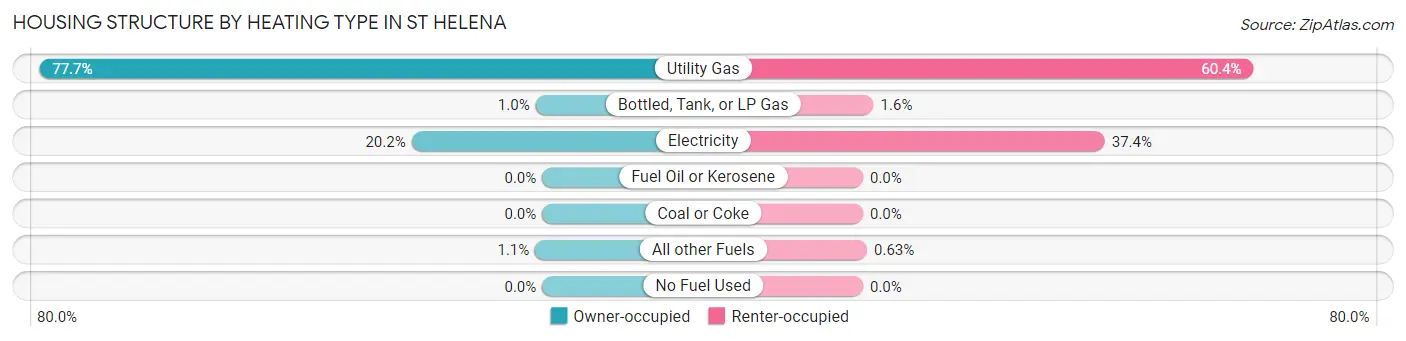
| Heating Type | Owner-occupied | Renter-occupied |
| Utility Gas | 1,301 (77.7%) | 478 (60.4%) |
| Bottled, Tank, or LP Gas | 17 (1.0%) | 13 (1.6%) |
| Electricity | 338 (20.2%) | 296 (37.4%) |
| Fuel Oil or Kerosene | 0 (0.0%) | 0 (0.0%) |
| Coal or Coke | 0 (0.0%) | 0 (0.0%) |
| All other Fuels | 18 (1.1%) | 5 (0.6%) |
| No Fuel Used | 0 (0.0%) | 0 (0.0%) |
| Total | 1,674 (100.0%) | 792 (100.0%) |
Household Vehicle Usage in St Helena
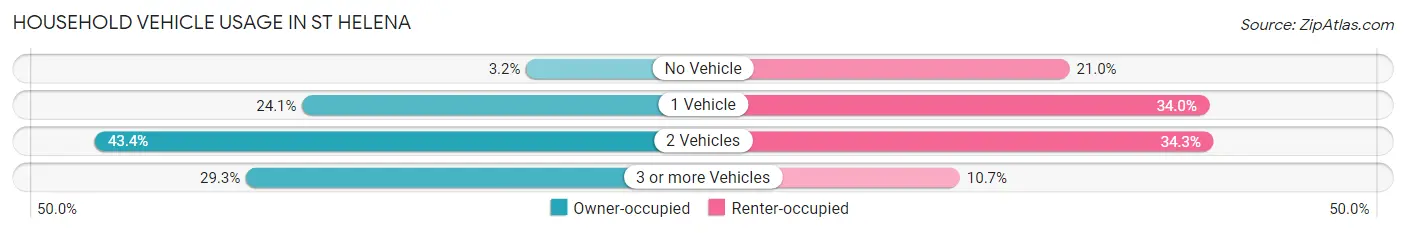
| Vehicles per Household | Owner-occupied | Renter-occupied |
| No Vehicle | 53 (3.2%) | 166 (21.0%) |
| 1 Vehicle | 403 (24.1%) | 269 (34.0%) |
| 2 Vehicles | 727 (43.4%) | 272 (34.3%) |
| 3 or more Vehicles | 491 (29.3%) | 85 (10.7%) |
| Total | 1,674 (100.0%) | 792 (100.0%) |
Real Estate & Mortgages in St Helena
Real Estate and Mortgage Overview in St Helena
| Characteristic | Without Mortgage | With Mortgage |
| Housing Units | 673 | 1,001 |
| Median Property Value | $1,226,300 | $2,000,001 |
| Median Household Income | $130,536 | $662 |
| Monthly Housing Costs | $1,149 | $753 |
| Real Estate Taxes | $4,466 | $53 |
Property Value by Mortgage Status in St Helena
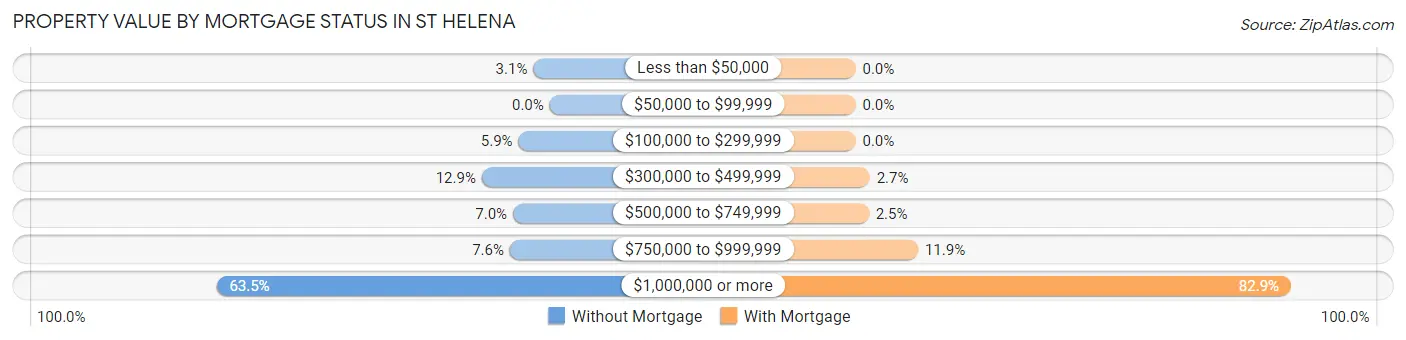
| Property Value | Without Mortgage | With Mortgage |
| Less than $50,000 | 21 (3.1%) | 0 (0.0%) |
| $50,000 to $99,999 | 0 (0.0%) | 0 (0.0%) |
| $100,000 to $299,999 | 40 (5.9%) | 0 (0.0%) |
| $300,000 to $499,999 | 87 (12.9%) | 27 (2.7%) |
| $500,000 to $749,999 | 47 (7.0%) | 25 (2.5%) |
| $750,000 to $999,999 | 51 (7.6%) | 119 (11.9%) |
| $1,000,000 or more | 427 (63.4%) | 830 (82.9%) |
| Total | 673 (100.0%) | 1,001 (100.0%) |
Household Income by Mortgage Status in St Helena
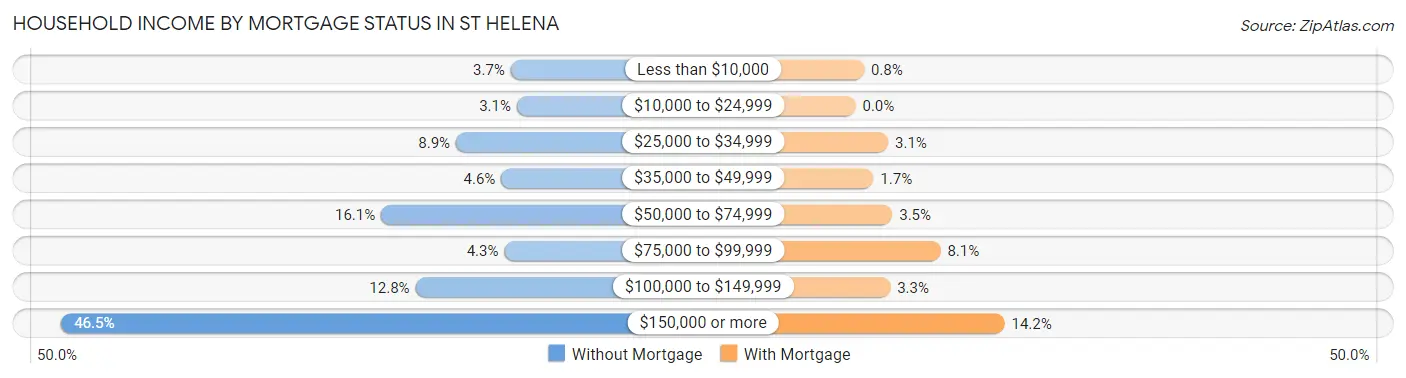
| Household Income | Without Mortgage | With Mortgage |
| Less than $10,000 | 25 (3.7%) | 8 (0.8%) |
| $10,000 to $24,999 | 21 (3.1%) | 0 (0.0%) |
| $25,000 to $34,999 | 60 (8.9%) | 31 (3.1%) |
| $35,000 to $49,999 | 31 (4.6%) | 17 (1.7%) |
| $50,000 to $74,999 | 108 (16.1%) | 35 (3.5%) |
| $75,000 to $99,999 | 29 (4.3%) | 81 (8.1%) |
| $100,000 to $149,999 | 86 (12.8%) | 33 (3.3%) |
| $150,000 or more | 313 (46.5%) | 142 (14.2%) |
| Total | 673 (100.0%) | 1,001 (100.0%) |
Property Value to Household Income Ratio in St Helena
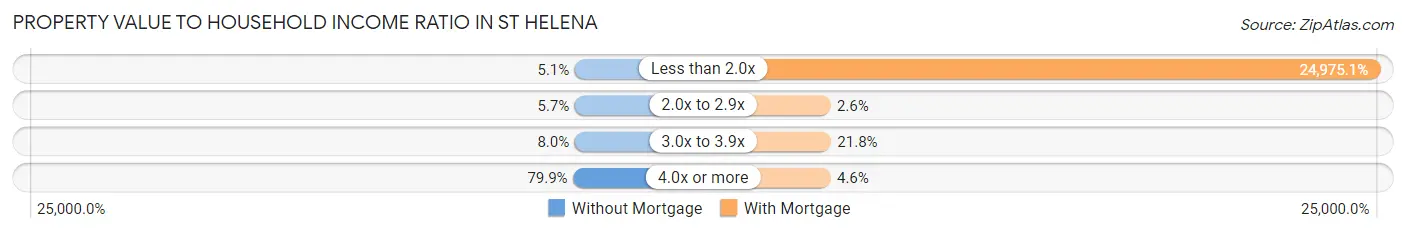
| Value-to-Income Ratio | Without Mortgage | With Mortgage |
| Less than 2.0x | 34 (5.1%) | 250,001 (24,975.1%) |
| 2.0x to 2.9x | 38 (5.7%) | 26 (2.6%) |
| 3.0x to 3.9x | 54 (8.0%) | 218 (21.8%) |
| 4.0x or more | 538 (79.9%) | 46 (4.6%) |
| Total | 673 (100.0%) | 1,001 (100.0%) |
Real Estate Taxes by Mortgage Status in St Helena
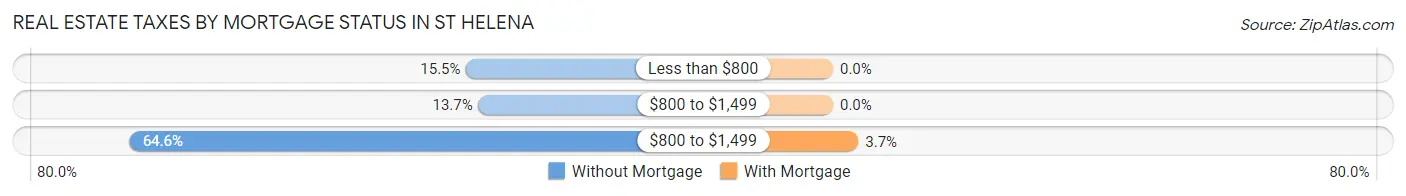
| Property Taxes | Without Mortgage | With Mortgage |
| Less than $800 | 104 (15.4%) | 0 (0.0%) |
| $800 to $1,499 | 92 (13.7%) | 0 (0.0%) |
| $800 to $1,499 | 435 (64.6%) | 37 (3.7%) |
| Total | 673 (100.0%) | 1,001 (100.0%) |
Health & Disability in St Helena
Health Insurance Coverage by Age in St Helena
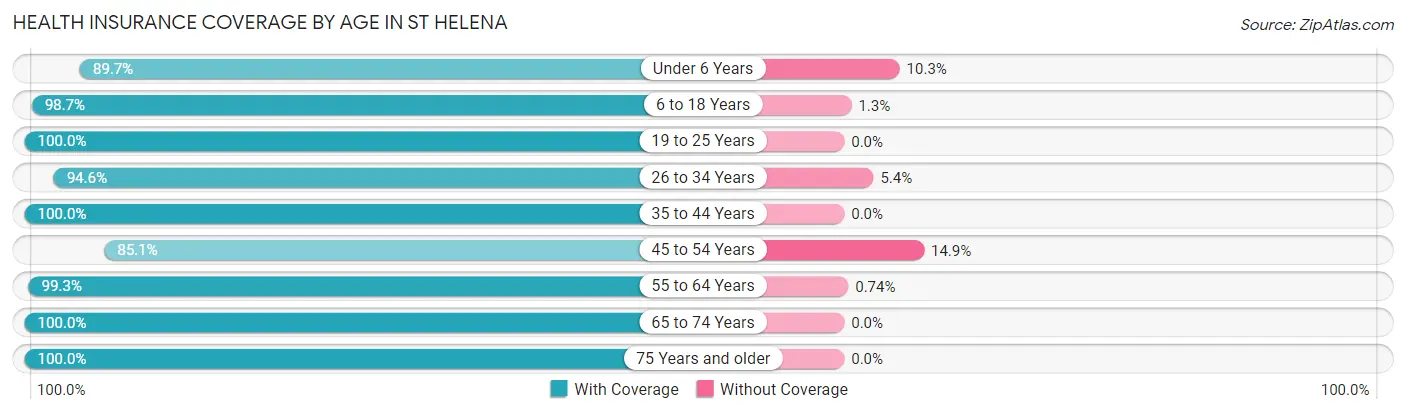
| Age Bracket | With Coverage | Without Coverage |
| Under 6 Years | 278 (89.7%) | 32 (10.3%) |
| 6 to 18 Years | 594 (98.7%) | 8 (1.3%) |
| 19 to 25 Years | 324 (100.0%) | 0 (0.0%) |
| 26 to 34 Years | 452 (94.6%) | 26 (5.4%) |
| 35 to 44 Years | 790 (100.0%) | 0 (0.0%) |
| 45 to 54 Years | 521 (85.1%) | 91 (14.9%) |
| 55 to 64 Years | 539 (99.3%) | 4 (0.7%) |
| 65 to 74 Years | 949 (100.0%) | 0 (0.0%) |
| 75 Years and older | 818 (100.0%) | 0 (0.0%) |
| Total | 5,265 (97.0%) | 161 (3.0%) |
Health Insurance Coverage by Citizenship Status in St Helena
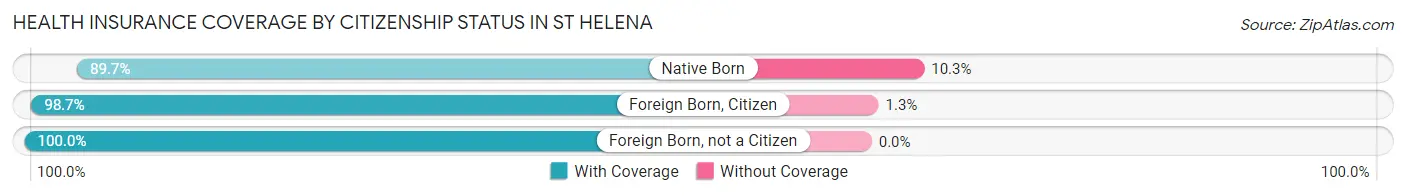
| Citizenship Status | With Coverage | Without Coverage |
| Native Born | 278 (89.7%) | 32 (10.3%) |
| Foreign Born, Citizen | 594 (98.7%) | 8 (1.3%) |
| Foreign Born, not a Citizen | 324 (100.0%) | 0 (0.0%) |
Health Insurance Coverage by Household Income in St Helena
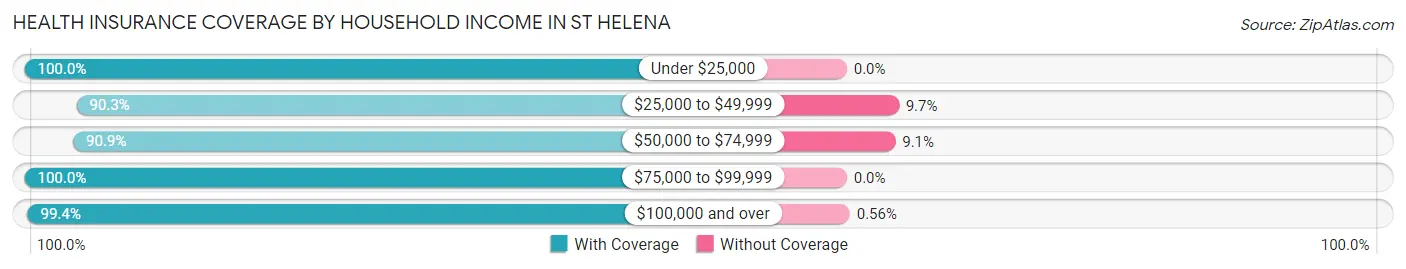
| Household Income | With Coverage | Without Coverage |
| Under $25,000 | 157 (100.0%) | 0 (0.0%) |
| $25,000 to $49,999 | 641 (90.3%) | 69 (9.7%) |
| $50,000 to $74,999 | 731 (90.9%) | 73 (9.1%) |
| $75,000 to $99,999 | 287 (100.0%) | 0 (0.0%) |
| $100,000 and over | 3,387 (99.4%) | 19 (0.6%) |
Public vs Private Health Insurance Coverage by Age in St Helena
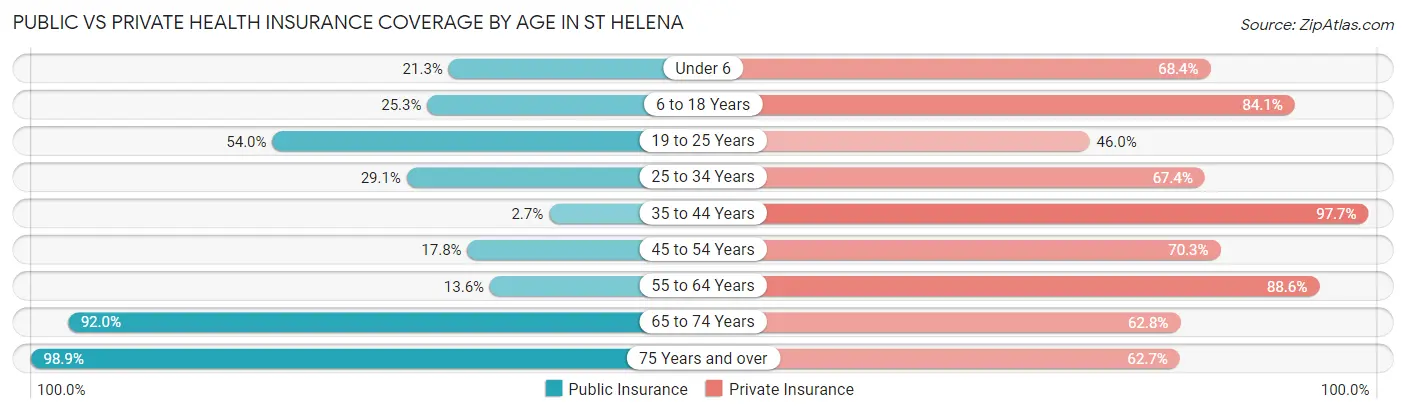
| Age Bracket | Public Insurance | Private Insurance |
| Under 6 | 66 (21.3%) | 212 (68.4%) |
| 6 to 18 Years | 152 (25.3%) | 506 (84.1%) |
| 19 to 25 Years | 175 (54.0%) | 149 (46.0%) |
| 25 to 34 Years | 139 (29.1%) | 322 (67.4%) |
| 35 to 44 Years | 21 (2.7%) | 772 (97.7%) |
| 45 to 54 Years | 109 (17.8%) | 430 (70.3%) |
| 55 to 64 Years | 74 (13.6%) | 481 (88.6%) |
| 65 to 74 Years | 873 (92.0%) | 596 (62.8%) |
| 75 Years and over | 809 (98.9%) | 513 (62.7%) |
| Total | 2,418 (44.6%) | 3,981 (73.4%) |
Disability Status by Sex by Age in St Helena
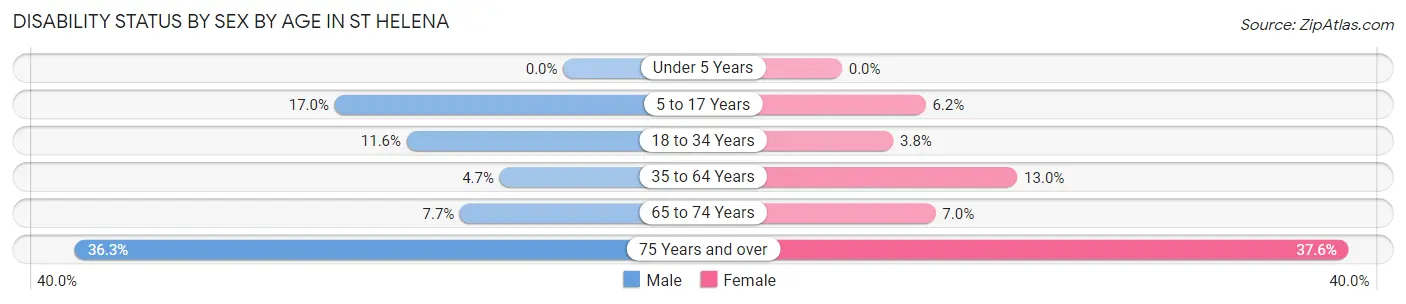
| Age Bracket | Male | Female |
| Under 5 Years | 0 (0.0%) | 0 (0.0%) |
| 5 to 17 Years | 56 (17.0%) | 18 (6.2%) |
| 18 to 34 Years | 48 (11.6%) | 16 (3.8%) |
| 35 to 64 Years | 45 (4.7%) | 129 (13.0%) |
| 65 to 74 Years | 33 (7.7%) | 36 (7.0%) |
| 75 Years and over | 153 (36.3%) | 149 (37.6%) |
Disability Class by Sex by Age in St Helena
Disability Class: Hearing Difficulty
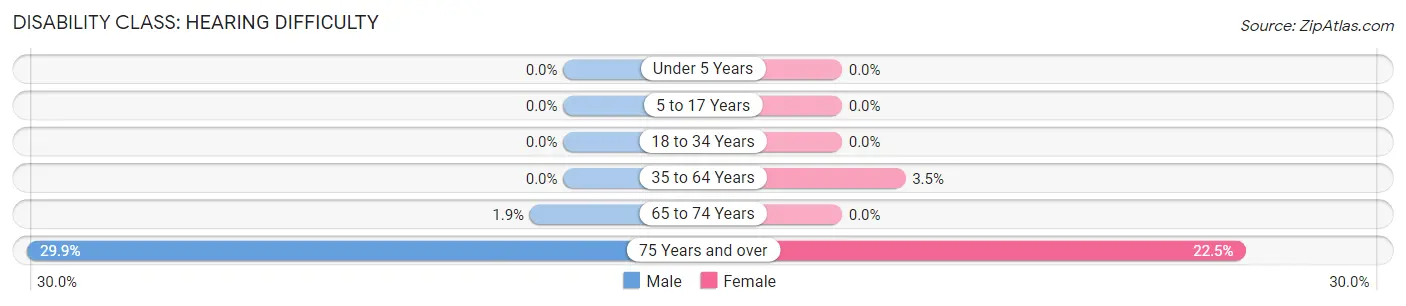
| Age Bracket | Male | Female |
| Under 5 Years | 0 (0.0%) | 0 (0.0%) |
| 5 to 17 Years | 0 (0.0%) | 0 (0.0%) |
| 18 to 34 Years | 0 (0.0%) | 0 (0.0%) |
| 35 to 64 Years | 0 (0.0%) | 35 (3.5%) |
| 65 to 74 Years | 8 (1.9%) | 0 (0.0%) |
| 75 Years and over | 126 (29.9%) | 89 (22.5%) |
Disability Class: Vision Difficulty
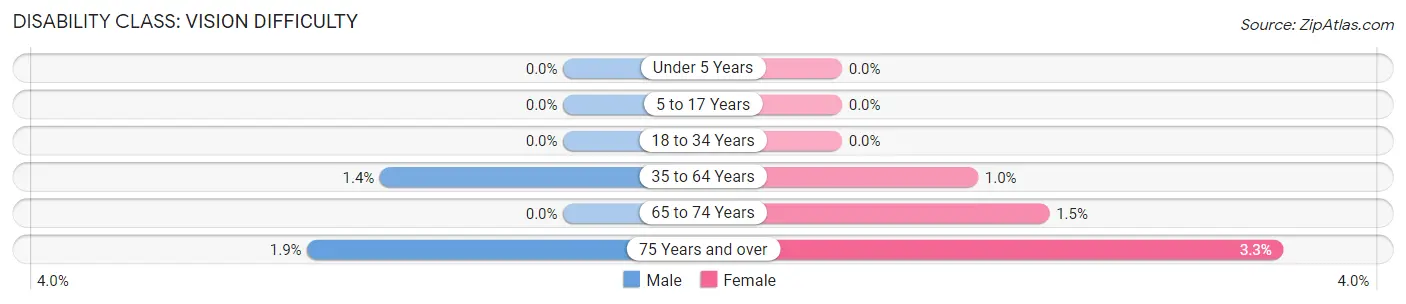
| Age Bracket | Male | Female |
| Under 5 Years | 0 (0.0%) | 0 (0.0%) |
| 5 to 17 Years | 0 (0.0%) | 0 (0.0%) |
| 18 to 34 Years | 0 (0.0%) | 0 (0.0%) |
| 35 to 64 Years | 13 (1.4%) | 10 (1.0%) |
| 65 to 74 Years | 0 (0.0%) | 8 (1.5%) |
| 75 Years and over | 8 (1.9%) | 13 (3.3%) |
Disability Class: Cognitive Difficulty
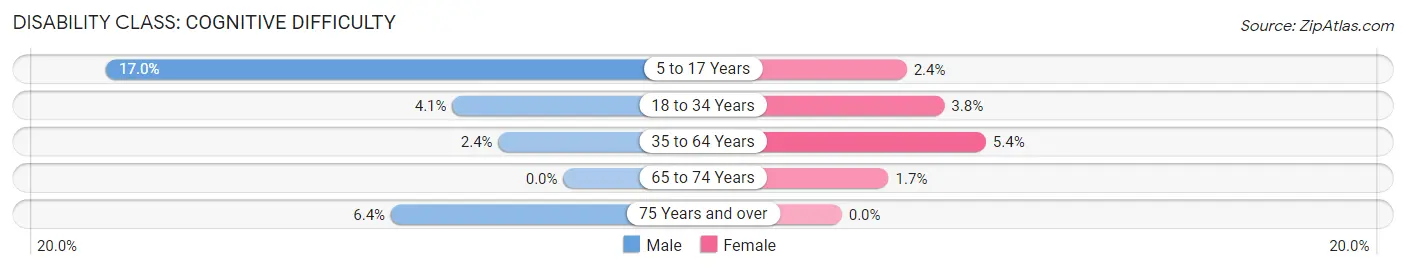
| Age Bracket | Male | Female |
| 5 to 17 Years | 56 (17.0%) | 7 (2.4%) |
| 18 to 34 Years | 17 (4.1%) | 16 (3.8%) |
| 35 to 64 Years | 23 (2.4%) | 53 (5.3%) |
| 65 to 74 Years | 0 (0.0%) | 9 (1.7%) |
| 75 Years and over | 27 (6.4%) | 0 (0.0%) |
Disability Class: Ambulatory Difficulty
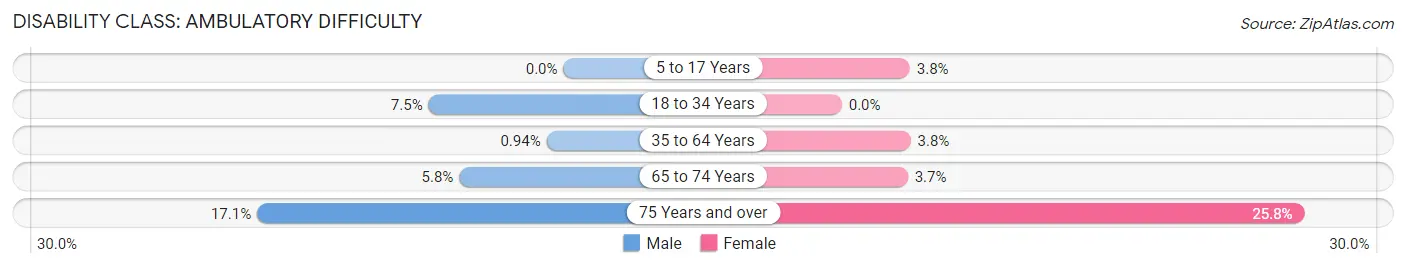
| Age Bracket | Male | Female |
| 5 to 17 Years | 0 (0.0%) | 11 (3.8%) |
| 18 to 34 Years | 31 (7.5%) | 0 (0.0%) |
| 35 to 64 Years | 9 (0.9%) | 38 (3.8%) |
| 65 to 74 Years | 25 (5.8%) | 19 (3.7%) |
| 75 Years and over | 72 (17.1%) | 102 (25.8%) |
Disability Class: Self-Care Difficulty
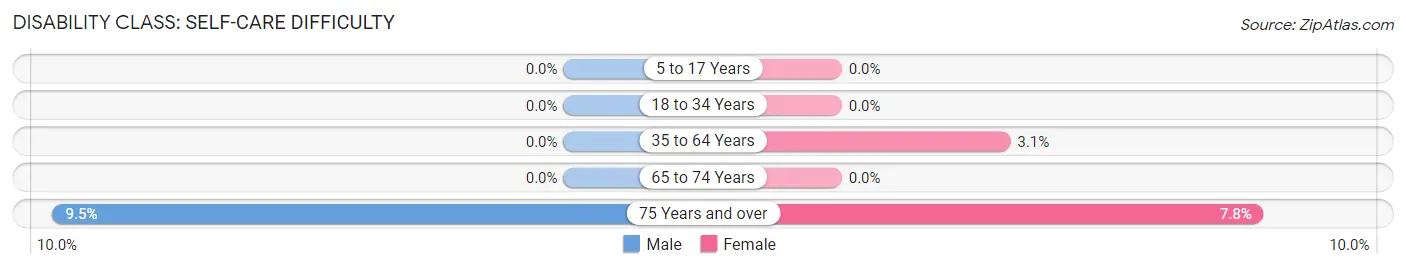
| Age Bracket | Male | Female |
| 5 to 17 Years | 0 (0.0%) | 0 (0.0%) |
| 18 to 34 Years | 0 (0.0%) | 0 (0.0%) |
| 35 to 64 Years | 0 (0.0%) | 31 (3.1%) |
| 65 to 74 Years | 0 (0.0%) | 0 (0.0%) |
| 75 Years and over | 40 (9.5%) | 31 (7.8%) |
Technology Access in St Helena
Computing Device Access in St Helena
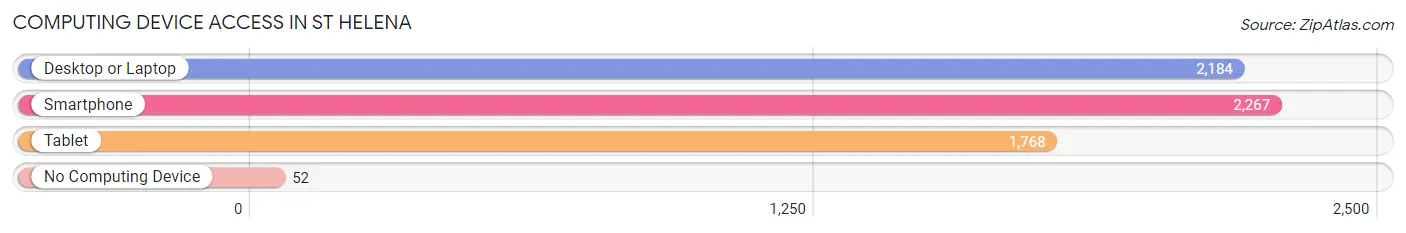
| Device Type | # Households | % Households |
| Desktop or Laptop | 2,184 | 88.6% |
| Smartphone | 2,267 | 91.9% |
| Tablet | 1,768 | 71.7% |
| No Computing Device | 52 | 2.1% |
| Total | 2,466 | 100.0% |
Internet Access in St Helena
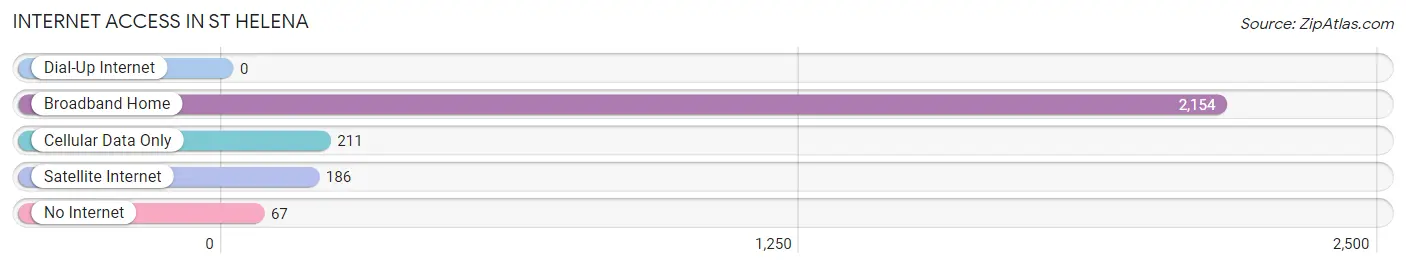
| Internet Type | # Households | % Households |
| Dial-Up Internet | 0 | 0.0% |
| Broadband Home | 2,154 | 87.4% |
| Cellular Data Only | 211 | 8.6% |
| Satellite Internet | 186 | 7.5% |
| No Internet | 67 | 2.7% |
| Total | 2,466 | 100.0% |
St Helena Summary
History
St. Helena is a city located in Napa County, California. It is located in the heart of the Napa Valley, and is known for its wineries and vineyards. The city was founded in 1876 by George C. Yount, who was the first European settler in the area. Yount named the city after Saint Helena of Constantinople, the mother of Emperor Constantine the Great.
The city was originally a farming community, and the first winery was established in 1878. The city quickly became known for its wine production, and by the early 1900s, it was home to over 30 wineries. The city was incorporated in 1881, and the first mayor was George Yount.
Geography
St. Helena is located in the northern part of Napa County, in the heart of the Napa Valley. It is situated between the Mayacamas Mountains to the east and the Vaca Mountains to the west. The city is located at an elevation of 830 feet above sea level.
The city covers an area of 4.2 square miles, and has a population of 5,814 as of the 2010 census. The city is located in a Mediterranean climate zone, with hot, dry summers and mild, wet winters.
Economy
St. Helena is known for its wine production, and is home to over 100 wineries and vineyards. The city is also home to several restaurants, hotels, and other businesses that cater to the wine industry.
The city is also home to several other businesses, including a number of retail stores, banks, and professional services. The city is also home to a number of medical facilities, including a hospital and several clinics.
Demographics
As of the 2010 census, the population of St. Helena was 5,814. The racial makeup of the city was 79.2% White, 0.7% African American, 0.3% Native American, 1.2% Asian, 0.1% Pacific Islander, 15.2% from other races, and 3.3% from two or more races. Hispanic or Latino of any race were 24.3% of the population.
The median income for a household in the city was $68,958, and the median income for a family was $77,958. The per capita income for the city was $37,958. About 8.2% of families and 10.3% of the population were below the poverty line, including 14.2% of those under age 18 and 5.2% of those age 65 or over.
Common Questions
What is Per Capita Income in St Helena?
Per Capita income in St Helena is $105,719.
What is the Median Family Income in St Helena?
Median Family Income in St Helena is $161,833.
What is the Median Household income in St Helena?
Median Household Income in St Helena is $135,781.
What is Income or Wage Gap in St Helena?
Income or Wage Gap in St Helena is 39.3%.
Women in St Helena earn 60.7 cents for every dollar earned by a man.
What is Inequality or Gini Index in St Helena?
Inequality or Gini Index in St Helena is 0.54.
What is the Total Population of St Helena?
Total Population of St Helena is 5,426.
What is the Total Male Population of St Helena?
Total Male Population of St Helena is 2,683.
What is the Total Female Population of St Helena?
Total Female Population of St Helena is 2,743.
What is the Ratio of Males per 100 Females in St Helena?
There are 97.81 Males per 100 Females in St Helena.
What is the Ratio of Females per 100 Males in St Helena?
There are 102.24 Females per 100 Males in St Helena.
What is the Median Population Age in St Helena?
Median Population Age in St Helena is 48.4 Years.
What is the Average Family Size in St Helena
Average Family Size in St Helena is 2.6 People.
What is the Average Household Size in St Helena
Average Household Size in St Helena is 2.2 People.
How Large is the Labor Force in St Helena?
There are 2,653 People in the Labor Forcein in St Helena.
What is the Percentage of People in the Labor Force in St Helena?
56.6% of People are in the Labor Force in St Helena.
What is the Unemployment Rate in St Helena?
Unemployment Rate in St Helena is 3.2%.