Layton, UT Map & Demographics
Layton Map
Layton Overview
$38,275
PER CAPITA INCOME
$106,600
AVG FAMILY INCOME
$93,453
AVG HOUSEHOLD INCOME
46.3%
WAGE / INCOME GAP [ % ]
53.7¢/ $1
WAGE / INCOME GAP [ $ ]
0.39
INEQUALITY / GINI INDEX
81,726
TOTAL POPULATION
41,536
MALE POPULATION
40,190
FEMALE POPULATION
103.35
MALES / 100 FEMALES
96.76
FEMALES / 100 MALES
31.9
MEDIAN AGE
3.5
AVG FAMILY SIZE
3.0
AVG HOUSEHOLD SIZE
44,237
LABOR FORCE [ PEOPLE ]
73.0%
PERCENT IN LABOR FORCE
2.3%
UNEMPLOYMENT RATE
Layton Area Codes
Income in Layton
Income Overview in Layton
Per Capita Income in Layton is $38,275, while median incomes of families and households are $106,600 and $93,453 respectively.
| Characteristic | Number | Measure |
| Per Capita Income | 81,726 | $38,275 |
| Median Family Income | 20,459 | $106,600 |
| Mean Family Income | 20,459 | $126,413 |
| Median Household Income | 26,754 | $93,453 |
| Mean Household Income | 26,754 | $114,136 |
| Income Deficit | 20,459 | $0 |
| Wage / Income Gap (%) | 81,726 | 46.28% |
| Wage / Income Gap ($) | 81,726 | 53.72¢ per $1 |
| Gini / Inequality Index | 81,726 | 0.39 |
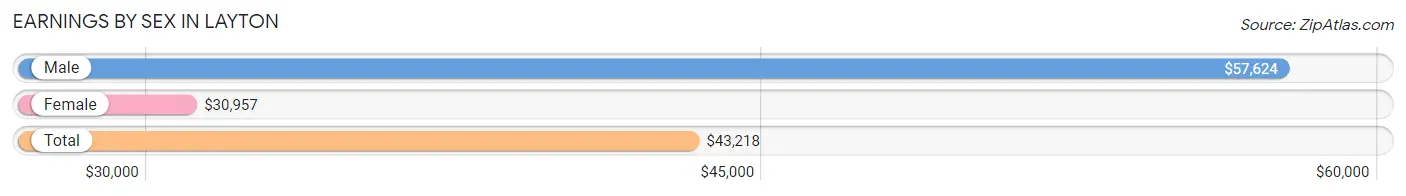
Earnings by Sex in Layton
Average Earnings in Layton are $43,218, $57,624 for men and $30,957 for women, a difference of 46.3%.
| Sex | Number | Average Earnings |
| Male | 25,486 (55.0%) | $57,624 |
| Female | 20,814 (45.0%) | $30,957 |
| Total | 46,300 (100.0%) | $43,218 |
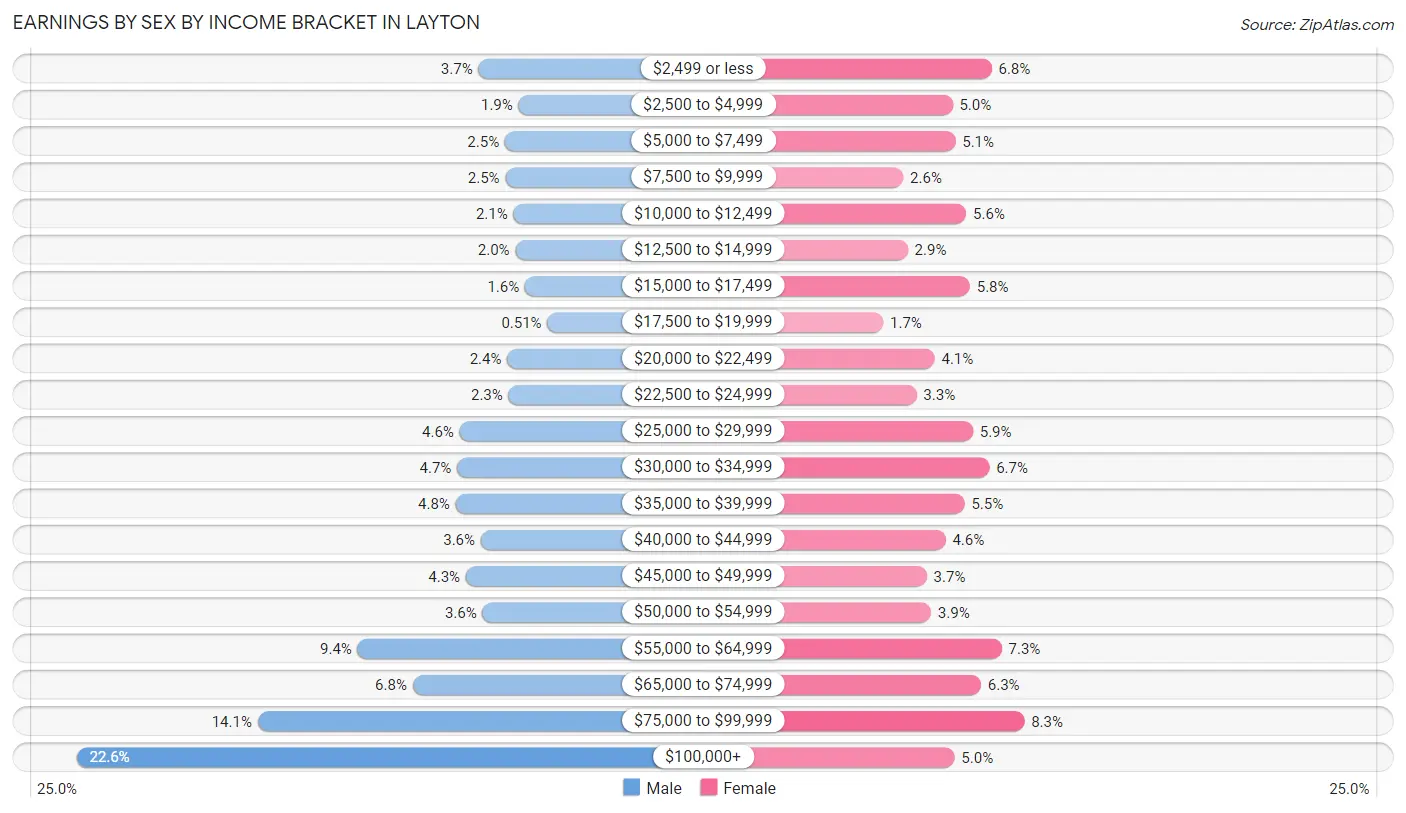
Earnings by Sex by Income Bracket in Layton
The most common earnings brackets in Layton are $100,000+ for men (5,751 | 22.6%) and $75,000 to $99,999 for women (1,729 | 8.3%).
| Income | Male | Female |
| $2,499 or less | 952 (3.7%) | 1,412 (6.8%) |
| $2,500 to $4,999 | 475 (1.9%) | 1,031 (5.0%) |
| $5,000 to $7,499 | 637 (2.5%) | 1,058 (5.1%) |
| $7,500 to $9,999 | 631 (2.5%) | 550 (2.6%) |
| $10,000 to $12,499 | 534 (2.1%) | 1,163 (5.6%) |
| $12,500 to $14,999 | 511 (2.0%) | 593 (2.9%) |
| $15,000 to $17,499 | 398 (1.6%) | 1,198 (5.8%) |
| $17,500 to $19,999 | 129 (0.5%) | 353 (1.7%) |
| $20,000 to $22,499 | 608 (2.4%) | 856 (4.1%) |
| $22,500 to $24,999 | 594 (2.3%) | 678 (3.3%) |
| $25,000 to $29,999 | 1,177 (4.6%) | 1,229 (5.9%) |
| $30,000 to $34,999 | 1,208 (4.7%) | 1,388 (6.7%) |
| $35,000 to $39,999 | 1,226 (4.8%) | 1,147 (5.5%) |
| $40,000 to $44,999 | 926 (3.6%) | 962 (4.6%) |
| $45,000 to $49,999 | 1,103 (4.3%) | 779 (3.7%) |
| $50,000 to $54,999 | 905 (3.5%) | 821 (3.9%) |
| $55,000 to $64,999 | 2,395 (9.4%) | 1,509 (7.2%) |
| $65,000 to $74,999 | 1,737 (6.8%) | 1,308 (6.3%) |
| $75,000 to $99,999 | 3,589 (14.1%) | 1,729 (8.3%) |
| $100,000+ | 5,751 (22.6%) | 1,050 (5.0%) |
| Total | 25,486 (100.0%) | 20,814 (100.0%) |
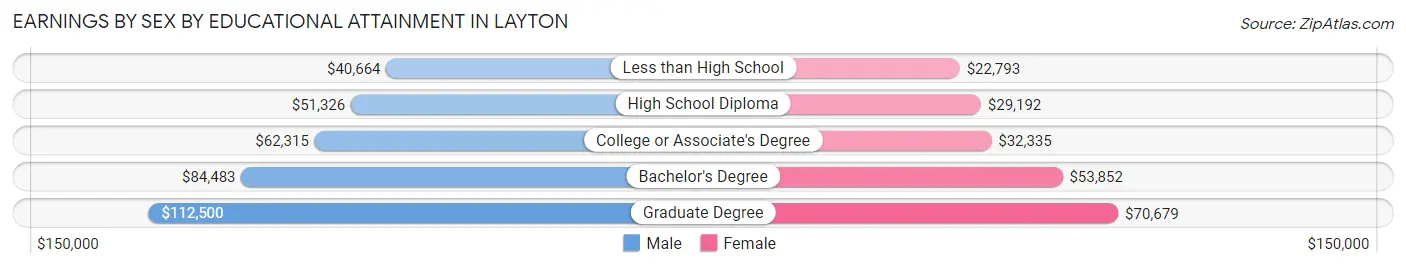
Earnings by Sex by Educational Attainment in Layton
Average earnings in Layton are $68,147 for men and $37,195 for women, a difference of 45.4%. Men with an educational attainment of graduate degree enjoy the highest average annual earnings of $112,500, while those with less than high school education earn the least with $40,664. Women with an educational attainment of graduate degree earn the most with the average annual earnings of $70,679, while those with less than high school education have the smallest earnings of $22,793.
| Educational Attainment | Male Income | Female Income |
| Less than High School | $40,664 | $22,793 |
| High School Diploma | $51,326 | $29,192 |
| College or Associate's Degree | $62,315 | $32,335 |
| Bachelor's Degree | $84,483 | $53,852 |
| Graduate Degree | $112,500 | $70,679 |
| Total | $68,147 | $37,195 |
Family Income in Layton
Family Income Brackets in Layton
According to the Layton family income data, there are 5,340 families falling into the $100,000 to $149,999 income range, which is the most common income bracket and makes up 26.1% of all families. Conversely, the $10,000 to $14,999 income bracket is the least frequent group with only 368 families (1.8%) belonging to this category.
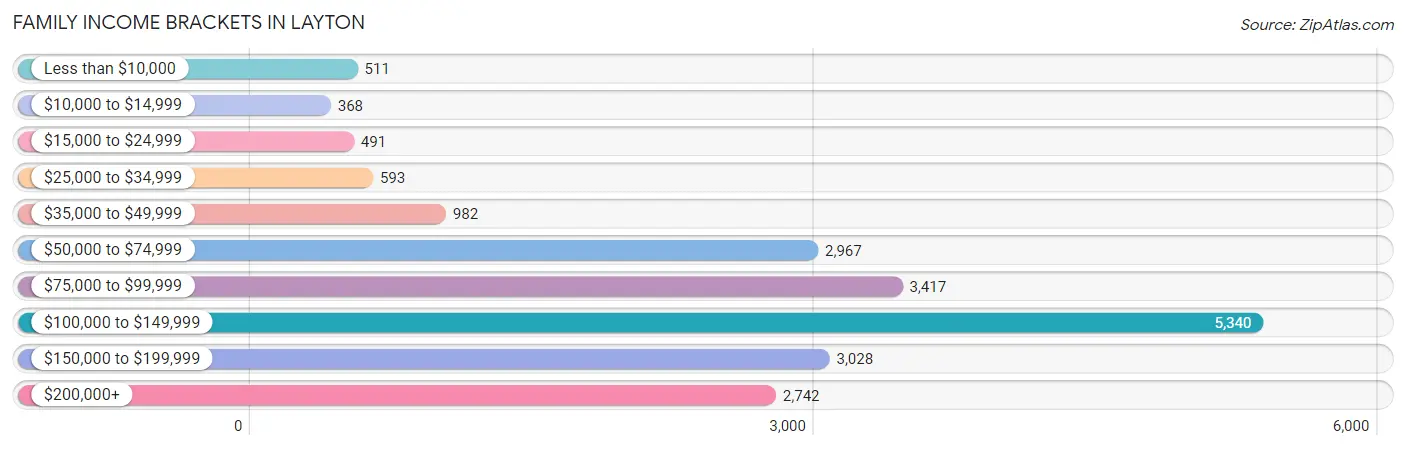
| Income Bracket | # Families | % Families |
| Less than $10,000 | 511 | 2.5% |
| $10,000 to $14,999 | 368 | 1.8% |
| $15,000 to $24,999 | 491 | 2.4% |
| $25,000 to $34,999 | 593 | 2.9% |
| $35,000 to $49,999 | 982 | 4.8% |
| $50,000 to $74,999 | 2,967 | 14.5% |
| $75,000 to $99,999 | 3,417 | 16.7% |
| $100,000 to $149,999 | 5,340 | 26.1% |
| $150,000 to $199,999 | 3,028 | 14.8% |
| $200,000+ | 2,742 | 13.4% |
Family Income by Famaliy Size in Layton
7+ person families (888 | 4.3%) account for the highest median family income in Layton with $134,363 per family, while 2-person families (7,479 | 36.6%) have the highest median income of $43,210 per family member.
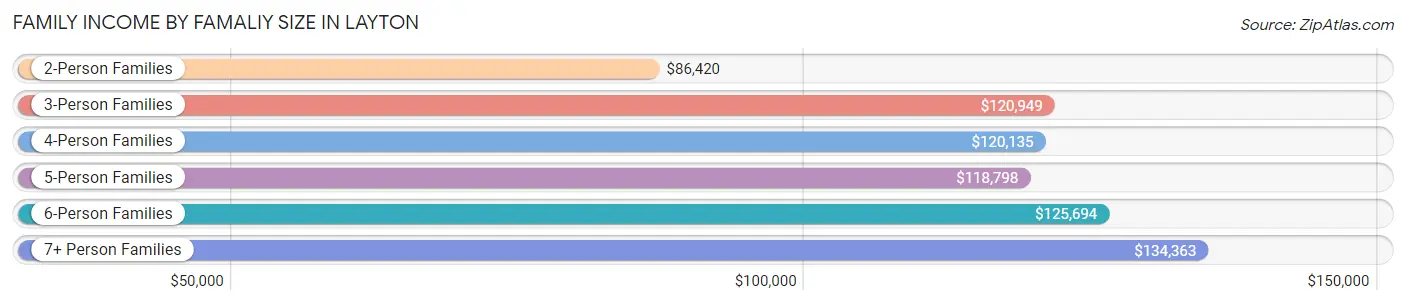
| Income Bracket | # Families | Median Income |
| 2-Person Families | 7,479 (36.6%) | $86,420 |
| 3-Person Families | 4,165 (20.4%) | $120,949 |
| 4-Person Families | 4,370 (21.4%) | $120,135 |
| 5-Person Families | 2,440 (11.9%) | $118,798 |
| 6-Person Families | 1,117 (5.5%) | $125,694 |
| 7+ Person Families | 888 (4.3%) | $134,363 |
| Total | 20,459 (100.0%) | $106,600 |
Family Income by Number of Earners in Layton
The median family income in Layton is $106,600, with families comprising 3+ earners (4,171) having the highest median family income of $146,406, while families with no earners (1,820) have the lowest median family income of $54,618, accounting for 20.4% and 8.9% of families, respectively.
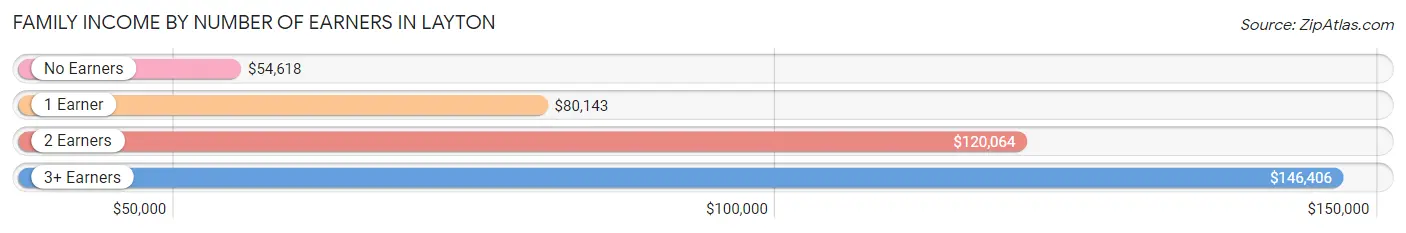
| Number of Earners | # Families | Median Income |
| No Earners | 1,820 (8.9%) | $54,618 |
| 1 Earner | 5,630 (27.5%) | $80,143 |
| 2 Earners | 8,838 (43.2%) | $120,064 |
| 3+ Earners | 4,171 (20.4%) | $146,406 |
| Total | 20,459 (100.0%) | $106,600 |
Household Income in Layton
Household Income Brackets in Layton
With 5,939 households falling in the category, the $100,000 to $149,999 income range is the most frequent in Layton, accounting for 22.2% of all households. In contrast, only 482 households (1.8%) fall into the $10,000 to $14,999 income bracket, making it the least populous group.
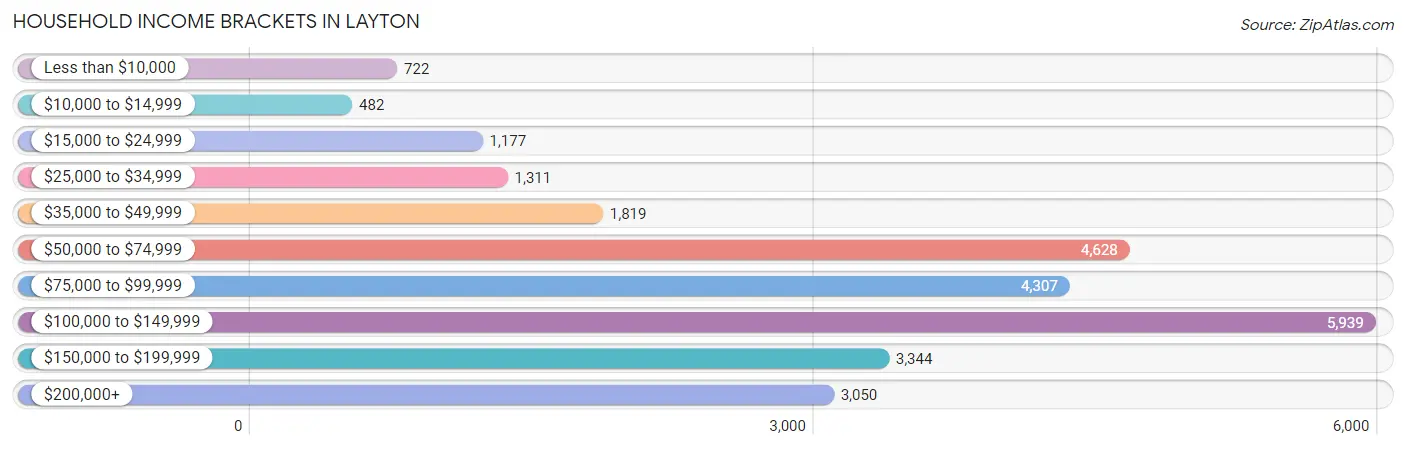
| Income Bracket | # Households | % Households |
| Less than $10,000 | 722 | 2.7% |
| $10,000 to $14,999 | 482 | 1.8% |
| $15,000 to $24,999 | 1,177 | 4.4% |
| $25,000 to $34,999 | 1,311 | 4.9% |
| $35,000 to $49,999 | 1,819 | 6.8% |
| $50,000 to $74,999 | 4,628 | 17.3% |
| $75,000 to $99,999 | 4,307 | 16.1% |
| $100,000 to $149,999 | 5,939 | 22.2% |
| $150,000 to $199,999 | 3,344 | 12.5% |
| $200,000+ | 3,050 | 11.4% |
Household Income by Householder Age in Layton
The median household income in Layton is $93,453, with the highest median household income of $117,945 found in the 45 to 64 years age bracket for the primary householder. A total of 9,268 households (34.6%) fall into this category. Meanwhile, the 15 to 24 years age bracket for the primary householder has the lowest median household income of $58,750, with 1,176 households (4.4%) in this group.
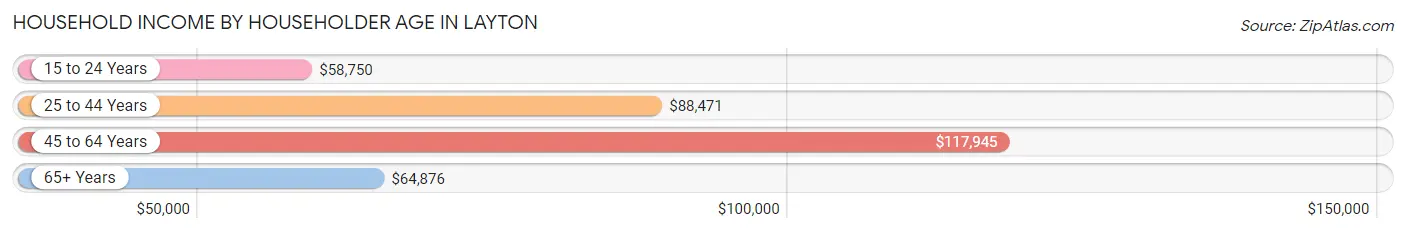
| Income Bracket | # Households | Median Income |
| 15 to 24 Years | 1,176 (4.4%) | $58,750 |
| 25 to 44 Years | 11,481 (42.9%) | $88,471 |
| 45 to 64 Years | 9,268 (34.6%) | $117,945 |
| 65+ Years | 4,829 (18.0%) | $64,876 |
| Total | 26,754 (100.0%) | $93,453 |
Poverty in Layton
Income Below Poverty by Sex and Age in Layton
With 6.5% poverty level for males and 8.6% for females among the residents of Layton, 5 year old males and 5 year old females are the most vulnerable to poverty, with 143 males (17.2%) and 88 females (15.4%) in their respective age groups living below the poverty level.
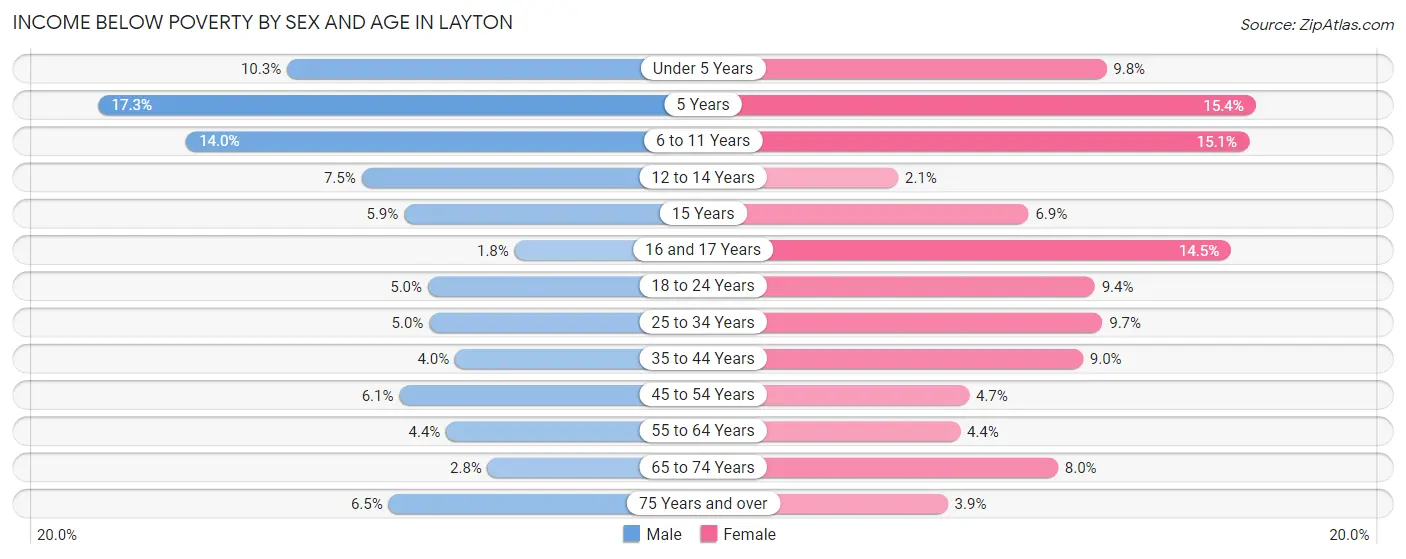
| Age Bracket | Male | Female |
| Under 5 Years | 293 (10.3%) | 246 (9.8%) |
| 5 Years | 143 (17.2%) | 88 (15.4%) |
| 6 to 11 Years | 654 (14.0%) | 660 (15.1%) |
| 12 to 14 Years | 152 (7.5%) | 38 (2.1%) |
| 15 Years | 40 (5.9%) | 50 (6.9%) |
| 16 and 17 Years | 25 (1.8%) | 220 (14.4%) |
| 18 to 24 Years | 208 (5.0%) | 348 (9.4%) |
| 25 to 34 Years | 312 (5.0%) | 604 (9.7%) |
| 35 to 44 Years | 259 (4.0%) | 536 (8.9%) |
| 45 to 54 Years | 294 (6.1%) | 232 (4.7%) |
| 55 to 64 Years | 159 (4.3%) | 151 (4.4%) |
| 65 to 74 Years | 69 (2.8%) | 208 (8.0%) |
| 75 Years and over | 78 (6.5%) | 65 (3.9%) |
| Total | 2,686 (6.5%) | 3,446 (8.6%) |
Income Above Poverty by Sex and Age in Layton
According to the poverty statistics in Layton, males aged 16 and 17 years and females aged 12 to 14 years are the age groups that are most secure financially, with 98.2% of males and 97.9% of females in these age groups living above the poverty line.
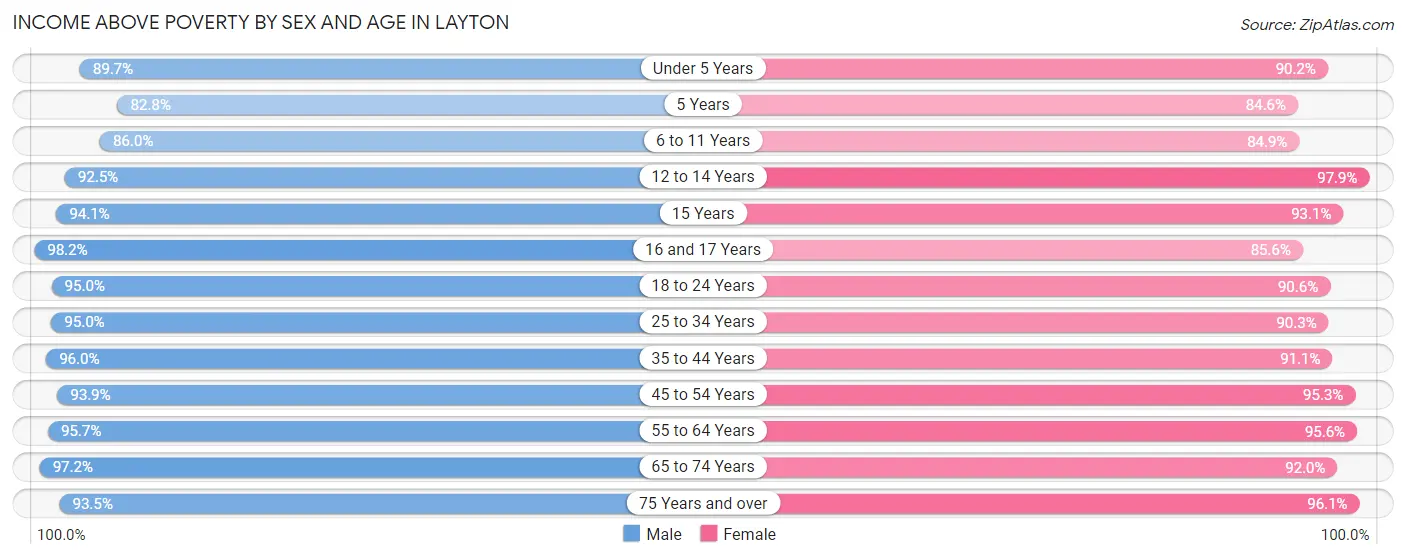
| Age Bracket | Male | Female |
| Under 5 Years | 2,564 (89.7%) | 2,259 (90.2%) |
| 5 Years | 686 (82.8%) | 485 (84.6%) |
| 6 to 11 Years | 4,018 (86.0%) | 3,707 (84.9%) |
| 12 to 14 Years | 1,878 (92.5%) | 1,781 (97.9%) |
| 15 Years | 637 (94.1%) | 672 (93.1%) |
| 16 and 17 Years | 1,359 (98.2%) | 1,303 (85.6%) |
| 18 to 24 Years | 3,926 (95.0%) | 3,359 (90.6%) |
| 25 to 34 Years | 5,957 (95.0%) | 5,644 (90.3%) |
| 35 to 44 Years | 6,178 (96.0%) | 5,456 (91.0%) |
| 45 to 54 Years | 4,531 (93.9%) | 4,683 (95.3%) |
| 55 to 64 Years | 3,496 (95.7%) | 3,286 (95.6%) |
| 65 to 74 Years | 2,389 (97.2%) | 2,387 (92.0%) |
| 75 Years and over | 1,123 (93.5%) | 1,591 (96.1%) |
| Total | 38,742 (93.5%) | 36,613 (91.4%) |
Income Below Poverty Among Married-Couple Families in Layton
The poverty statistics for married-couple families in Layton show that 3.0% or 497 of the total 16,384 families live below the poverty line. Families with 3 or 4 children have the highest poverty rate of 7.8%, comprising of 200 families. On the other hand, families with 5 or more children have the lowest poverty rate of 1.4%, which includes 7 families.
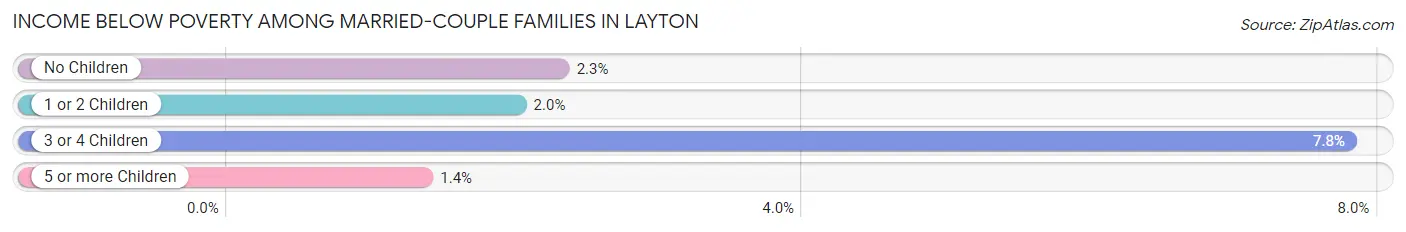
| Children | Above Poverty | Below Poverty |
| No Children | 7,538 (97.7%) | 178 (2.3%) |
| 1 or 2 Children | 5,472 (98.0%) | 112 (2.0%) |
| 3 or 4 Children | 2,368 (92.2%) | 200 (7.8%) |
| 5 or more Children | 509 (98.6%) | 7 (1.4%) |
| Total | 15,887 (97.0%) | 497 (3.0%) |
Income Below Poverty Among Single-Parent Households in Layton
According to the poverty data in Layton, 1.0% or 14 single-father households and 29.3% or 792 single-mother households are living below the poverty line. Among single-father households, those with no children have the highest poverty rate, with 14 households (1.6%) experiencing poverty. Likewise, among single-mother households, those with 3 or 4 children have the highest poverty rate, with 313 households (85.8%) falling below the poverty line.
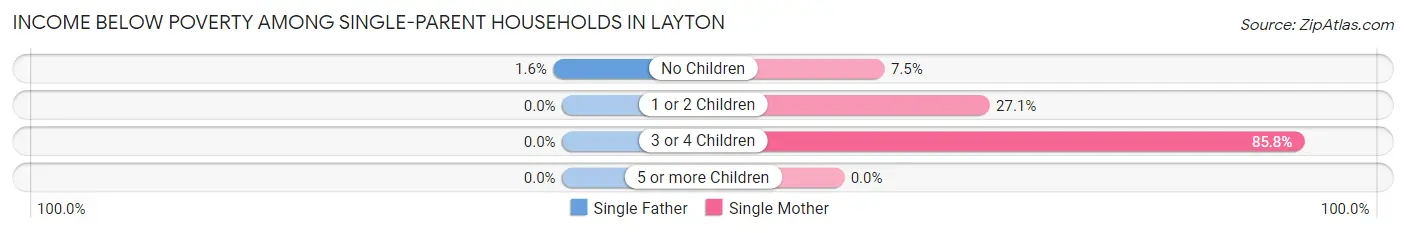
| Children | Single Father | Single Mother |
| No Children | 14 (1.6%) | 57 (7.5%) |
| 1 or 2 Children | 0 (0.0%) | 422 (27.1%) |
| 3 or 4 Children | 0 (0.0%) | 313 (85.8%) |
| 5 or more Children | 0 (0.0%) | 0 (0.0%) |
| Total | 14 (1.0%) | 792 (29.3%) |
Income Below Poverty Among Married-Couple vs Single-Parent Households in Layton
The poverty data for Layton shows that 497 of the married-couple family households (3.0%) and 806 of the single-parent households (19.8%) are living below the poverty level. Within the married-couple family households, those with 3 or 4 children have the highest poverty rate, with 200 households (7.8%) falling below the poverty line. Among the single-parent households, those with 3 or 4 children have the highest poverty rate, with 313 household (82.8%) living below poverty.
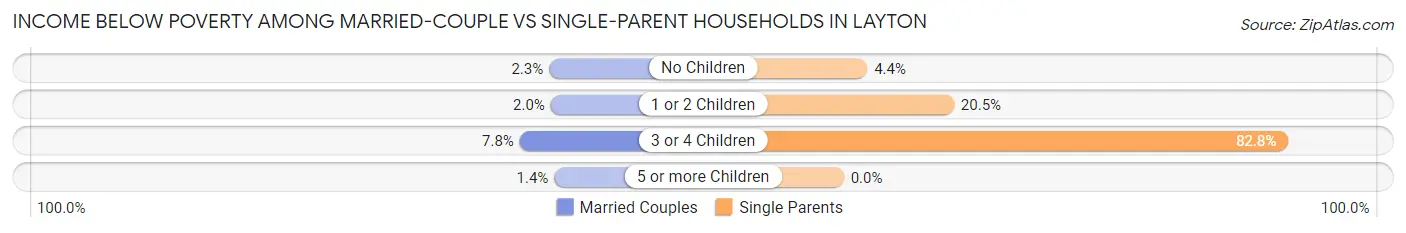
| Children | Married-Couple Families | Single-Parent Households |
| No Children | 178 (2.3%) | 71 (4.4%) |
| 1 or 2 Children | 112 (2.0%) | 422 (20.5%) |
| 3 or 4 Children | 200 (7.8%) | 313 (82.8%) |
| 5 or more Children | 7 (1.4%) | 0 (0.0%) |
| Total | 497 (3.0%) | 806 (19.8%) |
Race in Layton
The most populous races in Layton are White / Caucasian (69,924 | 85.6%), Hispanic or Latino (11,478 | 14.0%), and Two or more Races (6,176 | 7.6%).
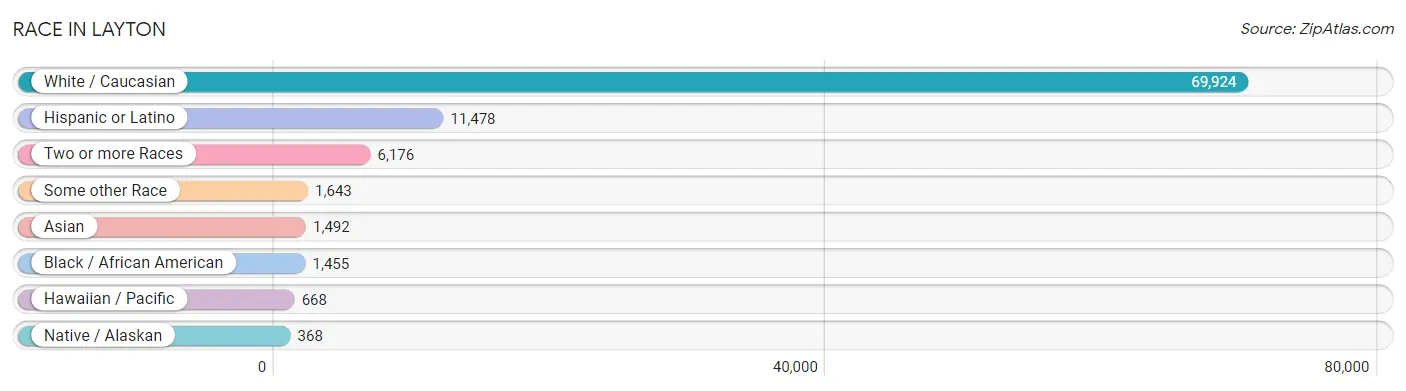
| Race | # Population | % Population |
| Asian | 1,492 | 1.8% |
| Black / African American | 1,455 | 1.8% |
| Hawaiian / Pacific | 668 | 0.8% |
| Hispanic or Latino | 11,478 | 14.0% |
| Native / Alaskan | 368 | 0.4% |
| White / Caucasian | 69,924 | 85.6% |
| Two or more Races | 6,176 | 7.6% |
| Some other Race | 1,643 | 2.0% |
| Total | 81,726 | 100.0% |
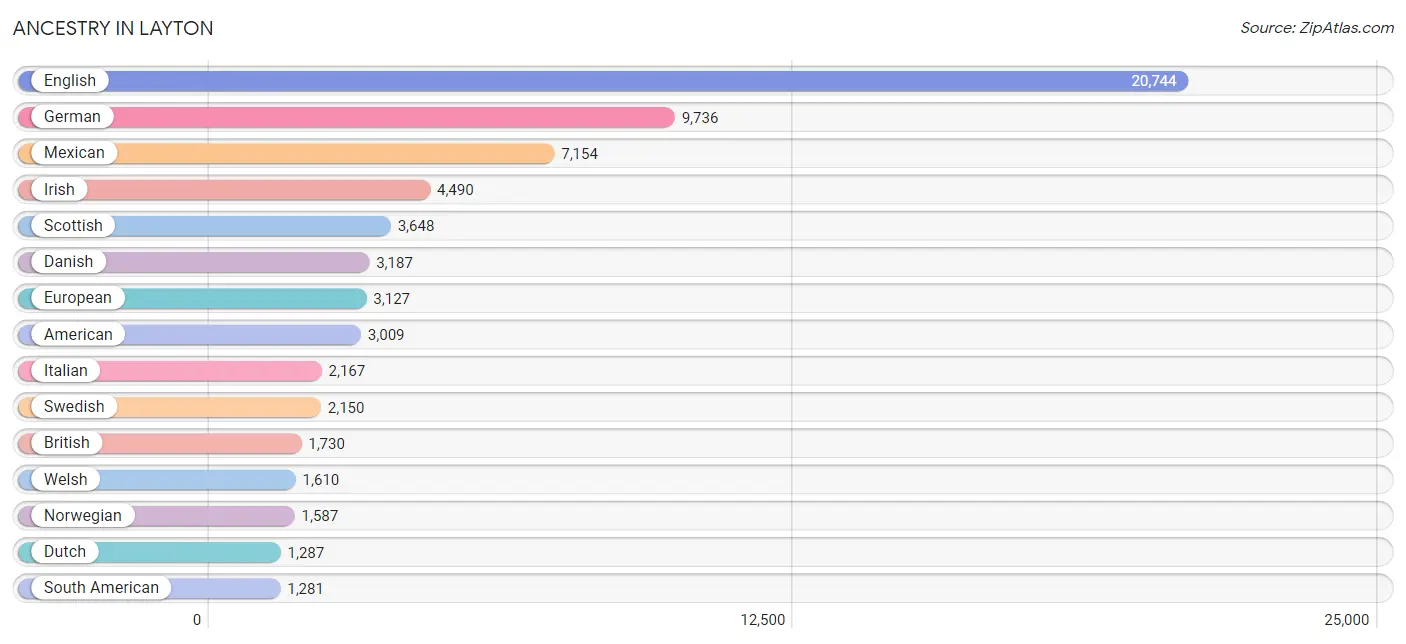
Ancestry in Layton
The most populous ancestries reported in Layton are English (20,744 | 25.4%), German (9,736 | 11.9%), Mexican (7,154 | 8.7%), Irish (4,490 | 5.5%), and Scottish (3,648 | 4.5%), together accounting for 56.0% of all Layton residents.
| Ancestry | # Population | % Population |
| African | 201 | 0.3% |
| Albanian | 18 | 0.0% |
| American | 3,009 | 3.7% |
| Apache | 59 | 0.1% |
| Argentinean | 262 | 0.3% |
| Australian | 124 | 0.2% |
| Austrian | 65 | 0.1% |
| Bangladeshi | 24 | 0.0% |
| Basque | 23 | 0.0% |
| Bermudan | 12 | 0.0% |
| Bhutanese | 755 | 0.9% |
| Blackfeet | 7 | 0.0% |
| Bolivian | 43 | 0.1% |
| Brazilian | 63 | 0.1% |
| British | 1,730 | 2.1% |
| Bulgarian | 12 | 0.0% |
| Burmese | 282 | 0.4% |
| Canadian | 152 | 0.2% |
| Celtic | 25 | 0.0% |
| Central American | 740 | 0.9% |
| Central American Indian | 107 | 0.1% |
| Cherokee | 145 | 0.2% |
| Chilean | 463 | 0.6% |
| Chinese | 45 | 0.1% |
| Choctaw | 7 | 0.0% |
| Colombian | 28 | 0.0% |
| Costa Rican | 12 | 0.0% |
| Creek | 9 | 0.0% |
| Croatian | 20 | 0.0% |
| Cuban | 46 | 0.1% |
| Czech | 87 | 0.1% |
| Czechoslovakian | 4 | 0.0% |
| Danish | 3,187 | 3.9% |
| Dominican | 33 | 0.0% |
| Dutch | 1,287 | 1.6% |
| Eastern European | 21 | 0.0% |
| Ecuadorian | 74 | 0.1% |
| English | 20,744 | 25.4% |
| Ethiopian | 39 | 0.1% |
| European | 3,127 | 3.8% |
| Fijian | 47 | 0.1% |
| Filipino | 24 | 0.0% |
| Finnish | 49 | 0.1% |
| French | 1,188 | 1.5% |
| French Canadian | 260 | 0.3% |
| German | 9,736 | 11.9% |
| Greek | 100 | 0.1% |
| Guamanian / Chamorro | 55 | 0.1% |
| Guatemalan | 133 | 0.2% |
| Haitian | 38 | 0.1% |
| Honduran | 56 | 0.1% |
| Hopi | 35 | 0.0% |
| Hungarian | 113 | 0.1% |
| Icelander | 169 | 0.2% |
| Indian (Asian) | 239 | 0.3% |
| Iranian | 11 | 0.0% |
| Irish | 4,490 | 5.5% |
| Italian | 2,167 | 2.6% |
| Korean | 912 | 1.1% |
| Mexican | 7,154 | 8.7% |
| Mexican American Indian | 13 | 0.0% |
| Mongolian | 13 | 0.0% |
| Native Hawaiian | 200 | 0.2% |
| Navajo | 240 | 0.3% |
| Nicaraguan | 202 | 0.3% |
| Nigerian | 4 | 0.0% |
| Northern European | 209 | 0.3% |
| Norwegian | 1,587 | 1.9% |
| Pakistani | 428 | 0.5% |
| Panamanian | 28 | 0.0% |
| Peruvian | 350 | 0.4% |
| Polish | 573 | 0.7% |
| Portuguese | 123 | 0.2% |
| Pueblo | 20 | 0.0% |
| Puerto Rican | 270 | 0.3% |
| Russian | 181 | 0.2% |
| Salvadoran | 309 | 0.4% |
| Samoan | 389 | 0.5% |
| Scandinavian | 1,218 | 1.5% |
| Scotch-Irish | 734 | 0.9% |
| Scottish | 3,648 | 4.5% |
| Sioux | 10 | 0.0% |
| Slovene | 63 | 0.1% |
| South African | 248 | 0.3% |
| South American | 1,281 | 1.6% |
| South American Indian | 31 | 0.0% |
| Spaniard | 864 | 1.1% |
| Spanish | 466 | 0.6% |
| Sri Lankan | 173 | 0.2% |
| Subsaharan African | 510 | 0.6% |
| Swedish | 2,150 | 2.6% |
| Swiss | 746 | 0.9% |
| Thai | 94 | 0.1% |
| Tongan | 92 | 0.1% |
| Turkish | 16 | 0.0% |
| Ukrainian | 27 | 0.0% |
| Uruguayan | 11 | 0.0% |
| Venezuelan | 50 | 0.1% |
| Welsh | 1,610 | 2.0% |
| Yugoslavian | 23 | 0.0% | View All 100 Rows |
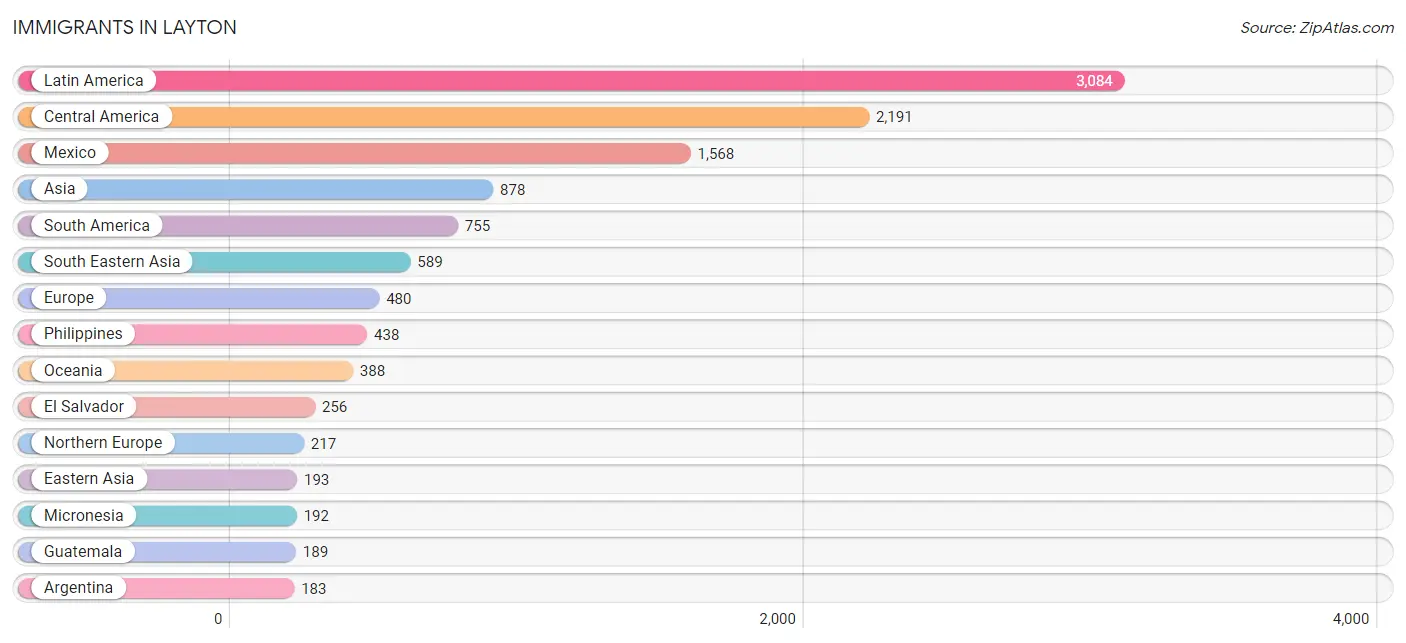
Immigrants in Layton
The most numerous immigrant groups reported in Layton came from Latin America (3,084 | 3.8%), Central America (2,191 | 2.7%), Mexico (1,568 | 1.9%), Asia (878 | 1.1%), and South America (755 | 0.9%), together accounting for 10.4% of all Layton residents.
| Immigration Origin | # Population | % Population |
| Africa | 127 | 0.2% |
| Argentina | 183 | 0.2% |
| Asia | 878 | 1.1% |
| Australia | 78 | 0.1% |
| Austria | 7 | 0.0% |
| Bolivia | 26 | 0.0% |
| Brazil | 113 | 0.1% |
| Bulgaria | 6 | 0.0% |
| Canada | 90 | 0.1% |
| Caribbean | 138 | 0.2% |
| Central America | 2,191 | 2.7% |
| Chile | 122 | 0.2% |
| China | 36 | 0.0% |
| Colombia | 19 | 0.0% |
| Cuba | 46 | 0.1% |
| Denmark | 18 | 0.0% |
| Dominican Republic | 48 | 0.1% |
| Eastern Africa | 30 | 0.0% |
| Eastern Asia | 193 | 0.2% |
| Eastern Europe | 39 | 0.1% |
| Ecuador | 37 | 0.1% |
| El Salvador | 256 | 0.3% |
| England | 105 | 0.1% |
| Ethiopia | 30 | 0.0% |
| Europe | 480 | 0.6% |
| France | 23 | 0.0% |
| Germany | 92 | 0.1% |
| Greece | 8 | 0.0% |
| Guatemala | 189 | 0.2% |
| Haiti | 38 | 0.1% |
| Honduras | 46 | 0.1% |
| India | 80 | 0.1% |
| Italy | 7 | 0.0% |
| Jamaica | 6 | 0.0% |
| Japan | 71 | 0.1% |
| Korea | 86 | 0.1% |
| Latin America | 3,084 | 3.8% |
| Mexico | 1,568 | 1.9% |
| Micronesia | 192 | 0.2% |
| Nicaragua | 104 | 0.1% |
| Northern Europe | 217 | 0.3% |
| Norway | 22 | 0.0% |
| Oceania | 388 | 0.5% |
| Panama | 28 | 0.0% |
| Peru | 177 | 0.2% |
| Philippines | 438 | 0.5% |
| Scotland | 37 | 0.1% |
| South Africa | 97 | 0.1% |
| South America | 755 | 0.9% |
| South Central Asia | 80 | 0.1% |
| South Eastern Asia | 589 | 0.7% |
| Southern Europe | 79 | 0.1% |
| Spain | 64 | 0.1% |
| Sweden | 9 | 0.0% |
| Switzerland | 23 | 0.0% |
| Thailand | 80 | 0.1% |
| Turkey | 16 | 0.0% |
| Ukraine | 17 | 0.0% |
| Venezuela | 78 | 0.1% |
| Vietnam | 71 | 0.1% |
| Western Asia | 16 | 0.0% |
| Western Europe | 145 | 0.2% | View All 62 Rows |
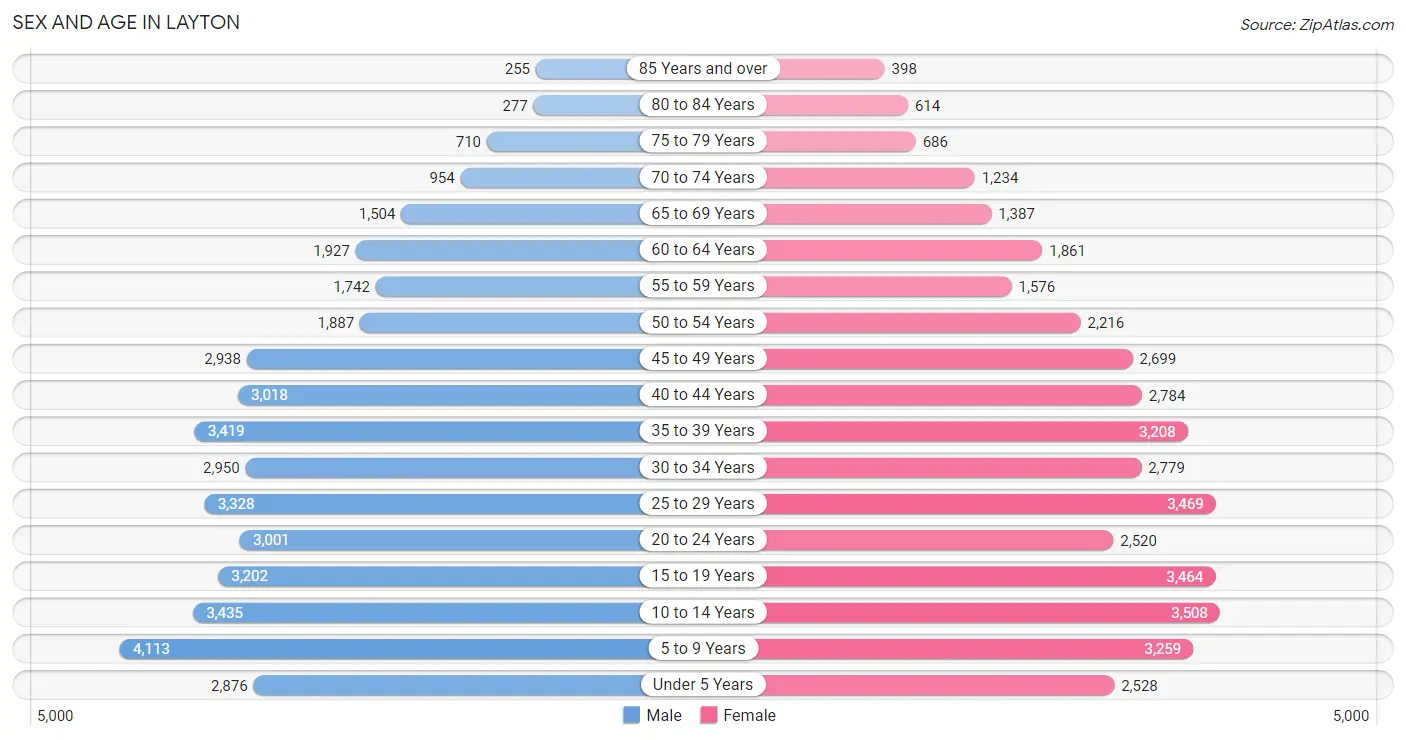
Sex and Age in Layton
Sex and Age in Layton
The most populous age groups in Layton are 5 to 9 Years (4,113 | 9.9%) for men and 10 to 14 Years (3,508 | 8.7%) for women.
| Age Bracket | Male | Female |
| Under 5 Years | 2,876 (6.9%) | 2,528 (6.3%) |
| 5 to 9 Years | 4,113 (9.9%) | 3,259 (8.1%) |
| 10 to 14 Years | 3,435 (8.3%) | 3,508 (8.7%) |
| 15 to 19 Years | 3,202 (7.7%) | 3,464 (8.6%) |
| 20 to 24 Years | 3,001 (7.2%) | 2,520 (6.3%) |
| 25 to 29 Years | 3,328 (8.0%) | 3,469 (8.6%) |
| 30 to 34 Years | 2,950 (7.1%) | 2,779 (6.9%) |
| 35 to 39 Years | 3,419 (8.2%) | 3,208 (8.0%) |
| 40 to 44 Years | 3,018 (7.3%) | 2,784 (6.9%) |
| 45 to 49 Years | 2,938 (7.1%) | 2,699 (6.7%) |
| 50 to 54 Years | 1,887 (4.5%) | 2,216 (5.5%) |
| 55 to 59 Years | 1,742 (4.2%) | 1,576 (3.9%) |
| 60 to 64 Years | 1,927 (4.6%) | 1,861 (4.6%) |
| 65 to 69 Years | 1,504 (3.6%) | 1,387 (3.5%) |
| 70 to 74 Years | 954 (2.3%) | 1,234 (3.1%) |
| 75 to 79 Years | 710 (1.7%) | 686 (1.7%) |
| 80 to 84 Years | 277 (0.7%) | 614 (1.5%) |
| 85 Years and over | 255 (0.6%) | 398 (1.0%) |
| Total | 41,536 (100.0%) | 40,190 (100.0%) |
Families and Households in Layton
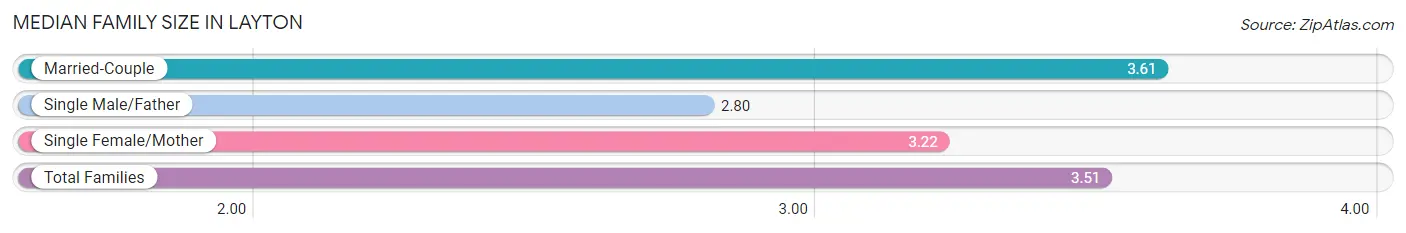
Median Family Size in Layton
The median family size in Layton is 3.51 persons per family, with married-couple families (16,384 | 80.1%) accounting for the largest median family size of 3.61 persons per family. On the other hand, single male/father families (1,371 | 6.7%) represent the smallest median family size with 2.80 persons per family.
| Family Type | # Families | Family Size |
| Married-Couple | 16,384 (80.1%) | 3.61 |
| Single Male/Father | 1,371 (6.7%) | 2.80 |
| Single Female/Mother | 2,704 (13.2%) | 3.22 |
| Total Families | 20,459 (100.0%) | 3.51 |
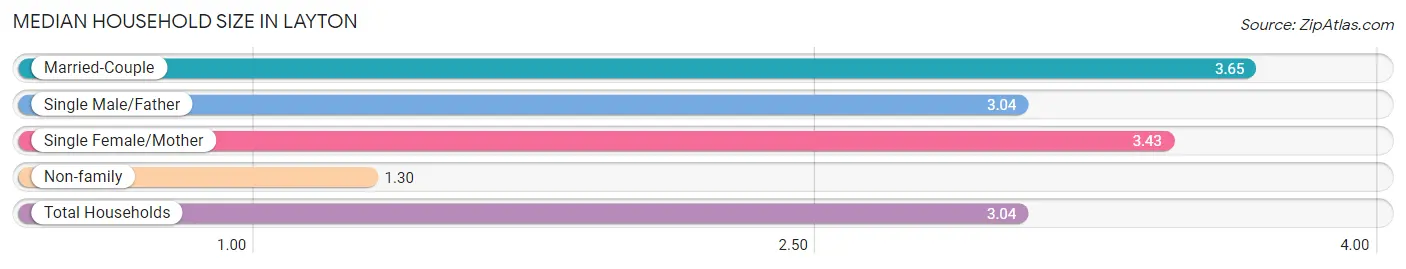
Median Household Size in Layton
The median household size in Layton is 3.04 persons per household, with married-couple households (16,384 | 61.2%) accounting for the largest median household size of 3.65 persons per household. non-family households (6,295 | 23.5%) represent the smallest median household size with 1.30 persons per household.
| Household Type | # Households | Household Size |
| Married-Couple | 16,384 (61.2%) | 3.65 |
| Single Male/Father | 1,371 (5.1%) | 3.04 |
| Single Female/Mother | 2,704 (10.1%) | 3.43 |
| Non-family | 6,295 (23.5%) | 1.30 |
| Total Households | 26,754 (100.0%) | 3.04 |
Household Size by Marriage Status in Layton
Out of a total of 26,754 households in Layton, 20,459 (76.5%) are family households, while 6,295 (23.5%) are nonfamily households. The most numerous type of family households are 2-person households, comprising 6,993, and the most common type of nonfamily households are 1-person households, comprising 5,045.
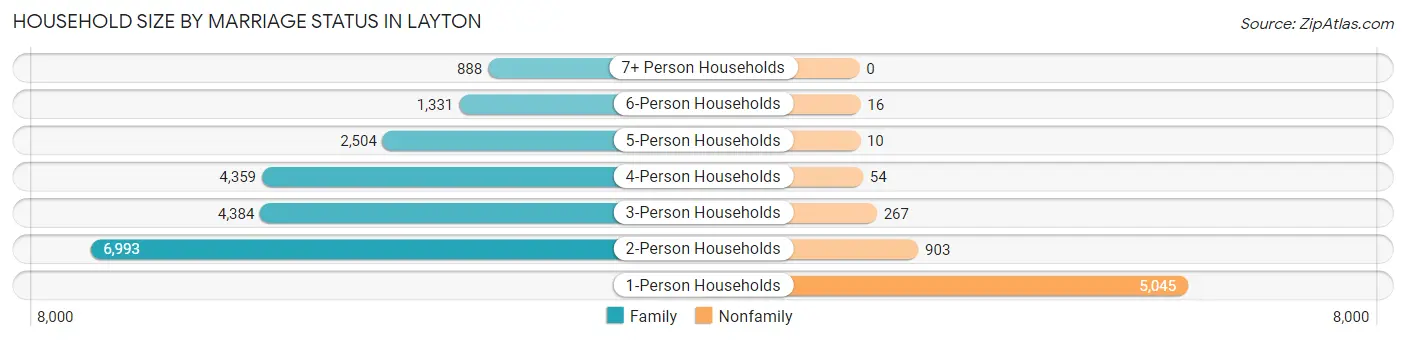
| Household Size | Family Households | Nonfamily Households |
| 1-Person Households | - | 5,045 (18.9%) |
| 2-Person Households | 6,993 (26.1%) | 903 (3.4%) |
| 3-Person Households | 4,384 (16.4%) | 267 (1.0%) |
| 4-Person Households | 4,359 (16.3%) | 54 (0.2%) |
| 5-Person Households | 2,504 (9.4%) | 10 (0.0%) |
| 6-Person Households | 1,331 (5.0%) | 16 (0.1%) |
| 7+ Person Households | 888 (3.3%) | 0 (0.0%) |
| Total | 20,459 (76.5%) | 6,295 (23.5%) |
Female Fertility in Layton
Fertility by Age in Layton
Average fertility rate in Layton is 43.0 births per 1,000 women. Women in the age bracket of 20 to 34 years have the highest fertility rate with 73.0 births per 1,000 women. Women in the age bracket of 20 to 34 years acount for 68.3% of all women with births.
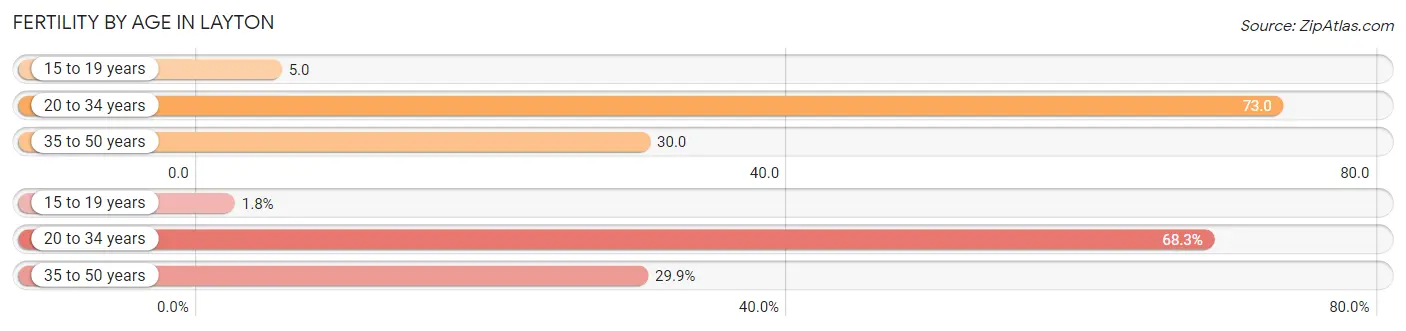
| Age Bracket | Women with Births | Births / 1,000 Women |
| 15 to 19 years | 17 (1.8%) | 5.0 |
| 20 to 34 years | 638 (68.3%) | 73.0 |
| 35 to 50 years | 279 (29.9%) | 30.0 |
| Total | 934 (100.0%) | 43.0 |
Fertility by Age by Marriage Status in Layton
76.3% of women with births (934) in Layton are married. The highest percentage of unmarried women with births falls into 15 to 19 years age bracket with 100.0% of them unmarried at the time of birth, while the lowest percentage of unmarried women with births belong to 35 to 50 years age bracket with 6.8% of them unmarried.
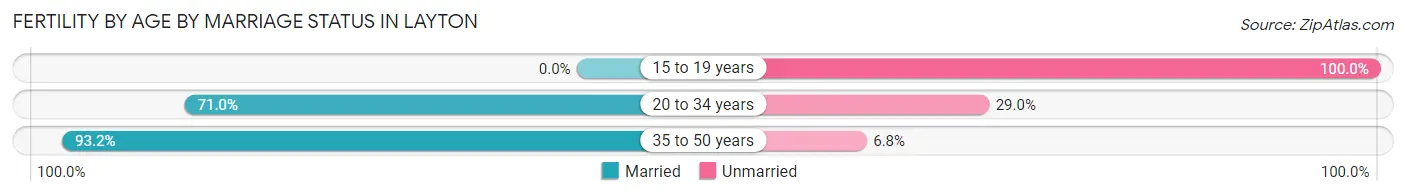
| Age Bracket | Married | Unmarried |
| 15 to 19 years | 0 (0.0%) | 17 (100.0%) |
| 20 to 34 years | 453 (71.0%) | 185 (29.0%) |
| 35 to 50 years | 260 (93.2%) | 19 (6.8%) |
| Total | 713 (76.3%) | 221 (23.7%) |
Fertility by Education in Layton
Average fertility rate in Layton is 43.0 births per 1,000 women. Women with the education attainment of college or associate's degree have the highest fertility rate of 67.0 births per 1,000 women, while women with the education attainment of less than high school have the lowest fertility at 6.0 births per 1,000 women. Women with the education attainment of college or associate's degree represent 46.9% of all women with births.
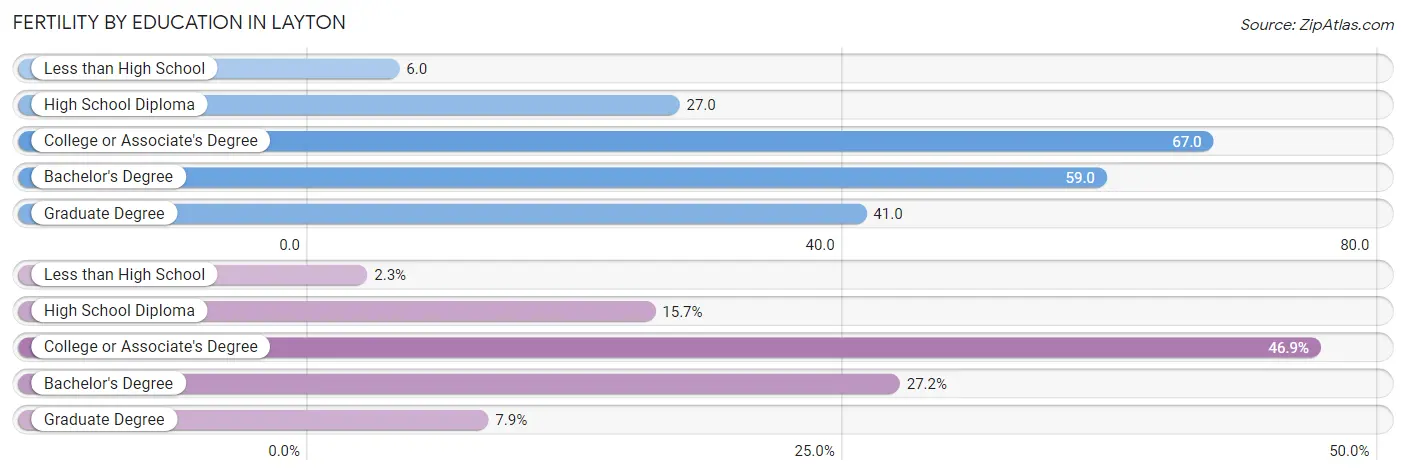
| Educational Attainment | Women with Births | Births / 1,000 Women |
| Less than High School | 21 (2.2%) | 6.0 |
| High School Diploma | 147 (15.7%) | 27.0 |
| College or Associate's Degree | 438 (46.9%) | 67.0 |
| Bachelor's Degree | 254 (27.2%) | 59.0 |
| Graduate Degree | 74 (7.9%) | 41.0 |
| Total | 934 (100.0%) | 43.0 |
Fertility by Education by Marriage Status in Layton
23.7% of women with births in Layton are unmarried. Women with the educational attainment of graduate degree are most likely to be married with 100.0% of them married at childbirth, while women with the educational attainment of less than high school are least likely to be married with 80.9% of them unmarried at childbirth.
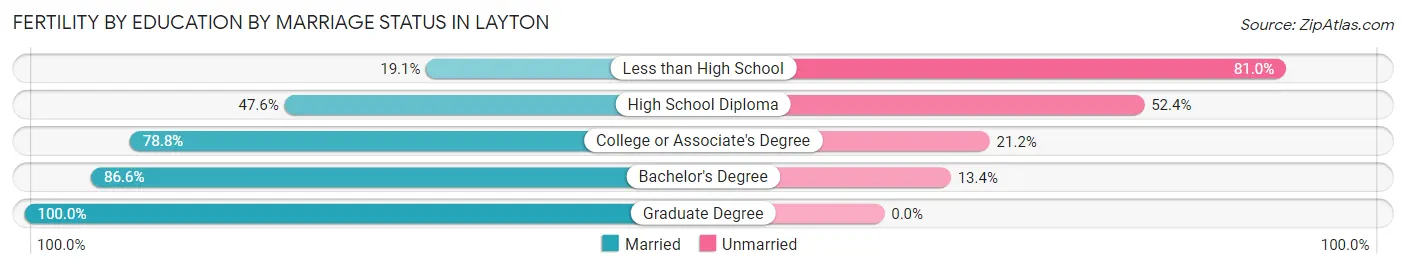
| Educational Attainment | Married | Unmarried |
| Less than High School | 4 (19.1%) | 17 (80.9%) |
| High School Diploma | 70 (47.6%) | 77 (52.4%) |
| College or Associate's Degree | 345 (78.8%) | 93 (21.2%) |
| Bachelor's Degree | 220 (86.6%) | 34 (13.4%) |
| Graduate Degree | 74 (100.0%) | 0 (0.0%) |
| Total | 713 (76.3%) | 221 (23.7%) |
Employment Characteristics in Layton
Employment by Class of Employer in Layton
Among the 42,536 employed individuals in Layton, private company employees (28,563 | 67.1%), federal government employees (3,665 | 8.6%), and local government employees (3,132 | 7.4%) make up the most common classes of employment.
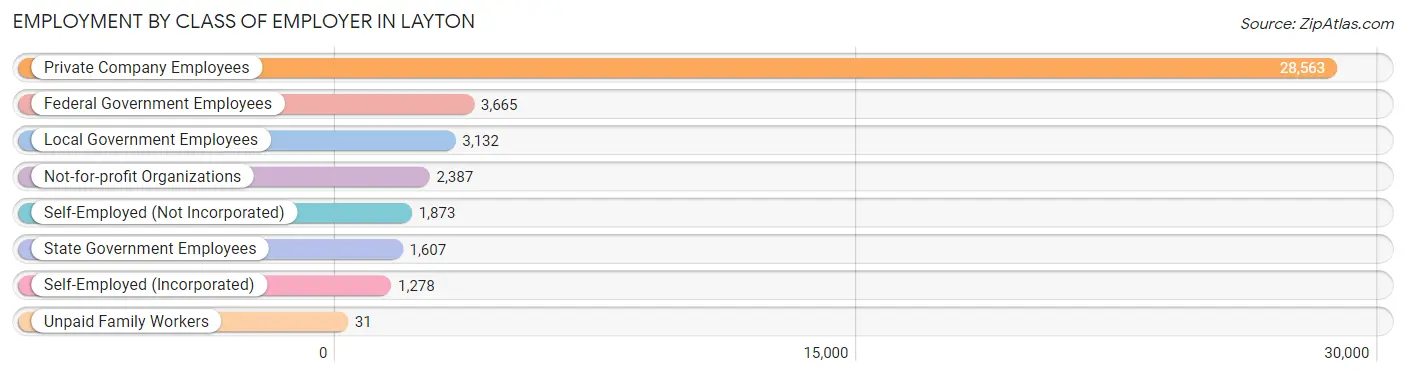
| Employer Class | # Employees | % Employees |
| Private Company Employees | 28,563 | 67.1% |
| Self-Employed (Incorporated) | 1,278 | 3.0% |
| Self-Employed (Not Incorporated) | 1,873 | 4.4% |
| Not-for-profit Organizations | 2,387 | 5.6% |
| Local Government Employees | 3,132 | 7.4% |
| State Government Employees | 1,607 | 3.8% |
| Federal Government Employees | 3,665 | 8.6% |
| Unpaid Family Workers | 31 | 0.1% |
| Total | 42,536 | 100.0% |
Employment Status by Age in Layton
According to the labor force statistics for Layton, out of the total population over 16 years of age (60,598), 73.0% or 44,237 individuals are in the labor force, with 2.3% or 1,017 of them unemployed. The age group with the highest labor force participation rate is 20 to 24 years, with 89.5% or 4,941 individuals in the labor force. Within the labor force, the 16 to 19 years age range has the highest percentage of unemployed individuals, with 8.0% or 236 of them being unemployed.
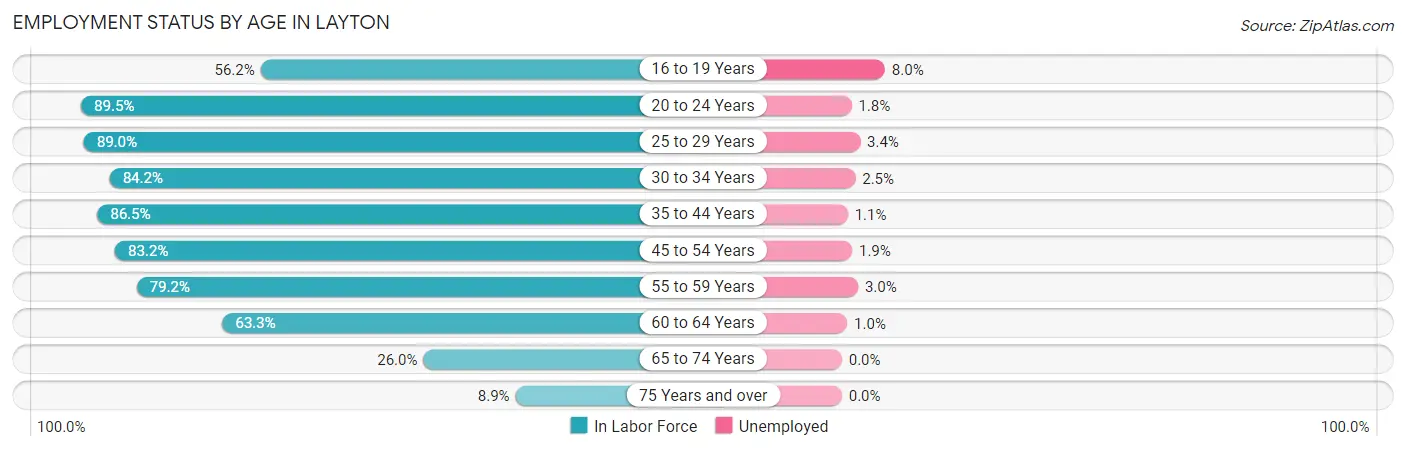
| Age Bracket | In Labor Force | Unemployed |
| 16 to 19 Years | 2,954 (56.2%) | 236 (8.0%) |
| 20 to 24 Years | 4,941 (89.5%) | 89 (1.8%) |
| 25 to 29 Years | 6,049 (89.0%) | 206 (3.4%) |
| 30 to 34 Years | 4,824 (84.2%) | 121 (2.5%) |
| 35 to 44 Years | 10,751 (86.5%) | 118 (1.1%) |
| 45 to 54 Years | 8,104 (83.2%) | 154 (1.9%) |
| 55 to 59 Years | 2,628 (79.2%) | 79 (3.0%) |
| 60 to 64 Years | 2,398 (63.3%) | 24 (1.0%) |
| 65 to 74 Years | 1,321 (26.0%) | 0 (0.0%) |
| 75 Years and over | 262 (8.9%) | 0 (0.0%) |
| Total | 44,237 (73.0%) | 1,017 (2.3%) |
Employment Status by Educational Attainment in Layton
According to labor force statistics for Layton, 83.1% of individuals (34,737) out of the total population between 25 and 64 years of age (41,801) are in the labor force, with 2.0% or 695 of them being unemployed. The group with the highest labor force participation rate are those with the educational attainment of bachelor's degree or higher, with 88.4% or 13,650 individuals in the labor force. Within the labor force, individuals with college / associate degree education have the highest percentage of unemployment, with 3.4% or 411 of them being unemployed.
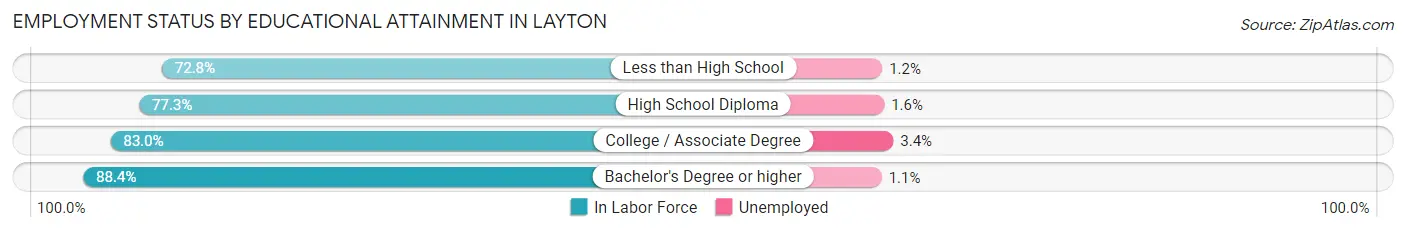
| Educational Attainment | In Labor Force | Unemployed |
| Less than High School | 1,578 (72.8%) | 26 (1.2%) |
| High School Diploma | 7,439 (77.3%) | 154 (1.6%) |
| College / Associate Degree | 12,092 (83.0%) | 495 (3.4%) |
| Bachelor's Degree or higher | 13,650 (88.4%) | 170 (1.1%) |
| Total | 34,737 (83.1%) | 836 (2.0%) |
Employment Occupations by Sex in Layton
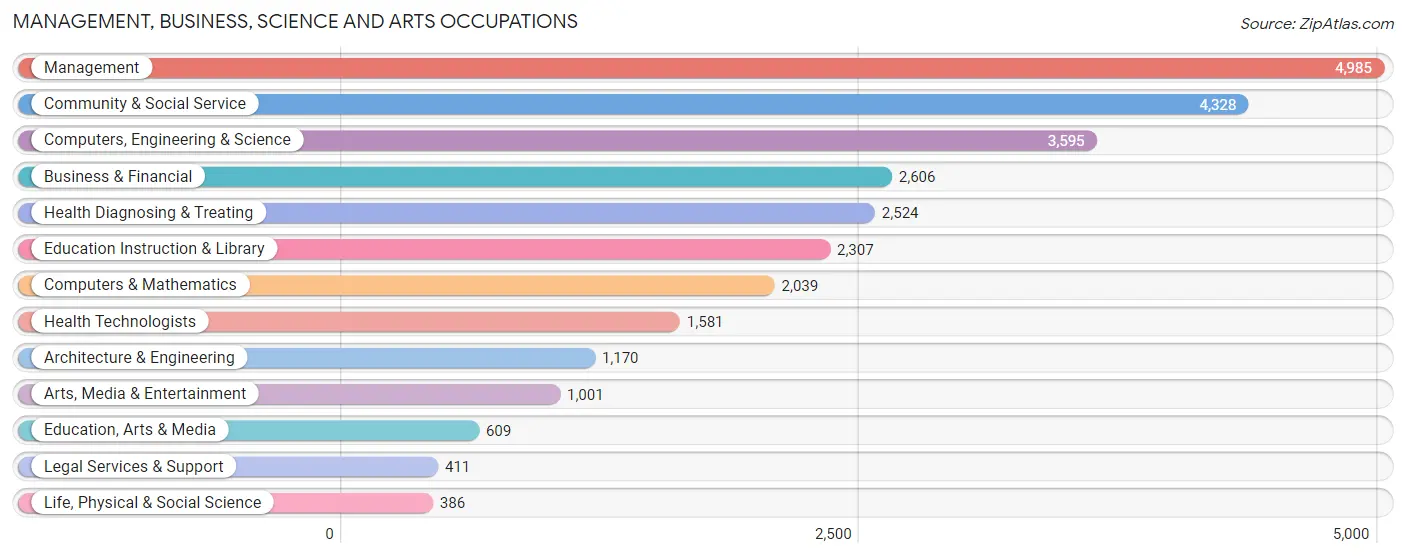
Management, Business, Science and Arts Occupations
The most common Management, Business, Science and Arts occupations in Layton are Management (4,985 | 11.7%), Community & Social Service (4,328 | 10.2%), Computers, Engineering & Science (3,595 | 8.5%), Business & Financial (2,606 | 6.1%), and Health Diagnosing & Treating (2,524 | 5.9%).
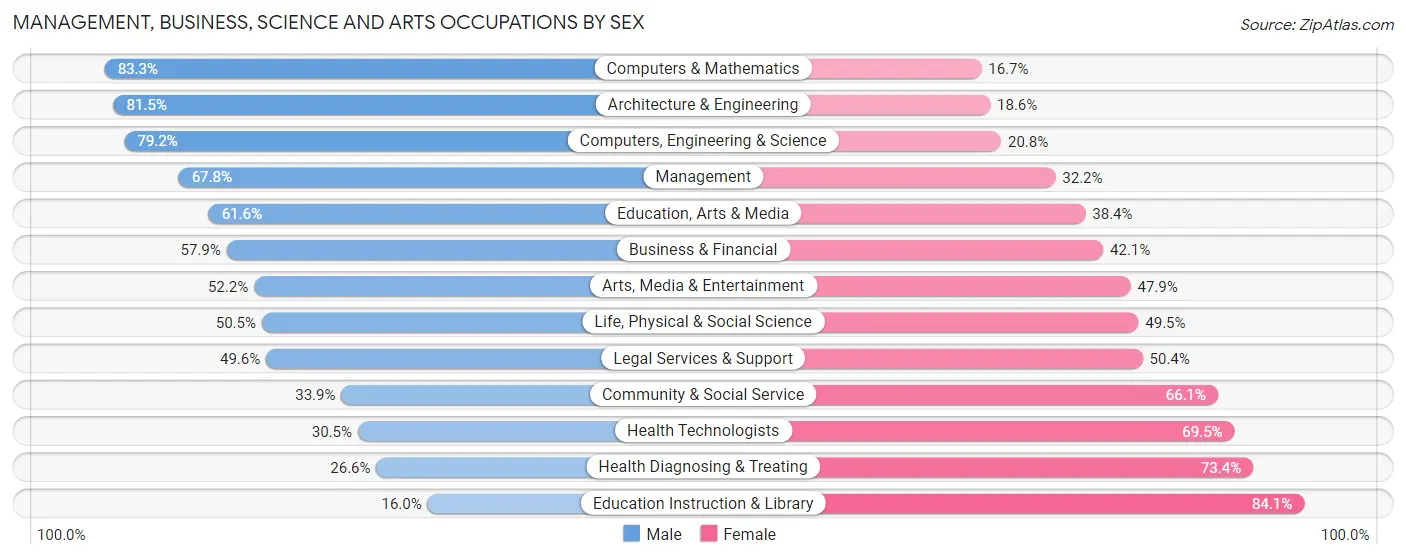
Management, Business, Science and Arts Occupations by Sex
Within the Management, Business, Science and Arts occupations in Layton, the most male-oriented occupations are Computers & Mathematics (83.3%), Architecture & Engineering (81.5%), and Computers, Engineering & Science (79.2%), while the most female-oriented occupations are Education Instruction & Library (84.1%), Health Diagnosing & Treating (73.4%), and Health Technologists (69.5%).
| Occupation | Male | Female |
| Management | 3,382 (67.8%) | 1,603 (32.2%) |
| Business & Financial | 1,508 (57.9%) | 1,098 (42.1%) |
| Computers, Engineering & Science | 2,846 (79.2%) | 749 (20.8%) |
| Computers & Mathematics | 1,698 (83.3%) | 341 (16.7%) |
| Architecture & Engineering | 953 (81.5%) | 217 (18.5%) |
| Life, Physical & Social Science | 195 (50.5%) | 191 (49.5%) |
| Community & Social Service | 1,469 (33.9%) | 2,859 (66.1%) |
| Education, Arts & Media | 375 (61.6%) | 234 (38.4%) |
| Legal Services & Support | 204 (49.6%) | 207 (50.4%) |
| Education Instruction & Library | 368 (16.0%) | 1,939 (84.1%) |
| Arts, Media & Entertainment | 522 (52.1%) | 479 (47.8%) |
| Health Diagnosing & Treating | 672 (26.6%) | 1,852 (73.4%) |
| Health Technologists | 482 (30.5%) | 1,099 (69.5%) |
| Total (Category) | 9,877 (54.8%) | 8,161 (45.2%) |
| Total (Overall) | 23,381 (55.0%) | 19,126 (45.0%) |
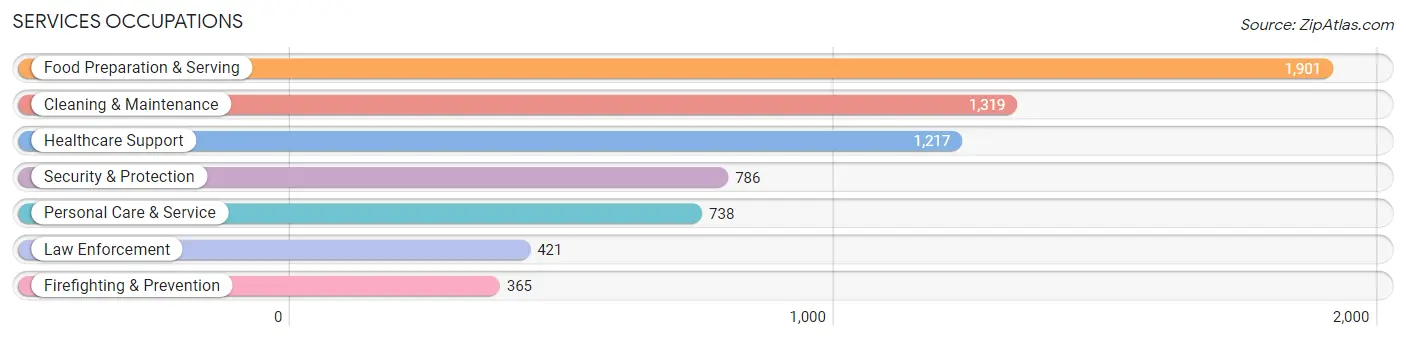
Services Occupations
The most common Services occupations in Layton are Food Preparation & Serving (1,901 | 4.5%), Cleaning & Maintenance (1,319 | 3.1%), Healthcare Support (1,217 | 2.9%), Security & Protection (786 | 1.8%), and Personal Care & Service (738 | 1.7%).
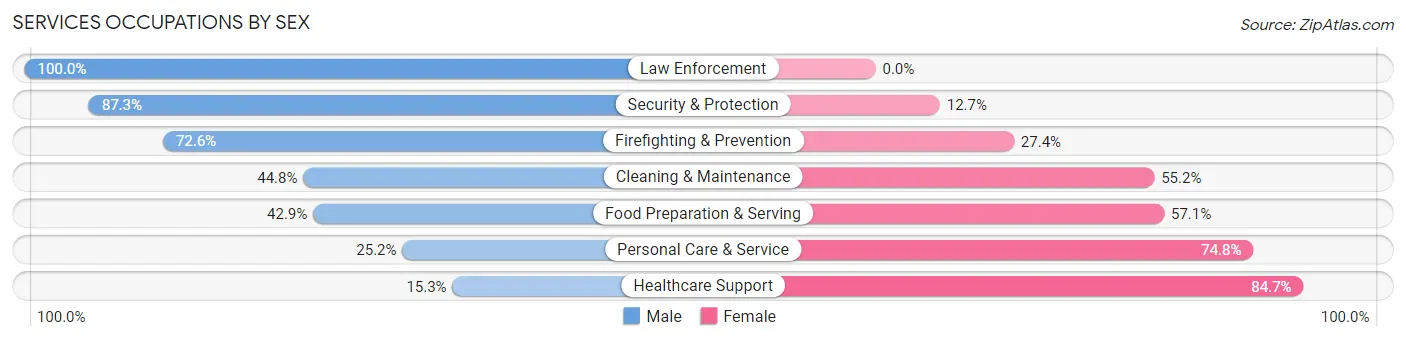
Services Occupations by Sex
Within the Services occupations in Layton, the most male-oriented occupations are Law Enforcement (100.0%), Security & Protection (87.3%), and Firefighting & Prevention (72.6%), while the most female-oriented occupations are Healthcare Support (84.7%), Personal Care & Service (74.8%), and Food Preparation & Serving (57.1%).
| Occupation | Male | Female |
| Healthcare Support | 186 (15.3%) | 1,031 (84.7%) |
| Security & Protection | 686 (87.3%) | 100 (12.7%) |
| Firefighting & Prevention | 265 (72.6%) | 100 (27.4%) |
| Law Enforcement | 421 (100.0%) | 0 (0.0%) |
| Food Preparation & Serving | 815 (42.9%) | 1,086 (57.1%) |
| Cleaning & Maintenance | 591 (44.8%) | 728 (55.2%) |
| Personal Care & Service | 186 (25.2%) | 552 (74.8%) |
| Total (Category) | 2,464 (41.3%) | 3,497 (58.7%) |
| Total (Overall) | 23,381 (55.0%) | 19,126 (45.0%) |
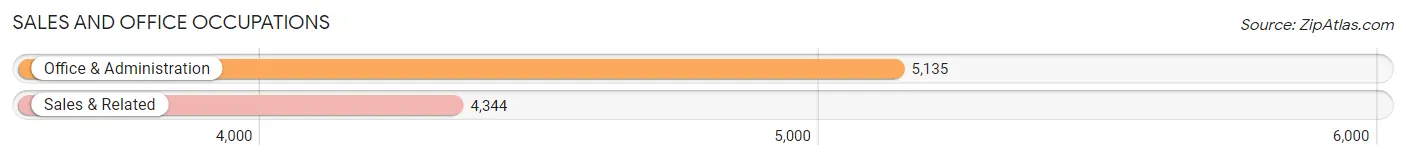
Sales and Office Occupations
The most common Sales and Office occupations in Layton are Office & Administration (5,135 | 12.1%), and Sales & Related (4,344 | 10.2%).
Sales and Office Occupations by Sex
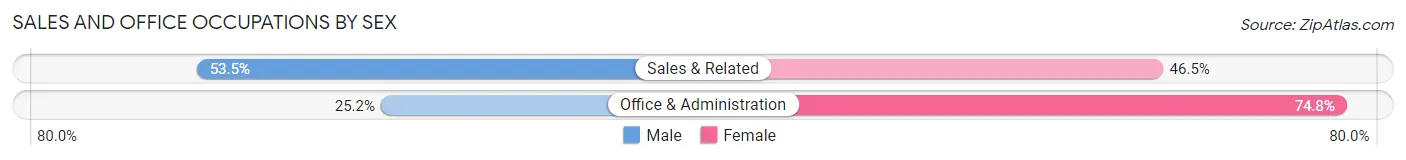
| Occupation | Male | Female |
| Sales & Related | 2,325 (53.5%) | 2,019 (46.5%) |
| Office & Administration | 1,294 (25.2%) | 3,841 (74.8%) |
| Total (Category) | 3,619 (38.2%) | 5,860 (61.8%) |
| Total (Overall) | 23,381 (55.0%) | 19,126 (45.0%) |
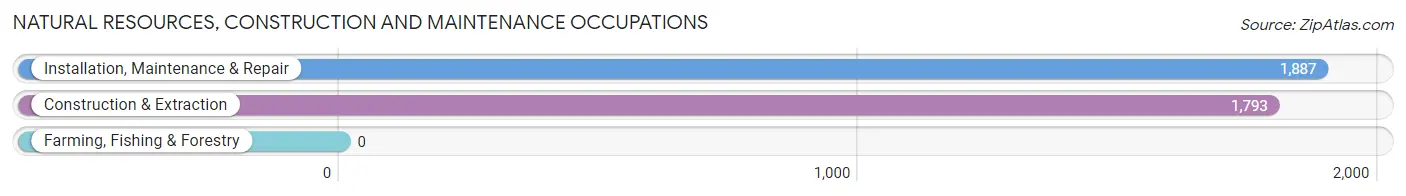
Natural Resources, Construction and Maintenance Occupations
The most common Natural Resources, Construction and Maintenance occupations in Layton are Installation, Maintenance & Repair (1,887 | 4.4%), and Construction & Extraction (1,793 | 4.2%).
Natural Resources, Construction and Maintenance Occupations by Sex
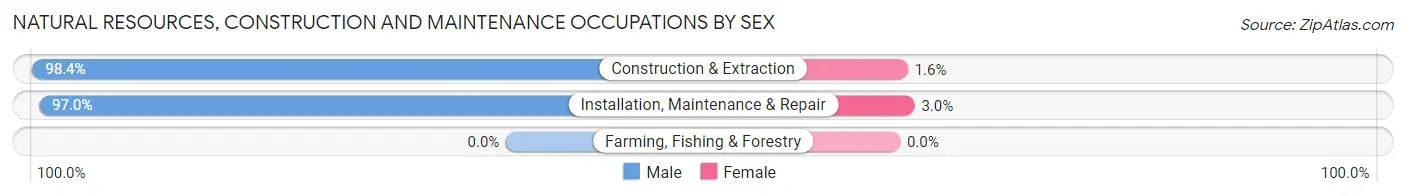
| Occupation | Male | Female |
| Farming, Fishing & Forestry | 0 (0.0%) | 0 (0.0%) |
| Construction & Extraction | 1,764 (98.4%) | 29 (1.6%) |
| Installation, Maintenance & Repair | 1,830 (97.0%) | 57 (3.0%) |
| Total (Category) | 3,594 (97.7%) | 86 (2.3%) |
| Total (Overall) | 23,381 (55.0%) | 19,126 (45.0%) |
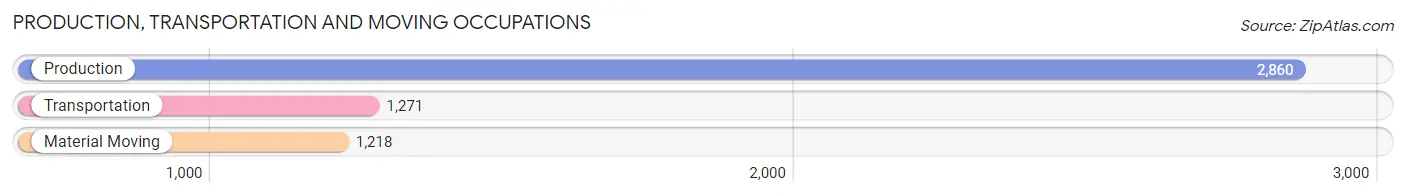
Production, Transportation and Moving Occupations
The most common Production, Transportation and Moving occupations in Layton are Production (2,860 | 6.7%), Transportation (1,271 | 3.0%), and Material Moving (1,218 | 2.9%).
Production, Transportation and Moving Occupations by Sex
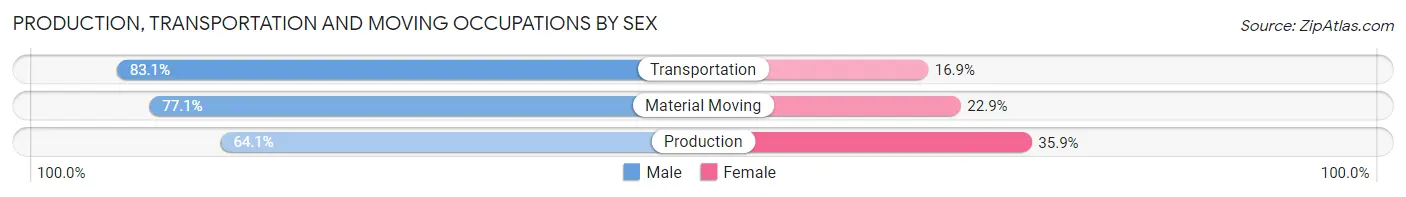
| Occupation | Male | Female |
| Production | 1,832 (64.1%) | 1,028 (35.9%) |
| Transportation | 1,056 (83.1%) | 215 (16.9%) |
| Material Moving | 939 (77.1%) | 279 (22.9%) |
| Total (Category) | 3,827 (71.6%) | 1,522 (28.4%) |
| Total (Overall) | 23,381 (55.0%) | 19,126 (45.0%) |
Employment Industries by Sex in Layton
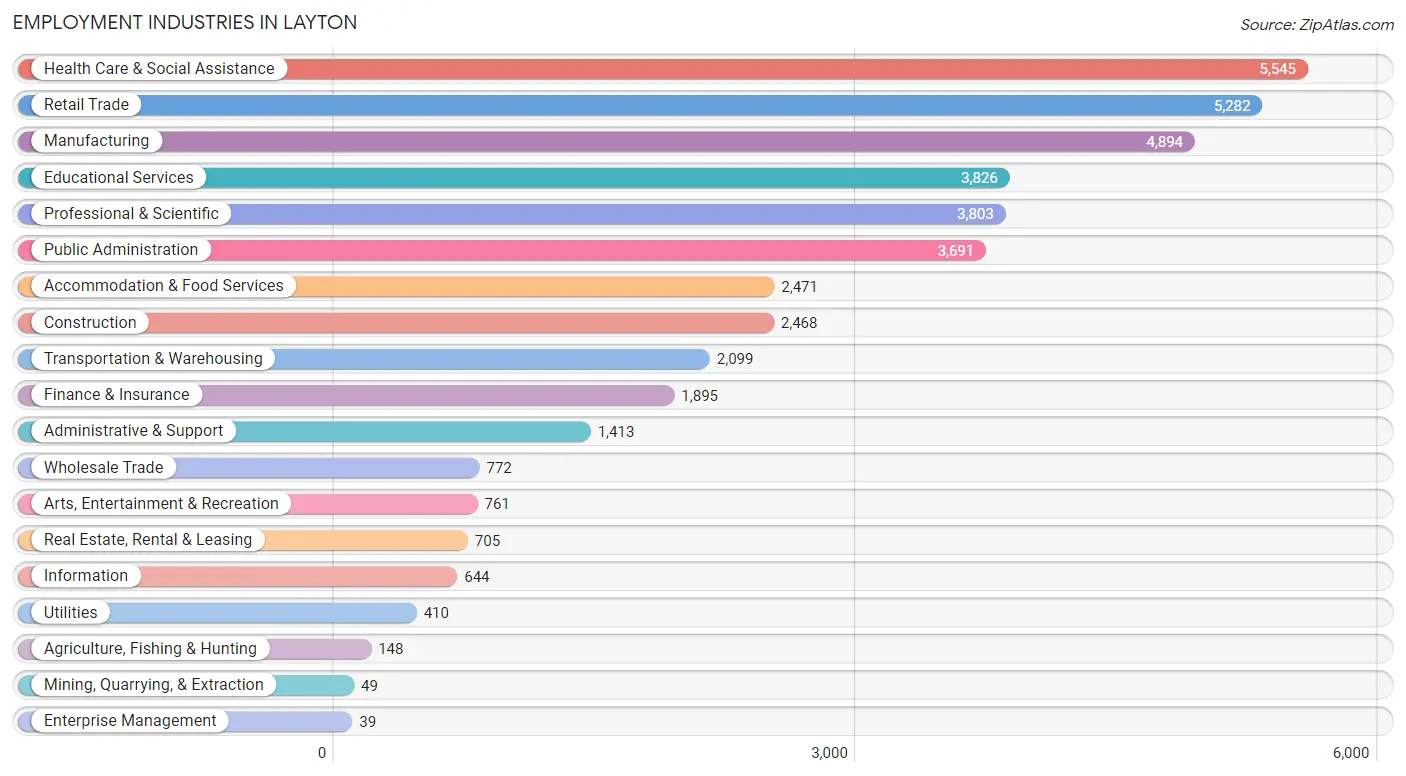
Employment Industries in Layton
The major employment industries in Layton include Health Care & Social Assistance (5,545 | 13.0%), Retail Trade (5,282 | 12.4%), Manufacturing (4,894 | 11.5%), Educational Services (3,826 | 9.0%), and Professional & Scientific (3,803 | 8.9%).
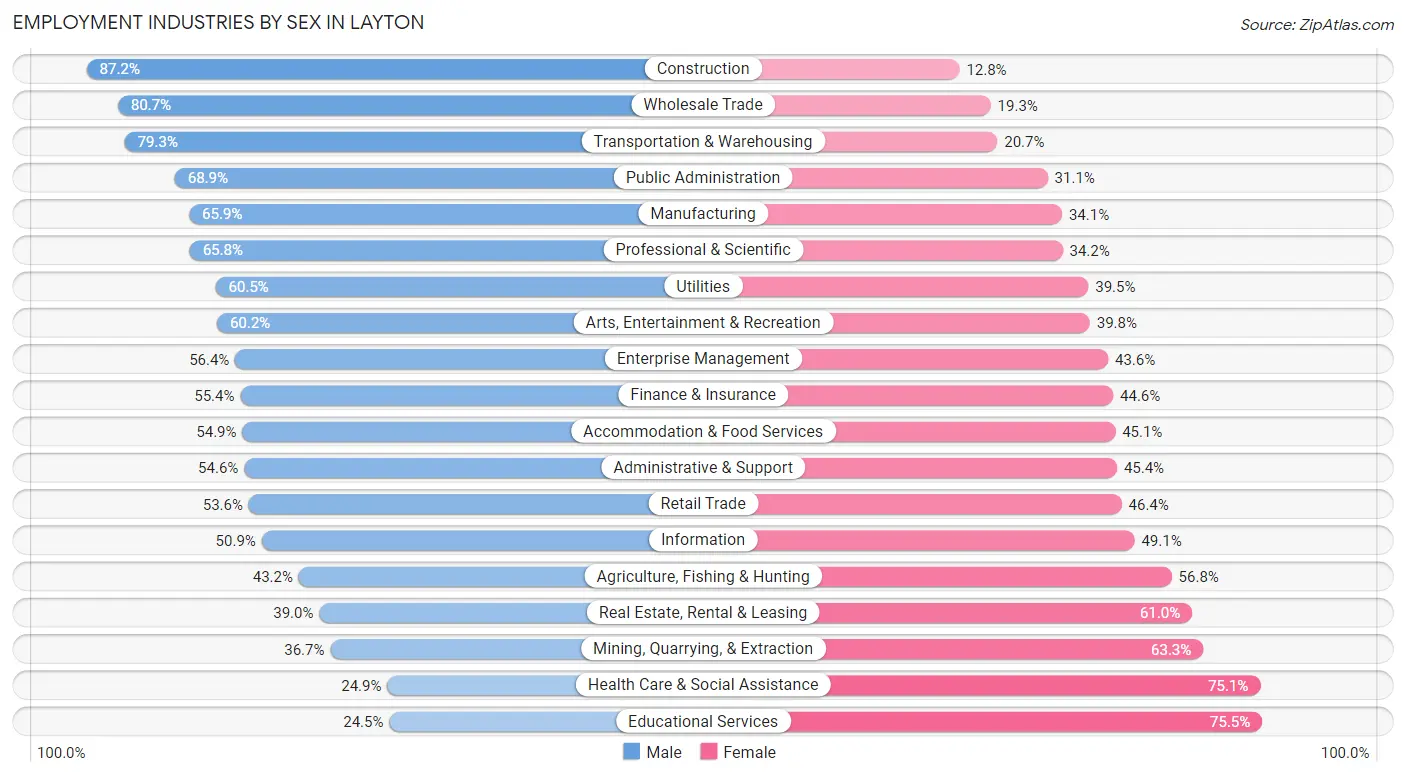
Employment Industries by Sex in Layton
The Layton industries that see more men than women are Construction (87.2%), Wholesale Trade (80.7%), and Transportation & Warehousing (79.3%), whereas the industries that tend to have a higher number of women are Educational Services (75.5%), Health Care & Social Assistance (75.1%), and Mining, Quarrying, & Extraction (63.3%).
| Industry | Male | Female |
| Agriculture, Fishing & Hunting | 64 (43.2%) | 84 (56.8%) |
| Mining, Quarrying, & Extraction | 18 (36.7%) | 31 (63.3%) |
| Construction | 2,151 (87.2%) | 317 (12.8%) |
| Manufacturing | 3,227 (65.9%) | 1,667 (34.1%) |
| Wholesale Trade | 623 (80.7%) | 149 (19.3%) |
| Retail Trade | 2,831 (53.6%) | 2,451 (46.4%) |
| Transportation & Warehousing | 1,665 (79.3%) | 434 (20.7%) |
| Utilities | 248 (60.5%) | 162 (39.5%) |
| Information | 328 (50.9%) | 316 (49.1%) |
| Finance & Insurance | 1,049 (55.4%) | 846 (44.6%) |
| Real Estate, Rental & Leasing | 275 (39.0%) | 430 (61.0%) |
| Professional & Scientific | 2,503 (65.8%) | 1,300 (34.2%) |
| Enterprise Management | 22 (56.4%) | 17 (43.6%) |
| Administrative & Support | 771 (54.6%) | 642 (45.4%) |
| Educational Services | 938 (24.5%) | 2,888 (75.5%) |
| Health Care & Social Assistance | 1,382 (24.9%) | 4,163 (75.1%) |
| Arts, Entertainment & Recreation | 458 (60.2%) | 303 (39.8%) |
| Accommodation & Food Services | 1,357 (54.9%) | 1,114 (45.1%) |
| Public Administration | 2,543 (68.9%) | 1,148 (31.1%) |
| Total | 23,381 (55.0%) | 19,126 (45.0%) |
Education in Layton
School Enrollment in Layton
The most common levels of schooling among the 24,823 students in Layton are high school (6,071 | 24.5%), elementary school (5,899 | 23.8%), and middle school (5,387 | 21.7%).
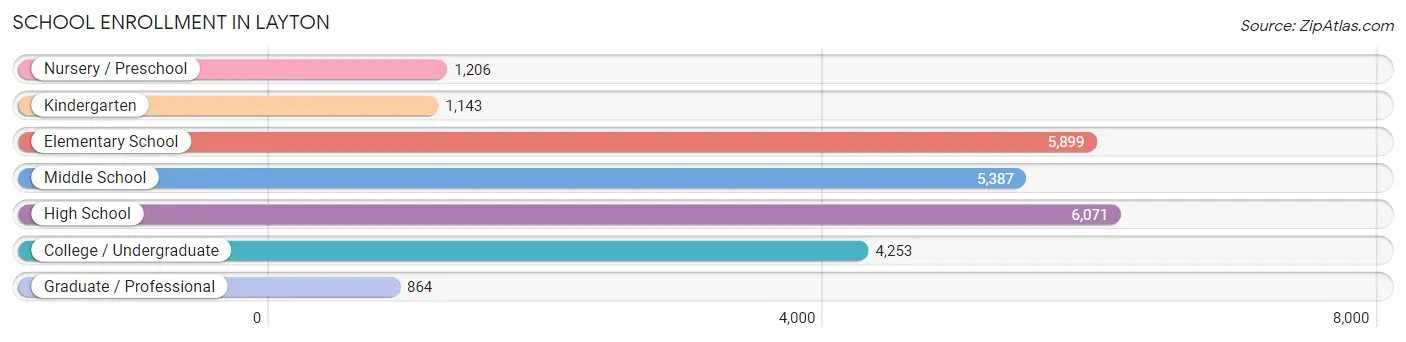
| School Level | # Students | % Students |
| Nursery / Preschool | 1,206 | 4.9% |
| Kindergarten | 1,143 | 4.6% |
| Elementary School | 5,899 | 23.8% |
| Middle School | 5,387 | 21.7% |
| High School | 6,071 | 24.5% |
| College / Undergraduate | 4,253 | 17.1% |
| Graduate / Professional | 864 | 3.5% |
| Total | 24,823 | 100.0% |
School Enrollment by Age by Funding Source in Layton
Out of a total of 24,823 students who are enrolled in schools in Layton, 2,333 (9.4%) attend a private institution, while the remaining 22,490 (90.6%) are enrolled in public schools. The age group of 3 to 4 year olds has the highest likelihood of being enrolled in private schools, with 344 (47.2% in the age bracket) enrolled. Conversely, the age group of 15 to 17 year olds has the lowest likelihood of being enrolled in a private school, with 4,145 (96.8% in the age bracket) attending a public institution.
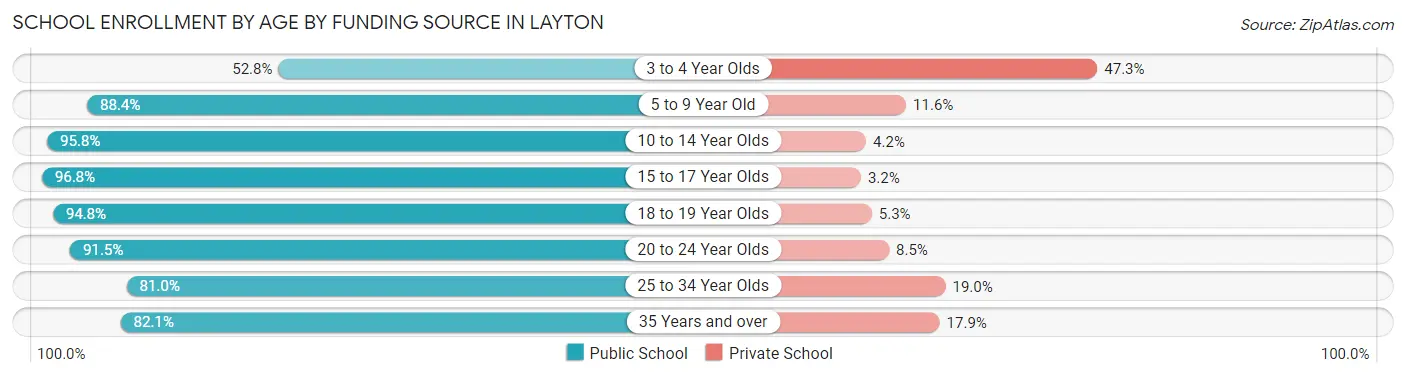
| Age Bracket | Public School | Private School |
| 3 to 4 Year Olds | 384 (52.7%) | 344 (47.2%) |
| 5 to 9 Year Old | 6,119 (88.4%) | 806 (11.6%) |
| 10 to 14 Year Olds | 6,473 (95.8%) | 283 (4.2%) |
| 15 to 17 Year Olds | 4,145 (96.8%) | 138 (3.2%) |
| 18 to 19 Year Olds | 1,390 (94.8%) | 77 (5.2%) |
| 20 to 24 Year Olds | 1,514 (91.5%) | 140 (8.5%) |
| 25 to 34 Year Olds | 1,315 (81.0%) | 308 (19.0%) |
| 35 Years and over | 1,139 (82.1%) | 248 (17.9%) |
| Total | 22,490 (90.6%) | 2,333 (9.4%) |
Educational Attainment by Field of Study in Layton
Business (4,476 | 22.6%), science & technology (2,616 | 13.2%), education (2,311 | 11.7%), engineering (1,615 | 8.2%), and arts & humanities (1,604 | 8.1%) are the most common fields of study among 19,814 individuals in Layton who have obtained a bachelor's degree or higher.
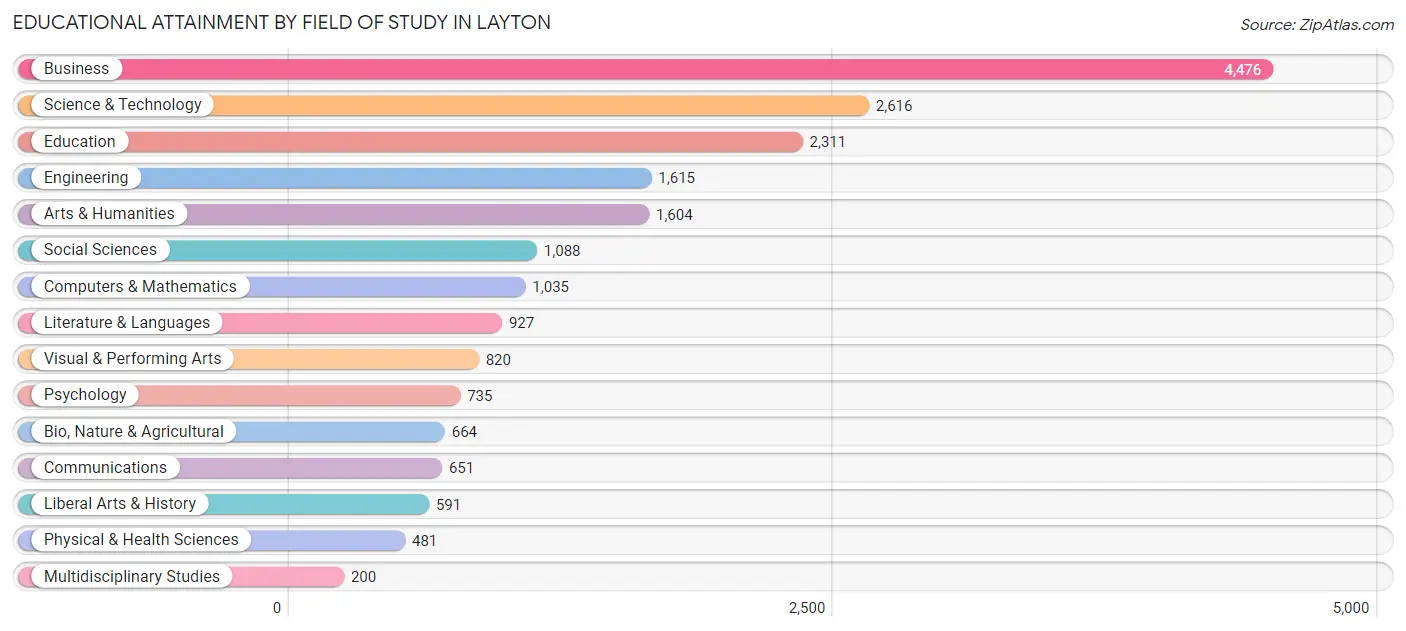
| Field of Study | # Graduates | % Graduates |
| Computers & Mathematics | 1,035 | 5.2% |
| Bio, Nature & Agricultural | 664 | 3.4% |
| Physical & Health Sciences | 481 | 2.4% |
| Psychology | 735 | 3.7% |
| Social Sciences | 1,088 | 5.5% |
| Engineering | 1,615 | 8.2% |
| Multidisciplinary Studies | 200 | 1.0% |
| Science & Technology | 2,616 | 13.2% |
| Business | 4,476 | 22.6% |
| Education | 2,311 | 11.7% |
| Literature & Languages | 927 | 4.7% |
| Liberal Arts & History | 591 | 3.0% |
| Visual & Performing Arts | 820 | 4.1% |
| Communications | 651 | 3.3% |
| Arts & Humanities | 1,604 | 8.1% |
| Total | 19,814 | 100.0% |
Transportation & Commute in Layton
Vehicle Availability by Sex in Layton
The most prevalent vehicle ownership categories in Layton are males with 2 vehicles (9,128, accounting for 38.9%) and females with 2 vehicles (6,911, making up 47.9%).
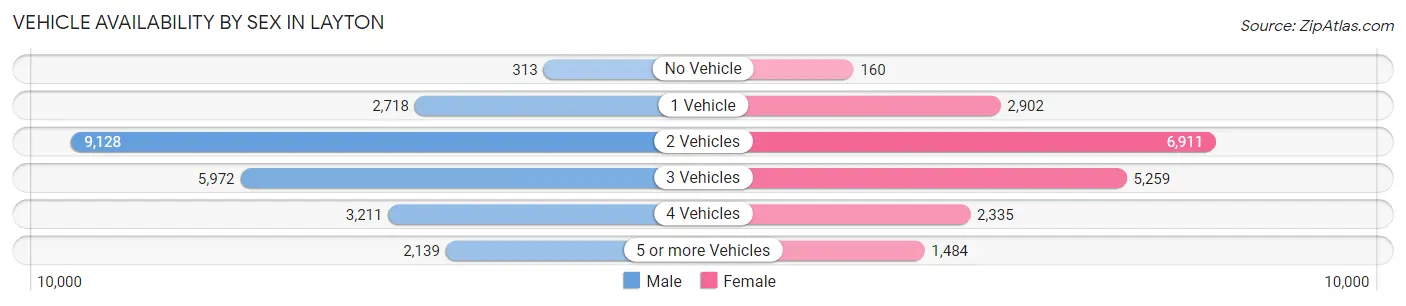
| Vehicles Available | Male | Female |
| No Vehicle | 313 (1.3%) | 160 (0.8%) |
| 1 Vehicle | 2,718 (11.6%) | 2,902 (15.2%) |
| 2 Vehicles | 9,128 (38.9%) | 6,911 (36.3%) |
| 3 Vehicles | 5,972 (25.4%) | 5,259 (27.6%) |
| 4 Vehicles | 3,211 (13.7%) | 2,335 (12.3%) |
| 5 or more Vehicles | 2,139 (9.1%) | 1,484 (7.8%) |
| Total | 23,481 (100.0%) | 19,051 (100.0%) |
Commute Time in Layton
The most frequently occuring commute durations in Layton are 15 to 19 minutes (6,195 commuters, 16.7%), 10 to 14 minutes (6,165 commuters, 16.6%), and 20 to 24 minutes (5,490 commuters, 14.8%).
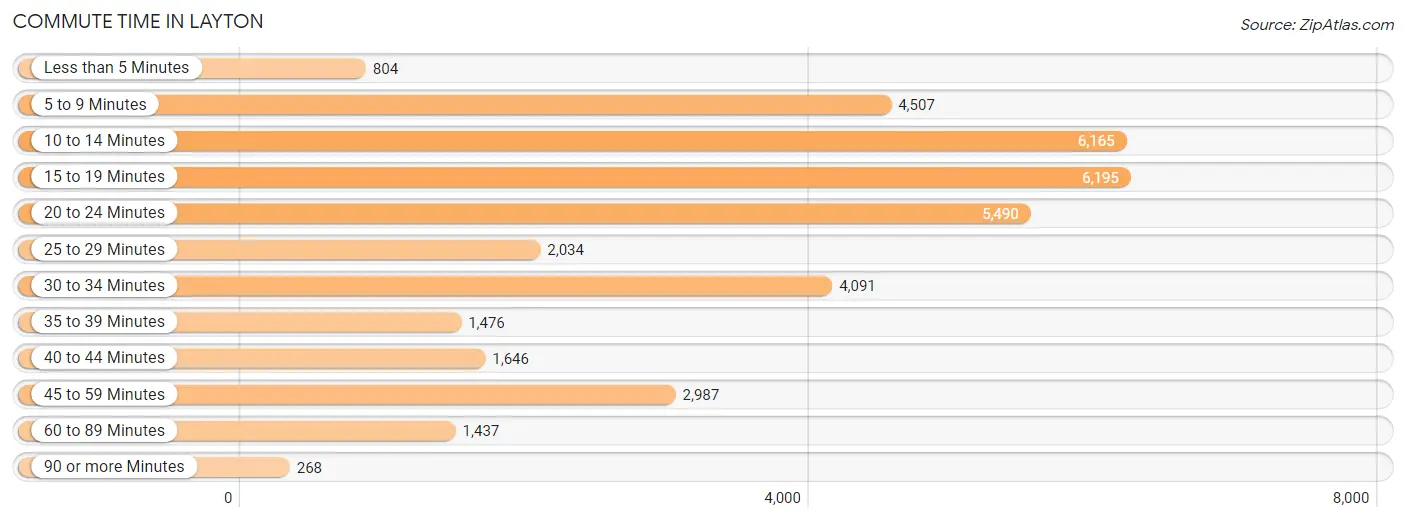
| Commute Time | # Commuters | % Commuters |
| Less than 5 Minutes | 804 | 2.2% |
| 5 to 9 Minutes | 4,507 | 12.1% |
| 10 to 14 Minutes | 6,165 | 16.6% |
| 15 to 19 Minutes | 6,195 | 16.7% |
| 20 to 24 Minutes | 5,490 | 14.8% |
| 25 to 29 Minutes | 2,034 | 5.5% |
| 30 to 34 Minutes | 4,091 | 11.0% |
| 35 to 39 Minutes | 1,476 | 4.0% |
| 40 to 44 Minutes | 1,646 | 4.4% |
| 45 to 59 Minutes | 2,987 | 8.1% |
| 60 to 89 Minutes | 1,437 | 3.9% |
| 90 or more Minutes | 268 | 0.7% |
Commute Time by Sex in Layton
The most common commute times in Layton are 15 to 19 minutes (3,451 commuters, 16.6%) for males and 10 to 14 minutes (3,177 commuters, 19.5%) for females.
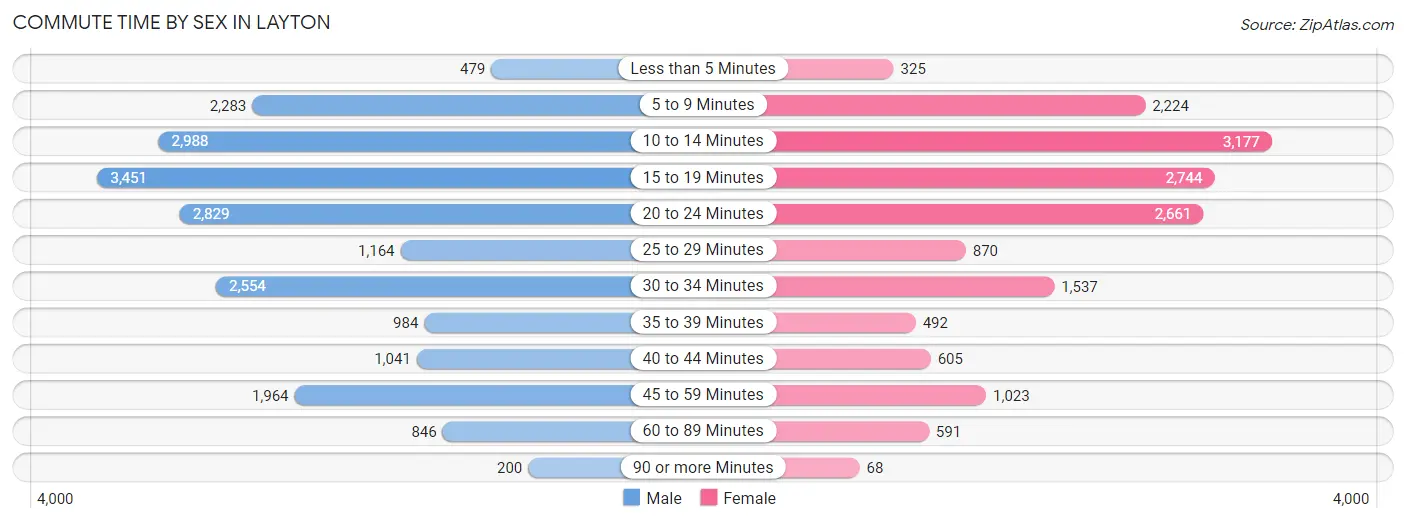
| Commute Time | Male | Female |
| Less than 5 Minutes | 479 (2.3%) | 325 (2.0%) |
| 5 to 9 Minutes | 2,283 (11.0%) | 2,224 (13.6%) |
| 10 to 14 Minutes | 2,988 (14.4%) | 3,177 (19.5%) |
| 15 to 19 Minutes | 3,451 (16.6%) | 2,744 (16.8%) |
| 20 to 24 Minutes | 2,829 (13.6%) | 2,661 (16.3%) |
| 25 to 29 Minutes | 1,164 (5.6%) | 870 (5.3%) |
| 30 to 34 Minutes | 2,554 (12.3%) | 1,537 (9.4%) |
| 35 to 39 Minutes | 984 (4.7%) | 492 (3.0%) |
| 40 to 44 Minutes | 1,041 (5.0%) | 605 (3.7%) |
| 45 to 59 Minutes | 1,964 (9.5%) | 1,023 (6.3%) |
| 60 to 89 Minutes | 846 (4.1%) | 591 (3.6%) |
| 90 or more Minutes | 200 (1.0%) | 68 (0.4%) |
Time of Departure to Work by Sex in Layton
The most frequent times of departure to work in Layton are 7:00 AM to 7:29 AM (2,653, 12.8%) for males and 8:00 AM to 8:29 AM (2,449, 15.0%) for females.
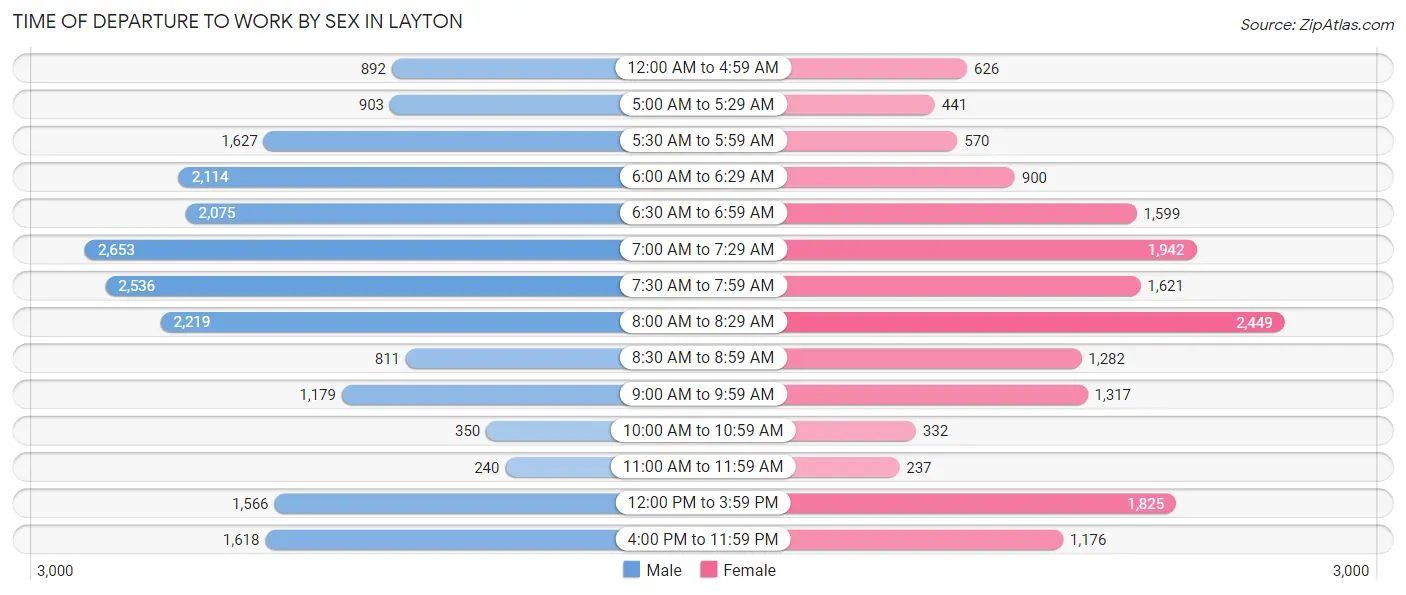
| Time of Departure | Male | Female |
| 12:00 AM to 4:59 AM | 892 (4.3%) | 626 (3.8%) |
| 5:00 AM to 5:29 AM | 903 (4.3%) | 441 (2.7%) |
| 5:30 AM to 5:59 AM | 1,627 (7.8%) | 570 (3.5%) |
| 6:00 AM to 6:29 AM | 2,114 (10.2%) | 900 (5.5%) |
| 6:30 AM to 6:59 AM | 2,075 (10.0%) | 1,599 (9.8%) |
| 7:00 AM to 7:29 AM | 2,653 (12.8%) | 1,942 (11.9%) |
| 7:30 AM to 7:59 AM | 2,536 (12.2%) | 1,621 (9.9%) |
| 8:00 AM to 8:29 AM | 2,219 (10.7%) | 2,449 (15.0%) |
| 8:30 AM to 8:59 AM | 811 (3.9%) | 1,282 (7.9%) |
| 9:00 AM to 9:59 AM | 1,179 (5.7%) | 1,317 (8.1%) |
| 10:00 AM to 10:59 AM | 350 (1.7%) | 332 (2.0%) |
| 11:00 AM to 11:59 AM | 240 (1.1%) | 237 (1.5%) |
| 12:00 PM to 3:59 PM | 1,566 (7.5%) | 1,825 (11.2%) |
| 4:00 PM to 11:59 PM | 1,618 (7.8%) | 1,176 (7.2%) |
| Total | 20,783 (100.0%) | 16,317 (100.0%) |
Housing Occupancy in Layton
Occupancy by Ownership in Layton
Of the total 26,754 dwellings in Layton, owner-occupied units account for 19,128 (71.5%), while renter-occupied units make up 7,626 (28.5%).
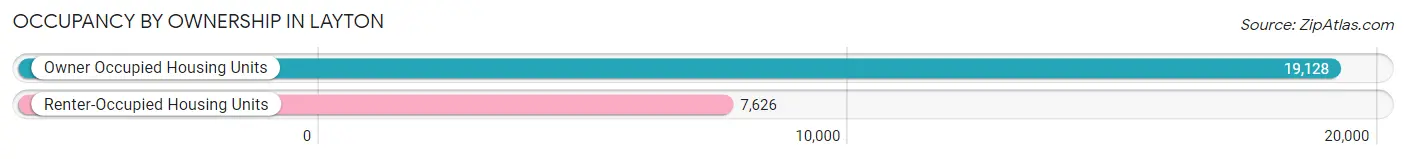
| Occupancy | # Housing Units | % Housing Units |
| Owner Occupied Housing Units | 19,128 | 71.5% |
| Renter-Occupied Housing Units | 7,626 | 28.5% |
| Total Occupied Housing Units | 26,754 | 100.0% |
Occupancy by Household Size in Layton
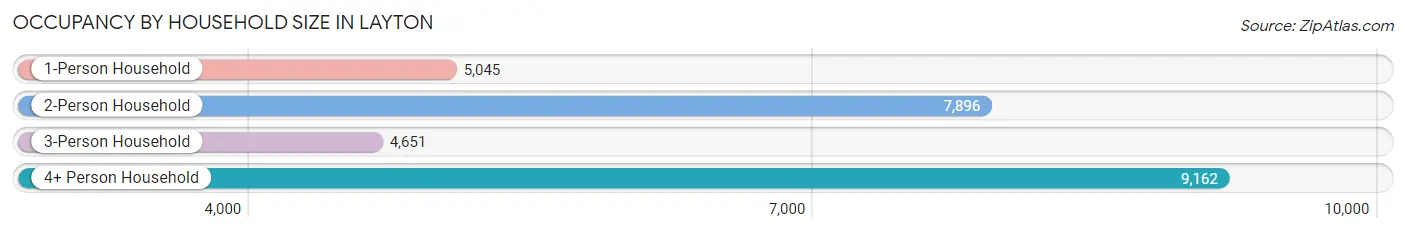
| Household Size | # Housing Units | % Housing Units |
| 1-Person Household | 5,045 | 18.9% |
| 2-Person Household | 7,896 | 29.5% |
| 3-Person Household | 4,651 | 17.4% |
| 4+ Person Household | 9,162 | 34.3% |
| Total Housing Units | 26,754 | 100.0% |
Occupancy by Ownership by Household Size in Layton
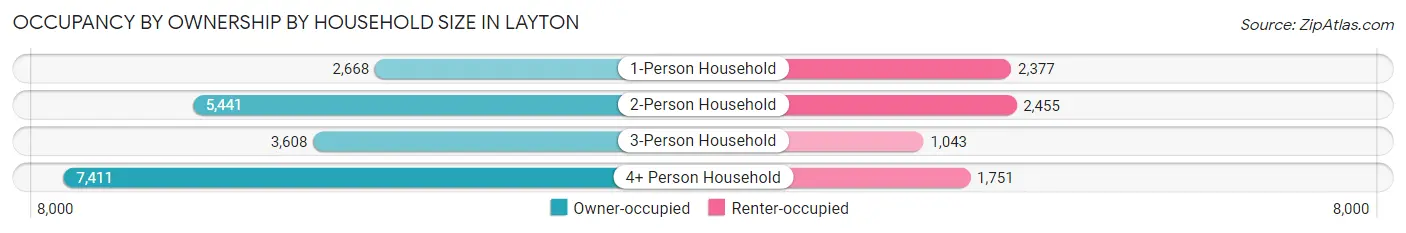
| Household Size | Owner-occupied | Renter-occupied |
| 1-Person Household | 2,668 (52.9%) | 2,377 (47.1%) |
| 2-Person Household | 5,441 (68.9%) | 2,455 (31.1%) |
| 3-Person Household | 3,608 (77.6%) | 1,043 (22.4%) |
| 4+ Person Household | 7,411 (80.9%) | 1,751 (19.1%) |
| Total Housing Units | 19,128 (71.5%) | 7,626 (28.5%) |
Occupancy by Educational Attainment in Layton
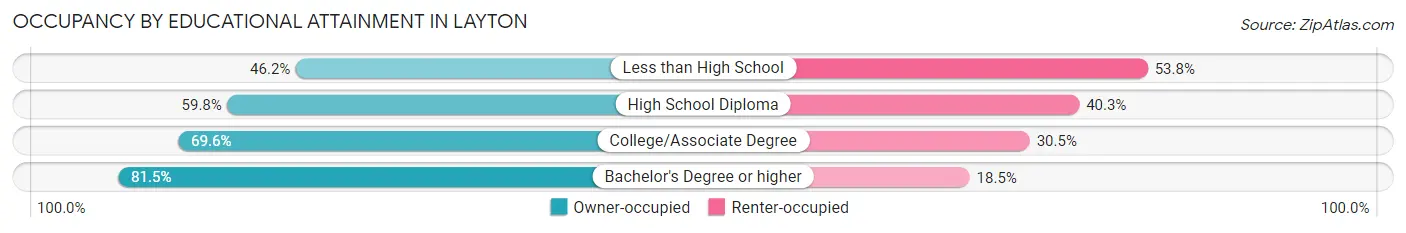
| Household Size | Owner-occupied | Renter-occupied |
| Less than High School | 583 (46.2%) | 680 (53.8%) |
| High School Diploma | 3,007 (59.8%) | 2,026 (40.3%) |
| College/Associate Degree | 6,593 (69.6%) | 2,886 (30.4%) |
| Bachelor's Degree or higher | 8,945 (81.5%) | 2,034 (18.5%) |
Occupancy by Age of Householder in Layton
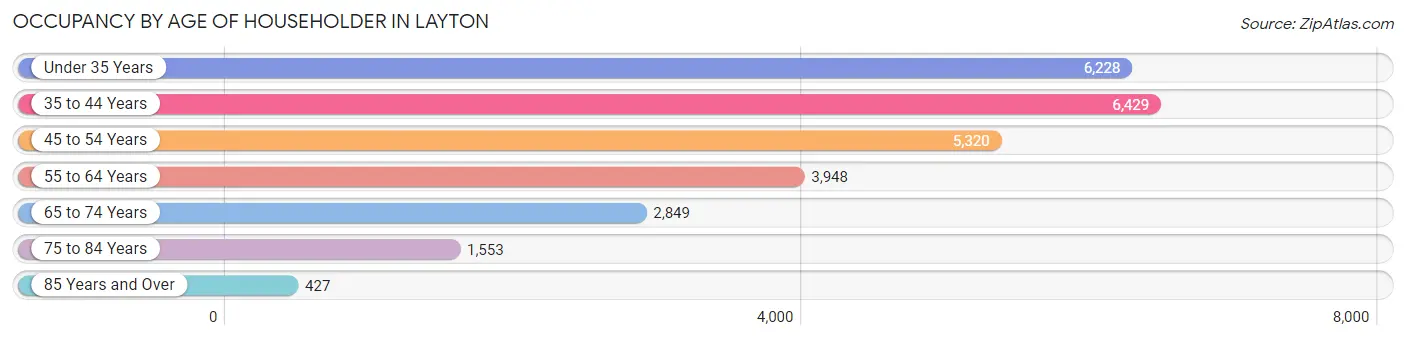
| Age Bracket | # Households | % Households |
| Under 35 Years | 6,228 | 23.3% |
| 35 to 44 Years | 6,429 | 24.0% |
| 45 to 54 Years | 5,320 | 19.9% |
| 55 to 64 Years | 3,948 | 14.8% |
| 65 to 74 Years | 2,849 | 10.6% |
| 75 to 84 Years | 1,553 | 5.8% |
| 85 Years and Over | 427 | 1.6% |
| Total | 26,754 | 100.0% |
Housing Finances in Layton
Median Income by Occupancy in Layton
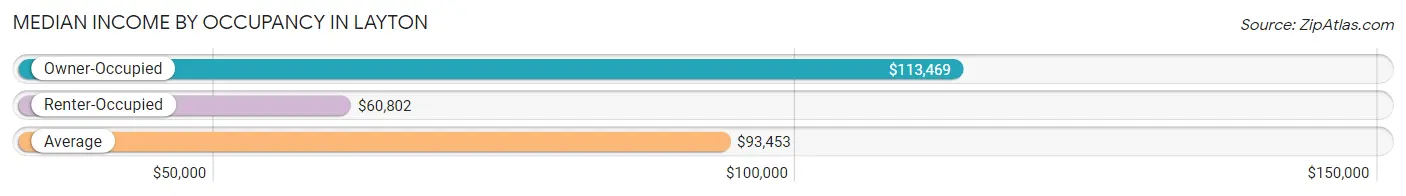
| Occupancy Type | # Households | Median Income |
| Owner-Occupied | 19,128 (71.5%) | $113,469 |
| Renter-Occupied | 7,626 (28.5%) | $60,802 |
| Average | 26,754 (100.0%) | $93,453 |
Occupancy by Householder Income Bracket in Layton
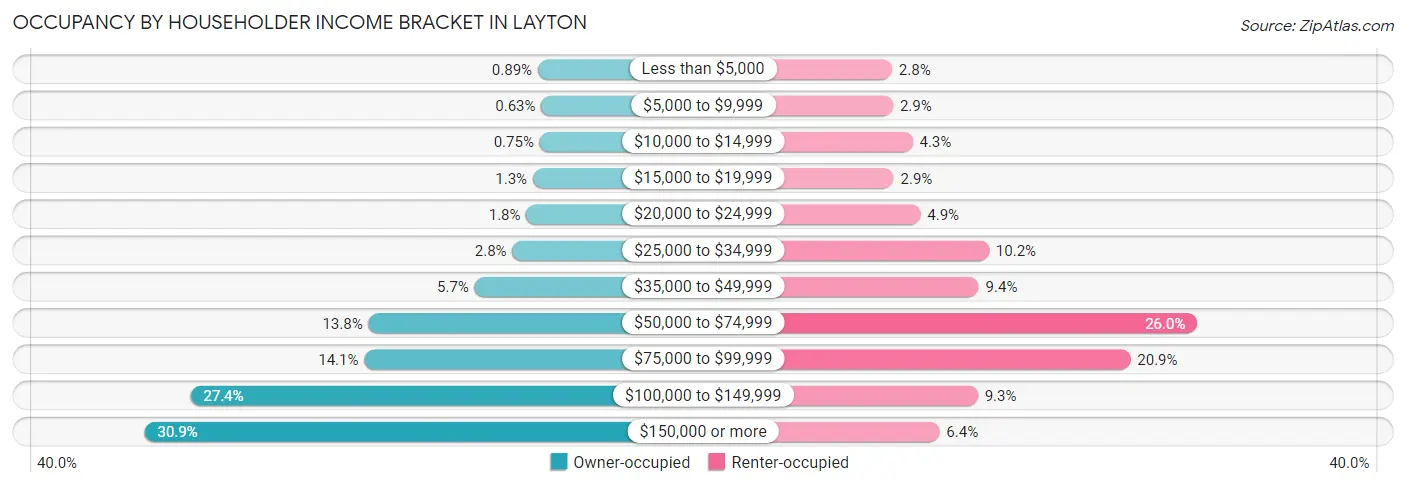
| Income Bracket | Owner-occupied | Renter-occupied |
| Less than $5,000 | 170 (0.9%) | 211 (2.8%) |
| $5,000 to $9,999 | 120 (0.6%) | 217 (2.9%) |
| $10,000 to $14,999 | 144 (0.7%) | 331 (4.3%) |
| $15,000 to $19,999 | 243 (1.3%) | 221 (2.9%) |
| $20,000 to $24,999 | 338 (1.8%) | 377 (4.9%) |
| $25,000 to $34,999 | 542 (2.8%) | 775 (10.2%) |
| $35,000 to $49,999 | 1,093 (5.7%) | 715 (9.4%) |
| $50,000 to $74,999 | 2,639 (13.8%) | 1,985 (26.0%) |
| $75,000 to $99,999 | 2,700 (14.1%) | 1,597 (20.9%) |
| $100,000 to $149,999 | 5,235 (27.4%) | 710 (9.3%) |
| $150,000 or more | 5,904 (30.9%) | 487 (6.4%) |
| Total | 19,128 (100.0%) | 7,626 (100.0%) |
Monthly Housing Cost Tiers in Layton
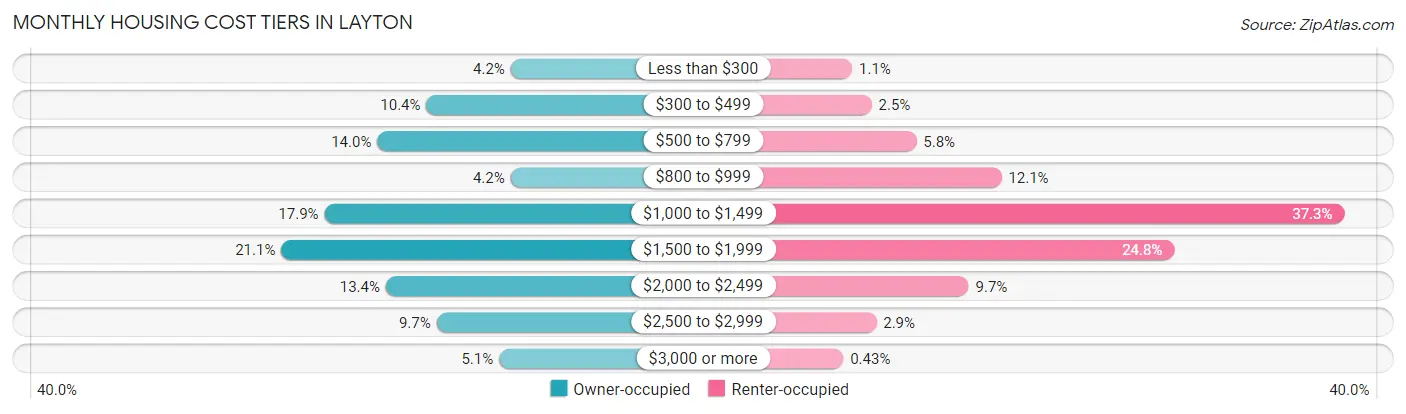
| Monthly Cost | Owner-occupied | Renter-occupied |
| Less than $300 | 803 (4.2%) | 82 (1.1%) |
| $300 to $499 | 1,992 (10.4%) | 192 (2.5%) |
| $500 to $799 | 2,684 (14.0%) | 443 (5.8%) |
| $800 to $999 | 806 (4.2%) | 921 (12.1%) |
| $1,000 to $1,499 | 3,428 (17.9%) | 2,847 (37.3%) |
| $1,500 to $1,999 | 4,036 (21.1%) | 1,891 (24.8%) |
| $2,000 to $2,499 | 2,564 (13.4%) | 737 (9.7%) |
| $2,500 to $2,999 | 1,847 (9.7%) | 218 (2.9%) |
| $3,000 or more | 968 (5.1%) | 33 (0.4%) |
| Total | 19,128 (100.0%) | 7,626 (100.0%) |
Physical Housing Characteristics in Layton
Housing Structures in Layton
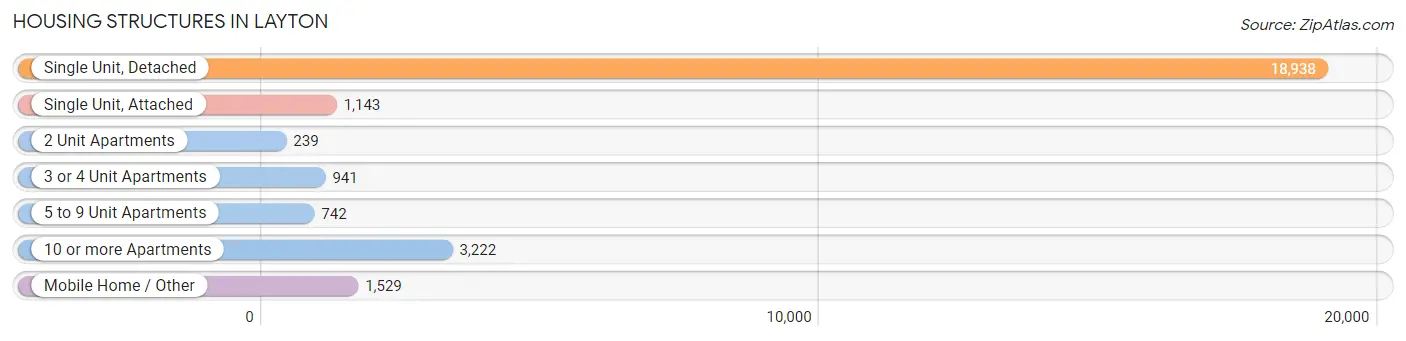
| Structure Type | # Housing Units | % Housing Units |
| Single Unit, Detached | 18,938 | 70.8% |
| Single Unit, Attached | 1,143 | 4.3% |
| 2 Unit Apartments | 239 | 0.9% |
| 3 or 4 Unit Apartments | 941 | 3.5% |
| 5 to 9 Unit Apartments | 742 | 2.8% |
| 10 or more Apartments | 3,222 | 12.0% |
| Mobile Home / Other | 1,529 | 5.7% |
| Total | 26,754 | 100.0% |
Housing Structures by Occupancy in Layton
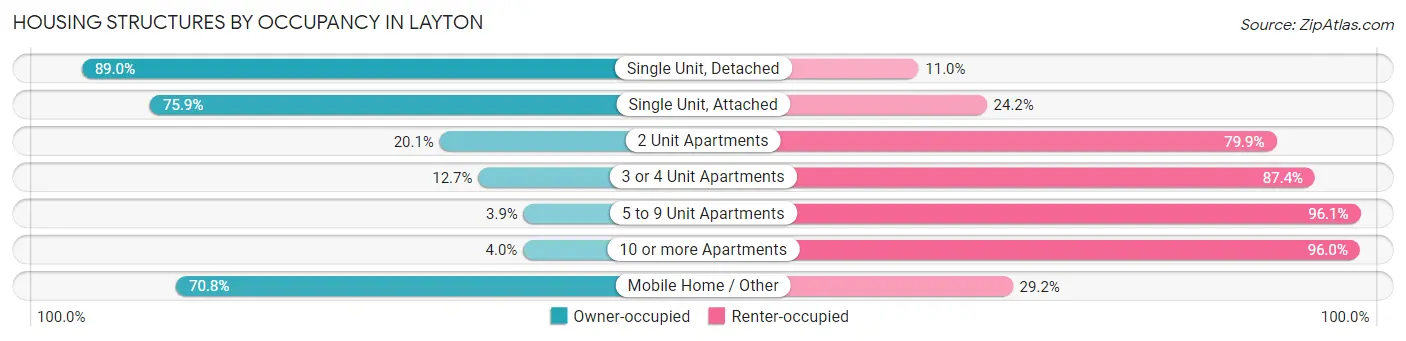
| Structure Type | Owner-occupied | Renter-occupied |
| Single Unit, Detached | 16,853 (89.0%) | 2,085 (11.0%) |
| Single Unit, Attached | 867 (75.8%) | 276 (24.1%) |
| 2 Unit Apartments | 48 (20.1%) | 191 (79.9%) |
| 3 or 4 Unit Apartments | 119 (12.7%) | 822 (87.4%) |
| 5 to 9 Unit Apartments | 29 (3.9%) | 713 (96.1%) |
| 10 or more Apartments | 129 (4.0%) | 3,093 (96.0%) |
| Mobile Home / Other | 1,083 (70.8%) | 446 (29.2%) |
| Total | 19,128 (71.5%) | 7,626 (28.5%) |
Housing Structures by Number of Rooms in Layton
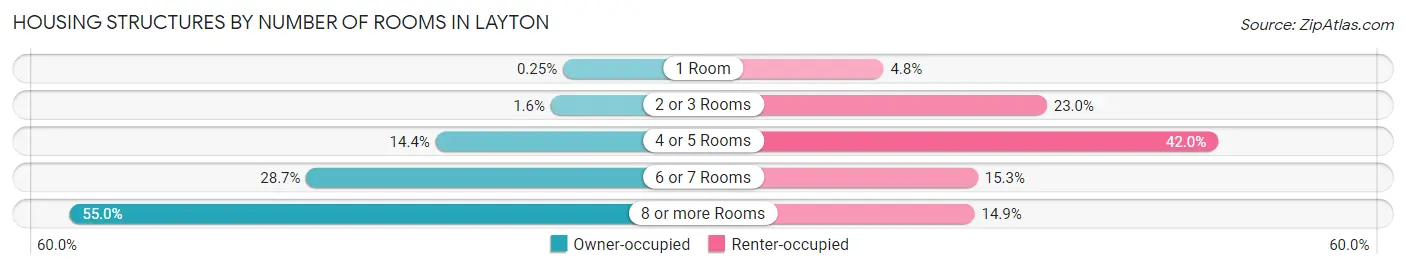
| Number of Rooms | Owner-occupied | Renter-occupied |
| 1 Room | 47 (0.3%) | 368 (4.8%) |
| 2 or 3 Rooms | 306 (1.6%) | 1,751 (23.0%) |
| 4 or 5 Rooms | 2,751 (14.4%) | 3,201 (42.0%) |
| 6 or 7 Rooms | 5,496 (28.7%) | 1,167 (15.3%) |
| 8 or more Rooms | 10,528 (55.0%) | 1,139 (14.9%) |
| Total | 19,128 (100.0%) | 7,626 (100.0%) |
Housing Structure by Heating Type in Layton
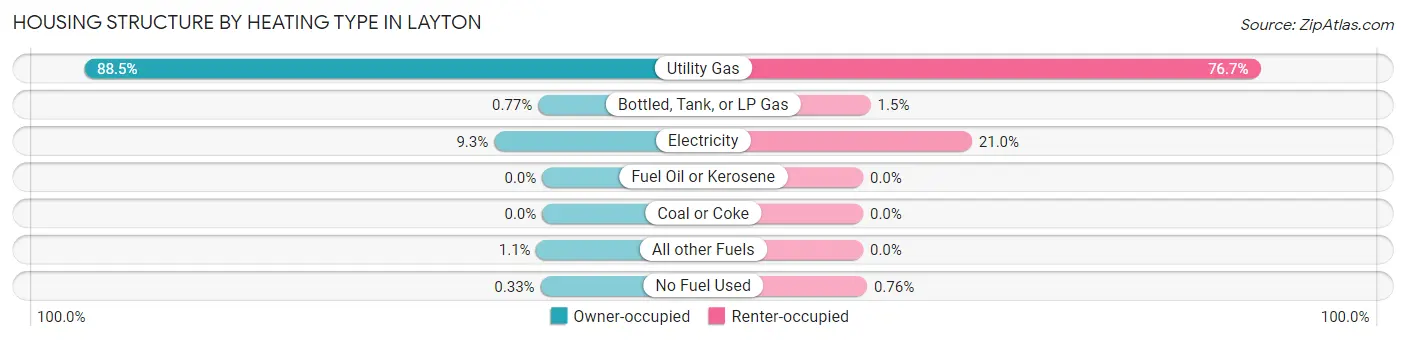
| Heating Type | Owner-occupied | Renter-occupied |
| Utility Gas | 16,930 (88.5%) | 5,852 (76.7%) |
| Bottled, Tank, or LP Gas | 148 (0.8%) | 112 (1.5%) |
| Electricity | 1,775 (9.3%) | 1,604 (21.0%) |
| Fuel Oil or Kerosene | 0 (0.0%) | 0 (0.0%) |
| Coal or Coke | 0 (0.0%) | 0 (0.0%) |
| All other Fuels | 211 (1.1%) | 0 (0.0%) |
| No Fuel Used | 64 (0.3%) | 58 (0.8%) |
| Total | 19,128 (100.0%) | 7,626 (100.0%) |
Household Vehicle Usage in Layton
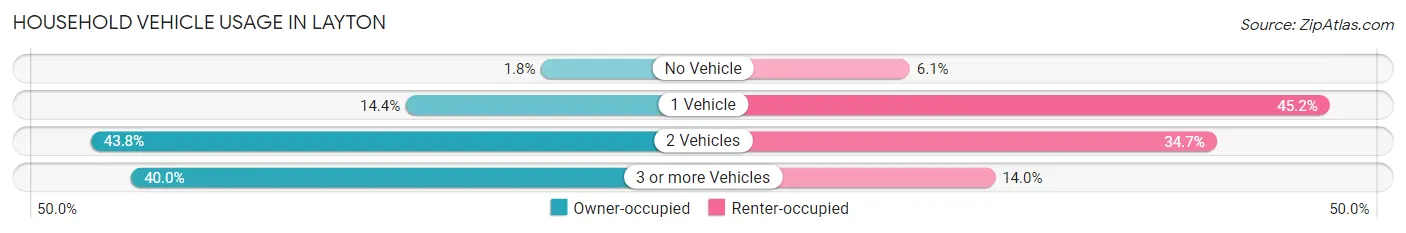
| Vehicles per Household | Owner-occupied | Renter-occupied |
| No Vehicle | 338 (1.8%) | 462 (6.1%) |
| 1 Vehicle | 2,752 (14.4%) | 3,449 (45.2%) |
| 2 Vehicles | 8,380 (43.8%) | 2,645 (34.7%) |
| 3 or more Vehicles | 7,658 (40.0%) | 1,070 (14.0%) |
| Total | 19,128 (100.0%) | 7,626 (100.0%) |
Real Estate & Mortgages in Layton
Real Estate and Mortgage Overview in Layton
| Characteristic | Without Mortgage | With Mortgage |
| Housing Units | 5,625 | 13,503 |
| Median Property Value | $366,300 | $395,700 |
| Median Household Income | $88,524 | $4,551 |
| Monthly Housing Costs | $513 | $968 |
| Real Estate Taxes | $2,155 | $342 |
Property Value by Mortgage Status in Layton
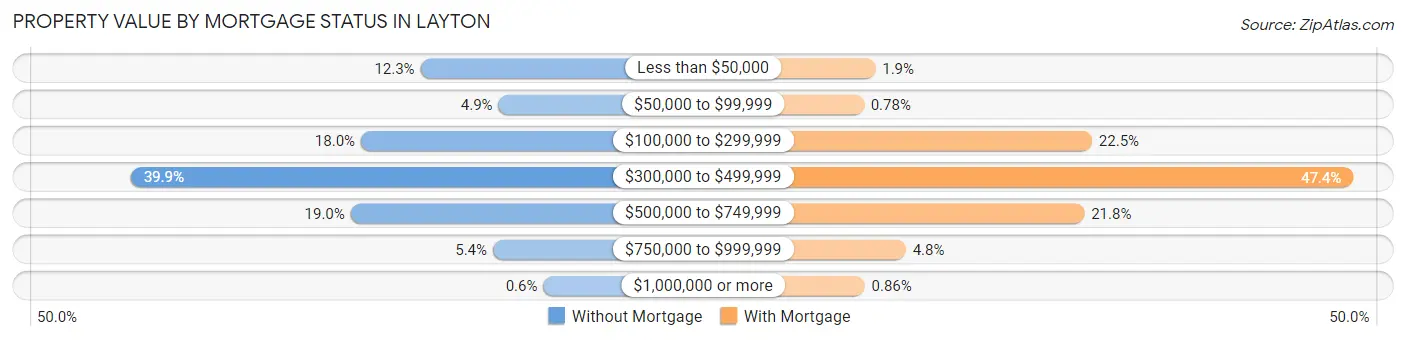
| Property Value | Without Mortgage | With Mortgage |
| Less than $50,000 | 692 (12.3%) | 254 (1.9%) |
| $50,000 to $99,999 | 274 (4.9%) | 105 (0.8%) |
| $100,000 to $299,999 | 1,011 (18.0%) | 3,040 (22.5%) |
| $300,000 to $499,999 | 2,244 (39.9%) | 6,401 (47.4%) |
| $500,000 to $749,999 | 1,066 (19.0%) | 2,941 (21.8%) |
| $750,000 to $999,999 | 304 (5.4%) | 646 (4.8%) |
| $1,000,000 or more | 34 (0.6%) | 116 (0.9%) |
| Total | 5,625 (100.0%) | 13,503 (100.0%) |
Household Income by Mortgage Status in Layton
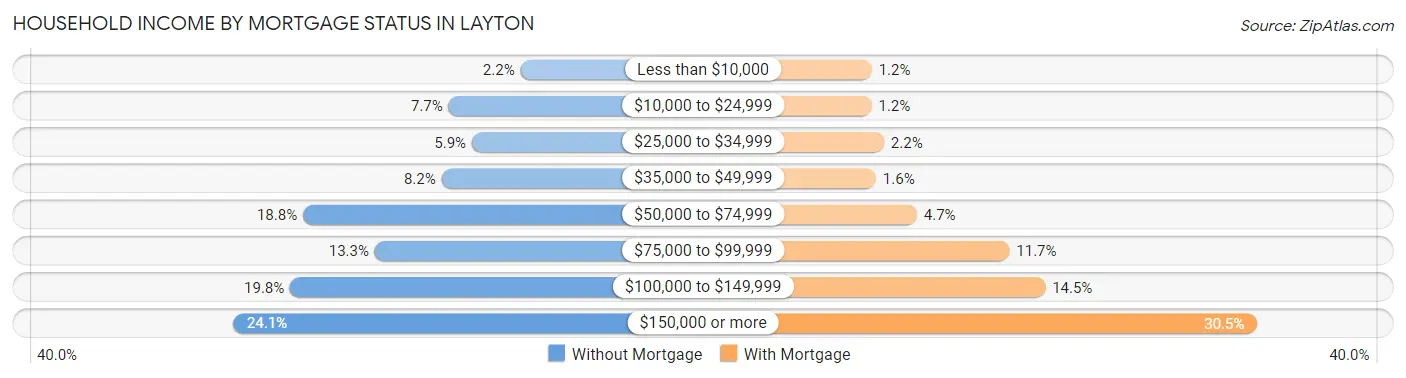
| Household Income | Without Mortgage | With Mortgage |
| Less than $10,000 | 125 (2.2%) | 166 (1.2%) |
| $10,000 to $24,999 | 433 (7.7%) | 165 (1.2%) |
| $25,000 to $34,999 | 333 (5.9%) | 292 (2.2%) |
| $35,000 to $49,999 | 463 (8.2%) | 209 (1.5%) |
| $50,000 to $74,999 | 1,057 (18.8%) | 630 (4.7%) |
| $75,000 to $99,999 | 749 (13.3%) | 1,582 (11.7%) |
| $100,000 to $149,999 | 1,112 (19.8%) | 1,951 (14.4%) |
| $150,000 or more | 1,353 (24.0%) | 4,123 (30.5%) |
| Total | 5,625 (100.0%) | 13,503 (100.0%) |
Property Value to Household Income Ratio in Layton
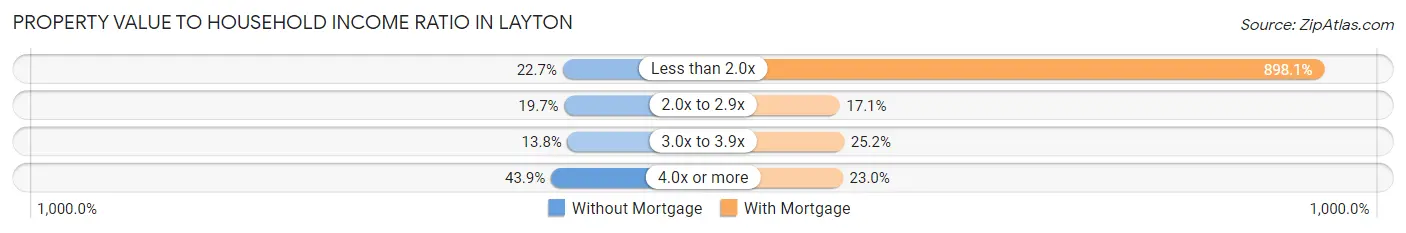
| Value-to-Income Ratio | Without Mortgage | With Mortgage |
| Less than 2.0x | 1,277 (22.7%) | 121,268 (898.1%) |
| 2.0x to 2.9x | 1,106 (19.7%) | 2,312 (17.1%) |
| 3.0x to 3.9x | 775 (13.8%) | 3,406 (25.2%) |
| 4.0x or more | 2,467 (43.9%) | 3,104 (23.0%) |
| Total | 5,625 (100.0%) | 13,503 (100.0%) |
Real Estate Taxes by Mortgage Status in Layton
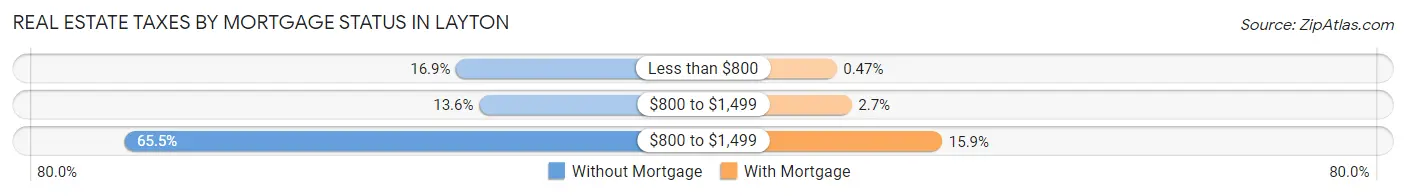
| Property Taxes | Without Mortgage | With Mortgage |
| Less than $800 | 952 (16.9%) | 64 (0.5%) |
| $800 to $1,499 | 763 (13.6%) | 360 (2.7%) |
| $800 to $1,499 | 3,683 (65.5%) | 2,147 (15.9%) |
| Total | 5,625 (100.0%) | 13,503 (100.0%) |
Health & Disability in Layton
Health Insurance Coverage by Age in Layton
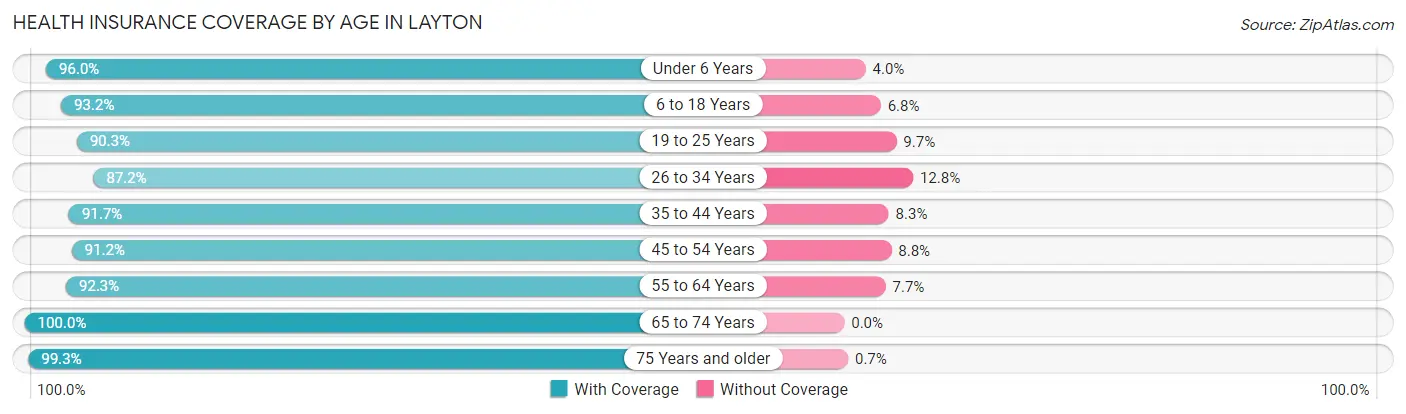
| Age Bracket | With Coverage | Without Coverage |
| Under 6 Years | 6,535 (96.0%) | 271 (4.0%) |
| 6 to 18 Years | 17,530 (93.2%) | 1,276 (6.8%) |
| 19 to 25 Years | 6,932 (90.3%) | 746 (9.7%) |
| 26 to 34 Years | 9,258 (87.2%) | 1,360 (12.8%) |
| 35 to 44 Years | 11,217 (91.7%) | 1,011 (8.3%) |
| 45 to 54 Years | 8,852 (91.2%) | 852 (8.8%) |
| 55 to 64 Years | 6,546 (92.3%) | 546 (7.7%) |
| 65 to 74 Years | 5,053 (100.0%) | 0 (0.0%) |
| 75 Years and older | 2,837 (99.3%) | 20 (0.7%) |
| Total | 74,760 (92.5%) | 6,082 (7.5%) |
Health Insurance Coverage by Citizenship Status in Layton
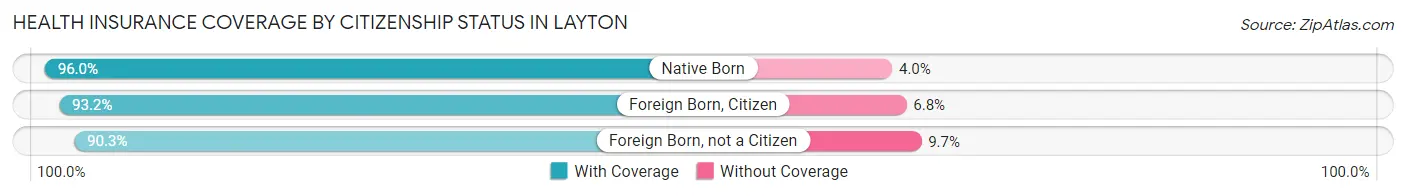
| Citizenship Status | With Coverage | Without Coverage |
| Native Born | 6,535 (96.0%) | 271 (4.0%) |
| Foreign Born, Citizen | 17,530 (93.2%) | 1,276 (6.8%) |
| Foreign Born, not a Citizen | 6,932 (90.3%) | 746 (9.7%) |
Health Insurance Coverage by Household Income in Layton
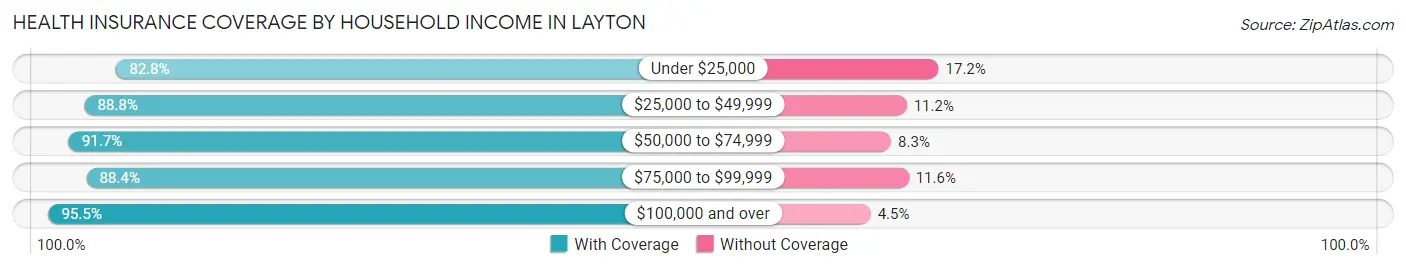
| Household Income | With Coverage | Without Coverage |
| Under $25,000 | 4,144 (82.8%) | 861 (17.2%) |
| $25,000 to $49,999 | 5,596 (88.8%) | 708 (11.2%) |
| $50,000 to $74,999 | 10,768 (91.7%) | 976 (8.3%) |
| $75,000 to $99,999 | 11,862 (88.4%) | 1,556 (11.6%) |
| $100,000 and over | 42,283 (95.5%) | 1,981 (4.5%) |
Public vs Private Health Insurance Coverage by Age in Layton
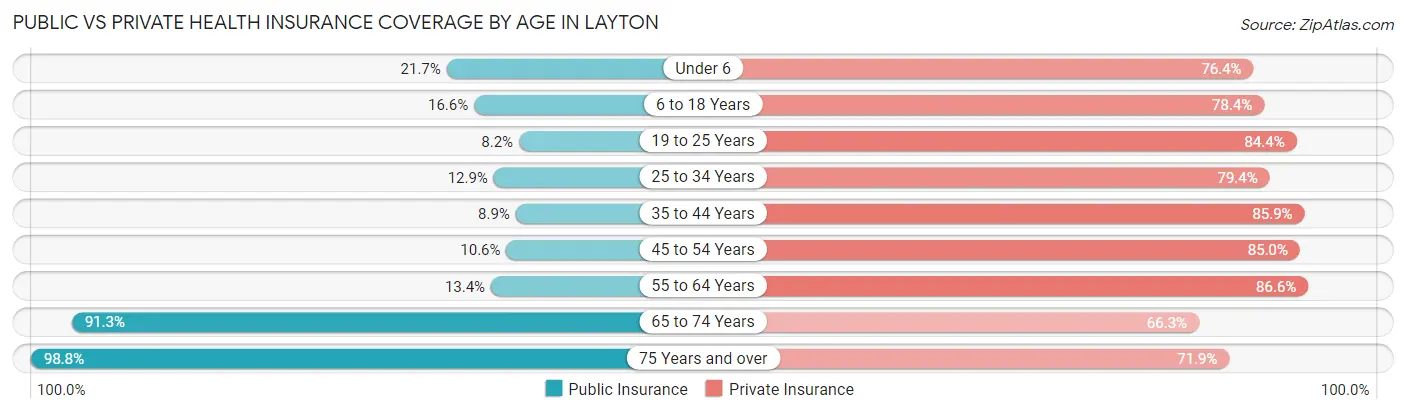
| Age Bracket | Public Insurance | Private Insurance |
| Under 6 | 1,475 (21.7%) | 5,200 (76.4%) |
| 6 to 18 Years | 3,116 (16.6%) | 14,742 (78.4%) |
| 19 to 25 Years | 633 (8.2%) | 6,480 (84.4%) |
| 25 to 34 Years | 1,373 (12.9%) | 8,430 (79.4%) |
| 35 to 44 Years | 1,082 (8.8%) | 10,500 (85.9%) |
| 45 to 54 Years | 1,027 (10.6%) | 8,250 (85.0%) |
| 55 to 64 Years | 953 (13.4%) | 6,139 (86.6%) |
| 65 to 74 Years | 4,611 (91.2%) | 3,349 (66.3%) |
| 75 Years and over | 2,824 (98.8%) | 2,055 (71.9%) |
| Total | 17,094 (21.1%) | 65,145 (80.6%) |
Disability Status by Sex by Age in Layton
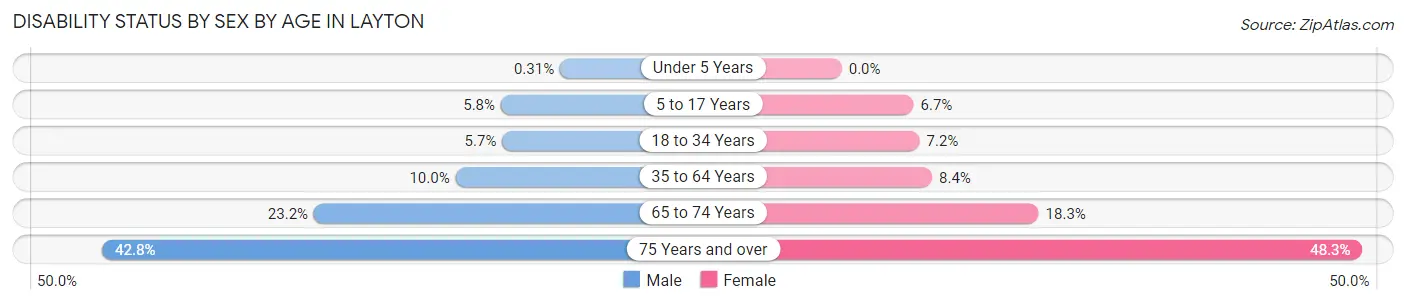
| Age Bracket | Male | Female |
| Under 5 Years | 9 (0.3%) | 0 (0.0%) |
| 5 to 17 Years | 557 (5.8%) | 600 (6.7%) |
| 18 to 34 Years | 569 (5.7%) | 711 (7.2%) |
| 35 to 64 Years | 1,472 (10.0%) | 1,200 (8.4%) |
| 65 to 74 Years | 569 (23.2%) | 474 (18.3%) |
| 75 Years and over | 514 (42.8%) | 800 (48.3%) |
Disability Class by Sex by Age in Layton
Disability Class: Hearing Difficulty
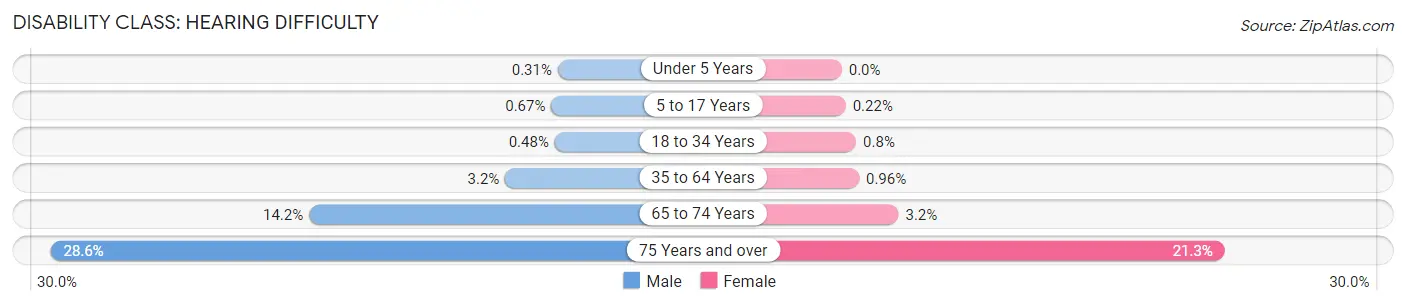
| Age Bracket | Male | Female |
| Under 5 Years | 9 (0.3%) | 0 (0.0%) |
| 5 to 17 Years | 64 (0.7%) | 20 (0.2%) |
| 18 to 34 Years | 48 (0.5%) | 79 (0.8%) |
| 35 to 64 Years | 477 (3.2%) | 138 (1.0%) |
| 65 to 74 Years | 348 (14.2%) | 82 (3.2%) |
| 75 Years and over | 343 (28.6%) | 353 (21.3%) |
Disability Class: Vision Difficulty
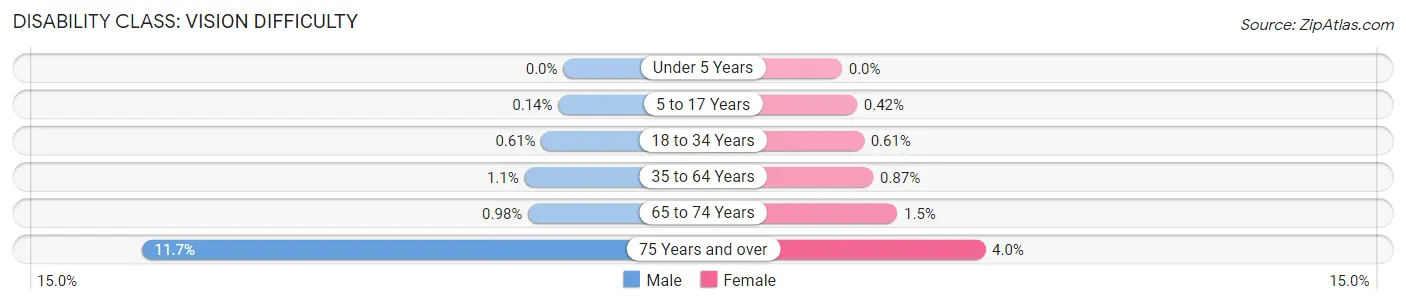
| Age Bracket | Male | Female |
| Under 5 Years | 0 (0.0%) | 0 (0.0%) |
| 5 to 17 Years | 13 (0.1%) | 38 (0.4%) |
| 18 to 34 Years | 61 (0.6%) | 60 (0.6%) |
| 35 to 64 Years | 159 (1.1%) | 124 (0.9%) |
| 65 to 74 Years | 24 (1.0%) | 40 (1.5%) |
| 75 Years and over | 141 (11.7%) | 66 (4.0%) |
Disability Class: Cognitive Difficulty
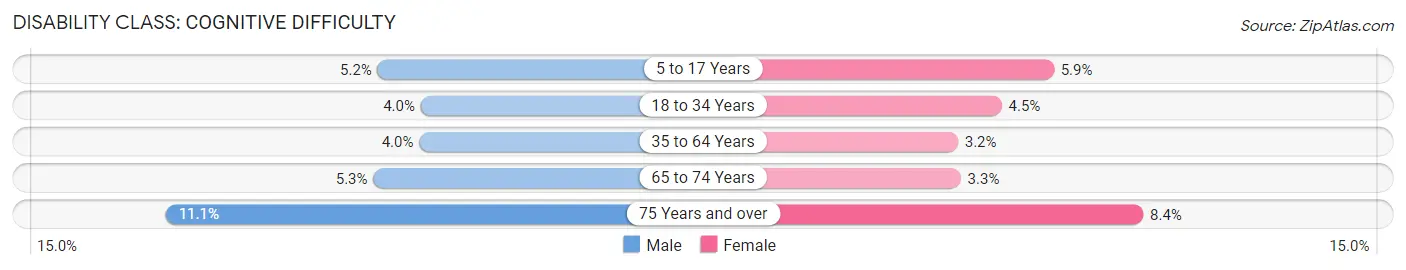
| Age Bracket | Male | Female |
| 5 to 17 Years | 497 (5.2%) | 532 (5.9%) |
| 18 to 34 Years | 399 (4.0%) | 438 (4.4%) |
| 35 to 64 Years | 590 (4.0%) | 463 (3.2%) |
| 65 to 74 Years | 130 (5.3%) | 86 (3.3%) |
| 75 Years and over | 133 (11.1%) | 139 (8.4%) |
Disability Class: Ambulatory Difficulty
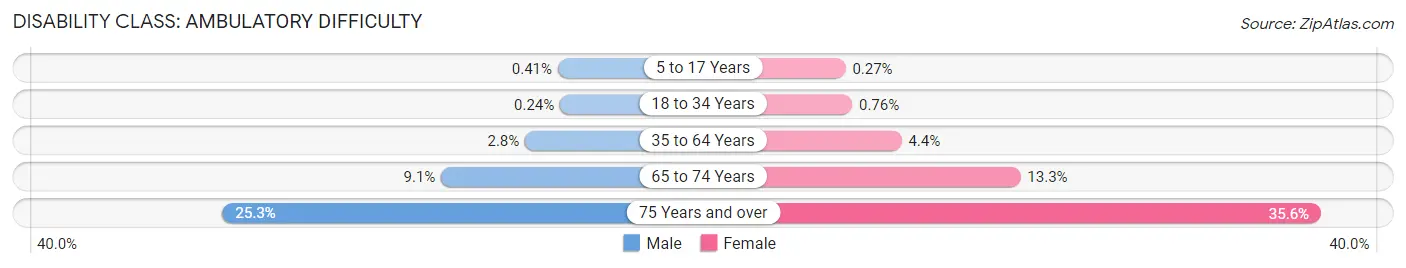
| Age Bracket | Male | Female |
| 5 to 17 Years | 39 (0.4%) | 24 (0.3%) |
| 18 to 34 Years | 24 (0.2%) | 75 (0.8%) |
| 35 to 64 Years | 417 (2.8%) | 634 (4.4%) |
| 65 to 74 Years | 223 (9.1%) | 344 (13.3%) |
| 75 Years and over | 304 (25.3%) | 589 (35.6%) |
Disability Class: Self-Care Difficulty
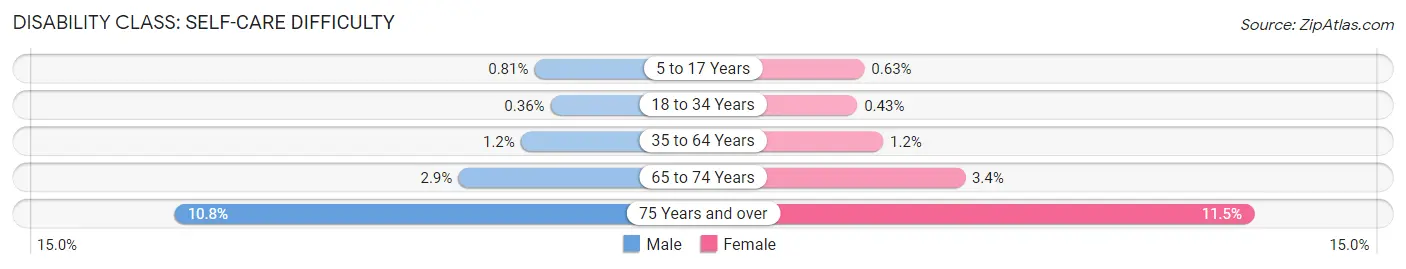
| Age Bracket | Male | Female |
| 5 to 17 Years | 78 (0.8%) | 57 (0.6%) |
| 18 to 34 Years | 36 (0.4%) | 42 (0.4%) |
| 35 to 64 Years | 175 (1.2%) | 164 (1.1%) |
| 65 to 74 Years | 72 (2.9%) | 89 (3.4%) |
| 75 Years and over | 130 (10.8%) | 190 (11.5%) |
Technology Access in Layton
Computing Device Access in Layton
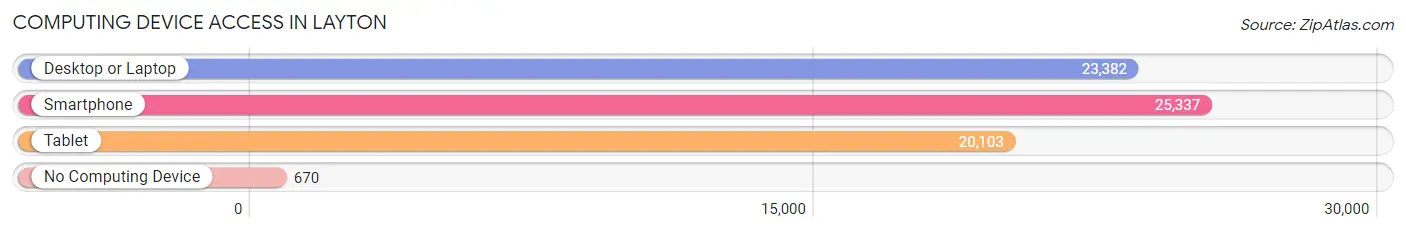
| Device Type | # Households | % Households |
| Desktop or Laptop | 23,382 | 87.4% |
| Smartphone | 25,337 | 94.7% |
| Tablet | 20,103 | 75.1% |
| No Computing Device | 670 | 2.5% |
| Total | 26,754 | 100.0% |
Internet Access in Layton
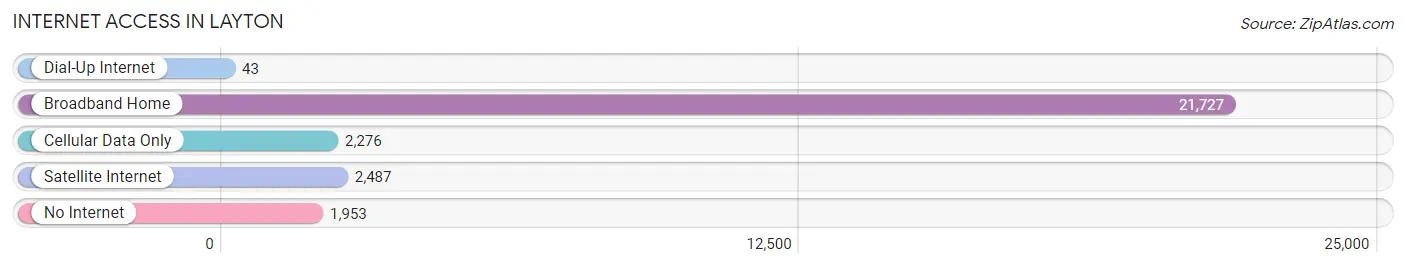
| Internet Type | # Households | % Households |
| Dial-Up Internet | 43 | 0.2% |
| Broadband Home | 21,727 | 81.2% |
| Cellular Data Only | 2,276 | 8.5% |
| Satellite Internet | 2,487 | 9.3% |
| No Internet | 1,953 | 7.3% |
| Total | 26,754 | 100.0% |
Layton Summary
Layton, Utah is a city located in Davis County, Utah, United States. It is part of the Ogden-Clearfield Metropolitan Statistical Area. As of the 2010 census, the city had a population of 67,311, making it the ninth-largest city in Utah.
Geography
Layton is located at the northern end of Davis County, approximately 20 miles north of Salt Lake City. It is bordered by Clearfield to the west, Kaysville to the south, Fruit Heights to the east, and the Wasatch Mountains to the north. The city covers an area of 24.2 square miles, with an elevation of 4,539 feet.
The city is situated in a valley between the Wasatch Mountains and the Great Salt Lake. The city is crossed by several major highways, including Interstate 15, U.S. Route 89, and U.S. Route 191.
Climate
Layton has a semi-arid climate, with hot summers and cold winters. The average annual temperature is 50.2°F, with an average high of 66.2°F in July and an average low of 34.2°F in January. The average annual precipitation is 17.2 inches, with an average of 24.3 inches of snowfall per year.
Demographics
As of the 2010 census, there were 67,311 people, 22,845 households, and 18,845 families residing in the city. The population density was 2,811.3 people per square mile. The racial makeup of the city was 90.2% White, 1.2% African American, 0.7% Native American, 2.2% Asian, 0.2% Pacific Islander, 3.2% from other races, and 2.3% from two or more races. Hispanic or Latino of any race were 6.7% of the population.
Economy
Layton is home to several major employers, including Hill Air Force Base, Davis Applied Technology College, and the Layton City Corporation. The city is also home to several retail and commercial businesses, including the Layton Hills Mall, the Layton Hills Cinema, and the Layton Hills Golf Course.
The median household income in Layton was $63,945 in 2017, and the median family income was $76,945. The per capita income was $27,945. The unemployment rate was 3.2% in 2017.
History
Layton was first settled in 1850 by the Mormon pioneers. The city was named after Christopher Layton, a Mormon leader and early settler of the area. The city was incorporated in 1920, and the population grew steadily throughout the 20th century.
Layton experienced rapid growth in the 1990s and 2000s, due in part to its proximity to Hill Air Force Base. The city has continued to grow in recent years, and is now the ninth-largest city in Utah.
Common Questions
What is Per Capita Income in Layton?
Per Capita income in Layton is $38,275.
What is the Median Family Income in Layton?
Median Family Income in Layton is $106,600.
What is the Median Household income in Layton?
Median Household Income in Layton is $93,453.
What is Income or Wage Gap in Layton?
Income or Wage Gap in Layton is 46.3%.
Women in Layton earn 53.7 cents for every dollar earned by a man.
What is Inequality or Gini Index in Layton?
Inequality or Gini Index in Layton is 0.39.
What is the Total Population of Layton?
Total Population of Layton is 81,726.
What is the Total Male Population of Layton?
Total Male Population of Layton is 41,536.
What is the Total Female Population of Layton?
Total Female Population of Layton is 40,190.
What is the Ratio of Males per 100 Females in Layton?
There are 103.35 Males per 100 Females in Layton.
What is the Ratio of Females per 100 Males in Layton?
There are 96.76 Females per 100 Males in Layton.
What is the Median Population Age in Layton?
Median Population Age in Layton is 31.9 Years.
What is the Average Family Size in Layton
Average Family Size in Layton is 3.5 People.
What is the Average Household Size in Layton
Average Household Size in Layton is 3.0 People.
How Large is the Labor Force in Layton?
There are 44,237 People in the Labor Forcein in Layton.
What is the Percentage of People in the Labor Force in Layton?
73.0% of People are in the Labor Force in Layton.
What is the Unemployment Rate in Layton?
Unemployment Rate in Layton is 2.3%.