Lincoln City, OR Map & Demographics
Lincoln City Map
Lincoln City Overview
$38,282
PER CAPITA INCOME
$67,448
AVG FAMILY INCOME
$54,210
AVG HOUSEHOLD INCOME
7.4%
WAGE / INCOME GAP [ % ]
92.6¢/ $1
WAGE / INCOME GAP [ $ ]
0.53
INEQUALITY / GINI INDEX
9,790
TOTAL POPULATION
4,608
MALE POPULATION
5,182
FEMALE POPULATION
88.92
MALES / 100 FEMALES
112.46
FEMALES / 100 MALES
50.6
MEDIAN AGE
2.9
AVG FAMILY SIZE
2.2
AVG HOUSEHOLD SIZE
4,362
LABOR FORCE [ PEOPLE ]
52.4%
PERCENT IN LABOR FORCE
3.9%
UNEMPLOYMENT RATE
Lincoln City Zip Codes
Lincoln City Area Codes
Income in Lincoln City
Income Overview in Lincoln City
Per Capita Income in Lincoln City is $38,282, while median incomes of families and households are $67,448 and $54,210 respectively.
| Characteristic | Number | Measure |
| Per Capita Income | 9,790 | $38,282 |
| Median Family Income | 2,394 | $67,448 |
| Mean Family Income | 2,394 | $116,015 |
| Median Household Income | 4,291 | $54,210 |
| Mean Household Income | 4,291 | $85,854 |
| Income Deficit | 2,394 | $0 |
| Wage / Income Gap (%) | 9,790 | 7.40% |
| Wage / Income Gap ($) | 9,790 | 92.60¢ per $1 |
| Gini / Inequality Index | 9,790 | 0.53 |
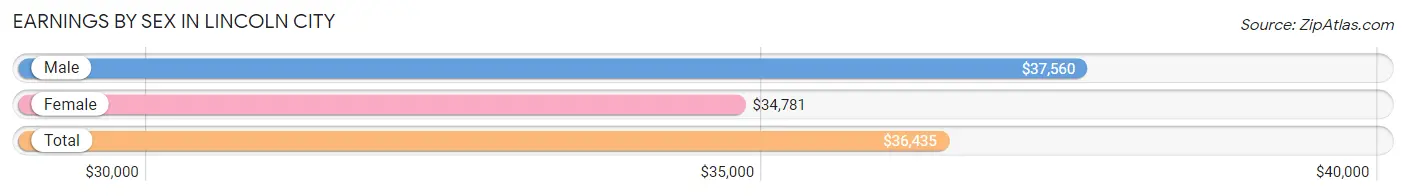
Earnings by Sex in Lincoln City
Average Earnings in Lincoln City are $36,435, $37,560 for men and $34,781 for women, a difference of 7.4%.
| Sex | Number | Average Earnings |
| Male | 2,188 (47.3%) | $37,560 |
| Female | 2,433 (52.6%) | $34,781 |
| Total | 4,621 (100.0%) | $36,435 |
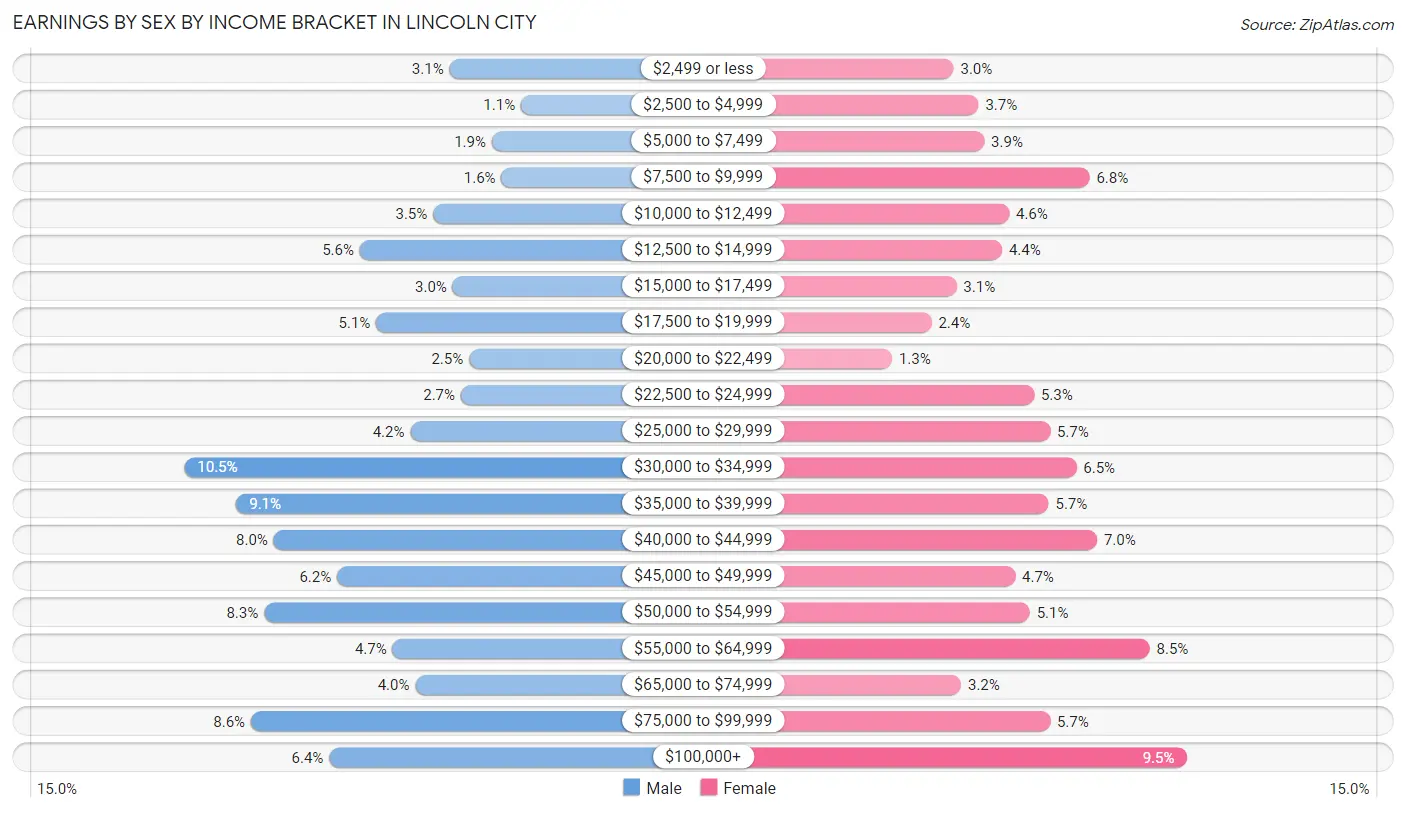
Earnings by Sex by Income Bracket in Lincoln City
The most common earnings brackets in Lincoln City are $30,000 to $34,999 for men (230 | 10.5%) and $100,000+ for women (232 | 9.5%).
| Income | Male | Female |
| $2,499 or less | 67 (3.1%) | 73 (3.0%) |
| $2,500 to $4,999 | 23 (1.1%) | 90 (3.7%) |
| $5,000 to $7,499 | 41 (1.9%) | 94 (3.9%) |
| $7,500 to $9,999 | 35 (1.6%) | 166 (6.8%) |
| $10,000 to $12,499 | 77 (3.5%) | 111 (4.6%) |
| $12,500 to $14,999 | 122 (5.6%) | 106 (4.4%) |
| $15,000 to $17,499 | 65 (3.0%) | 75 (3.1%) |
| $17,500 to $19,999 | 112 (5.1%) | 58 (2.4%) |
| $20,000 to $22,499 | 55 (2.5%) | 31 (1.3%) |
| $22,500 to $24,999 | 60 (2.7%) | 128 (5.3%) |
| $25,000 to $29,999 | 91 (4.2%) | 139 (5.7%) |
| $30,000 to $34,999 | 230 (10.5%) | 157 (6.5%) |
| $35,000 to $39,999 | 198 (9.0%) | 138 (5.7%) |
| $40,000 to $44,999 | 175 (8.0%) | 171 (7.0%) |
| $45,000 to $49,999 | 136 (6.2%) | 115 (4.7%) |
| $50,000 to $54,999 | 181 (8.3%) | 125 (5.1%) |
| $55,000 to $64,999 | 102 (4.7%) | 207 (8.5%) |
| $65,000 to $74,999 | 88 (4.0%) | 78 (3.2%) |
| $75,000 to $99,999 | 189 (8.6%) | 139 (5.7%) |
| $100,000+ | 141 (6.4%) | 232 (9.5%) |
| Total | 2,188 (100.0%) | 2,433 (100.0%) |
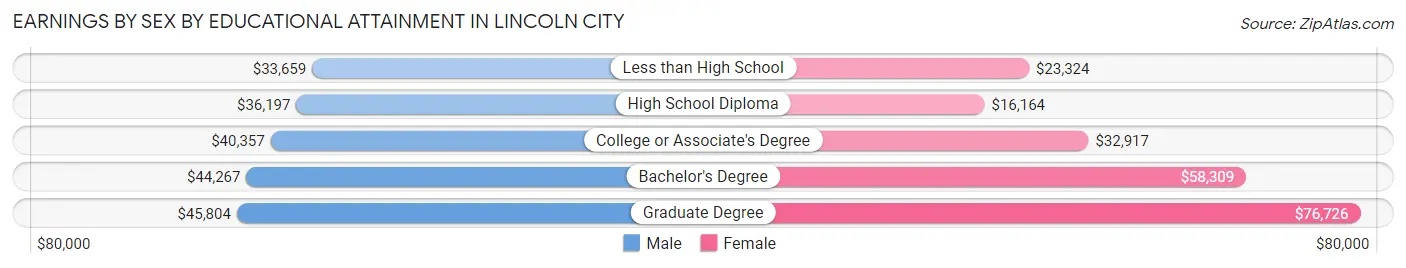
Earnings by Sex by Educational Attainment in Lincoln City
Average earnings in Lincoln City are $39,717 for men and $37,040 for women, a difference of 6.7%. Men with an educational attainment of graduate degree enjoy the highest average annual earnings of $45,804, while those with less than high school education earn the least with $33,659. Women with an educational attainment of graduate degree earn the most with the average annual earnings of $76,726, while those with high school diploma education have the smallest earnings of $16,164.
| Educational Attainment | Male Income | Female Income |
| Less than High School | $33,659 | $23,324 |
| High School Diploma | $36,197 | $16,164 |
| College or Associate's Degree | $40,357 | $32,917 |
| Bachelor's Degree | $44,267 | $58,309 |
| Graduate Degree | $45,804 | $76,726 |
| Total | $39,717 | $37,040 |
Family Income in Lincoln City
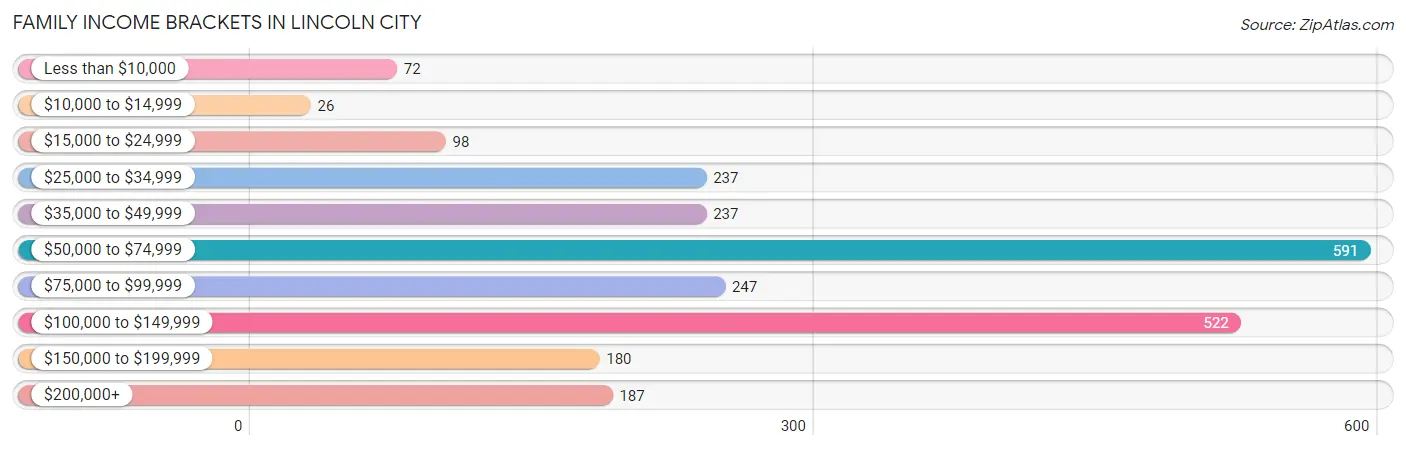
Family Income Brackets in Lincoln City
According to the Lincoln City family income data, there are 591 families falling into the $50,000 to $74,999 income range, which is the most common income bracket and makes up 24.7% of all families. Conversely, the $10,000 to $14,999 income bracket is the least frequent group with only 26 families (1.1%) belonging to this category.
| Income Bracket | # Families | % Families |
| Less than $10,000 | 72 | 3.0% |
| $10,000 to $14,999 | 26 | 1.1% |
| $15,000 to $24,999 | 98 | 4.1% |
| $25,000 to $34,999 | 237 | 9.9% |
| $35,000 to $49,999 | 237 | 9.9% |
| $50,000 to $74,999 | 591 | 24.7% |
| $75,000 to $99,999 | 247 | 10.3% |
| $100,000 to $149,999 | 522 | 21.8% |
| $150,000 to $199,999 | 180 | 7.5% |
| $200,000+ | 187 | 7.8% |
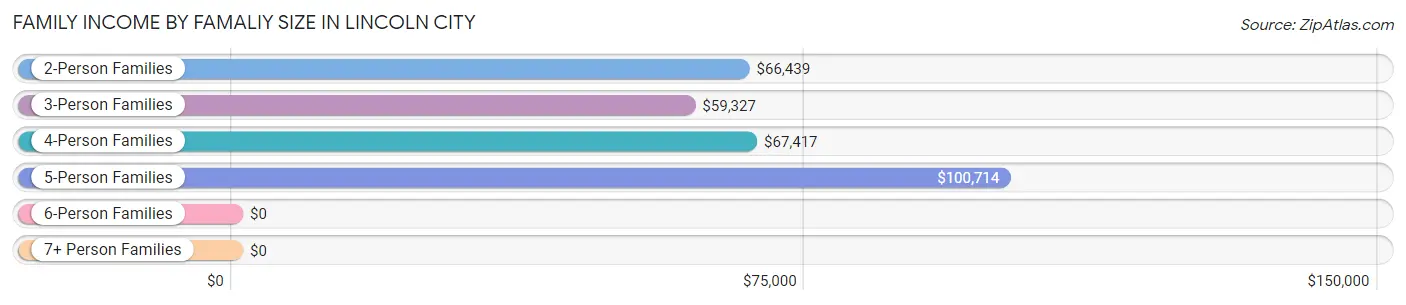
Family Income by Famaliy Size in Lincoln City
5-person families (66 | 2.8%) account for the highest median family income in Lincoln City with $100,714 per family, while 2-person families (1,500 | 62.7%) have the highest median income of $33,220 per family member.
| Income Bracket | # Families | Median Income |
| 2-Person Families | 1,500 (62.7%) | $66,439 |
| 3-Person Families | 421 (17.6%) | $59,327 |
| 4-Person Families | 344 (14.4%) | $67,417 |
| 5-Person Families | 66 (2.8%) | $100,714 |
| 6-Person Families | 42 (1.8%) | $0 |
| 7+ Person Families | 21 (0.9%) | $0 |
| Total | 2,394 (100.0%) | $67,448 |
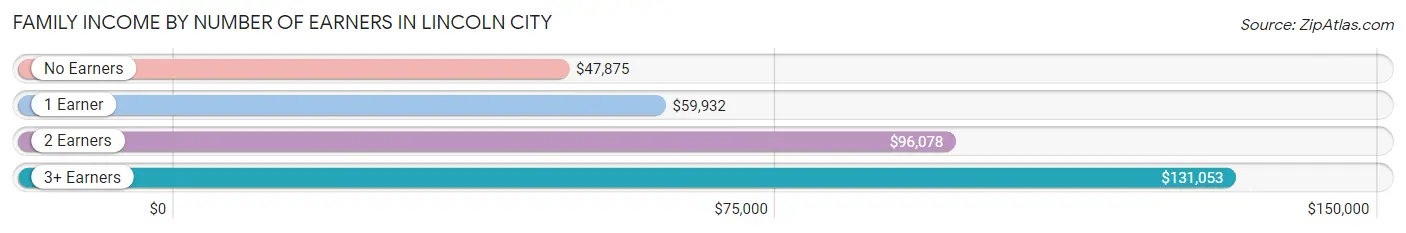
Family Income by Number of Earners in Lincoln City
The median family income in Lincoln City is $67,448, with families comprising 3+ earners (198) having the highest median family income of $131,053, while families with no earners (697) have the lowest median family income of $47,875, accounting for 8.3% and 29.1% of families, respectively.
| Number of Earners | # Families | Median Income |
| No Earners | 697 (29.1%) | $47,875 |
| 1 Earner | 676 (28.2%) | $59,932 |
| 2 Earners | 823 (34.4%) | $96,078 |
| 3+ Earners | 198 (8.3%) | $131,053 |
| Total | 2,394 (100.0%) | $67,448 |
Household Income in Lincoln City
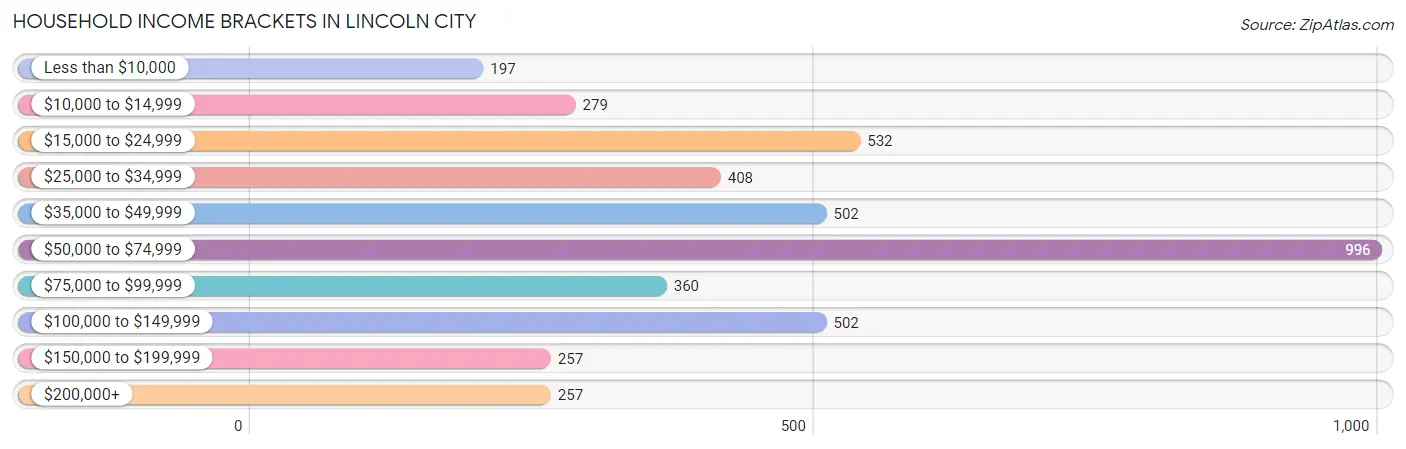
Household Income Brackets in Lincoln City
With 996 households falling in the category, the $50,000 to $74,999 income range is the most frequent in Lincoln City, accounting for 23.2% of all households. In contrast, only 197 households (4.6%) fall into the less than $10,000 income bracket, making it the least populous group.
| Income Bracket | # Households | % Households |
| Less than $10,000 | 197 | 4.6% |
| $10,000 to $14,999 | 279 | 6.5% |
| $15,000 to $24,999 | 532 | 12.4% |
| $25,000 to $34,999 | 408 | 9.5% |
| $35,000 to $49,999 | 502 | 11.7% |
| $50,000 to $74,999 | 996 | 23.2% |
| $75,000 to $99,999 | 360 | 8.4% |
| $100,000 to $149,999 | 502 | 11.7% |
| $150,000 to $199,999 | 257 | 6.0% |
| $200,000+ | 257 | 6.0% |
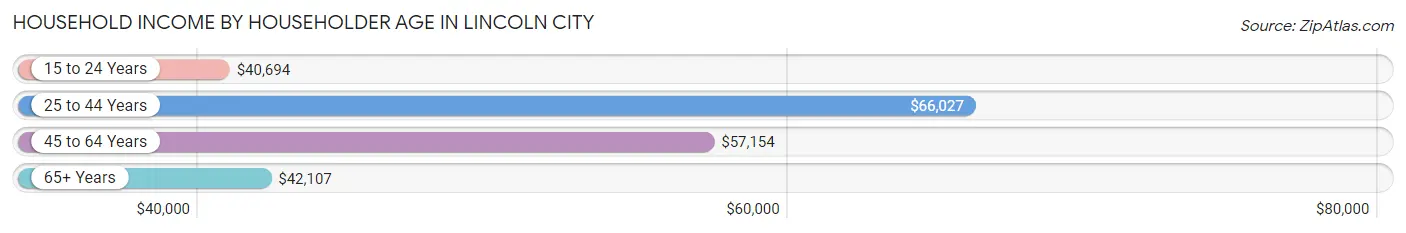
Household Income by Householder Age in Lincoln City
The median household income in Lincoln City is $54,210, with the highest median household income of $66,027 found in the 25 to 44 years age bracket for the primary householder. A total of 870 households (20.3%) fall into this category. Meanwhile, the 15 to 24 years age bracket for the primary householder has the lowest median household income of $40,694, with 85 households (2.0%) in this group.
| Income Bracket | # Households | Median Income |
| 15 to 24 Years | 85 (2.0%) | $40,694 |
| 25 to 44 Years | 870 (20.3%) | $66,027 |
| 45 to 64 Years | 1,507 (35.1%) | $57,154 |
| 65+ Years | 1,829 (42.6%) | $42,107 |
| Total | 4,291 (100.0%) | $54,210 |
Poverty in Lincoln City
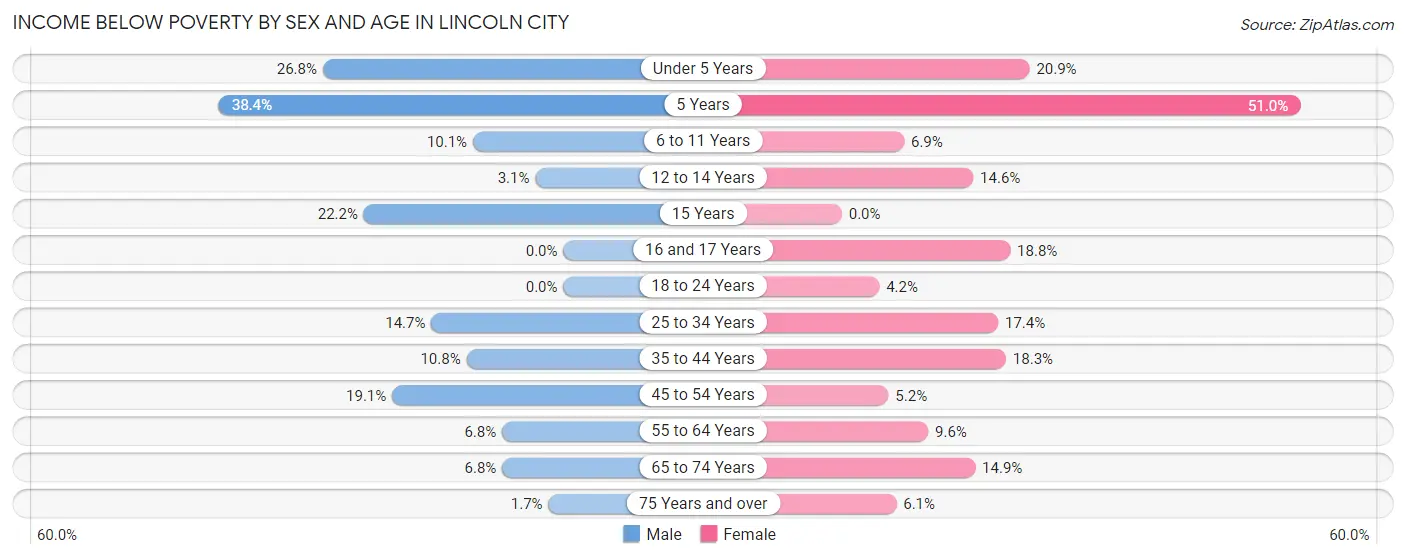
Income Below Poverty by Sex and Age in Lincoln City
With 10.8% poverty level for males and 12.8% for females among the residents of Lincoln City, 5 year old males and 5 year old females are the most vulnerable to poverty, with 33 males (38.4%) and 49 females (51.0%) in their respective age groups living below the poverty level.
| Age Bracket | Male | Female |
| Under 5 Years | 60 (26.8%) | 37 (20.9%) |
| 5 Years | 33 (38.4%) | 49 (51.0%) |
| 6 to 11 Years | 42 (10.1%) | 14 (6.9%) |
| 12 to 14 Years | 2 (3.1%) | 18 (14.6%) |
| 15 Years | 4 (22.2%) | 0 (0.0%) |
| 16 and 17 Years | 0 (0.0%) | 3 (18.8%) |
| 18 to 24 Years | 0 (0.0%) | 10 (4.2%) |
| 25 to 34 Years | 70 (14.7%) | 107 (17.4%) |
| 35 to 44 Years | 52 (10.8%) | 113 (18.3%) |
| 45 to 54 Years | 123 (19.1%) | 27 (5.2%) |
| 55 to 64 Years | 38 (6.8%) | 95 (9.6%) |
| 65 to 74 Years | 62 (6.8%) | 158 (14.8%) |
| 75 Years and over | 6 (1.7%) | 27 (6.1%) |
| Total | 492 (10.8%) | 658 (12.8%) |
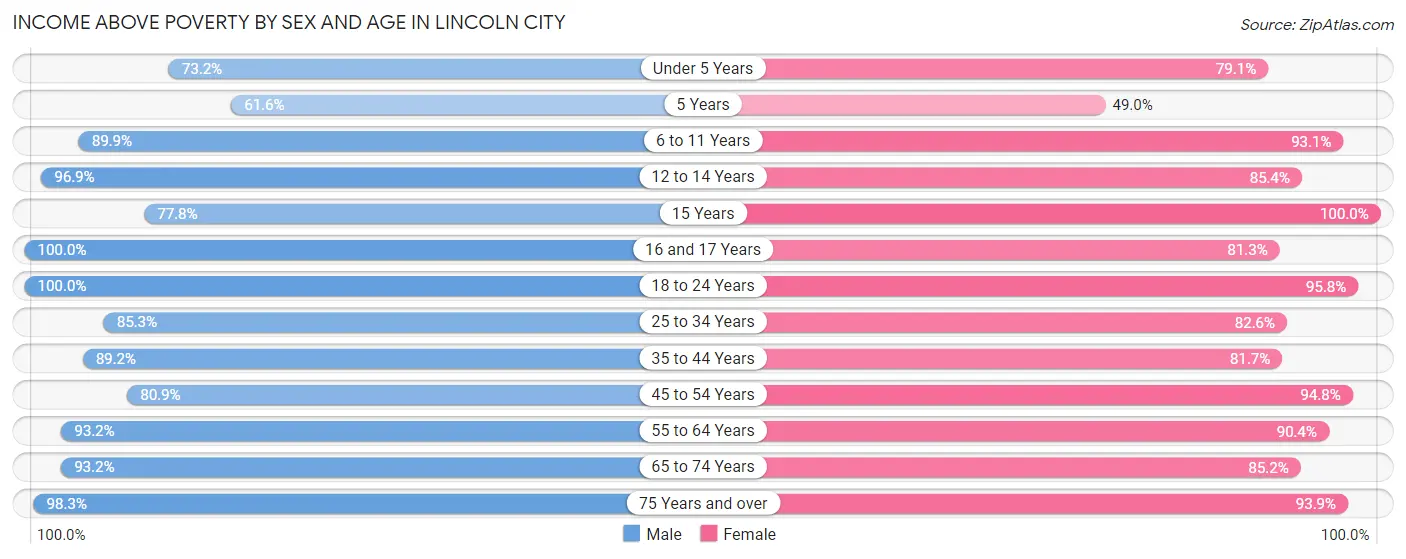
Income Above Poverty by Sex and Age in Lincoln City
According to the poverty statistics in Lincoln City, males aged 16 and 17 years and females aged 15 years are the age groups that are most secure financially, with 100.0% of males and 100.0% of females in these age groups living above the poverty line.
| Age Bracket | Male | Female |
| Under 5 Years | 164 (73.2%) | 140 (79.1%) |
| 5 Years | 53 (61.6%) | 47 (49.0%) |
| 6 to 11 Years | 375 (89.9%) | 188 (93.1%) |
| 12 to 14 Years | 62 (96.9%) | 105 (85.4%) |
| 15 Years | 14 (77.8%) | 49 (100.0%) |
| 16 and 17 Years | 118 (100.0%) | 13 (81.2%) |
| 18 to 24 Years | 175 (100.0%) | 230 (95.8%) |
| 25 to 34 Years | 406 (85.3%) | 508 (82.6%) |
| 35 to 44 Years | 430 (89.2%) | 505 (81.7%) |
| 45 to 54 Years | 522 (80.9%) | 493 (94.8%) |
| 55 to 64 Years | 518 (93.2%) | 894 (90.4%) |
| 65 to 74 Years | 849 (93.2%) | 906 (85.2%) |
| 75 Years and over | 356 (98.3%) | 418 (93.9%) |
| Total | 4,042 (89.1%) | 4,496 (87.2%) |
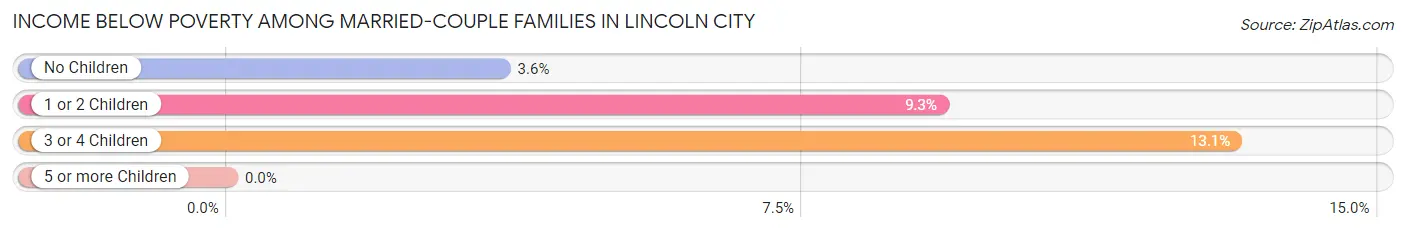
Income Below Poverty Among Married-Couple Families in Lincoln City
The poverty statistics for married-couple families in Lincoln City show that 5.0% or 90 of the total 1,812 families live below the poverty line. Families with 3 or 4 children have the highest poverty rate of 13.1%, comprising of 8 families. On the other hand, families with no children have the lowest poverty rate of 3.6%, which includes 50 families.
| Children | Above Poverty | Below Poverty |
| No Children | 1,356 (96.4%) | 50 (3.6%) |
| 1 or 2 Children | 313 (90.7%) | 32 (9.3%) |
| 3 or 4 Children | 53 (86.9%) | 8 (13.1%) |
| 5 or more Children | 0 (0.0%) | 0 (0.0%) |
| Total | 1,722 (95.0%) | 90 (5.0%) |
Income Below Poverty Among Single-Parent Households in Lincoln City
According to the poverty data in Lincoln City, 12.2% or 18 single-father households and 15.2% or 66 single-mother households are living below the poverty line. Among single-father households, those with 3 or 4 children have the highest poverty rate, with 9 households (81.8%) experiencing poverty. Likewise, among single-mother households, those with 3 or 4 children have the highest poverty rate, with 1 households (100.0%) falling below the poverty line.
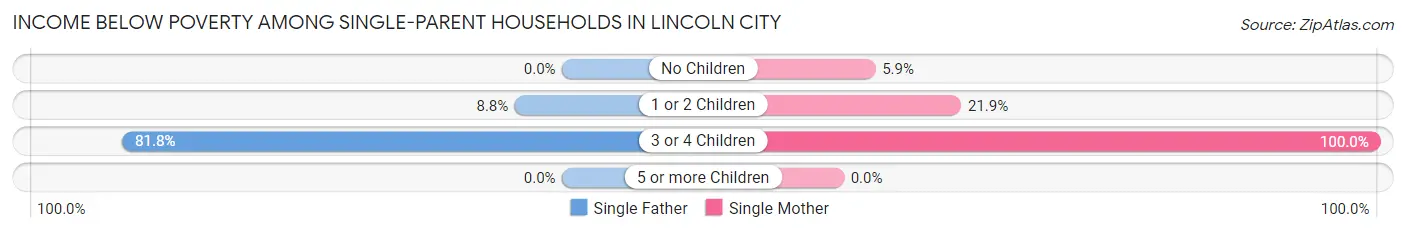
| Children | Single Father | Single Mother |
| No Children | 0 (0.0%) | 11 (5.9%) |
| 1 or 2 Children | 9 (8.8%) | 54 (21.9%) |
| 3 or 4 Children | 9 (81.8%) | 1 (100.0%) |
| 5 or more Children | 0 (0.0%) | 0 (0.0%) |
| Total | 18 (12.2%) | 66 (15.2%) |
Income Below Poverty Among Married-Couple vs Single-Parent Households in Lincoln City
The poverty data for Lincoln City shows that 90 of the married-couple family households (5.0%) and 84 of the single-parent households (14.4%) are living below the poverty level. Within the married-couple family households, those with 3 or 4 children have the highest poverty rate, with 8 households (13.1%) falling below the poverty line. Among the single-parent households, those with 3 or 4 children have the highest poverty rate, with 10 household (83.3%) living below poverty.
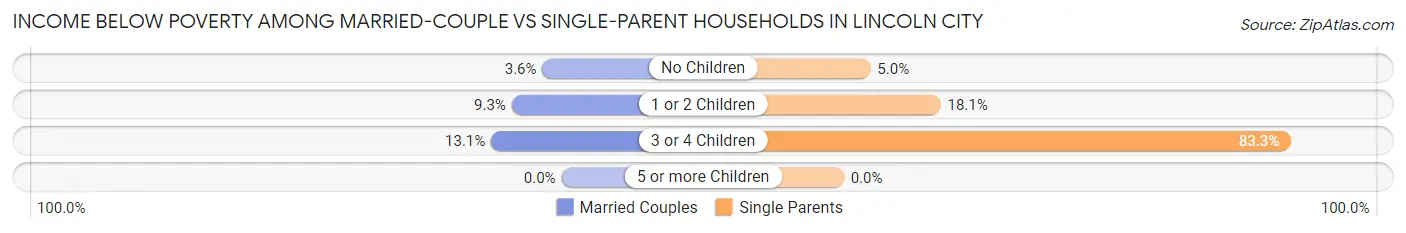
| Children | Married-Couple Families | Single-Parent Households |
| No Children | 50 (3.6%) | 11 (5.0%) |
| 1 or 2 Children | 32 (9.3%) | 63 (18.0%) |
| 3 or 4 Children | 8 (13.1%) | 10 (83.3%) |
| 5 or more Children | 0 (0.0%) | 0 (0.0%) |
| Total | 90 (5.0%) | 84 (14.4%) |
Race in Lincoln City
The most populous races in Lincoln City are White / Caucasian (8,095 | 82.7%), Hispanic or Latino (988 | 10.1%), and Two or more Races (722 | 7.4%).
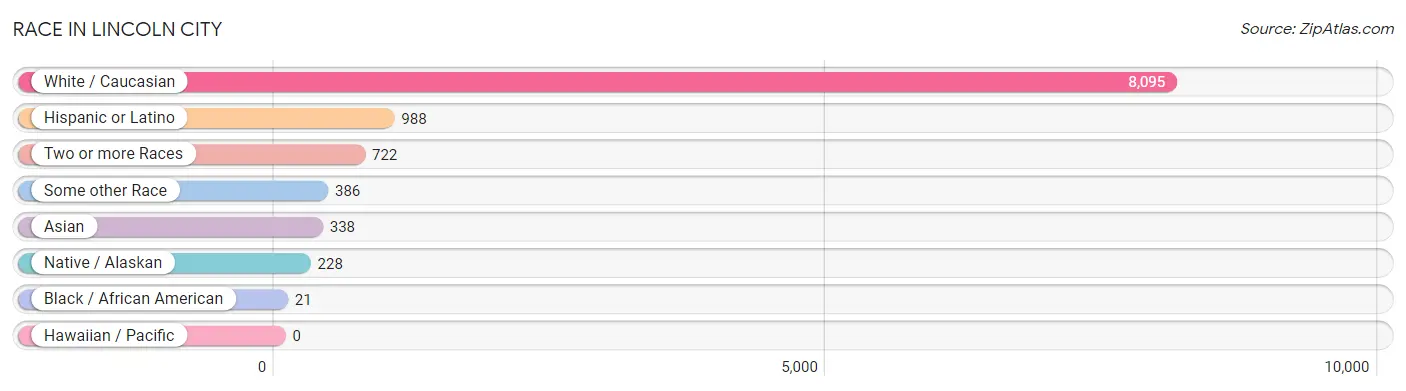
| Race | # Population | % Population |
| Asian | 338 | 3.5% |
| Black / African American | 21 | 0.2% |
| Hawaiian / Pacific | 0 | 0.0% |
| Hispanic or Latino | 988 | 10.1% |
| Native / Alaskan | 228 | 2.3% |
| White / Caucasian | 8,095 | 82.7% |
| Two or more Races | 722 | 7.4% |
| Some other Race | 386 | 3.9% |
| Total | 9,790 | 100.0% |
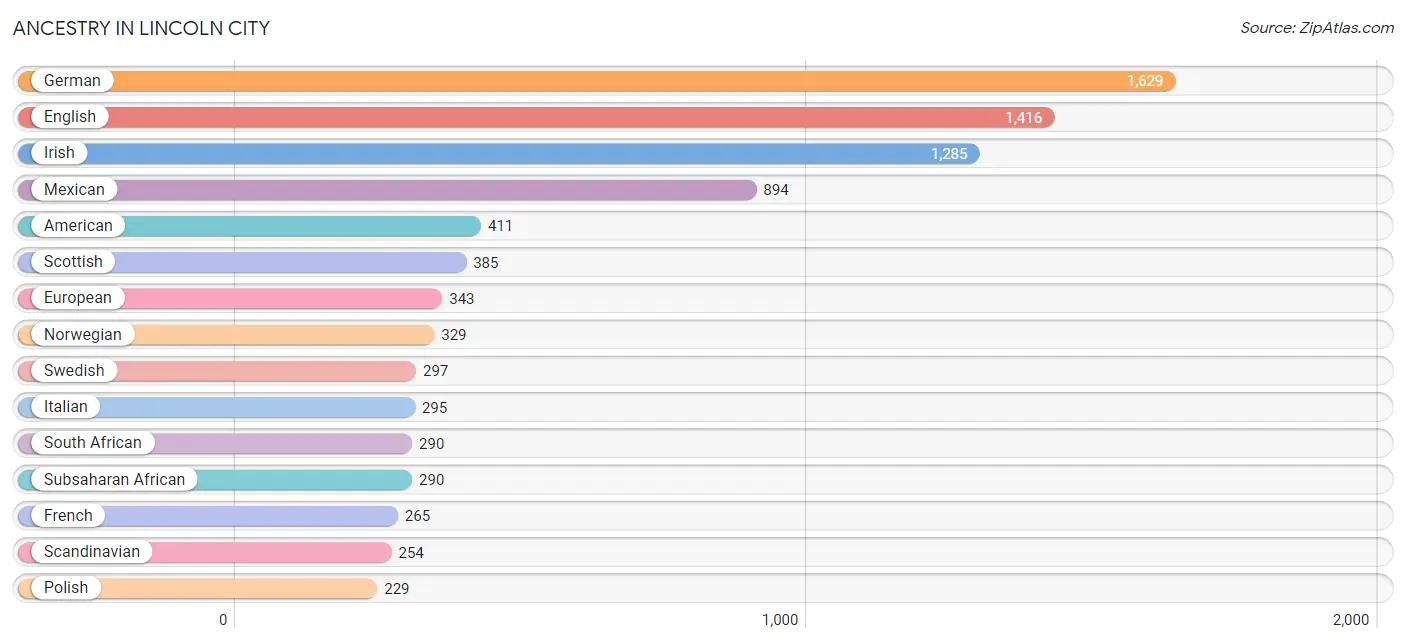
Ancestry in Lincoln City
The most populous ancestries reported in Lincoln City are German (1,629 | 16.6%), English (1,416 | 14.5%), Irish (1,285 | 13.1%), Mexican (894 | 9.1%), and American (411 | 4.2%), together accounting for 57.6% of all Lincoln City residents.
| Ancestry | # Population | % Population |
| Alaskan Athabascan | 2 | 0.0% |
| Albanian | 10 | 0.1% |
| American | 411 | 4.2% |
| Apache | 31 | 0.3% |
| Armenian | 33 | 0.3% |
| Australian | 6 | 0.1% |
| Austrian | 13 | 0.1% |
| Basque | 23 | 0.2% |
| Belgian | 16 | 0.2% |
| Bhutanese | 16 | 0.2% |
| British | 101 | 1.0% |
| Burmese | 18 | 0.2% |
| Canadian | 43 | 0.4% |
| Central American | 21 | 0.2% |
| Cherokee | 86 | 0.9% |
| Chilean | 10 | 0.1% |
| Czech | 24 | 0.3% |
| Czechoslovakian | 8 | 0.1% |
| Danish | 89 | 0.9% |
| Dutch | 164 | 1.7% |
| Eastern European | 12 | 0.1% |
| English | 1,416 | 14.5% |
| European | 343 | 3.5% |
| Finnish | 43 | 0.4% |
| French | 265 | 2.7% |
| French Canadian | 94 | 1.0% |
| German | 1,629 | 16.6% |
| Greek | 18 | 0.2% |
| Hungarian | 114 | 1.2% |
| Indian (Asian) | 40 | 0.4% |
| Irish | 1,285 | 13.1% |
| Italian | 295 | 3.0% |
| Korean | 138 | 1.4% |
| Lithuanian | 10 | 0.1% |
| Mexican | 894 | 9.1% |
| Native Hawaiian | 8 | 0.1% |
| Nicaraguan | 20 | 0.2% |
| Northern European | 77 | 0.8% |
| Norwegian | 329 | 3.4% |
| Ottawa | 1 | 0.0% |
| Pakistani | 123 | 1.3% |
| Pennsylvania German | 9 | 0.1% |
| Polish | 229 | 2.3% |
| Portuguese | 44 | 0.4% |
| Puerto Rican | 48 | 0.5% |
| Puget Sound Salish | 13 | 0.1% |
| Russian | 71 | 0.7% |
| Salvadoran | 1 | 0.0% |
| Scandinavian | 254 | 2.6% |
| Scotch-Irish | 91 | 0.9% |
| Scottish | 385 | 3.9% |
| Sioux | 14 | 0.1% |
| South African | 290 | 3.0% |
| South American | 10 | 0.1% |
| Spaniard | 1 | 0.0% |
| Spanish | 13 | 0.1% |
| Sri Lankan | 36 | 0.4% |
| Subsaharan African | 290 | 3.0% |
| Swedish | 297 | 3.0% |
| Thai | 15 | 0.2% |
| Tlingit-Haida | 20 | 0.2% |
| Welsh | 47 | 0.5% |
| Yugoslavian | 42 | 0.4% | View All 63 Rows |
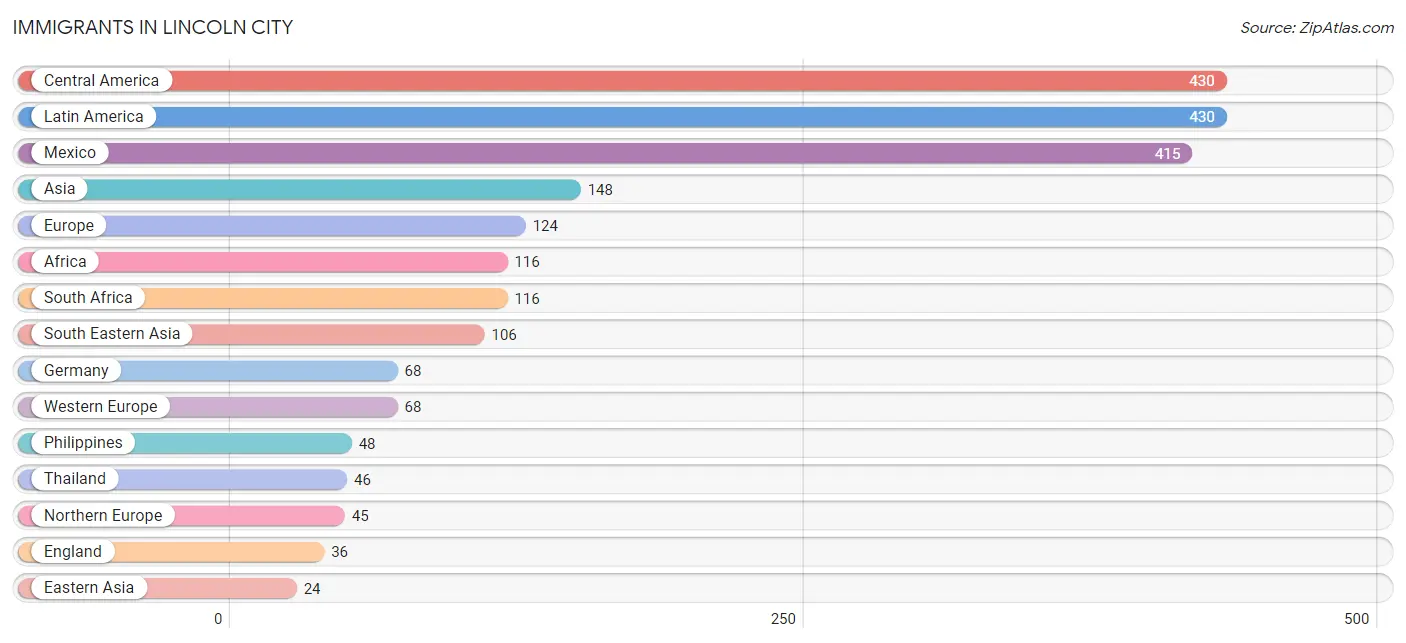
Immigrants in Lincoln City
The most numerous immigrant groups reported in Lincoln City came from Central America (430 | 4.4%), Latin America (430 | 4.4%), Mexico (415 | 4.2%), Asia (148 | 1.5%), and Europe (124 | 1.3%), together accounting for 15.8% of all Lincoln City residents.
| Immigration Origin | # Population | % Population |
| Africa | 116 | 1.2% |
| Asia | 148 | 1.5% |
| Canada | 4 | 0.0% |
| Central America | 430 | 4.4% |
| China | 23 | 0.2% |
| Eastern Asia | 24 | 0.3% |
| Eastern Europe | 5 | 0.1% |
| England | 36 | 0.4% |
| Europe | 124 | 1.3% |
| Germany | 68 | 0.7% |
| India | 8 | 0.1% |
| Italy | 6 | 0.1% |
| Korea | 1 | 0.0% |
| Latin America | 430 | 4.4% |
| Mexico | 415 | 4.2% |
| Nicaragua | 15 | 0.2% |
| Northern Europe | 45 | 0.5% |
| Philippines | 48 | 0.5% |
| Russia | 5 | 0.1% |
| South Africa | 116 | 1.2% |
| South Central Asia | 8 | 0.1% |
| South Eastern Asia | 106 | 1.1% |
| Southern Europe | 6 | 0.1% |
| Taiwan | 5 | 0.1% |
| Thailand | 46 | 0.5% |
| Turkey | 10 | 0.1% |
| Vietnam | 12 | 0.1% |
| Western Asia | 10 | 0.1% |
| Western Europe | 68 | 0.7% | View All 29 Rows |
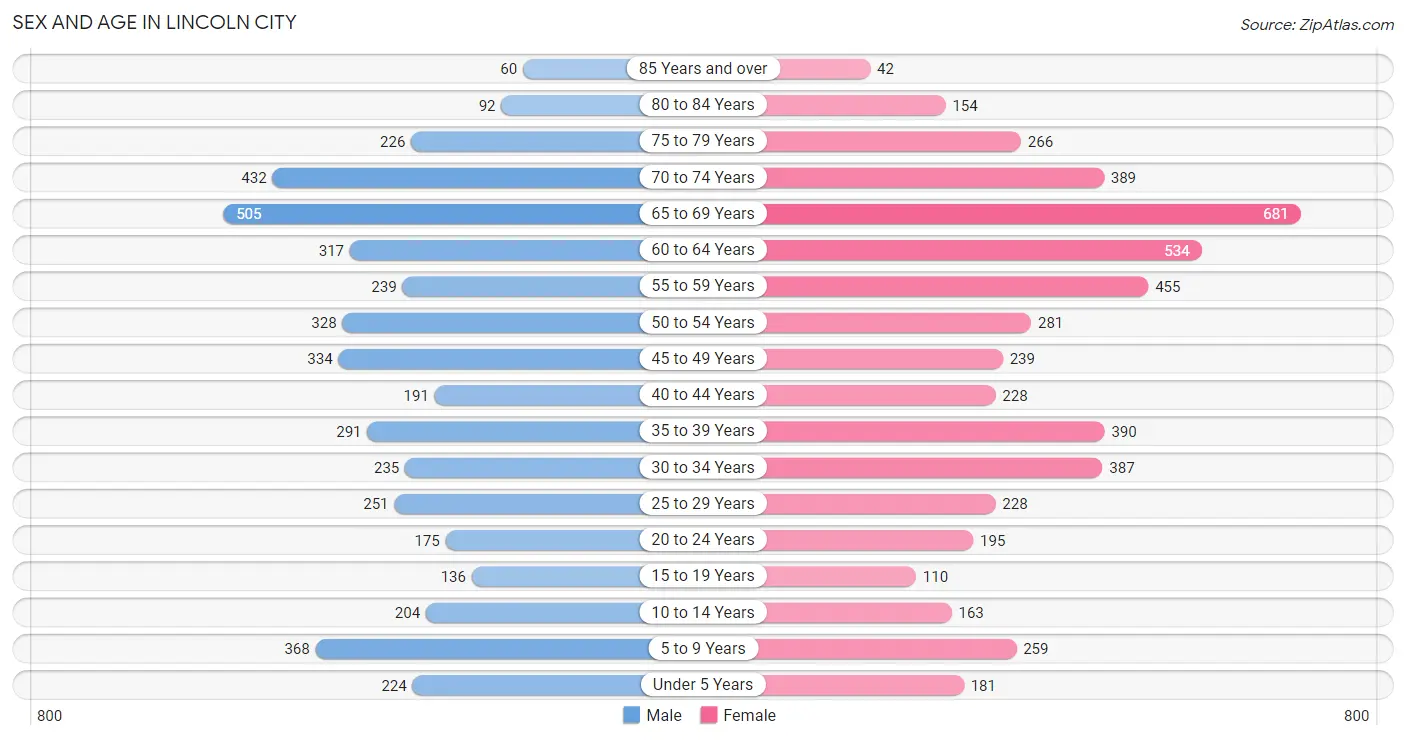
Sex and Age in Lincoln City
Sex and Age in Lincoln City
The most populous age groups in Lincoln City are 65 to 69 Years (505 | 11.0%) for men and 65 to 69 Years (681 | 13.1%) for women.
| Age Bracket | Male | Female |
| Under 5 Years | 224 (4.9%) | 181 (3.5%) |
| 5 to 9 Years | 368 (8.0%) | 259 (5.0%) |
| 10 to 14 Years | 204 (4.4%) | 163 (3.2%) |
| 15 to 19 Years | 136 (2.9%) | 110 (2.1%) |
| 20 to 24 Years | 175 (3.8%) | 195 (3.8%) |
| 25 to 29 Years | 251 (5.4%) | 228 (4.4%) |
| 30 to 34 Years | 235 (5.1%) | 387 (7.5%) |
| 35 to 39 Years | 291 (6.3%) | 390 (7.5%) |
| 40 to 44 Years | 191 (4.1%) | 228 (4.4%) |
| 45 to 49 Years | 334 (7.2%) | 239 (4.6%) |
| 50 to 54 Years | 328 (7.1%) | 281 (5.4%) |
| 55 to 59 Years | 239 (5.2%) | 455 (8.8%) |
| 60 to 64 Years | 317 (6.9%) | 534 (10.3%) |
| 65 to 69 Years | 505 (11.0%) | 681 (13.1%) |
| 70 to 74 Years | 432 (9.4%) | 389 (7.5%) |
| 75 to 79 Years | 226 (4.9%) | 266 (5.1%) |
| 80 to 84 Years | 92 (2.0%) | 154 (3.0%) |
| 85 Years and over | 60 (1.3%) | 42 (0.8%) |
| Total | 4,608 (100.0%) | 5,182 (100.0%) |
Families and Households in Lincoln City
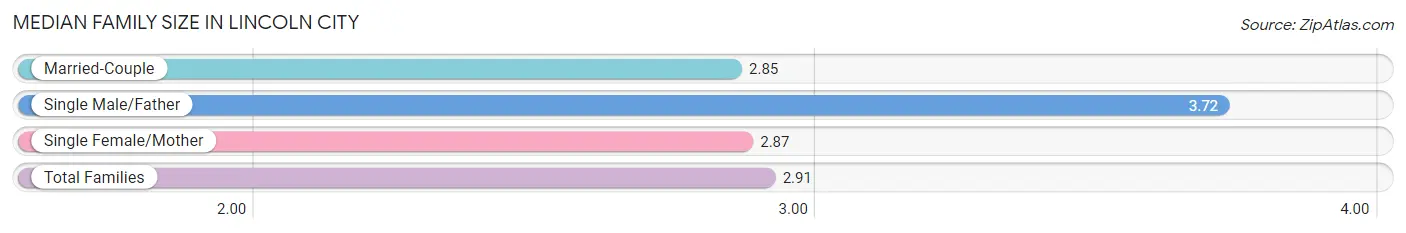
Median Family Size in Lincoln City
The median family size in Lincoln City is 2.91 persons per family, with single male/father families (147 | 6.1%) accounting for the largest median family size of 3.72 persons per family. On the other hand, married-couple families (1,812 | 75.7%) represent the smallest median family size with 2.85 persons per family.
| Family Type | # Families | Family Size |
| Married-Couple | 1,812 (75.7%) | 2.85 |
| Single Male/Father | 147 (6.1%) | 3.72 |
| Single Female/Mother | 435 (18.2%) | 2.87 |
| Total Families | 2,394 (100.0%) | 2.91 |
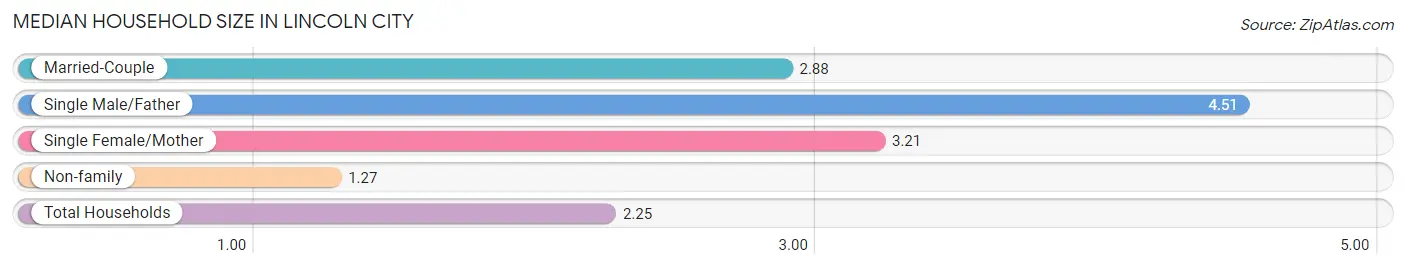
Median Household Size in Lincoln City
The median household size in Lincoln City is 2.25 persons per household, with single male/father households (147 | 3.4%) accounting for the largest median household size of 4.51 persons per household. non-family households (1,897 | 44.2%) represent the smallest median household size with 1.27 persons per household.
| Household Type | # Households | Household Size |
| Married-Couple | 1,812 (42.2%) | 2.88 |
| Single Male/Father | 147 (3.4%) | 4.51 |
| Single Female/Mother | 435 (10.1%) | 3.21 |
| Non-family | 1,897 (44.2%) | 1.27 |
| Total Households | 4,291 (100.0%) | 2.25 |
Household Size by Marriage Status in Lincoln City
Out of a total of 4,291 households in Lincoln City, 2,394 (55.8%) are family households, while 1,897 (44.2%) are nonfamily households. The most numerous type of family households are 2-person households, comprising 1,405, and the most common type of nonfamily households are 1-person households, comprising 1,582.
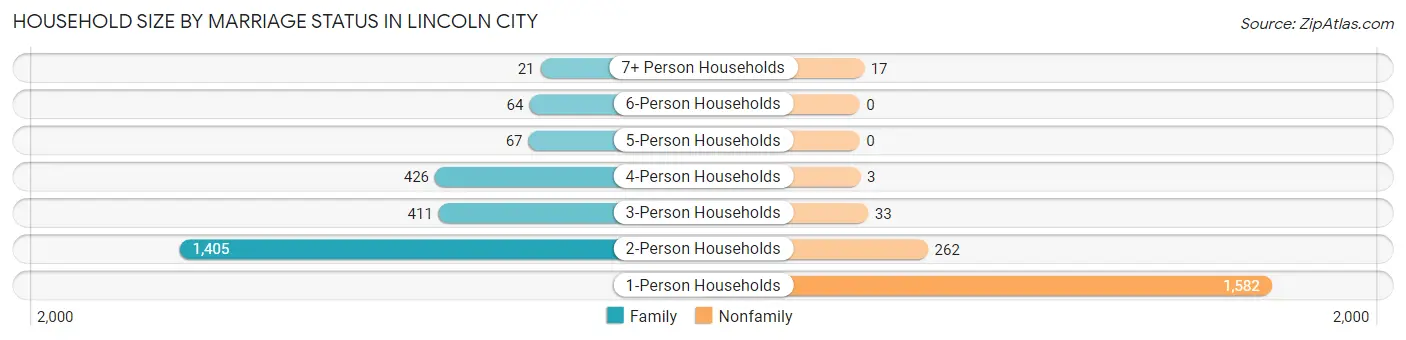
| Household Size | Family Households | Nonfamily Households |
| 1-Person Households | - | 1,582 (36.9%) |
| 2-Person Households | 1,405 (32.7%) | 262 (6.1%) |
| 3-Person Households | 411 (9.6%) | 33 (0.8%) |
| 4-Person Households | 426 (9.9%) | 3 (0.1%) |
| 5-Person Households | 67 (1.6%) | 0 (0.0%) |
| 6-Person Households | 64 (1.5%) | 0 (0.0%) |
| 7+ Person Households | 21 (0.5%) | 17 (0.4%) |
| Total | 2,394 (55.8%) | 1,897 (44.2%) |
Female Fertility in Lincoln City
Fertility by Age in Lincoln City
Average fertility rate in Lincoln City is 88.0 births per 1,000 women. Women in the age bracket of 20 to 34 years have the highest fertility rate with 184.0 births per 1,000 women. Women in the age bracket of 20 to 34 years acount for 90.8% of all women with births.
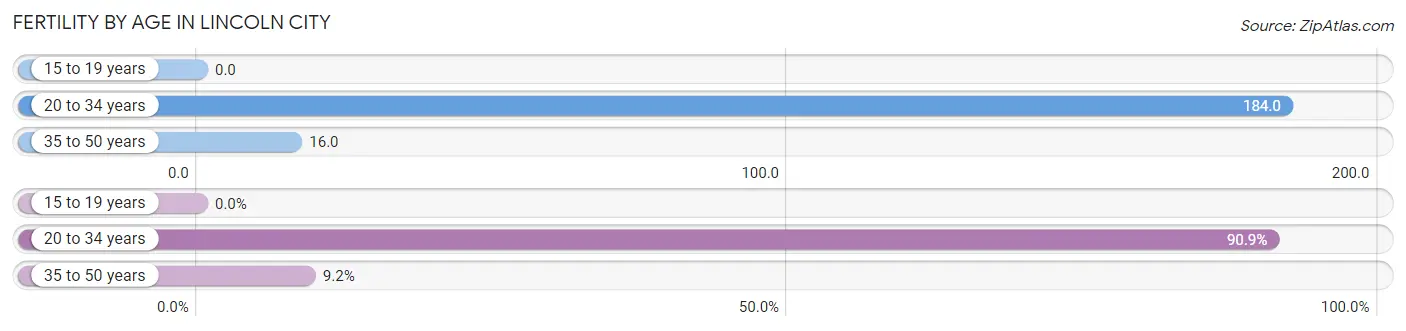
| Age Bracket | Women with Births | Births / 1,000 Women |
| 15 to 19 years | 0 (0.0%) | 0.0 |
| 20 to 34 years | 149 (90.8%) | 184.0 |
| 35 to 50 years | 15 (9.1%) | 16.0 |
| Total | 164 (100.0%) | 88.0 |
Fertility by Age by Marriage Status in Lincoln City
95.1% of women with births (164) in Lincoln City are married. The highest percentage of unmarried women with births falls into 35 to 50 years age bracket with 53.3% of them unmarried at the time of birth, while the lowest percentage of unmarried women with births belong to 20 to 34 years age bracket with 0.0% of them unmarried.
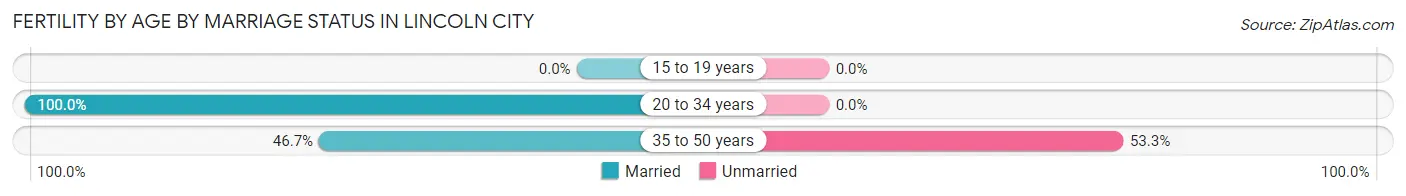
| Age Bracket | Married | Unmarried |
| 15 to 19 years | 0 (0.0%) | 0 (0.0%) |
| 20 to 34 years | 149 (100.0%) | 0 (0.0%) |
| 35 to 50 years | 7 (46.7%) | 8 (53.3%) |
| Total | 156 (95.1%) | 8 (4.9%) |
Fertility by Education in Lincoln City
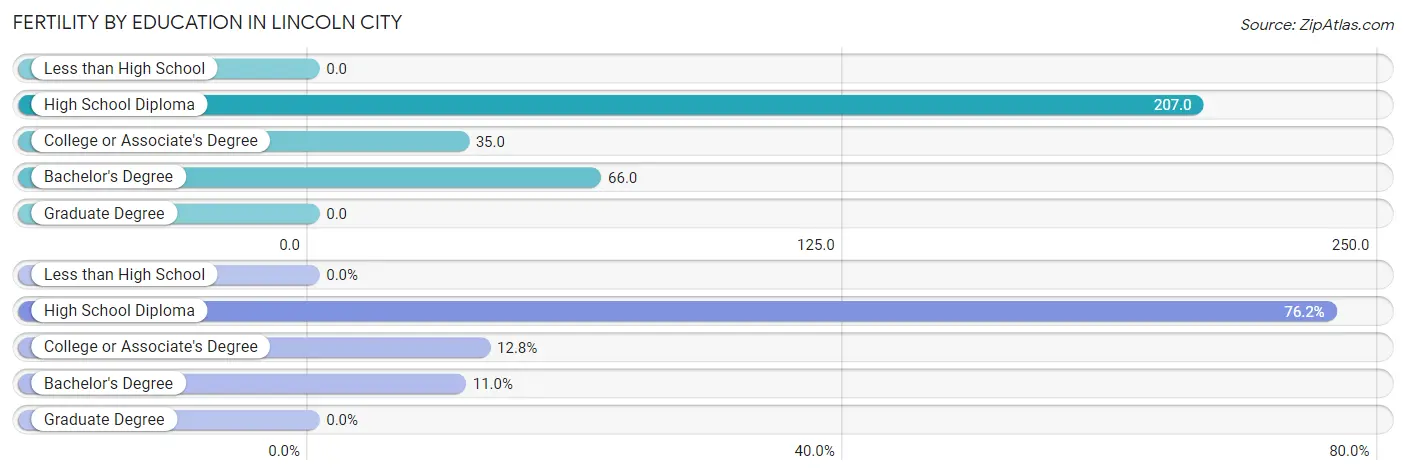
| Educational Attainment | Women with Births | Births / 1,000 Women |
| Less than High School | 0 (0.0%) | 0.0 |
| High School Diploma | 125 (76.2%) | 207.0 |
| College or Associate's Degree | 21 (12.8%) | 35.0 |
| Bachelor's Degree | 18 (11.0%) | 66.0 |
| Graduate Degree | 0 (0.0%) | 0.0 |
| Total | 164 (100.0%) | 88.0 |
Fertility by Education by Marriage Status in Lincoln City
4.9% of women with births in Lincoln City are unmarried. Women with the educational attainment of high school diploma are most likely to be married with 100.0% of them married at childbirth, while women with the educational attainment of college or associate's degree are least likely to be married with 38.1% of them unmarried at childbirth.
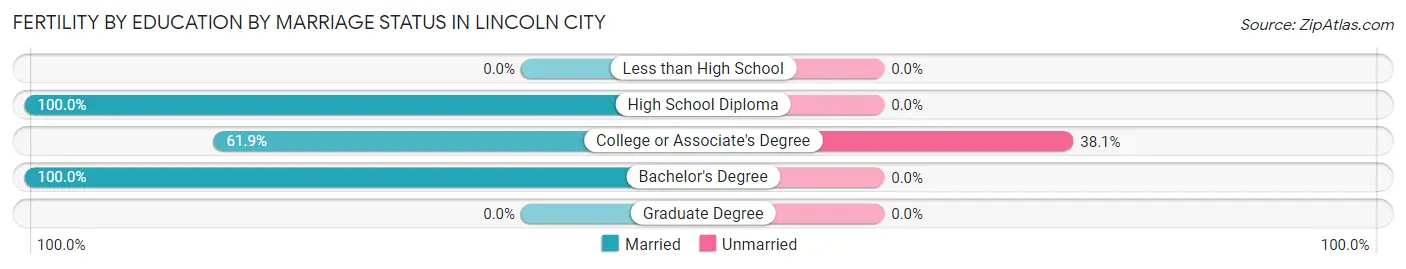
| Educational Attainment | Married | Unmarried |
| Less than High School | 0 (0.0%) | 0 (0.0%) |
| High School Diploma | 125 (100.0%) | 0 (0.0%) |
| College or Associate's Degree | 13 (61.9%) | 8 (38.1%) |
| Bachelor's Degree | 18 (100.0%) | 0 (0.0%) |
| Graduate Degree | 0 (0.0%) | 0 (0.0%) |
| Total | 156 (95.1%) | 8 (4.9%) |
Employment Characteristics in Lincoln City
Employment by Class of Employer in Lincoln City
Among the 4,119 employed individuals in Lincoln City, private company employees (2,994 | 72.7%), self-employed (not incorporated) (266 | 6.5%), and not-for-profit organizations (254 | 6.2%) make up the most common classes of employment.
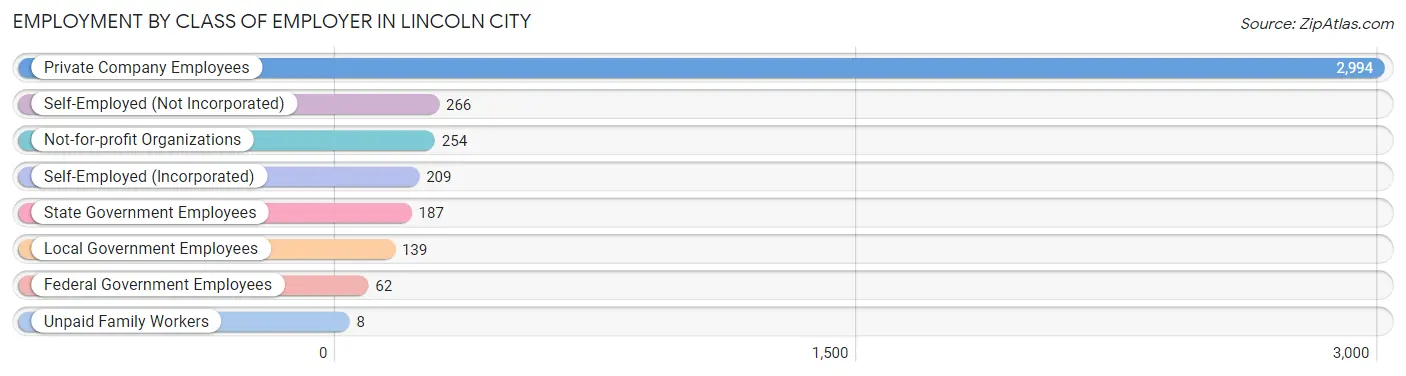
| Employer Class | # Employees | % Employees |
| Private Company Employees | 2,994 | 72.7% |
| Self-Employed (Incorporated) | 209 | 5.1% |
| Self-Employed (Not Incorporated) | 266 | 6.5% |
| Not-for-profit Organizations | 254 | 6.2% |
| Local Government Employees | 139 | 3.4% |
| State Government Employees | 187 | 4.5% |
| Federal Government Employees | 62 | 1.5% |
| Unpaid Family Workers | 8 | 0.2% |
| Total | 4,119 | 100.0% |
Employment Status by Age in Lincoln City
According to the labor force statistics for Lincoln City, out of the total population over 16 years of age (8,324), 52.4% or 4,362 individuals are in the labor force, with 3.9% or 170 of them unemployed. The age group with the highest labor force participation rate is 25 to 29 years, with 87.5% or 419 individuals in the labor force. Within the labor force, the 60 to 64 years age range has the highest percentage of unemployed individuals, with 13.3% or 44 of them being unemployed.
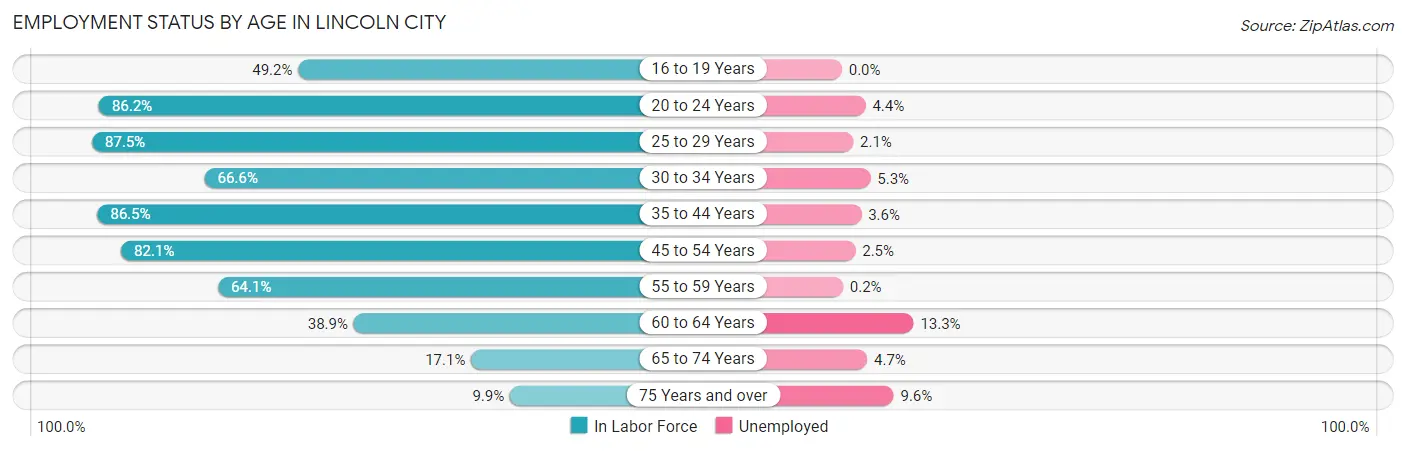
| Age Bracket | In Labor Force | Unemployed |
| 16 to 19 Years | 88 (49.2%) | 0 (0.0%) |
| 20 to 24 Years | 319 (86.2%) | 14 (4.4%) |
| 25 to 29 Years | 419 (87.5%) | 9 (2.1%) |
| 30 to 34 Years | 414 (66.6%) | 22 (5.3%) |
| 35 to 44 Years | 952 (86.5%) | 34 (3.6%) |
| 45 to 54 Years | 970 (82.1%) | 24 (2.5%) |
| 55 to 59 Years | 445 (64.1%) | 1 (0.2%) |
| 60 to 64 Years | 331 (38.9%) | 44 (13.3%) |
| 65 to 74 Years | 343 (17.1%) | 16 (4.7%) |
| 75 Years and over | 83 (9.9%) | 8 (9.6%) |
| Total | 4,362 (52.4%) | 170 (3.9%) |
Employment Status by Educational Attainment in Lincoln City
According to labor force statistics for Lincoln City, 71.7% of individuals (3,533) out of the total population between 25 and 64 years of age (4,928) are in the labor force, with 3.8% or 134 of them being unemployed. The group with the highest labor force participation rate are those with the educational attainment of bachelor's degree or higher, with 84.5% or 1,070 individuals in the labor force. Within the labor force, individuals with college / associate degree education have the highest percentage of unemployment, with 6.6% or 85 of them being unemployed.
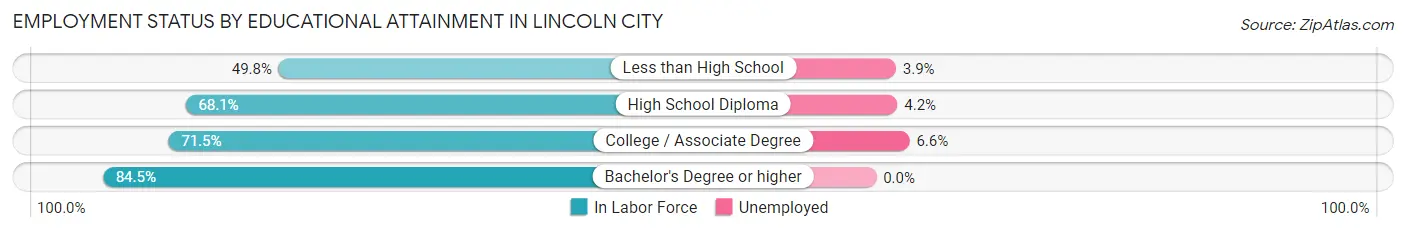
| Educational Attainment | In Labor Force | Unemployed |
| Less than High School | 256 (49.8%) | 20 (3.9%) |
| High School Diploma | 919 (68.1%) | 57 (4.2%) |
| College / Associate Degree | 1,286 (71.5%) | 119 (6.6%) |
| Bachelor's Degree or higher | 1,070 (84.5%) | 0 (0.0%) |
| Total | 3,533 (71.7%) | 187 (3.8%) |
Employment Occupations by Sex in Lincoln City
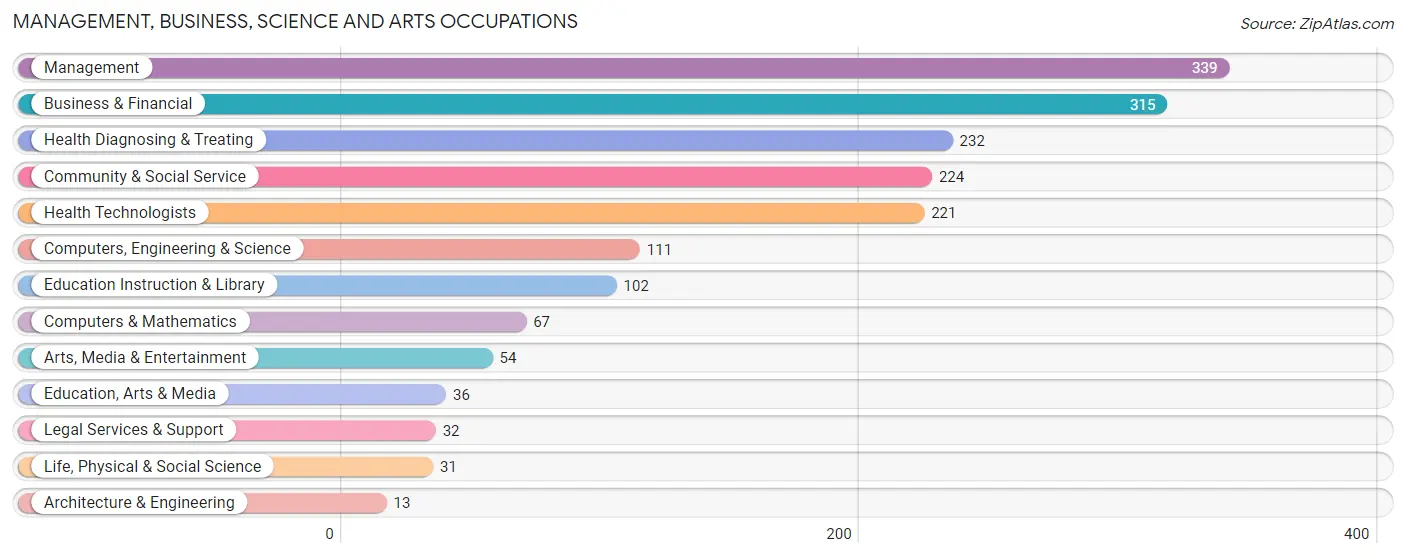
Management, Business, Science and Arts Occupations
The most common Management, Business, Science and Arts occupations in Lincoln City are Management (339 | 8.1%), Business & Financial (315 | 7.5%), Health Diagnosing & Treating (232 | 5.5%), Community & Social Service (224 | 5.3%), and Health Technologists (221 | 5.3%).
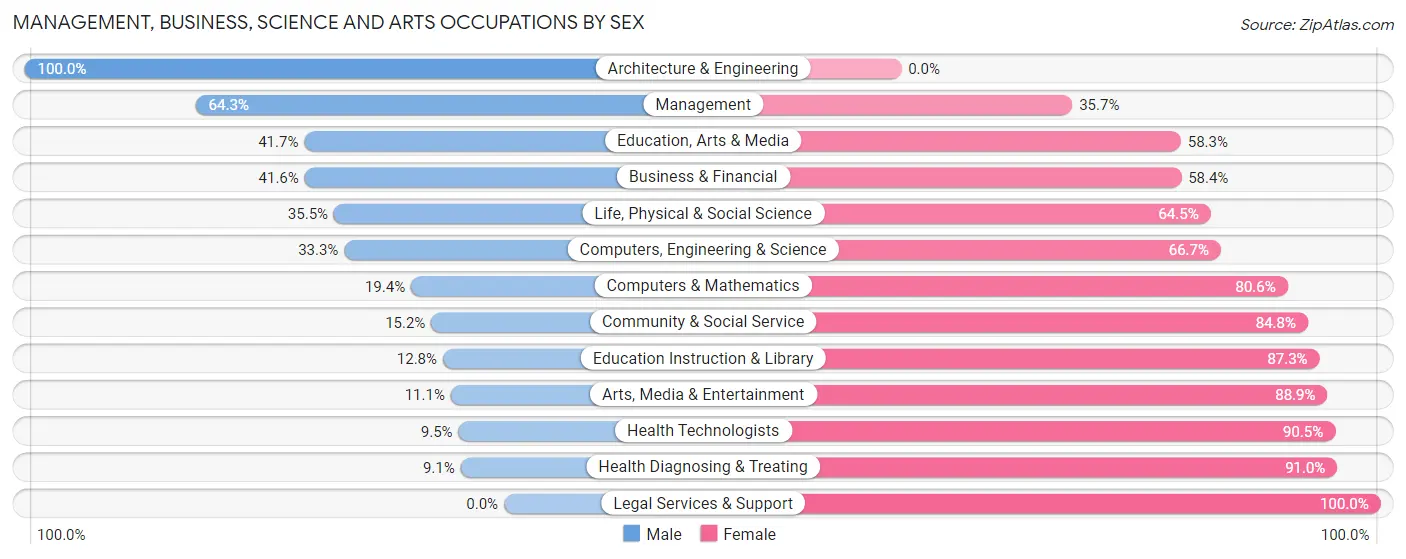
Management, Business, Science and Arts Occupations by Sex
Within the Management, Business, Science and Arts occupations in Lincoln City, the most male-oriented occupations are Architecture & Engineering (100.0%), Management (64.3%), and Education, Arts & Media (41.7%), while the most female-oriented occupations are Legal Services & Support (100.0%), Health Diagnosing & Treating (90.9%), and Health Technologists (90.5%).
| Occupation | Male | Female |
| Management | 218 (64.3%) | 121 (35.7%) |
| Business & Financial | 131 (41.6%) | 184 (58.4%) |
| Computers, Engineering & Science | 37 (33.3%) | 74 (66.7%) |
| Computers & Mathematics | 13 (19.4%) | 54 (80.6%) |
| Architecture & Engineering | 13 (100.0%) | 0 (0.0%) |
| Life, Physical & Social Science | 11 (35.5%) | 20 (64.5%) |
| Community & Social Service | 34 (15.2%) | 190 (84.8%) |
| Education, Arts & Media | 15 (41.7%) | 21 (58.3%) |
| Legal Services & Support | 0 (0.0%) | 32 (100.0%) |
| Education Instruction & Library | 13 (12.8%) | 89 (87.3%) |
| Arts, Media & Entertainment | 6 (11.1%) | 48 (88.9%) |
| Health Diagnosing & Treating | 21 (9.0%) | 211 (90.9%) |
| Health Technologists | 21 (9.5%) | 200 (90.5%) |
| Total (Category) | 441 (36.1%) | 780 (63.9%) |
| Total (Overall) | 2,050 (48.9%) | 2,142 (51.1%) |
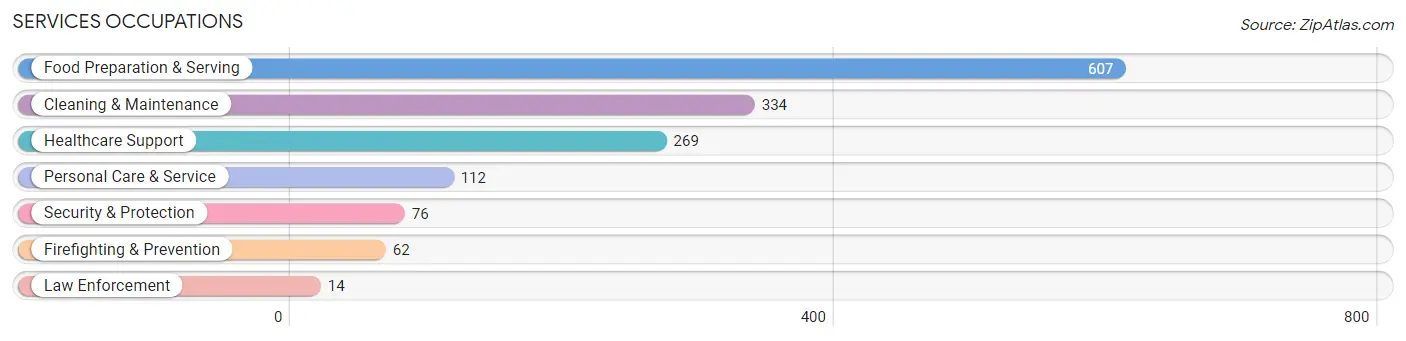
Services Occupations
The most common Services occupations in Lincoln City are Food Preparation & Serving (607 | 14.5%), Cleaning & Maintenance (334 | 8.0%), Healthcare Support (269 | 6.4%), Personal Care & Service (112 | 2.7%), and Security & Protection (76 | 1.8%).
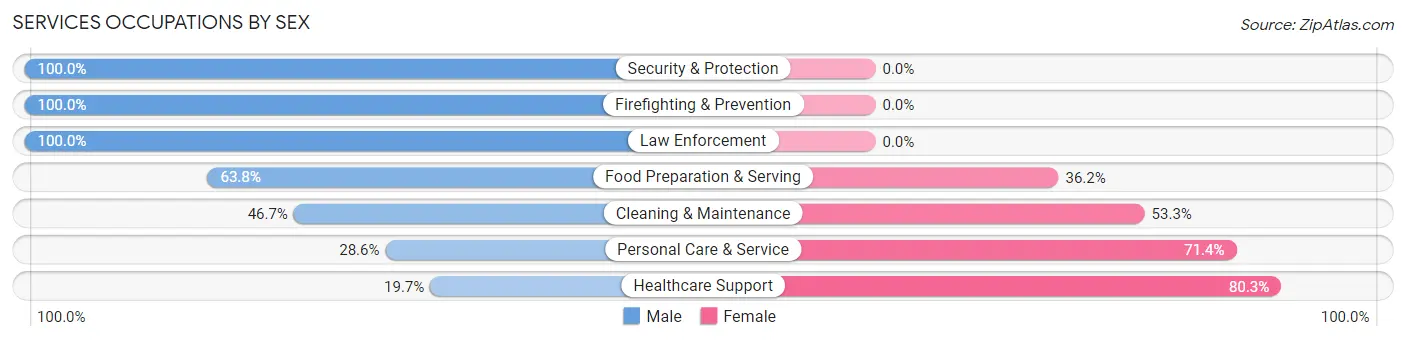
Services Occupations by Sex
Within the Services occupations in Lincoln City, the most male-oriented occupations are Security & Protection (100.0%), Firefighting & Prevention (100.0%), and Law Enforcement (100.0%), while the most female-oriented occupations are Healthcare Support (80.3%), Personal Care & Service (71.4%), and Cleaning & Maintenance (53.3%).
| Occupation | Male | Female |
| Healthcare Support | 53 (19.7%) | 216 (80.3%) |
| Security & Protection | 76 (100.0%) | 0 (0.0%) |
| Firefighting & Prevention | 62 (100.0%) | 0 (0.0%) |
| Law Enforcement | 14 (100.0%) | 0 (0.0%) |
| Food Preparation & Serving | 387 (63.8%) | 220 (36.2%) |
| Cleaning & Maintenance | 156 (46.7%) | 178 (53.3%) |
| Personal Care & Service | 32 (28.6%) | 80 (71.4%) |
| Total (Category) | 704 (50.4%) | 694 (49.6%) |
| Total (Overall) | 2,050 (48.9%) | 2,142 (51.1%) |
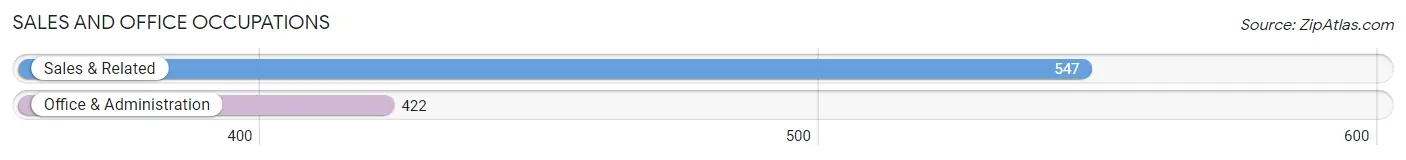
Sales and Office Occupations
The most common Sales and Office occupations in Lincoln City are Sales & Related (547 | 13.1%), and Office & Administration (422 | 10.1%).
Sales and Office Occupations by Sex
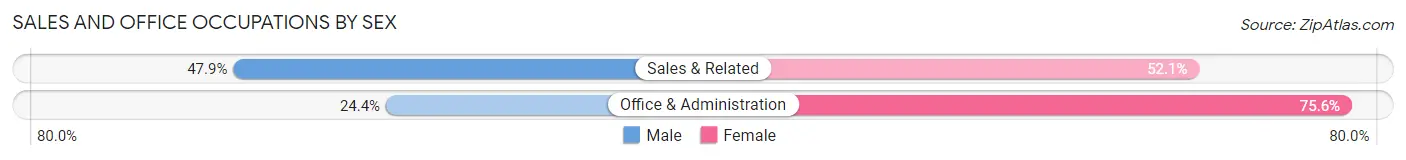
| Occupation | Male | Female |
| Sales & Related | 262 (47.9%) | 285 (52.1%) |
| Office & Administration | 103 (24.4%) | 319 (75.6%) |
| Total (Category) | 365 (37.7%) | 604 (62.3%) |
| Total (Overall) | 2,050 (48.9%) | 2,142 (51.1%) |
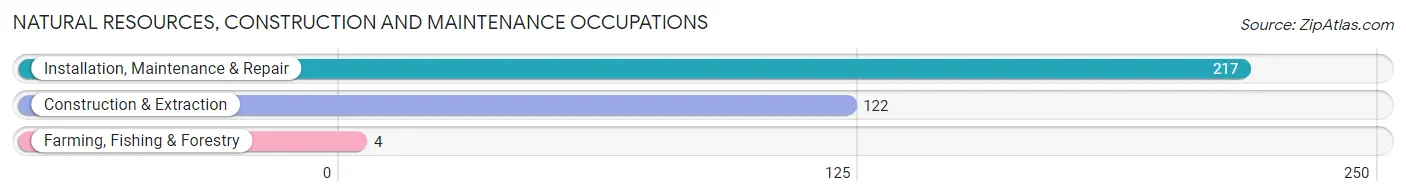
Natural Resources, Construction and Maintenance Occupations
The most common Natural Resources, Construction and Maintenance occupations in Lincoln City are Installation, Maintenance & Repair (217 | 5.2%), Construction & Extraction (122 | 2.9%), and Farming, Fishing & Forestry (4 | 0.1%).
Natural Resources, Construction and Maintenance Occupations by Sex
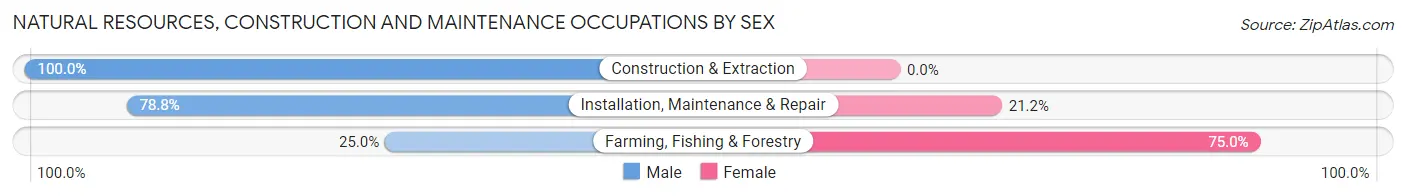
| Occupation | Male | Female |
| Farming, Fishing & Forestry | 1 (25.0%) | 3 (75.0%) |
| Construction & Extraction | 122 (100.0%) | 0 (0.0%) |
| Installation, Maintenance & Repair | 171 (78.8%) | 46 (21.2%) |
| Total (Category) | 294 (85.7%) | 49 (14.3%) |
| Total (Overall) | 2,050 (48.9%) | 2,142 (51.1%) |
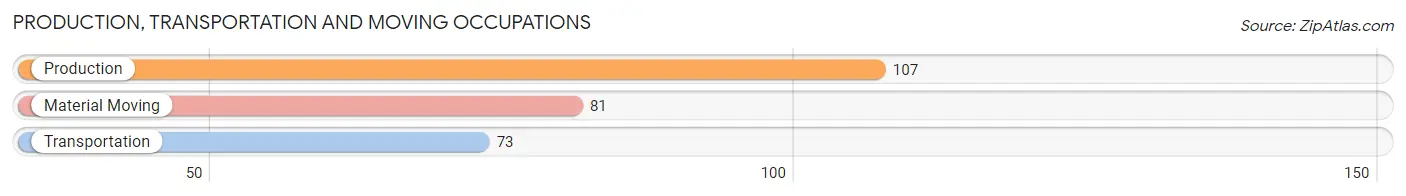
Production, Transportation and Moving Occupations
The most common Production, Transportation and Moving occupations in Lincoln City are Production (107 | 2.5%), Material Moving (81 | 1.9%), and Transportation (73 | 1.7%).
Production, Transportation and Moving Occupations by Sex
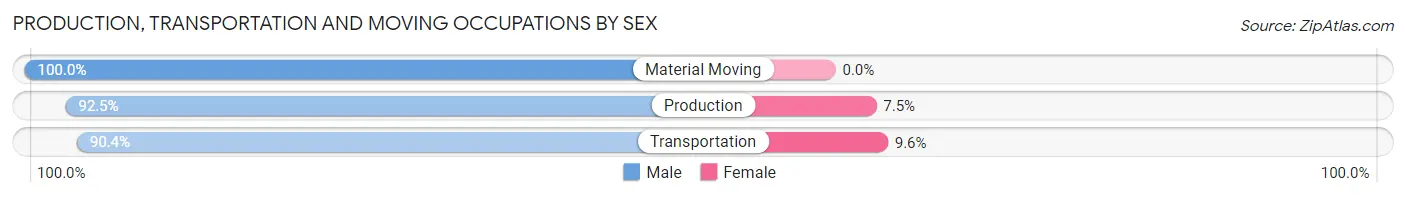
| Occupation | Male | Female |
| Production | 99 (92.5%) | 8 (7.5%) |
| Transportation | 66 (90.4%) | 7 (9.6%) |
| Material Moving | 81 (100.0%) | 0 (0.0%) |
| Total (Category) | 246 (94.3%) | 15 (5.8%) |
| Total (Overall) | 2,050 (48.9%) | 2,142 (51.1%) |
Employment Industries by Sex in Lincoln City
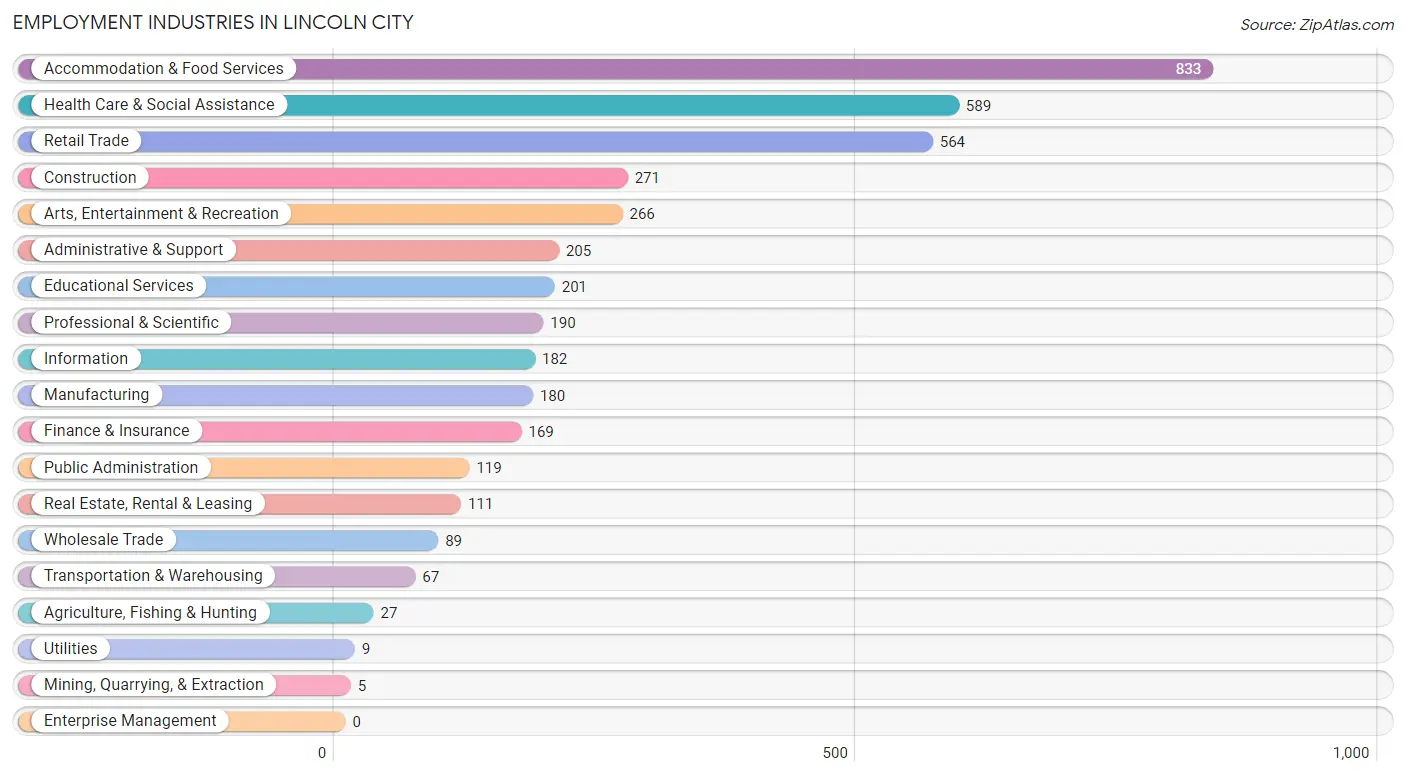
Employment Industries in Lincoln City
The major employment industries in Lincoln City include Accommodation & Food Services (833 | 19.9%), Health Care & Social Assistance (589 | 14.1%), Retail Trade (564 | 13.5%), Construction (271 | 6.5%), and Arts, Entertainment & Recreation (266 | 6.4%).
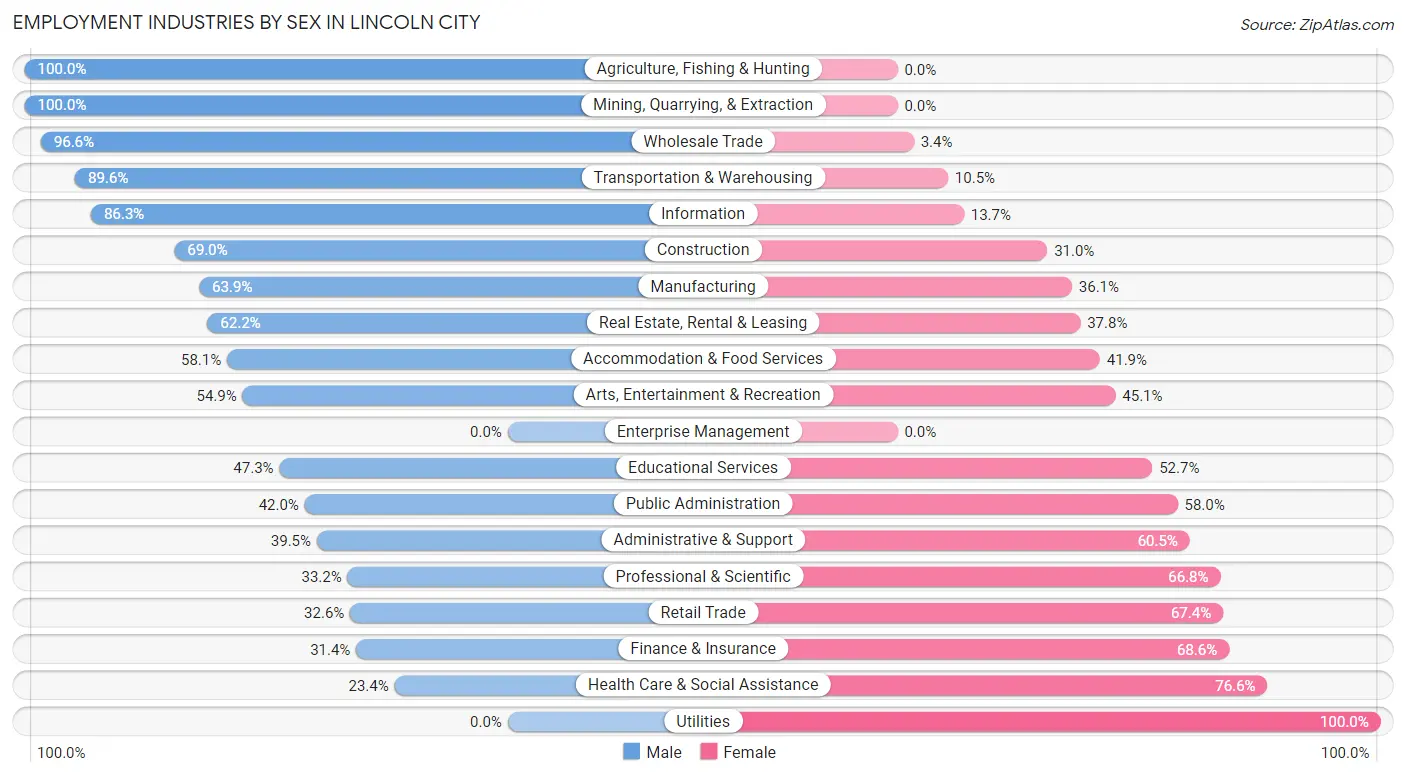
Employment Industries by Sex in Lincoln City
The Lincoln City industries that see more men than women are Agriculture, Fishing & Hunting (100.0%), Mining, Quarrying, & Extraction (100.0%), and Wholesale Trade (96.6%), whereas the industries that tend to have a higher number of women are Utilities (100.0%), Health Care & Social Assistance (76.6%), and Finance & Insurance (68.6%).
| Industry | Male | Female |
| Agriculture, Fishing & Hunting | 27 (100.0%) | 0 (0.0%) |
| Mining, Quarrying, & Extraction | 5 (100.0%) | 0 (0.0%) |
| Construction | 187 (69.0%) | 84 (31.0%) |
| Manufacturing | 115 (63.9%) | 65 (36.1%) |
| Wholesale Trade | 86 (96.6%) | 3 (3.4%) |
| Retail Trade | 184 (32.6%) | 380 (67.4%) |
| Transportation & Warehousing | 60 (89.5%) | 7 (10.4%) |
| Utilities | 0 (0.0%) | 9 (100.0%) |
| Information | 157 (86.3%) | 25 (13.7%) |
| Finance & Insurance | 53 (31.4%) | 116 (68.6%) |
| Real Estate, Rental & Leasing | 69 (62.2%) | 42 (37.8%) |
| Professional & Scientific | 63 (33.2%) | 127 (66.8%) |
| Enterprise Management | 0 (0.0%) | 0 (0.0%) |
| Administrative & Support | 81 (39.5%) | 124 (60.5%) |
| Educational Services | 95 (47.3%) | 106 (52.7%) |
| Health Care & Social Assistance | 138 (23.4%) | 451 (76.6%) |
| Arts, Entertainment & Recreation | 146 (54.9%) | 120 (45.1%) |
| Accommodation & Food Services | 484 (58.1%) | 349 (41.9%) |
| Public Administration | 50 (42.0%) | 69 (58.0%) |
| Total | 2,050 (48.9%) | 2,142 (51.1%) |
Education in Lincoln City
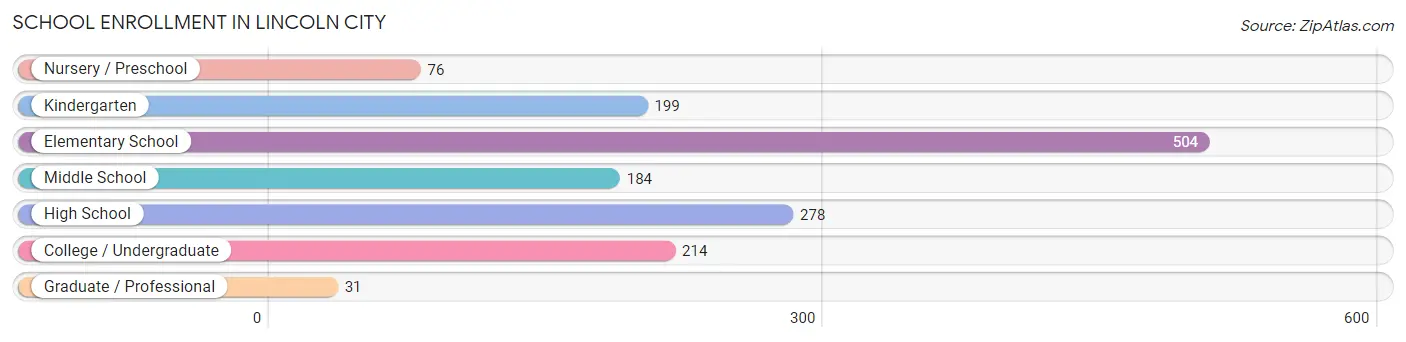
School Enrollment in Lincoln City
The most common levels of schooling among the 1,486 students in Lincoln City are elementary school (504 | 33.9%), high school (278 | 18.7%), and college / undergraduate (214 | 14.4%).
| School Level | # Students | % Students |
| Nursery / Preschool | 76 | 5.1% |
| Kindergarten | 199 | 13.4% |
| Elementary School | 504 | 33.9% |
| Middle School | 184 | 12.4% |
| High School | 278 | 18.7% |
| College / Undergraduate | 214 | 14.4% |
| Graduate / Professional | 31 | 2.1% |
| Total | 1,486 | 100.0% |
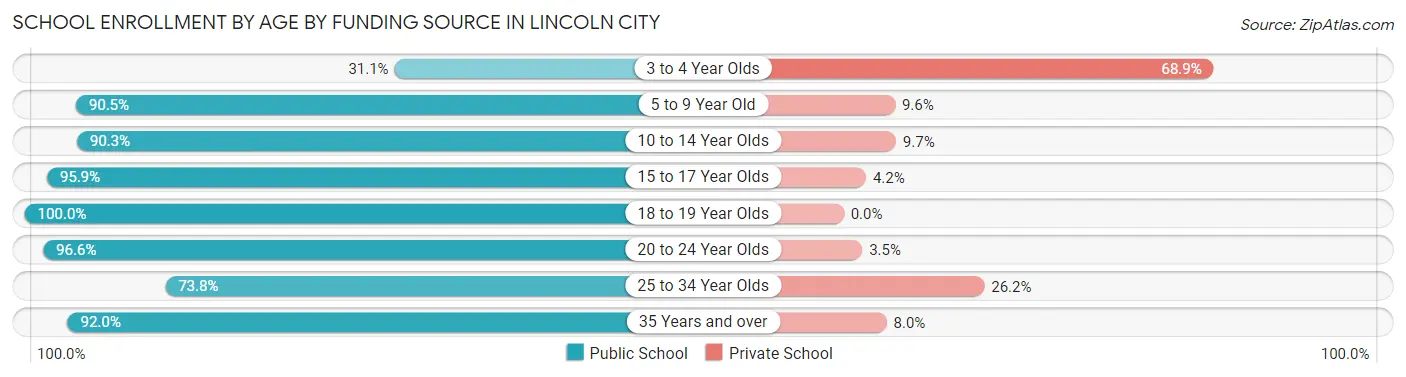
School Enrollment by Age by Funding Source in Lincoln City
Out of a total of 1,486 students who are enrolled in schools in Lincoln City, 158 (10.6%) attend a private institution, while the remaining 1,328 (89.4%) are enrolled in public schools. The age group of 3 to 4 year olds has the highest likelihood of being enrolled in private schools, with 31 (68.9% in the age bracket) enrolled. Conversely, the age group of 18 to 19 year olds has the lowest likelihood of being enrolled in a private school, with 45 (100.0% in the age bracket) attending a public institution.
| Age Bracket | Public School | Private School |
| 3 to 4 Year Olds | 14 (31.1%) | 31 (68.9%) |
| 5 to 9 Year Old | 559 (90.4%) | 59 (9.6%) |
| 10 to 14 Year Olds | 306 (90.3%) | 33 (9.7%) |
| 15 to 17 Year Olds | 185 (95.9%) | 8 (4.2%) |
| 18 to 19 Year Olds | 45 (100.0%) | 0 (0.0%) |
| 20 to 24 Year Olds | 28 (96.6%) | 1 (3.5%) |
| 25 to 34 Year Olds | 31 (73.8%) | 11 (26.2%) |
| 35 Years and over | 161 (92.0%) | 14 (8.0%) |
| Total | 1,328 (89.4%) | 158 (10.6%) |
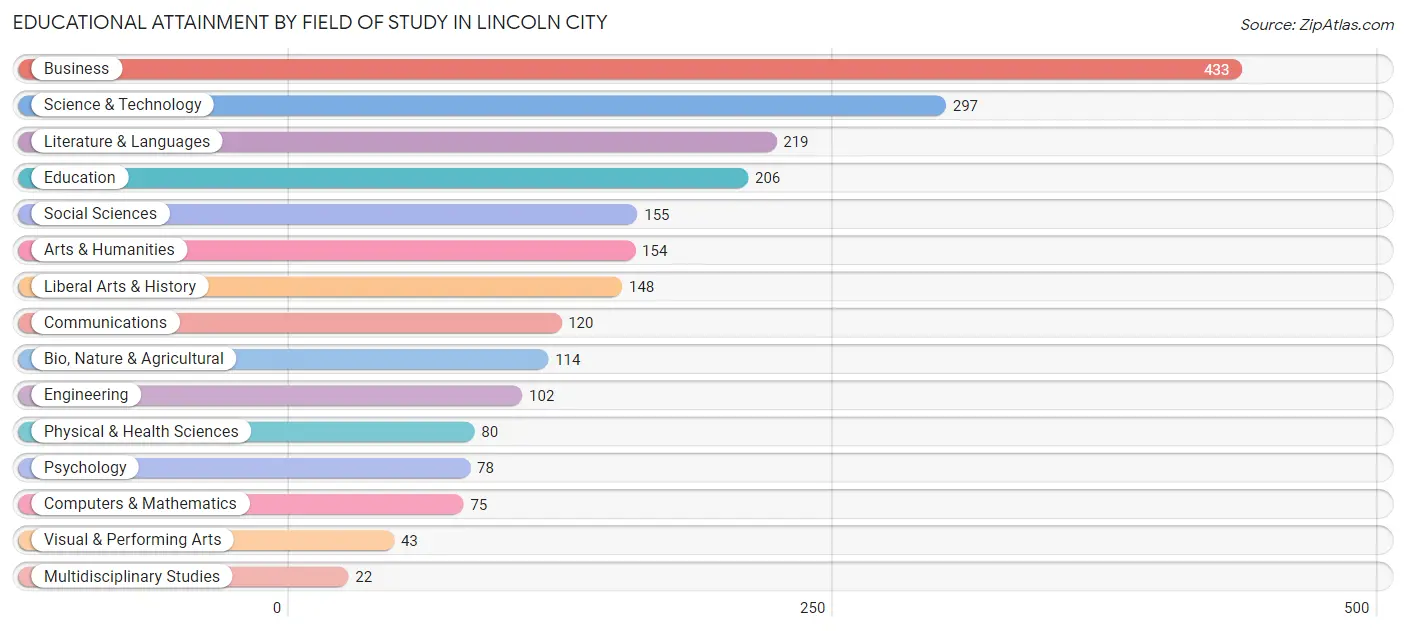
Educational Attainment by Field of Study in Lincoln City
Business (433 | 19.3%), science & technology (297 | 13.2%), literature & languages (219 | 9.8%), education (206 | 9.2%), and social sciences (155 | 6.9%) are the most common fields of study among 2,246 individuals in Lincoln City who have obtained a bachelor's degree or higher.
| Field of Study | # Graduates | % Graduates |
| Computers & Mathematics | 75 | 3.3% |
| Bio, Nature & Agricultural | 114 | 5.1% |
| Physical & Health Sciences | 80 | 3.6% |
| Psychology | 78 | 3.5% |
| Social Sciences | 155 | 6.9% |
| Engineering | 102 | 4.5% |
| Multidisciplinary Studies | 22 | 1.0% |
| Science & Technology | 297 | 13.2% |
| Business | 433 | 19.3% |
| Education | 206 | 9.2% |
| Literature & Languages | 219 | 9.8% |
| Liberal Arts & History | 148 | 6.6% |
| Visual & Performing Arts | 43 | 1.9% |
| Communications | 120 | 5.3% |
| Arts & Humanities | 154 | 6.9% |
| Total | 2,246 | 100.0% |
Transportation & Commute in Lincoln City
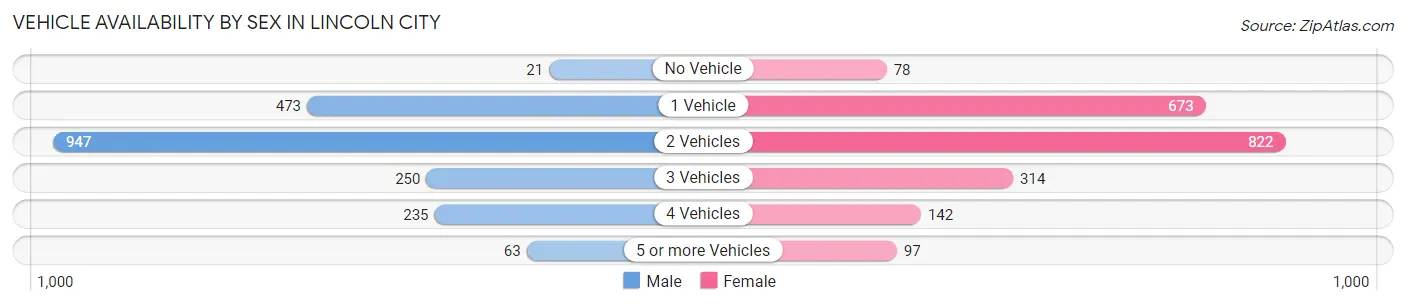
Vehicle Availability by Sex in Lincoln City
The most prevalent vehicle ownership categories in Lincoln City are males with 2 vehicles (947, accounting for 47.6%) and females with 2 vehicles (822, making up 44.5%).
| Vehicles Available | Male | Female |
| No Vehicle | 21 (1.1%) | 78 (3.7%) |
| 1 Vehicle | 473 (23.8%) | 673 (31.7%) |
| 2 Vehicles | 947 (47.6%) | 822 (38.7%) |
| 3 Vehicles | 250 (12.6%) | 314 (14.8%) |
| 4 Vehicles | 235 (11.8%) | 142 (6.7%) |
| 5 or more Vehicles | 63 (3.2%) | 97 (4.6%) |
| Total | 1,989 (100.0%) | 2,126 (100.0%) |
Commute Time in Lincoln City
The most frequently occuring commute durations in Lincoln City are 5 to 9 minutes (988 commuters, 27.7%), 10 to 14 minutes (949 commuters, 26.6%), and 15 to 19 minutes (521 commuters, 14.6%).
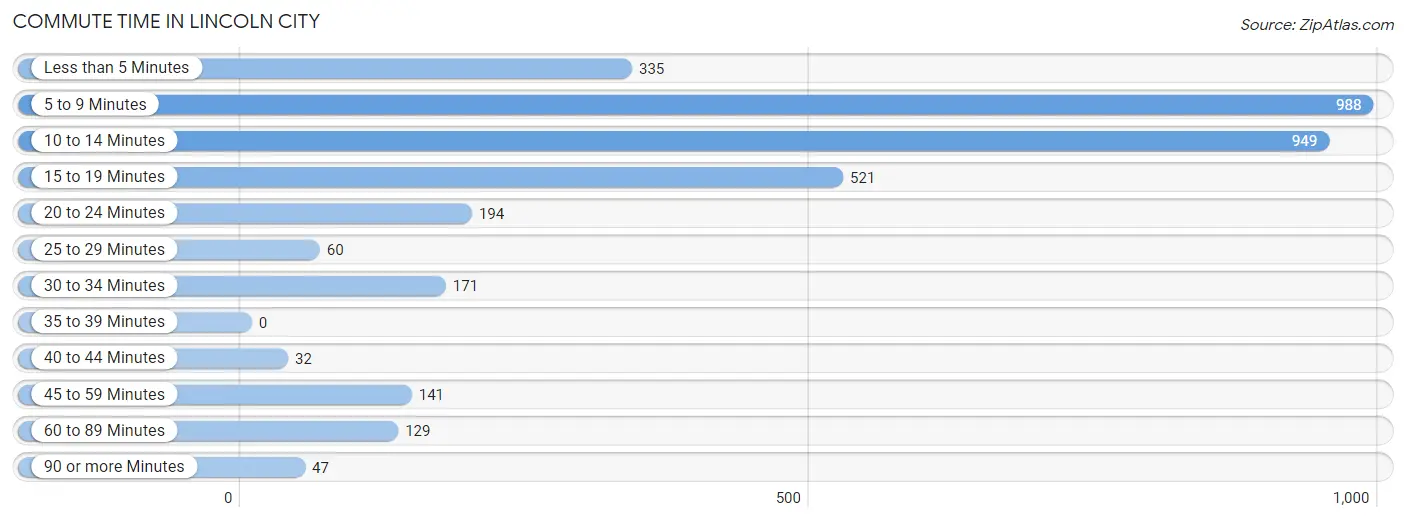
| Commute Time | # Commuters | % Commuters |
| Less than 5 Minutes | 335 | 9.4% |
| 5 to 9 Minutes | 988 | 27.7% |
| 10 to 14 Minutes | 949 | 26.6% |
| 15 to 19 Minutes | 521 | 14.6% |
| 20 to 24 Minutes | 194 | 5.4% |
| 25 to 29 Minutes | 60 | 1.7% |
| 30 to 34 Minutes | 171 | 4.8% |
| 35 to 39 Minutes | 0 | 0.0% |
| 40 to 44 Minutes | 32 | 0.9% |
| 45 to 59 Minutes | 141 | 4.0% |
| 60 to 89 Minutes | 129 | 3.6% |
| 90 or more Minutes | 47 | 1.3% |
Commute Time by Sex in Lincoln City
The most common commute times in Lincoln City are 10 to 14 minutes (418 commuters, 24.4%) for males and 5 to 9 minutes (620 commuters, 33.5%) for females.
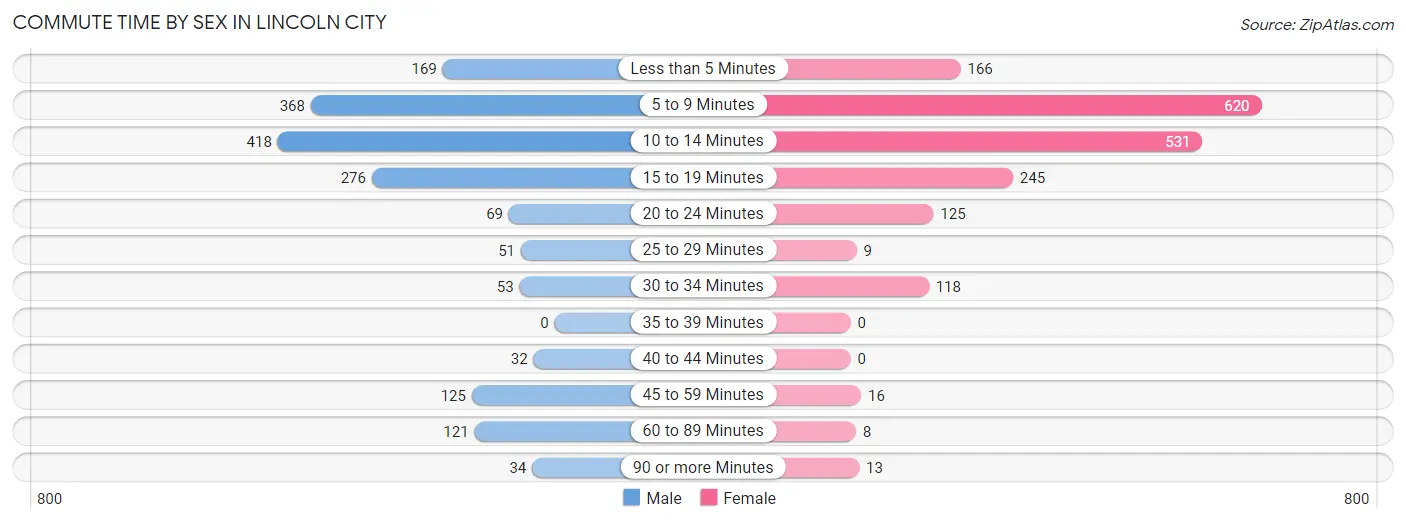
| Commute Time | Male | Female |
| Less than 5 Minutes | 169 (9.9%) | 166 (9.0%) |
| 5 to 9 Minutes | 368 (21.4%) | 620 (33.5%) |
| 10 to 14 Minutes | 418 (24.4%) | 531 (28.7%) |
| 15 to 19 Minutes | 276 (16.1%) | 245 (13.2%) |
| 20 to 24 Minutes | 69 (4.0%) | 125 (6.8%) |
| 25 to 29 Minutes | 51 (3.0%) | 9 (0.5%) |
| 30 to 34 Minutes | 53 (3.1%) | 118 (6.4%) |
| 35 to 39 Minutes | 0 (0.0%) | 0 (0.0%) |
| 40 to 44 Minutes | 32 (1.9%) | 0 (0.0%) |
| 45 to 59 Minutes | 125 (7.3%) | 16 (0.9%) |
| 60 to 89 Minutes | 121 (7.0%) | 8 (0.4%) |
| 90 or more Minutes | 34 (2.0%) | 13 (0.7%) |
Time of Departure to Work by Sex in Lincoln City
The most frequent times of departure to work in Lincoln City are 8:00 AM to 8:29 AM (260, 15.1%) for males and 7:00 AM to 7:29 AM (282, 15.2%) for females.
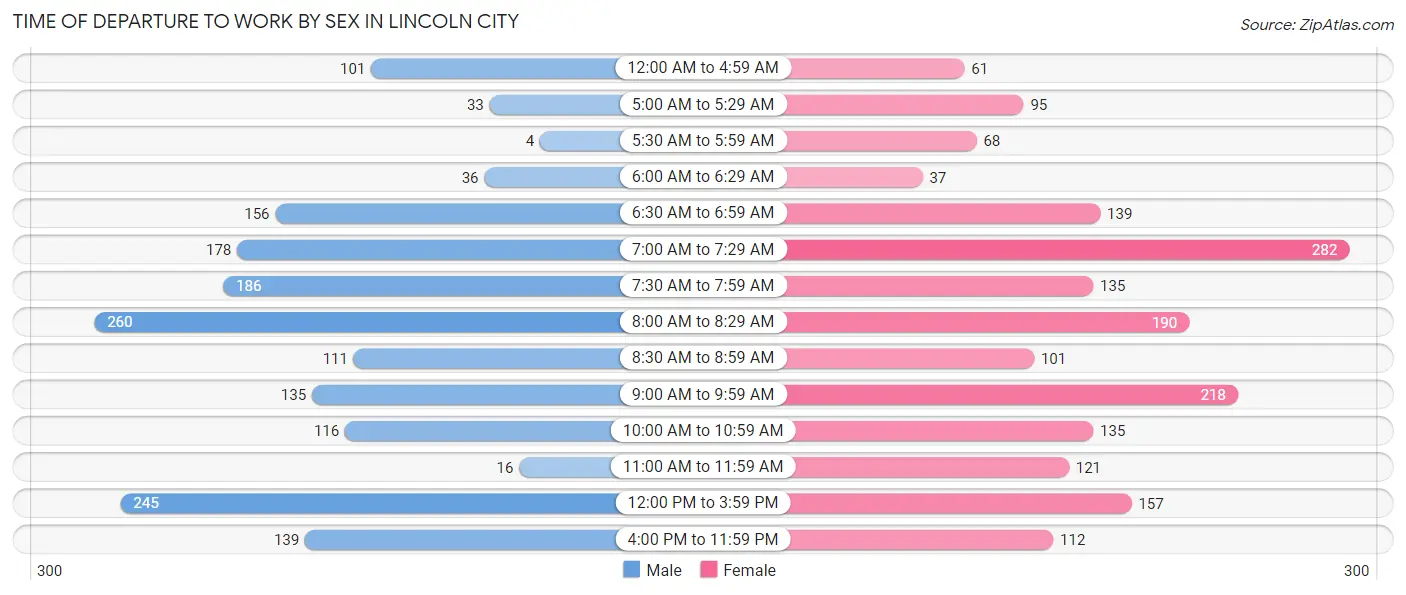
| Time of Departure | Male | Female |
| 12:00 AM to 4:59 AM | 101 (5.9%) | 61 (3.3%) |
| 5:00 AM to 5:29 AM | 33 (1.9%) | 95 (5.1%) |
| 5:30 AM to 5:59 AM | 4 (0.2%) | 68 (3.7%) |
| 6:00 AM to 6:29 AM | 36 (2.1%) | 37 (2.0%) |
| 6:30 AM to 6:59 AM | 156 (9.1%) | 139 (7.5%) |
| 7:00 AM to 7:29 AM | 178 (10.4%) | 282 (15.2%) |
| 7:30 AM to 7:59 AM | 186 (10.8%) | 135 (7.3%) |
| 8:00 AM to 8:29 AM | 260 (15.1%) | 190 (10.3%) |
| 8:30 AM to 8:59 AM | 111 (6.5%) | 101 (5.5%) |
| 9:00 AM to 9:59 AM | 135 (7.9%) | 218 (11.8%) |
| 10:00 AM to 10:59 AM | 116 (6.8%) | 135 (7.3%) |
| 11:00 AM to 11:59 AM | 16 (0.9%) | 121 (6.5%) |
| 12:00 PM to 3:59 PM | 245 (14.3%) | 157 (8.5%) |
| 4:00 PM to 11:59 PM | 139 (8.1%) | 112 (6.0%) |
| Total | 1,716 (100.0%) | 1,851 (100.0%) |
Housing Occupancy in Lincoln City
Occupancy by Ownership in Lincoln City
Of the total 4,291 dwellings in Lincoln City, owner-occupied units account for 2,570 (59.9%), while renter-occupied units make up 1,721 (40.1%).
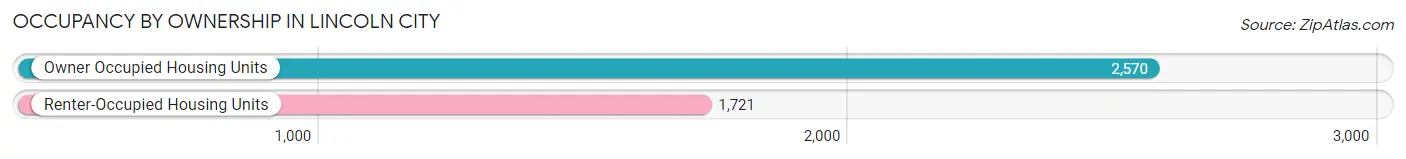
| Occupancy | # Housing Units | % Housing Units |
| Owner Occupied Housing Units | 2,570 | 59.9% |
| Renter-Occupied Housing Units | 1,721 | 40.1% |
| Total Occupied Housing Units | 4,291 | 100.0% |
Occupancy by Household Size in Lincoln City
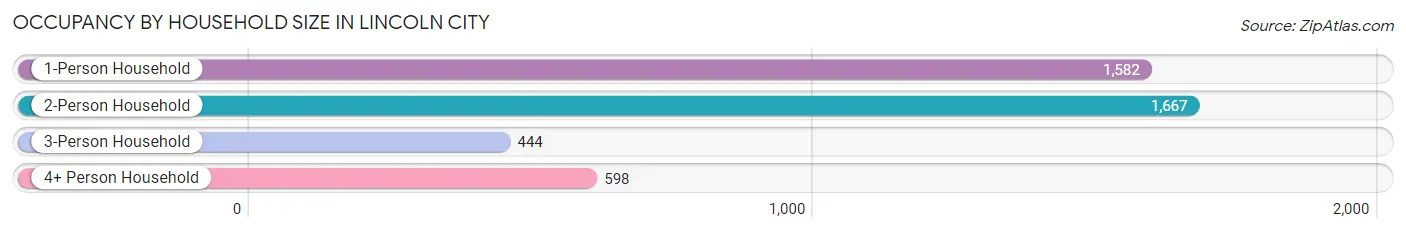
| Household Size | # Housing Units | % Housing Units |
| 1-Person Household | 1,582 | 36.9% |
| 2-Person Household | 1,667 | 38.9% |
| 3-Person Household | 444 | 10.3% |
| 4+ Person Household | 598 | 13.9% |
| Total Housing Units | 4,291 | 100.0% |
Occupancy by Ownership by Household Size in Lincoln City
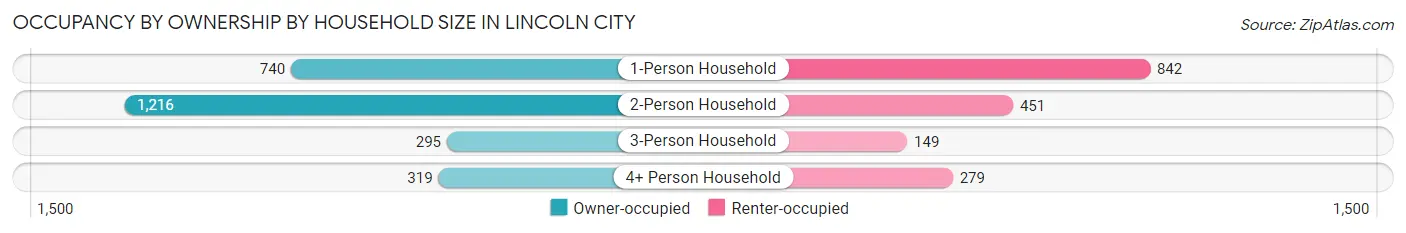
| Household Size | Owner-occupied | Renter-occupied |
| 1-Person Household | 740 (46.8%) | 842 (53.2%) |
| 2-Person Household | 1,216 (73.0%) | 451 (27.1%) |
| 3-Person Household | 295 (66.4%) | 149 (33.6%) |
| 4+ Person Household | 319 (53.3%) | 279 (46.7%) |
| Total Housing Units | 2,570 (59.9%) | 1,721 (40.1%) |
Occupancy by Educational Attainment in Lincoln City
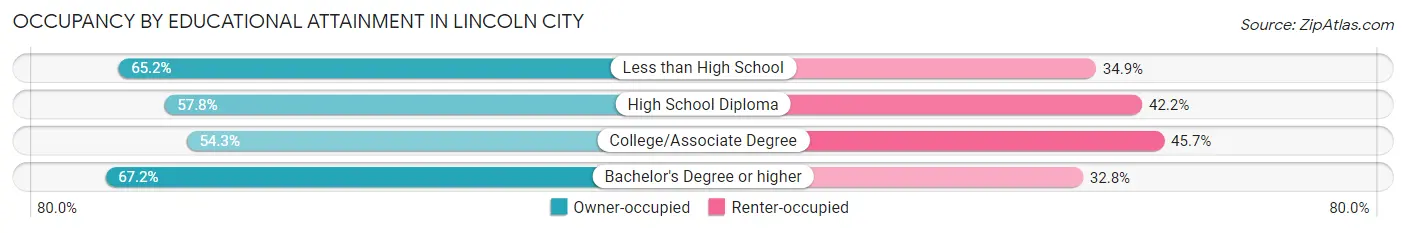
| Household Size | Owner-occupied | Renter-occupied |
| Less than High School | 172 (65.1%) | 92 (34.8%) |
| High School Diploma | 469 (57.8%) | 342 (42.2%) |
| College/Associate Degree | 980 (54.3%) | 824 (45.7%) |
| Bachelor's Degree or higher | 949 (67.2%) | 463 (32.8%) |
Occupancy by Age of Householder in Lincoln City
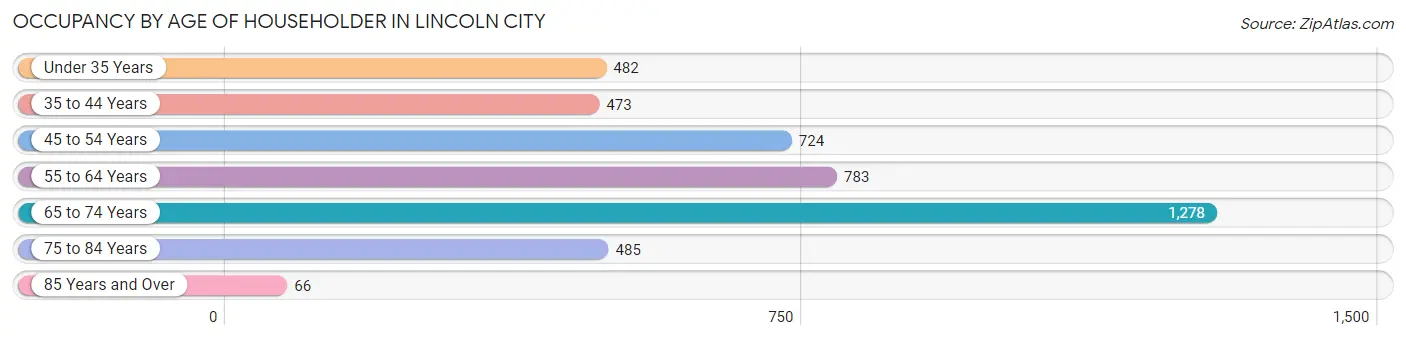
| Age Bracket | # Households | % Households |
| Under 35 Years | 482 | 11.2% |
| 35 to 44 Years | 473 | 11.0% |
| 45 to 54 Years | 724 | 16.9% |
| 55 to 64 Years | 783 | 18.2% |
| 65 to 74 Years | 1,278 | 29.8% |
| 75 to 84 Years | 485 | 11.3% |
| 85 Years and Over | 66 | 1.5% |
| Total | 4,291 | 100.0% |
Housing Finances in Lincoln City
Median Income by Occupancy in Lincoln City
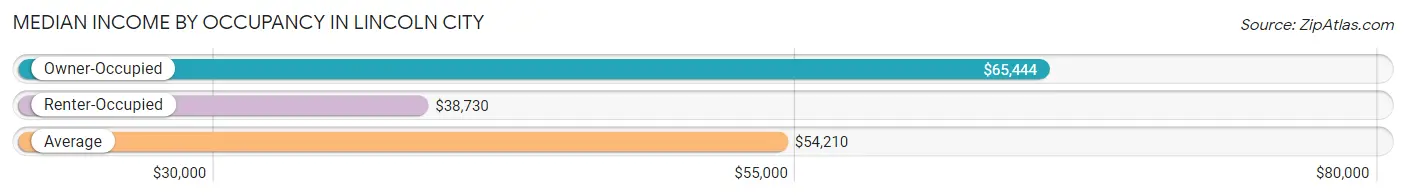
| Occupancy Type | # Households | Median Income |
| Owner-Occupied | 2,570 (59.9%) | $65,444 |
| Renter-Occupied | 1,721 (40.1%) | $38,730 |
| Average | 4,291 (100.0%) | $54,210 |
Occupancy by Householder Income Bracket in Lincoln City
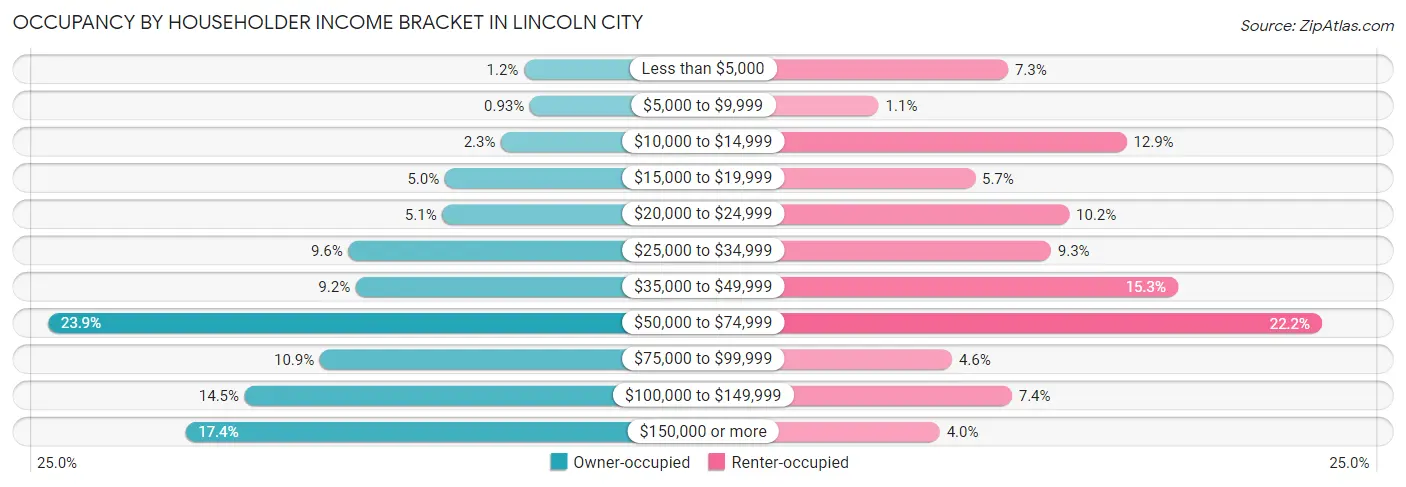
| Income Bracket | Owner-occupied | Renter-occupied |
| Less than $5,000 | 31 (1.2%) | 125 (7.3%) |
| $5,000 to $9,999 | 24 (0.9%) | 19 (1.1%) |
| $10,000 to $14,999 | 59 (2.3%) | 222 (12.9%) |
| $15,000 to $19,999 | 128 (5.0%) | 98 (5.7%) |
| $20,000 to $24,999 | 131 (5.1%) | 175 (10.2%) |
| $25,000 to $34,999 | 246 (9.6%) | 160 (9.3%) |
| $35,000 to $49,999 | 237 (9.2%) | 264 (15.3%) |
| $50,000 to $74,999 | 614 (23.9%) | 382 (22.2%) |
| $75,000 to $99,999 | 281 (10.9%) | 79 (4.6%) |
| $100,000 to $149,999 | 373 (14.5%) | 128 (7.4%) |
| $150,000 or more | 446 (17.3%) | 69 (4.0%) |
| Total | 2,570 (100.0%) | 1,721 (100.0%) |
Monthly Housing Cost Tiers in Lincoln City
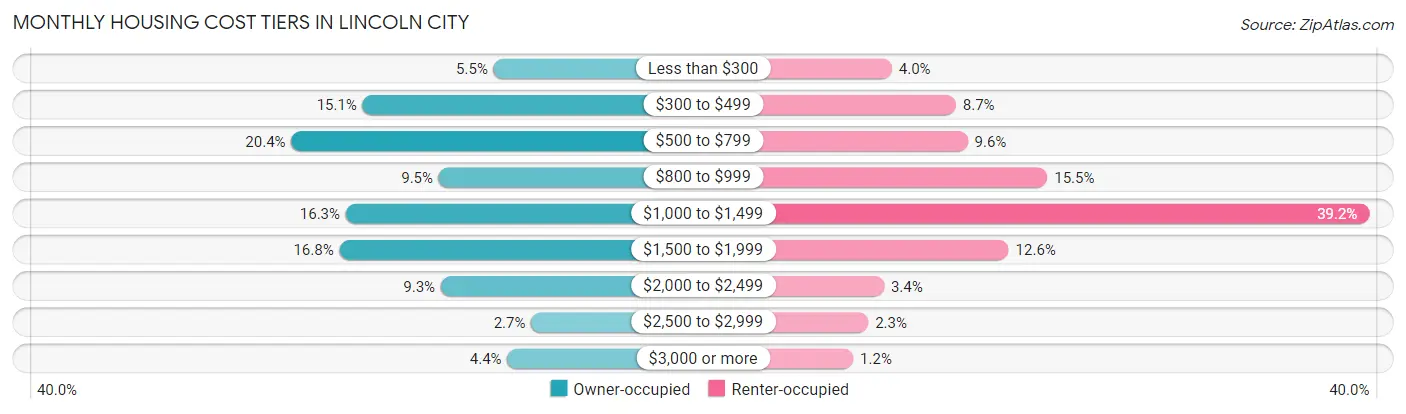
| Monthly Cost | Owner-occupied | Renter-occupied |
| Less than $300 | 140 (5.4%) | 69 (4.0%) |
| $300 to $499 | 388 (15.1%) | 150 (8.7%) |
| $500 to $799 | 523 (20.3%) | 165 (9.6%) |
| $800 to $999 | 244 (9.5%) | 266 (15.5%) |
| $1,000 to $1,499 | 420 (16.3%) | 674 (39.2%) |
| $1,500 to $1,999 | 432 (16.8%) | 217 (12.6%) |
| $2,000 to $2,499 | 240 (9.3%) | 59 (3.4%) |
| $2,500 to $2,999 | 69 (2.7%) | 39 (2.3%) |
| $3,000 or more | 114 (4.4%) | 20 (1.2%) |
| Total | 2,570 (100.0%) | 1,721 (100.0%) |
Physical Housing Characteristics in Lincoln City
Housing Structures in Lincoln City
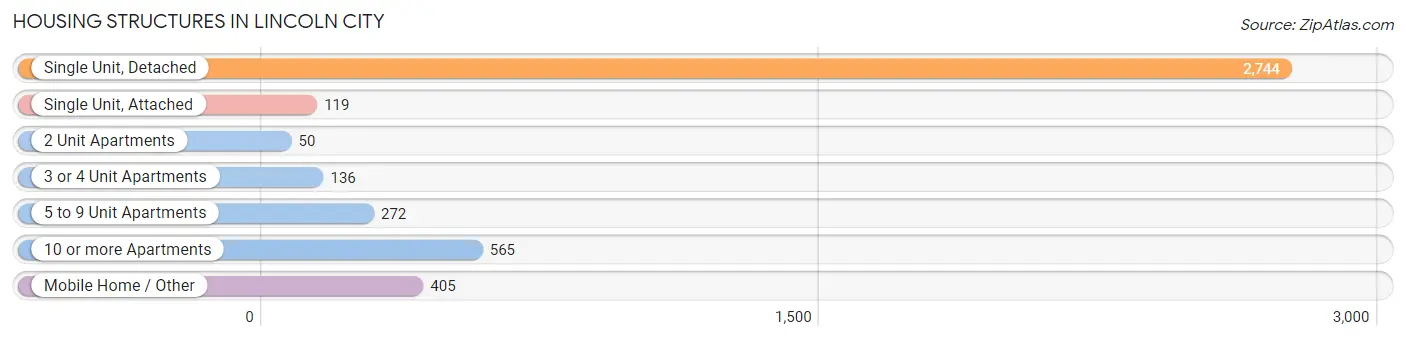
| Structure Type | # Housing Units | % Housing Units |
| Single Unit, Detached | 2,744 | 63.9% |
| Single Unit, Attached | 119 | 2.8% |
| 2 Unit Apartments | 50 | 1.2% |
| 3 or 4 Unit Apartments | 136 | 3.2% |
| 5 to 9 Unit Apartments | 272 | 6.3% |
| 10 or more Apartments | 565 | 13.2% |
| Mobile Home / Other | 405 | 9.4% |
| Total | 4,291 | 100.0% |
Housing Structures by Occupancy in Lincoln City
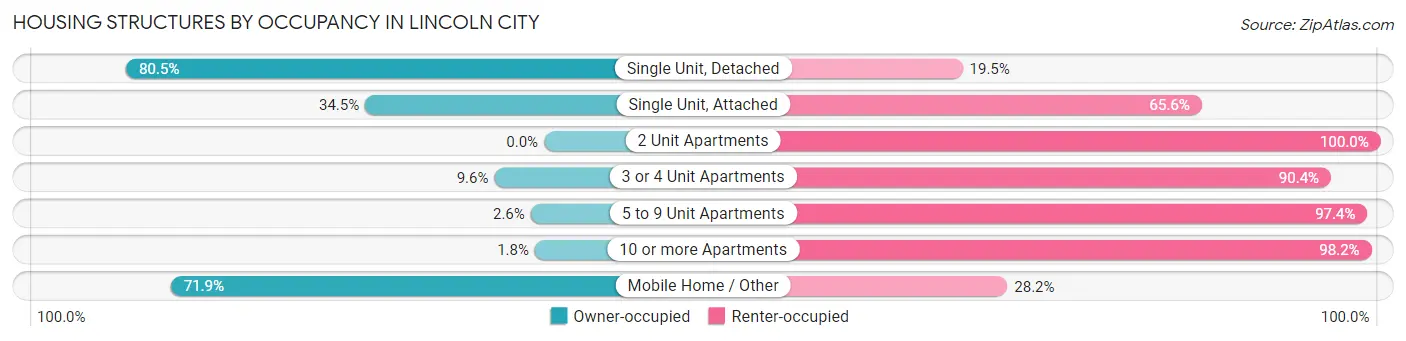
| Structure Type | Owner-occupied | Renter-occupied |
| Single Unit, Detached | 2,208 (80.5%) | 536 (19.5%) |
| Single Unit, Attached | 41 (34.4%) | 78 (65.5%) |
| 2 Unit Apartments | 0 (0.0%) | 50 (100.0%) |
| 3 or 4 Unit Apartments | 13 (9.6%) | 123 (90.4%) |
| 5 to 9 Unit Apartments | 7 (2.6%) | 265 (97.4%) |
| 10 or more Apartments | 10 (1.8%) | 555 (98.2%) |
| Mobile Home / Other | 291 (71.9%) | 114 (28.1%) |
| Total | 2,570 (59.9%) | 1,721 (40.1%) |
Housing Structures by Number of Rooms in Lincoln City
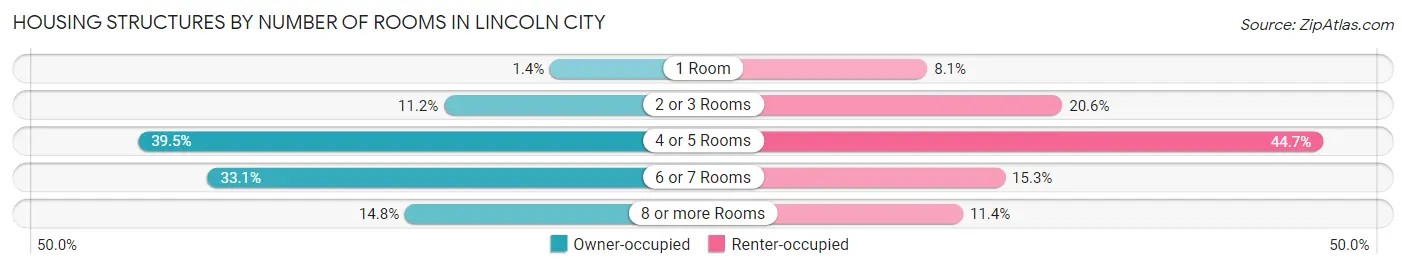
| Number of Rooms | Owner-occupied | Renter-occupied |
| 1 Room | 36 (1.4%) | 139 (8.1%) |
| 2 or 3 Rooms | 288 (11.2%) | 354 (20.6%) |
| 4 or 5 Rooms | 1,015 (39.5%) | 769 (44.7%) |
| 6 or 7 Rooms | 850 (33.1%) | 263 (15.3%) |
| 8 or more Rooms | 381 (14.8%) | 196 (11.4%) |
| Total | 2,570 (100.0%) | 1,721 (100.0%) |
Housing Structure by Heating Type in Lincoln City
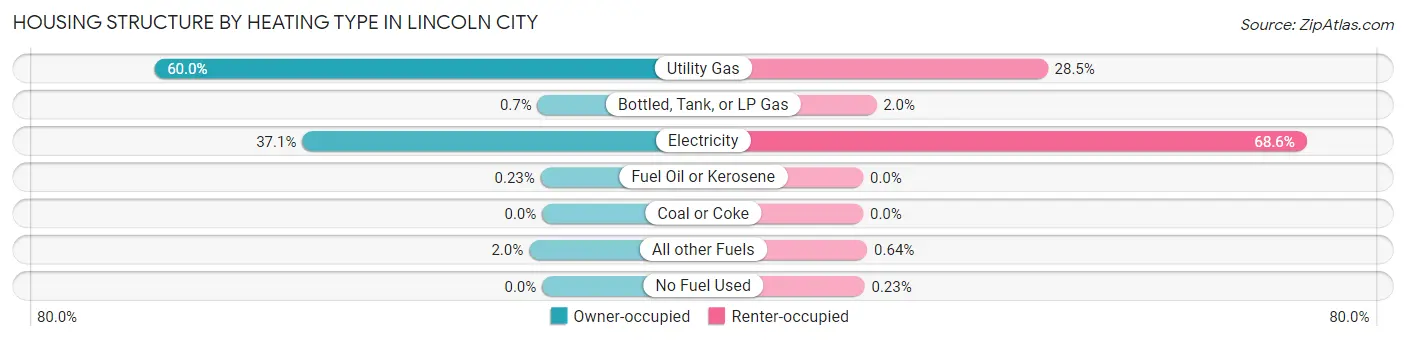
| Heating Type | Owner-occupied | Renter-occupied |
| Utility Gas | 1,541 (60.0%) | 491 (28.5%) |
| Bottled, Tank, or LP Gas | 18 (0.7%) | 35 (2.0%) |
| Electricity | 953 (37.1%) | 1,180 (68.6%) |
| Fuel Oil or Kerosene | 6 (0.2%) | 0 (0.0%) |
| Coal or Coke | 0 (0.0%) | 0 (0.0%) |
| All other Fuels | 52 (2.0%) | 11 (0.6%) |
| No Fuel Used | 0 (0.0%) | 4 (0.2%) |
| Total | 2,570 (100.0%) | 1,721 (100.0%) |
Household Vehicle Usage in Lincoln City
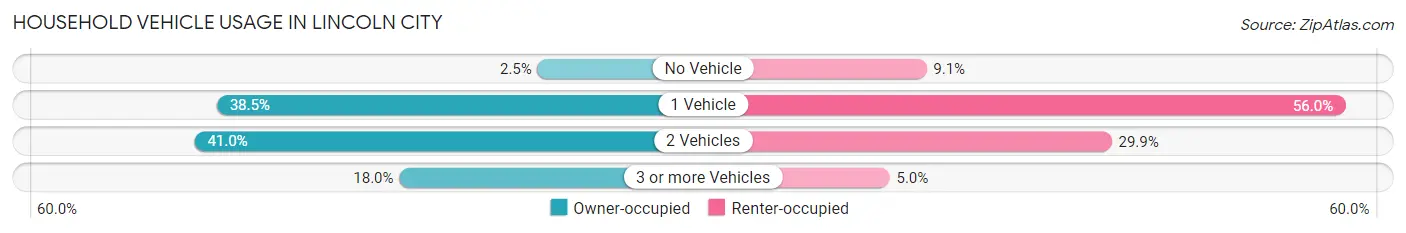
| Vehicles per Household | Owner-occupied | Renter-occupied |
| No Vehicle | 65 (2.5%) | 157 (9.1%) |
| 1 Vehicle | 989 (38.5%) | 964 (56.0%) |
| 2 Vehicles | 1,053 (41.0%) | 514 (29.9%) |
| 3 or more Vehicles | 463 (18.0%) | 86 (5.0%) |
| Total | 2,570 (100.0%) | 1,721 (100.0%) |
Real Estate & Mortgages in Lincoln City
Real Estate and Mortgage Overview in Lincoln City
| Characteristic | Without Mortgage | With Mortgage |
| Housing Units | 1,154 | 1,416 |
| Median Property Value | $341,600 | $327,100 |
| Median Household Income | $53,553 | $278 |
| Monthly Housing Costs | $531 | $108 |
| Real Estate Taxes | $4,041 | $43 |
Property Value by Mortgage Status in Lincoln City
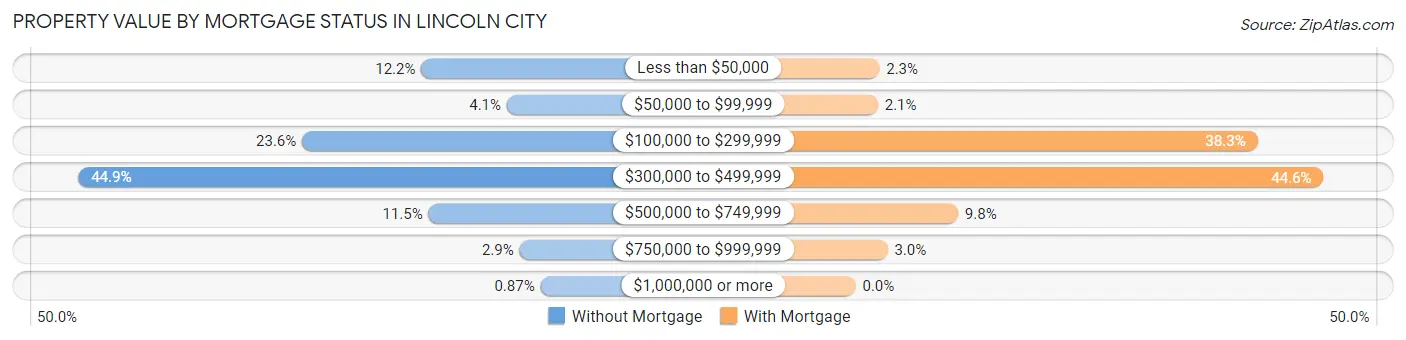
| Property Value | Without Mortgage | With Mortgage |
| Less than $50,000 | 141 (12.2%) | 32 (2.3%) |
| $50,000 to $99,999 | 47 (4.1%) | 30 (2.1%) |
| $100,000 to $299,999 | 272 (23.6%) | 542 (38.3%) |
| $300,000 to $499,999 | 518 (44.9%) | 631 (44.6%) |
| $500,000 to $749,999 | 133 (11.5%) | 138 (9.8%) |
| $750,000 to $999,999 | 33 (2.9%) | 43 (3.0%) |
| $1,000,000 or more | 10 (0.9%) | 0 (0.0%) |
| Total | 1,154 (100.0%) | 1,416 (100.0%) |
Household Income by Mortgage Status in Lincoln City
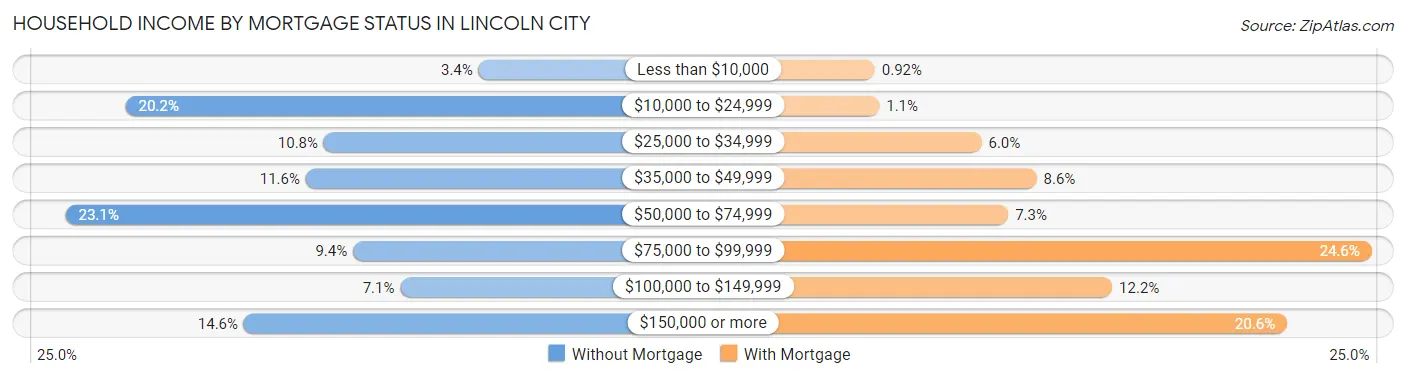
| Household Income | Without Mortgage | With Mortgage |
| Less than $10,000 | 39 (3.4%) | 13 (0.9%) |
| $10,000 to $24,999 | 233 (20.2%) | 16 (1.1%) |
| $25,000 to $34,999 | 124 (10.7%) | 85 (6.0%) |
| $35,000 to $49,999 | 134 (11.6%) | 122 (8.6%) |
| $50,000 to $74,999 | 266 (23.1%) | 103 (7.3%) |
| $75,000 to $99,999 | 108 (9.4%) | 348 (24.6%) |
| $100,000 to $149,999 | 82 (7.1%) | 173 (12.2%) |
| $150,000 or more | 168 (14.6%) | 291 (20.5%) |
| Total | 1,154 (100.0%) | 1,416 (100.0%) |
Property Value to Household Income Ratio in Lincoln City
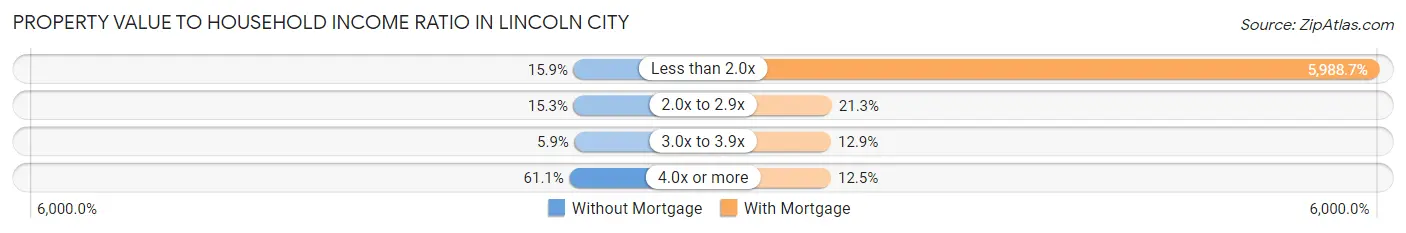
| Value-to-Income Ratio | Without Mortgage | With Mortgage |
| Less than 2.0x | 184 (15.9%) | 84,800 (5,988.7%) |
| 2.0x to 2.9x | 177 (15.3%) | 302 (21.3%) |
| 3.0x to 3.9x | 68 (5.9%) | 183 (12.9%) |
| 4.0x or more | 705 (61.1%) | 177 (12.5%) |
| Total | 1,154 (100.0%) | 1,416 (100.0%) |
Real Estate Taxes by Mortgage Status in Lincoln City
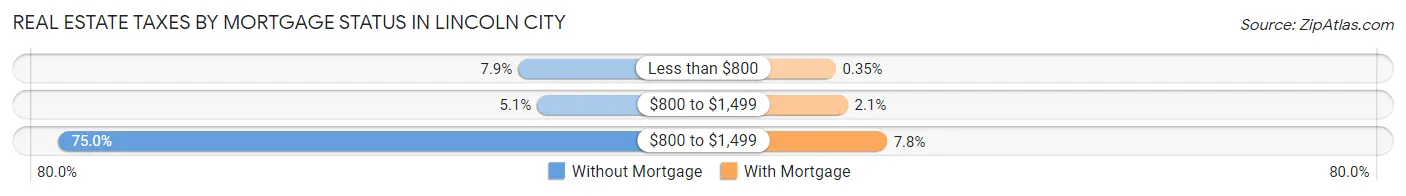
| Property Taxes | Without Mortgage | With Mortgage |
| Less than $800 | 91 (7.9%) | 5 (0.4%) |
| $800 to $1,499 | 59 (5.1%) | 30 (2.1%) |
| $800 to $1,499 | 866 (75.0%) | 111 (7.8%) |
| Total | 1,154 (100.0%) | 1,416 (100.0%) |
Health & Disability in Lincoln City
Health Insurance Coverage by Age in Lincoln City
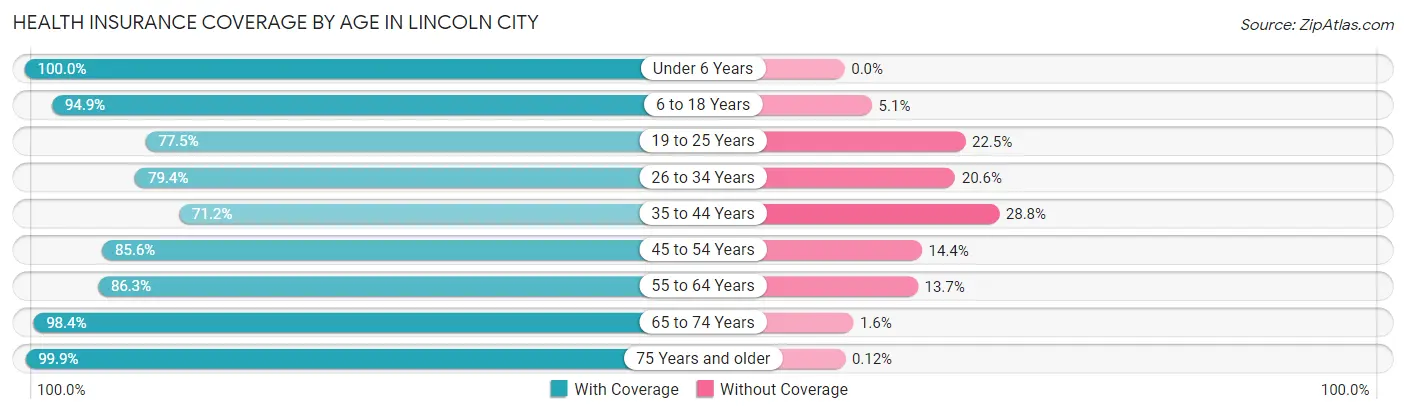
| Age Bracket | With Coverage | Without Coverage |
| Under 6 Years | 587 (100.0%) | 0 (0.0%) |
| 6 to 18 Years | 1,004 (94.9%) | 54 (5.1%) |
| 19 to 25 Years | 365 (77.5%) | 106 (22.5%) |
| 26 to 34 Years | 786 (79.4%) | 204 (20.6%) |
| 35 to 44 Years | 783 (71.2%) | 317 (28.8%) |
| 45 to 54 Years | 997 (85.6%) | 168 (14.4%) |
| 55 to 64 Years | 1,334 (86.3%) | 211 (13.7%) |
| 65 to 74 Years | 1,943 (98.4%) | 32 (1.6%) |
| 75 Years and older | 806 (99.9%) | 1 (0.1%) |
| Total | 8,605 (88.7%) | 1,093 (11.3%) |
Health Insurance Coverage by Citizenship Status in Lincoln City
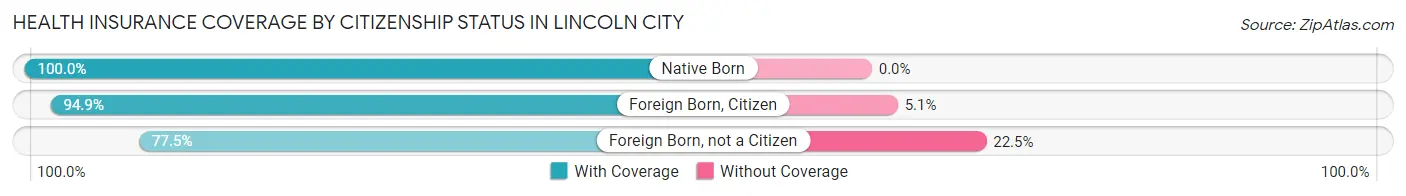
| Citizenship Status | With Coverage | Without Coverage |
| Native Born | 587 (100.0%) | 0 (0.0%) |
| Foreign Born, Citizen | 1,004 (94.9%) | 54 (5.1%) |
| Foreign Born, not a Citizen | 365 (77.5%) | 106 (22.5%) |
Health Insurance Coverage by Household Income in Lincoln City
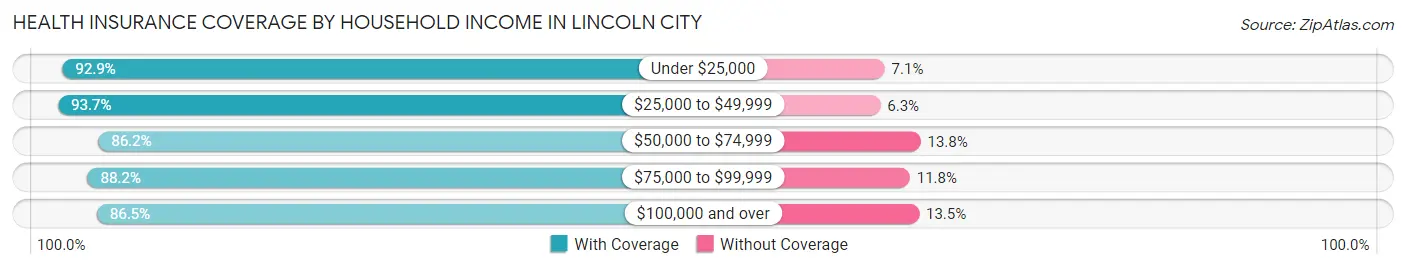
| Household Income | With Coverage | Without Coverage |
| Under $25,000 | 1,232 (92.9%) | 94 (7.1%) |
| $25,000 to $49,999 | 1,612 (93.7%) | 108 (6.3%) |
| $50,000 to $74,999 | 2,146 (86.2%) | 344 (13.8%) |
| $75,000 to $99,999 | 777 (88.2%) | 104 (11.8%) |
| $100,000 and over | 2,815 (86.5%) | 441 (13.5%) |
Public vs Private Health Insurance Coverage by Age in Lincoln City
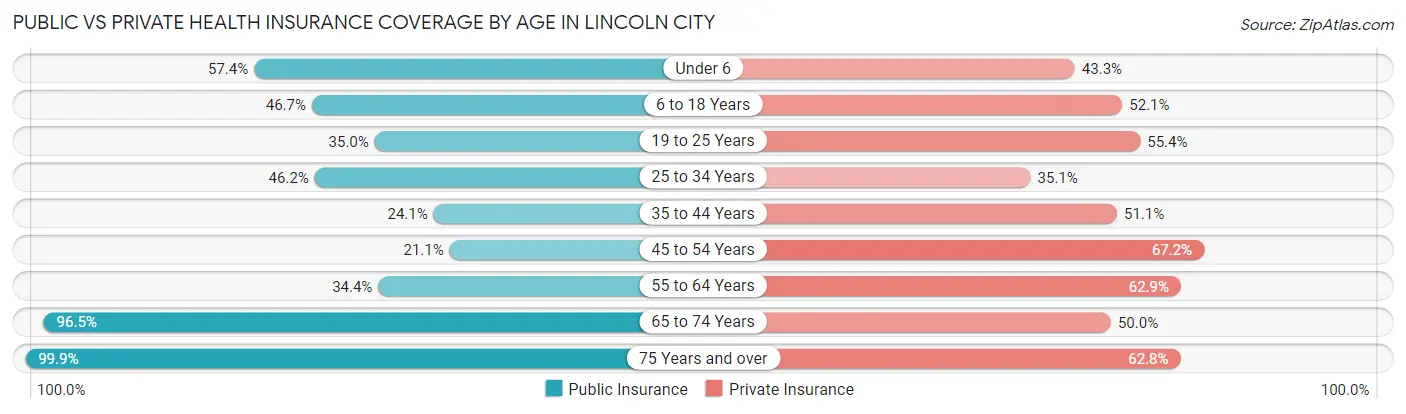
| Age Bracket | Public Insurance | Private Insurance |
| Under 6 | 337 (57.4%) | 254 (43.3%) |
| 6 to 18 Years | 494 (46.7%) | 551 (52.1%) |
| 19 to 25 Years | 165 (35.0%) | 261 (55.4%) |
| 25 to 34 Years | 457 (46.2%) | 347 (35.0%) |
| 35 to 44 Years | 265 (24.1%) | 562 (51.1%) |
| 45 to 54 Years | 246 (21.1%) | 783 (67.2%) |
| 55 to 64 Years | 531 (34.4%) | 972 (62.9%) |
| 65 to 74 Years | 1,905 (96.5%) | 987 (50.0%) |
| 75 Years and over | 806 (99.9%) | 507 (62.8%) |
| Total | 5,206 (53.7%) | 5,224 (53.9%) |
Disability Status by Sex by Age in Lincoln City
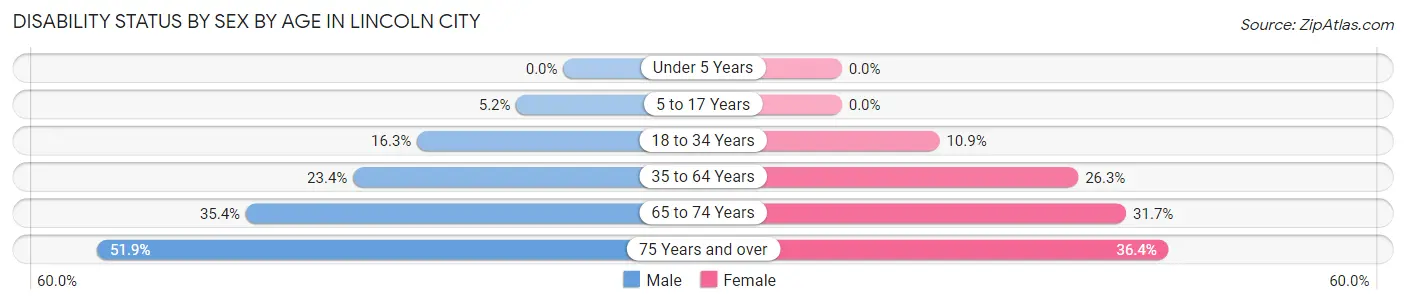
| Age Bracket | Male | Female |
| Under 5 Years | 0 (0.0%) | 0 (0.0%) |
| 5 to 17 Years | 37 (5.2%) | 0 (0.0%) |
| 18 to 34 Years | 106 (16.3%) | 93 (10.9%) |
| 35 to 64 Years | 394 (23.4%) | 560 (26.3%) |
| 65 to 74 Years | 322 (35.3%) | 337 (31.7%) |
| 75 Years and over | 188 (51.9%) | 162 (36.4%) |
Disability Class by Sex by Age in Lincoln City
Disability Class: Hearing Difficulty
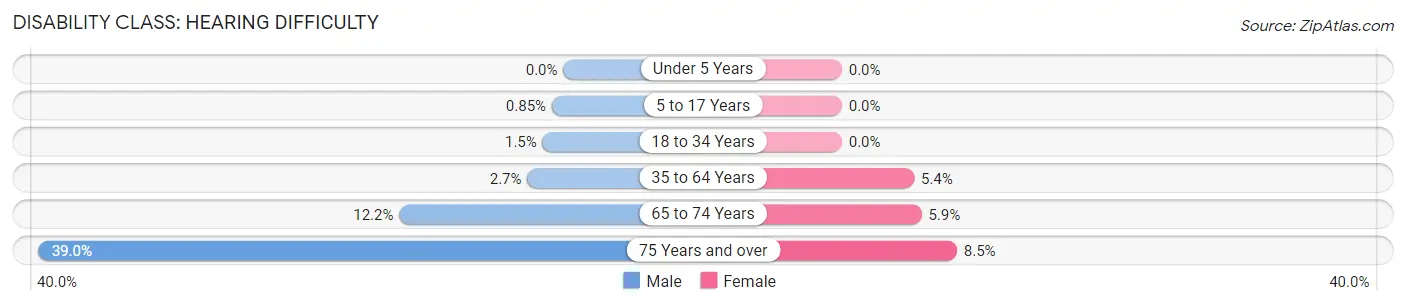
| Age Bracket | Male | Female |
| Under 5 Years | 0 (0.0%) | 0 (0.0%) |
| 5 to 17 Years | 6 (0.9%) | 0 (0.0%) |
| 18 to 34 Years | 10 (1.5%) | 0 (0.0%) |
| 35 to 64 Years | 45 (2.7%) | 114 (5.4%) |
| 65 to 74 Years | 111 (12.2%) | 63 (5.9%) |
| 75 Years and over | 141 (39.0%) | 38 (8.5%) |
Disability Class: Vision Difficulty
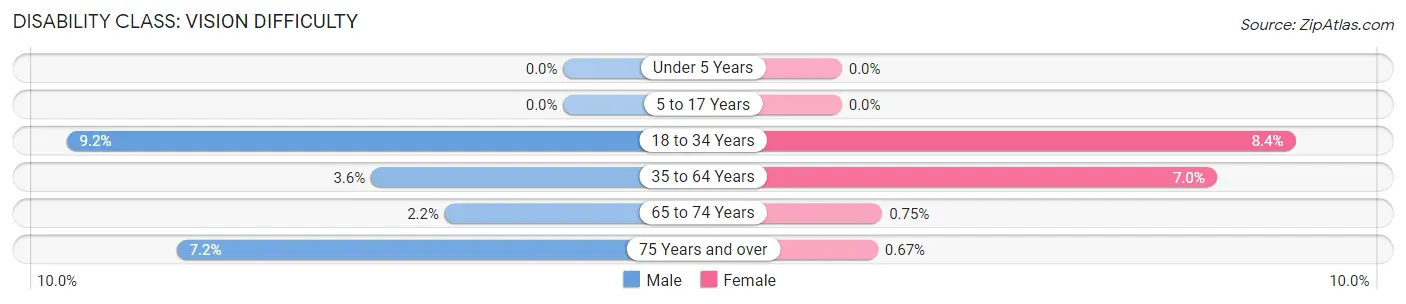
| Age Bracket | Male | Female |
| Under 5 Years | 0 (0.0%) | 0 (0.0%) |
| 5 to 17 Years | 0 (0.0%) | 0 (0.0%) |
| 18 to 34 Years | 60 (9.2%) | 72 (8.4%) |
| 35 to 64 Years | 60 (3.6%) | 148 (7.0%) |
| 65 to 74 Years | 20 (2.2%) | 8 (0.7%) |
| 75 Years and over | 26 (7.2%) | 3 (0.7%) |
Disability Class: Cognitive Difficulty
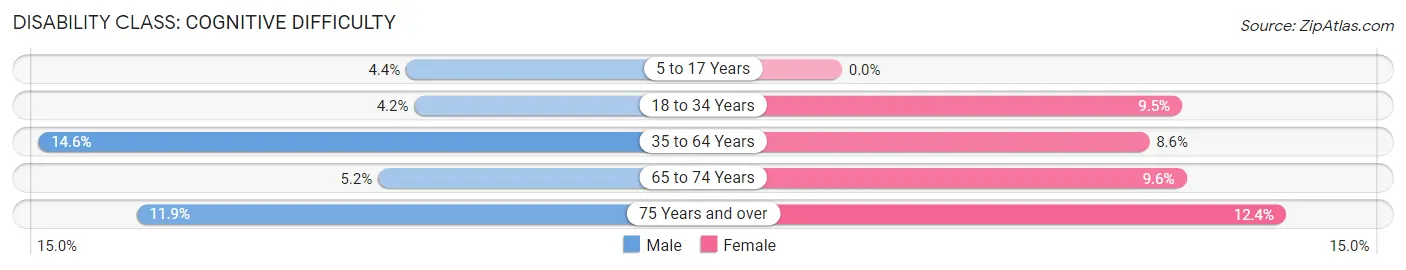
| Age Bracket | Male | Female |
| 5 to 17 Years | 31 (4.4%) | 0 (0.0%) |
| 18 to 34 Years | 27 (4.2%) | 81 (9.5%) |
| 35 to 64 Years | 246 (14.6%) | 182 (8.6%) |
| 65 to 74 Years | 47 (5.2%) | 102 (9.6%) |
| 75 Years and over | 43 (11.9%) | 55 (12.4%) |
Disability Class: Ambulatory Difficulty
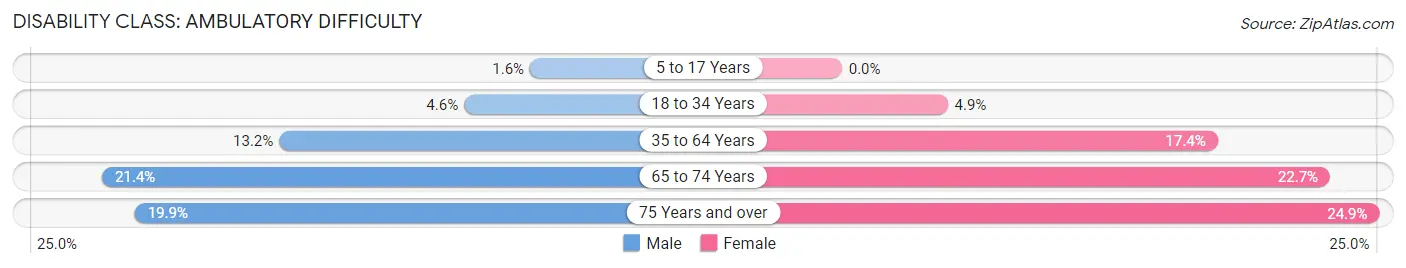
| Age Bracket | Male | Female |
| 5 to 17 Years | 11 (1.5%) | 0 (0.0%) |
| 18 to 34 Years | 30 (4.6%) | 42 (4.9%) |
| 35 to 64 Years | 222 (13.2%) | 371 (17.4%) |
| 65 to 74 Years | 195 (21.4%) | 241 (22.7%) |
| 75 Years and over | 72 (19.9%) | 111 (24.9%) |
Disability Class: Self-Care Difficulty
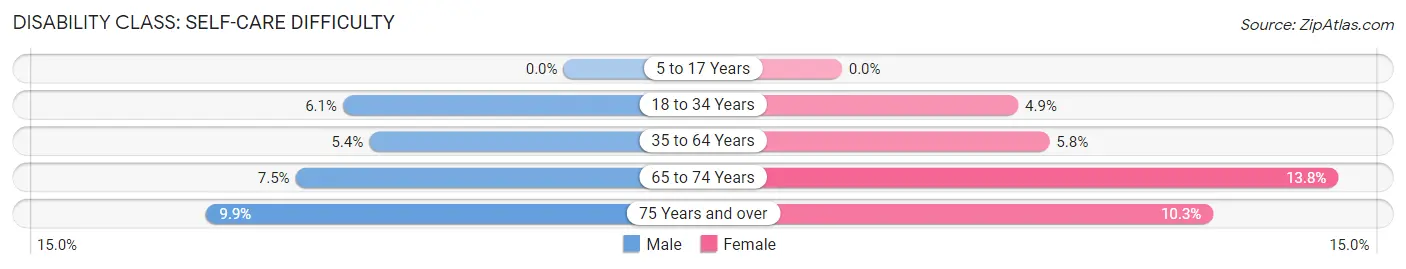
| Age Bracket | Male | Female |
| 5 to 17 Years | 0 (0.0%) | 0 (0.0%) |
| 18 to 34 Years | 40 (6.1%) | 42 (4.9%) |
| 35 to 64 Years | 91 (5.4%) | 123 (5.8%) |
| 65 to 74 Years | 68 (7.5%) | 147 (13.8%) |
| 75 Years and over | 36 (9.9%) | 46 (10.3%) |
Technology Access in Lincoln City
Computing Device Access in Lincoln City
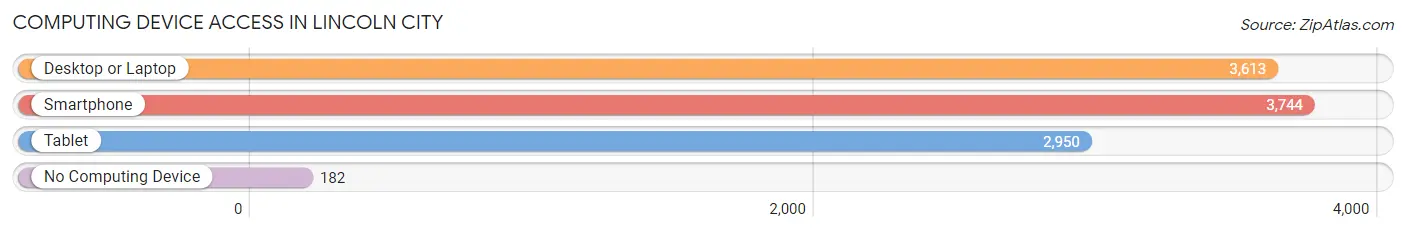
| Device Type | # Households | % Households |
| Desktop or Laptop | 3,613 | 84.2% |
| Smartphone | 3,744 | 87.3% |
| Tablet | 2,950 | 68.8% |
| No Computing Device | 182 | 4.2% |
| Total | 4,291 | 100.0% |
Internet Access in Lincoln City
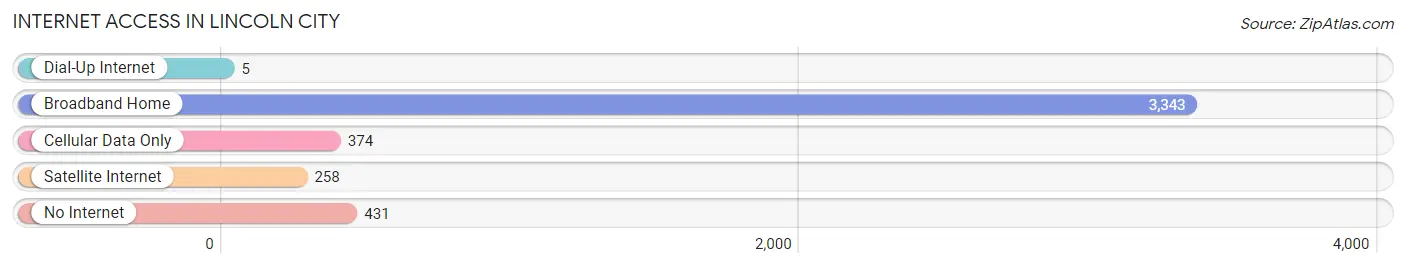
| Internet Type | # Households | % Households |
| Dial-Up Internet | 5 | 0.1% |
| Broadband Home | 3,343 | 77.9% |
| Cellular Data Only | 374 | 8.7% |
| Satellite Internet | 258 | 6.0% |
| No Internet | 431 | 10.0% |
| Total | 4,291 | 100.0% |
Lincoln City Summary
Lincoln City is a city located in the central Oregon Coast, in Lincoln County, Oregon. It is situated on the Pacific Ocean, about 60 miles (97 km) southwest of Portland. The city is known for its seven miles of sandy beaches, its fishing and crabbing opportunities, and its proximity to the Cascade Mountains.
History
The area that is now Lincoln City was first inhabited by the Siletz people, a Native American tribe of the Salishan language family. The Siletz people lived in the area for thousands of years, and were known for their fishing and hunting skills.
In 1851, the first white settlers arrived in the area, and the town of Delake was established. The town was named after the nearby lake, which was named after the Siletz chief, Delake. In 1865, the town was renamed Lincoln City, after President Abraham Lincoln.
In the late 1800s, the town began to grow as a fishing and logging community. The first cannery was built in 1891, and the first sawmill was built in 1895. The town was incorporated in 1965.
Geography
Lincoln City is located on the central Oregon Coast, in Lincoln County. It is situated on the Pacific Ocean, about 60 miles (97 km) southwest of Portland. The city is bordered by the Siletz Bay to the north, and the Pacific Ocean to the west. The city is located on a narrow strip of land between the ocean and the Siletz Bay.
The city has a total area of 8.3 square miles (21.5 km2), of which 8.2 square miles (21.3 km2) is land and 0.1 square miles (0.2 km2) is water. The city is located at an elevation of 40 feet (12 m).
Economy
Lincoln City’s economy is largely based on tourism. The city is known for its seven miles of sandy beaches, its fishing and crabbing opportunities, and its proximity to the Cascade Mountains. The city is also home to several resorts, hotels, and restaurants.
The city is also home to several manufacturing companies, including a wood products company, a boat building company, and a seafood processing plant. The city is also home to several retail stores, including a grocery store, a hardware store, and a clothing store.
Demographics
As of the 2010 census, the population of Lincoln City was 7,930. The racial makeup of the city was 91.2% White, 0.7% African American, 1.2% Native American, 1.2% Asian, 0.2% Pacific Islander, 2.2% from other races, and 3.3% from two or more races. Hispanic or Latino of any race were 6.2% of the population.
The median income for a household in the city was $37,917, and the median income for a family was $45,938. The per capita income for the city was $20,945. About 11.2% of families and 15.2% of the population were below the poverty line, including 22.2% of those under age 18 and 8.2% of those age 65 or over.
Common Questions
What is Per Capita Income in Lincoln City?
Per Capita income in Lincoln City is $38,282.
What is the Median Family Income in Lincoln City?
Median Family Income in Lincoln City is $67,448.
What is the Median Household income in Lincoln City?
Median Household Income in Lincoln City is $54,210.
What is Income or Wage Gap in Lincoln City?
Income or Wage Gap in Lincoln City is 7.4%.
Women in Lincoln City earn 92.6 cents for every dollar earned by a man.
What is Inequality or Gini Index in Lincoln City?
Inequality or Gini Index in Lincoln City is 0.53.
What is the Total Population of Lincoln City?
Total Population of Lincoln City is 9,790.
What is the Total Male Population of Lincoln City?
Total Male Population of Lincoln City is 4,608.
What is the Total Female Population of Lincoln City?
Total Female Population of Lincoln City is 5,182.
What is the Ratio of Males per 100 Females in Lincoln City?
There are 88.92 Males per 100 Females in Lincoln City.
What is the Ratio of Females per 100 Males in Lincoln City?
There are 112.46 Females per 100 Males in Lincoln City.
What is the Median Population Age in Lincoln City?
Median Population Age in Lincoln City is 50.6 Years.
What is the Average Family Size in Lincoln City
Average Family Size in Lincoln City is 2.9 People.
What is the Average Household Size in Lincoln City
Average Household Size in Lincoln City is 2.2 People.
How Large is the Labor Force in Lincoln City?
There are 4,362 People in the Labor Forcein in Lincoln City.
What is the Percentage of People in the Labor Force in Lincoln City?
52.4% of People are in the Labor Force in Lincoln City.
What is the Unemployment Rate in Lincoln City?
Unemployment Rate in Lincoln City is 3.9%.