Manassas, VA Map & Demographics
Manassas Map
Manassas Overview
$42,958
PER CAPITA INCOME
$123,147
AVG FAMILY INCOME
$110,559
AVG HOUSEHOLD INCOME
37.7%
WAGE / INCOME GAP [ % ]
62.3¢/ $1
WAGE / INCOME GAP [ $ ]
$13,489
FAMILY INCOME DEFICIT
0.38
INEQUALITY / GINI INDEX
42,620
TOTAL POPULATION
21,632
MALE POPULATION
20,988
FEMALE POPULATION
103.07
MALES / 100 FEMALES
97.02
FEMALES / 100 MALES
35.1
MEDIAN AGE
3.7
AVG FAMILY SIZE
3.1
AVG HOUSEHOLD SIZE
23,772
LABOR FORCE [ PEOPLE ]
72.7%
PERCENT IN LABOR FORCE
3.3%
UNEMPLOYMENT RATE
Income in Manassas
Income Overview in Manassas
Per Capita Income in Manassas is $42,958, while median incomes of families and households are $123,147 and $110,559 respectively.
| Characteristic | Number | Measure |
| Per Capita Income | 42,620 | $42,958 |
| Median Family Income | 9,679 | $123,147 |
| Mean Family Income | 9,679 | $141,558 |
| Median Household Income | 13,840 | $110,559 |
| Mean Household Income | 13,840 | $131,779 |
| Income Deficit | 9,679 | $13,489 |
| Wage / Income Gap (%) | 42,620 | 37.68% |
| Wage / Income Gap ($) | 42,620 | 62.32¢ per $1 |
| Gini / Inequality Index | 42,620 | 0.38 |
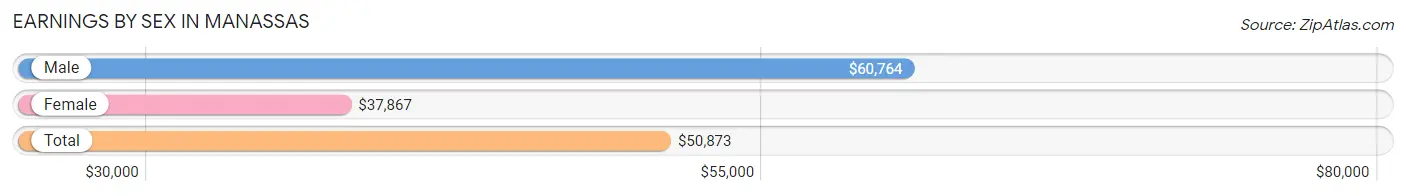
Earnings by Sex in Manassas
Average Earnings in Manassas are $50,873, $60,764 for men and $37,867 for women, a difference of 37.7%.
| Sex | Number | Average Earnings |
| Male | 13,420 (55.0%) | $60,764 |
| Female | 10,997 (45.0%) | $37,867 |
| Total | 24,417 (100.0%) | $50,873 |
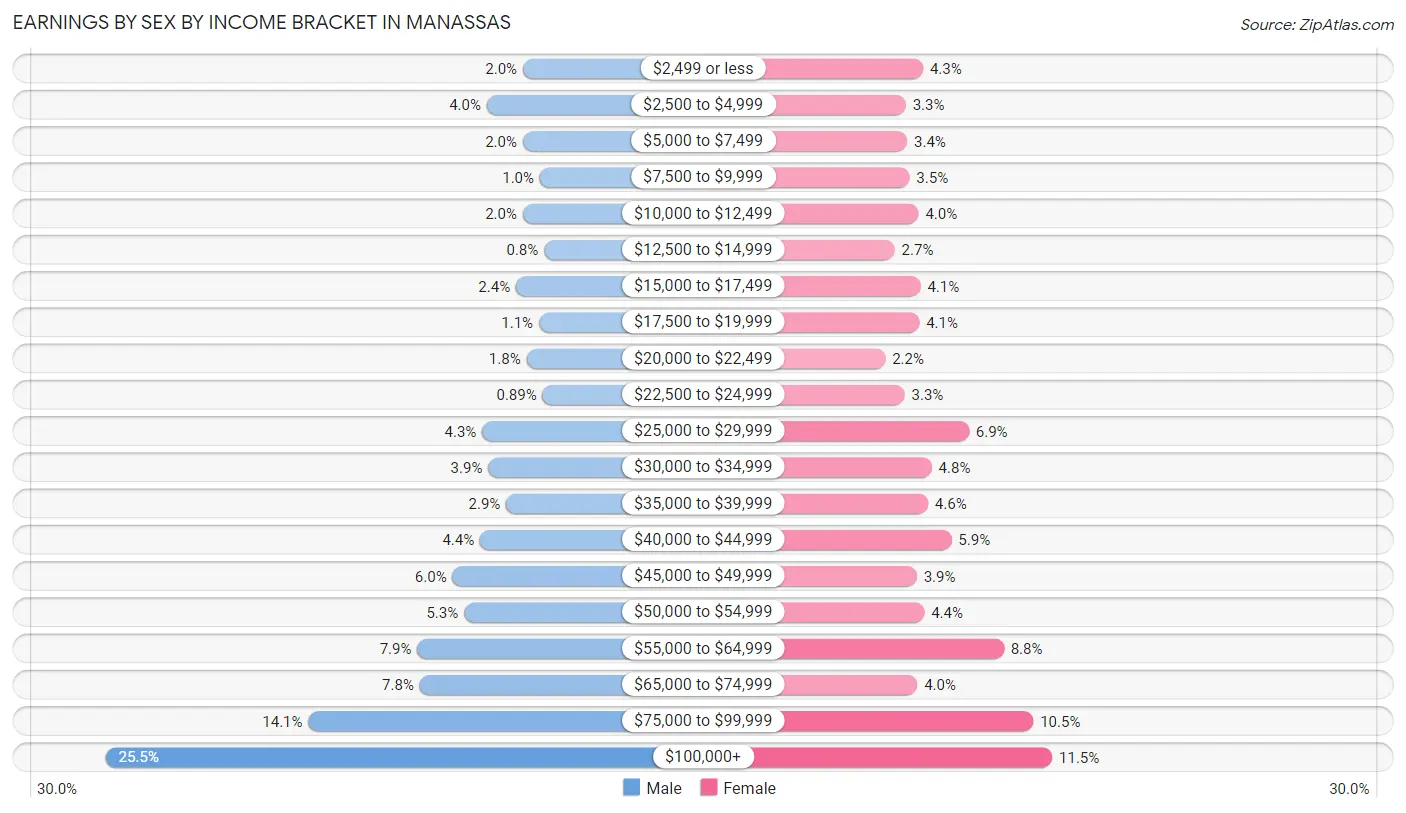
Earnings by Sex by Income Bracket in Manassas
The most common earnings brackets in Manassas are $100,000+ for men (3,415 | 25.5%) and $100,000+ for women (1,269 | 11.5%).
| Income | Male | Female |
| $2,499 or less | 267 (2.0%) | 471 (4.3%) |
| $2,500 to $4,999 | 540 (4.0%) | 364 (3.3%) |
| $5,000 to $7,499 | 269 (2.0%) | 373 (3.4%) |
| $7,500 to $9,999 | 140 (1.0%) | 387 (3.5%) |
| $10,000 to $12,499 | 268 (2.0%) | 443 (4.0%) |
| $12,500 to $14,999 | 107 (0.8%) | 296 (2.7%) |
| $15,000 to $17,499 | 319 (2.4%) | 455 (4.1%) |
| $17,500 to $19,999 | 146 (1.1%) | 448 (4.1%) |
| $20,000 to $22,499 | 240 (1.8%) | 238 (2.2%) |
| $22,500 to $24,999 | 119 (0.9%) | 357 (3.3%) |
| $25,000 to $29,999 | 574 (4.3%) | 754 (6.9%) |
| $30,000 to $34,999 | 529 (3.9%) | 525 (4.8%) |
| $35,000 to $39,999 | 393 (2.9%) | 501 (4.6%) |
| $40,000 to $44,999 | 590 (4.4%) | 647 (5.9%) |
| $45,000 to $49,999 | 798 (5.9%) | 432 (3.9%) |
| $50,000 to $54,999 | 711 (5.3%) | 478 (4.3%) |
| $55,000 to $64,999 | 1,064 (7.9%) | 970 (8.8%) |
| $65,000 to $74,999 | 1,046 (7.8%) | 436 (4.0%) |
| $75,000 to $99,999 | 1,885 (14.1%) | 1,153 (10.5%) |
| $100,000+ | 3,415 (25.5%) | 1,269 (11.5%) |
| Total | 13,420 (100.0%) | 10,997 (100.0%) |
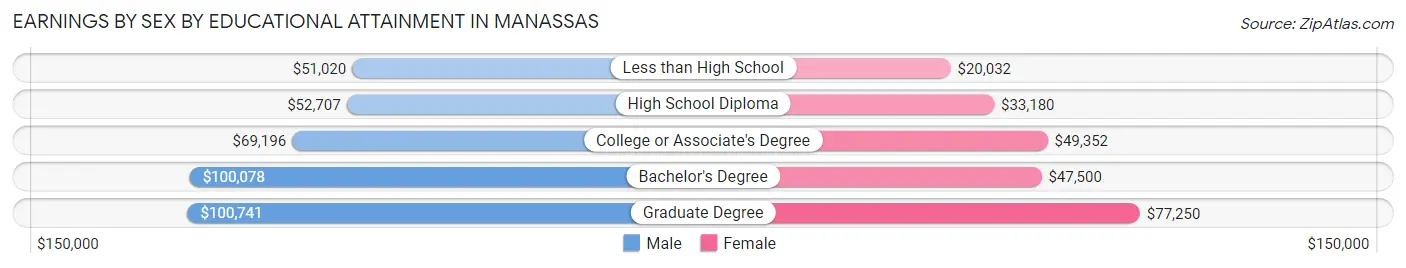
Earnings by Sex by Educational Attainment in Manassas
Average earnings in Manassas are $67,495 for men and $43,992 for women, a difference of 34.8%. Men with an educational attainment of graduate degree enjoy the highest average annual earnings of $100,741, while those with less than high school education earn the least with $51,020. Women with an educational attainment of graduate degree earn the most with the average annual earnings of $77,250, while those with less than high school education have the smallest earnings of $20,032.
| Educational Attainment | Male Income | Female Income |
| Less than High School | $51,020 | $20,032 |
| High School Diploma | $52,707 | $33,180 |
| College or Associate's Degree | $69,196 | $49,352 |
| Bachelor's Degree | $100,078 | $47,500 |
| Graduate Degree | $100,741 | $77,250 |
| Total | $67,495 | $43,992 |
Family Income in Manassas
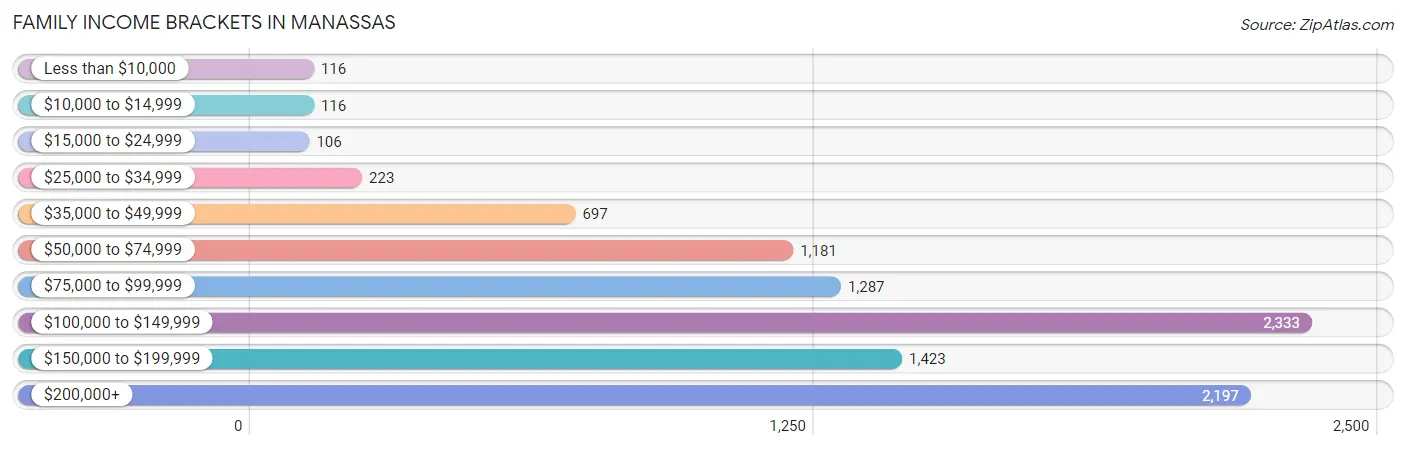
Family Income Brackets in Manassas
According to the Manassas family income data, there are 2,333 families falling into the $100,000 to $149,999 income range, which is the most common income bracket and makes up 24.1% of all families. Conversely, the $15,000 to $24,999 income bracket is the least frequent group with only 106 families (1.1%) belonging to this category.
| Income Bracket | # Families | % Families |
| Less than $10,000 | 116 | 1.2% |
| $10,000 to $14,999 | 116 | 1.2% |
| $15,000 to $24,999 | 106 | 1.1% |
| $25,000 to $34,999 | 223 | 2.3% |
| $35,000 to $49,999 | 697 | 7.2% |
| $50,000 to $74,999 | 1,181 | 12.2% |
| $75,000 to $99,999 | 1,287 | 13.3% |
| $100,000 to $149,999 | 2,333 | 24.1% |
| $150,000 to $199,999 | 1,423 | 14.7% |
| $200,000+ | 2,197 | 22.7% |
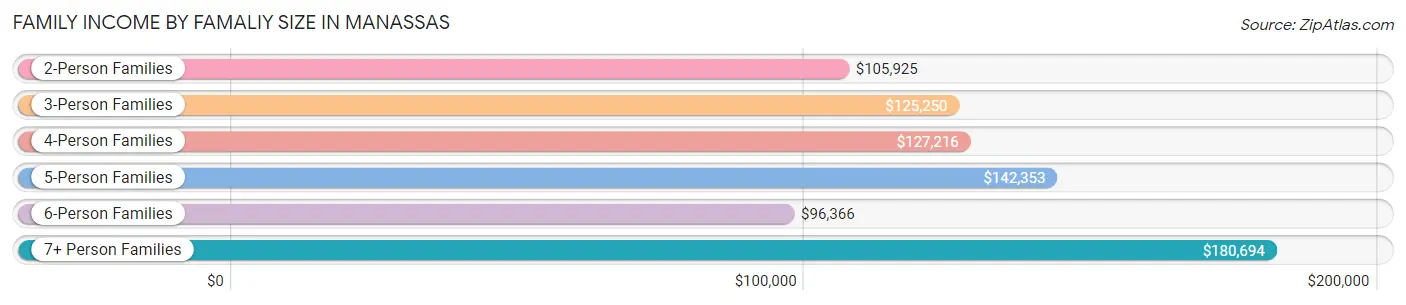
Family Income by Famaliy Size in Manassas
7+ person families (624 | 6.5%) account for the highest median family income in Manassas with $180,694 per family, while 2-person families (3,231 | 33.4%) have the highest median income of $52,962 per family member.
| Income Bracket | # Families | Median Income |
| 2-Person Families | 3,231 (33.4%) | $105,925 |
| 3-Person Families | 2,361 (24.4%) | $125,250 |
| 4-Person Families | 2,006 (20.7%) | $127,216 |
| 5-Person Families | 944 (9.8%) | $142,353 |
| 6-Person Families | 513 (5.3%) | $96,366 |
| 7+ Person Families | 624 (6.5%) | $180,694 |
| Total | 9,679 (100.0%) | $123,147 |
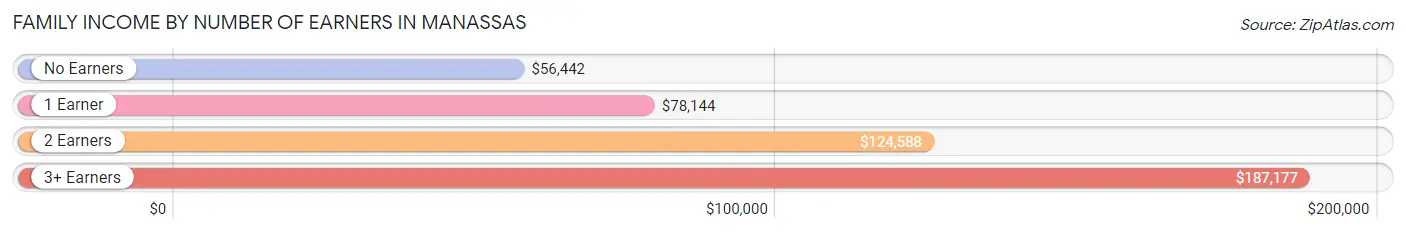
Family Income by Number of Earners in Manassas
The median family income in Manassas is $123,147, with families comprising 3+ earners (2,115) having the highest median family income of $187,177, while families with no earners (607) have the lowest median family income of $56,442, accounting for 21.8% and 6.3% of families, respectively.
| Number of Earners | # Families | Median Income |
| No Earners | 607 (6.3%) | $56,442 |
| 1 Earner | 2,438 (25.2%) | $78,144 |
| 2 Earners | 4,519 (46.7%) | $124,588 |
| 3+ Earners | 2,115 (21.8%) | $187,177 |
| Total | 9,679 (100.0%) | $123,147 |
Household Income in Manassas
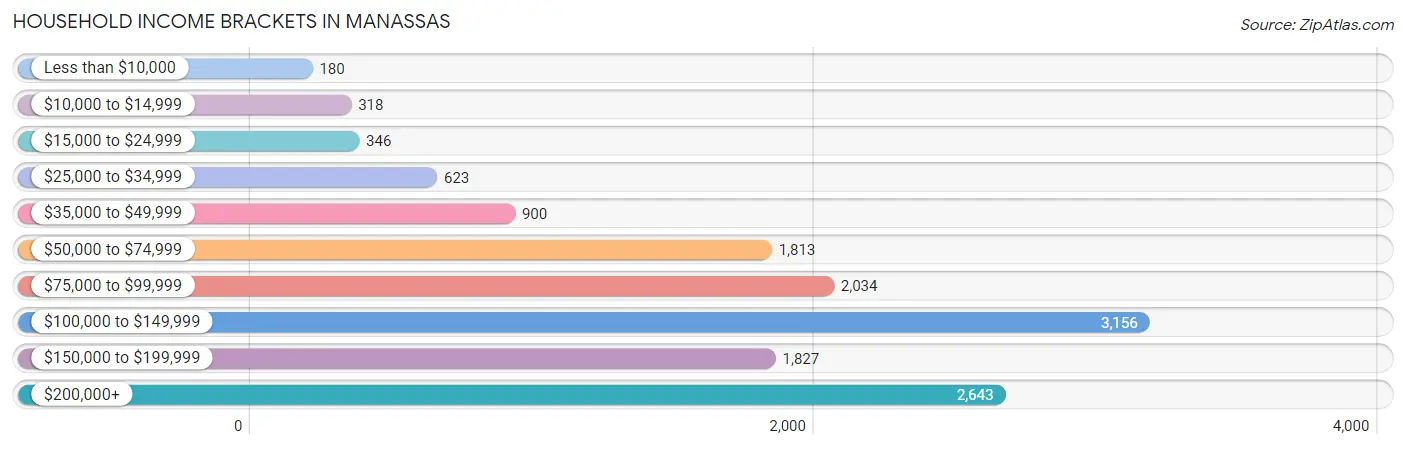
Household Income Brackets in Manassas
With 3,156 households falling in the category, the $100,000 to $149,999 income range is the most frequent in Manassas, accounting for 22.8% of all households. In contrast, only 180 households (1.3%) fall into the less than $10,000 income bracket, making it the least populous group.
| Income Bracket | # Households | % Households |
| Less than $10,000 | 180 | 1.3% |
| $10,000 to $14,999 | 318 | 2.3% |
| $15,000 to $24,999 | 346 | 2.5% |
| $25,000 to $34,999 | 623 | 4.5% |
| $35,000 to $49,999 | 900 | 6.5% |
| $50,000 to $74,999 | 1,813 | 13.1% |
| $75,000 to $99,999 | 2,034 | 14.7% |
| $100,000 to $149,999 | 3,156 | 22.8% |
| $150,000 to $199,999 | 1,827 | 13.2% |
| $200,000+ | 2,643 | 19.1% |
Household Income by Householder Age in Manassas
The median household income in Manassas is $110,559, with the highest median household income of $129,665 found in the 45 to 64 years age bracket for the primary householder. A total of 5,830 households (42.1%) fall into this category. Meanwhile, the 15 to 24 years age bracket for the primary householder has the lowest median household income of $68,685, with 421 households (3.0%) in this group.
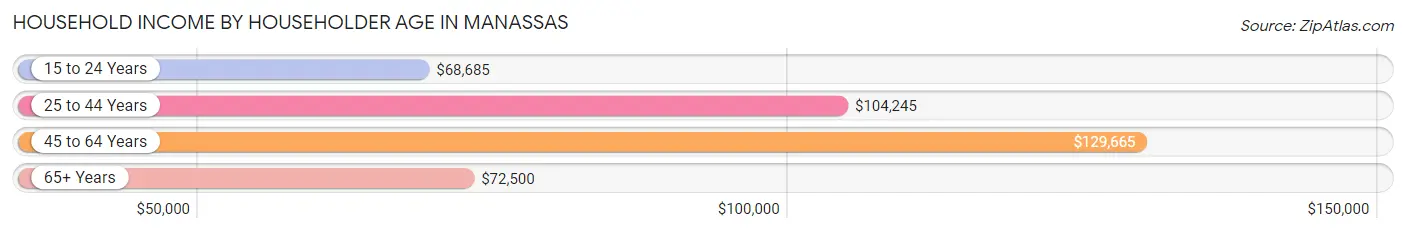
| Income Bracket | # Households | Median Income |
| 15 to 24 Years | 421 (3.0%) | $68,685 |
| 25 to 44 Years | 4,969 (35.9%) | $104,245 |
| 45 to 64 Years | 5,830 (42.1%) | $129,665 |
| 65+ Years | 2,620 (18.9%) | $72,500 |
| Total | 13,840 (100.0%) | $110,559 |
Poverty in Manassas
Income Below Poverty by Sex and Age in Manassas
With 3.9% poverty level for males and 5.6% for females among the residents of Manassas, 16 and 17 year old males and 75 year old and over females are the most vulnerable to poverty, with 100 males (15.5%) and 177 females (15.3%) in their respective age groups living below the poverty level.
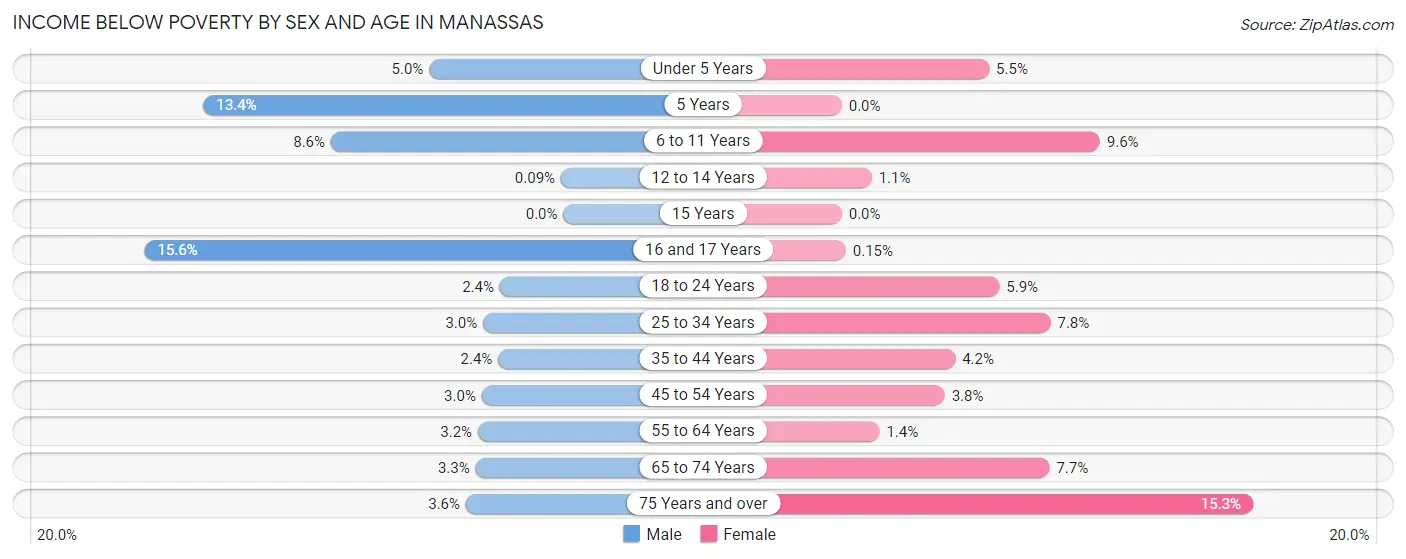
| Age Bracket | Male | Female |
| Under 5 Years | 82 (5.0%) | 86 (5.5%) |
| 5 Years | 33 (13.4%) | 0 (0.0%) |
| 6 to 11 Years | 168 (8.6%) | 191 (9.6%) |
| 12 to 14 Years | 1 (0.1%) | 7 (1.1%) |
| 15 Years | 0 (0.0%) | 0 (0.0%) |
| 16 and 17 Years | 100 (15.5%) | 1 (0.2%) |
| 18 to 24 Years | 46 (2.4%) | 102 (5.9%) |
| 25 to 34 Years | 99 (3.0%) | 233 (7.7%) |
| 35 to 44 Years | 77 (2.4%) | 128 (4.2%) |
| 45 to 54 Years | 86 (3.0%) | 100 (3.8%) |
| 55 to 64 Years | 83 (3.2%) | 35 (1.4%) |
| 65 to 74 Years | 44 (3.3%) | 114 (7.7%) |
| 75 Years and over | 21 (3.6%) | 177 (15.3%) |
| Total | 840 (3.9%) | 1,174 (5.6%) |
Income Above Poverty by Sex and Age in Manassas
According to the poverty statistics in Manassas, males aged 15 years and females aged 5 years are the age groups that are most secure financially, with 100.0% of males and 100.0% of females in these age groups living above the poverty line.
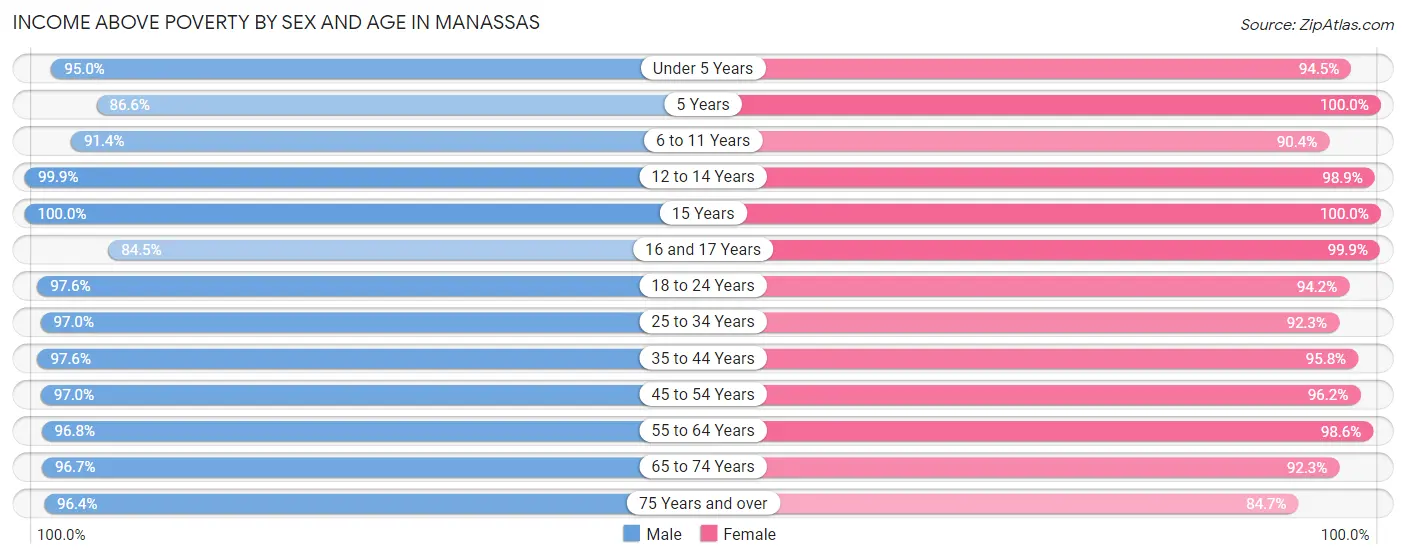
| Age Bracket | Male | Female |
| Under 5 Years | 1,564 (95.0%) | 1,485 (94.5%) |
| 5 Years | 214 (86.6%) | 298 (100.0%) |
| 6 to 11 Years | 1,778 (91.4%) | 1,803 (90.4%) |
| 12 to 14 Years | 1,052 (99.9%) | 622 (98.9%) |
| 15 Years | 203 (100.0%) | 198 (100.0%) |
| 16 and 17 Years | 543 (84.5%) | 670 (99.9%) |
| 18 to 24 Years | 1,906 (97.6%) | 1,643 (94.2%) |
| 25 to 34 Years | 3,218 (97.0%) | 2,774 (92.2%) |
| 35 to 44 Years | 3,099 (97.6%) | 2,915 (95.8%) |
| 45 to 54 Years | 2,751 (97.0%) | 2,516 (96.2%) |
| 55 to 64 Years | 2,532 (96.8%) | 2,473 (98.6%) |
| 65 to 74 Years | 1,306 (96.7%) | 1,365 (92.3%) |
| 75 Years and over | 559 (96.4%) | 983 (84.7%) |
| Total | 20,725 (96.1%) | 19,745 (94.4%) |
Income Below Poverty Among Married-Couple Families in Manassas
The poverty statistics for married-couple families in Manassas show that 1.8% or 134 of the total 7,451 families live below the poverty line. Families with no children have the highest poverty rate of 2.6%, comprising of 108 families. On the other hand, families with 5 or more children have the lowest poverty rate of 0.0%, which includes 0 families.
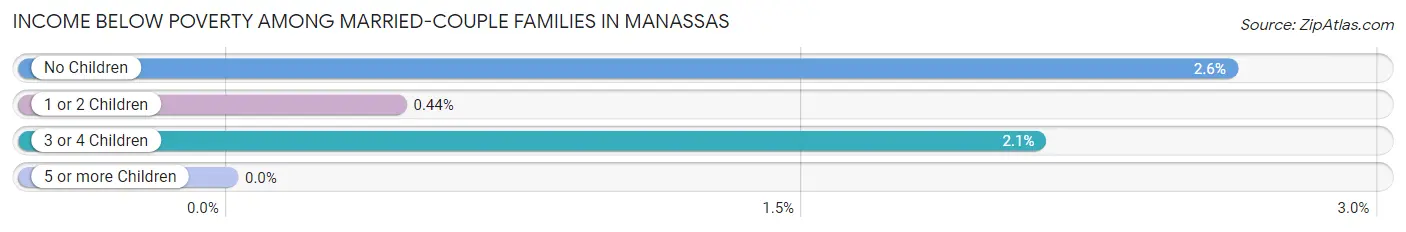
| Children | Above Poverty | Below Poverty |
| No Children | 4,026 (97.4%) | 108 (2.6%) |
| 1 or 2 Children | 2,501 (99.6%) | 11 (0.4%) |
| 3 or 4 Children | 695 (97.9%) | 15 (2.1%) |
| 5 or more Children | 95 (100.0%) | 0 (0.0%) |
| Total | 7,317 (98.2%) | 134 (1.8%) |
Income Below Poverty Among Single-Parent Households in Manassas
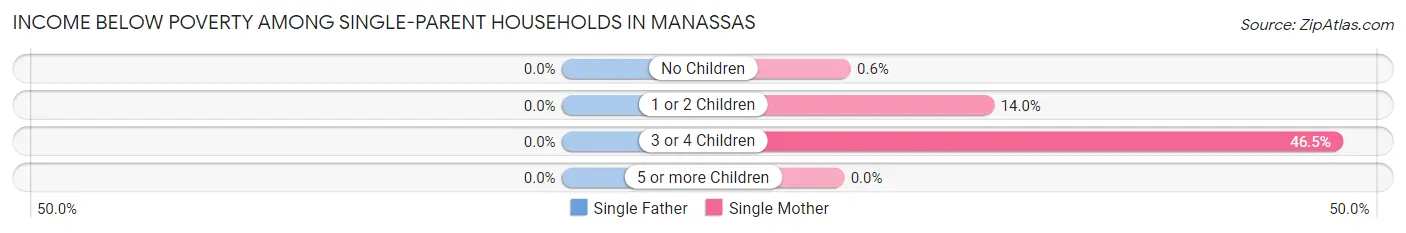
| Children | Single Father | Single Mother |
| No Children | 0 (0.0%) | 3 (0.6%) |
| 1 or 2 Children | 0 (0.0%) | 109 (14.0%) |
| 3 or 4 Children | 0 (0.0%) | 92 (46.5%) |
| 5 or more Children | 0 (0.0%) | 0 (0.0%) |
| Total | 0 (0.0%) | 204 (13.8%) |
Income Below Poverty Among Married-Couple vs Single-Parent Households in Manassas
The poverty data for Manassas shows that 134 of the married-couple family households (1.8%) and 204 of the single-parent households (9.2%) are living below the poverty level. Within the married-couple family households, those with no children have the highest poverty rate, with 108 households (2.6%) falling below the poverty line. Among the single-parent households, those with 3 or 4 children have the highest poverty rate, with 92 household (37.1%) living below poverty.
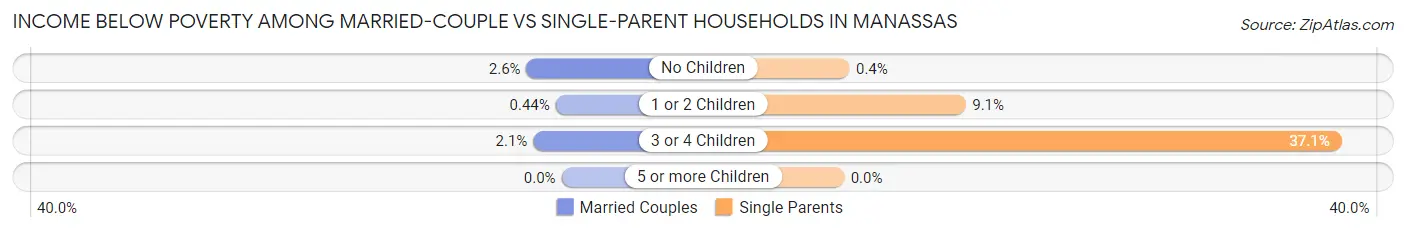
| Children | Married-Couple Families | Single-Parent Households |
| No Children | 108 (2.6%) | 3 (0.4%) |
| 1 or 2 Children | 11 (0.4%) | 109 (9.1%) |
| 3 or 4 Children | 15 (2.1%) | 92 (37.1%) |
| 5 or more Children | 0 (0.0%) | 0 (0.0%) |
| Total | 134 (1.8%) | 204 (9.2%) |
Race in Manassas
The most populous races in Manassas are White / Caucasian (22,653 | 53.1%), Hispanic or Latino (16,527 | 38.8%), and Two or more Races (7,693 | 18.0%).
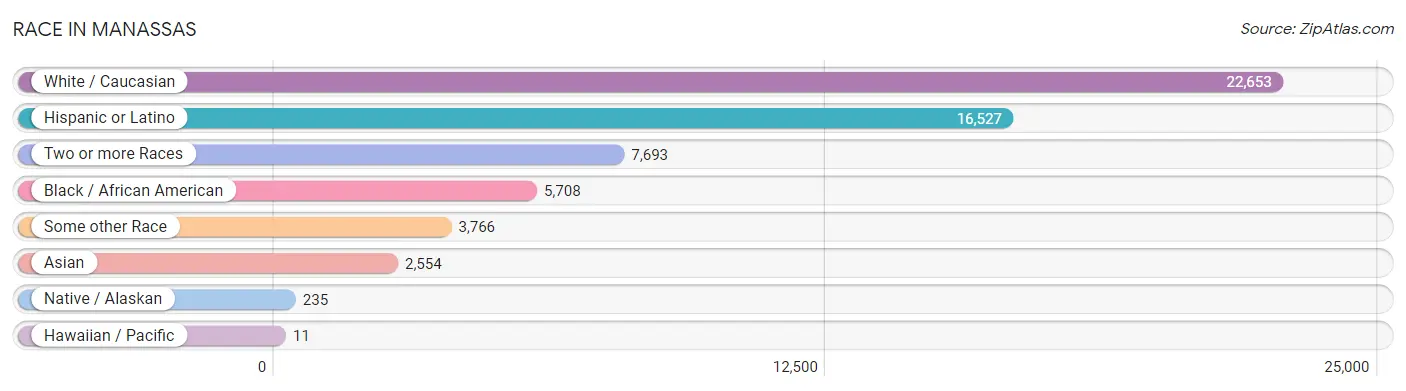
| Race | # Population | % Population |
| Asian | 2,554 | 6.0% |
| Black / African American | 5,708 | 13.4% |
| Hawaiian / Pacific | 11 | 0.0% |
| Hispanic or Latino | 16,527 | 38.8% |
| Native / Alaskan | 235 | 0.5% |
| White / Caucasian | 22,653 | 53.1% |
| Two or more Races | 7,693 | 18.0% |
| Some other Race | 3,766 | 8.8% |
| Total | 42,620 | 100.0% |
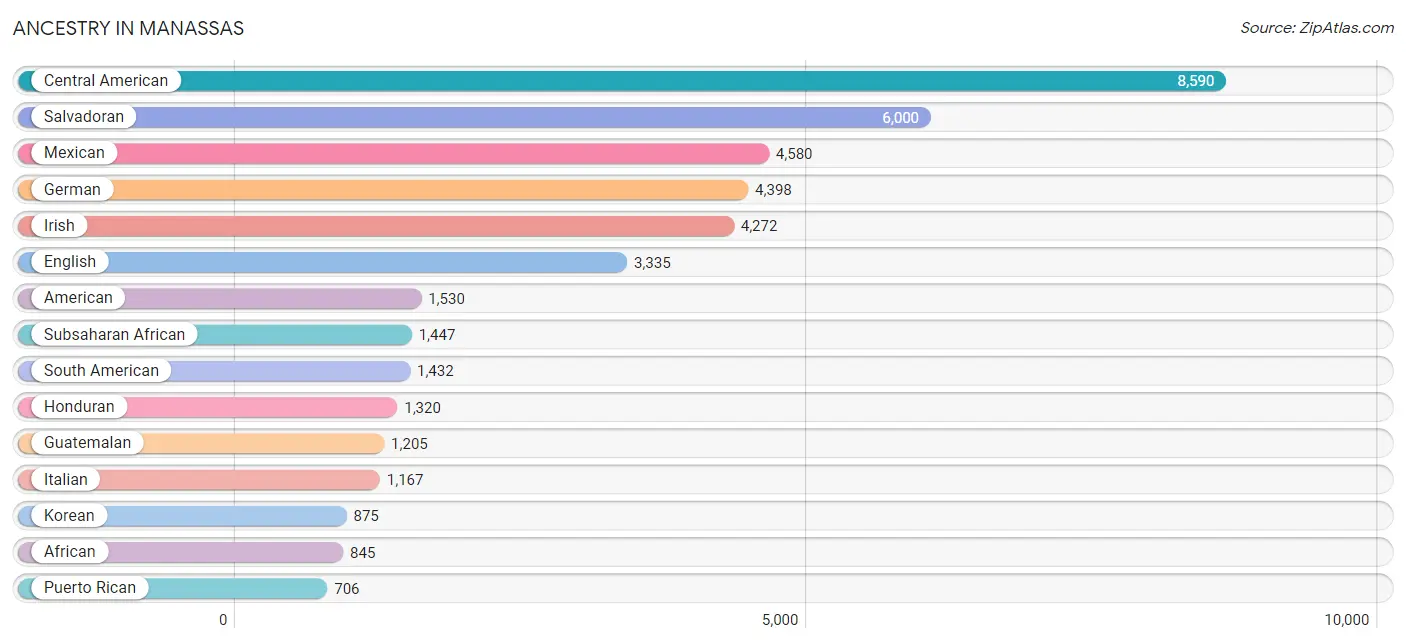
Ancestry in Manassas
The most populous ancestries reported in Manassas are Central American (8,590 | 20.2%), Salvadoran (6,000 | 14.1%), Mexican (4,580 | 10.7%), German (4,398 | 10.3%), and Irish (4,272 | 10.0%), together accounting for 65.3% of all Manassas residents.
| Ancestry | # Population | % Population |
| Afghan | 94 | 0.2% |
| African | 845 | 2.0% |
| Albanian | 10 | 0.0% |
| American | 1,530 | 3.6% |
| Arab | 321 | 0.7% |
| Argentinean | 62 | 0.2% |
| Austrian | 125 | 0.3% |
| Basque | 9 | 0.0% |
| Bhutanese | 532 | 1.3% |
| Blackfeet | 9 | 0.0% |
| Bolivian | 420 | 1.0% |
| Brazilian | 18 | 0.0% |
| British | 200 | 0.5% |
| Bulgarian | 34 | 0.1% |
| Burmese | 279 | 0.6% |
| Canadian | 9 | 0.0% |
| Celtic | 12 | 0.0% |
| Central American | 8,590 | 20.2% |
| Central American Indian | 22 | 0.1% |
| Cherokee | 101 | 0.2% |
| Choctaw | 13 | 0.0% |
| Colombian | 153 | 0.4% |
| Croatian | 12 | 0.0% |
| Cuban | 168 | 0.4% |
| Czech | 113 | 0.3% |
| Czechoslovakian | 31 | 0.1% |
| Danish | 90 | 0.2% |
| Dominican | 247 | 0.6% |
| Dutch | 405 | 0.9% |
| Eastern European | 91 | 0.2% |
| Ecuadorian | 272 | 0.6% |
| English | 3,335 | 7.8% |
| Ethiopian | 108 | 0.3% |
| European | 382 | 0.9% |
| Filipino | 20 | 0.1% |
| Finnish | 32 | 0.1% |
| French | 442 | 1.0% |
| French Canadian | 184 | 0.4% |
| German | 4,398 | 10.3% |
| German Russian | 57 | 0.1% |
| Greek | 209 | 0.5% |
| Guatemalan | 1,205 | 2.8% |
| Honduran | 1,320 | 3.1% |
| Hungarian | 163 | 0.4% |
| Indian (Asian) | 94 | 0.2% |
| Indonesian | 8 | 0.0% |
| Iranian | 67 | 0.2% |
| Iraqi | 67 | 0.2% |
| Irish | 4,272 | 10.0% |
| Israeli | 10 | 0.0% |
| Italian | 1,167 | 2.7% |
| Jamaican | 187 | 0.4% |
| Japanese | 51 | 0.1% |
| Jordanian | 13 | 0.0% |
| Kenyan | 10 | 0.0% |
| Korean | 875 | 2.1% |
| Lebanese | 108 | 0.3% |
| Luxembourger | 7 | 0.0% |
| Malaysian | 16 | 0.0% |
| Mexican | 4,580 | 10.7% |
| Mexican American Indian | 250 | 0.6% |
| Moroccan | 95 | 0.2% |
| Native Hawaiian | 5 | 0.0% |
| Navajo | 12 | 0.0% |
| Nicaraguan | 22 | 0.1% |
| Nigerian | 48 | 0.1% |
| Northern European | 83 | 0.2% |
| Norwegian | 325 | 0.8% |
| Pakistani | 95 | 0.2% |
| Panamanian | 43 | 0.1% |
| Pennsylvania German | 10 | 0.0% |
| Peruvian | 326 | 0.8% |
| Polish | 516 | 1.2% |
| Portuguese | 88 | 0.2% |
| Puerto Rican | 706 | 1.7% |
| Romanian | 70 | 0.2% |
| Russian | 280 | 0.7% |
| Salvadoran | 6,000 | 14.1% |
| Scandinavian | 107 | 0.3% |
| Scotch-Irish | 218 | 0.5% |
| Scottish | 653 | 1.5% |
| Seminole | 33 | 0.1% |
| Serbian | 13 | 0.0% |
| Sierra Leonean | 104 | 0.2% |
| Sioux | 95 | 0.2% |
| Slovak | 228 | 0.5% |
| South African | 128 | 0.3% |
| South American | 1,432 | 3.4% |
| Spaniard | 108 | 0.3% |
| Sri Lankan | 274 | 0.6% |
| Subsaharan African | 1,447 | 3.4% |
| Swedish | 195 | 0.5% |
| Swiss | 44 | 0.1% |
| Syrian | 20 | 0.1% |
| Thai | 468 | 1.1% |
| Tongan | 21 | 0.1% |
| Trinidadian and Tobagonian | 34 | 0.1% |
| Turkish | 63 | 0.2% |
| Ukrainian | 64 | 0.2% |
| Venezuelan | 199 | 0.5% |
| Vietnamese | 5 | 0.0% |
| Welsh | 181 | 0.4% |
| West Indian | 91 | 0.2% |
| Yugoslavian | 13 | 0.0% | View All 104 Rows |
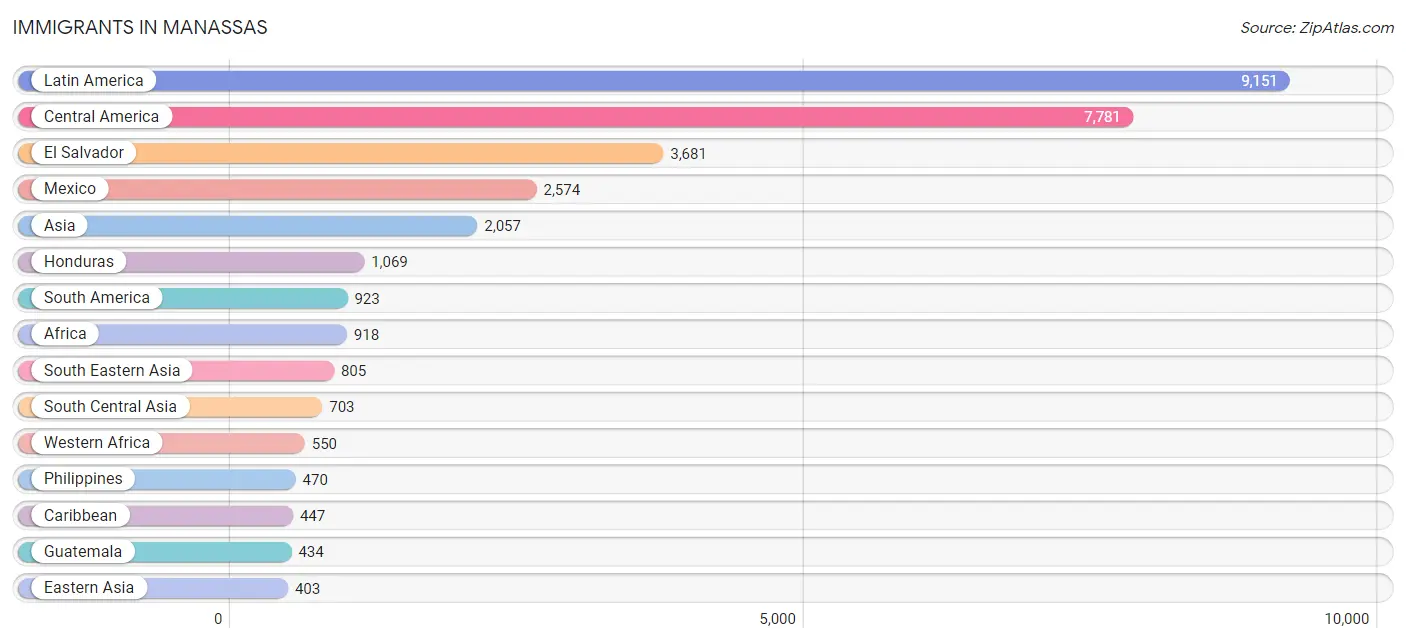
Immigrants in Manassas
The most numerous immigrant groups reported in Manassas came from Latin America (9,151 | 21.5%), Central America (7,781 | 18.3%), El Salvador (3,681 | 8.6%), Mexico (2,574 | 6.0%), and Asia (2,057 | 4.8%), together accounting for 59.2% of all Manassas residents.
| Immigration Origin | # Population | % Population |
| Afghanistan | 98 | 0.2% |
| Africa | 918 | 2.1% |
| Argentina | 33 | 0.1% |
| Asia | 2,057 | 4.8% |
| Bangladesh | 5 | 0.0% |
| Belarus | 16 | 0.0% |
| Bolivia | 200 | 0.5% |
| Bulgaria | 28 | 0.1% |
| Cambodia | 28 | 0.1% |
| Cameroon | 54 | 0.1% |
| Canada | 20 | 0.1% |
| Caribbean | 447 | 1.1% |
| Central America | 7,781 | 18.3% |
| China | 75 | 0.2% |
| Colombia | 134 | 0.3% |
| Cuba | 29 | 0.1% |
| Dominican Republic | 211 | 0.5% |
| Eastern Africa | 128 | 0.3% |
| Eastern Asia | 403 | 0.9% |
| Eastern Europe | 175 | 0.4% |
| Ecuador | 51 | 0.1% |
| El Salvador | 3,681 | 8.6% |
| Ethiopia | 69 | 0.2% |
| Europe | 380 | 0.9% |
| France | 7 | 0.0% |
| Germany | 55 | 0.1% |
| Ghana | 383 | 0.9% |
| Guatemala | 434 | 1.0% |
| Guyana | 6 | 0.0% |
| Haiti | 47 | 0.1% |
| Honduras | 1,069 | 2.5% |
| Hong Kong | 35 | 0.1% |
| India | 273 | 0.6% |
| Iran | 80 | 0.2% |
| Iraq | 67 | 0.2% |
| Ireland | 13 | 0.0% |
| Jamaica | 89 | 0.2% |
| Japan | 208 | 0.5% |
| Kazakhstan | 25 | 0.1% |
| Kenya | 26 | 0.1% |
| Korea | 120 | 0.3% |
| Laos | 16 | 0.0% |
| Latin America | 9,151 | 21.5% |
| Lebanon | 52 | 0.1% |
| Mexico | 2,574 | 6.0% |
| Middle Africa | 54 | 0.1% |
| Moldova | 22 | 0.1% |
| Morocco | 75 | 0.2% |
| Nepal | 95 | 0.2% |
| Nicaragua | 15 | 0.0% |
| Nigeria | 36 | 0.1% |
| Northern Africa | 75 | 0.2% |
| Northern Europe | 91 | 0.2% |
| Norway | 32 | 0.1% |
| Oceania | 11 | 0.0% |
| Pakistan | 105 | 0.3% |
| Panama | 8 | 0.0% |
| Peru | 356 | 0.8% |
| Philippines | 470 | 1.1% |
| Portugal | 31 | 0.1% |
| Romania | 48 | 0.1% |
| Russia | 52 | 0.1% |
| Scotland | 37 | 0.1% |
| Sierra Leone | 43 | 0.1% |
| South Africa | 85 | 0.2% |
| South America | 923 | 2.2% |
| South Central Asia | 703 | 1.7% |
| South Eastern Asia | 805 | 1.9% |
| Southern Europe | 52 | 0.1% |
| Spain | 21 | 0.1% |
| Sri Lanka | 22 | 0.1% |
| Taiwan | 20 | 0.1% |
| Thailand | 67 | 0.2% |
| Trinidad and Tobago | 5 | 0.0% |
| Turkey | 27 | 0.1% |
| Uganda | 33 | 0.1% |
| Ukraine | 9 | 0.0% |
| Venezuela | 143 | 0.3% |
| Vietnam | 216 | 0.5% |
| West Indies | 66 | 0.2% |
| Western Africa | 550 | 1.3% |
| Western Asia | 146 | 0.3% |
| Western Europe | 62 | 0.2% | View All 83 Rows |
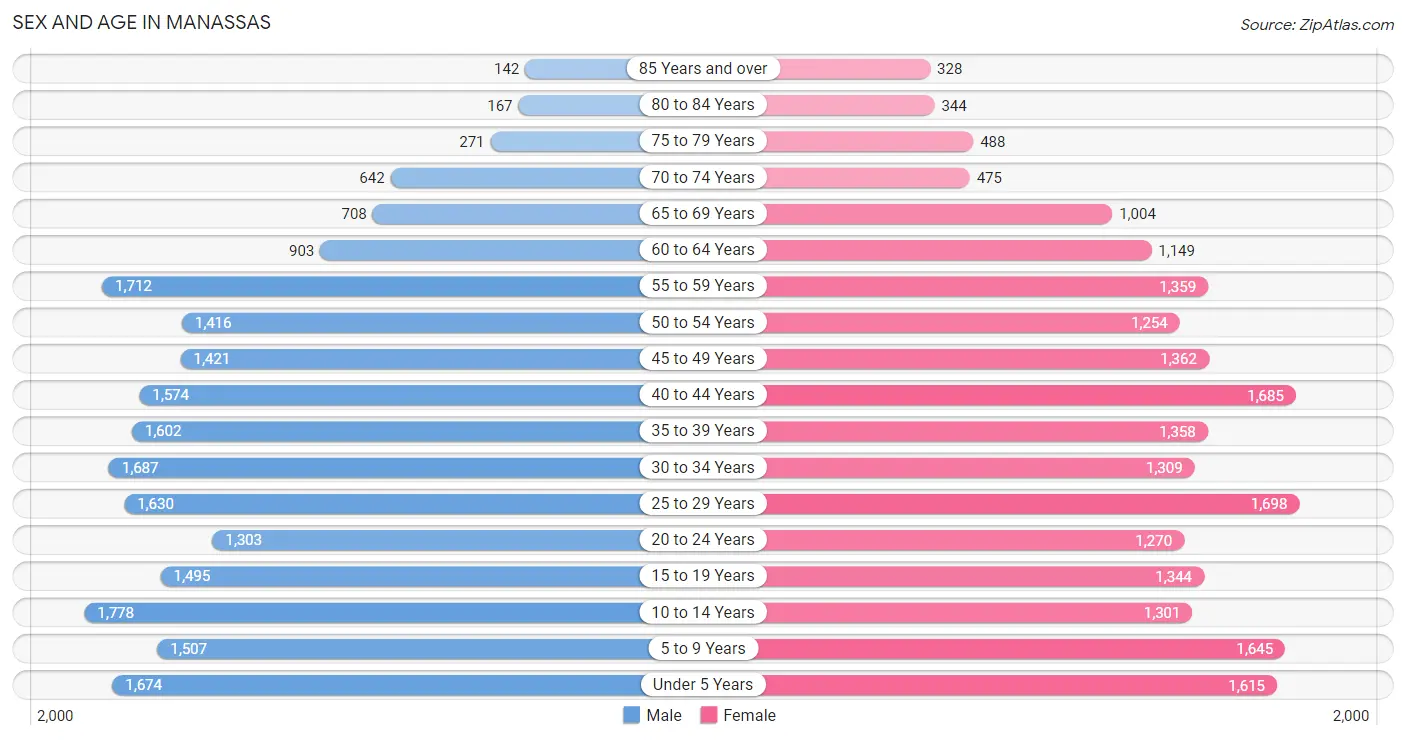
Sex and Age in Manassas
Sex and Age in Manassas
The most populous age groups in Manassas are 10 to 14 Years (1,778 | 8.2%) for men and 25 to 29 Years (1,698 | 8.1%) for women.
| Age Bracket | Male | Female |
| Under 5 Years | 1,674 (7.7%) | 1,615 (7.7%) |
| 5 to 9 Years | 1,507 (7.0%) | 1,645 (7.8%) |
| 10 to 14 Years | 1,778 (8.2%) | 1,301 (6.2%) |
| 15 to 19 Years | 1,495 (6.9%) | 1,344 (6.4%) |
| 20 to 24 Years | 1,303 (6.0%) | 1,270 (6.0%) |
| 25 to 29 Years | 1,630 (7.5%) | 1,698 (8.1%) |
| 30 to 34 Years | 1,687 (7.8%) | 1,309 (6.2%) |
| 35 to 39 Years | 1,602 (7.4%) | 1,358 (6.5%) |
| 40 to 44 Years | 1,574 (7.3%) | 1,685 (8.0%) |
| 45 to 49 Years | 1,421 (6.6%) | 1,362 (6.5%) |
| 50 to 54 Years | 1,416 (6.6%) | 1,254 (6.0%) |
| 55 to 59 Years | 1,712 (7.9%) | 1,359 (6.5%) |
| 60 to 64 Years | 903 (4.2%) | 1,149 (5.5%) |
| 65 to 69 Years | 708 (3.3%) | 1,004 (4.8%) |
| 70 to 74 Years | 642 (3.0%) | 475 (2.3%) |
| 75 to 79 Years | 271 (1.3%) | 488 (2.3%) |
| 80 to 84 Years | 167 (0.8%) | 344 (1.6%) |
| 85 Years and over | 142 (0.7%) | 328 (1.6%) |
| Total | 21,632 (100.0%) | 20,988 (100.0%) |
Families and Households in Manassas
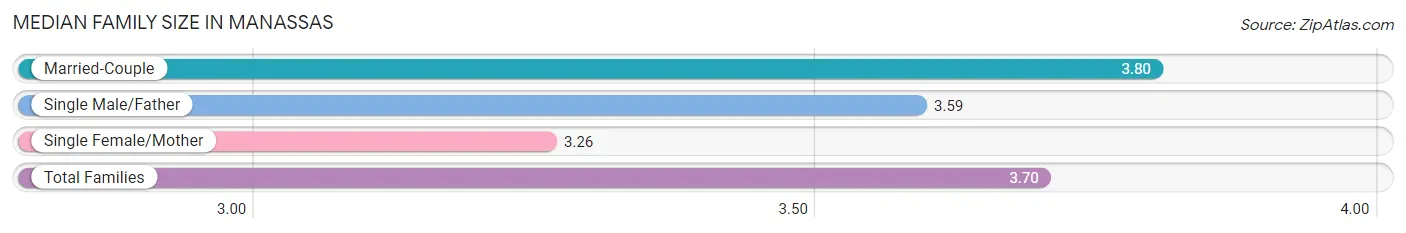
Median Family Size in Manassas
The median family size in Manassas is 3.70 persons per family, with married-couple families (7,451 | 77.0%) accounting for the largest median family size of 3.8 persons per family. On the other hand, single female/mother families (1,479 | 15.3%) represent the smallest median family size with 3.26 persons per family.
| Family Type | # Families | Family Size |
| Married-Couple | 7,451 (77.0%) | 3.80 |
| Single Male/Father | 749 (7.7%) | 3.59 |
| Single Female/Mother | 1,479 (15.3%) | 3.26 |
| Total Families | 9,679 (100.0%) | 3.70 |
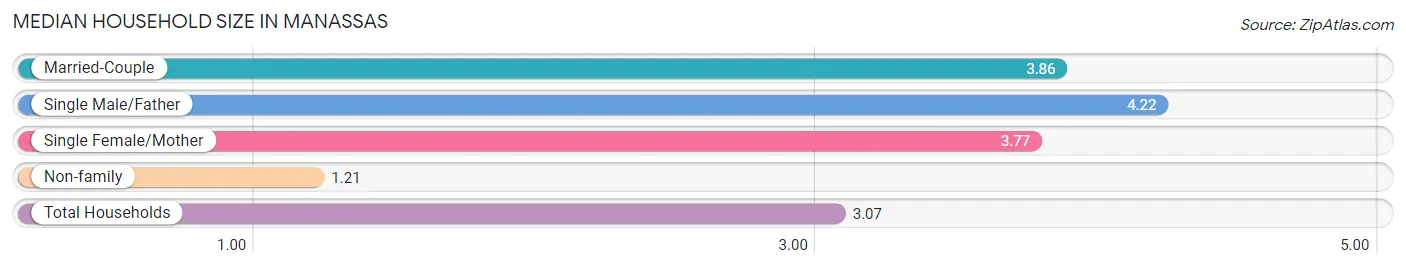
Median Household Size in Manassas
The median household size in Manassas is 3.07 persons per household, with single male/father households (749 | 5.4%) accounting for the largest median household size of 4.22 persons per household. non-family households (4,161 | 30.1%) represent the smallest median household size with 1.21 persons per household.
| Household Type | # Households | Household Size |
| Married-Couple | 7,451 (53.8%) | 3.86 |
| Single Male/Father | 749 (5.4%) | 4.22 |
| Single Female/Mother | 1,479 (10.7%) | 3.77 |
| Non-family | 4,161 (30.1%) | 1.21 |
| Total Households | 13,840 (100.0%) | 3.07 |
Household Size by Marriage Status in Manassas
Out of a total of 13,840 households in Manassas, 9,679 (69.9%) are family households, while 4,161 (30.1%) are nonfamily households. The most numerous type of family households are 2-person households, comprising 2,904, and the most common type of nonfamily households are 1-person households, comprising 3,448.
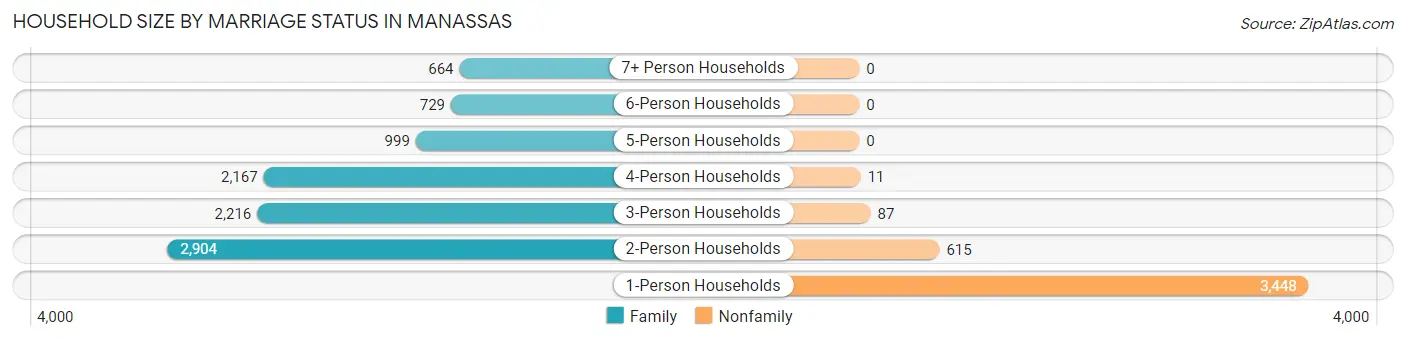
| Household Size | Family Households | Nonfamily Households |
| 1-Person Households | - | 3,448 (24.9%) |
| 2-Person Households | 2,904 (21.0%) | 615 (4.4%) |
| 3-Person Households | 2,216 (16.0%) | 87 (0.6%) |
| 4-Person Households | 2,167 (15.7%) | 11 (0.1%) |
| 5-Person Households | 999 (7.2%) | 0 (0.0%) |
| 6-Person Households | 729 (5.3%) | 0 (0.0%) |
| 7+ Person Households | 664 (4.8%) | 0 (0.0%) |
| Total | 9,679 (69.9%) | 4,161 (30.1%) |
Female Fertility in Manassas
Fertility by Age in Manassas
Average fertility rate in Manassas is 63.0 births per 1,000 women. Women in the age bracket of 20 to 34 years have the highest fertility rate with 121.0 births per 1,000 women. Women in the age bracket of 20 to 34 years acount for 79.4% of all women with births.
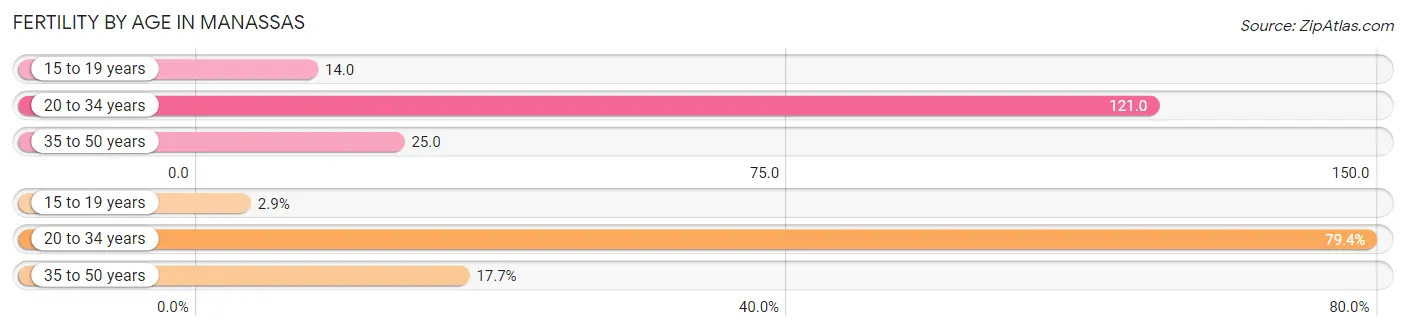
| Age Bracket | Women with Births | Births / 1,000 Women |
| 15 to 19 years | 19 (2.9%) | 14.0 |
| 20 to 34 years | 519 (79.4%) | 121.0 |
| 35 to 50 years | 116 (17.7%) | 25.0 |
| Total | 654 (100.0%) | 63.0 |
Fertility by Age by Marriage Status in Manassas
67.1% of women with births (654) in Manassas are married. The highest percentage of unmarried women with births falls into 15 to 19 years age bracket with 100.0% of them unmarried at the time of birth, while the lowest percentage of unmarried women with births belong to 35 to 50 years age bracket with 18.1% of them unmarried.
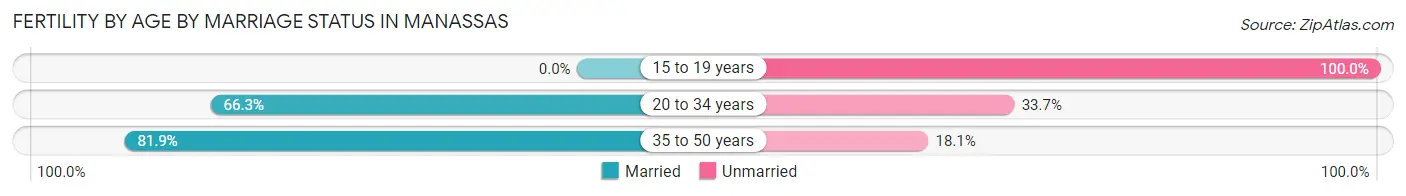
| Age Bracket | Married | Unmarried |
| 15 to 19 years | 0 (0.0%) | 19 (100.0%) |
| 20 to 34 years | 344 (66.3%) | 175 (33.7%) |
| 35 to 50 years | 95 (81.9%) | 21 (18.1%) |
| Total | 439 (67.1%) | 215 (32.9%) |
Fertility by Education in Manassas
Average fertility rate in Manassas is 63.0 births per 1,000 women. Women with the education attainment of high school diploma have the highest fertility rate of 101.0 births per 1,000 women, while women with the education attainment of less than high school have the lowest fertility at 37.0 births per 1,000 women. Women with the education attainment of high school diploma represent 44.2% of all women with births.
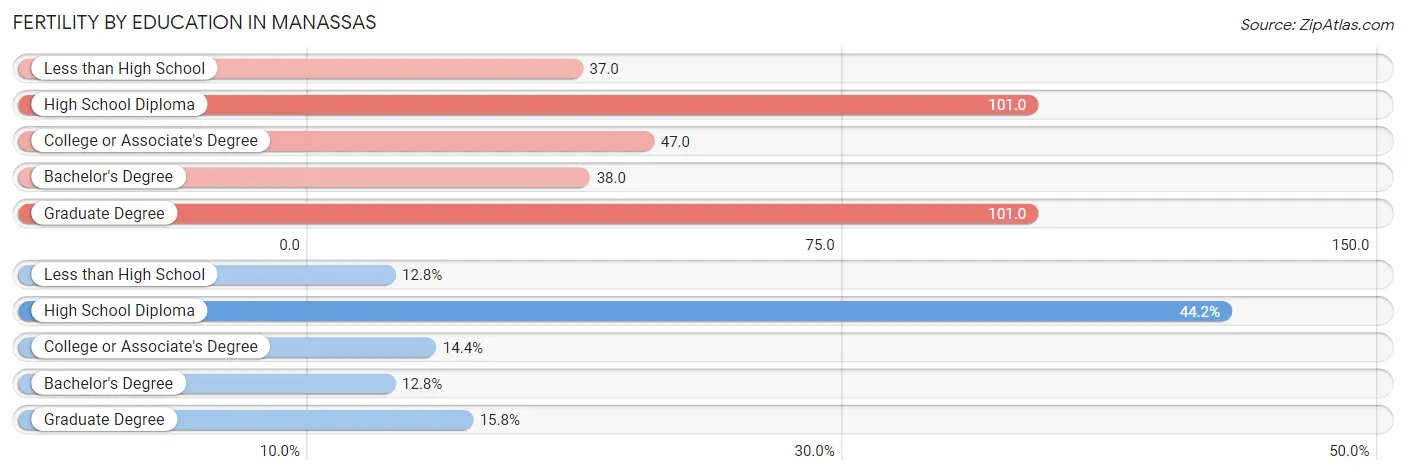
| Educational Attainment | Women with Births | Births / 1,000 Women |
| Less than High School | 84 (12.8%) | 37.0 |
| High School Diploma | 289 (44.2%) | 101.0 |
| College or Associate's Degree | 94 (14.4%) | 47.0 |
| Bachelor's Degree | 84 (12.8%) | 38.0 |
| Graduate Degree | 103 (15.8%) | 101.0 |
| Total | 654 (100.0%) | 63.0 |
Fertility by Education by Marriage Status in Manassas
32.9% of women with births in Manassas are unmarried. Women with the educational attainment of bachelor's degree are most likely to be married with 100.0% of them married at childbirth, while women with the educational attainment of high school diploma are least likely to be married with 47.1% of them unmarried at childbirth.
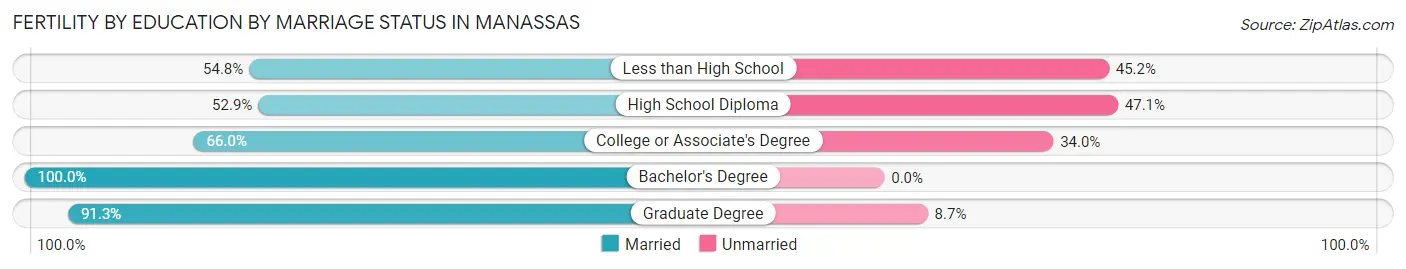
| Educational Attainment | Married | Unmarried |
| Less than High School | 46 (54.8%) | 38 (45.2%) |
| High School Diploma | 153 (52.9%) | 136 (47.1%) |
| College or Associate's Degree | 62 (66.0%) | 32 (34.0%) |
| Bachelor's Degree | 84 (100.0%) | 0 (0.0%) |
| Graduate Degree | 94 (91.3%) | 9 (8.7%) |
| Total | 439 (67.1%) | 215 (32.9%) |
Employment Characteristics in Manassas
Employment by Class of Employer in Manassas
Among the 22,588 employed individuals in Manassas, private company employees (15,239 | 67.5%), federal government employees (2,035 | 9.0%), and local government employees (1,972 | 8.7%) make up the most common classes of employment.
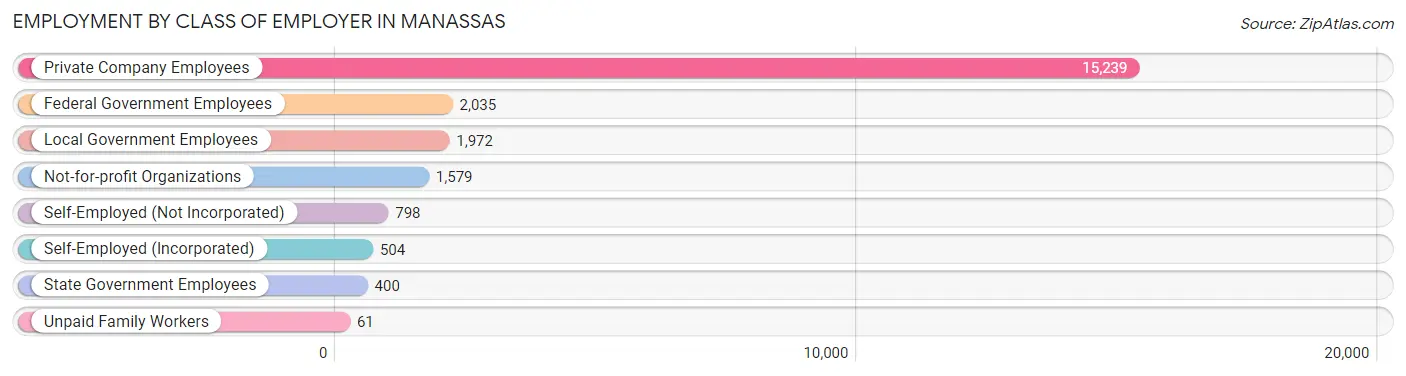
| Employer Class | # Employees | % Employees |
| Private Company Employees | 15,239 | 67.5% |
| Self-Employed (Incorporated) | 504 | 2.2% |
| Self-Employed (Not Incorporated) | 798 | 3.5% |
| Not-for-profit Organizations | 1,579 | 7.0% |
| Local Government Employees | 1,972 | 8.7% |
| State Government Employees | 400 | 1.8% |
| Federal Government Employees | 2,035 | 9.0% |
| Unpaid Family Workers | 61 | 0.3% |
| Total | 22,588 | 100.0% |
Employment Status by Age in Manassas
According to the labor force statistics for Manassas, out of the total population over 16 years of age (32,699), 72.7% or 23,772 individuals are in the labor force, with 3.3% or 784 of them unemployed. The age group with the highest labor force participation rate is 30 to 34 years, with 90.7% or 2,717 individuals in the labor force. Within the labor force, the 16 to 19 years age range has the highest percentage of unemployed individuals, with 18.3% or 151 of them being unemployed.
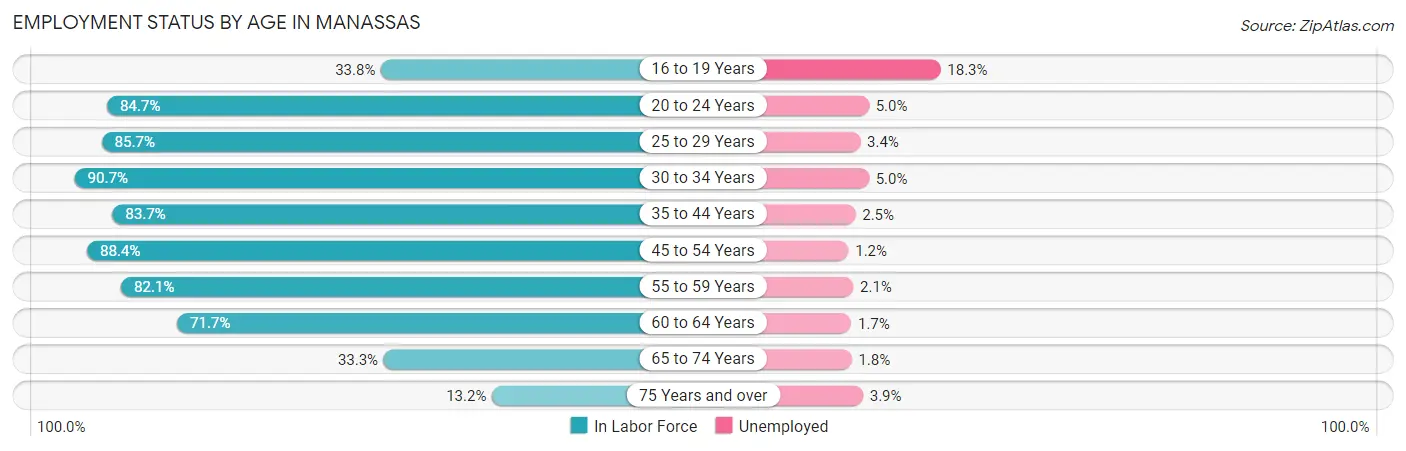
| Age Bracket | In Labor Force | Unemployed |
| 16 to 19 Years | 824 (33.8%) | 151 (18.3%) |
| 20 to 24 Years | 2,179 (84.7%) | 109 (5.0%) |
| 25 to 29 Years | 2,852 (85.7%) | 97 (3.4%) |
| 30 to 34 Years | 2,717 (90.7%) | 136 (5.0%) |
| 35 to 44 Years | 5,205 (83.7%) | 130 (2.5%) |
| 45 to 54 Years | 4,820 (88.4%) | 58 (1.2%) |
| 55 to 59 Years | 2,521 (82.1%) | 53 (2.1%) |
| 60 to 64 Years | 1,471 (71.7%) | 25 (1.7%) |
| 65 to 74 Years | 942 (33.3%) | 17 (1.8%) |
| 75 Years and over | 230 (13.2%) | 9 (3.9%) |
| Total | 23,772 (72.7%) | 784 (3.3%) |
Employment Status by Educational Attainment in Manassas
According to labor force statistics for Manassas, 84.7% of individuals (19,582) out of the total population between 25 and 64 years of age (23,119) are in the labor force, with 2.6% or 509 of them being unemployed. The group with the highest labor force participation rate are those with the educational attainment of college / associate degree, with 88.7% or 4,384 individuals in the labor force. Within the labor force, individuals with college / associate degree education have the highest percentage of unemployment, with 5.3% or 232 of them being unemployed.
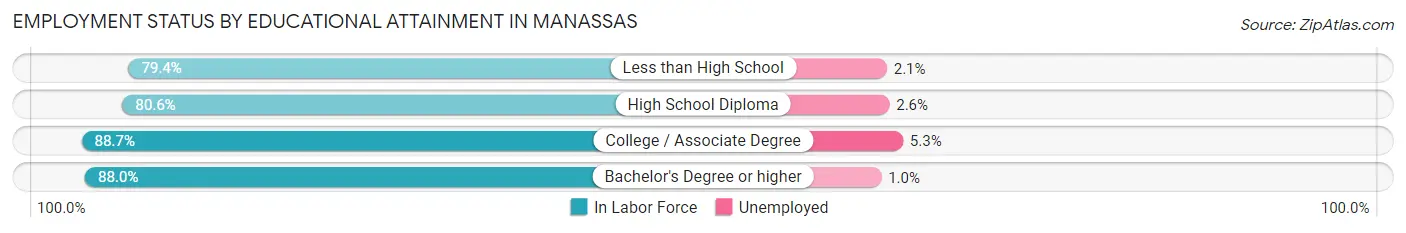
| Educational Attainment | In Labor Force | Unemployed |
| Less than High School | 2,863 (79.4%) | 76 (2.1%) |
| High School Diploma | 5,236 (80.6%) | 169 (2.6%) |
| College / Associate Degree | 4,384 (88.7%) | 262 (5.3%) |
| Bachelor's Degree or higher | 7,105 (88.0%) | 81 (1.0%) |
| Total | 19,582 (84.7%) | 601 (2.6%) |
Employment Occupations by Sex in Manassas
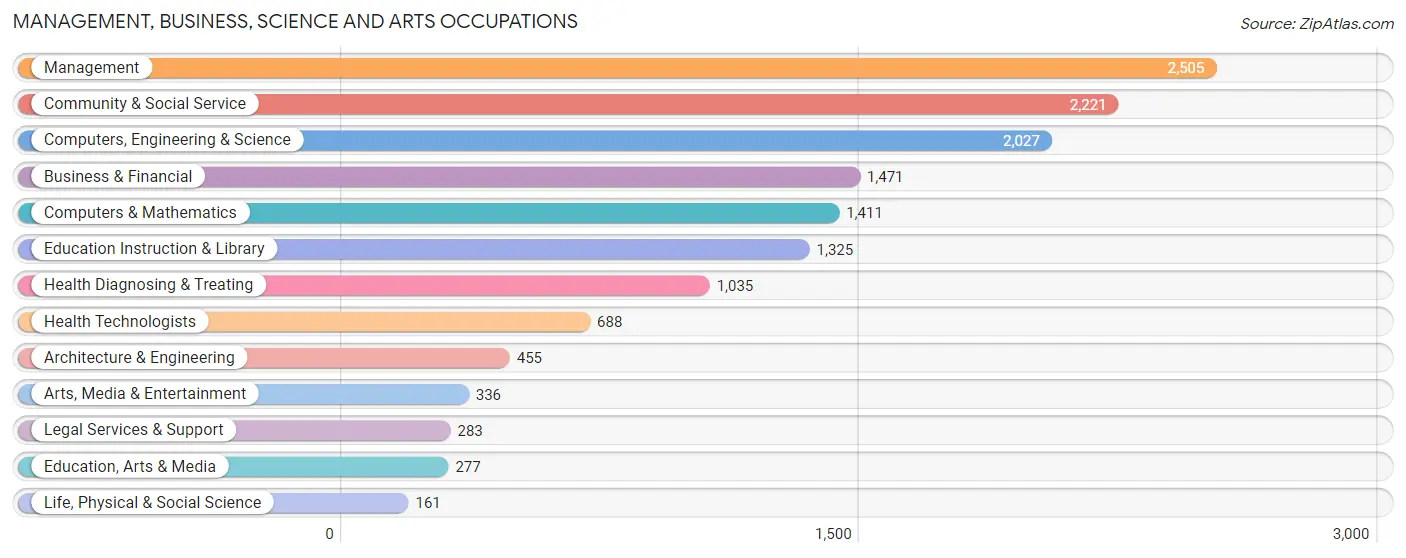
Management, Business, Science and Arts Occupations
The most common Management, Business, Science and Arts occupations in Manassas are Management (2,505 | 10.9%), Community & Social Service (2,221 | 9.7%), Computers, Engineering & Science (2,027 | 8.8%), Business & Financial (1,471 | 6.4%), and Computers & Mathematics (1,411 | 6.2%).
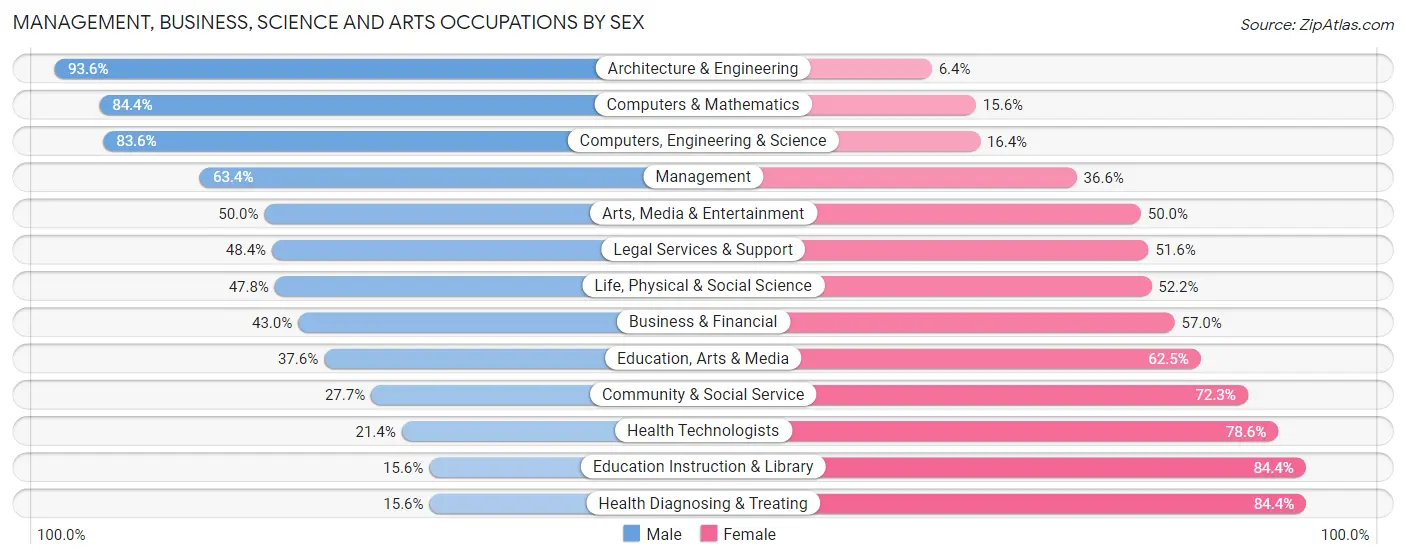
Management, Business, Science and Arts Occupations by Sex
Within the Management, Business, Science and Arts occupations in Manassas, the most male-oriented occupations are Architecture & Engineering (93.6%), Computers & Mathematics (84.4%), and Computers, Engineering & Science (83.6%), while the most female-oriented occupations are Health Diagnosing & Treating (84.4%), Education Instruction & Library (84.4%), and Health Technologists (78.6%).
| Occupation | Male | Female |
| Management | 1,588 (63.4%) | 917 (36.6%) |
| Business & Financial | 632 (43.0%) | 839 (57.0%) |
| Computers, Engineering & Science | 1,694 (83.6%) | 333 (16.4%) |
| Computers & Mathematics | 1,191 (84.4%) | 220 (15.6%) |
| Architecture & Engineering | 426 (93.6%) | 29 (6.4%) |
| Life, Physical & Social Science | 77 (47.8%) | 84 (52.2%) |
| Community & Social Service | 616 (27.7%) | 1,605 (72.3%) |
| Education, Arts & Media | 104 (37.6%) | 173 (62.5%) |
| Legal Services & Support | 137 (48.4%) | 146 (51.6%) |
| Education Instruction & Library | 207 (15.6%) | 1,118 (84.4%) |
| Arts, Media & Entertainment | 168 (50.0%) | 168 (50.0%) |
| Health Diagnosing & Treating | 161 (15.6%) | 874 (84.4%) |
| Health Technologists | 147 (21.4%) | 541 (78.6%) |
| Total (Category) | 4,691 (50.7%) | 4,568 (49.3%) |
| Total (Overall) | 12,635 (55.2%) | 10,264 (44.8%) |
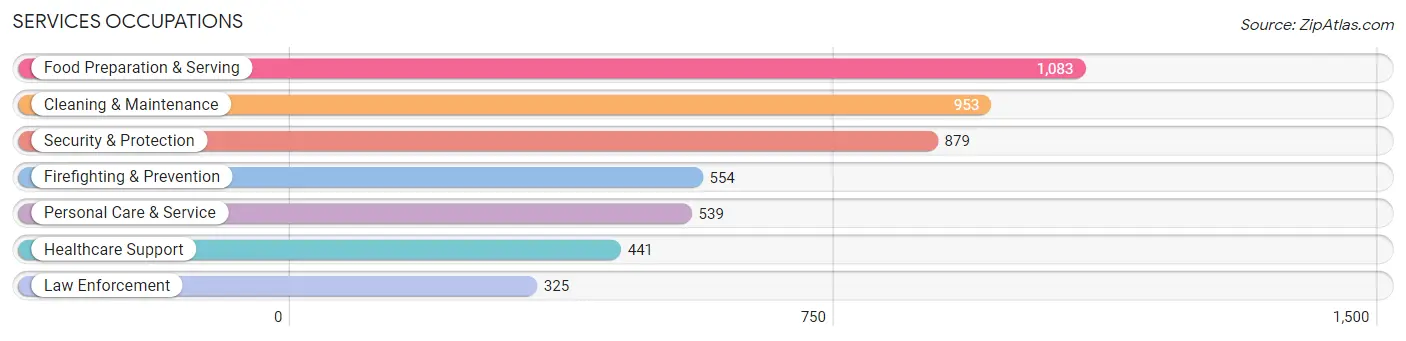
Services Occupations
The most common Services occupations in Manassas are Food Preparation & Serving (1,083 | 4.7%), Cleaning & Maintenance (953 | 4.2%), Security & Protection (879 | 3.8%), Firefighting & Prevention (554 | 2.4%), and Personal Care & Service (539 | 2.4%).
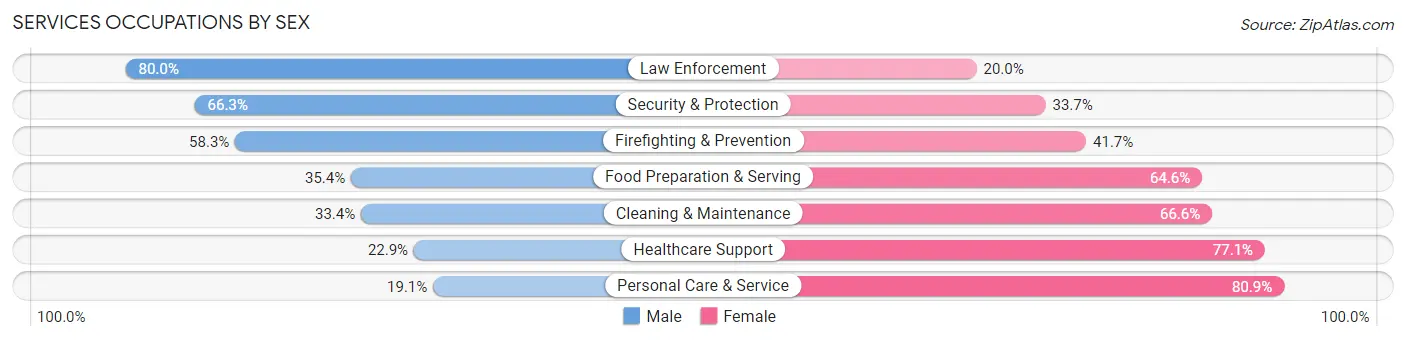
Services Occupations by Sex
Within the Services occupations in Manassas, the most male-oriented occupations are Law Enforcement (80.0%), Security & Protection (66.3%), and Firefighting & Prevention (58.3%), while the most female-oriented occupations are Personal Care & Service (80.9%), Healthcare Support (77.1%), and Cleaning & Maintenance (66.6%).
| Occupation | Male | Female |
| Healthcare Support | 101 (22.9%) | 340 (77.1%) |
| Security & Protection | 583 (66.3%) | 296 (33.7%) |
| Firefighting & Prevention | 323 (58.3%) | 231 (41.7%) |
| Law Enforcement | 260 (80.0%) | 65 (20.0%) |
| Food Preparation & Serving | 383 (35.4%) | 700 (64.6%) |
| Cleaning & Maintenance | 318 (33.4%) | 635 (66.6%) |
| Personal Care & Service | 103 (19.1%) | 436 (80.9%) |
| Total (Category) | 1,488 (38.2%) | 2,407 (61.8%) |
| Total (Overall) | 12,635 (55.2%) | 10,264 (44.8%) |
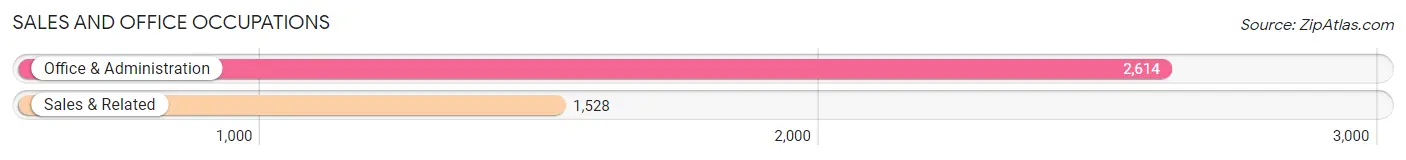
Sales and Office Occupations
The most common Sales and Office occupations in Manassas are Office & Administration (2,614 | 11.4%), and Sales & Related (1,528 | 6.7%).
Sales and Office Occupations by Sex
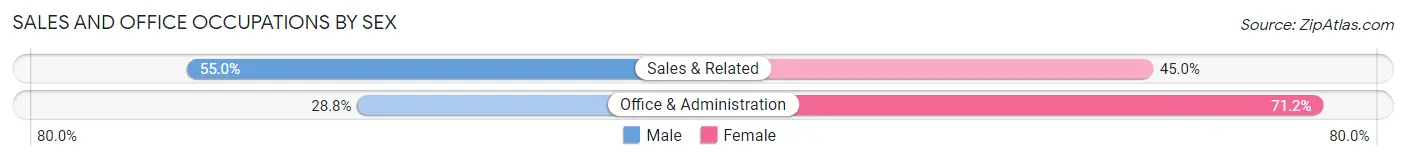
| Occupation | Male | Female |
| Sales & Related | 841 (55.0%) | 687 (45.0%) |
| Office & Administration | 753 (28.8%) | 1,861 (71.2%) |
| Total (Category) | 1,594 (38.5%) | 2,548 (61.5%) |
| Total (Overall) | 12,635 (55.2%) | 10,264 (44.8%) |
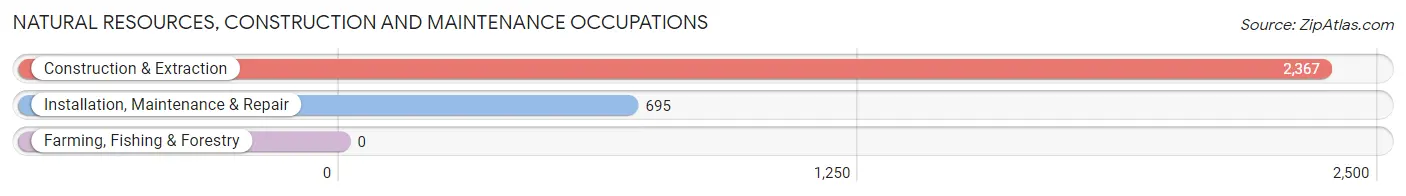
Natural Resources, Construction and Maintenance Occupations
The most common Natural Resources, Construction and Maintenance occupations in Manassas are Construction & Extraction (2,367 | 10.3%), and Installation, Maintenance & Repair (695 | 3.0%).
Natural Resources, Construction and Maintenance Occupations by Sex
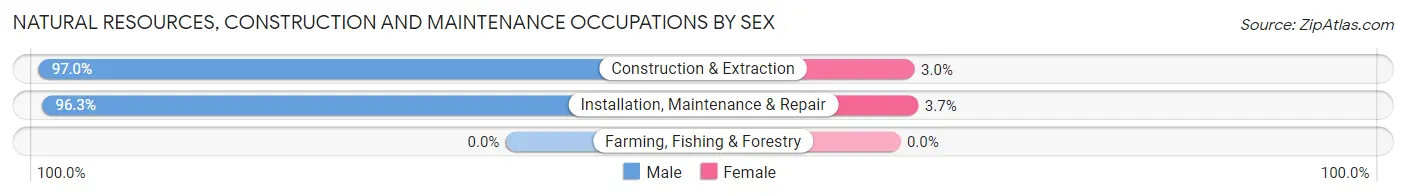
| Occupation | Male | Female |
| Farming, Fishing & Forestry | 0 (0.0%) | 0 (0.0%) |
| Construction & Extraction | 2,297 (97.0%) | 70 (3.0%) |
| Installation, Maintenance & Repair | 669 (96.3%) | 26 (3.7%) |
| Total (Category) | 2,966 (96.9%) | 96 (3.1%) |
| Total (Overall) | 12,635 (55.2%) | 10,264 (44.8%) |
Production, Transportation and Moving Occupations
The most common Production, Transportation and Moving occupations in Manassas are Transportation (941 | 4.1%), Production (834 | 3.6%), and Material Moving (766 | 3.4%).
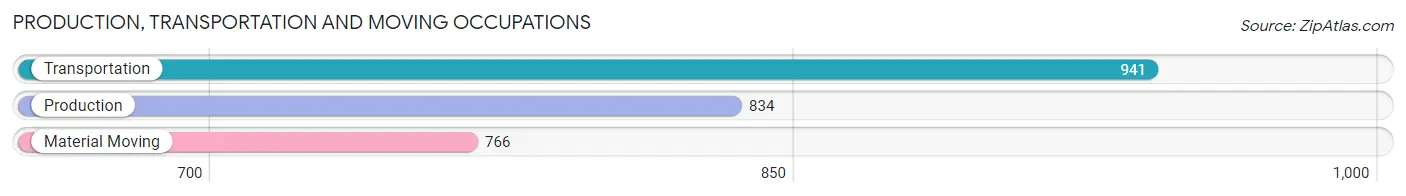
Production, Transportation and Moving Occupations by Sex
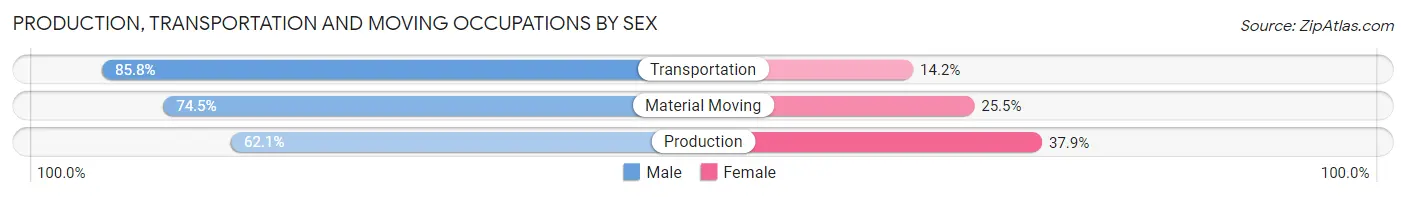
| Occupation | Male | Female |
| Production | 518 (62.1%) | 316 (37.9%) |
| Transportation | 807 (85.8%) | 134 (14.2%) |
| Material Moving | 571 (74.5%) | 195 (25.5%) |
| Total (Category) | 1,896 (74.6%) | 645 (25.4%) |
| Total (Overall) | 12,635 (55.2%) | 10,264 (44.8%) |
Employment Industries by Sex in Manassas
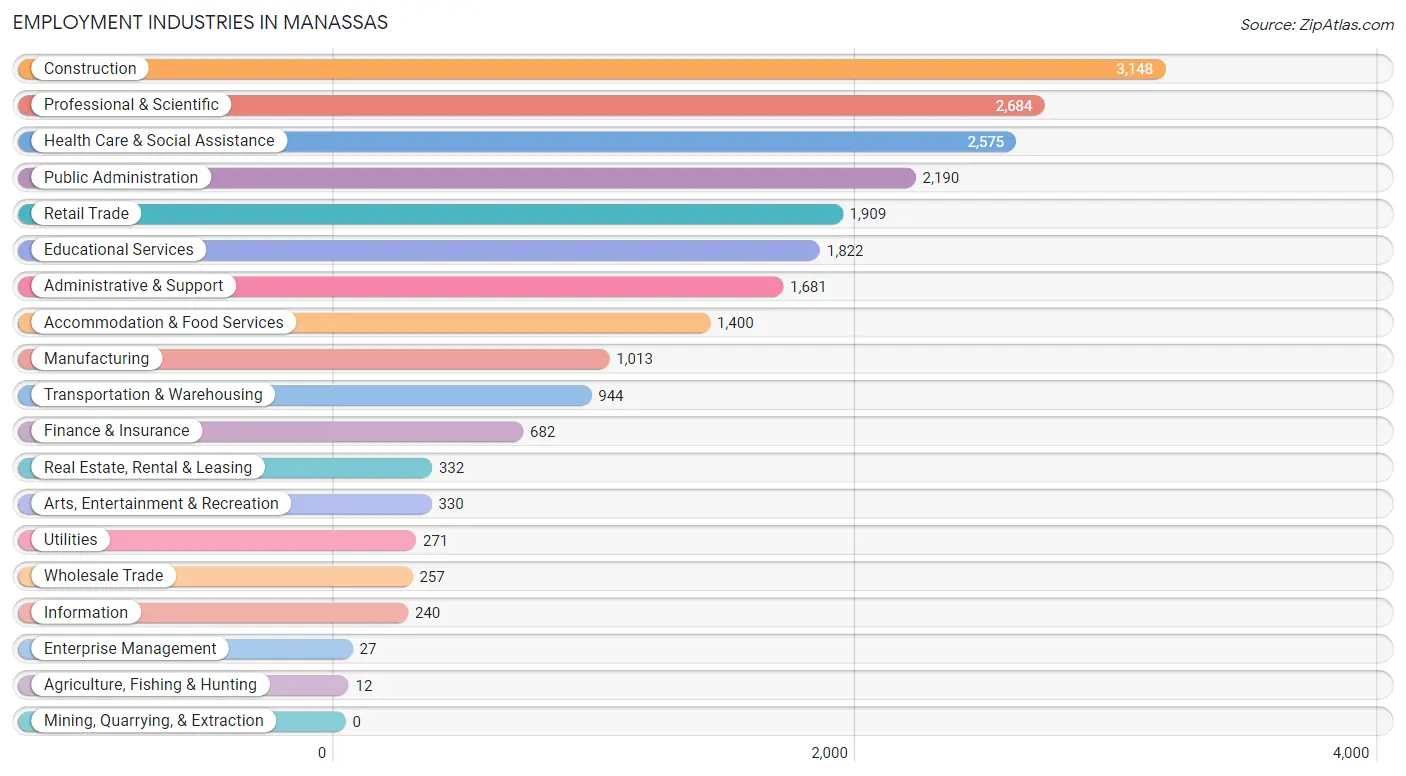
Employment Industries in Manassas
The major employment industries in Manassas include Construction (3,148 | 13.8%), Professional & Scientific (2,684 | 11.7%), Health Care & Social Assistance (2,575 | 11.3%), Public Administration (2,190 | 9.6%), and Retail Trade (1,909 | 8.3%).
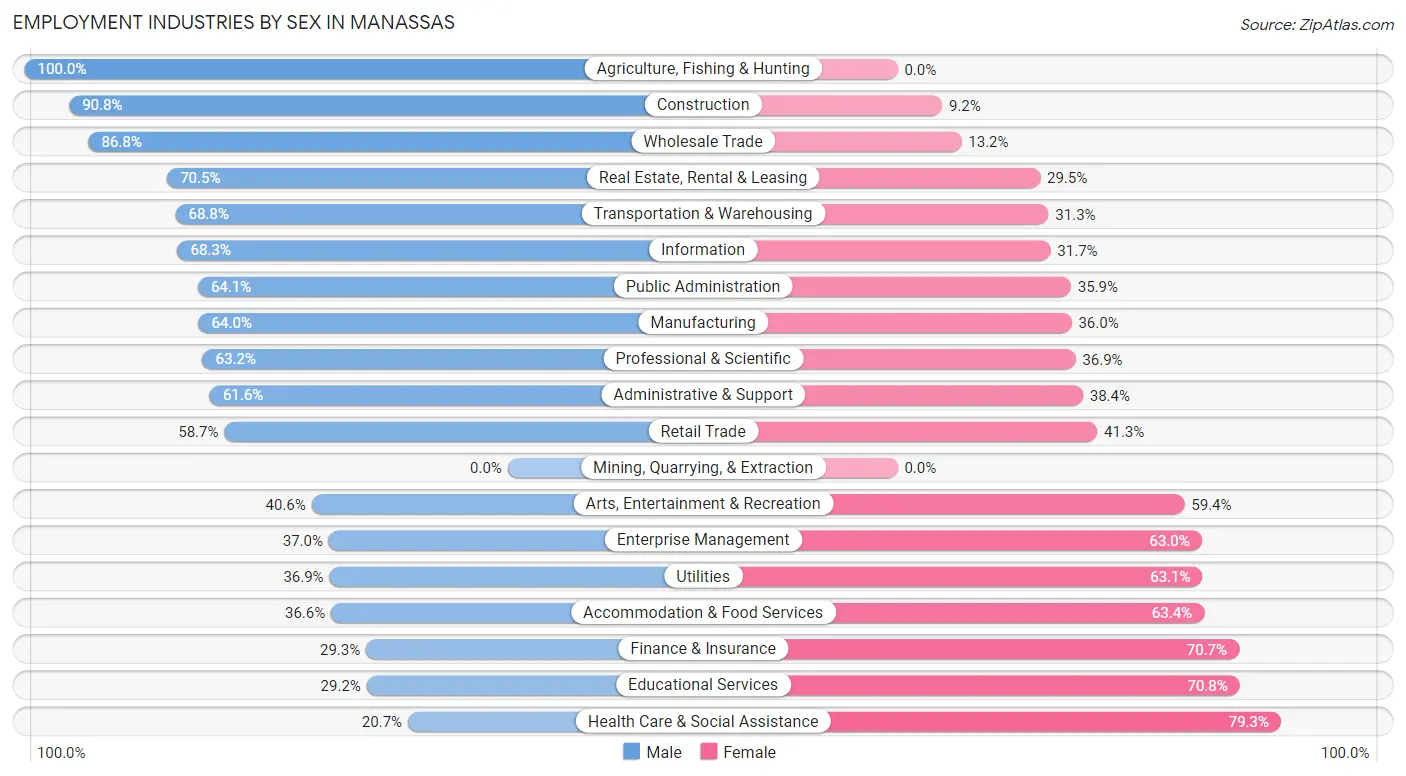
Employment Industries by Sex in Manassas
The Manassas industries that see more men than women are Agriculture, Fishing & Hunting (100.0%), Construction (90.8%), and Wholesale Trade (86.8%), whereas the industries that tend to have a higher number of women are Health Care & Social Assistance (79.3%), Educational Services (70.8%), and Finance & Insurance (70.7%).
| Industry | Male | Female |
| Agriculture, Fishing & Hunting | 12 (100.0%) | 0 (0.0%) |
| Mining, Quarrying, & Extraction | 0 (0.0%) | 0 (0.0%) |
| Construction | 2,857 (90.8%) | 291 (9.2%) |
| Manufacturing | 648 (64.0%) | 365 (36.0%) |
| Wholesale Trade | 223 (86.8%) | 34 (13.2%) |
| Retail Trade | 1,120 (58.7%) | 789 (41.3%) |
| Transportation & Warehousing | 649 (68.8%) | 295 (31.2%) |
| Utilities | 100 (36.9%) | 171 (63.1%) |
| Information | 164 (68.3%) | 76 (31.7%) |
| Finance & Insurance | 200 (29.3%) | 482 (70.7%) |
| Real Estate, Rental & Leasing | 234 (70.5%) | 98 (29.5%) |
| Professional & Scientific | 1,695 (63.1%) | 989 (36.8%) |
| Enterprise Management | 10 (37.0%) | 17 (63.0%) |
| Administrative & Support | 1,036 (61.6%) | 645 (38.4%) |
| Educational Services | 532 (29.2%) | 1,290 (70.8%) |
| Health Care & Social Assistance | 532 (20.7%) | 2,043 (79.3%) |
| Arts, Entertainment & Recreation | 134 (40.6%) | 196 (59.4%) |
| Accommodation & Food Services | 512 (36.6%) | 888 (63.4%) |
| Public Administration | 1,404 (64.1%) | 786 (35.9%) |
| Total | 12,635 (55.2%) | 10,264 (44.8%) |
Education in Manassas
School Enrollment in Manassas
The most common levels of schooling among the 11,181 students in Manassas are middle school (2,676 | 23.9%), elementary school (2,537 | 22.7%), and high school (2,172 | 19.4%).
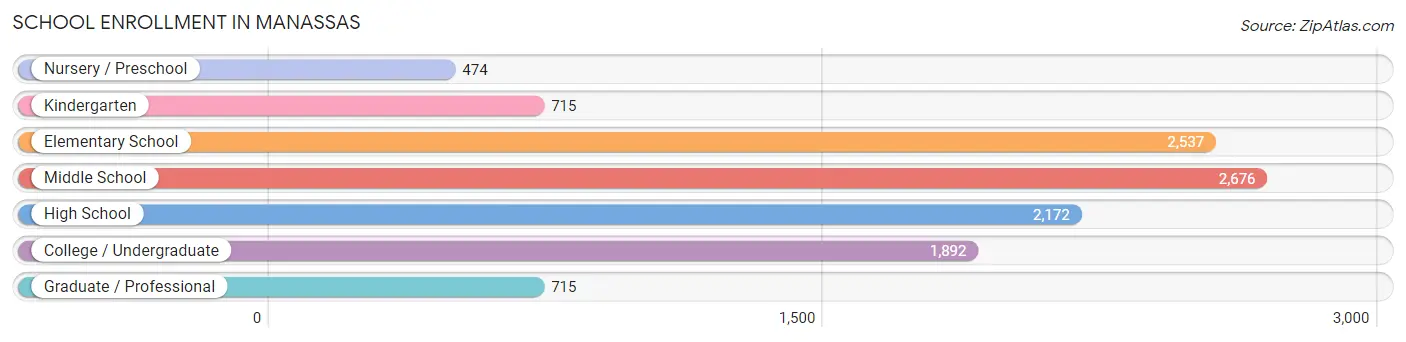
| School Level | # Students | % Students |
| Nursery / Preschool | 474 | 4.2% |
| Kindergarten | 715 | 6.4% |
| Elementary School | 2,537 | 22.7% |
| Middle School | 2,676 | 23.9% |
| High School | 2,172 | 19.4% |
| College / Undergraduate | 1,892 | 16.9% |
| Graduate / Professional | 715 | 6.4% |
| Total | 11,181 | 100.0% |
School Enrollment by Age by Funding Source in Manassas
Out of a total of 11,181 students who are enrolled in schools in Manassas, 2,382 (21.3%) attend a private institution, while the remaining 8,799 (78.7%) are enrolled in public schools. The age group of 35 years and over has the highest likelihood of being enrolled in private schools, with 418 (62.3% in the age bracket) enrolled. Conversely, the age group of 18 to 19 year olds has the lowest likelihood of being enrolled in a private school, with 713 (88.0% in the age bracket) attending a public institution.
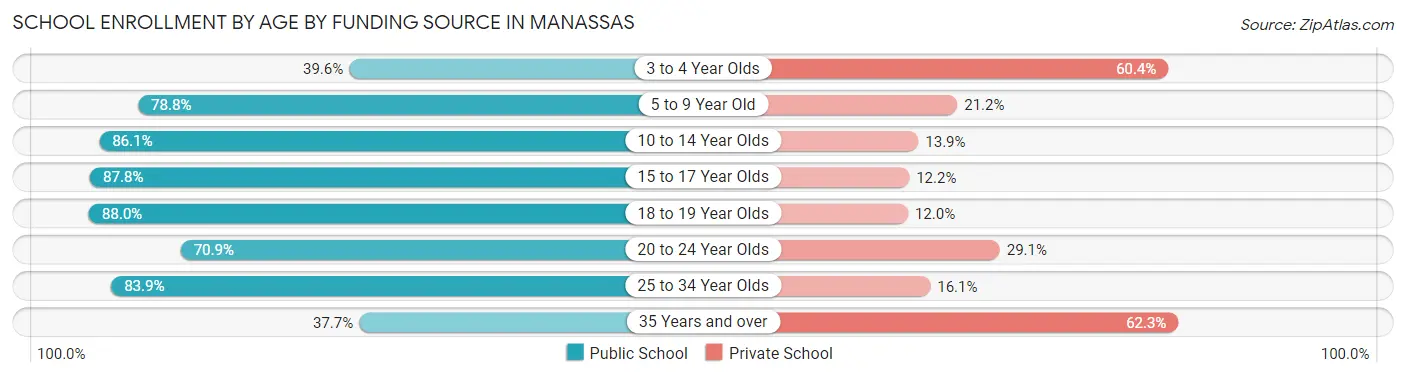
| Age Bracket | Public School | Private School |
| 3 to 4 Year Olds | 144 (39.6%) | 220 (60.4%) |
| 5 to 9 Year Old | 2,422 (78.8%) | 650 (21.2%) |
| 10 to 14 Year Olds | 2,618 (86.1%) | 423 (13.9%) |
| 15 to 17 Year Olds | 1,496 (87.8%) | 208 (12.2%) |
| 18 to 19 Year Olds | 713 (88.0%) | 97 (12.0%) |
| 20 to 24 Year Olds | 673 (70.9%) | 276 (29.1%) |
| 25 to 34 Year Olds | 478 (83.9%) | 92 (16.1%) |
| 35 Years and over | 253 (37.7%) | 418 (62.3%) |
| Total | 8,799 (78.7%) | 2,382 (21.3%) |
Educational Attainment by Field of Study in Manassas
Business (1,959 | 18.8%), education (904 | 8.7%), social sciences (881 | 8.5%), science & technology (833 | 8.0%), and computers & mathematics (817 | 7.8%) are the most common fields of study among 10,422 individuals in Manassas who have obtained a bachelor's degree or higher.
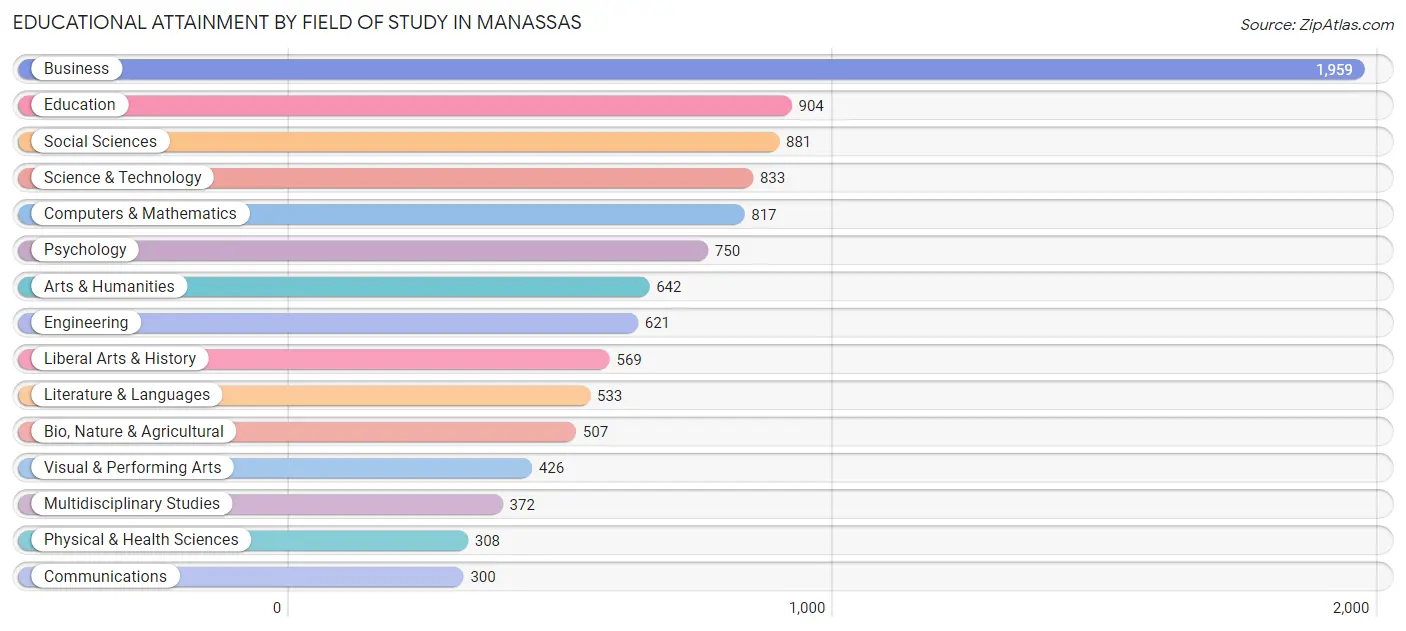
| Field of Study | # Graduates | % Graduates |
| Computers & Mathematics | 817 | 7.8% |
| Bio, Nature & Agricultural | 507 | 4.9% |
| Physical & Health Sciences | 308 | 3.0% |
| Psychology | 750 | 7.2% |
| Social Sciences | 881 | 8.5% |
| Engineering | 621 | 6.0% |
| Multidisciplinary Studies | 372 | 3.6% |
| Science & Technology | 833 | 8.0% |
| Business | 1,959 | 18.8% |
| Education | 904 | 8.7% |
| Literature & Languages | 533 | 5.1% |
| Liberal Arts & History | 569 | 5.5% |
| Visual & Performing Arts | 426 | 4.1% |
| Communications | 300 | 2.9% |
| Arts & Humanities | 642 | 6.2% |
| Total | 10,422 | 100.0% |
Transportation & Commute in Manassas
Vehicle Availability by Sex in Manassas
The most prevalent vehicle ownership categories in Manassas are males with 2 vehicles (5,394, accounting for 42.9%) and females with 2 vehicles (3,894, making up 53.9%).
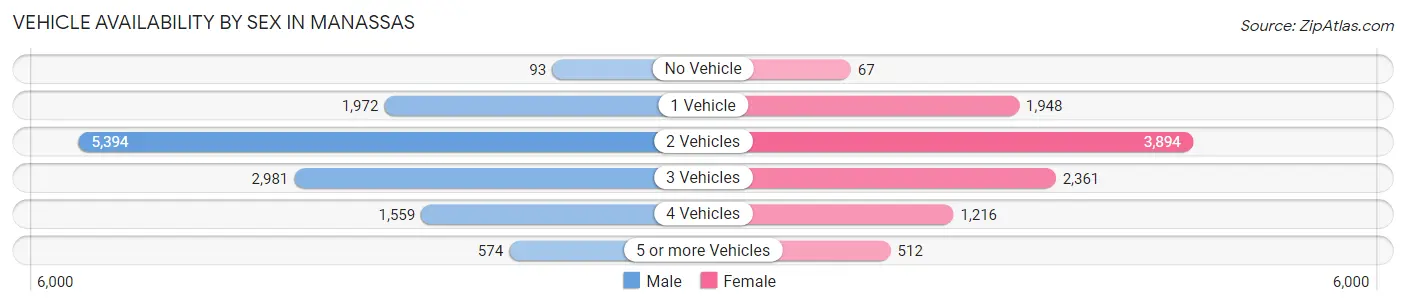
| Vehicles Available | Male | Female |
| No Vehicle | 93 (0.7%) | 67 (0.7%) |
| 1 Vehicle | 1,972 (15.7%) | 1,948 (19.5%) |
| 2 Vehicles | 5,394 (42.9%) | 3,894 (39.0%) |
| 3 Vehicles | 2,981 (23.7%) | 2,361 (23.6%) |
| 4 Vehicles | 1,559 (12.4%) | 1,216 (12.2%) |
| 5 or more Vehicles | 574 (4.6%) | 512 (5.1%) |
| Total | 12,573 (100.0%) | 9,998 (100.0%) |
Commute Time in Manassas
The most frequently occuring commute durations in Manassas are 60 to 89 minutes (3,062 commuters, 15.1%), 10 to 14 minutes (2,670 commuters, 13.2%), and 30 to 34 minutes (2,447 commuters, 12.1%).
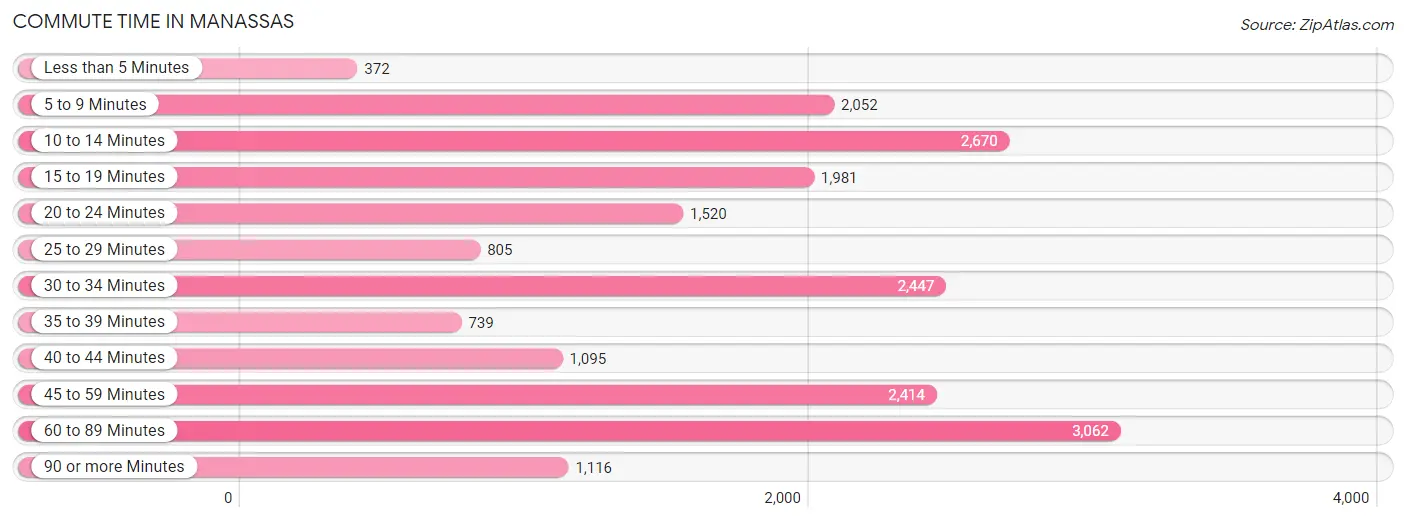
| Commute Time | # Commuters | % Commuters |
| Less than 5 Minutes | 372 | 1.8% |
| 5 to 9 Minutes | 2,052 | 10.1% |
| 10 to 14 Minutes | 2,670 | 13.2% |
| 15 to 19 Minutes | 1,981 | 9.8% |
| 20 to 24 Minutes | 1,520 | 7.5% |
| 25 to 29 Minutes | 805 | 4.0% |
| 30 to 34 Minutes | 2,447 | 12.1% |
| 35 to 39 Minutes | 739 | 3.6% |
| 40 to 44 Minutes | 1,095 | 5.4% |
| 45 to 59 Minutes | 2,414 | 11.9% |
| 60 to 89 Minutes | 3,062 | 15.1% |
| 90 or more Minutes | 1,116 | 5.5% |
Commute Time by Sex in Manassas
The most common commute times in Manassas are 30 to 34 minutes (1,624 commuters, 14.4%) for males and 60 to 89 minutes (1,523 commuters, 17.0%) for females.
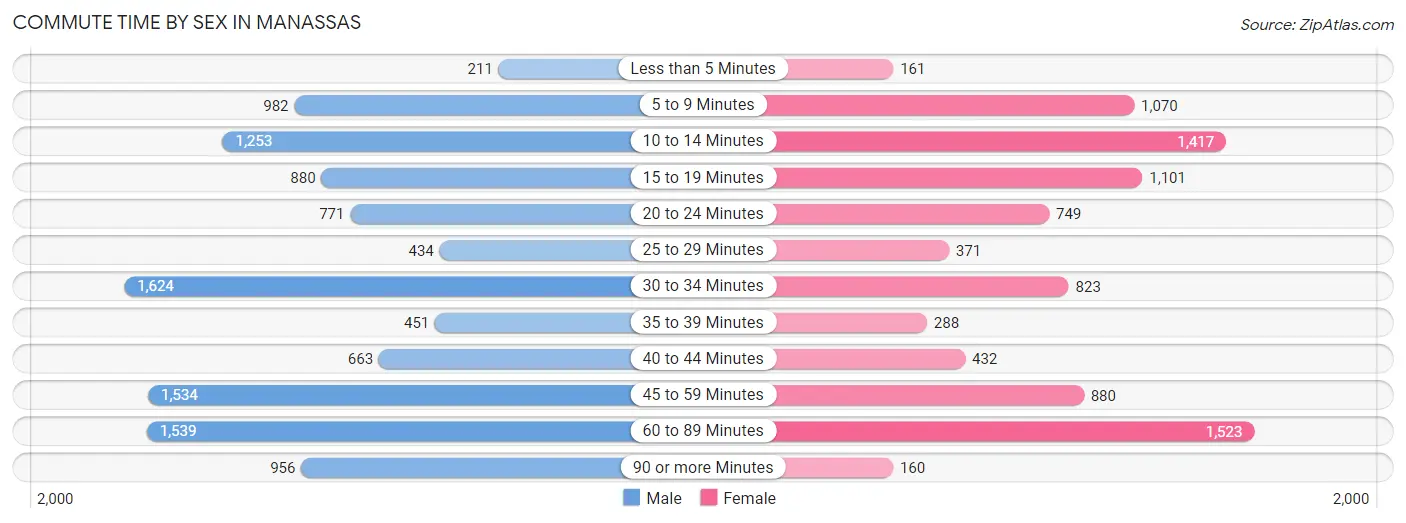
| Commute Time | Male | Female |
| Less than 5 Minutes | 211 (1.9%) | 161 (1.8%) |
| 5 to 9 Minutes | 982 (8.7%) | 1,070 (11.9%) |
| 10 to 14 Minutes | 1,253 (11.1%) | 1,417 (15.8%) |
| 15 to 19 Minutes | 880 (7.8%) | 1,101 (12.3%) |
| 20 to 24 Minutes | 771 (6.8%) | 749 (8.4%) |
| 25 to 29 Minutes | 434 (3.8%) | 371 (4.1%) |
| 30 to 34 Minutes | 1,624 (14.4%) | 823 (9.2%) |
| 35 to 39 Minutes | 451 (4.0%) | 288 (3.2%) |
| 40 to 44 Minutes | 663 (5.9%) | 432 (4.8%) |
| 45 to 59 Minutes | 1,534 (13.6%) | 880 (9.8%) |
| 60 to 89 Minutes | 1,539 (13.6%) | 1,523 (17.0%) |
| 90 or more Minutes | 956 (8.5%) | 160 (1.8%) |
Time of Departure to Work by Sex in Manassas
The most frequent times of departure to work in Manassas are 6:00 AM to 6:29 AM (1,884, 16.7%) for males and 8:00 AM to 8:29 AM (1,219, 13.6%) for females.
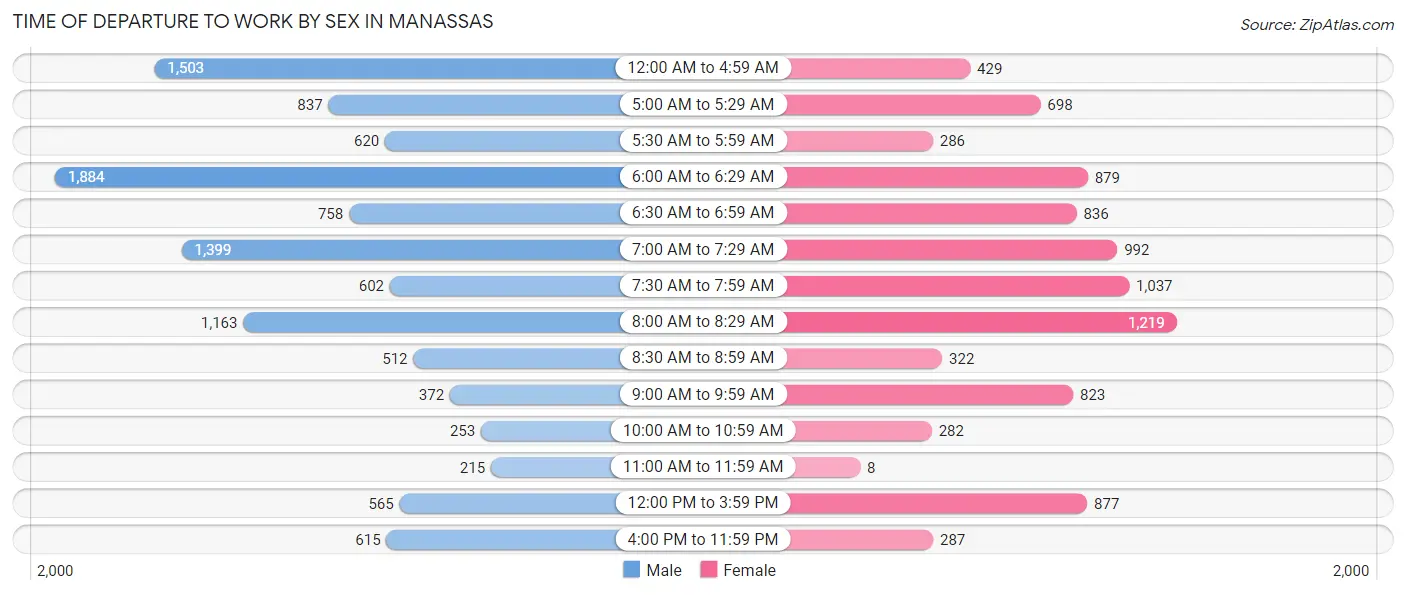
| Time of Departure | Male | Female |
| 12:00 AM to 4:59 AM | 1,503 (13.3%) | 429 (4.8%) |
| 5:00 AM to 5:29 AM | 837 (7.4%) | 698 (7.8%) |
| 5:30 AM to 5:59 AM | 620 (5.5%) | 286 (3.2%) |
| 6:00 AM to 6:29 AM | 1,884 (16.7%) | 879 (9.8%) |
| 6:30 AM to 6:59 AM | 758 (6.7%) | 836 (9.3%) |
| 7:00 AM to 7:29 AM | 1,399 (12.4%) | 992 (11.1%) |
| 7:30 AM to 7:59 AM | 602 (5.3%) | 1,037 (11.6%) |
| 8:00 AM to 8:29 AM | 1,163 (10.3%) | 1,219 (13.6%) |
| 8:30 AM to 8:59 AM | 512 (4.5%) | 322 (3.6%) |
| 9:00 AM to 9:59 AM | 372 (3.3%) | 823 (9.2%) |
| 10:00 AM to 10:59 AM | 253 (2.2%) | 282 (3.1%) |
| 11:00 AM to 11:59 AM | 215 (1.9%) | 8 (0.1%) |
| 12:00 PM to 3:59 PM | 565 (5.0%) | 877 (9.8%) |
| 4:00 PM to 11:59 PM | 615 (5.4%) | 287 (3.2%) |
| Total | 11,298 (100.0%) | 8,975 (100.0%) |
Housing Occupancy in Manassas
Occupancy by Ownership in Manassas
Of the total 13,840 dwellings in Manassas, owner-occupied units account for 10,236 (74.0%), while renter-occupied units make up 3,604 (26.0%).
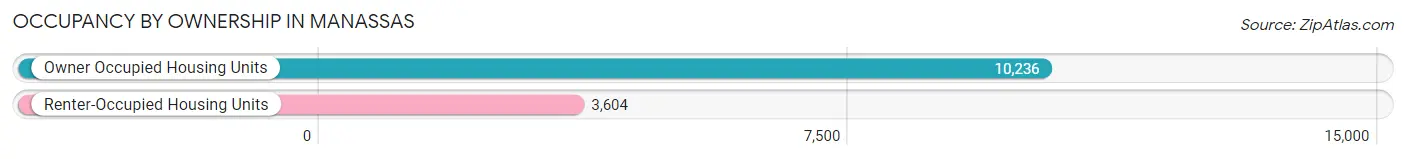
| Occupancy | # Housing Units | % Housing Units |
| Owner Occupied Housing Units | 10,236 | 74.0% |
| Renter-Occupied Housing Units | 3,604 | 26.0% |
| Total Occupied Housing Units | 13,840 | 100.0% |
Occupancy by Household Size in Manassas
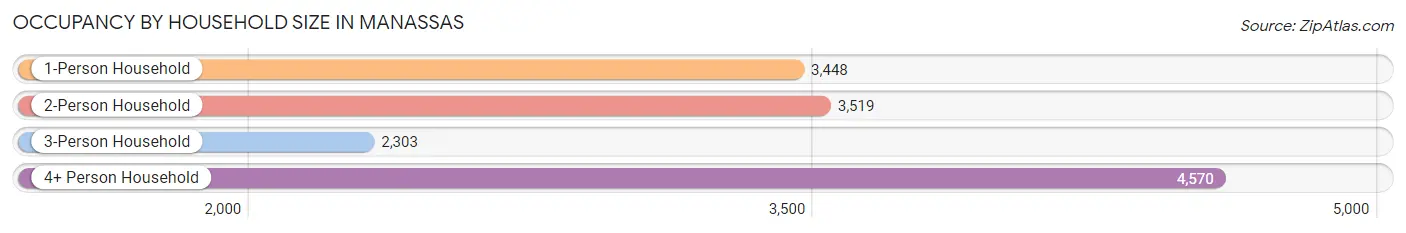
| Household Size | # Housing Units | % Housing Units |
| 1-Person Household | 3,448 | 24.9% |
| 2-Person Household | 3,519 | 25.4% |
| 3-Person Household | 2,303 | 16.6% |
| 4+ Person Household | 4,570 | 33.0% |
| Total Housing Units | 13,840 | 100.0% |
Occupancy by Ownership by Household Size in Manassas
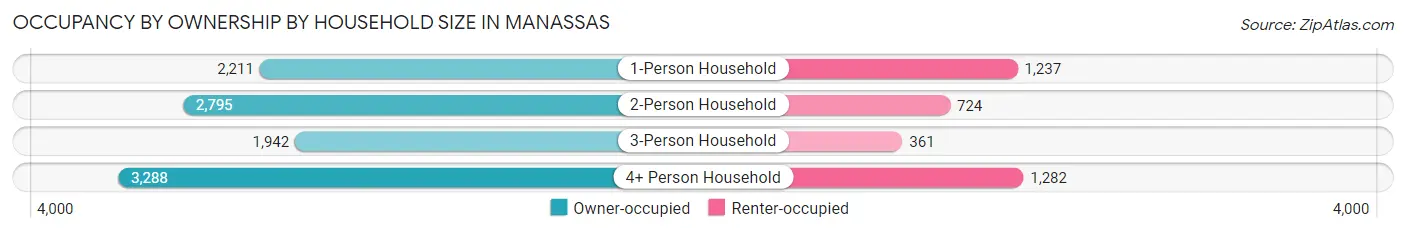
| Household Size | Owner-occupied | Renter-occupied |
| 1-Person Household | 2,211 (64.1%) | 1,237 (35.9%) |
| 2-Person Household | 2,795 (79.4%) | 724 (20.6%) |
| 3-Person Household | 1,942 (84.3%) | 361 (15.7%) |
| 4+ Person Household | 3,288 (72.0%) | 1,282 (28.1%) |
| Total Housing Units | 10,236 (74.0%) | 3,604 (26.0%) |
Occupancy by Educational Attainment in Manassas
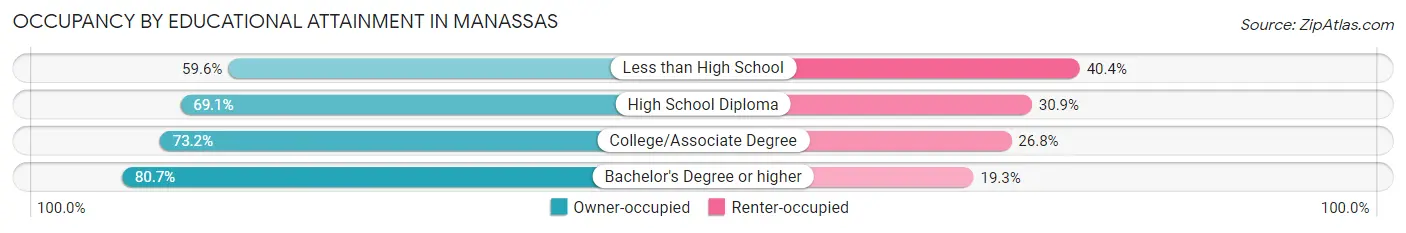
| Household Size | Owner-occupied | Renter-occupied |
| Less than High School | 702 (59.6%) | 475 (40.4%) |
| High School Diploma | 2,394 (69.1%) | 1,069 (30.9%) |
| College/Associate Degree | 2,774 (73.2%) | 1,016 (26.8%) |
| Bachelor's Degree or higher | 4,366 (80.7%) | 1,044 (19.3%) |
Occupancy by Age of Householder in Manassas
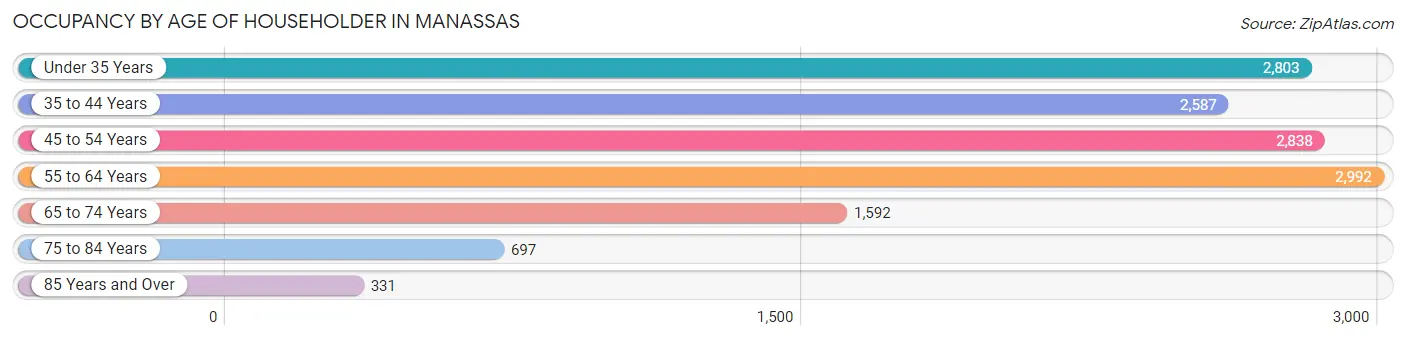
| Age Bracket | # Households | % Households |
| Under 35 Years | 2,803 | 20.3% |
| 35 to 44 Years | 2,587 | 18.7% |
| 45 to 54 Years | 2,838 | 20.5% |
| 55 to 64 Years | 2,992 | 21.6% |
| 65 to 74 Years | 1,592 | 11.5% |
| 75 to 84 Years | 697 | 5.0% |
| 85 Years and Over | 331 | 2.4% |
| Total | 13,840 | 100.0% |
Housing Finances in Manassas
Median Income by Occupancy in Manassas
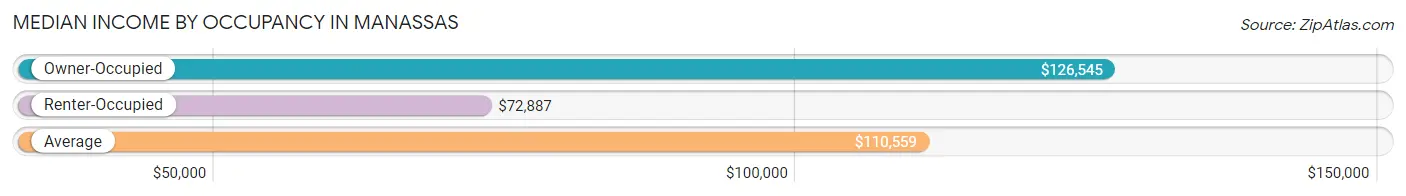
| Occupancy Type | # Households | Median Income |
| Owner-Occupied | 10,236 (74.0%) | $126,545 |
| Renter-Occupied | 3,604 (26.0%) | $72,887 |
| Average | 13,840 (100.0%) | $110,559 |
Occupancy by Householder Income Bracket in Manassas
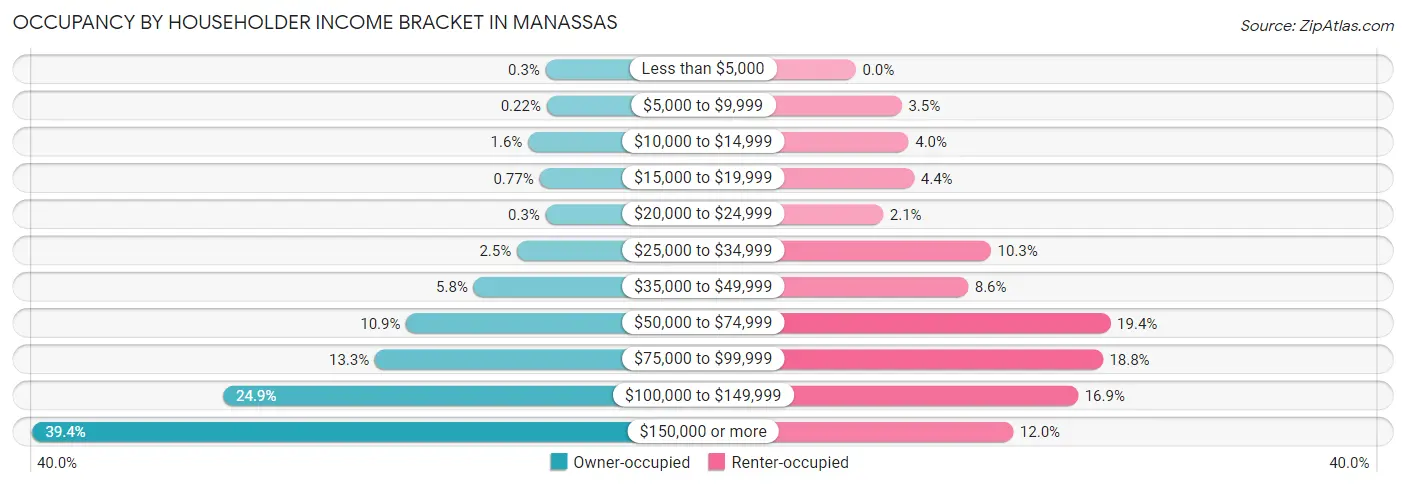
| Income Bracket | Owner-occupied | Renter-occupied |
| Less than $5,000 | 31 (0.3%) | 0 (0.0%) |
| $5,000 to $9,999 | 23 (0.2%) | 126 (3.5%) |
| $10,000 to $14,999 | 167 (1.6%) | 145 (4.0%) |
| $15,000 to $19,999 | 79 (0.8%) | 160 (4.4%) |
| $20,000 to $24,999 | 31 (0.3%) | 75 (2.1%) |
| $25,000 to $34,999 | 254 (2.5%) | 371 (10.3%) |
| $35,000 to $49,999 | 592 (5.8%) | 308 (8.6%) |
| $50,000 to $74,999 | 1,118 (10.9%) | 699 (19.4%) |
| $75,000 to $99,999 | 1,361 (13.3%) | 678 (18.8%) |
| $100,000 to $149,999 | 2,547 (24.9%) | 610 (16.9%) |
| $150,000 or more | 4,033 (39.4%) | 432 (12.0%) |
| Total | 10,236 (100.0%) | 3,604 (100.0%) |
Monthly Housing Cost Tiers in Manassas
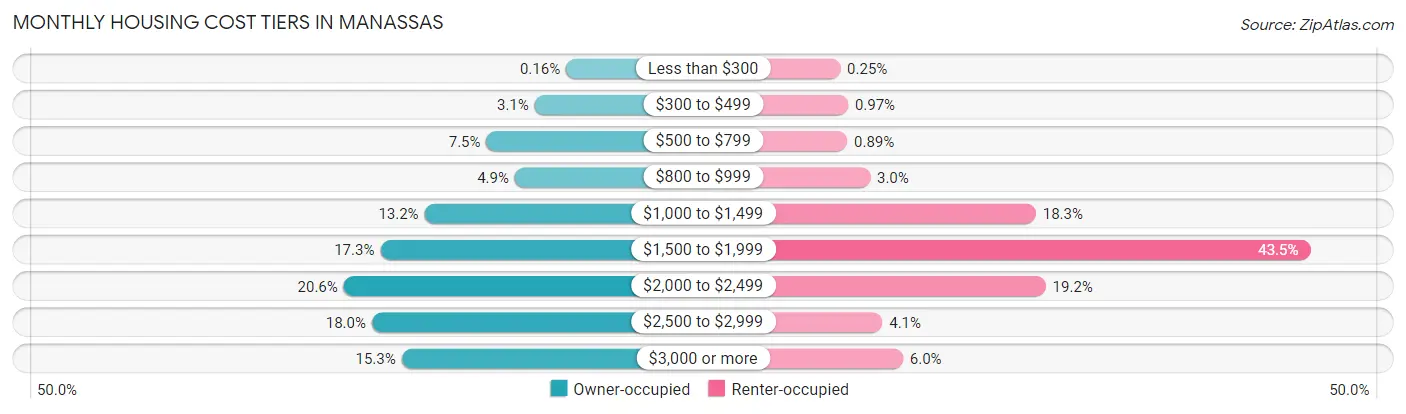
| Monthly Cost | Owner-occupied | Renter-occupied |
| Less than $300 | 16 (0.2%) | 9 (0.3%) |
| $300 to $499 | 312 (3.0%) | 35 (1.0%) |
| $500 to $799 | 767 (7.5%) | 32 (0.9%) |
| $800 to $999 | 499 (4.9%) | 108 (3.0%) |
| $1,000 to $1,499 | 1,350 (13.2%) | 658 (18.3%) |
| $1,500 to $1,999 | 1,767 (17.3%) | 1,569 (43.5%) |
| $2,000 to $2,499 | 2,112 (20.6%) | 691 (19.2%) |
| $2,500 to $2,999 | 1,847 (18.0%) | 149 (4.1%) |
| $3,000 or more | 1,566 (15.3%) | 217 (6.0%) |
| Total | 10,236 (100.0%) | 3,604 (100.0%) |
Physical Housing Characteristics in Manassas
Housing Structures in Manassas
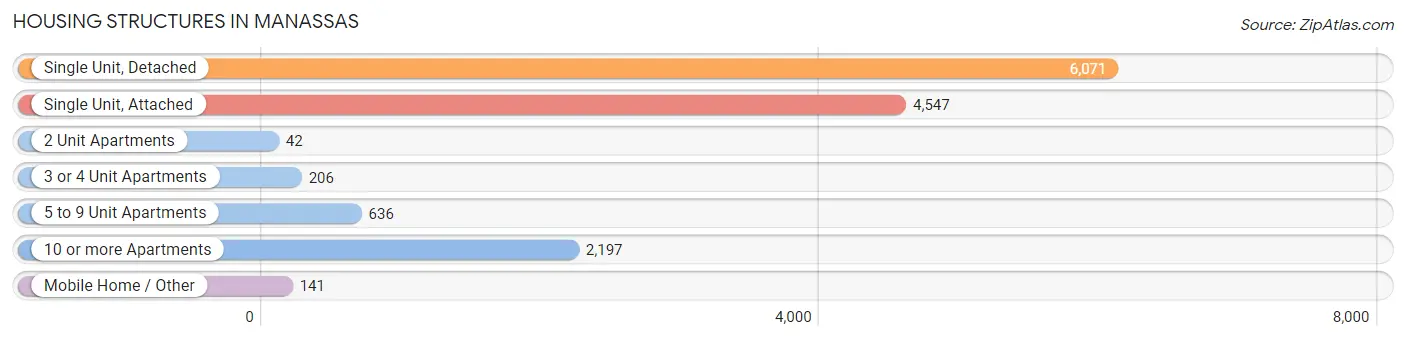
| Structure Type | # Housing Units | % Housing Units |
| Single Unit, Detached | 6,071 | 43.9% |
| Single Unit, Attached | 4,547 | 32.9% |
| 2 Unit Apartments | 42 | 0.3% |
| 3 or 4 Unit Apartments | 206 | 1.5% |
| 5 to 9 Unit Apartments | 636 | 4.6% |
| 10 or more Apartments | 2,197 | 15.9% |
| Mobile Home / Other | 141 | 1.0% |
| Total | 13,840 | 100.0% |
Housing Structures by Occupancy in Manassas
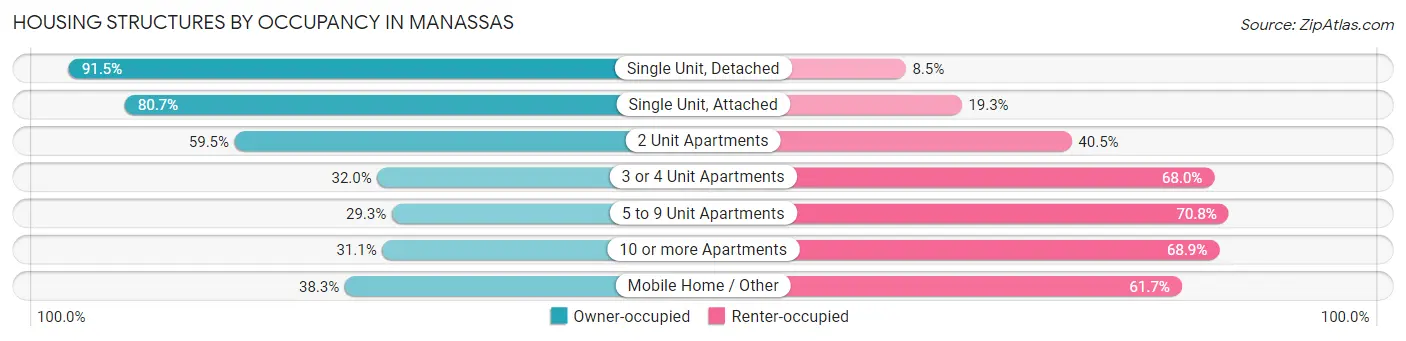
| Structure Type | Owner-occupied | Renter-occupied |
| Single Unit, Detached | 5,553 (91.5%) | 518 (8.5%) |
| Single Unit, Attached | 3,669 (80.7%) | 878 (19.3%) |
| 2 Unit Apartments | 25 (59.5%) | 17 (40.5%) |
| 3 or 4 Unit Apartments | 66 (32.0%) | 140 (68.0%) |
| 5 to 9 Unit Apartments | 186 (29.2%) | 450 (70.8%) |
| 10 or more Apartments | 683 (31.1%) | 1,514 (68.9%) |
| Mobile Home / Other | 54 (38.3%) | 87 (61.7%) |
| Total | 10,236 (74.0%) | 3,604 (26.0%) |
Housing Structures by Number of Rooms in Manassas
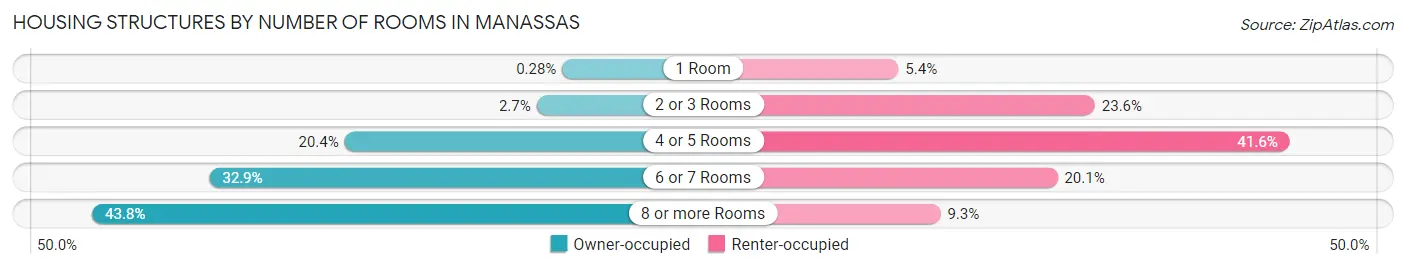
| Number of Rooms | Owner-occupied | Renter-occupied |
| 1 Room | 29 (0.3%) | 195 (5.4%) |
| 2 or 3 Rooms | 271 (2.6%) | 850 (23.6%) |
| 4 or 5 Rooms | 2,089 (20.4%) | 1,499 (41.6%) |
| 6 or 7 Rooms | 3,369 (32.9%) | 725 (20.1%) |
| 8 or more Rooms | 4,478 (43.8%) | 335 (9.3%) |
| Total | 10,236 (100.0%) | 3,604 (100.0%) |
Housing Structure by Heating Type in Manassas
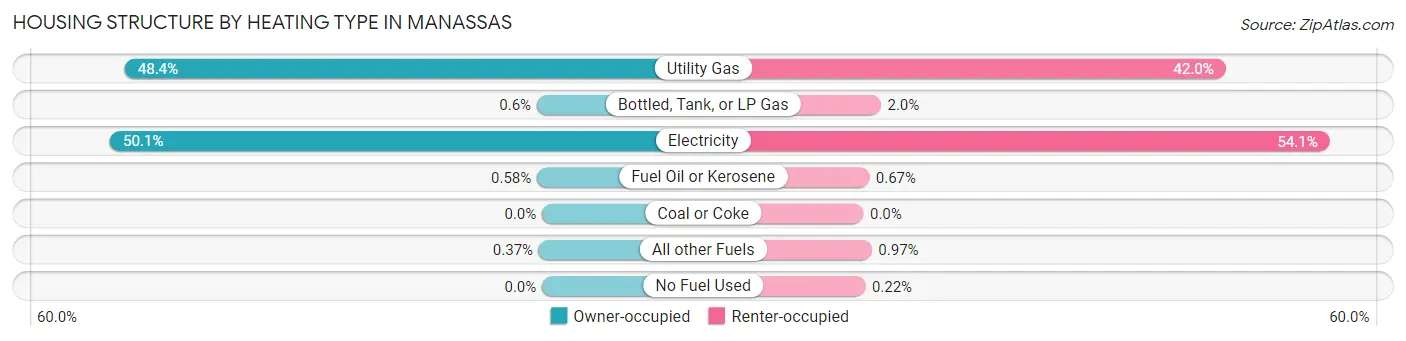
| Heating Type | Owner-occupied | Renter-occupied |
| Utility Gas | 4,951 (48.4%) | 1,515 (42.0%) |
| Bottled, Tank, or LP Gas | 61 (0.6%) | 73 (2.0%) |
| Electricity | 5,127 (50.1%) | 1,949 (54.1%) |
| Fuel Oil or Kerosene | 59 (0.6%) | 24 (0.7%) |
| Coal or Coke | 0 (0.0%) | 0 (0.0%) |
| All other Fuels | 38 (0.4%) | 35 (1.0%) |
| No Fuel Used | 0 (0.0%) | 8 (0.2%) |
| Total | 10,236 (100.0%) | 3,604 (100.0%) |
Household Vehicle Usage in Manassas
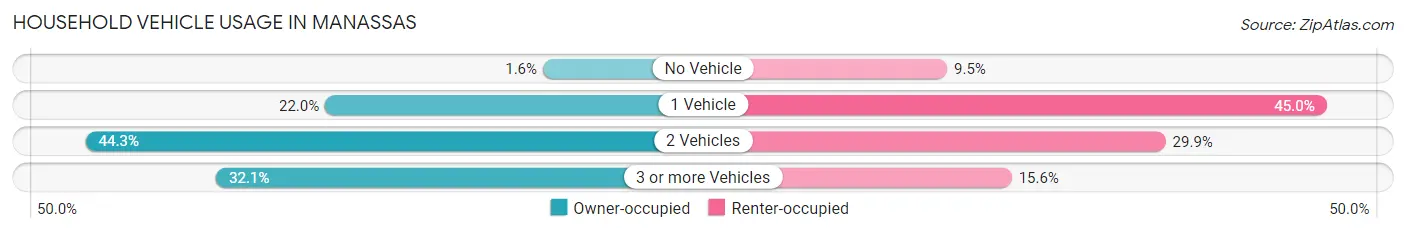
| Vehicles per Household | Owner-occupied | Renter-occupied |
| No Vehicle | 166 (1.6%) | 344 (9.5%) |
| 1 Vehicle | 2,247 (22.0%) | 1,620 (45.0%) |
| 2 Vehicles | 4,535 (44.3%) | 1,079 (29.9%) |
| 3 or more Vehicles | 3,288 (32.1%) | 561 (15.6%) |
| Total | 10,236 (100.0%) | 3,604 (100.0%) |
Real Estate & Mortgages in Manassas
Real Estate and Mortgage Overview in Manassas
| Characteristic | Without Mortgage | With Mortgage |
| Housing Units | 1,829 | 8,407 |
| Median Property Value | $403,200 | $392,500 |
| Median Household Income | $98,009 | $3,489 |
| Monthly Housing Costs | $777 | $1,551 |
| Real Estate Taxes | $5,101 | $185 |
Property Value by Mortgage Status in Manassas
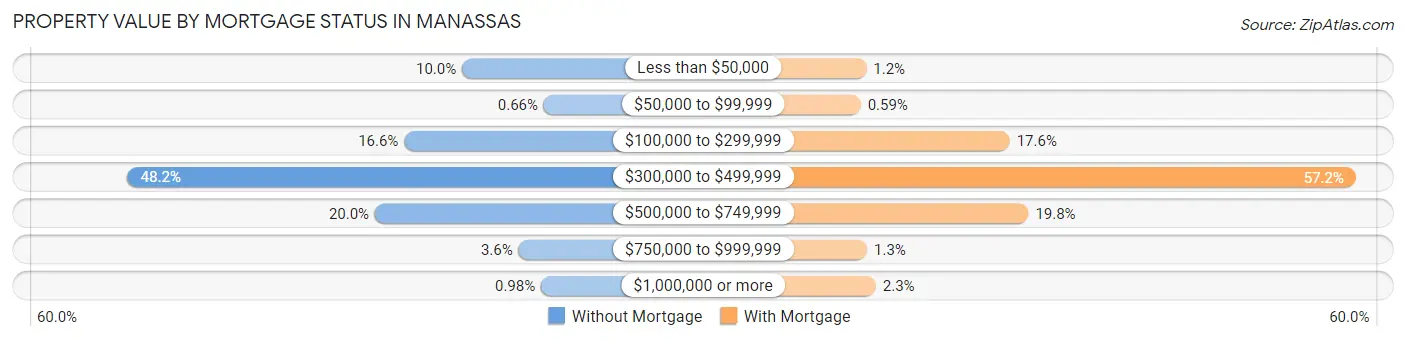
| Property Value | Without Mortgage | With Mortgage |
| Less than $50,000 | 183 (10.0%) | 103 (1.2%) |
| $50,000 to $99,999 | 12 (0.7%) | 50 (0.6%) |
| $100,000 to $299,999 | 304 (16.6%) | 1,481 (17.6%) |
| $300,000 to $499,999 | 882 (48.2%) | 4,806 (57.2%) |
| $500,000 to $749,999 | 365 (20.0%) | 1,661 (19.8%) |
| $750,000 to $999,999 | 65 (3.5%) | 111 (1.3%) |
| $1,000,000 or more | 18 (1.0%) | 195 (2.3%) |
| Total | 1,829 (100.0%) | 8,407 (100.0%) |
Household Income by Mortgage Status in Manassas
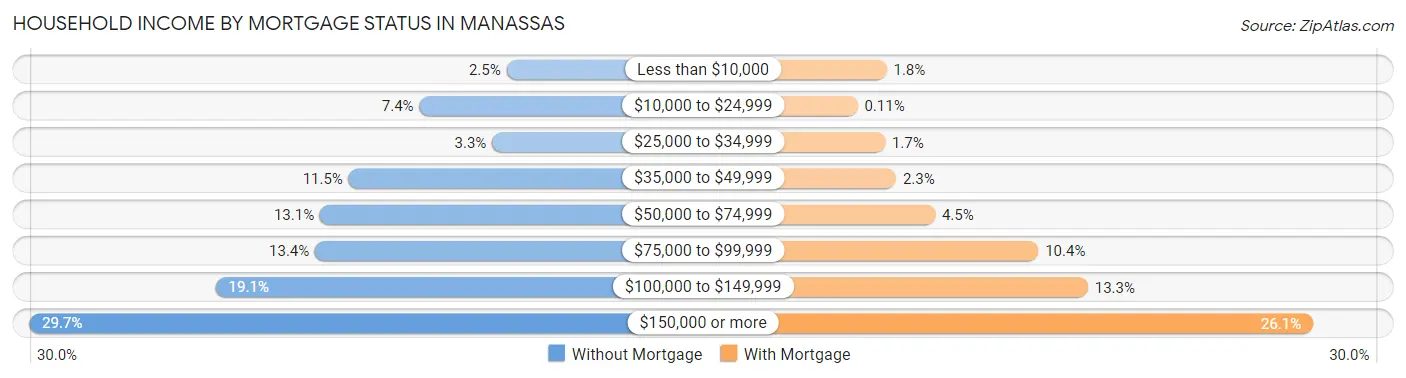
| Household Income | Without Mortgage | With Mortgage |
| Less than $10,000 | 45 (2.5%) | 149 (1.8%) |
| $10,000 to $24,999 | 136 (7.4%) | 9 (0.1%) |
| $25,000 to $34,999 | 60 (3.3%) | 141 (1.7%) |
| $35,000 to $49,999 | 210 (11.5%) | 194 (2.3%) |
| $50,000 to $74,999 | 240 (13.1%) | 382 (4.5%) |
| $75,000 to $99,999 | 245 (13.4%) | 878 (10.4%) |
| $100,000 to $149,999 | 349 (19.1%) | 1,116 (13.3%) |
| $150,000 or more | 544 (29.7%) | 2,198 (26.1%) |
| Total | 1,829 (100.0%) | 8,407 (100.0%) |
Property Value to Household Income Ratio in Manassas
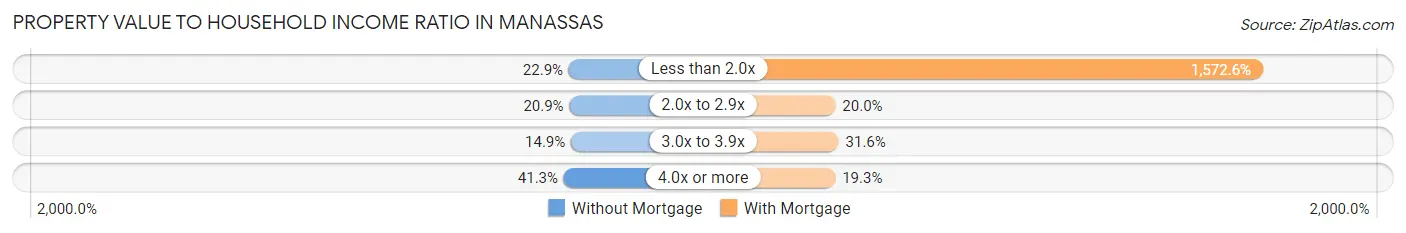
| Value-to-Income Ratio | Without Mortgage | With Mortgage |
| Less than 2.0x | 418 (22.9%) | 132,205 (1,572.6%) |
| 2.0x to 2.9x | 383 (20.9%) | 1,677 (20.0%) |
| 3.0x to 3.9x | 273 (14.9%) | 2,655 (31.6%) |
| 4.0x or more | 755 (41.3%) | 1,626 (19.3%) |
| Total | 1,829 (100.0%) | 8,407 (100.0%) |
Real Estate Taxes by Mortgage Status in Manassas
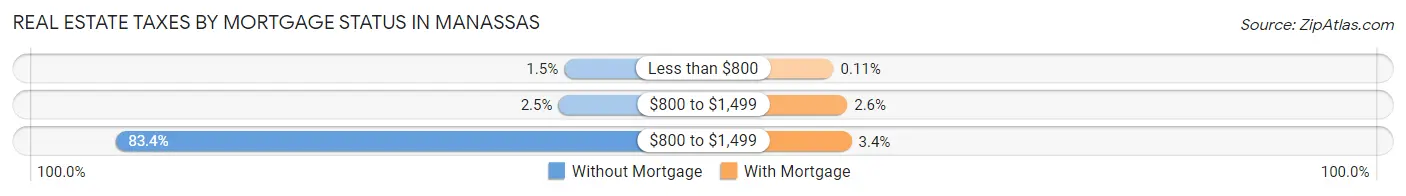
| Property Taxes | Without Mortgage | With Mortgage |
| Less than $800 | 27 (1.5%) | 9 (0.1%) |
| $800 to $1,499 | 46 (2.5%) | 219 (2.6%) |
| $800 to $1,499 | 1,526 (83.4%) | 285 (3.4%) |
| Total | 1,829 (100.0%) | 8,407 (100.0%) |
Health & Disability in Manassas
Health Insurance Coverage by Age in Manassas
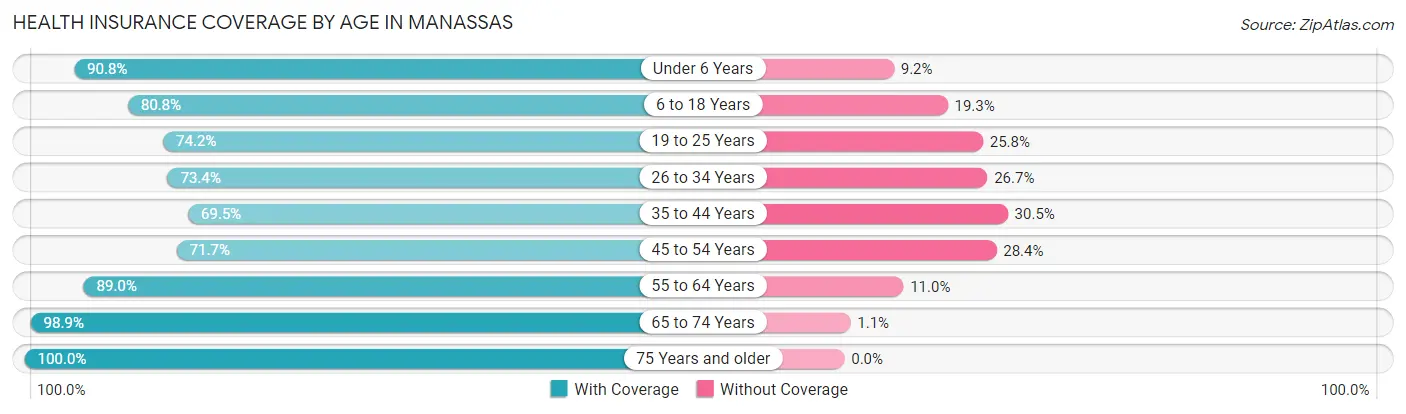
| Age Bracket | With Coverage | Without Coverage |
| Under 6 Years | 3,480 (90.8%) | 354 (9.2%) |
| 6 to 18 Years | 6,552 (80.7%) | 1,562 (19.3%) |
| 19 to 25 Years | 2,652 (74.2%) | 923 (25.8%) |
| 26 to 34 Years | 4,168 (73.4%) | 1,514 (26.7%) |
| 35 to 44 Years | 4,305 (69.5%) | 1,886 (30.5%) |
| 45 to 54 Years | 3,907 (71.7%) | 1,546 (28.3%) |
| 55 to 64 Years | 4,560 (89.0%) | 563 (11.0%) |
| 65 to 74 Years | 2,797 (98.9%) | 32 (1.1%) |
| 75 Years and older | 1,740 (100.0%) | 0 (0.0%) |
| Total | 34,161 (80.3%) | 8,380 (19.7%) |
Health Insurance Coverage by Citizenship Status in Manassas
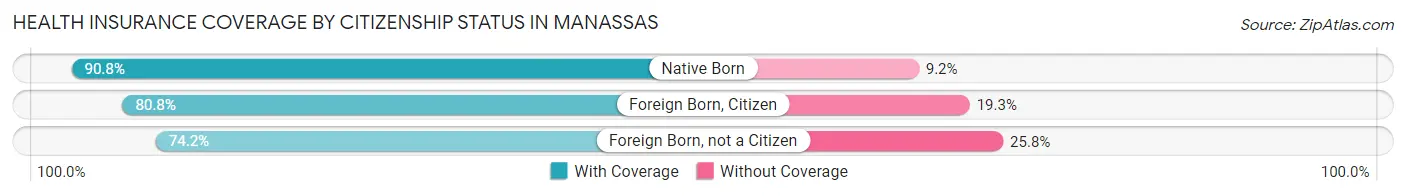
| Citizenship Status | With Coverage | Without Coverage |
| Native Born | 3,480 (90.8%) | 354 (9.2%) |
| Foreign Born, Citizen | 6,552 (80.7%) | 1,562 (19.3%) |
| Foreign Born, not a Citizen | 2,652 (74.2%) | 923 (25.8%) |
Health Insurance Coverage by Household Income in Manassas
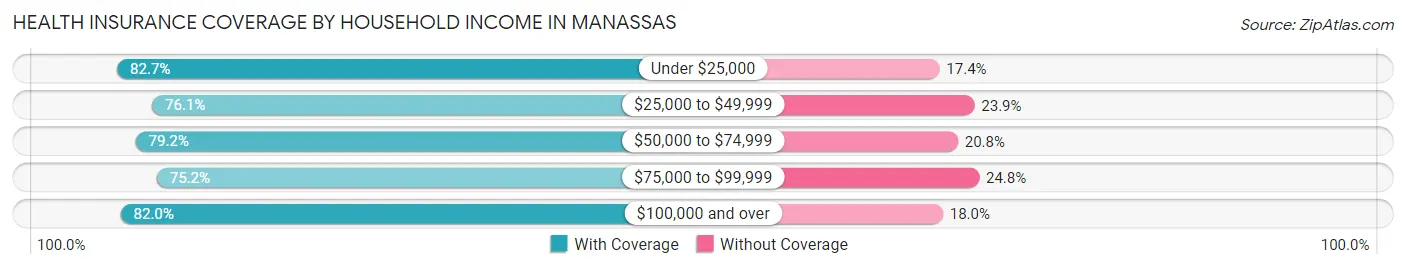
| Household Income | With Coverage | Without Coverage |
| Under $25,000 | 1,110 (82.7%) | 233 (17.3%) |
| $25,000 to $49,999 | 2,809 (76.1%) | 882 (23.9%) |
| $50,000 to $74,999 | 3,628 (79.2%) | 953 (20.8%) |
| $75,000 to $99,999 | 4,447 (75.2%) | 1,464 (24.8%) |
| $100,000 and over | 22,089 (82.0%) | 4,847 (18.0%) |
Public vs Private Health Insurance Coverage by Age in Manassas
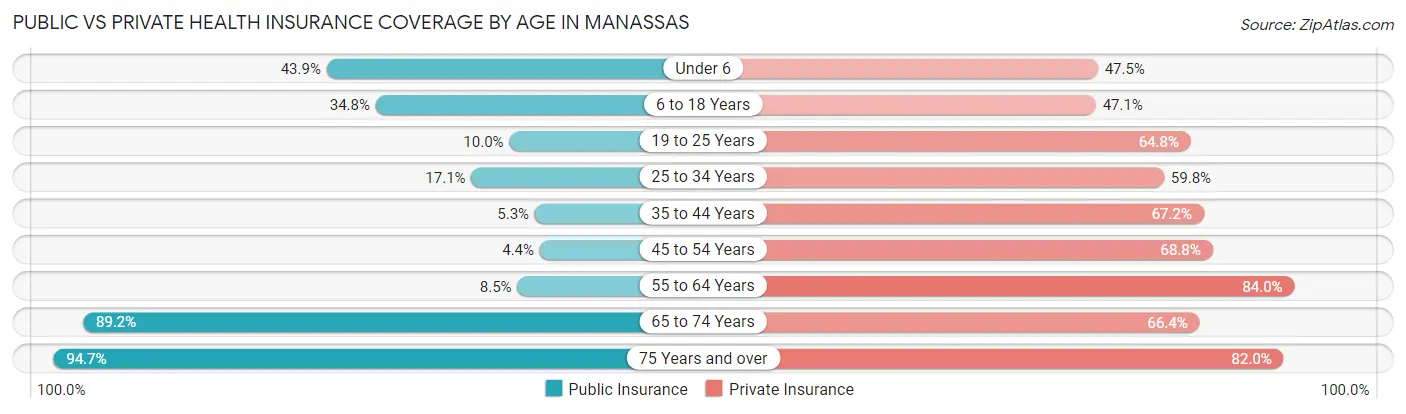
| Age Bracket | Public Insurance | Private Insurance |
| Under 6 | 1,684 (43.9%) | 1,821 (47.5%) |
| 6 to 18 Years | 2,825 (34.8%) | 3,824 (47.1%) |
| 19 to 25 Years | 358 (10.0%) | 2,316 (64.8%) |
| 25 to 34 Years | 970 (17.1%) | 3,397 (59.8%) |
| 35 to 44 Years | 326 (5.3%) | 4,159 (67.2%) |
| 45 to 54 Years | 238 (4.4%) | 3,753 (68.8%) |
| 55 to 64 Years | 437 (8.5%) | 4,304 (84.0%) |
| 65 to 74 Years | 2,523 (89.2%) | 1,879 (66.4%) |
| 75 Years and over | 1,647 (94.7%) | 1,427 (82.0%) |
| Total | 11,008 (25.9%) | 26,880 (63.2%) |
Disability Status by Sex by Age in Manassas
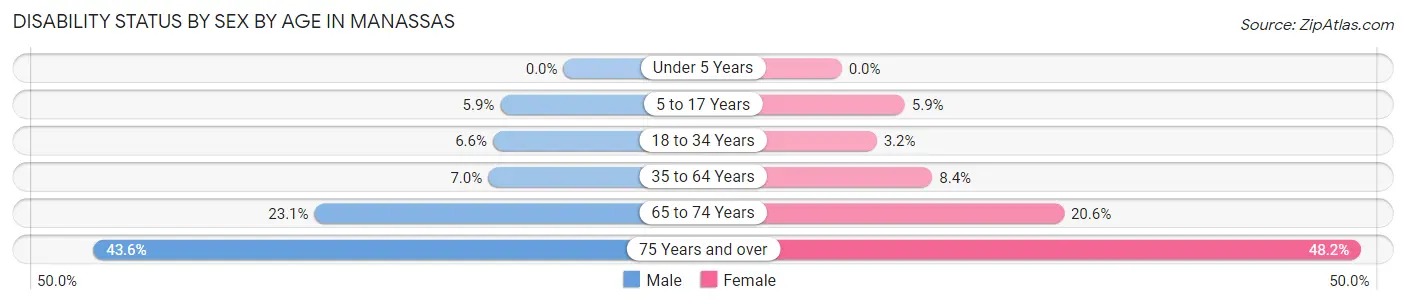
| Age Bracket | Male | Female |
| Under 5 Years | 0 (0.0%) | 0 (0.0%) |
| 5 to 17 Years | 242 (5.9%) | 223 (5.9%) |
| 18 to 34 Years | 342 (6.6%) | 154 (3.2%) |
| 35 to 64 Years | 601 (7.0%) | 686 (8.4%) |
| 65 to 74 Years | 312 (23.1%) | 305 (20.6%) |
| 75 Years and over | 253 (43.6%) | 559 (48.2%) |
Disability Class by Sex by Age in Manassas
Disability Class: Hearing Difficulty
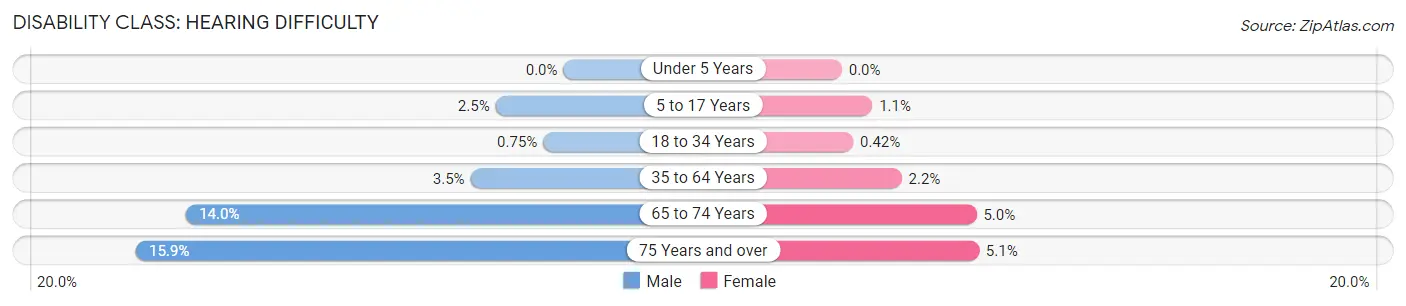
| Age Bracket | Male | Female |
| Under 5 Years | 0 (0.0%) | 0 (0.0%) |
| 5 to 17 Years | 104 (2.5%) | 43 (1.1%) |
| 18 to 34 Years | 39 (0.7%) | 20 (0.4%) |
| 35 to 64 Years | 297 (3.5%) | 181 (2.2%) |
| 65 to 74 Years | 189 (14.0%) | 74 (5.0%) |
| 75 Years and over | 92 (15.9%) | 59 (5.1%) |
Disability Class: Vision Difficulty
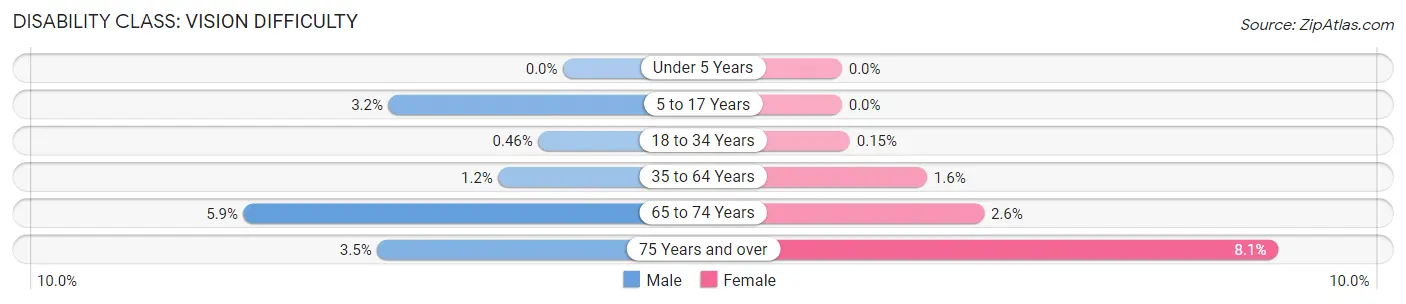
| Age Bracket | Male | Female |
| Under 5 Years | 0 (0.0%) | 0 (0.0%) |
| 5 to 17 Years | 134 (3.2%) | 0 (0.0%) |
| 18 to 34 Years | 24 (0.5%) | 7 (0.2%) |
| 35 to 64 Years | 103 (1.2%) | 129 (1.6%) |
| 65 to 74 Years | 80 (5.9%) | 39 (2.6%) |
| 75 Years and over | 20 (3.5%) | 94 (8.1%) |
Disability Class: Cognitive Difficulty
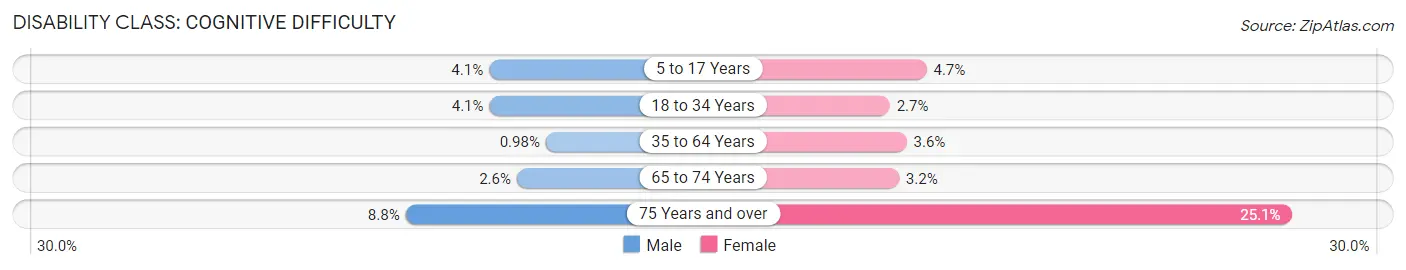
| Age Bracket | Male | Female |
| 5 to 17 Years | 171 (4.1%) | 180 (4.7%) |
| 18 to 34 Years | 215 (4.1%) | 127 (2.7%) |
| 35 to 64 Years | 84 (1.0%) | 295 (3.6%) |
| 65 to 74 Years | 35 (2.6%) | 47 (3.2%) |
| 75 Years and over | 51 (8.8%) | 291 (25.1%) |
Disability Class: Ambulatory Difficulty
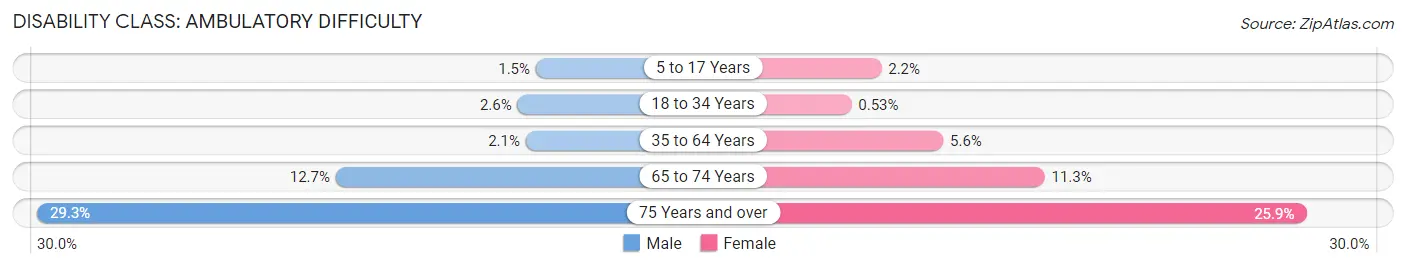
| Age Bracket | Male | Female |
| 5 to 17 Years | 63 (1.5%) | 84 (2.2%) |
| 18 to 34 Years | 133 (2.5%) | 25 (0.5%) |
| 35 to 64 Years | 180 (2.1%) | 461 (5.6%) |
| 65 to 74 Years | 171 (12.7%) | 167 (11.3%) |
| 75 Years and over | 170 (29.3%) | 300 (25.9%) |
Disability Class: Self-Care Difficulty
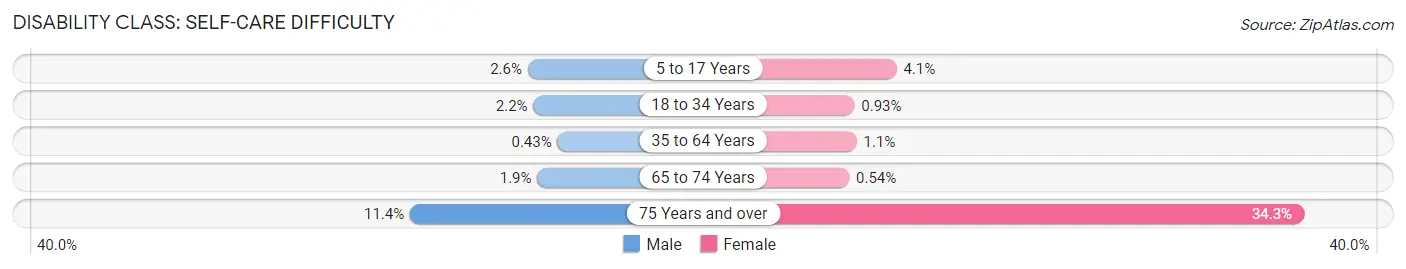
| Age Bracket | Male | Female |
| 5 to 17 Years | 109 (2.6%) | 155 (4.1%) |
| 18 to 34 Years | 116 (2.2%) | 44 (0.9%) |
| 35 to 64 Years | 37 (0.4%) | 90 (1.1%) |
| 65 to 74 Years | 26 (1.9%) | 8 (0.5%) |
| 75 Years and over | 66 (11.4%) | 398 (34.3%) |
Technology Access in Manassas
Computing Device Access in Manassas
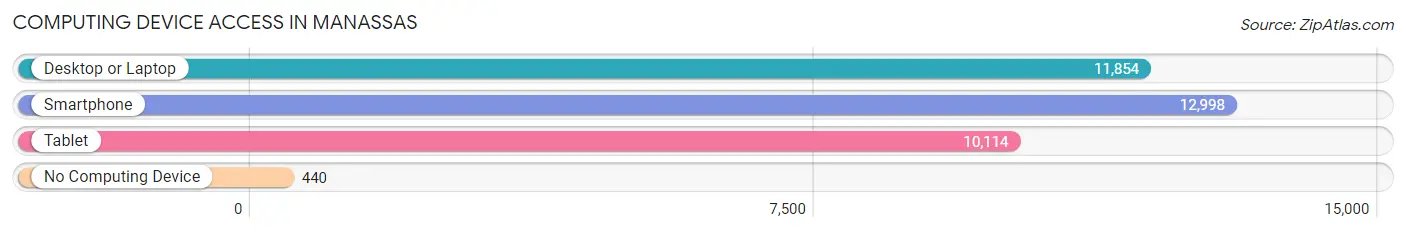
| Device Type | # Households | % Households |
| Desktop or Laptop | 11,854 | 85.7% |
| Smartphone | 12,998 | 93.9% |
| Tablet | 10,114 | 73.1% |
| No Computing Device | 440 | 3.2% |
| Total | 13,840 | 100.0% |
Internet Access in Manassas
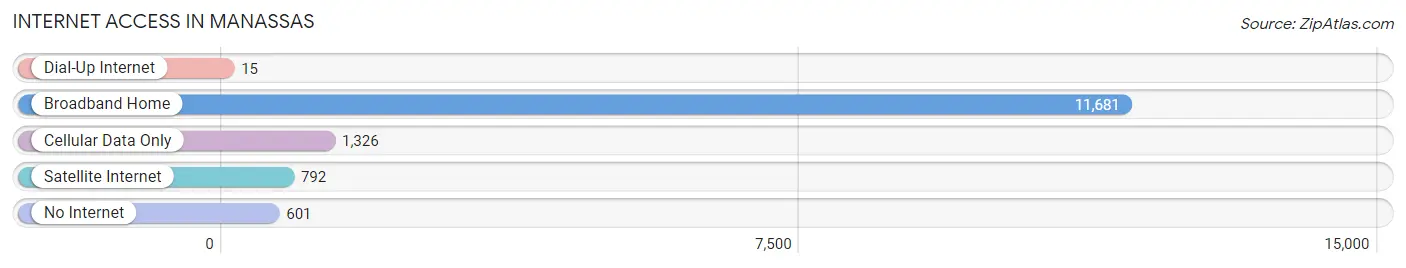
| Internet Type | # Households | % Households |
| Dial-Up Internet | 15 | 0.1% |
| Broadband Home | 11,681 | 84.4% |
| Cellular Data Only | 1,326 | 9.6% |
| Satellite Internet | 792 | 5.7% |
| No Internet | 601 | 4.3% |
| Total | 13,840 | 100.0% |
Manassas Summary
Manassas, Virginia is a city located in Prince William County, Virginia, about 25 miles southwest of Washington, D.C. It is part of the Washington metropolitan area and is the county seat of Prince William County. The city is known for its rich history, which dates back to the Civil War, and its proximity to the nation’s capital.
History
Manassas was first settled in 1798 by a group of settlers from Maryland. The town was named after the nearby Manassas Gap, which was named after a Native American chief. The town was incorporated in 1873 and was the site of two major Civil War battles, the First Battle of Manassas in 1861 and the Second Battle of Manassas in 1862. The town was also the site of the Battle of Bull Run in 1861. After the Civil War, Manassas became a major railroad hub and was home to several major industries, including a brickyard, a cannery, and a flour mill.
Geography
Manassas is located in the northern part of Prince William County, Virginia, about 25 miles southwest of Washington, D.C. The city is situated in the Piedmont region of Virginia, and is surrounded by rolling hills and forests. The city is located at the intersection of two major highways, Interstate 66 and U.S. Route 29. The city is also located near the Occoquan and Bull Run rivers.
Economy
Manassas is a major economic center in the Washington metropolitan area. The city is home to several major employers, including the Manassas City Public Schools, the Prince William County Government, and the Manassas Regional Airport. The city is also home to several major retail and commercial centers, including the Manassas Mall and the Manassas Town Center.
Demographics
As of the 2010 census, Manassas had a population of 37,821. The racial makeup of the city was 68.3% White, 17.3% African American, 0.4% Native American, 5.2% Asian, and 8.8% from other races. The median household income was $71,945, and the median family income was $83,945. The city’s population is well-educated, with over 40% of the population having a bachelor’s degree or higher.
Manassas is a vibrant and diverse city with a rich history and a bright future. The city is home to a variety of businesses, industries, and cultural attractions, and is a great place to live, work, and play.
Common Questions
What is Per Capita Income in Manassas?
Per Capita income in Manassas is $42,958.
What is the Median Family Income in Manassas?
Median Family Income in Manassas is $123,147.
What is the Median Household income in Manassas?
Median Household Income in Manassas is $110,559.
What is Income or Wage Gap in Manassas?
Income or Wage Gap in Manassas is 37.7%.
Women in Manassas earn 62.3 cents for every dollar earned by a man.
What is Family Income Deficit in Manassas?
Family Income Deficit in Manassas is $13,489.
Families that are below poverty line in Manassas earn $13,489 less on average than the poverty threshold level.
What is Inequality or Gini Index in Manassas?
Inequality or Gini Index in Manassas is 0.38.
What is the Total Population of Manassas?
Total Population of Manassas is 42,620.
What is the Total Male Population of Manassas?
Total Male Population of Manassas is 21,632.
What is the Total Female Population of Manassas?
Total Female Population of Manassas is 20,988.
What is the Ratio of Males per 100 Females in Manassas?
There are 103.07 Males per 100 Females in Manassas.
What is the Ratio of Females per 100 Males in Manassas?
There are 97.02 Females per 100 Males in Manassas.
What is the Median Population Age in Manassas?
Median Population Age in Manassas is 35.1 Years.
What is the Average Family Size in Manassas
Average Family Size in Manassas is 3.7 People.
What is the Average Household Size in Manassas
Average Household Size in Manassas is 3.1 People.
How Large is the Labor Force in Manassas?
There are 23,772 People in the Labor Forcein in Manassas.
What is the Percentage of People in the Labor Force in Manassas?
72.7% of People are in the Labor Force in Manassas.
What is the Unemployment Rate in Manassas?
Unemployment Rate in Manassas is 3.3%.