Summerfield, MD Map & Demographics
Summerfield Map
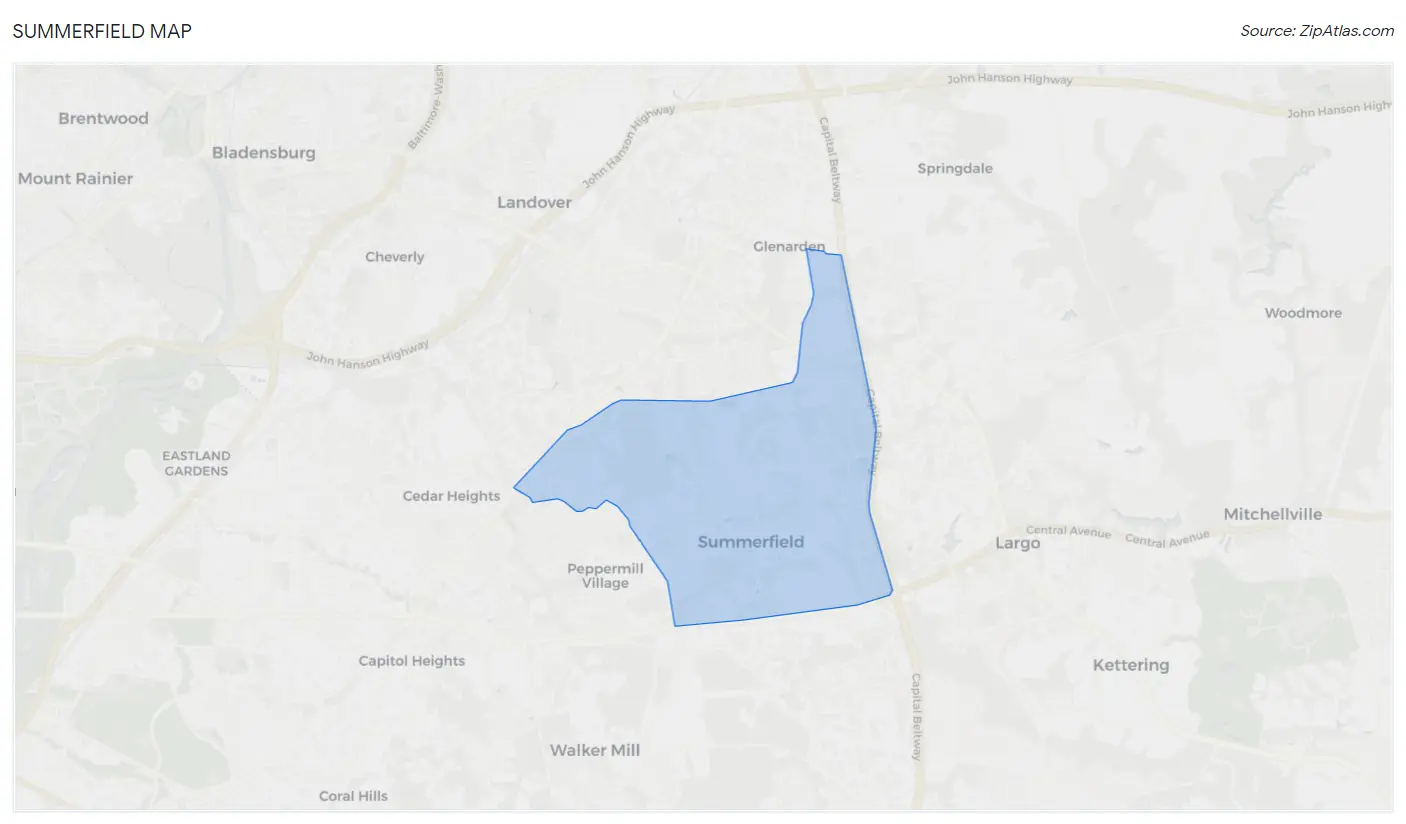
Summerfield Overview
$39,397
PER CAPITA INCOME
$98,729
AVG FAMILY INCOME
$90,904
AVG HOUSEHOLD INCOME
18.9%
WAGE / INCOME GAP [ % ]
81.1¢/ $1
WAGE / INCOME GAP [ $ ]
0.37
INEQUALITY / GINI INDEX
15,940
TOTAL POPULATION
7,038
MALE POPULATION
8,902
FEMALE POPULATION
79.06
MALES / 100 FEMALES
126.48
FEMALES / 100 MALES
37.2
MEDIAN AGE
3.5
AVG FAMILY SIZE
2.7
AVG HOUSEHOLD SIZE
9,252
LABOR FORCE [ PEOPLE ]
74.3%
PERCENT IN LABOR FORCE
6.6%
UNEMPLOYMENT RATE
Income in Summerfield
Income Overview in Summerfield
Per Capita Income in Summerfield is $39,397, while median incomes of families and households are $98,729 and $90,904 respectively.
| Characteristic | Number | Measure |
| Per Capita Income | 15,940 | $39,397 |
| Median Family Income | 3,684 | $98,729 |
| Mean Family Income | 3,684 | $111,655 |
| Median Household Income | 5,985 | $90,904 |
| Mean Household Income | 5,985 | $100,282 |
| Income Deficit | 3,684 | $0 |
| Wage / Income Gap (%) | 15,940 | 18.86% |
| Wage / Income Gap ($) | 15,940 | 81.14¢ per $1 |
| Gini / Inequality Index | 15,940 | 0.37 |
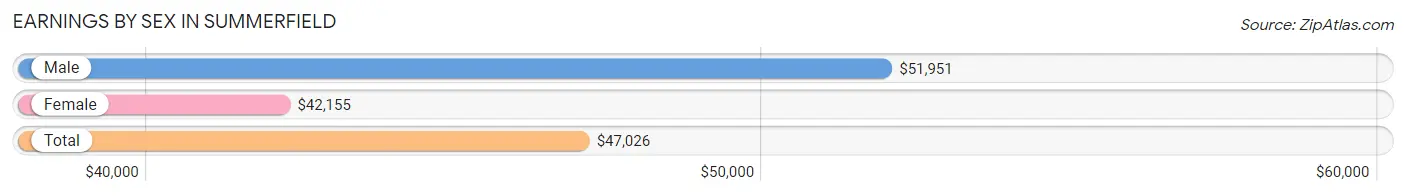
Earnings by Sex in Summerfield
Average Earnings in Summerfield are $47,026, $51,951 for men and $42,155 for women, a difference of 18.9%.
| Sex | Number | Average Earnings |
| Male | 3,941 (42.5%) | $51,951 |
| Female | 5,335 (57.5%) | $42,155 |
| Total | 9,276 (100.0%) | $47,026 |
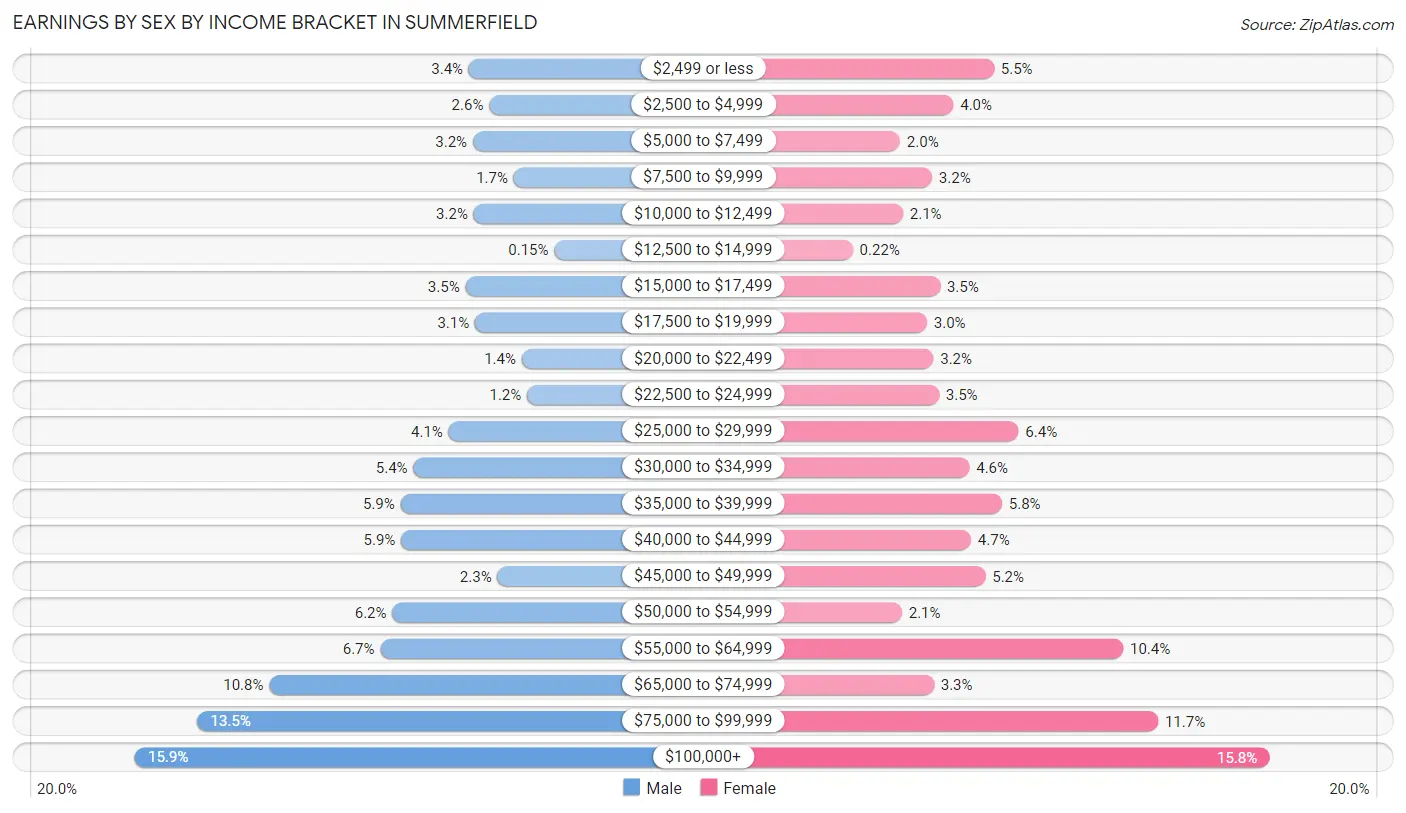
Earnings by Sex by Income Bracket in Summerfield
The most common earnings brackets in Summerfield are $100,000+ for men (625 | 15.9%) and $100,000+ for women (844 | 15.8%).
| Income | Male | Female |
| $2,499 or less | 132 (3.4%) | 294 (5.5%) |
| $2,500 to $4,999 | 102 (2.6%) | 213 (4.0%) |
| $5,000 to $7,499 | 126 (3.2%) | 106 (2.0%) |
| $7,500 to $9,999 | 66 (1.7%) | 170 (3.2%) |
| $10,000 to $12,499 | 125 (3.2%) | 112 (2.1%) |
| $12,500 to $14,999 | 6 (0.2%) | 12 (0.2%) |
| $15,000 to $17,499 | 137 (3.5%) | 186 (3.5%) |
| $17,500 to $19,999 | 123 (3.1%) | 160 (3.0%) |
| $20,000 to $22,499 | 54 (1.4%) | 173 (3.2%) |
| $22,500 to $24,999 | 46 (1.2%) | 184 (3.5%) |
| $25,000 to $29,999 | 162 (4.1%) | 343 (6.4%) |
| $30,000 to $34,999 | 214 (5.4%) | 245 (4.6%) |
| $35,000 to $39,999 | 233 (5.9%) | 310 (5.8%) |
| $40,000 to $44,999 | 232 (5.9%) | 248 (4.6%) |
| $45,000 to $49,999 | 90 (2.3%) | 277 (5.2%) |
| $50,000 to $54,999 | 245 (6.2%) | 110 (2.1%) |
| $55,000 to $64,999 | 263 (6.7%) | 552 (10.3%) |
| $65,000 to $74,999 | 427 (10.8%) | 174 (3.3%) |
| $75,000 to $99,999 | 533 (13.5%) | 622 (11.7%) |
| $100,000+ | 625 (15.9%) | 844 (15.8%) |
| Total | 3,941 (100.0%) | 5,335 (100.0%) |
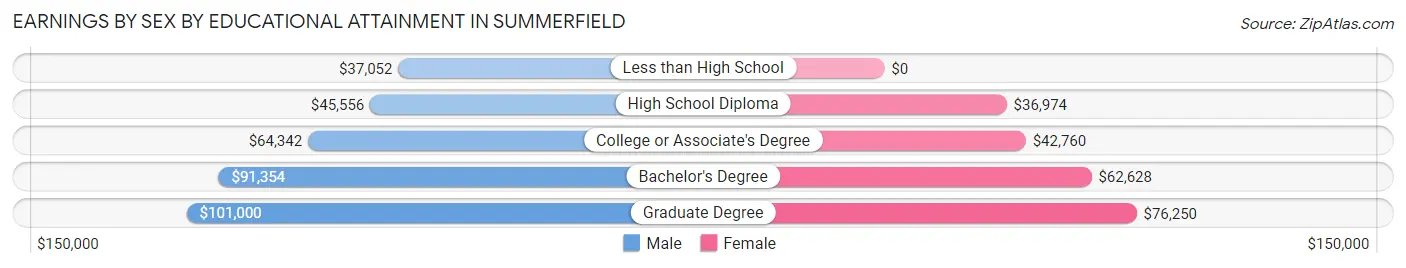
Earnings by Sex by Educational Attainment in Summerfield
Average earnings in Summerfield are $62,396 for men and $49,837 for women, a difference of 20.1%. Men with an educational attainment of graduate degree enjoy the highest average annual earnings of $101,000, while those with less than high school education earn the least with $37,052. Women with an educational attainment of graduate degree earn the most with the average annual earnings of $76,250, while those with high school diploma education have the smallest earnings of $36,974.
| Educational Attainment | Male Income | Female Income |
| Less than High School | $37,052 | $0 |
| High School Diploma | $45,556 | $36,974 |
| College or Associate's Degree | $64,342 | $42,760 |
| Bachelor's Degree | $91,354 | $62,628 |
| Graduate Degree | $101,000 | $76,250 |
| Total | $62,396 | $49,837 |
Family Income in Summerfield
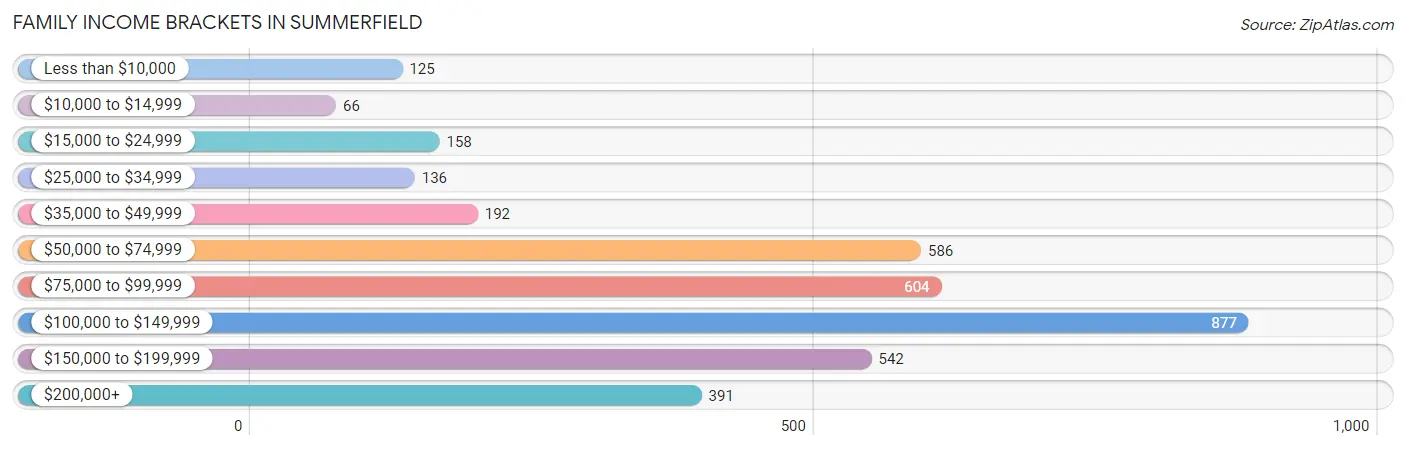
Family Income Brackets in Summerfield
According to the Summerfield family income data, there are 877 families falling into the $100,000 to $149,999 income range, which is the most common income bracket and makes up 23.8% of all families. Conversely, the $10,000 to $14,999 income bracket is the least frequent group with only 66 families (1.8%) belonging to this category.
| Income Bracket | # Families | % Families |
| Less than $10,000 | 125 | 3.4% |
| $10,000 to $14,999 | 66 | 1.8% |
| $15,000 to $24,999 | 158 | 4.3% |
| $25,000 to $34,999 | 136 | 3.7% |
| $35,000 to $49,999 | 192 | 5.2% |
| $50,000 to $74,999 | 586 | 15.9% |
| $75,000 to $99,999 | 604 | 16.4% |
| $100,000 to $149,999 | 877 | 23.8% |
| $150,000 to $199,999 | 542 | 14.7% |
| $200,000+ | 391 | 10.6% |
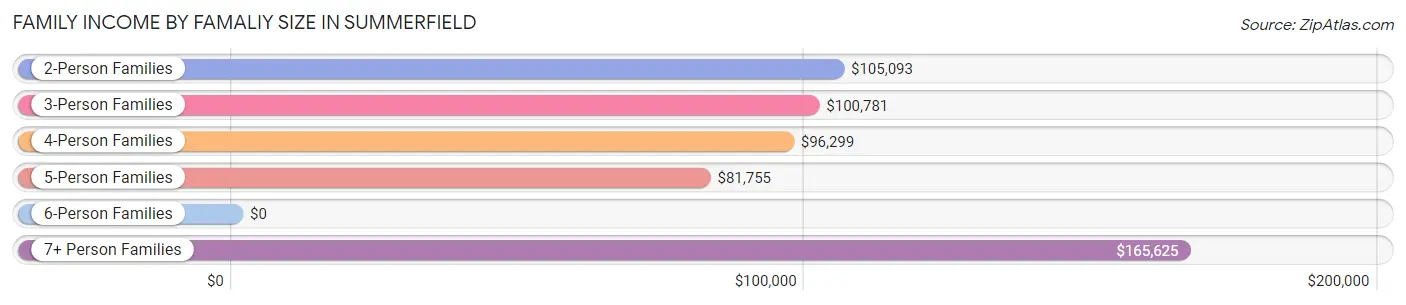
Family Income by Famaliy Size in Summerfield
7+ person families (53 | 1.4%) account for the highest median family income in Summerfield with $165,625 per family, while 2-person families (1,276 | 34.6%) have the highest median income of $52,546 per family member.
| Income Bracket | # Families | Median Income |
| 2-Person Families | 1,276 (34.6%) | $105,093 |
| 3-Person Families | 1,064 (28.9%) | $100,781 |
| 4-Person Families | 719 (19.5%) | $96,299 |
| 5-Person Families | 451 (12.2%) | $81,755 |
| 6-Person Families | 121 (3.3%) | $0 |
| 7+ Person Families | 53 (1.4%) | $165,625 |
| Total | 3,684 (100.0%) | $98,729 |
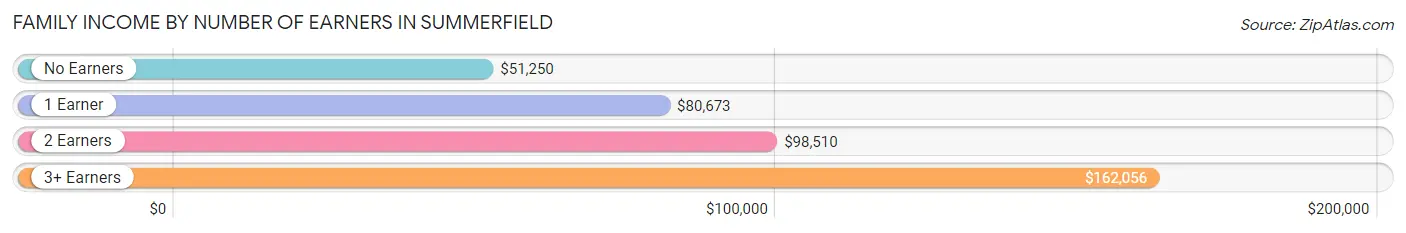
Family Income by Number of Earners in Summerfield
The median family income in Summerfield is $98,729, with families comprising 3+ earners (807) having the highest median family income of $162,056, while families with no earners (234) have the lowest median family income of $51,250, accounting for 21.9% and 6.4% of families, respectively.
| Number of Earners | # Families | Median Income |
| No Earners | 234 (6.4%) | $51,250 |
| 1 Earner | 1,388 (37.7%) | $80,673 |
| 2 Earners | 1,255 (34.1%) | $98,510 |
| 3+ Earners | 807 (21.9%) | $162,056 |
| Total | 3,684 (100.0%) | $98,729 |
Household Income in Summerfield
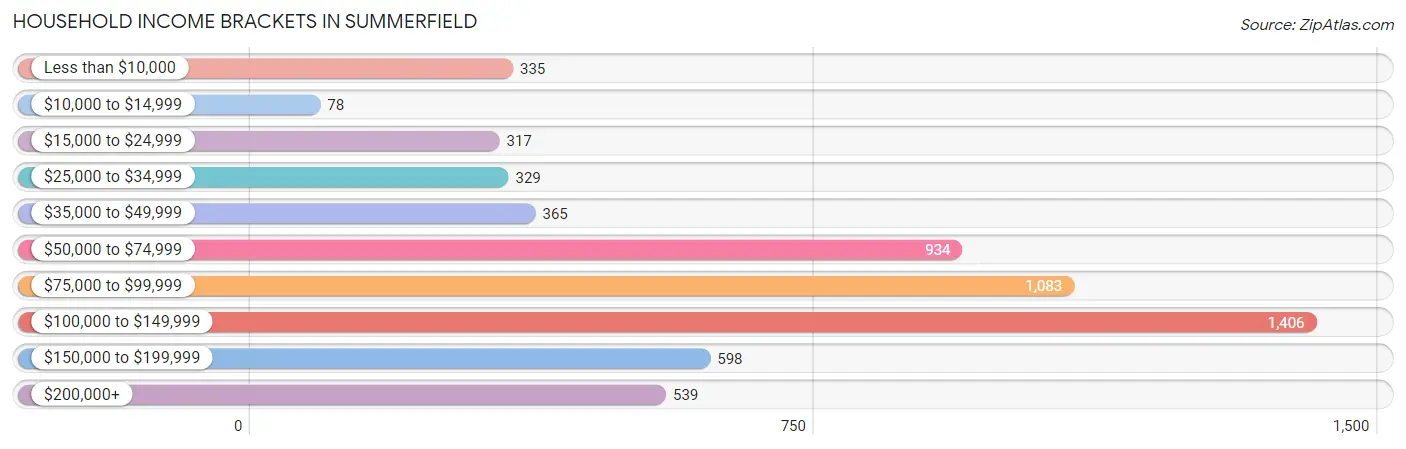
Household Income Brackets in Summerfield
With 1,406 households falling in the category, the $100,000 to $149,999 income range is the most frequent in Summerfield, accounting for 23.5% of all households. In contrast, only 78 households (1.3%) fall into the $10,000 to $14,999 income bracket, making it the least populous group.
| Income Bracket | # Households | % Households |
| Less than $10,000 | 335 | 5.6% |
| $10,000 to $14,999 | 78 | 1.3% |
| $15,000 to $24,999 | 317 | 5.3% |
| $25,000 to $34,999 | 329 | 5.5% |
| $35,000 to $49,999 | 365 | 6.1% |
| $50,000 to $74,999 | 934 | 15.6% |
| $75,000 to $99,999 | 1,083 | 18.1% |
| $100,000 to $149,999 | 1,406 | 23.5% |
| $150,000 to $199,999 | 598 | 10.0% |
| $200,000+ | 539 | 9.0% |
Household Income by Householder Age in Summerfield
The median household income in Summerfield is $90,904, with the highest median household income of $97,566 found in the 25 to 44 years age bracket for the primary householder. A total of 2,592 households (43.3%) fall into this category. Meanwhile, the 65+ years age bracket for the primary householder has the lowest median household income of $68,145, with 1,170 households (19.6%) in this group.
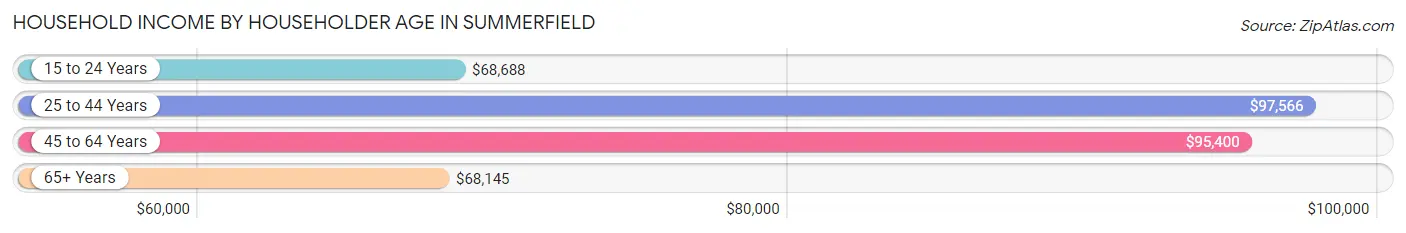
| Income Bracket | # Households | Median Income |
| 15 to 24 Years | 73 (1.2%) | $68,688 |
| 25 to 44 Years | 2,592 (43.3%) | $97,566 |
| 45 to 64 Years | 2,150 (35.9%) | $95,400 |
| 65+ Years | 1,170 (19.6%) | $68,145 |
| Total | 5,985 (100.0%) | $90,904 |
Poverty in Summerfield
Income Below Poverty by Sex and Age in Summerfield
With 8.7% poverty level for males and 13.4% for females among the residents of Summerfield, 15 year old males and 5 year old females are the most vulnerable to poverty, with 29 males (53.7%) and 68 females (54.8%) in their respective age groups living below the poverty level.
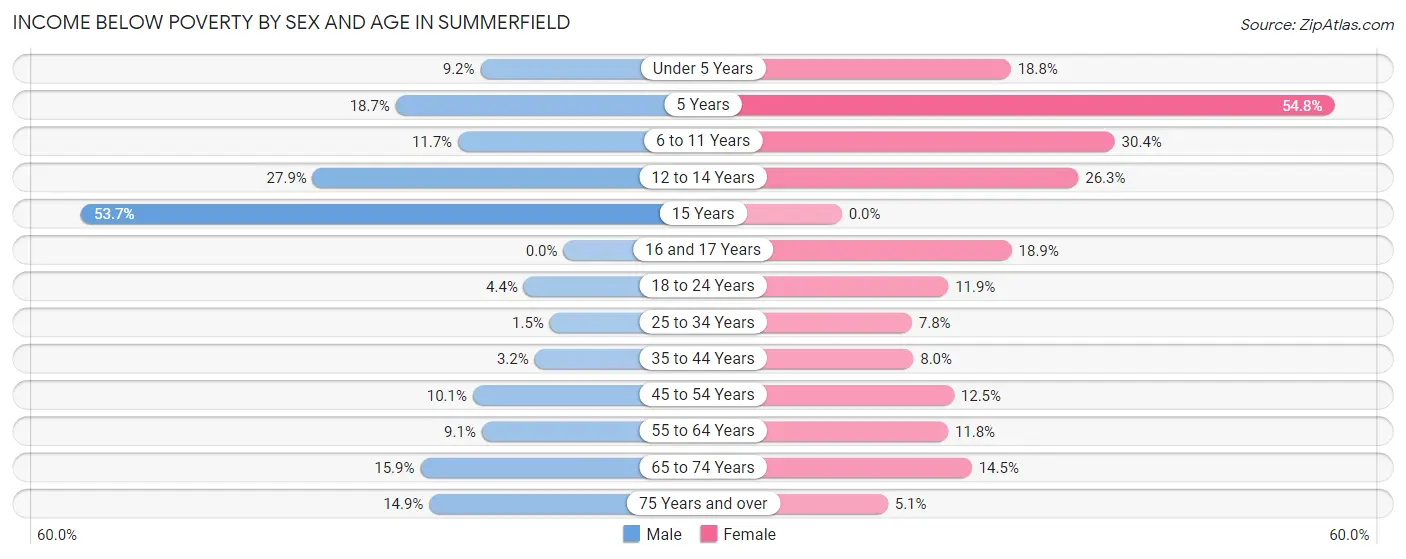
| Age Bracket | Male | Female |
| Under 5 Years | 29 (9.2%) | 117 (18.8%) |
| 5 Years | 14 (18.7%) | 68 (54.8%) |
| 6 to 11 Years | 126 (11.7%) | 203 (30.4%) |
| 12 to 14 Years | 67 (27.9%) | 54 (26.3%) |
| 15 Years | 29 (53.7%) | 0 (0.0%) |
| 16 and 17 Years | 0 (0.0%) | 45 (18.9%) |
| 18 to 24 Years | 30 (4.4%) | 93 (11.8%) |
| 25 to 34 Years | 16 (1.5%) | 92 (7.8%) |
| 35 to 44 Years | 36 (3.2%) | 145 (8.0%) |
| 45 to 54 Years | 84 (10.1%) | 129 (12.5%) |
| 55 to 64 Years | 62 (9.1%) | 109 (11.8%) |
| 65 to 74 Years | 86 (15.9%) | 110 (14.5%) |
| 75 Years and over | 36 (14.9%) | 22 (5.1%) |
| Total | 615 (8.7%) | 1,187 (13.4%) |
Income Above Poverty by Sex and Age in Summerfield
According to the poverty statistics in Summerfield, males aged 16 and 17 years and females aged 15 years are the age groups that are most secure financially, with 100.0% of males and 100.0% of females in these age groups living above the poverty line.
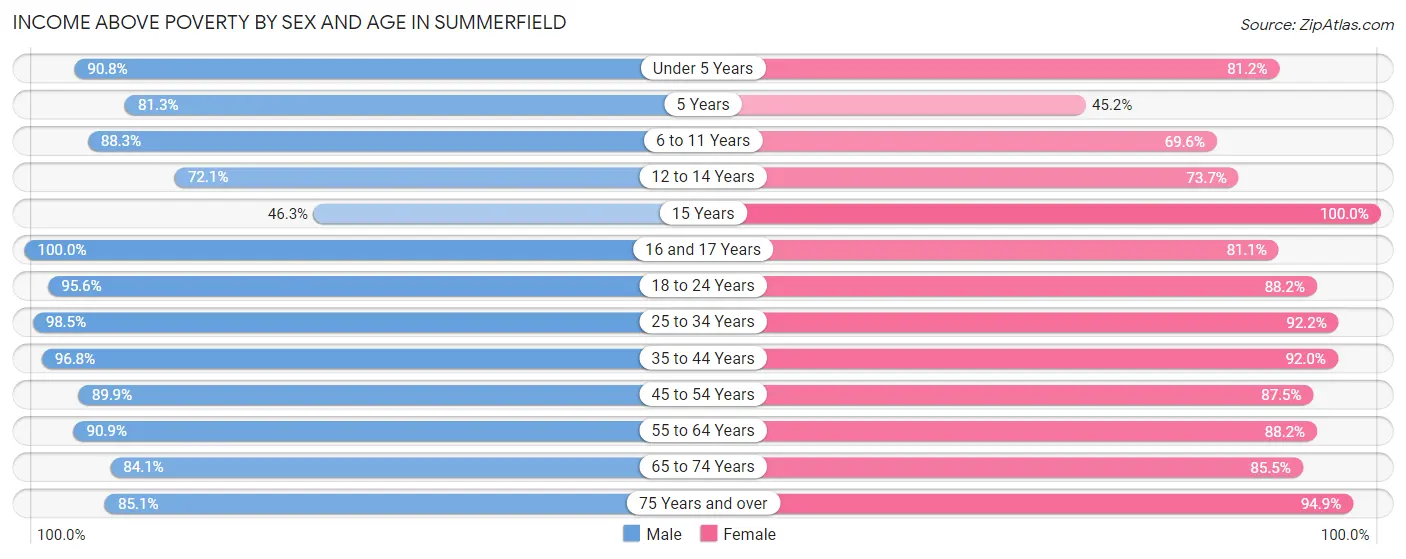
| Age Bracket | Male | Female |
| Under 5 Years | 285 (90.8%) | 505 (81.2%) |
| 5 Years | 61 (81.3%) | 56 (45.2%) |
| 6 to 11 Years | 947 (88.3%) | 465 (69.6%) |
| 12 to 14 Years | 173 (72.1%) | 151 (73.7%) |
| 15 Years | 25 (46.3%) | 59 (100.0%) |
| 16 and 17 Years | 133 (100.0%) | 193 (81.1%) |
| 18 to 24 Years | 651 (95.6%) | 692 (88.1%) |
| 25 to 34 Years | 1,034 (98.5%) | 1,088 (92.2%) |
| 35 to 44 Years | 1,085 (96.8%) | 1,676 (92.0%) |
| 45 to 54 Years | 749 (89.9%) | 905 (87.5%) |
| 55 to 64 Years | 620 (90.9%) | 813 (88.2%) |
| 65 to 74 Years | 454 (84.1%) | 650 (85.5%) |
| 75 Years and over | 205 (85.1%) | 408 (94.9%) |
| Total | 6,422 (91.3%) | 7,661 (86.6%) |
Income Below Poverty Among Married-Couple Families in Summerfield
The poverty statistics for married-couple families in Summerfield show that 7.2% or 108 of the total 1,504 families live below the poverty line. Families with 3 or 4 children have the highest poverty rate of 51.0%, comprising of 78 families. On the other hand, families with no children have the lowest poverty rate of 1.9%, which includes 14 families.
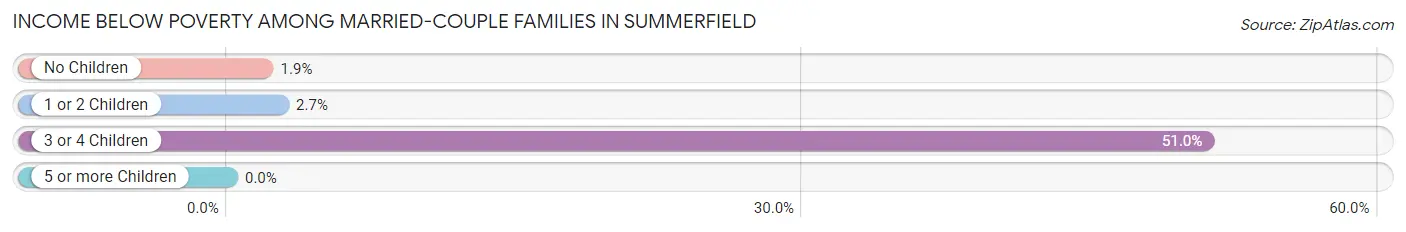
| Children | Above Poverty | Below Poverty |
| No Children | 738 (98.1%) | 14 (1.9%) |
| 1 or 2 Children | 583 (97.3%) | 16 (2.7%) |
| 3 or 4 Children | 75 (49.0%) | 78 (51.0%) |
| 5 or more Children | 0 (0.0%) | 0 (0.0%) |
| Total | 1,396 (92.8%) | 108 (7.2%) |
Income Below Poverty Among Single-Parent Households in Summerfield
According to the poverty data in Summerfield, 7.6% or 33 single-father households and 13.4% or 234 single-mother households are living below the poverty line. Among single-father households, those with 1 or 2 children have the highest poverty rate, with 33 households (17.3%) experiencing poverty. Likewise, among single-mother households, those with 3 or 4 children have the highest poverty rate, with 55 households (29.3%) falling below the poverty line.
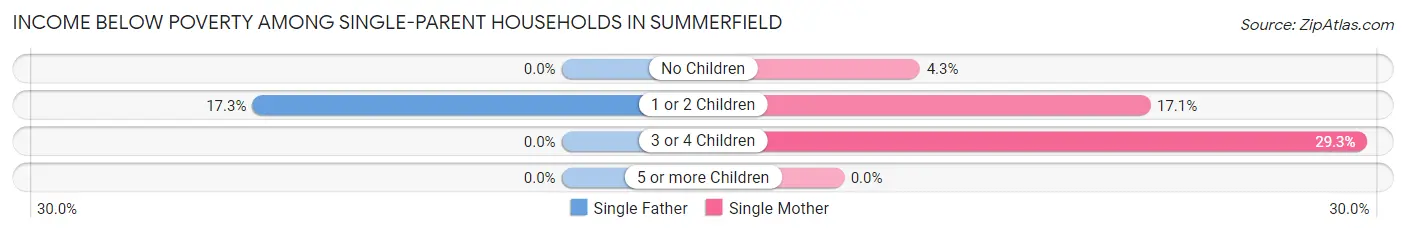
| Children | Single Father | Single Mother |
| No Children | 0 (0.0%) | 29 (4.3%) |
| 1 or 2 Children | 33 (17.3%) | 150 (17.1%) |
| 3 or 4 Children | 0 (0.0%) | 55 (29.3%) |
| 5 or more Children | 0 (0.0%) | 0 (0.0%) |
| Total | 33 (7.6%) | 234 (13.4%) |
Income Below Poverty Among Married-Couple vs Single-Parent Households in Summerfield
The poverty data for Summerfield shows that 108 of the married-couple family households (7.2%) and 267 of the single-parent households (12.2%) are living below the poverty level. Within the married-couple family households, those with 3 or 4 children have the highest poverty rate, with 78 households (51.0%) falling below the poverty line. Among the single-parent households, those with 3 or 4 children have the highest poverty rate, with 55 household (29.3%) living below poverty.
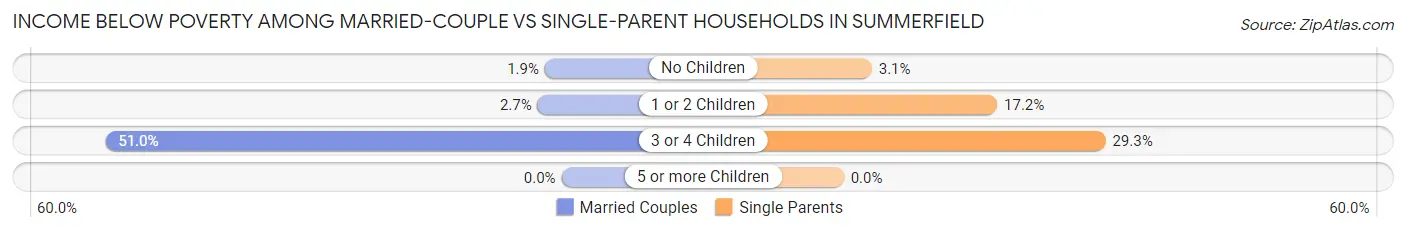
| Children | Married-Couple Families | Single-Parent Households |
| No Children | 14 (1.9%) | 29 (3.1%) |
| 1 or 2 Children | 16 (2.7%) | 183 (17.2%) |
| 3 or 4 Children | 78 (51.0%) | 55 (29.3%) |
| 5 or more Children | 0 (0.0%) | 0 (0.0%) |
| Total | 108 (7.2%) | 267 (12.2%) |
Race in Summerfield
The most populous races in Summerfield are Black / African American (14,070 | 88.3%), Hispanic or Latino (1,525 | 9.6%), and Some other Race (637 | 4.0%).
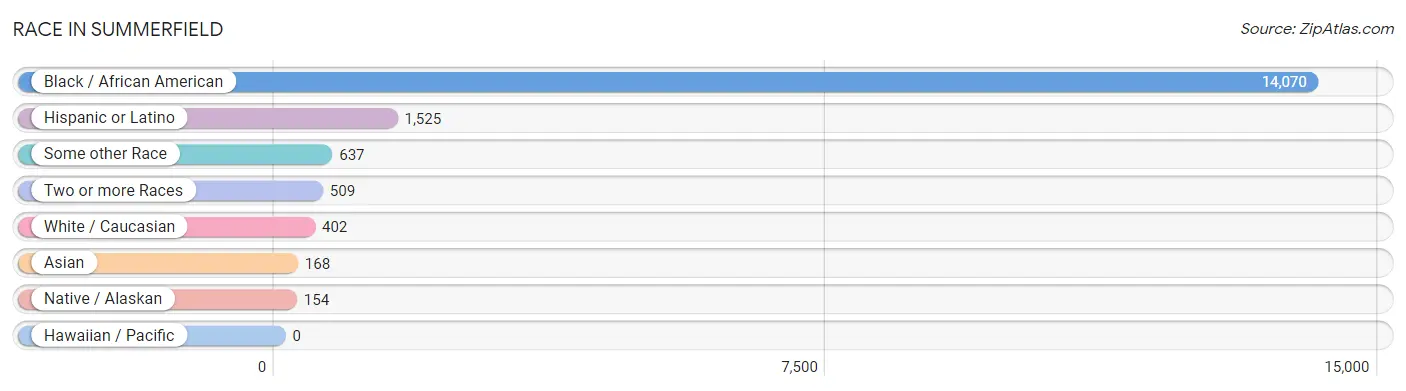
| Race | # Population | % Population |
| Asian | 168 | 1.1% |
| Black / African American | 14,070 | 88.3% |
| Hawaiian / Pacific | 0 | 0.0% |
| Hispanic or Latino | 1,525 | 9.6% |
| Native / Alaskan | 154 | 1.0% |
| White / Caucasian | 402 | 2.5% |
| Two or more Races | 509 | 3.2% |
| Some other Race | 637 | 4.0% |
| Total | 15,940 | 100.0% |
Ancestry in Summerfield
The most populous ancestries reported in Summerfield are Subsaharan African (2,290 | 14.4%), Nigerian (1,054 | 6.6%), African (795 | 5.0%), Central American (752 | 4.7%), and Haitian (613 | 3.8%), together accounting for 34.5% of all Summerfield residents.
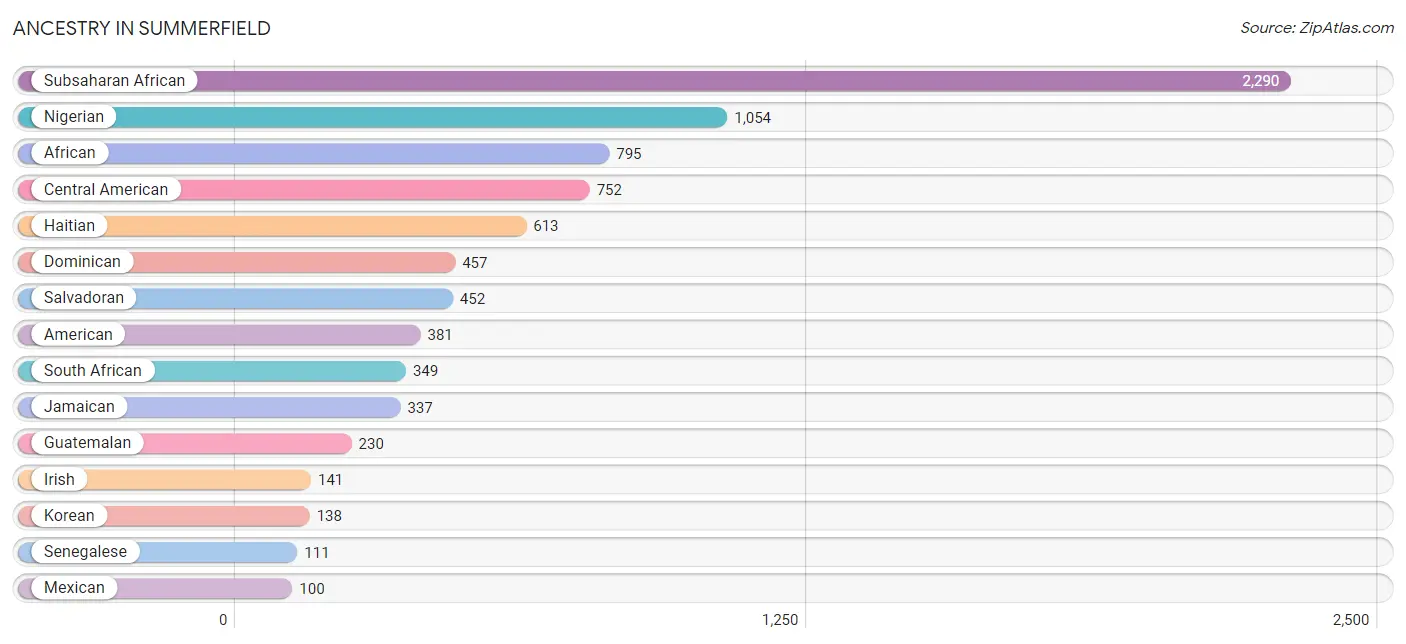
| Ancestry | # Population | % Population |
| African | 795 | 5.0% |
| American | 381 | 2.4% |
| Bhutanese | 27 | 0.2% |
| British | 59 | 0.4% |
| Central American | 752 | 4.7% |
| Cherokee | 82 | 0.5% |
| Cuban | 1 | 0.0% |
| Czech | 21 | 0.1% |
| Dominican | 457 | 2.9% |
| English | 76 | 0.5% |
| Ethiopian | 11 | 0.1% |
| European | 20 | 0.1% |
| French Canadian | 12 | 0.1% |
| German | 32 | 0.2% |
| Ghanaian | 83 | 0.5% |
| Greek | 9 | 0.1% |
| Guatemalan | 230 | 1.4% |
| Haitian | 613 | 3.8% |
| Honduran | 50 | 0.3% |
| Indian (Asian) | 16 | 0.1% |
| Irish | 141 | 0.9% |
| Italian | 11 | 0.1% |
| Jamaican | 337 | 2.1% |
| Kenyan | 55 | 0.4% |
| Korean | 138 | 0.9% |
| Mexican | 100 | 0.6% |
| Nigerian | 1,054 | 6.6% |
| Panamanian | 20 | 0.1% |
| Polish | 63 | 0.4% |
| Puerto Rican | 49 | 0.3% |
| Russian | 9 | 0.1% |
| Salvadoran | 452 | 2.8% |
| Scotch-Irish | 14 | 0.1% |
| Scottish | 44 | 0.3% |
| Senegalese | 111 | 0.7% |
| Sierra Leonean | 39 | 0.2% |
| South African | 349 | 2.2% |
| South American | 28 | 0.2% |
| Sri Lankan | 26 | 0.2% |
| Subsaharan African | 2,290 | 14.4% |
| Thai | 24 | 0.2% |
| Trinidadian and Tobagonian | 53 | 0.3% |
| Turkish | 16 | 0.1% |
| Venezuelan | 28 | 0.2% |
| West Indian | 11 | 0.1% | View All 45 Rows |
Immigrants in Summerfield
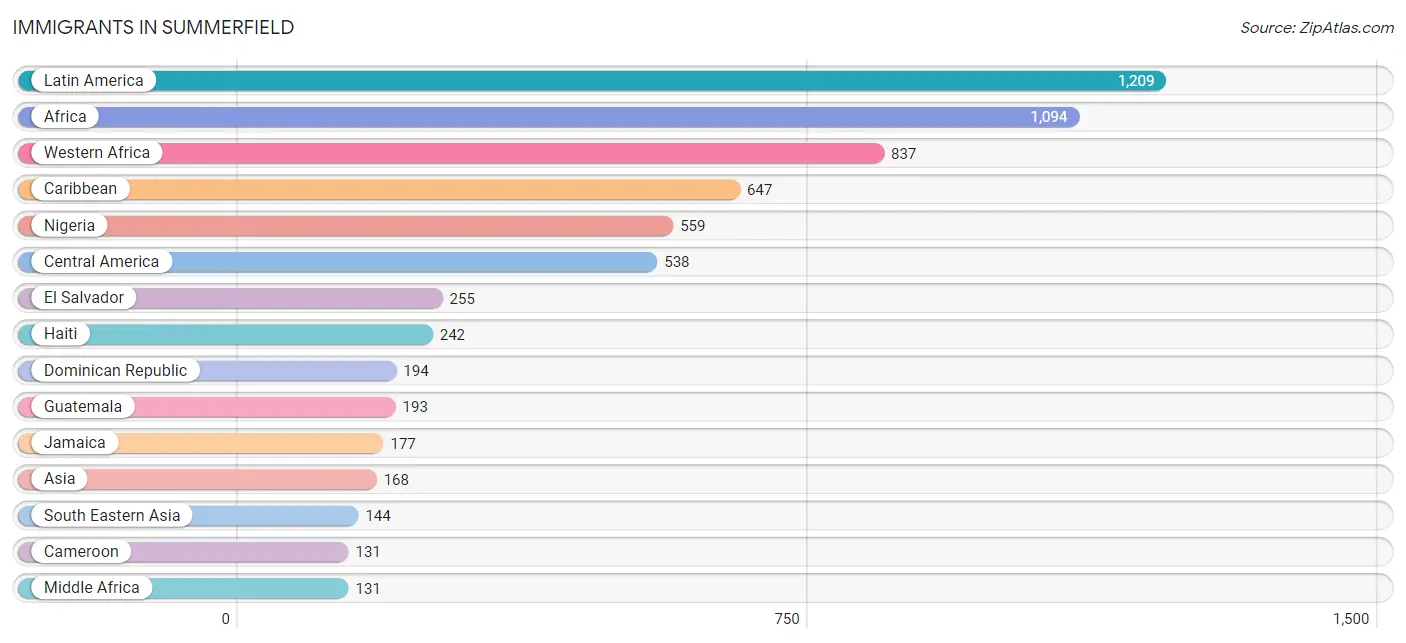
The most numerous immigrant groups reported in Summerfield came from Latin America (1,209 | 7.6%), Africa (1,094 | 6.9%), Western Africa (837 | 5.2%), Caribbean (647 | 4.1%), and Nigeria (559 | 3.5%), together accounting for 27.3% of all Summerfield residents.
| Immigration Origin | # Population | % Population |
| Africa | 1,094 | 6.9% |
| Asia | 168 | 1.1% |
| Cameroon | 131 | 0.8% |
| Caribbean | 647 | 4.1% |
| Central America | 538 | 3.4% |
| Czechoslovakia | 8 | 0.1% |
| Dominican Republic | 194 | 1.2% |
| Eastern Africa | 55 | 0.4% |
| Eastern Europe | 17 | 0.1% |
| El Salvador | 255 | 1.6% |
| Europe | 28 | 0.2% |
| Germany | 11 | 0.1% |
| Ghana | 88 | 0.5% |
| Guatemala | 193 | 1.2% |
| Guyana | 24 | 0.2% |
| Haiti | 242 | 1.5% |
| India | 24 | 0.2% |
| Jamaica | 177 | 1.1% |
| Kenya | 55 | 0.4% |
| Latin America | 1,209 | 7.6% |
| Mexico | 70 | 0.4% |
| Middle Africa | 131 | 0.8% |
| Nigeria | 559 | 3.5% |
| Panama | 20 | 0.1% |
| Philippines | 118 | 0.7% |
| Senegal | 111 | 0.7% |
| Sierra Leone | 46 | 0.3% |
| South Africa | 71 | 0.4% |
| South America | 24 | 0.2% |
| South Central Asia | 24 | 0.2% |
| South Eastern Asia | 144 | 0.9% |
| Trinidad and Tobago | 34 | 0.2% |
| Ukraine | 9 | 0.1% |
| Vietnam | 26 | 0.2% |
| Western Africa | 837 | 5.2% |
| Western Europe | 11 | 0.1% | View All 36 Rows |
Sex and Age in Summerfield
Sex and Age in Summerfield
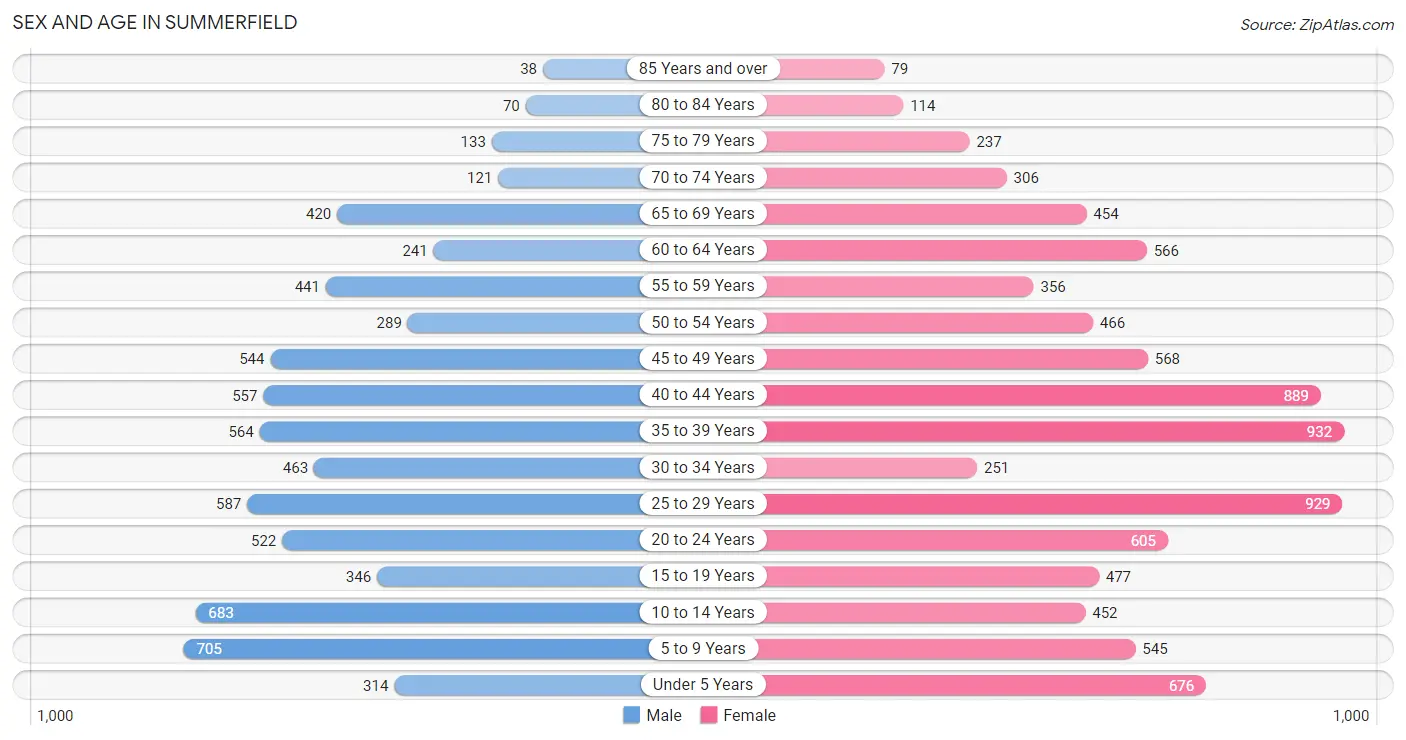
The most populous age groups in Summerfield are 5 to 9 Years (705 | 10.0%) for men and 35 to 39 Years (932 | 10.5%) for women.
| Age Bracket | Male | Female |
| Under 5 Years | 314 (4.5%) | 676 (7.6%) |
| 5 to 9 Years | 705 (10.0%) | 545 (6.1%) |
| 10 to 14 Years | 683 (9.7%) | 452 (5.1%) |
| 15 to 19 Years | 346 (4.9%) | 477 (5.4%) |
| 20 to 24 Years | 522 (7.4%) | 605 (6.8%) |
| 25 to 29 Years | 587 (8.3%) | 929 (10.4%) |
| 30 to 34 Years | 463 (6.6%) | 251 (2.8%) |
| 35 to 39 Years | 564 (8.0%) | 932 (10.5%) |
| 40 to 44 Years | 557 (7.9%) | 889 (10.0%) |
| 45 to 49 Years | 544 (7.7%) | 568 (6.4%) |
| 50 to 54 Years | 289 (4.1%) | 466 (5.2%) |
| 55 to 59 Years | 441 (6.3%) | 356 (4.0%) |
| 60 to 64 Years | 241 (3.4%) | 566 (6.4%) |
| 65 to 69 Years | 420 (6.0%) | 454 (5.1%) |
| 70 to 74 Years | 121 (1.7%) | 306 (3.4%) |
| 75 to 79 Years | 133 (1.9%) | 237 (2.7%) |
| 80 to 84 Years | 70 (1.0%) | 114 (1.3%) |
| 85 Years and over | 38 (0.5%) | 79 (0.9%) |
| Total | 7,038 (100.0%) | 8,902 (100.0%) |
Families and Households in Summerfield
Median Family Size in Summerfield
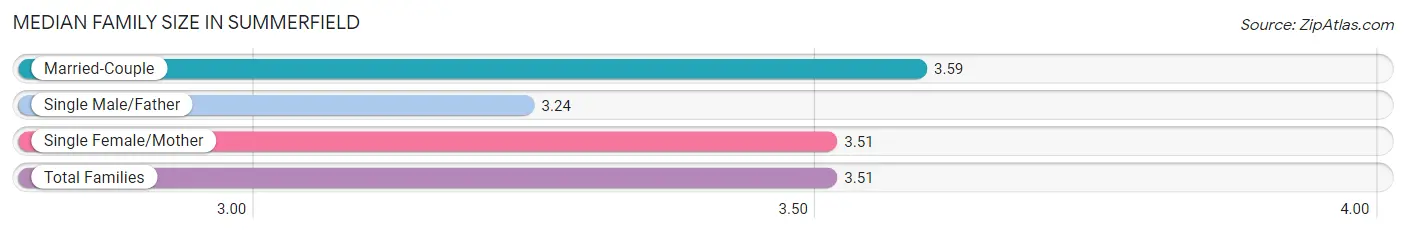
The median family size in Summerfield is 3.51 persons per family, with married-couple families (1,504 | 40.8%) accounting for the largest median family size of 3.59 persons per family. On the other hand, single male/father families (434 | 11.8%) represent the smallest median family size with 3.24 persons per family.
| Family Type | # Families | Family Size |
| Married-Couple | 1,504 (40.8%) | 3.59 |
| Single Male/Father | 434 (11.8%) | 3.24 |
| Single Female/Mother | 1,746 (47.4%) | 3.51 |
| Total Families | 3,684 (100.0%) | 3.51 |
Median Household Size in Summerfield
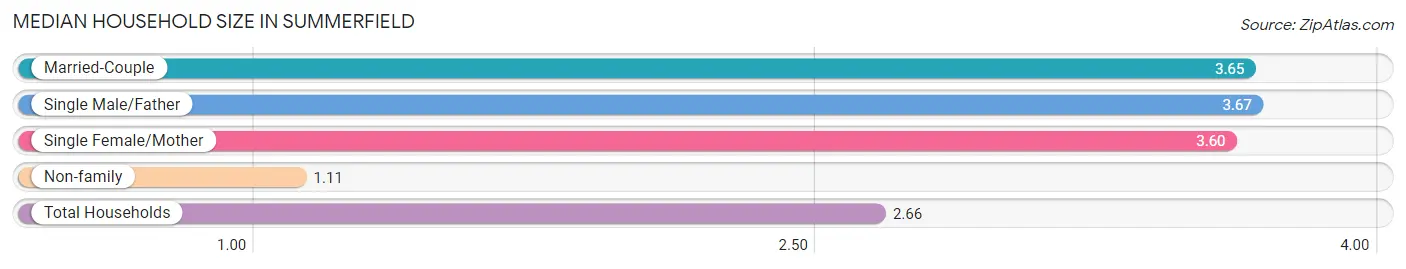
The median household size in Summerfield is 2.66 persons per household, with single male/father households (434 | 7.2%) accounting for the largest median household size of 3.67 persons per household. non-family households (2,301 | 38.5%) represent the smallest median household size with 1.11 persons per household.
| Household Type | # Households | Household Size |
| Married-Couple | 1,504 (25.1%) | 3.65 |
| Single Male/Father | 434 (7.2%) | 3.67 |
| Single Female/Mother | 1,746 (29.2%) | 3.60 |
| Non-family | 2,301 (38.5%) | 1.11 |
| Total Households | 5,985 (100.0%) | 2.66 |
Household Size by Marriage Status in Summerfield
Out of a total of 5,985 households in Summerfield, 3,684 (61.6%) are family households, while 2,301 (38.5%) are nonfamily households. The most numerous type of family households are 2-person households, comprising 1,239, and the most common type of nonfamily households are 1-person households, comprising 2,098.
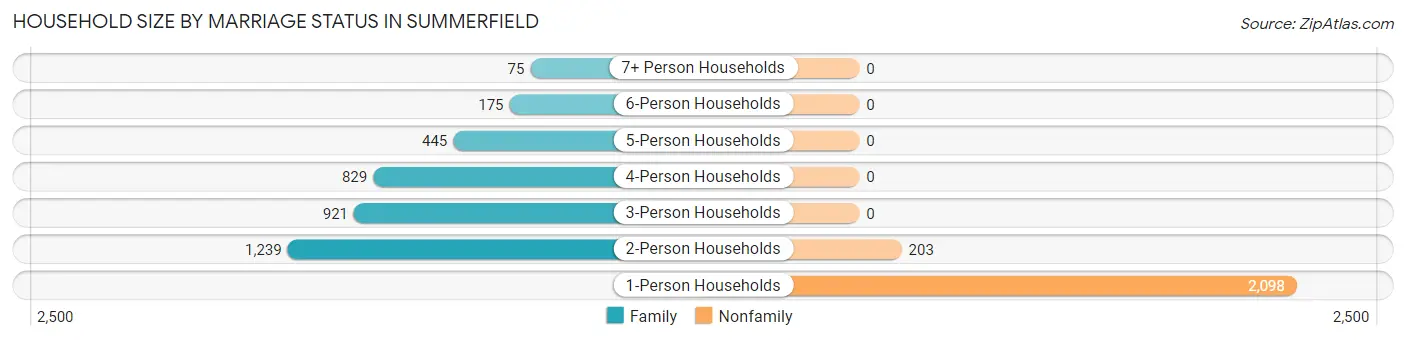
| Household Size | Family Households | Nonfamily Households |
| 1-Person Households | - | 2,098 (35.0%) |
| 2-Person Households | 1,239 (20.7%) | 203 (3.4%) |
| 3-Person Households | 921 (15.4%) | 0 (0.0%) |
| 4-Person Households | 829 (13.9%) | 0 (0.0%) |
| 5-Person Households | 445 (7.4%) | 0 (0.0%) |
| 6-Person Households | 175 (2.9%) | 0 (0.0%) |
| 7+ Person Households | 75 (1.3%) | 0 (0.0%) |
| Total | 3,684 (61.6%) | 2,301 (38.5%) |
Female Fertility in Summerfield
Fertility by Age in Summerfield
Average fertility rate in Summerfield is 52.0 births per 1,000 women. Women in the age bracket of 20 to 34 years have the highest fertility rate with 119.0 births per 1,000 women. Women in the age bracket of 20 to 34 years acount for 86.9% of all women with births.
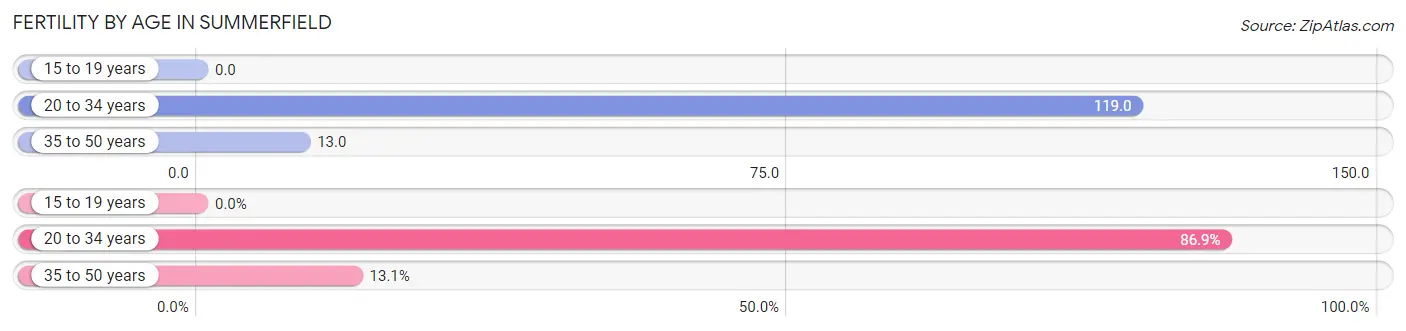
| Age Bracket | Women with Births | Births / 1,000 Women |
| 15 to 19 years | 0 (0.0%) | 0.0 |
| 20 to 34 years | 212 (86.9%) | 119.0 |
| 35 to 50 years | 32 (13.1%) | 13.0 |
| Total | 244 (100.0%) | 52.0 |
Fertility by Age by Marriage Status in Summerfield
42.2% of women with births (244) in Summerfield are married. The highest percentage of unmarried women with births falls into 20 to 34 years age bracket with 66.5% of them unmarried at the time of birth, while the lowest percentage of unmarried women with births belong to 35 to 50 years age bracket with 0.0% of them unmarried.
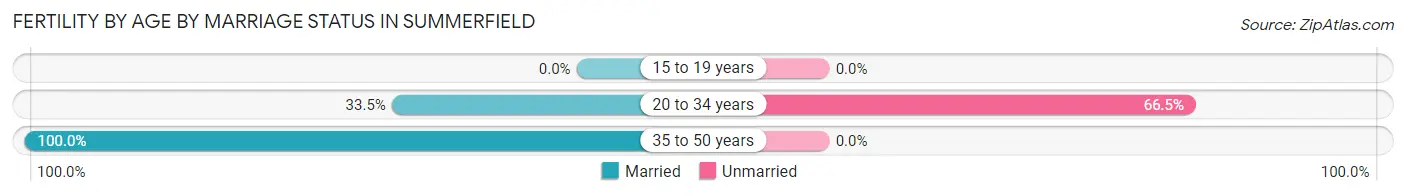
| Age Bracket | Married | Unmarried |
| 15 to 19 years | 0 (0.0%) | 0 (0.0%) |
| 20 to 34 years | 71 (33.5%) | 141 (66.5%) |
| 35 to 50 years | 32 (100.0%) | 0 (0.0%) |
| Total | 103 (42.2%) | 141 (57.8%) |
Fertility by Education in Summerfield
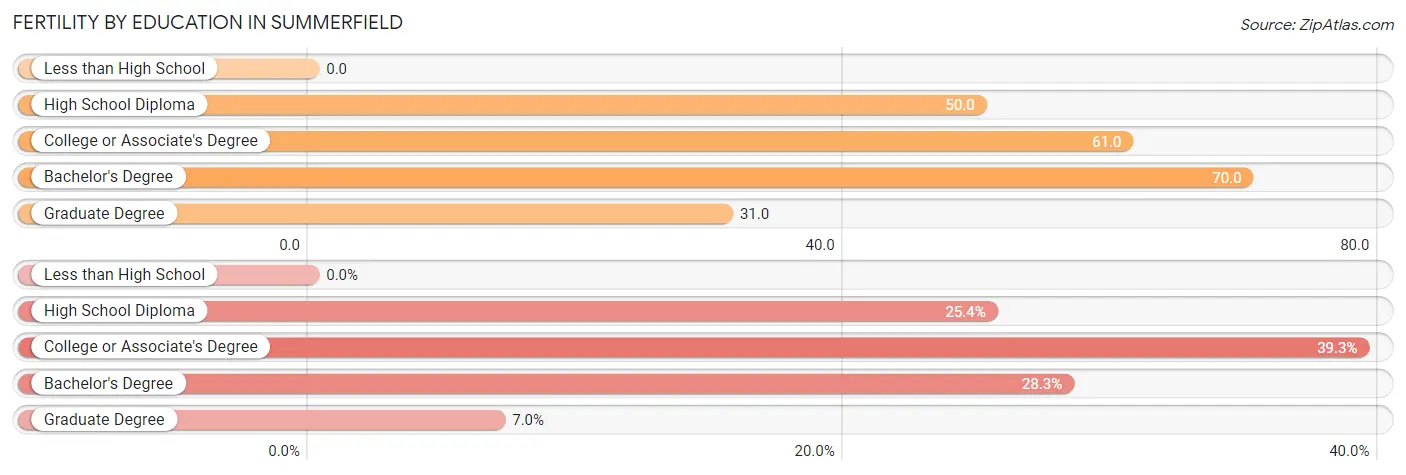
| Educational Attainment | Women with Births | Births / 1,000 Women |
| Less than High School | 0 (0.0%) | 0.0 |
| High School Diploma | 62 (25.4%) | 50.0 |
| College or Associate's Degree | 96 (39.3%) | 61.0 |
| Bachelor's Degree | 69 (28.3%) | 70.0 |
| Graduate Degree | 17 (7.0%) | 31.0 |
| Total | 244 (100.0%) | 52.0 |
Fertility by Education by Marriage Status in Summerfield
57.8% of women with births in Summerfield are unmarried. Women with the educational attainment of graduate degree are most likely to be married with 100.0% of them married at childbirth, while women with the educational attainment of bachelor's degree are least likely to be married with 88.4% of them unmarried at childbirth.
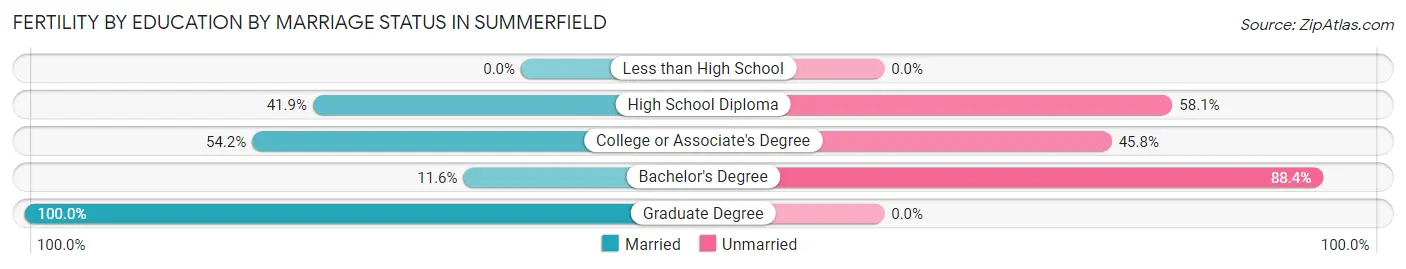
| Educational Attainment | Married | Unmarried |
| Less than High School | 0 (0.0%) | 0 (0.0%) |
| High School Diploma | 26 (41.9%) | 36 (58.1%) |
| College or Associate's Degree | 52 (54.2%) | 44 (45.8%) |
| Bachelor's Degree | 8 (11.6%) | 61 (88.4%) |
| Graduate Degree | 17 (100.0%) | 0 (0.0%) |
| Total | 103 (42.2%) | 141 (57.8%) |
Employment Characteristics in Summerfield
Employment by Class of Employer in Summerfield
Among the 8,443 employed individuals in Summerfield, private company employees (4,714 | 55.8%), federal government employees (1,327 | 15.7%), and not-for-profit organizations (950 | 11.3%) make up the most common classes of employment.
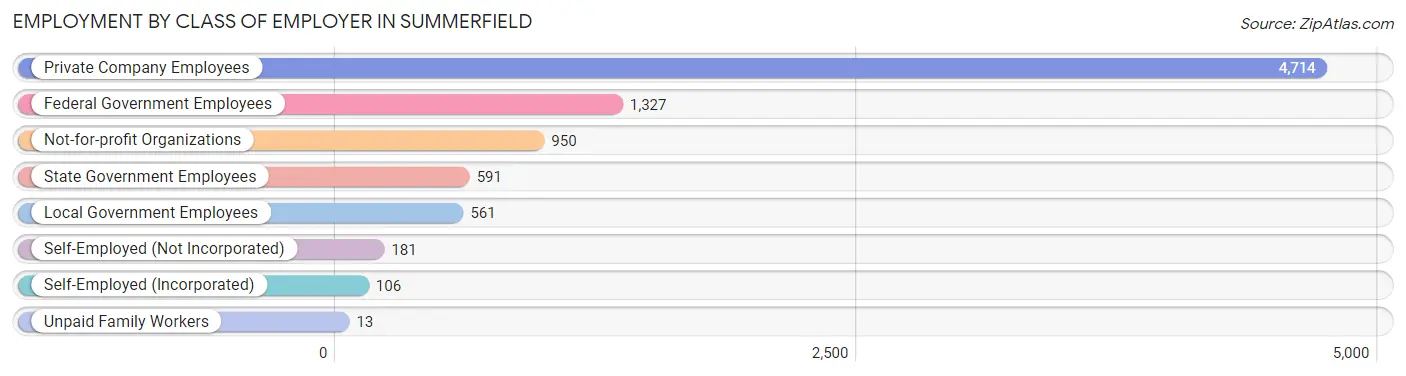
| Employer Class | # Employees | % Employees |
| Private Company Employees | 4,714 | 55.8% |
| Self-Employed (Incorporated) | 106 | 1.3% |
| Self-Employed (Not Incorporated) | 181 | 2.1% |
| Not-for-profit Organizations | 950 | 11.3% |
| Local Government Employees | 561 | 6.6% |
| State Government Employees | 591 | 7.0% |
| Federal Government Employees | 1,327 | 15.7% |
| Unpaid Family Workers | 13 | 0.2% |
| Total | 8,443 | 100.0% |
Employment Status by Age in Summerfield
According to the labor force statistics for Summerfield, out of the total population over 16 years of age (12,452), 74.3% or 9,252 individuals are in the labor force, with 6.6% or 611 of them unemployed. The age group with the highest labor force participation rate is 25 to 29 years, with 97.4% or 1,477 individuals in the labor force. Within the labor force, the 16 to 19 years age range has the highest percentage of unemployed individuals, with 22.1% or 50 of them being unemployed.
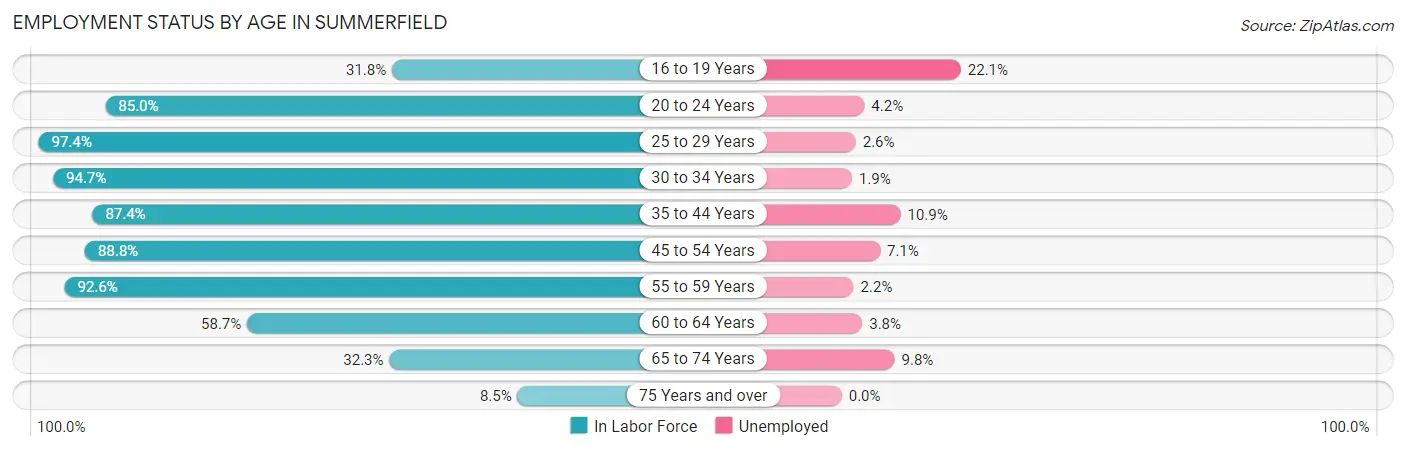
| Age Bracket | In Labor Force | Unemployed |
| 16 to 19 Years | 226 (31.8%) | 50 (22.1%) |
| 20 to 24 Years | 958 (85.0%) | 40 (4.2%) |
| 25 to 29 Years | 1,477 (97.4%) | 38 (2.6%) |
| 30 to 34 Years | 676 (94.7%) | 13 (1.9%) |
| 35 to 44 Years | 2,571 (87.4%) | 280 (10.9%) |
| 45 to 54 Years | 1,658 (88.8%) | 118 (7.1%) |
| 55 to 59 Years | 738 (92.6%) | 16 (2.2%) |
| 60 to 64 Years | 474 (58.7%) | 18 (3.8%) |
| 65 to 74 Years | 420 (32.3%) | 41 (9.8%) |
| 75 Years and over | 57 (8.5%) | 0 (0.0%) |
| Total | 9,252 (74.3%) | 611 (6.6%) |
Employment Status by Educational Attainment in Summerfield
According to labor force statistics for Summerfield, 87.9% of individuals (7,597) out of the total population between 25 and 64 years of age (8,643) are in the labor force, with 6.3% or 479 of them being unemployed. The group with the highest labor force participation rate are those with the educational attainment of bachelor's degree or higher, with 93.6% or 2,468 individuals in the labor force. Within the labor force, individuals with less than high school education have the highest percentage of unemployment, with 14.7% or 62 of them being unemployed.
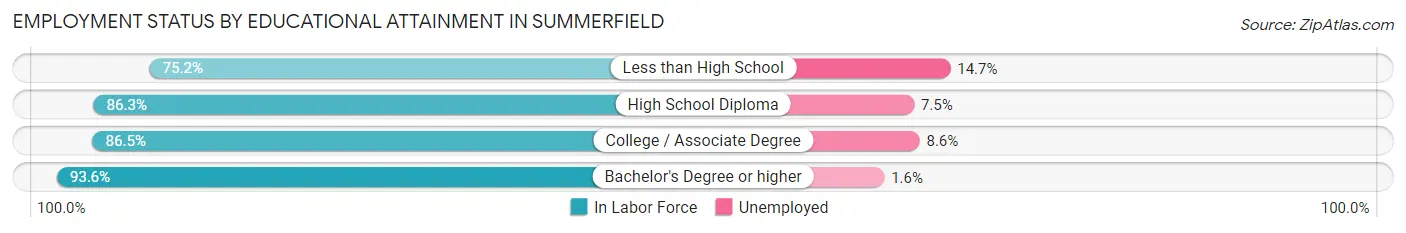
| Educational Attainment | In Labor Force | Unemployed |
| Less than High School | 421 (75.2%) | 82 (14.7%) |
| High School Diploma | 2,067 (86.3%) | 180 (7.5%) |
| College / Associate Degree | 2,639 (86.5%) | 262 (8.6%) |
| Bachelor's Degree or higher | 2,468 (93.6%) | 42 (1.6%) |
| Total | 7,597 (87.9%) | 545 (6.3%) |
Employment Occupations by Sex in Summerfield
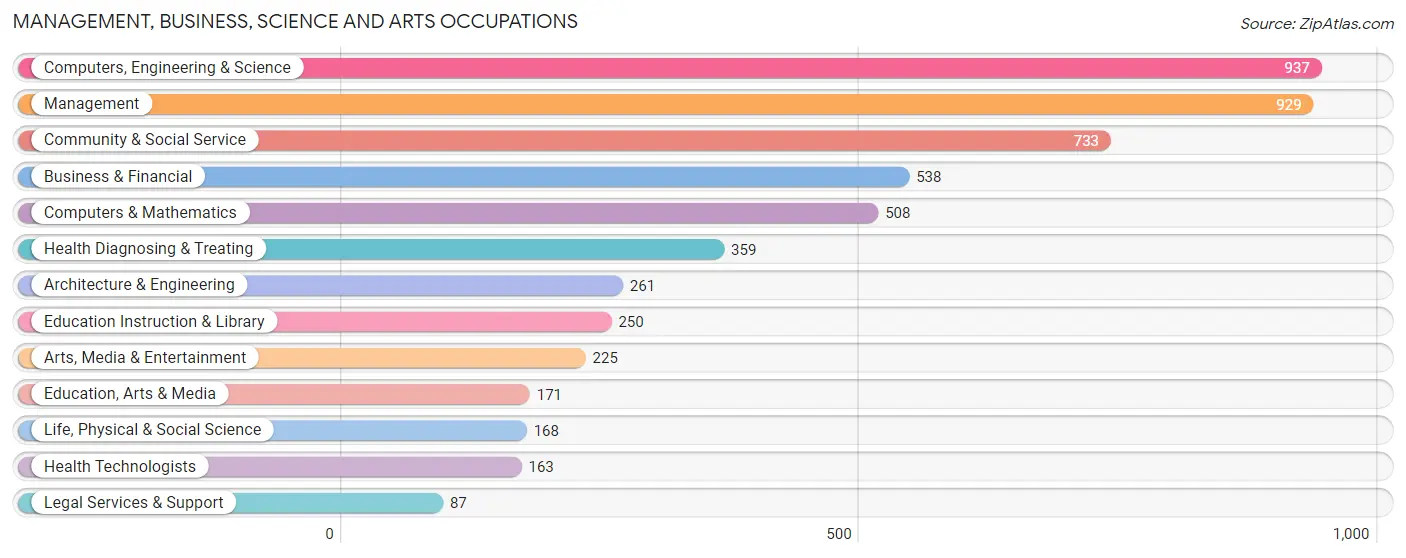
Management, Business, Science and Arts Occupations
The most common Management, Business, Science and Arts occupations in Summerfield are Computers, Engineering & Science (937 | 10.9%), Management (929 | 10.8%), Community & Social Service (733 | 8.5%), Business & Financial (538 | 6.2%), and Computers & Mathematics (508 | 5.9%).
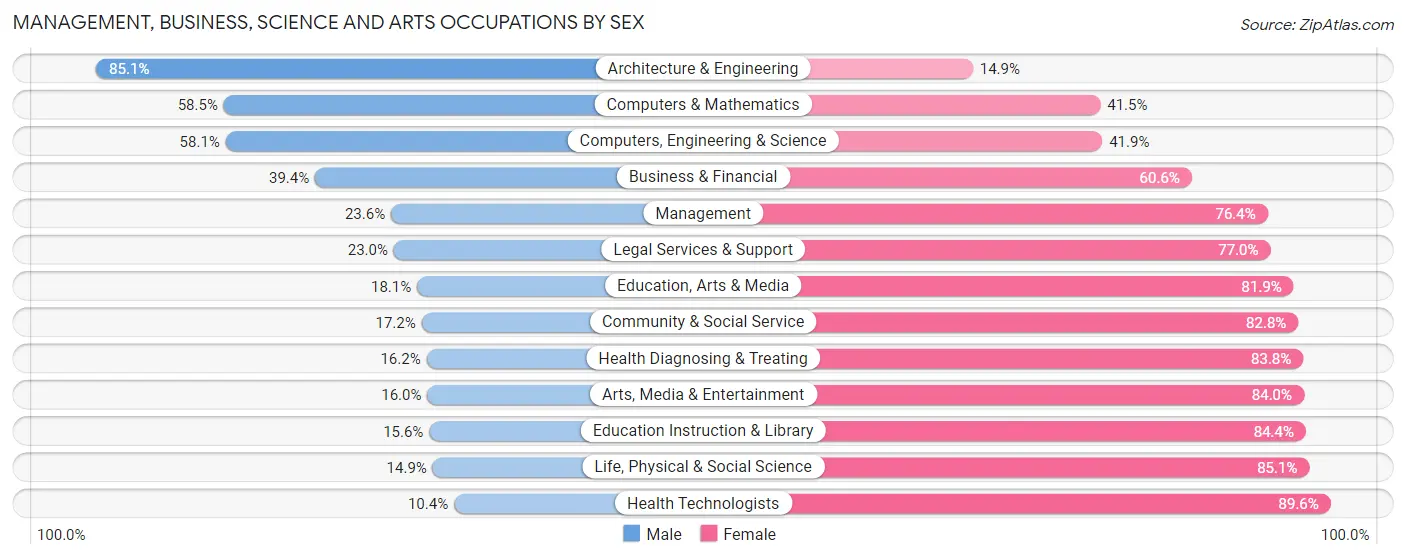
Management, Business, Science and Arts Occupations by Sex
Within the Management, Business, Science and Arts occupations in Summerfield, the most male-oriented occupations are Architecture & Engineering (85.1%), Computers & Mathematics (58.5%), and Computers, Engineering & Science (58.1%), while the most female-oriented occupations are Health Technologists (89.6%), Life, Physical & Social Science (85.1%), and Education Instruction & Library (84.4%).
| Occupation | Male | Female |
| Management | 219 (23.6%) | 710 (76.4%) |
| Business & Financial | 212 (39.4%) | 326 (60.6%) |
| Computers, Engineering & Science | 544 (58.1%) | 393 (41.9%) |
| Computers & Mathematics | 297 (58.5%) | 211 (41.5%) |
| Architecture & Engineering | 222 (85.1%) | 39 (14.9%) |
| Life, Physical & Social Science | 25 (14.9%) | 143 (85.1%) |
| Community & Social Service | 126 (17.2%) | 607 (82.8%) |
| Education, Arts & Media | 31 (18.1%) | 140 (81.9%) |
| Legal Services & Support | 20 (23.0%) | 67 (77.0%) |
| Education Instruction & Library | 39 (15.6%) | 211 (84.4%) |
| Arts, Media & Entertainment | 36 (16.0%) | 189 (84.0%) |
| Health Diagnosing & Treating | 58 (16.2%) | 301 (83.8%) |
| Health Technologists | 17 (10.4%) | 146 (89.6%) |
| Total (Category) | 1,159 (33.2%) | 2,337 (66.8%) |
| Total (Overall) | 3,740 (43.4%) | 4,881 (56.6%) |
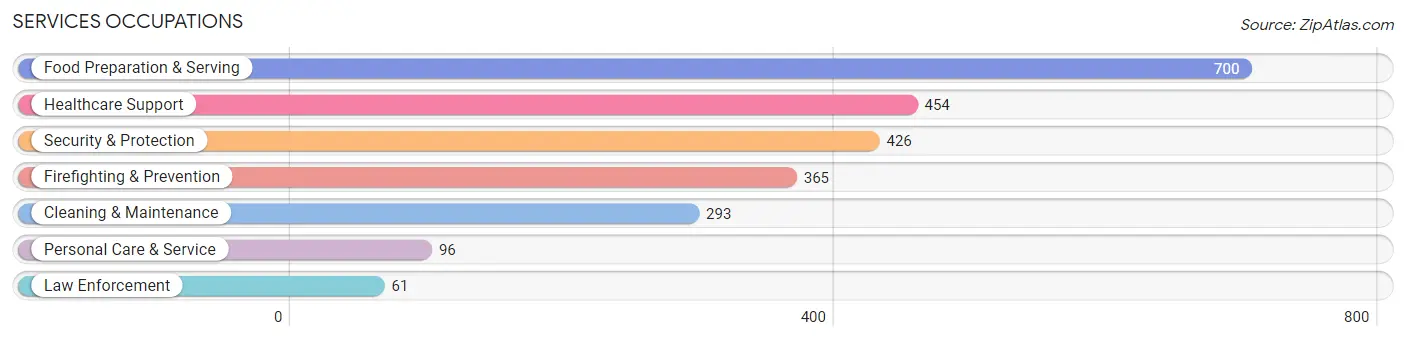
Services Occupations
The most common Services occupations in Summerfield are Food Preparation & Serving (700 | 8.1%), Healthcare Support (454 | 5.3%), Security & Protection (426 | 4.9%), Firefighting & Prevention (365 | 4.2%), and Cleaning & Maintenance (293 | 3.4%).
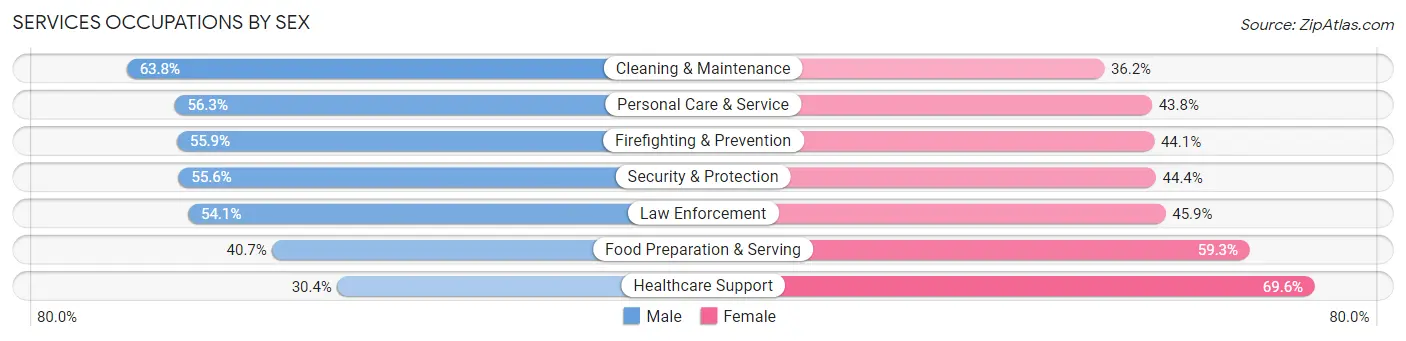
Services Occupations by Sex
Within the Services occupations in Summerfield, the most male-oriented occupations are Cleaning & Maintenance (63.8%), Personal Care & Service (56.2%), and Firefighting & Prevention (55.9%), while the most female-oriented occupations are Healthcare Support (69.6%), Food Preparation & Serving (59.3%), and Law Enforcement (45.9%).
| Occupation | Male | Female |
| Healthcare Support | 138 (30.4%) | 316 (69.6%) |
| Security & Protection | 237 (55.6%) | 189 (44.4%) |
| Firefighting & Prevention | 204 (55.9%) | 161 (44.1%) |
| Law Enforcement | 33 (54.1%) | 28 (45.9%) |
| Food Preparation & Serving | 285 (40.7%) | 415 (59.3%) |
| Cleaning & Maintenance | 187 (63.8%) | 106 (36.2%) |
| Personal Care & Service | 54 (56.2%) | 42 (43.8%) |
| Total (Category) | 901 (45.8%) | 1,068 (54.2%) |
| Total (Overall) | 3,740 (43.4%) | 4,881 (56.6%) |
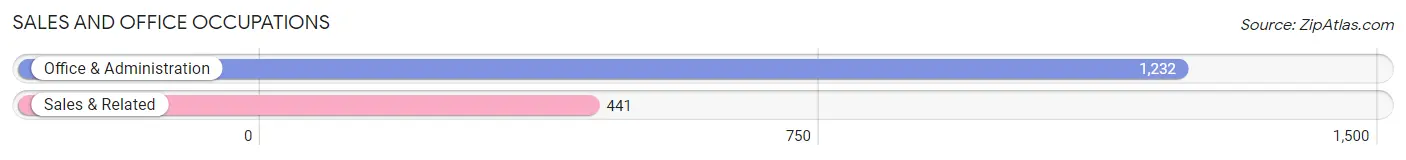
Sales and Office Occupations
The most common Sales and Office occupations in Summerfield are Office & Administration (1,232 | 14.3%), and Sales & Related (441 | 5.1%).
Sales and Office Occupations by Sex
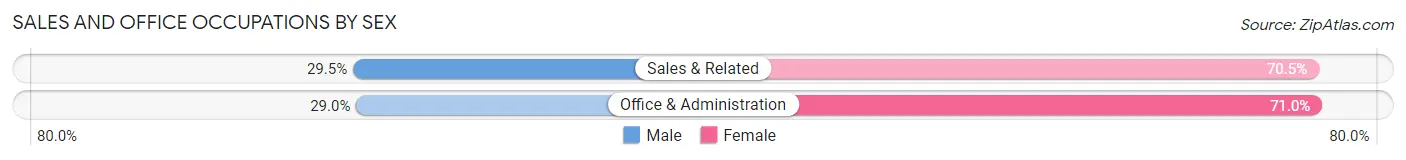
| Occupation | Male | Female |
| Sales & Related | 130 (29.5%) | 311 (70.5%) |
| Office & Administration | 357 (29.0%) | 875 (71.0%) |
| Total (Category) | 487 (29.1%) | 1,186 (70.9%) |
| Total (Overall) | 3,740 (43.4%) | 4,881 (56.6%) |
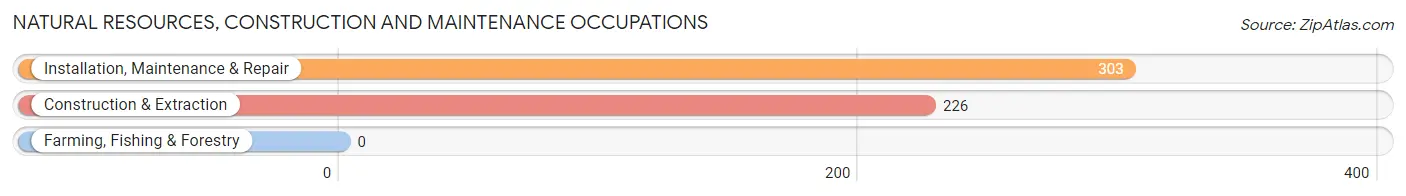
Natural Resources, Construction and Maintenance Occupations
The most common Natural Resources, Construction and Maintenance occupations in Summerfield are Installation, Maintenance & Repair (303 | 3.5%), and Construction & Extraction (226 | 2.6%).
Natural Resources, Construction and Maintenance Occupations by Sex
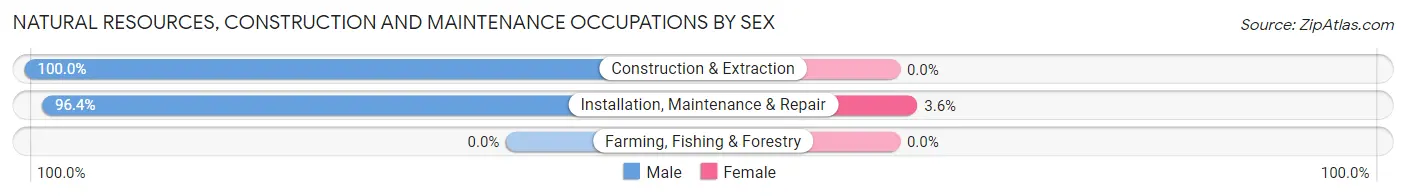
| Occupation | Male | Female |
| Farming, Fishing & Forestry | 0 (0.0%) | 0 (0.0%) |
| Construction & Extraction | 226 (100.0%) | 0 (0.0%) |
| Installation, Maintenance & Repair | 292 (96.4%) | 11 (3.6%) |
| Total (Category) | 518 (97.9%) | 11 (2.1%) |
| Total (Overall) | 3,740 (43.4%) | 4,881 (56.6%) |
Production, Transportation and Moving Occupations
The most common Production, Transportation and Moving occupations in Summerfield are Transportation (594 | 6.9%), Material Moving (233 | 2.7%), and Production (127 | 1.5%).
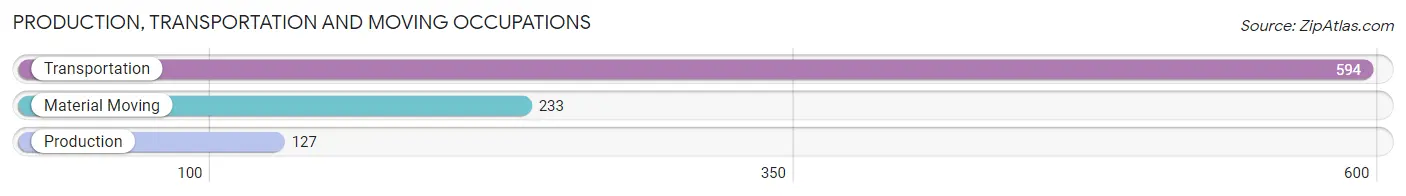
Production, Transportation and Moving Occupations by Sex
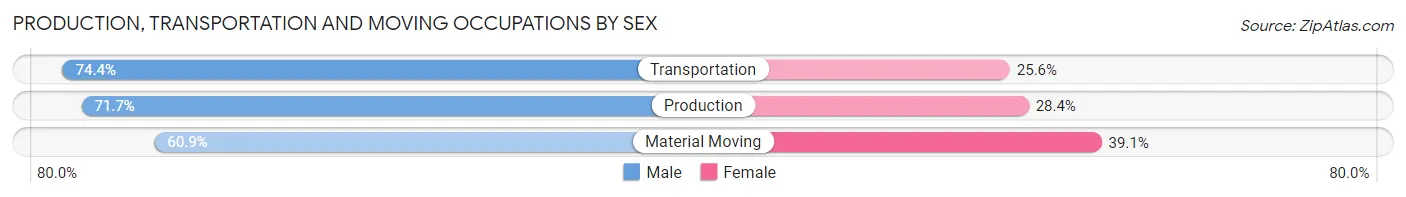
| Occupation | Male | Female |
| Production | 91 (71.7%) | 36 (28.3%) |
| Transportation | 442 (74.4%) | 152 (25.6%) |
| Material Moving | 142 (60.9%) | 91 (39.1%) |
| Total (Category) | 675 (70.8%) | 279 (29.2%) |
| Total (Overall) | 3,740 (43.4%) | 4,881 (56.6%) |
Employment Industries by Sex in Summerfield
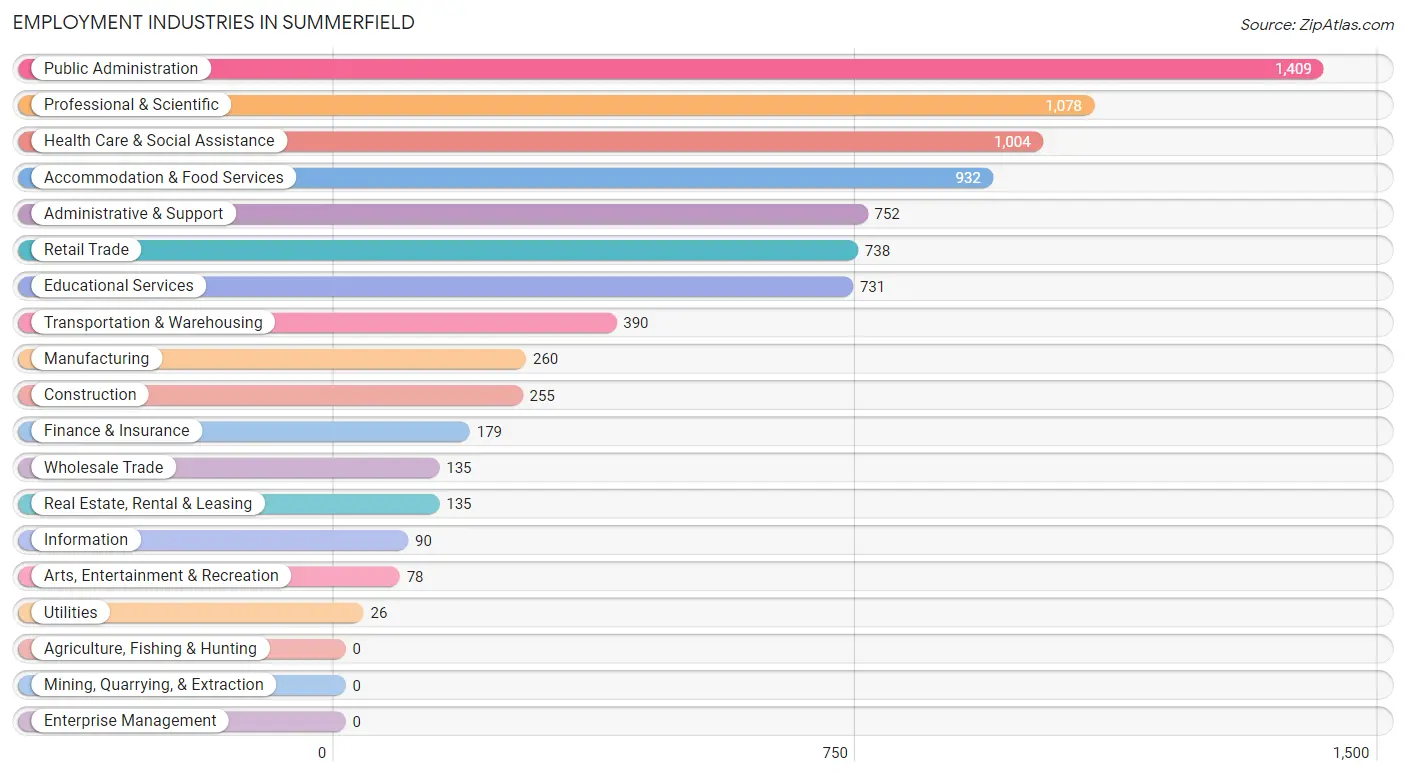
Employment Industries in Summerfield
The major employment industries in Summerfield include Public Administration (1,409 | 16.3%), Professional & Scientific (1,078 | 12.5%), Health Care & Social Assistance (1,004 | 11.7%), Accommodation & Food Services (932 | 10.8%), and Administrative & Support (752 | 8.7%).
Employment Industries by Sex in Summerfield
The Summerfield industries that see more men than women are Construction (100.0%), Utilities (100.0%), and Arts, Entertainment & Recreation (78.2%), whereas the industries that tend to have a higher number of women are Finance & Insurance (82.1%), Health Care & Social Assistance (78.7%), and Educational Services (67.4%).
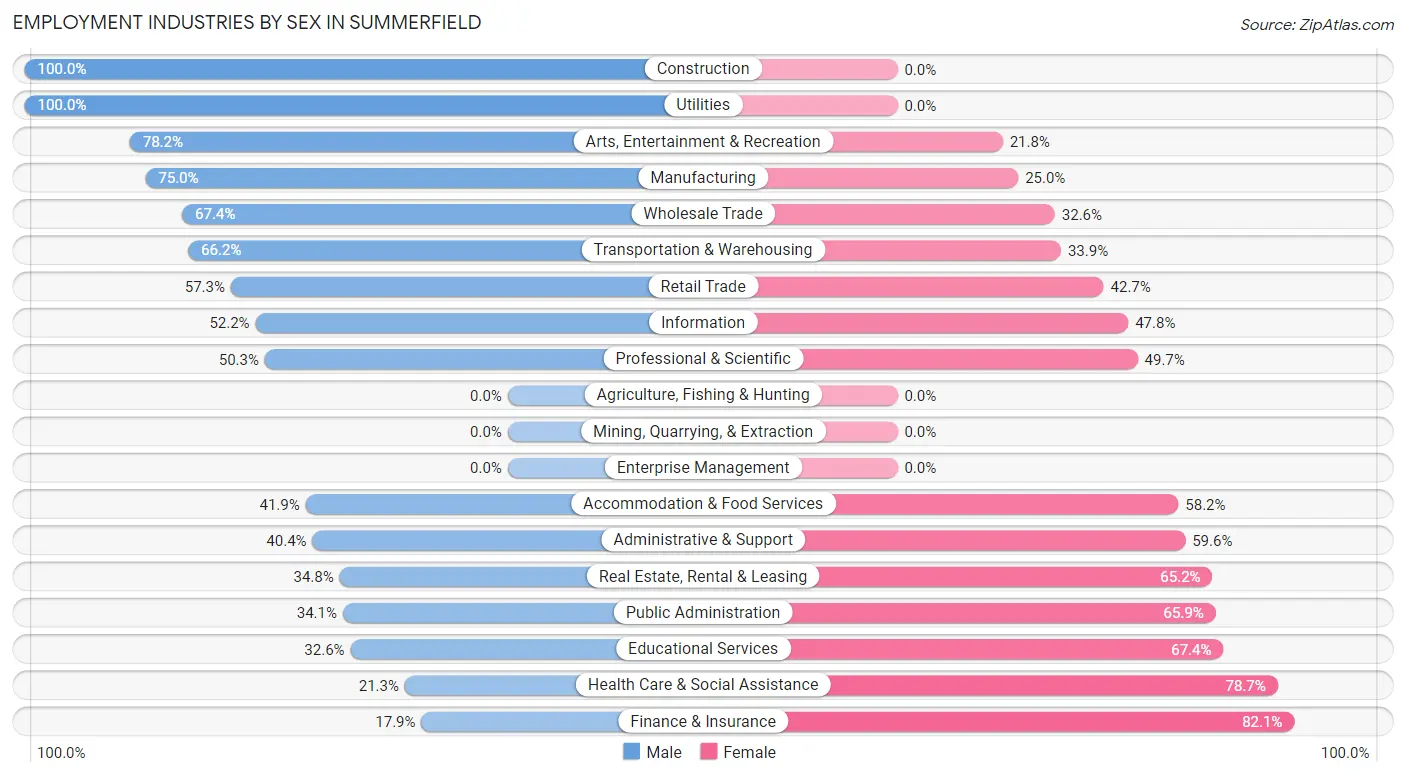
| Industry | Male | Female |
| Agriculture, Fishing & Hunting | 0 (0.0%) | 0 (0.0%) |
| Mining, Quarrying, & Extraction | 0 (0.0%) | 0 (0.0%) |
| Construction | 255 (100.0%) | 0 (0.0%) |
| Manufacturing | 195 (75.0%) | 65 (25.0%) |
| Wholesale Trade | 91 (67.4%) | 44 (32.6%) |
| Retail Trade | 423 (57.3%) | 315 (42.7%) |
| Transportation & Warehousing | 258 (66.1%) | 132 (33.9%) |
| Utilities | 26 (100.0%) | 0 (0.0%) |
| Information | 47 (52.2%) | 43 (47.8%) |
| Finance & Insurance | 32 (17.9%) | 147 (82.1%) |
| Real Estate, Rental & Leasing | 47 (34.8%) | 88 (65.2%) |
| Professional & Scientific | 542 (50.3%) | 536 (49.7%) |
| Enterprise Management | 0 (0.0%) | 0 (0.0%) |
| Administrative & Support | 304 (40.4%) | 448 (59.6%) |
| Educational Services | 238 (32.6%) | 493 (67.4%) |
| Health Care & Social Assistance | 214 (21.3%) | 790 (78.7%) |
| Arts, Entertainment & Recreation | 61 (78.2%) | 17 (21.8%) |
| Accommodation & Food Services | 390 (41.8%) | 542 (58.2%) |
| Public Administration | 481 (34.1%) | 928 (65.9%) |
| Total | 3,740 (43.4%) | 4,881 (56.6%) |
Education in Summerfield
School Enrollment in Summerfield
The most common levels of schooling among the 4,534 students in Summerfield are elementary school (1,181 | 26.1%), college / undergraduate (1,021 | 22.5%), and middle school (869 | 19.2%).
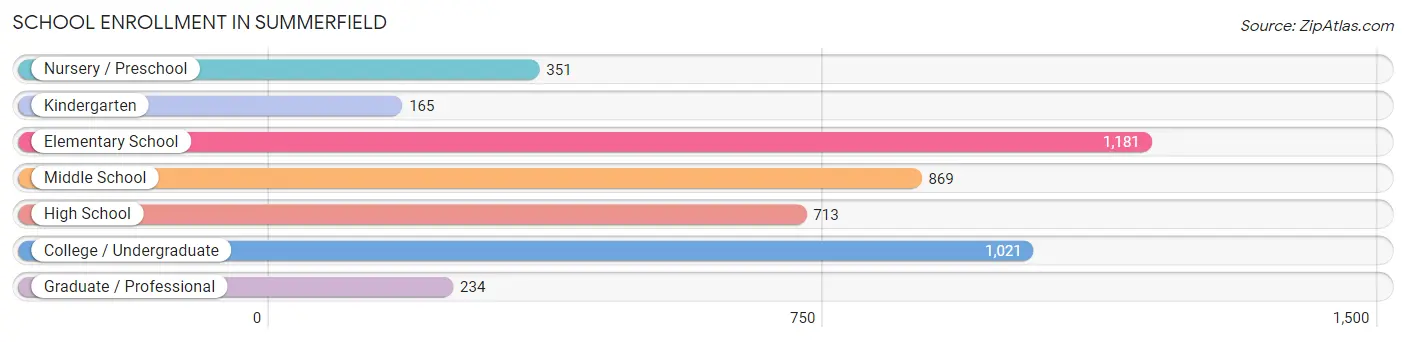
| School Level | # Students | % Students |
| Nursery / Preschool | 351 | 7.7% |
| Kindergarten | 165 | 3.6% |
| Elementary School | 1,181 | 26.1% |
| Middle School | 869 | 19.2% |
| High School | 713 | 15.7% |
| College / Undergraduate | 1,021 | 22.5% |
| Graduate / Professional | 234 | 5.2% |
| Total | 4,534 | 100.0% |
School Enrollment by Age by Funding Source in Summerfield
Out of a total of 4,534 students who are enrolled in schools in Summerfield, 775 (17.1%) attend a private institution, while the remaining 3,759 (82.9%) are enrolled in public schools. The age group of 20 to 24 year olds has the highest likelihood of being enrolled in private schools, with 213 (61.4% in the age bracket) enrolled. Conversely, the age group of 10 to 14 year olds has the lowest likelihood of being enrolled in a private school, with 1,100 (98.8% in the age bracket) attending a public institution.
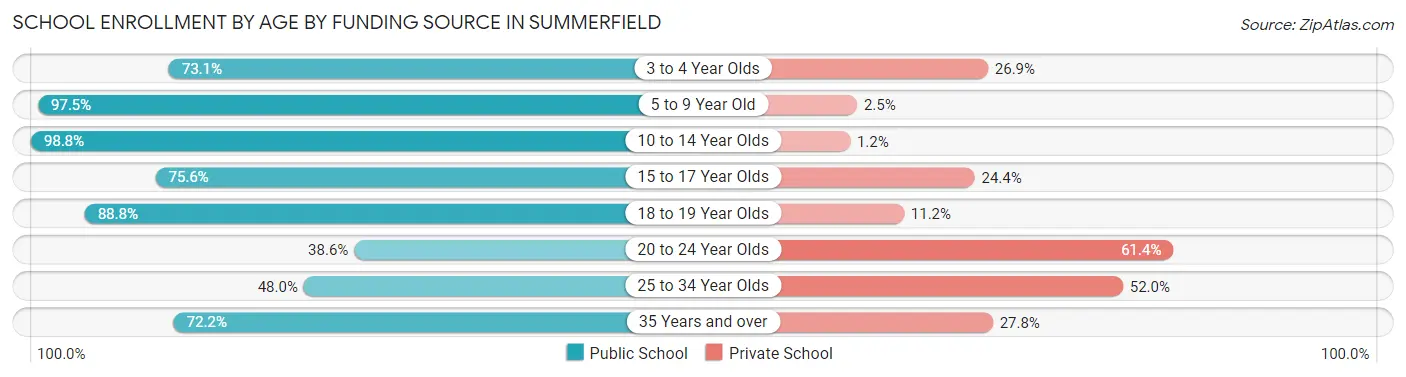
| Age Bracket | Public School | Private School |
| 3 to 4 Year Olds | 177 (73.1%) | 65 (26.9%) |
| 5 to 9 Year Old | 1,219 (97.5%) | 31 (2.5%) |
| 10 to 14 Year Olds | 1,100 (98.8%) | 13 (1.2%) |
| 15 to 17 Year Olds | 366 (75.6%) | 118 (24.4%) |
| 18 to 19 Year Olds | 198 (88.8%) | 25 (11.2%) |
| 20 to 24 Year Olds | 134 (38.6%) | 213 (61.4%) |
| 25 to 34 Year Olds | 133 (48.0%) | 144 (52.0%) |
| 35 Years and over | 432 (72.2%) | 166 (27.8%) |
| Total | 3,759 (82.9%) | 775 (17.1%) |
Educational Attainment by Field of Study in Summerfield
Business (867 | 26.3%), arts & humanities (328 | 9.9%), engineering (261 | 7.9%), social sciences (260 | 7.9%), and education (230 | 7.0%) are the most common fields of study among 3,300 individuals in Summerfield who have obtained a bachelor's degree or higher.
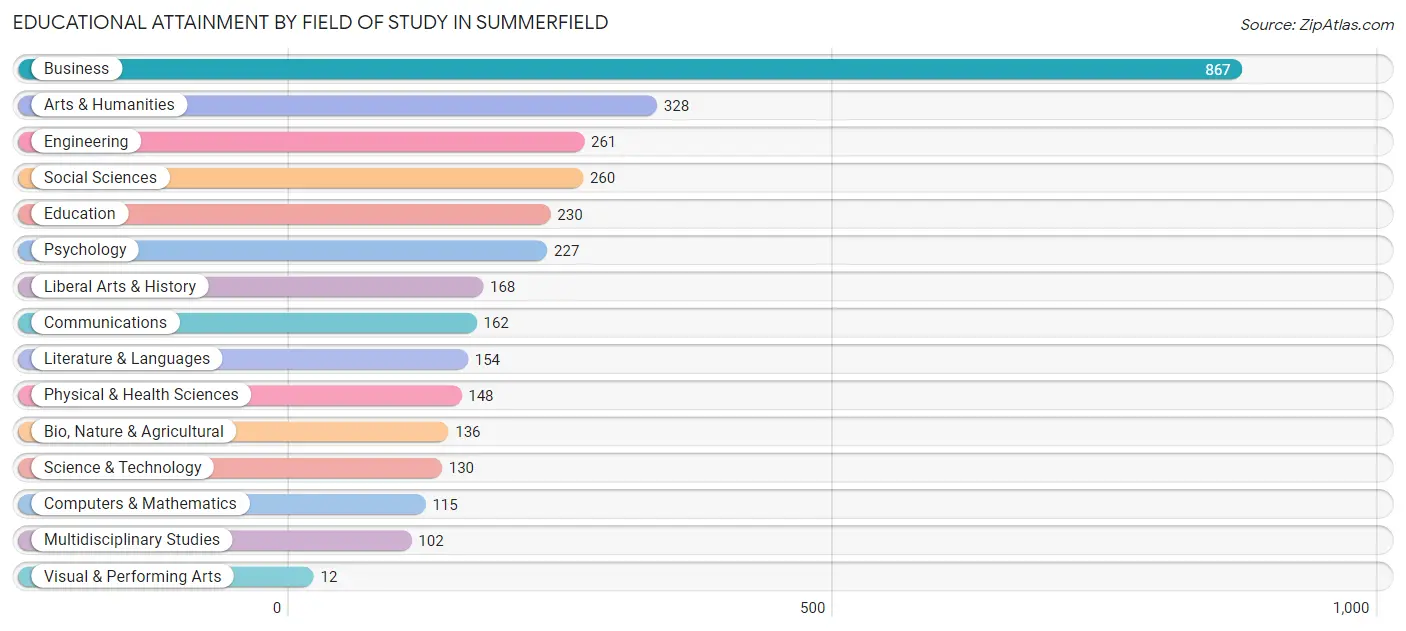
| Field of Study | # Graduates | % Graduates |
| Computers & Mathematics | 115 | 3.5% |
| Bio, Nature & Agricultural | 136 | 4.1% |
| Physical & Health Sciences | 148 | 4.5% |
| Psychology | 227 | 6.9% |
| Social Sciences | 260 | 7.9% |
| Engineering | 261 | 7.9% |
| Multidisciplinary Studies | 102 | 3.1% |
| Science & Technology | 130 | 3.9% |
| Business | 867 | 26.3% |
| Education | 230 | 7.0% |
| Literature & Languages | 154 | 4.7% |
| Liberal Arts & History | 168 | 5.1% |
| Visual & Performing Arts | 12 | 0.4% |
| Communications | 162 | 4.9% |
| Arts & Humanities | 328 | 9.9% |
| Total | 3,300 | 100.0% |
Transportation & Commute in Summerfield
Vehicle Availability by Sex in Summerfield
The most prevalent vehicle ownership categories in Summerfield are males with 2 vehicles (1,411, accounting for 37.8%) and females with 2 vehicles (1,422, making up 30.0%).
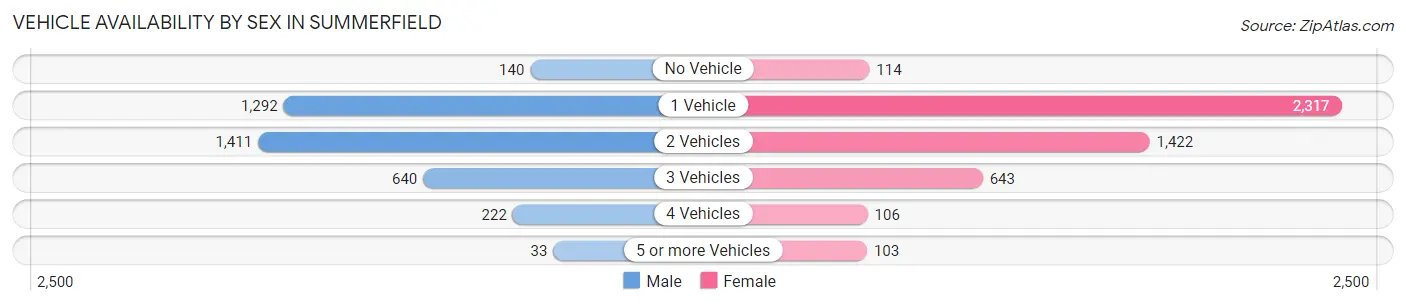
| Vehicles Available | Male | Female |
| No Vehicle | 140 (3.7%) | 114 (2.4%) |
| 1 Vehicle | 1,292 (34.6%) | 2,317 (49.2%) |
| 2 Vehicles | 1,411 (37.8%) | 1,422 (30.2%) |
| 3 Vehicles | 640 (17.1%) | 643 (13.7%) |
| 4 Vehicles | 222 (5.9%) | 106 (2.2%) |
| 5 or more Vehicles | 33 (0.9%) | 103 (2.2%) |
| Total | 3,738 (100.0%) | 4,705 (100.0%) |
Commute Time in Summerfield
The most frequently occuring commute durations in Summerfield are 30 to 34 minutes (1,145 commuters, 16.1%), 20 to 24 minutes (1,040 commuters, 14.6%), and 60 to 89 minutes (968 commuters, 13.6%).
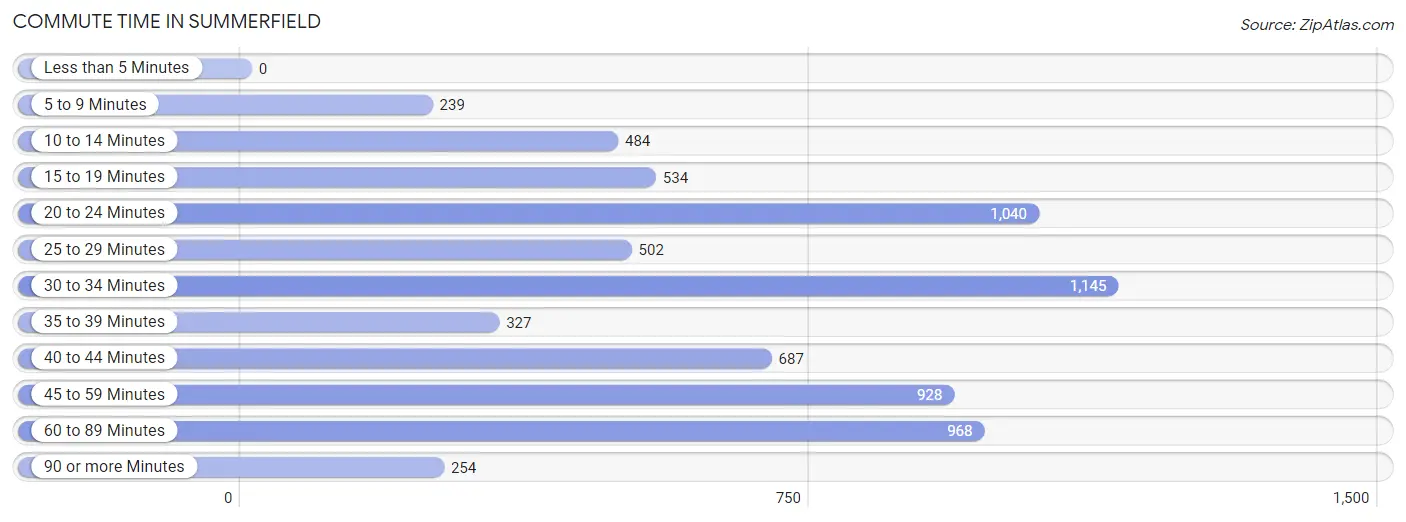
| Commute Time | # Commuters | % Commuters |
| Less than 5 Minutes | 0 | 0.0% |
| 5 to 9 Minutes | 239 | 3.4% |
| 10 to 14 Minutes | 484 | 6.8% |
| 15 to 19 Minutes | 534 | 7.5% |
| 20 to 24 Minutes | 1,040 | 14.6% |
| 25 to 29 Minutes | 502 | 7.1% |
| 30 to 34 Minutes | 1,145 | 16.1% |
| 35 to 39 Minutes | 327 | 4.6% |
| 40 to 44 Minutes | 687 | 9.7% |
| 45 to 59 Minutes | 928 | 13.1% |
| 60 to 89 Minutes | 968 | 13.6% |
| 90 or more Minutes | 254 | 3.6% |
Commute Time by Sex in Summerfield
The most common commute times in Summerfield are 30 to 34 minutes (585 commuters, 17.9%) for males and 20 to 24 minutes (683 commuters, 17.8%) for females.
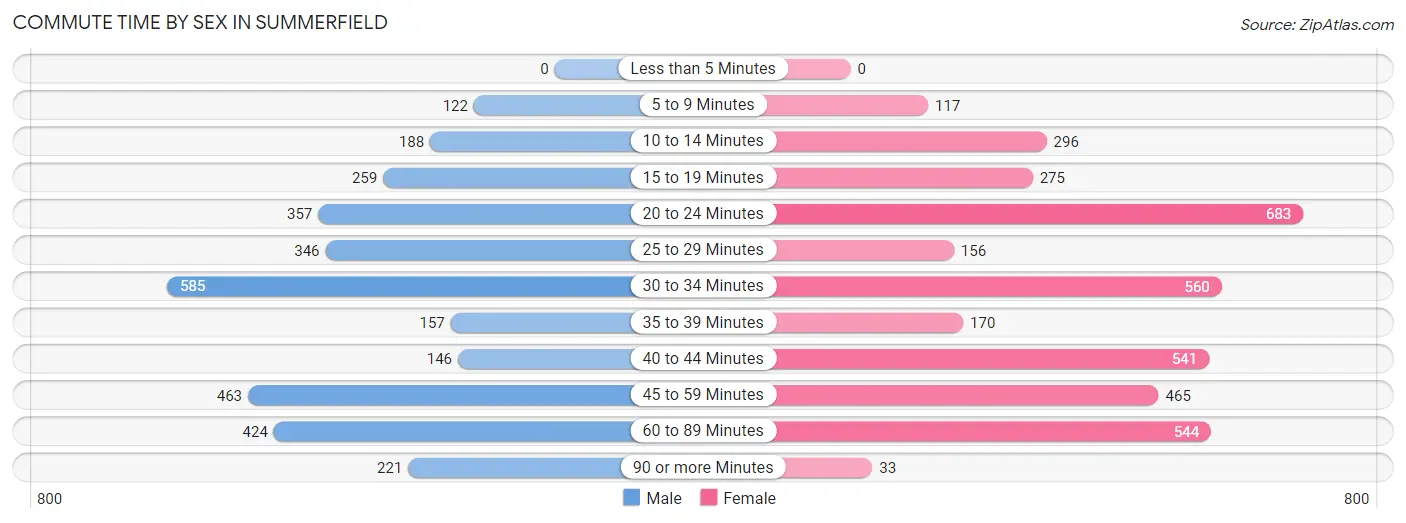
| Commute Time | Male | Female |
| Less than 5 Minutes | 0 (0.0%) | 0 (0.0%) |
| 5 to 9 Minutes | 122 (3.7%) | 117 (3.0%) |
| 10 to 14 Minutes | 188 (5.8%) | 296 (7.7%) |
| 15 to 19 Minutes | 259 (7.9%) | 275 (7.2%) |
| 20 to 24 Minutes | 357 (10.9%) | 683 (17.8%) |
| 25 to 29 Minutes | 346 (10.6%) | 156 (4.1%) |
| 30 to 34 Minutes | 585 (17.9%) | 560 (14.6%) |
| 35 to 39 Minutes | 157 (4.8%) | 170 (4.4%) |
| 40 to 44 Minutes | 146 (4.5%) | 541 (14.1%) |
| 45 to 59 Minutes | 463 (14.2%) | 465 (12.1%) |
| 60 to 89 Minutes | 424 (13.0%) | 544 (14.2%) |
| 90 or more Minutes | 221 (6.8%) | 33 (0.9%) |
Time of Departure to Work by Sex in Summerfield
The most frequent times of departure to work in Summerfield are 12:00 PM to 3:59 PM (519, 15.9%) for males and 7:30 AM to 7:59 AM (561, 14.6%) for females.
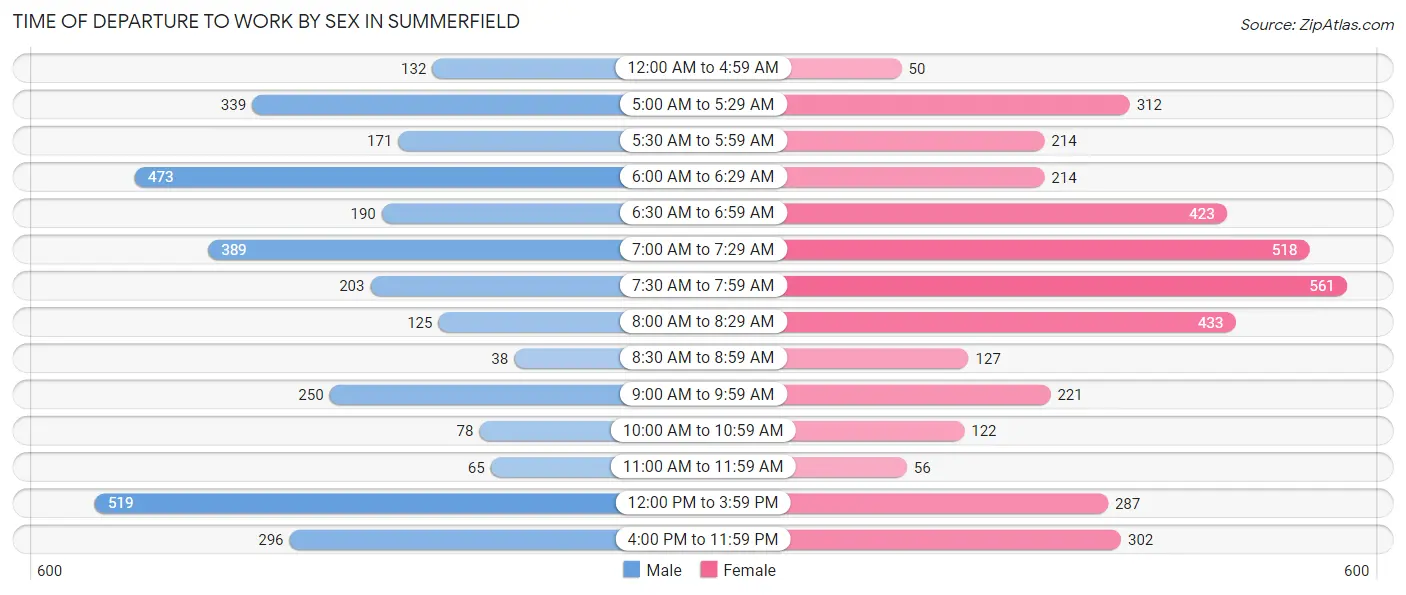
| Time of Departure | Male | Female |
| 12:00 AM to 4:59 AM | 132 (4.0%) | 50 (1.3%) |
| 5:00 AM to 5:29 AM | 339 (10.4%) | 312 (8.1%) |
| 5:30 AM to 5:59 AM | 171 (5.2%) | 214 (5.6%) |
| 6:00 AM to 6:29 AM | 473 (14.5%) | 214 (5.6%) |
| 6:30 AM to 6:59 AM | 190 (5.8%) | 423 (11.0%) |
| 7:00 AM to 7:29 AM | 389 (11.9%) | 518 (13.5%) |
| 7:30 AM to 7:59 AM | 203 (6.2%) | 561 (14.6%) |
| 8:00 AM to 8:29 AM | 125 (3.8%) | 433 (11.3%) |
| 8:30 AM to 8:59 AM | 38 (1.2%) | 127 (3.3%) |
| 9:00 AM to 9:59 AM | 250 (7.6%) | 221 (5.8%) |
| 10:00 AM to 10:59 AM | 78 (2.4%) | 122 (3.2%) |
| 11:00 AM to 11:59 AM | 65 (2.0%) | 56 (1.5%) |
| 12:00 PM to 3:59 PM | 519 (15.9%) | 287 (7.5%) |
| 4:00 PM to 11:59 PM | 296 (9.1%) | 302 (7.9%) |
| Total | 3,268 (100.0%) | 3,840 (100.0%) |
Housing Occupancy in Summerfield
Occupancy by Ownership in Summerfield
Of the total 5,985 dwellings in Summerfield, owner-occupied units account for 2,686 (44.9%), while renter-occupied units make up 3,299 (55.1%).
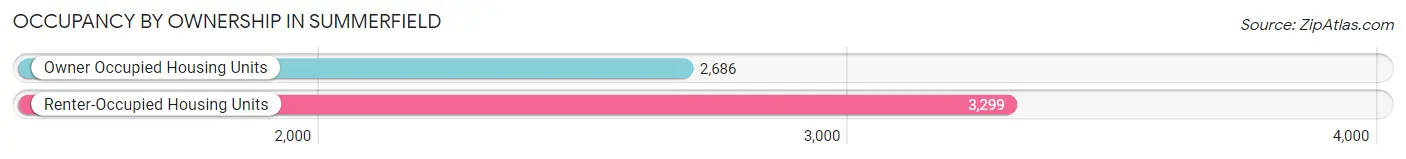
| Occupancy | # Housing Units | % Housing Units |
| Owner Occupied Housing Units | 2,686 | 44.9% |
| Renter-Occupied Housing Units | 3,299 | 55.1% |
| Total Occupied Housing Units | 5,985 | 100.0% |
Occupancy by Household Size in Summerfield
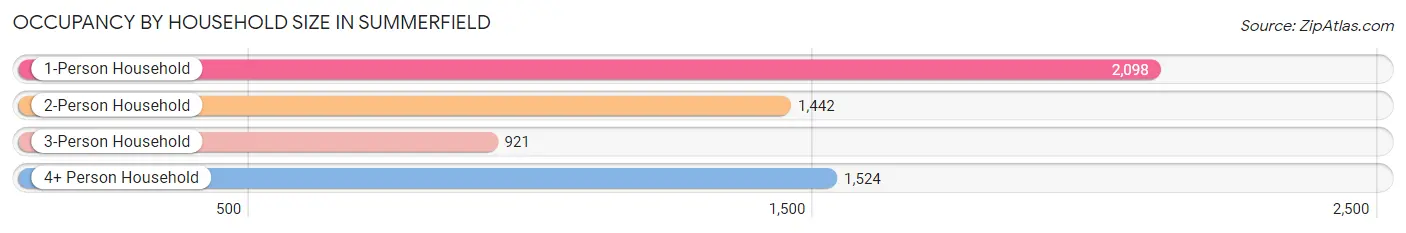
| Household Size | # Housing Units | % Housing Units |
| 1-Person Household | 2,098 | 35.0% |
| 2-Person Household | 1,442 | 24.1% |
| 3-Person Household | 921 | 15.4% |
| 4+ Person Household | 1,524 | 25.5% |
| Total Housing Units | 5,985 | 100.0% |
Occupancy by Ownership by Household Size in Summerfield
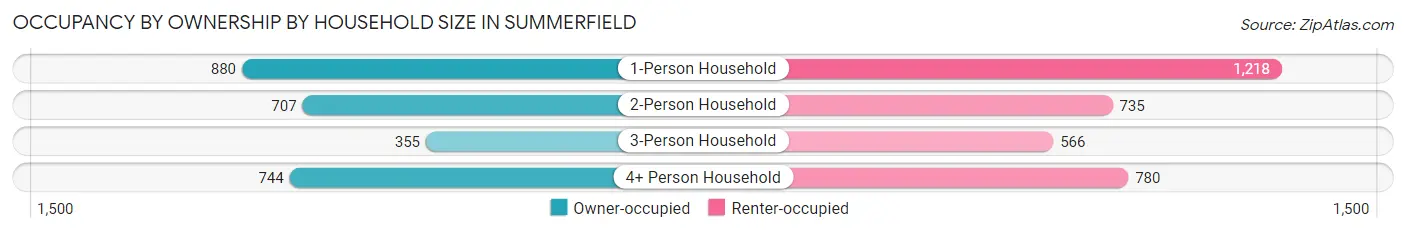
| Household Size | Owner-occupied | Renter-occupied |
| 1-Person Household | 880 (41.9%) | 1,218 (58.1%) |
| 2-Person Household | 707 (49.0%) | 735 (51.0%) |
| 3-Person Household | 355 (38.6%) | 566 (61.5%) |
| 4+ Person Household | 744 (48.8%) | 780 (51.2%) |
| Total Housing Units | 2,686 (44.9%) | 3,299 (55.1%) |
Occupancy by Educational Attainment in Summerfield
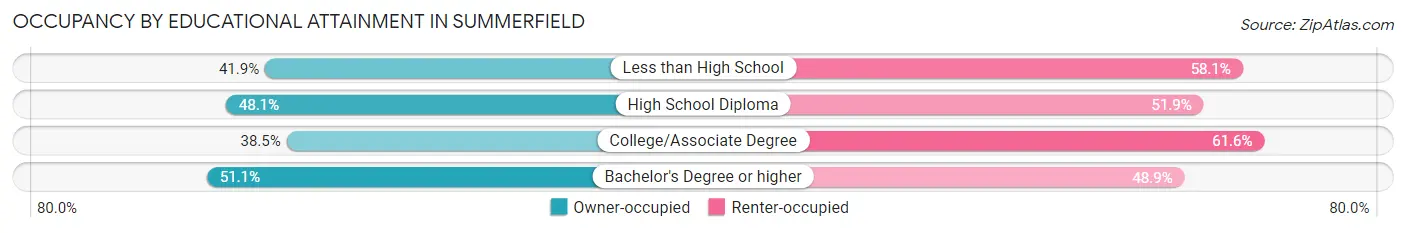
| Household Size | Owner-occupied | Renter-occupied |
| Less than High School | 103 (41.9%) | 143 (58.1%) |
| High School Diploma | 758 (48.1%) | 819 (51.9%) |
| College/Associate Degree | 917 (38.5%) | 1,468 (61.6%) |
| Bachelor's Degree or higher | 908 (51.1%) | 869 (48.9%) |
Occupancy by Age of Householder in Summerfield
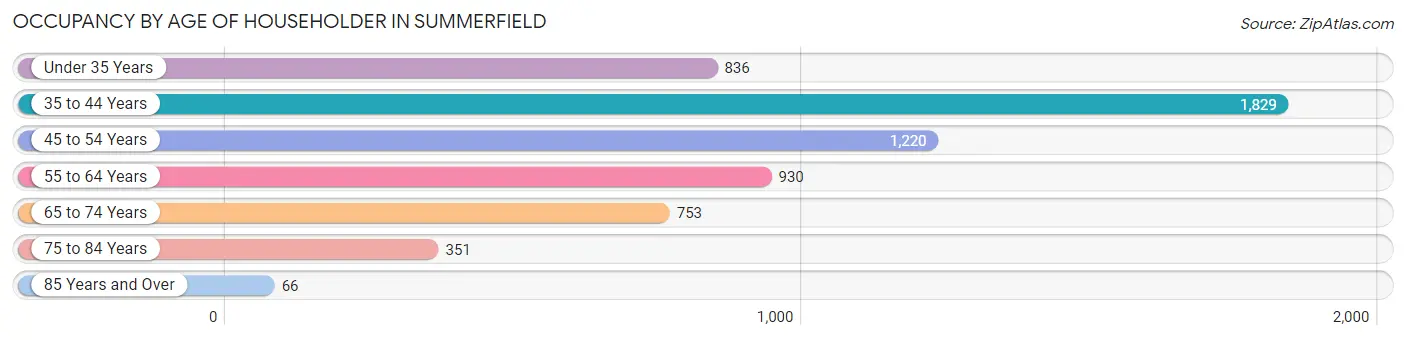
| Age Bracket | # Households | % Households |
| Under 35 Years | 836 | 14.0% |
| 35 to 44 Years | 1,829 | 30.6% |
| 45 to 54 Years | 1,220 | 20.4% |
| 55 to 64 Years | 930 | 15.5% |
| 65 to 74 Years | 753 | 12.6% |
| 75 to 84 Years | 351 | 5.9% |
| 85 Years and Over | 66 | 1.1% |
| Total | 5,985 | 100.0% |
Housing Finances in Summerfield
Median Income by Occupancy in Summerfield
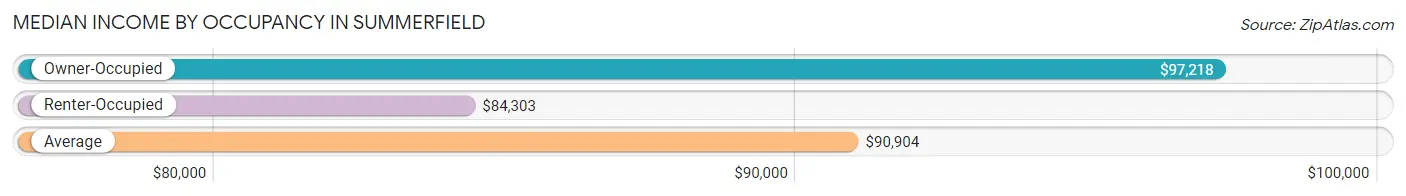
| Occupancy Type | # Households | Median Income |
| Owner-Occupied | 2,686 (44.9%) | $97,218 |
| Renter-Occupied | 3,299 (55.1%) | $84,303 |
| Average | 5,985 (100.0%) | $90,904 |
Occupancy by Householder Income Bracket in Summerfield
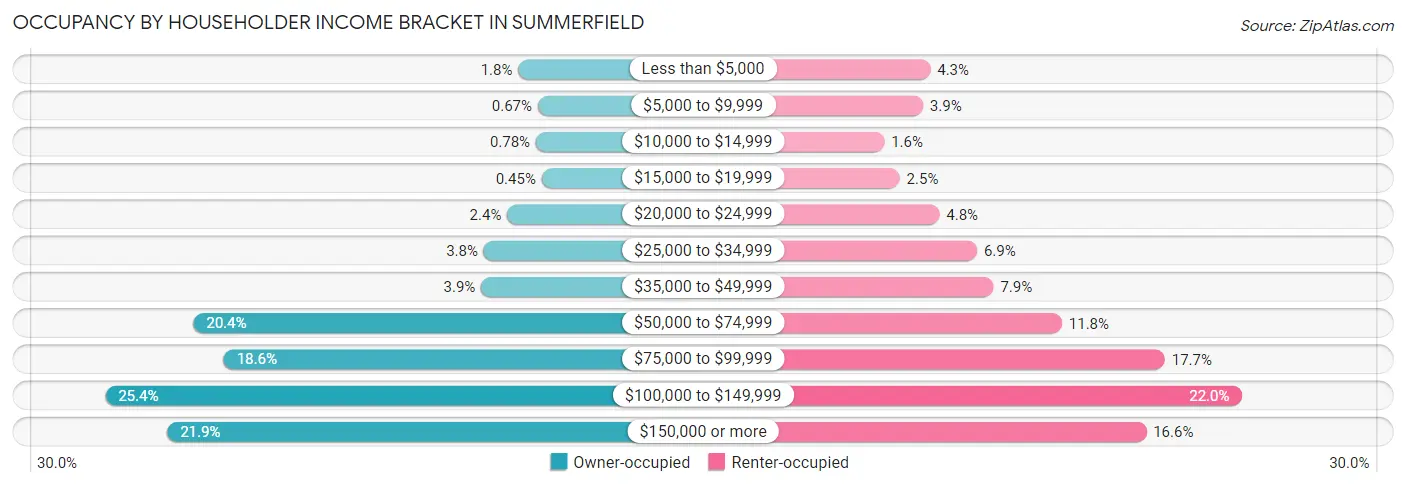
| Income Bracket | Owner-occupied | Renter-occupied |
| Less than $5,000 | 48 (1.8%) | 141 (4.3%) |
| $5,000 to $9,999 | 18 (0.7%) | 127 (3.8%) |
| $10,000 to $14,999 | 21 (0.8%) | 54 (1.6%) |
| $15,000 to $19,999 | 12 (0.4%) | 83 (2.5%) |
| $20,000 to $24,999 | 65 (2.4%) | 158 (4.8%) |
| $25,000 to $34,999 | 101 (3.8%) | 229 (6.9%) |
| $35,000 to $49,999 | 105 (3.9%) | 260 (7.9%) |
| $50,000 to $74,999 | 547 (20.4%) | 389 (11.8%) |
| $75,000 to $99,999 | 500 (18.6%) | 583 (17.7%) |
| $100,000 to $149,999 | 682 (25.4%) | 727 (22.0%) |
| $150,000 or more | 587 (21.8%) | 548 (16.6%) |
| Total | 2,686 (100.0%) | 3,299 (100.0%) |
Monthly Housing Cost Tiers in Summerfield
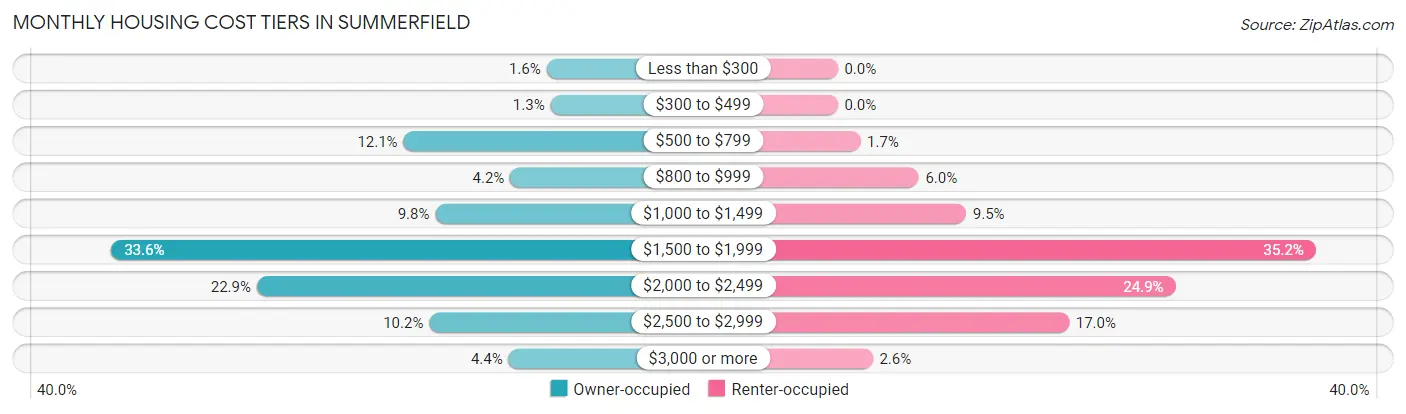
| Monthly Cost | Owner-occupied | Renter-occupied |
| Less than $300 | 42 (1.6%) | 0 (0.0%) |
| $300 to $499 | 34 (1.3%) | 0 (0.0%) |
| $500 to $799 | 325 (12.1%) | 55 (1.7%) |
| $800 to $999 | 114 (4.2%) | 197 (6.0%) |
| $1,000 to $1,499 | 262 (9.8%) | 312 (9.5%) |
| $1,500 to $1,999 | 903 (33.6%) | 1,162 (35.2%) |
| $2,000 to $2,499 | 615 (22.9%) | 821 (24.9%) |
| $2,500 to $2,999 | 274 (10.2%) | 562 (17.0%) |
| $3,000 or more | 117 (4.4%) | 85 (2.6%) |
| Total | 2,686 (100.0%) | 3,299 (100.0%) |
Physical Housing Characteristics in Summerfield
Housing Structures in Summerfield
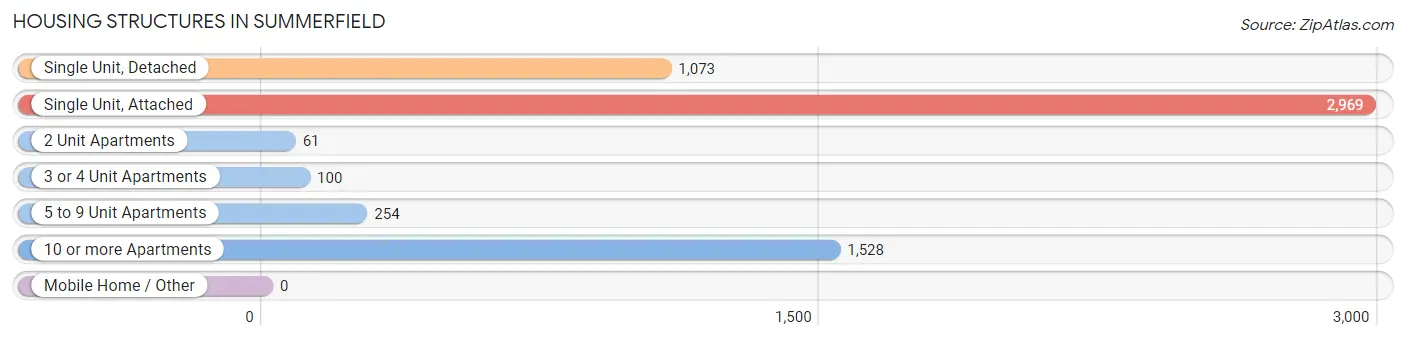
| Structure Type | # Housing Units | % Housing Units |
| Single Unit, Detached | 1,073 | 17.9% |
| Single Unit, Attached | 2,969 | 49.6% |
| 2 Unit Apartments | 61 | 1.0% |
| 3 or 4 Unit Apartments | 100 | 1.7% |
| 5 to 9 Unit Apartments | 254 | 4.2% |
| 10 or more Apartments | 1,528 | 25.5% |
| Mobile Home / Other | 0 | 0.0% |
| Total | 5,985 | 100.0% |
Housing Structures by Occupancy in Summerfield
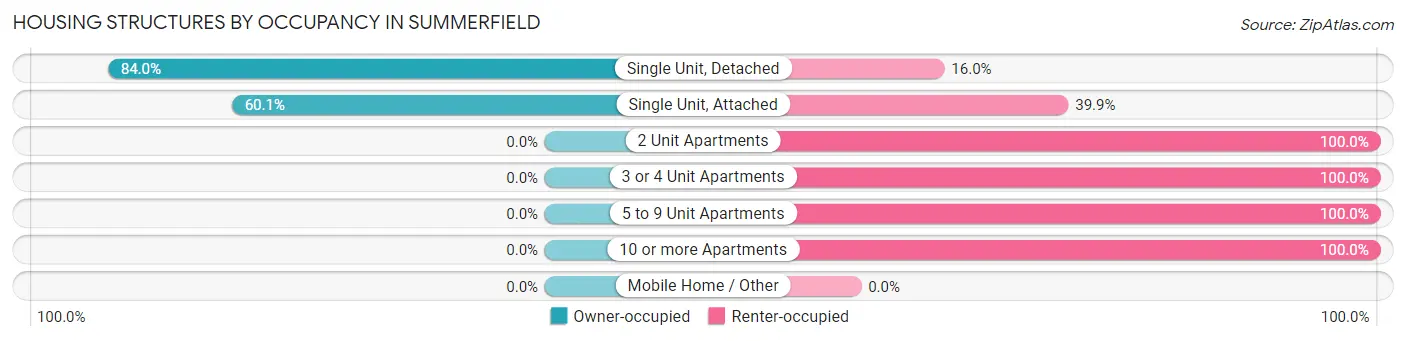
| Structure Type | Owner-occupied | Renter-occupied |
| Single Unit, Detached | 901 (84.0%) | 172 (16.0%) |
| Single Unit, Attached | 1,785 (60.1%) | 1,184 (39.9%) |
| 2 Unit Apartments | 0 (0.0%) | 61 (100.0%) |
| 3 or 4 Unit Apartments | 0 (0.0%) | 100 (100.0%) |
| 5 to 9 Unit Apartments | 0 (0.0%) | 254 (100.0%) |
| 10 or more Apartments | 0 (0.0%) | 1,528 (100.0%) |
| Mobile Home / Other | 0 (0.0%) | 0 (0.0%) |
| Total | 2,686 (44.9%) | 3,299 (55.1%) |
Housing Structures by Number of Rooms in Summerfield
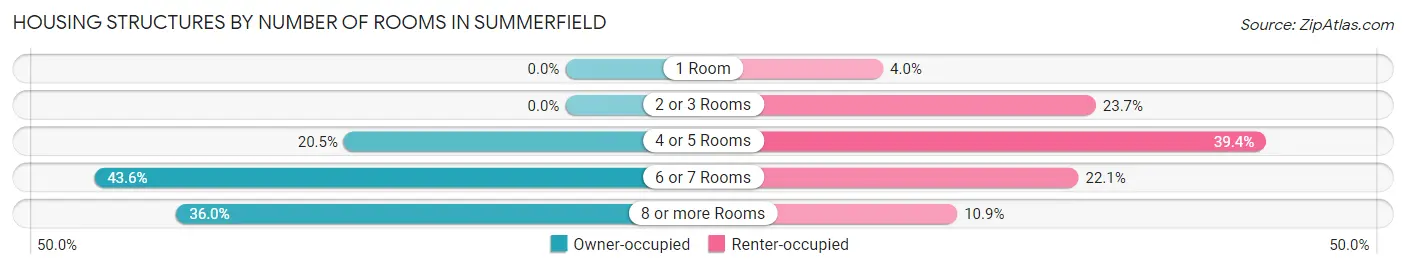
| Number of Rooms | Owner-occupied | Renter-occupied |
| 1 Room | 0 (0.0%) | 132 (4.0%) |
| 2 or 3 Rooms | 0 (0.0%) | 781 (23.7%) |
| 4 or 5 Rooms | 550 (20.5%) | 1,300 (39.4%) |
| 6 or 7 Rooms | 1,170 (43.6%) | 728 (22.1%) |
| 8 or more Rooms | 966 (36.0%) | 358 (10.8%) |
| Total | 2,686 (100.0%) | 3,299 (100.0%) |
Housing Structure by Heating Type in Summerfield
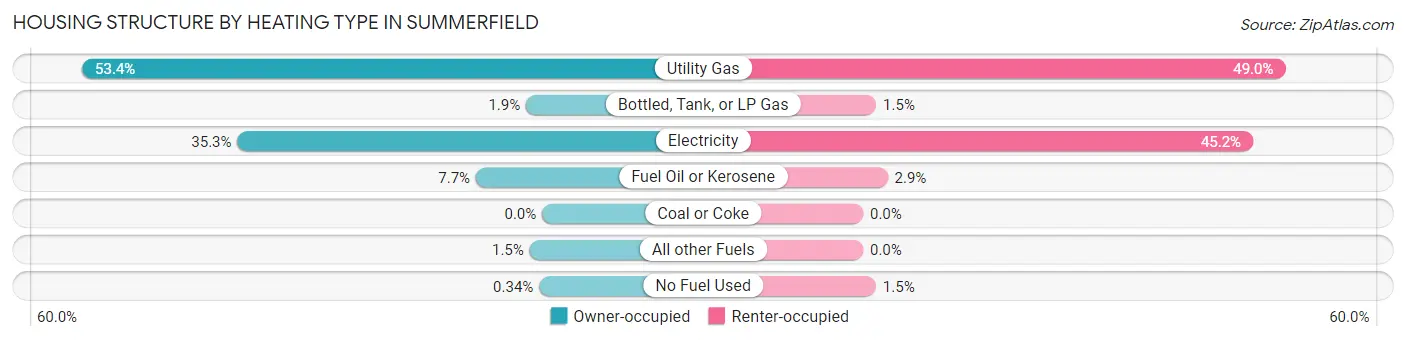
| Heating Type | Owner-occupied | Renter-occupied |
| Utility Gas | 1,433 (53.3%) | 1,615 (48.9%) |
| Bottled, Tank, or LP Gas | 50 (1.9%) | 50 (1.5%) |
| Electricity | 949 (35.3%) | 1,491 (45.2%) |
| Fuel Oil or Kerosene | 206 (7.7%) | 94 (2.9%) |
| Coal or Coke | 0 (0.0%) | 0 (0.0%) |
| All other Fuels | 39 (1.5%) | 0 (0.0%) |
| No Fuel Used | 9 (0.3%) | 49 (1.5%) |
| Total | 2,686 (100.0%) | 3,299 (100.0%) |
Household Vehicle Usage in Summerfield
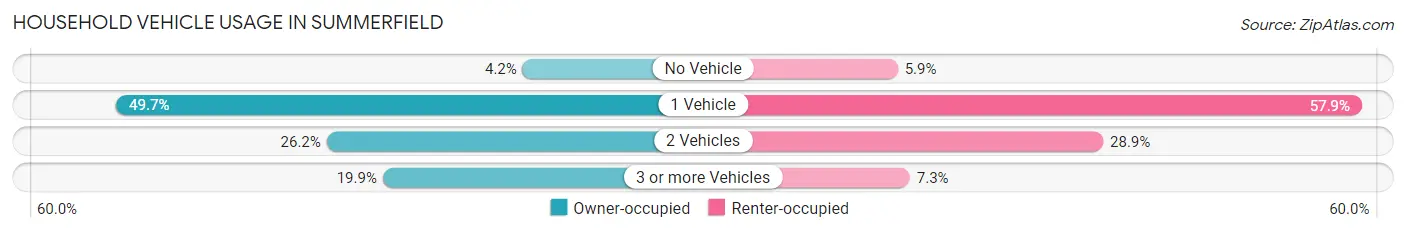
| Vehicles per Household | Owner-occupied | Renter-occupied |
| No Vehicle | 113 (4.2%) | 195 (5.9%) |
| 1 Vehicle | 1,336 (49.7%) | 1,910 (57.9%) |
| 2 Vehicles | 703 (26.2%) | 954 (28.9%) |
| 3 or more Vehicles | 534 (19.9%) | 240 (7.3%) |
| Total | 2,686 (100.0%) | 3,299 (100.0%) |
Real Estate & Mortgages in Summerfield
Real Estate and Mortgage Overview in Summerfield
| Characteristic | Without Mortgage | With Mortgage |
| Housing Units | 493 | 2,193 |
| Median Property Value | $323,400 | $322,000 |
| Median Household Income | $90,402 | $507 |
| Monthly Housing Costs | $656 | $117 |
| Real Estate Taxes | $3,509 | $103 |
Property Value by Mortgage Status in Summerfield
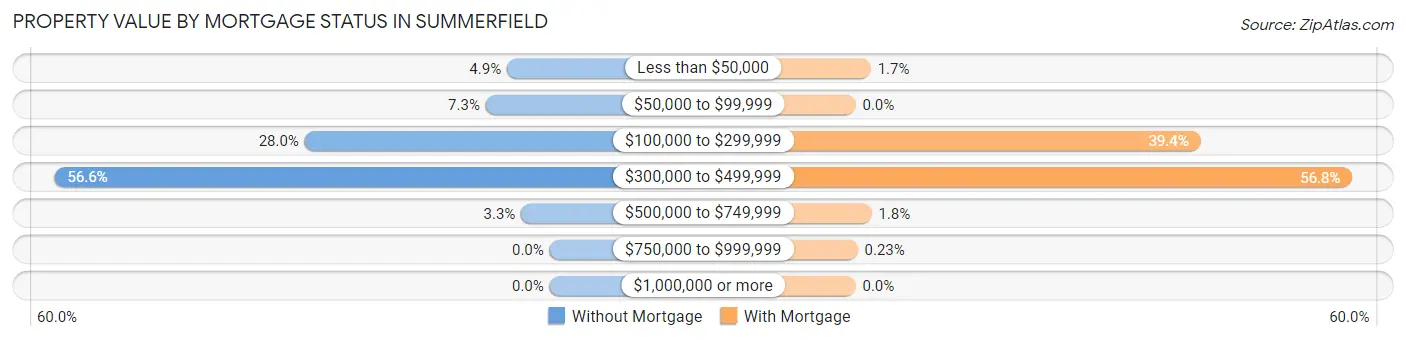
| Property Value | Without Mortgage | With Mortgage |
| Less than $50,000 | 24 (4.9%) | 38 (1.7%) |
| $50,000 to $99,999 | 36 (7.3%) | 0 (0.0%) |
| $100,000 to $299,999 | 138 (28.0%) | 865 (39.4%) |
| $300,000 to $499,999 | 279 (56.6%) | 1,245 (56.8%) |
| $500,000 to $749,999 | 16 (3.3%) | 40 (1.8%) |
| $750,000 to $999,999 | 0 (0.0%) | 5 (0.2%) |
| $1,000,000 or more | 0 (0.0%) | 0 (0.0%) |
| Total | 493 (100.0%) | 2,193 (100.0%) |
Household Income by Mortgage Status in Summerfield
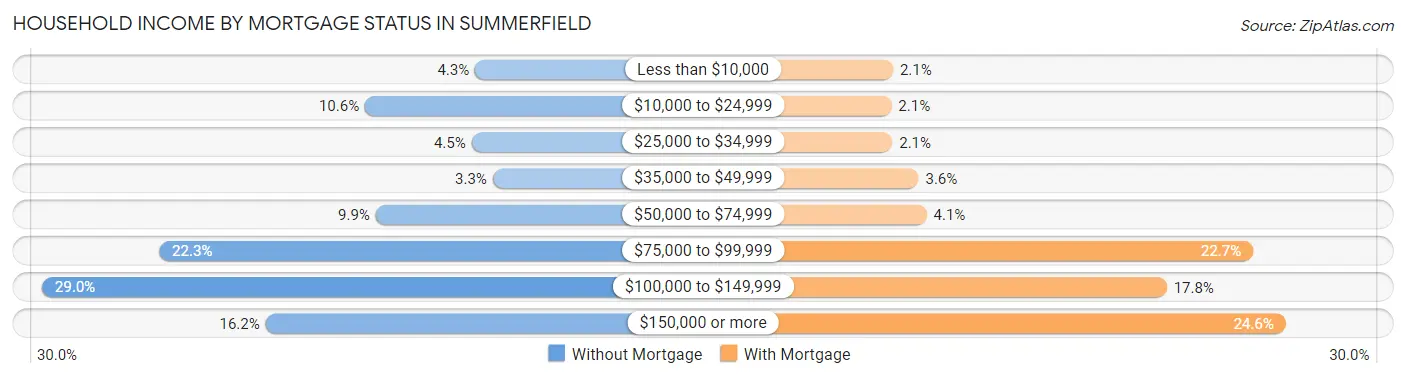
| Household Income | Without Mortgage | With Mortgage |
| Less than $10,000 | 21 (4.3%) | 47 (2.1%) |
| $10,000 to $24,999 | 52 (10.5%) | 45 (2.1%) |
| $25,000 to $34,999 | 22 (4.5%) | 46 (2.1%) |
| $35,000 to $49,999 | 16 (3.3%) | 79 (3.6%) |
| $50,000 to $74,999 | 49 (9.9%) | 89 (4.1%) |
| $75,000 to $99,999 | 110 (22.3%) | 498 (22.7%) |
| $100,000 to $149,999 | 143 (29.0%) | 390 (17.8%) |
| $150,000 or more | 80 (16.2%) | 539 (24.6%) |
| Total | 493 (100.0%) | 2,193 (100.0%) |
Property Value to Household Income Ratio in Summerfield
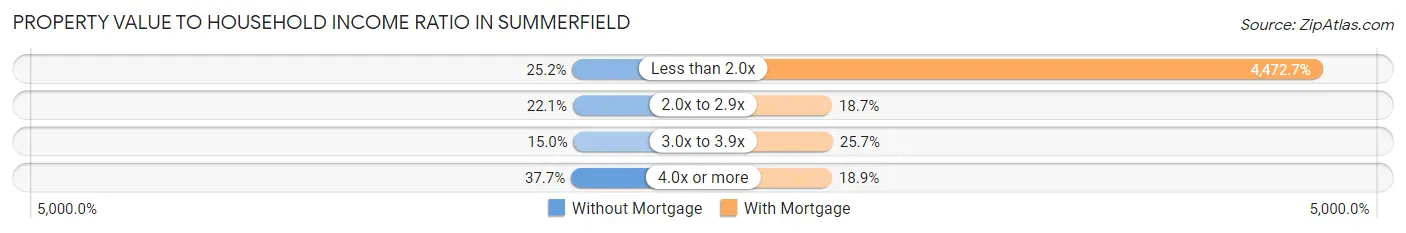
| Value-to-Income Ratio | Without Mortgage | With Mortgage |
| Less than 2.0x | 124 (25.2%) | 98,087 (4,472.7%) |
| 2.0x to 2.9x | 109 (22.1%) | 409 (18.6%) |
| 3.0x to 3.9x | 74 (15.0%) | 564 (25.7%) |
| 4.0x or more | 186 (37.7%) | 414 (18.9%) |
| Total | 493 (100.0%) | 2,193 (100.0%) |
Real Estate Taxes by Mortgage Status in Summerfield
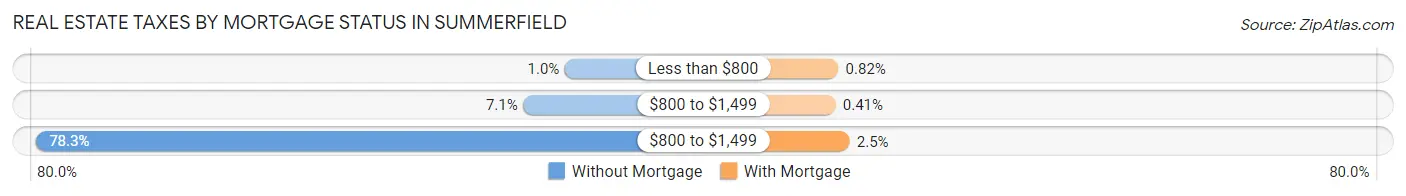
| Property Taxes | Without Mortgage | With Mortgage |
| Less than $800 | 5 (1.0%) | 18 (0.8%) |
| $800 to $1,499 | 35 (7.1%) | 9 (0.4%) |
| $800 to $1,499 | 386 (78.3%) | 54 (2.5%) |
| Total | 493 (100.0%) | 2,193 (100.0%) |
Health & Disability in Summerfield
Health Insurance Coverage by Age in Summerfield
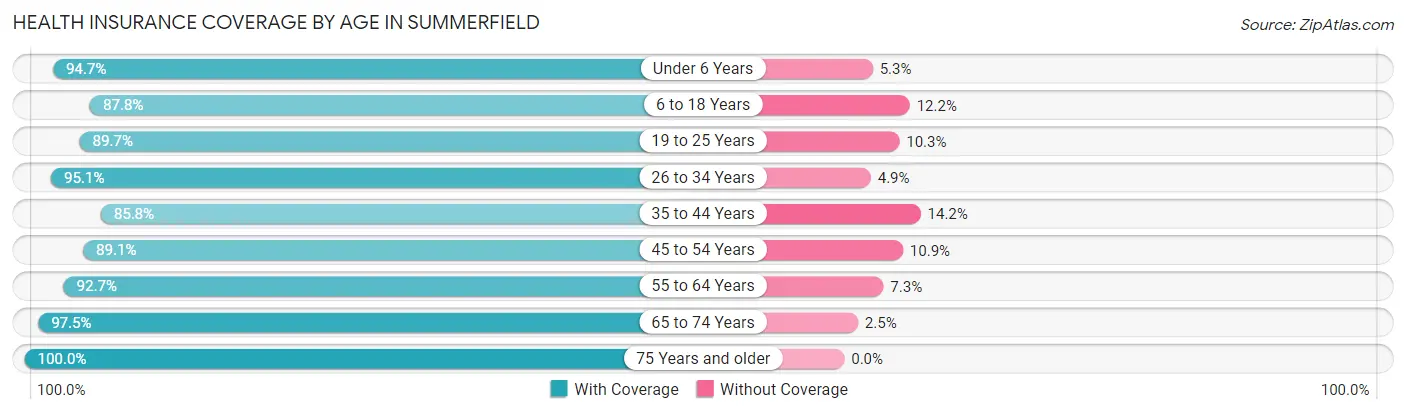
| Age Bracket | With Coverage | Without Coverage |
| Under 6 Years | 1,126 (94.7%) | 63 (5.3%) |
| 6 to 18 Years | 2,519 (87.8%) | 350 (12.2%) |
| 19 to 25 Years | 1,286 (89.7%) | 147 (10.3%) |
| 26 to 34 Years | 1,962 (95.1%) | 102 (4.9%) |
| 35 to 44 Years | 2,513 (85.8%) | 417 (14.2%) |
| 45 to 54 Years | 1,654 (89.1%) | 203 (10.9%) |
| 55 to 64 Years | 1,487 (92.7%) | 117 (7.3%) |
| 65 to 74 Years | 1,267 (97.5%) | 33 (2.5%) |
| 75 Years and older | 671 (100.0%) | 0 (0.0%) |
| Total | 14,485 (91.0%) | 1,432 (9.0%) |
Health Insurance Coverage by Citizenship Status in Summerfield
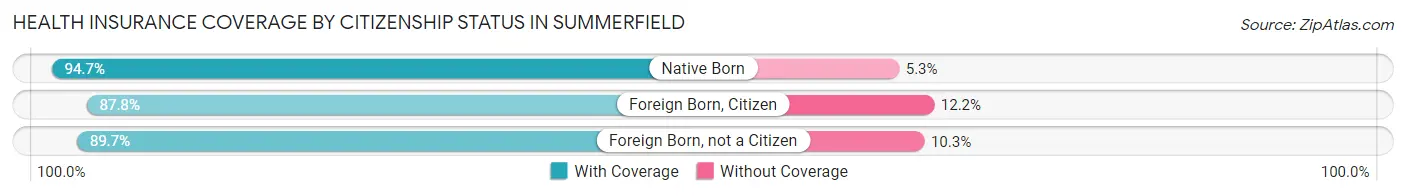
| Citizenship Status | With Coverage | Without Coverage |
| Native Born | 1,126 (94.7%) | 63 (5.3%) |
| Foreign Born, Citizen | 2,519 (87.8%) | 350 (12.2%) |
| Foreign Born, not a Citizen | 1,286 (89.7%) | 147 (10.3%) |
Health Insurance Coverage by Household Income in Summerfield
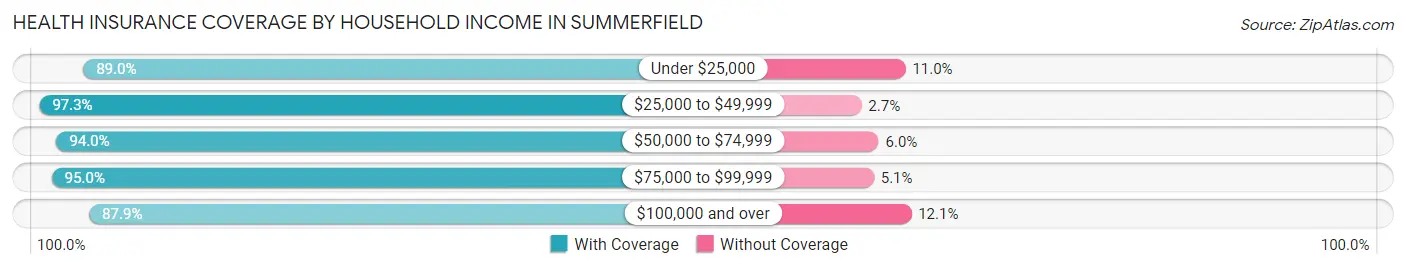
| Household Income | With Coverage | Without Coverage |
| Under $25,000 | 1,491 (89.0%) | 184 (11.0%) |
| $25,000 to $49,999 | 1,170 (97.3%) | 33 (2.7%) |
| $50,000 to $74,999 | 2,461 (94.0%) | 156 (6.0%) |
| $75,000 to $99,999 | 2,709 (95.0%) | 144 (5.1%) |
| $100,000 and over | 6,645 (87.9%) | 912 (12.1%) |
Public vs Private Health Insurance Coverage by Age in Summerfield
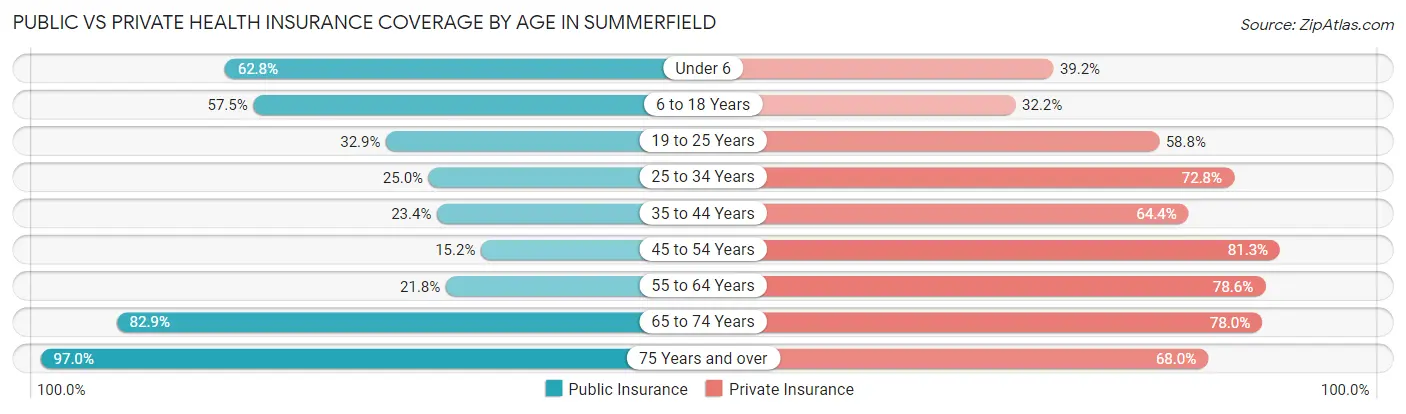
| Age Bracket | Public Insurance | Private Insurance |
| Under 6 | 747 (62.8%) | 466 (39.2%) |
| 6 to 18 Years | 1,650 (57.5%) | 923 (32.2%) |
| 19 to 25 Years | 471 (32.9%) | 843 (58.8%) |
| 25 to 34 Years | 515 (24.9%) | 1,502 (72.8%) |
| 35 to 44 Years | 686 (23.4%) | 1,886 (64.4%) |
| 45 to 54 Years | 283 (15.2%) | 1,510 (81.3%) |
| 55 to 64 Years | 349 (21.8%) | 1,260 (78.5%) |
| 65 to 74 Years | 1,078 (82.9%) | 1,014 (78.0%) |
| 75 Years and over | 651 (97.0%) | 456 (68.0%) |
| Total | 6,430 (40.4%) | 9,860 (62.0%) |
Disability Status by Sex by Age in Summerfield
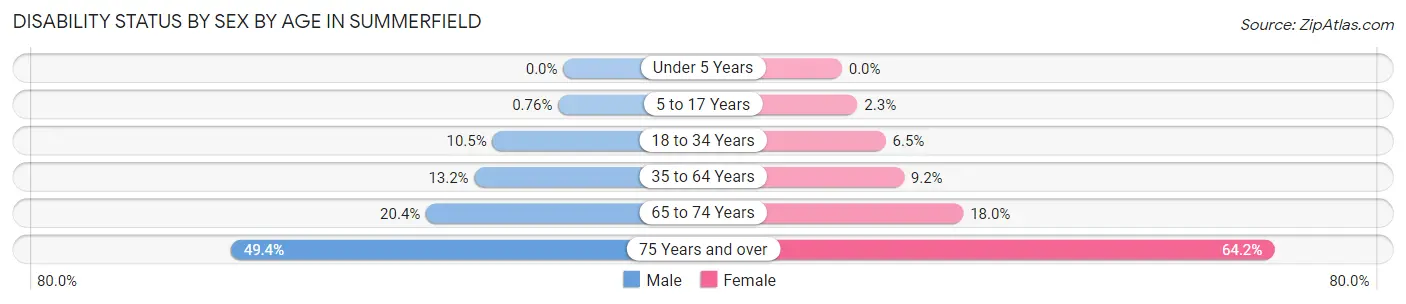
| Age Bracket | Male | Female |
| Under 5 Years | 0 (0.0%) | 0 (0.0%) |
| 5 to 17 Years | 12 (0.8%) | 30 (2.3%) |
| 18 to 34 Years | 182 (10.5%) | 128 (6.5%) |
| 35 to 64 Years | 345 (13.2%) | 348 (9.2%) |
| 65 to 74 Years | 110 (20.4%) | 137 (18.0%) |
| 75 Years and over | 119 (49.4%) | 276 (64.2%) |
Disability Class by Sex by Age in Summerfield
Disability Class: Hearing Difficulty
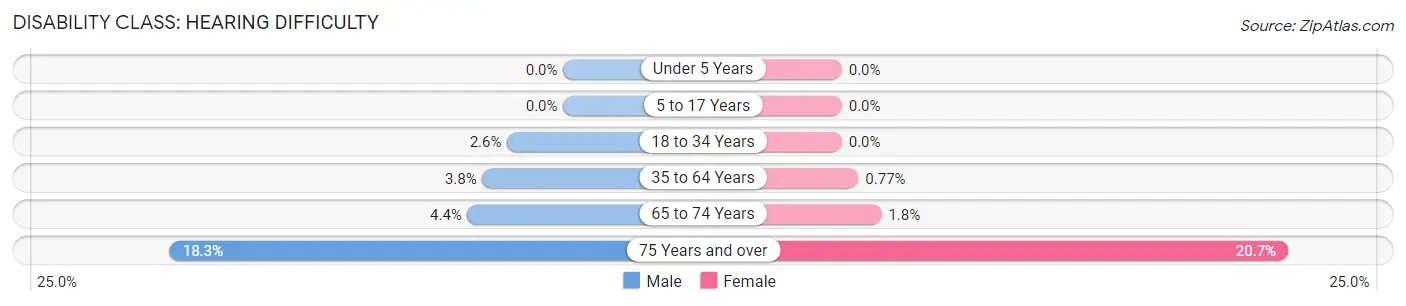
| Age Bracket | Male | Female |
| Under 5 Years | 0 (0.0%) | 0 (0.0%) |
| 5 to 17 Years | 0 (0.0%) | 0 (0.0%) |
| 18 to 34 Years | 45 (2.6%) | 0 (0.0%) |
| 35 to 64 Years | 98 (3.7%) | 29 (0.8%) |
| 65 to 74 Years | 24 (4.4%) | 14 (1.8%) |
| 75 Years and over | 44 (18.3%) | 89 (20.7%) |
Disability Class: Vision Difficulty
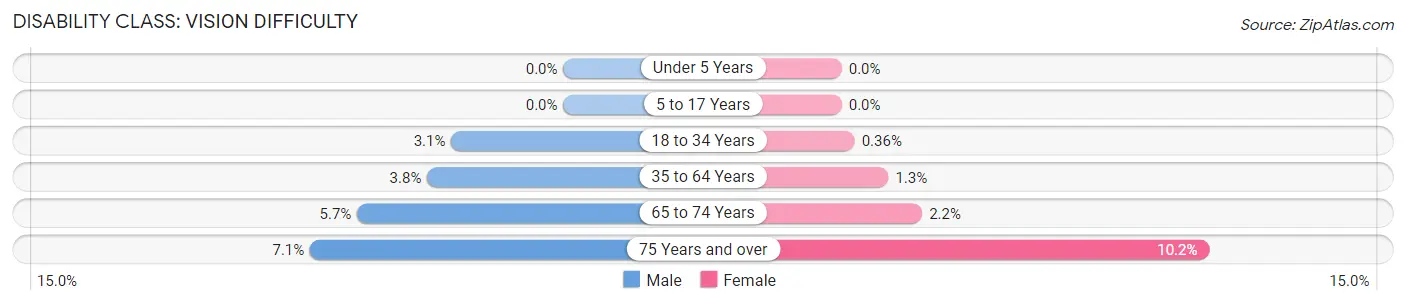
| Age Bracket | Male | Female |
| Under 5 Years | 0 (0.0%) | 0 (0.0%) |
| 5 to 17 Years | 0 (0.0%) | 0 (0.0%) |
| 18 to 34 Years | 54 (3.1%) | 7 (0.4%) |
| 35 to 64 Years | 99 (3.8%) | 49 (1.3%) |
| 65 to 74 Years | 31 (5.7%) | 17 (2.2%) |
| 75 Years and over | 17 (7.0%) | 44 (10.2%) |
Disability Class: Cognitive Difficulty
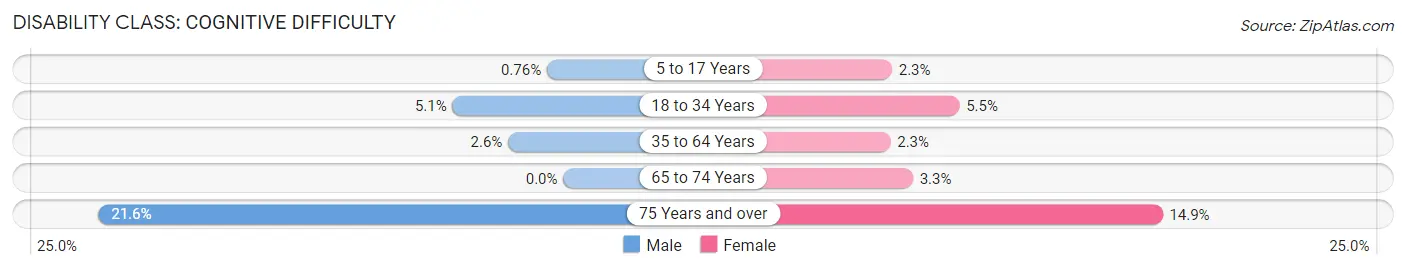
| Age Bracket | Male | Female |
| 5 to 17 Years | 12 (0.8%) | 30 (2.3%) |
| 18 to 34 Years | 89 (5.1%) | 107 (5.4%) |
| 35 to 64 Years | 67 (2.6%) | 85 (2.2%) |
| 65 to 74 Years | 0 (0.0%) | 25 (3.3%) |
| 75 Years and over | 52 (21.6%) | 64 (14.9%) |
Disability Class: Ambulatory Difficulty
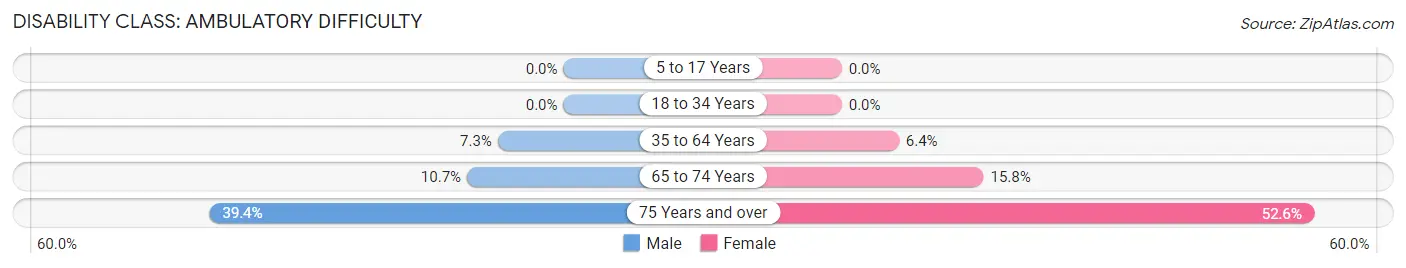
| Age Bracket | Male | Female |
| 5 to 17 Years | 0 (0.0%) | 0 (0.0%) |
| 18 to 34 Years | 0 (0.0%) | 0 (0.0%) |
| 35 to 64 Years | 191 (7.3%) | 240 (6.4%) |
| 65 to 74 Years | 58 (10.7%) | 120 (15.8%) |
| 75 Years and over | 95 (39.4%) | 226 (52.6%) |
Disability Class: Self-Care Difficulty
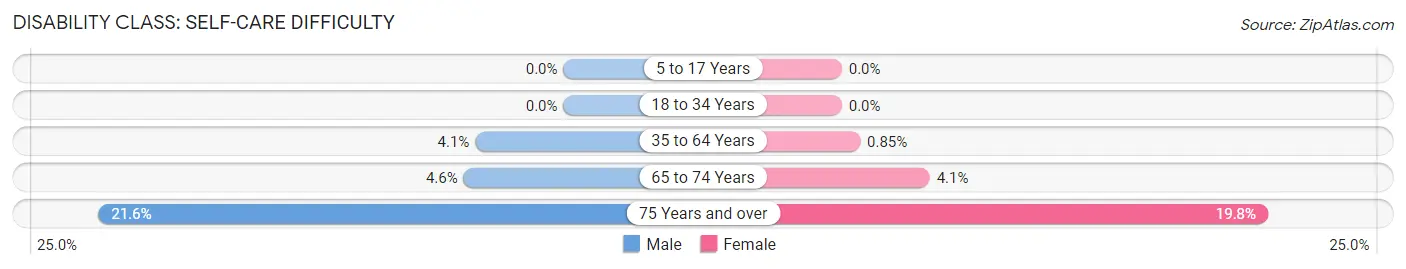
| Age Bracket | Male | Female |
| 5 to 17 Years | 0 (0.0%) | 0 (0.0%) |
| 18 to 34 Years | 0 (0.0%) | 0 (0.0%) |
| 35 to 64 Years | 107 (4.1%) | 32 (0.9%) |
| 65 to 74 Years | 25 (4.6%) | 31 (4.1%) |
| 75 Years and over | 52 (21.6%) | 85 (19.8%) |
Technology Access in Summerfield
Computing Device Access in Summerfield
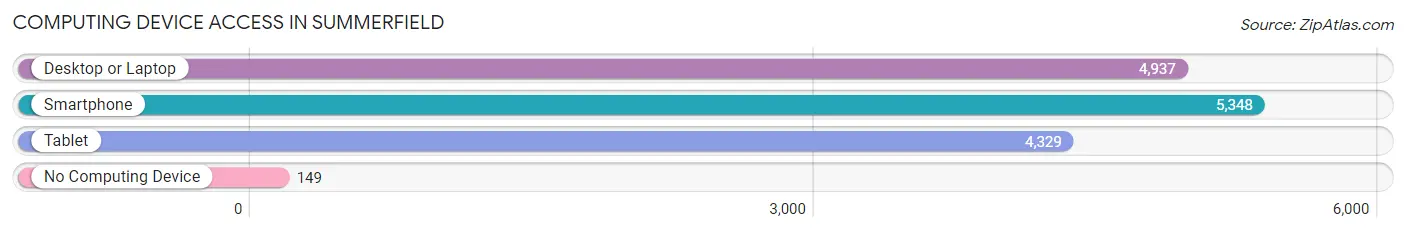
| Device Type | # Households | % Households |
| Desktop or Laptop | 4,937 | 82.5% |
| Smartphone | 5,348 | 89.4% |
| Tablet | 4,329 | 72.3% |
| No Computing Device | 149 | 2.5% |
| Total | 5,985 | 100.0% |
Internet Access in Summerfield
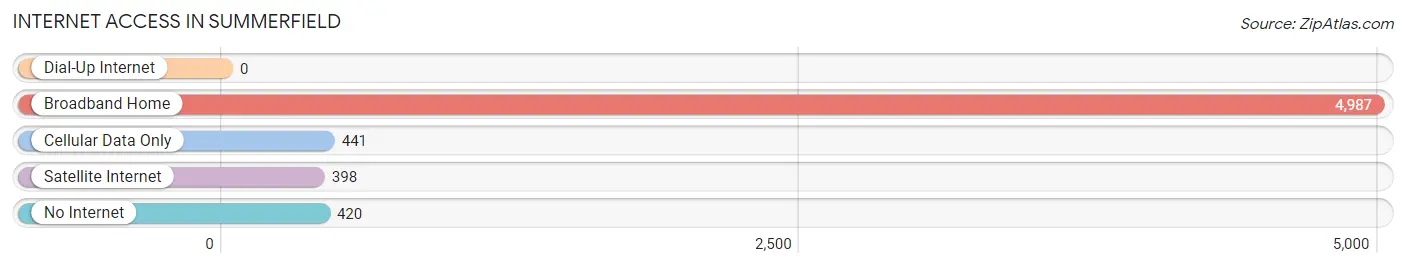
| Internet Type | # Households | % Households |
| Dial-Up Internet | 0 | 0.0% |
| Broadband Home | 4,987 | 83.3% |
| Cellular Data Only | 441 | 7.4% |
| Satellite Internet | 398 | 6.7% |
| No Internet | 420 | 7.0% |
| Total | 5,985 | 100.0% |
Summerfield Summary
Introduction
Summerfield is a small unincorporated community located in Frederick County, Maryland. It is situated in the northern part of the county, just south of the Pennsylvania border. The community is bordered by the towns of Thurmont and Emmitsburg to the north, and the city of Frederick to the south. Summerfield is a rural community with a population of approximately 1,000 people.
History
Summerfield was first settled in the late 1700s by German immigrants. The community was originally known as “Summerfield’s Crossroads” due to its location at the intersection of two major roads. The community was officially established in 1820 and was named after the Summerfield family, who were among the first settlers.
In the late 1800s, Summerfield was a thriving agricultural community. The area was known for its production of apples, peaches, and other fruits. The community also had several mills, including a grist mill, a saw mill, and a woolen mill.
In the early 1900s, Summerfield began to experience a decline in population as many of its residents moved away in search of better economic opportunities. The decline continued until the 1950s, when the community began to experience a resurgence. This was due in part to the construction of Interstate 70, which provided easy access to nearby cities such as Frederick and Baltimore.
Geography
Summerfield is located in northern Frederick County, Maryland. It is situated at the intersection of two major roads, US Route 15 and Maryland Route 77. The community is bordered by the towns of Thurmont and Emmitsburg to the north, and the city of Frederick to the south.
The terrain of Summerfield is mostly rolling hills and farmland. The area is known for its scenic views of the Catoctin Mountains to the west and the Monocacy River to the east.
Economy
The economy of Summerfield is largely based on agriculture. The area is known for its production of apples, peaches, and other fruits. There are also several small businesses in the community, including a grocery store, a hardware store, and a gas station.
The community is also home to several small manufacturing companies, including a furniture factory and a printing company. In addition, there are several small businesses that provide services such as landscaping and auto repair.
Demographics
As of the 2010 census, the population of Summerfield was 1,000 people. The racial makeup of the community was 94.2% White, 2.2% African American, 0.7% Asian, 0.3% Native American, and 2.6% from other races. The median household income was $50,000, and the median age was 40 years.
Conclusion
Summerfield is a small unincorporated community located in Frederick County, Maryland. It is a rural community with a population of approximately 1,000 people. The economy of Summerfield is largely based on agriculture, and the area is known for its production of apples, peaches, and other fruits. The racial makeup of the community is 94.2% White, 2.2% African American, 0.7% Asian, 0.3% Native American, and 2.6% from other races. The median household income was $50,000, and the median age was 40 years.
Common Questions
What is Per Capita Income in Summerfield?
Per Capita income in Summerfield is $39,397.
What is the Median Family Income in Summerfield?
Median Family Income in Summerfield is $98,729.
What is the Median Household income in Summerfield?
Median Household Income in Summerfield is $90,904.
What is Income or Wage Gap in Summerfield?
Income or Wage Gap in Summerfield is 18.9%.
Women in Summerfield earn 81.1 cents for every dollar earned by a man.
What is Inequality or Gini Index in Summerfield?
Inequality or Gini Index in Summerfield is 0.37.
What is the Total Population of Summerfield?
Total Population of Summerfield is 15,940.
What is the Total Male Population of Summerfield?
Total Male Population of Summerfield is 7,038.
What is the Total Female Population of Summerfield?
Total Female Population of Summerfield is 8,902.
What is the Ratio of Males per 100 Females in Summerfield?
There are 79.06 Males per 100 Females in Summerfield.
What is the Ratio of Females per 100 Males in Summerfield?
There are 126.48 Females per 100 Males in Summerfield.
What is the Median Population Age in Summerfield?
Median Population Age in Summerfield is 37.2 Years.
What is the Average Family Size in Summerfield
Average Family Size in Summerfield is 3.5 People.
What is the Average Household Size in Summerfield
Average Household Size in Summerfield is 2.7 People.
How Large is the Labor Force in Summerfield?
There are 9,252 People in the Labor Forcein in Summerfield.
What is the Percentage of People in the Labor Force in Summerfield?
74.3% of People are in the Labor Force in Summerfield.
What is the Unemployment Rate in Summerfield?
Unemployment Rate in Summerfield is 6.6%.