Vacaville, CA Map & Demographics
Vacaville Map
Vacaville Overview
$44,147
PER CAPITA INCOME
$119,327
AVG FAMILY INCOME
$106,764
AVG HOUSEHOLD INCOME
24.5%
WAGE / INCOME GAP [ % ]
75.5¢/ $1
WAGE / INCOME GAP [ $ ]
$11,224
FAMILY INCOME DEFICIT
0.39
INEQUALITY / GINI INDEX
101,631
TOTAL POPULATION
52,713
MALE POPULATION
48,918
FEMALE POPULATION
107.76
MALES / 100 FEMALES
92.80
FEMALES / 100 MALES
37.3
MEDIAN AGE
3.3
AVG FAMILY SIZE
2.8
AVG HOUSEHOLD SIZE
49,935
LABOR FORCE [ PEOPLE ]
61.5%
PERCENT IN LABOR FORCE
5.4%
UNEMPLOYMENT RATE
Vacaville Area Codes
Income in Vacaville
Income Overview in Vacaville
Per Capita Income in Vacaville is $44,147, while median incomes of families and households are $119,327 and $106,764 respectively.
| Characteristic | Number | Measure |
| Per Capita Income | 101,631 | $44,147 |
| Median Family Income | 24,566 | $119,327 |
| Mean Family Income | 24,566 | $143,075 |
| Median Household Income | 33,723 | $106,764 |
| Mean Household Income | 33,723 | $129,825 |
| Income Deficit | 24,566 | $11,224 |
| Wage / Income Gap (%) | 101,631 | 24.51% |
| Wage / Income Gap ($) | 101,631 | 75.49¢ per $1 |
| Gini / Inequality Index | 101,631 | 0.39 |
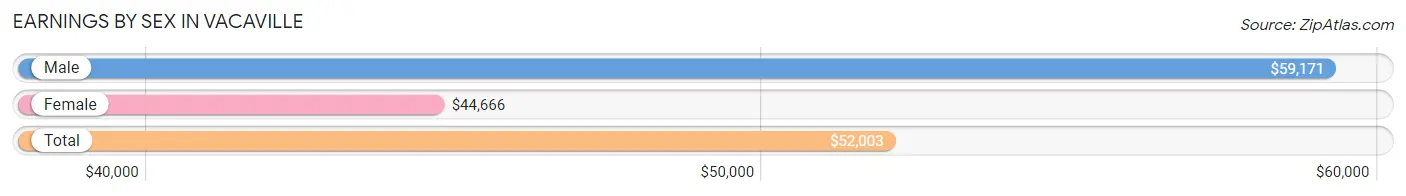
Earnings by Sex in Vacaville
Average Earnings in Vacaville are $52,003, $59,171 for men and $44,666 for women, a difference of 24.5%.
| Sex | Number | Average Earnings |
| Male | 27,088 (52.1%) | $59,171 |
| Female | 24,933 (47.9%) | $44,666 |
| Total | 52,021 (100.0%) | $52,003 |
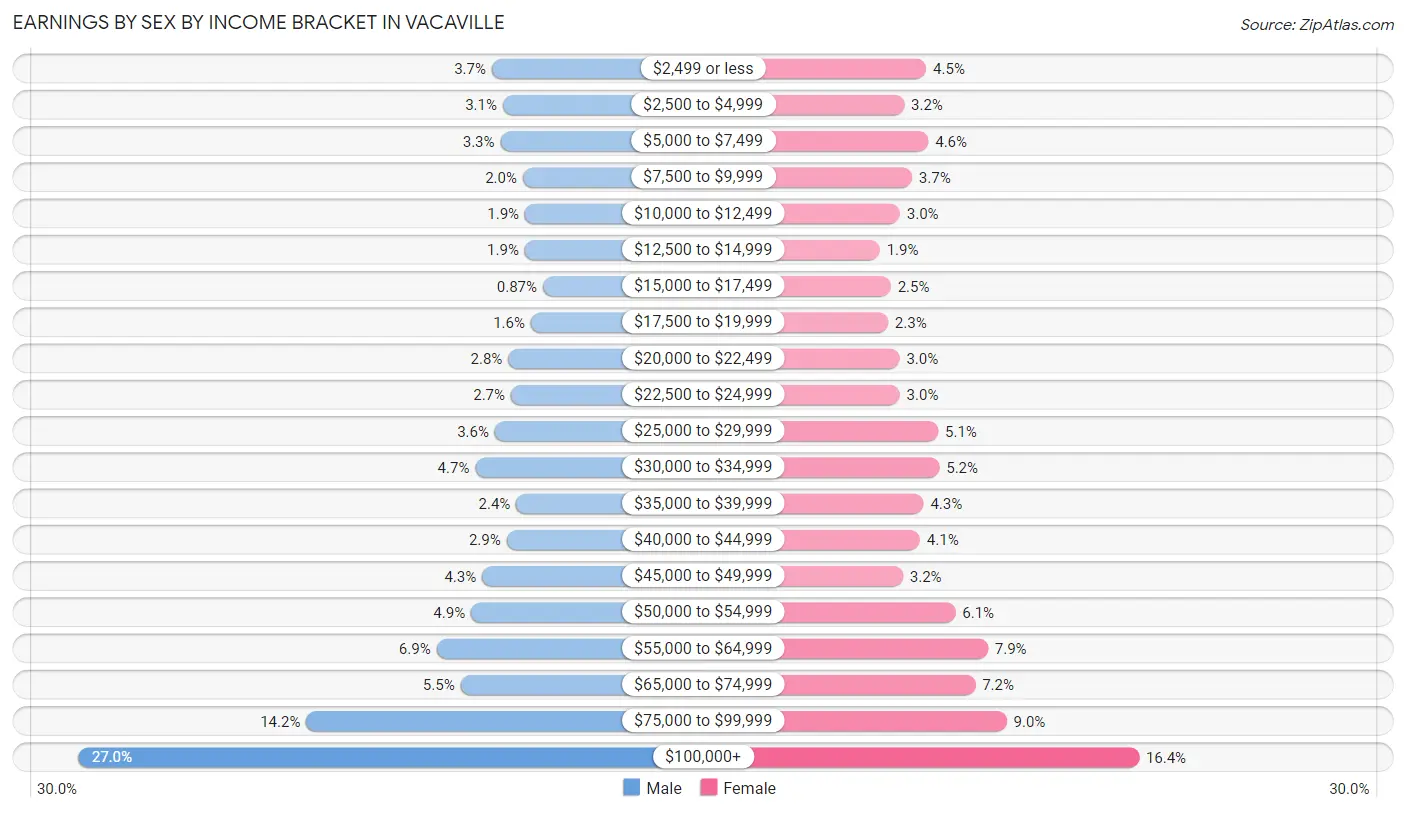
Earnings by Sex by Income Bracket in Vacaville
The most common earnings brackets in Vacaville are $100,000+ for men (7,300 | 27.0%) and $100,000+ for women (4,095 | 16.4%).
| Income | Male | Female |
| $2,499 or less | 1,012 (3.7%) | 1,111 (4.5%) |
| $2,500 to $4,999 | 845 (3.1%) | 803 (3.2%) |
| $5,000 to $7,499 | 882 (3.3%) | 1,142 (4.6%) |
| $7,500 to $9,999 | 543 (2.0%) | 913 (3.7%) |
| $10,000 to $12,499 | 508 (1.9%) | 743 (3.0%) |
| $12,500 to $14,999 | 511 (1.9%) | 461 (1.8%) |
| $15,000 to $17,499 | 237 (0.9%) | 615 (2.5%) |
| $17,500 to $19,999 | 420 (1.5%) | 577 (2.3%) |
| $20,000 to $22,499 | 763 (2.8%) | 738 (3.0%) |
| $22,500 to $24,999 | 724 (2.7%) | 741 (3.0%) |
| $25,000 to $29,999 | 966 (3.6%) | 1,279 (5.1%) |
| $30,000 to $34,999 | 1,266 (4.7%) | 1,296 (5.2%) |
| $35,000 to $39,999 | 643 (2.4%) | 1,074 (4.3%) |
| $40,000 to $44,999 | 789 (2.9%) | 1,025 (4.1%) |
| $45,000 to $49,999 | 1,163 (4.3%) | 786 (3.2%) |
| $50,000 to $54,999 | 1,331 (4.9%) | 1,520 (6.1%) |
| $55,000 to $64,999 | 1,856 (6.9%) | 1,976 (7.9%) |
| $65,000 to $74,999 | 1,490 (5.5%) | 1,800 (7.2%) |
| $75,000 to $99,999 | 3,839 (14.2%) | 2,238 (9.0%) |
| $100,000+ | 7,300 (27.0%) | 4,095 (16.4%) |
| Total | 27,088 (100.0%) | 24,933 (100.0%) |
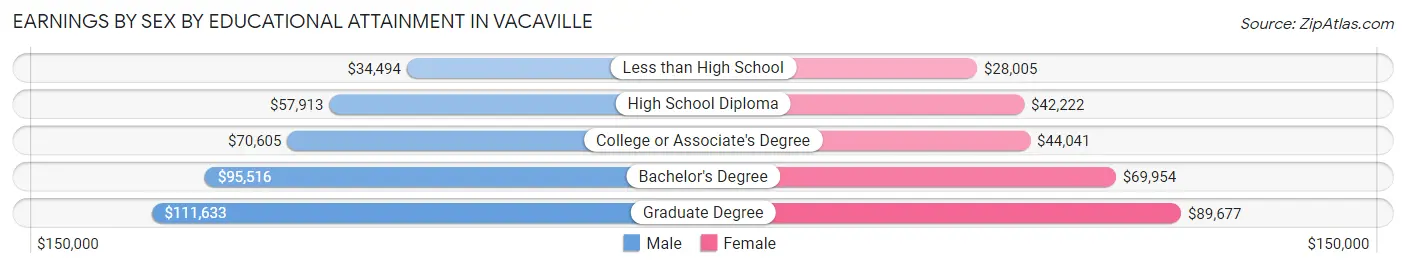
Earnings by Sex by Educational Attainment in Vacaville
Average earnings in Vacaville are $69,640 for men and $51,856 for women, a difference of 25.5%. Men with an educational attainment of graduate degree enjoy the highest average annual earnings of $111,633, while those with less than high school education earn the least with $34,494. Women with an educational attainment of graduate degree earn the most with the average annual earnings of $89,677, while those with less than high school education have the smallest earnings of $28,005.
| Educational Attainment | Male Income | Female Income |
| Less than High School | $34,494 | $28,005 |
| High School Diploma | $57,913 | $42,222 |
| College or Associate's Degree | $70,605 | $44,041 |
| Bachelor's Degree | $95,516 | $69,954 |
| Graduate Degree | $111,633 | $89,677 |
| Total | $69,640 | $51,856 |
Family Income in Vacaville
Family Income Brackets in Vacaville
According to the Vacaville family income data, there are 5,699 families falling into the $100,000 to $149,999 income range, which is the most common income bracket and makes up 23.2% of all families. Conversely, the $10,000 to $14,999 income bracket is the least frequent group with only 197 families (0.8%) belonging to this category.
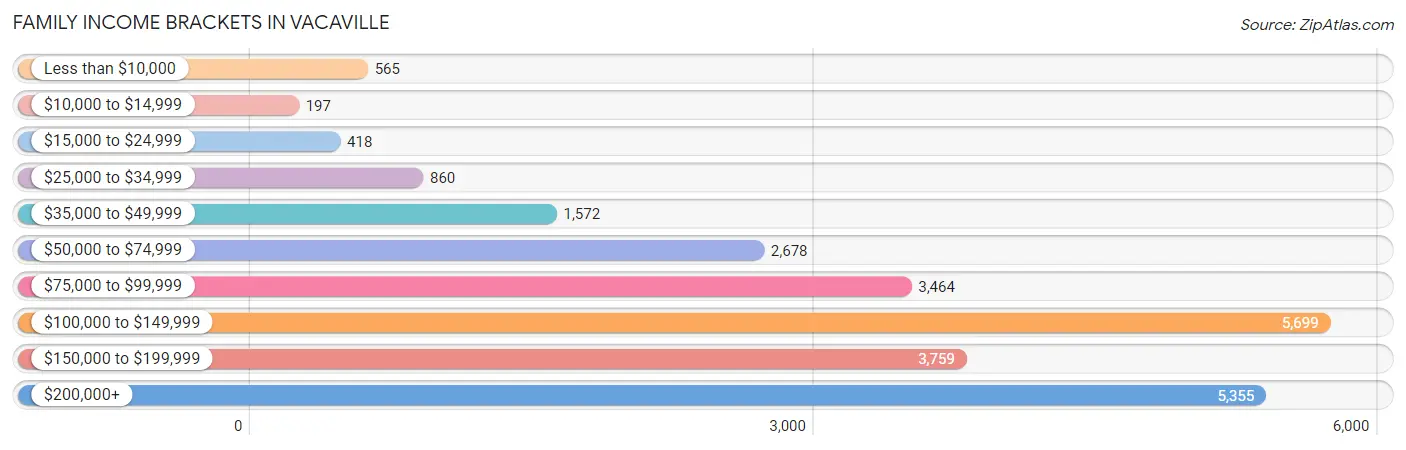
| Income Bracket | # Families | % Families |
| Less than $10,000 | 565 | 2.3% |
| $10,000 to $14,999 | 197 | 0.8% |
| $15,000 to $24,999 | 418 | 1.7% |
| $25,000 to $34,999 | 860 | 3.5% |
| $35,000 to $49,999 | 1,572 | 6.4% |
| $50,000 to $74,999 | 2,678 | 10.9% |
| $75,000 to $99,999 | 3,464 | 14.1% |
| $100,000 to $149,999 | 5,699 | 23.2% |
| $150,000 to $199,999 | 3,759 | 15.3% |
| $200,000+ | 5,355 | 21.8% |
Family Income by Famaliy Size in Vacaville
6-person families (655 | 2.7%) account for the highest median family income in Vacaville with $159,177 per family, while 2-person families (10,426 | 42.4%) have the highest median income of $52,628 per family member.
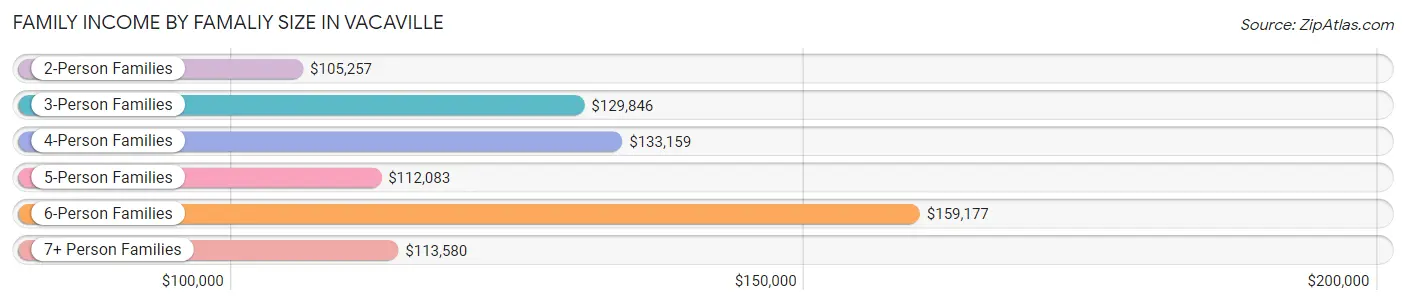
| Income Bracket | # Families | Median Income |
| 2-Person Families | 10,426 (42.4%) | $105,257 |
| 3-Person Families | 5,738 (23.4%) | $129,846 |
| 4-Person Families | 4,591 (18.7%) | $133,159 |
| 5-Person Families | 2,799 (11.4%) | $112,083 |
| 6-Person Families | 655 (2.7%) | $159,177 |
| 7+ Person Families | 357 (1.5%) | $113,580 |
| Total | 24,566 (100.0%) | $119,327 |
Family Income by Number of Earners in Vacaville
The median family income in Vacaville is $119,327, with families comprising 3+ earners (3,709) having the highest median family income of $181,513, while families with no earners (3,256) have the lowest median family income of $74,375, accounting for 15.1% and 13.3% of families, respectively.
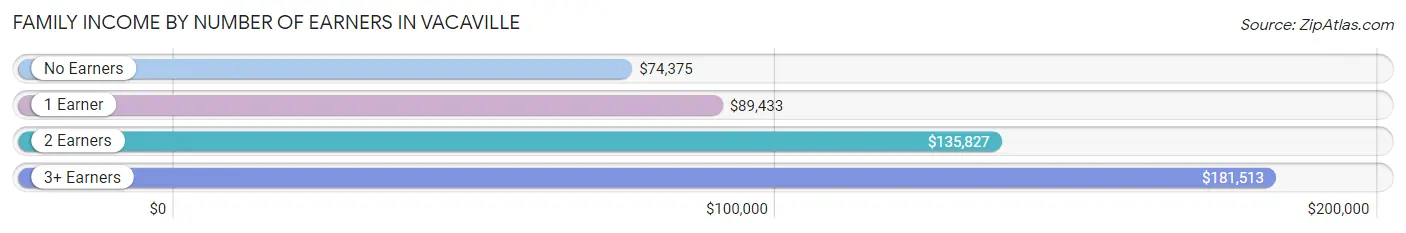
| Number of Earners | # Families | Median Income |
| No Earners | 3,256 (13.3%) | $74,375 |
| 1 Earner | 7,759 (31.6%) | $89,433 |
| 2 Earners | 9,842 (40.1%) | $135,827 |
| 3+ Earners | 3,709 (15.1%) | $181,513 |
| Total | 24,566 (100.0%) | $119,327 |
Household Income in Vacaville
Household Income Brackets in Vacaville
With 7,520 households falling in the category, the $100,000 to $149,999 income range is the most frequent in Vacaville, accounting for 22.3% of all households. In contrast, only 641 households (1.9%) fall into the $10,000 to $14,999 income bracket, making it the least populous group.
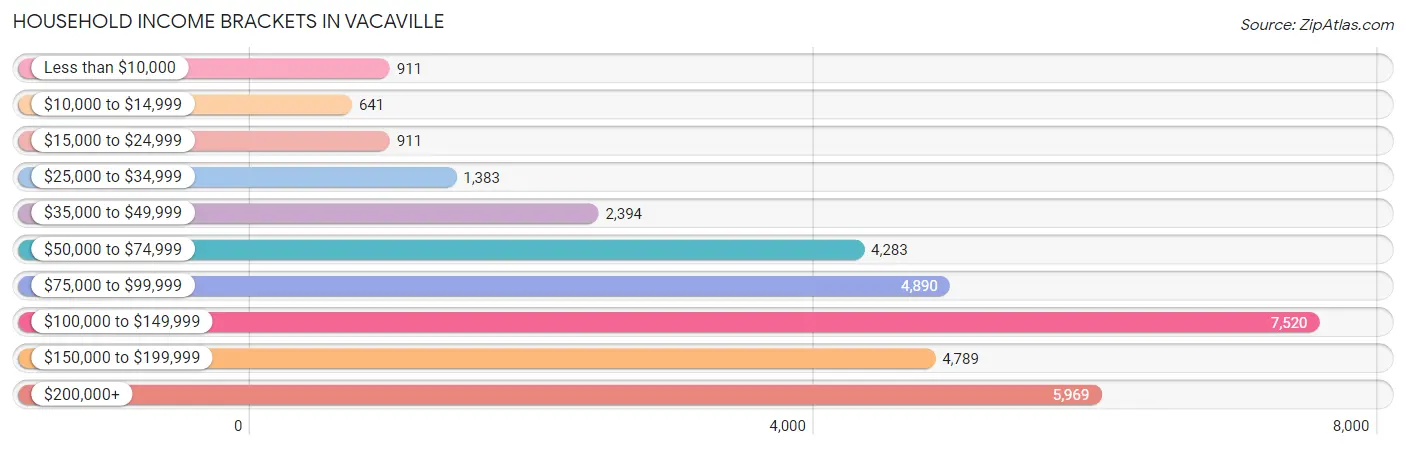
| Income Bracket | # Households | % Households |
| Less than $10,000 | 911 | 2.7% |
| $10,000 to $14,999 | 641 | 1.9% |
| $15,000 to $24,999 | 911 | 2.7% |
| $25,000 to $34,999 | 1,383 | 4.1% |
| $35,000 to $49,999 | 2,394 | 7.1% |
| $50,000 to $74,999 | 4,283 | 12.7% |
| $75,000 to $99,999 | 4,890 | 14.5% |
| $100,000 to $149,999 | 7,520 | 22.3% |
| $150,000 to $199,999 | 4,789 | 14.2% |
| $200,000+ | 5,969 | 17.7% |
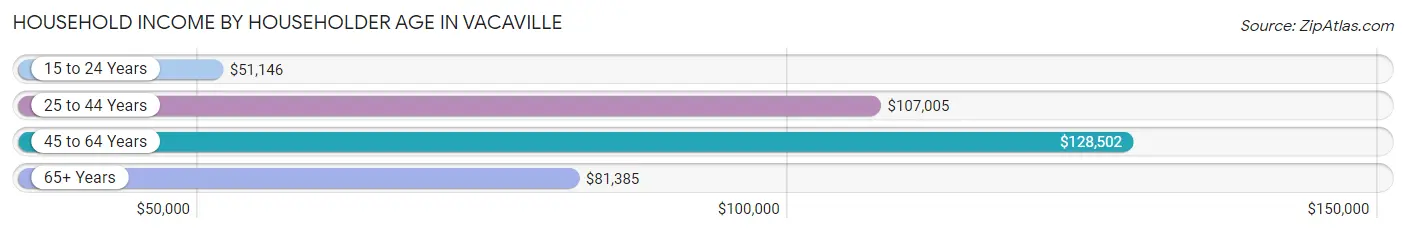
Household Income by Householder Age in Vacaville
The median household income in Vacaville is $106,764, with the highest median household income of $128,502 found in the 45 to 64 years age bracket for the primary householder. A total of 12,231 households (36.3%) fall into this category. Meanwhile, the 15 to 24 years age bracket for the primary householder has the lowest median household income of $51,146, with 595 households (1.8%) in this group.
| Income Bracket | # Households | Median Income |
| 15 to 24 Years | 595 (1.8%) | $51,146 |
| 25 to 44 Years | 12,471 (37.0%) | $107,005 |
| 45 to 64 Years | 12,231 (36.3%) | $128,502 |
| 65+ Years | 8,426 (25.0%) | $81,385 |
| Total | 33,723 (100.0%) | $106,764 |
Poverty in Vacaville
Income Below Poverty by Sex and Age in Vacaville
With 7.2% poverty level for males and 6.7% for females among the residents of Vacaville, 6 to 11 year old males and 5 year old females are the most vulnerable to poverty, with 571 males (15.7%) and 161 females (17.6%) in their respective age groups living below the poverty level.
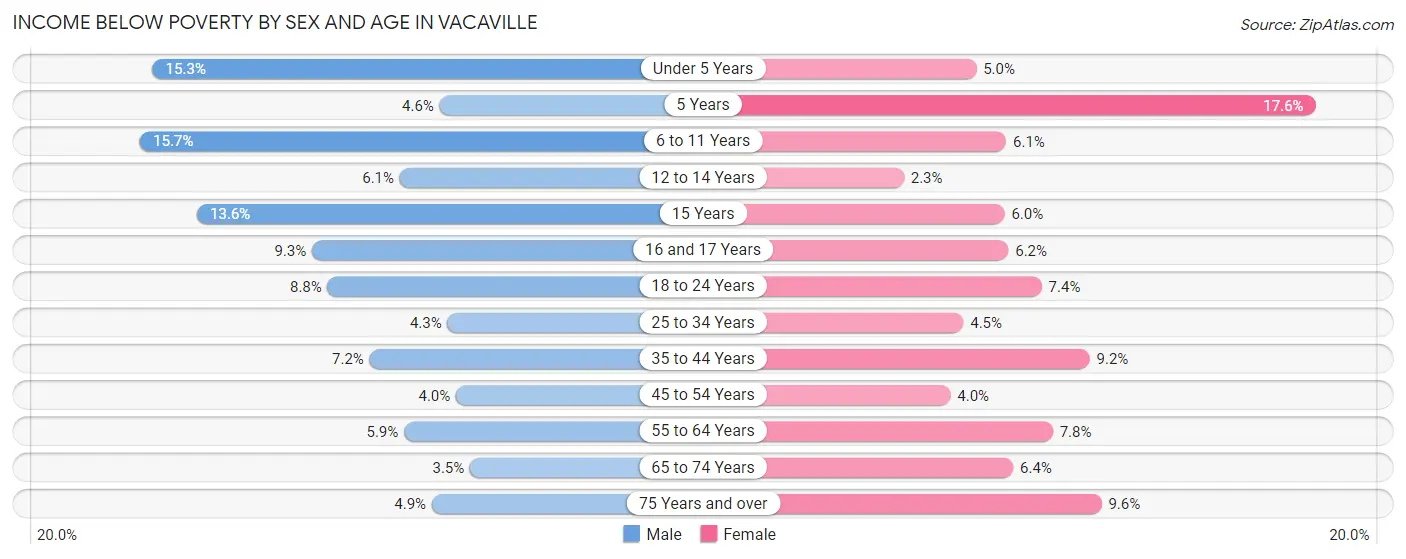
| Age Bracket | Male | Female |
| Under 5 Years | 482 (15.2%) | 139 (5.0%) |
| 5 Years | 29 (4.6%) | 161 (17.6%) |
| 6 to 11 Years | 571 (15.7%) | 247 (6.1%) |
| 12 to 14 Years | 102 (6.1%) | 43 (2.3%) |
| 15 Years | 117 (13.6%) | 33 (6.0%) |
| 16 and 17 Years | 143 (9.3%) | 54 (6.2%) |
| 18 to 24 Years | 346 (8.7%) | 311 (7.4%) |
| 25 to 34 Years | 312 (4.3%) | 336 (4.5%) |
| 35 to 44 Years | 474 (7.2%) | 625 (9.2%) |
| 45 to 54 Years | 210 (4.0%) | 210 (4.0%) |
| 55 to 64 Years | 340 (5.9%) | 494 (7.8%) |
| 65 to 74 Years | 140 (3.5%) | 295 (6.4%) |
| 75 Years and over | 110 (4.9%) | 299 (9.6%) |
| Total | 3,376 (7.2%) | 3,247 (6.7%) |
Income Above Poverty by Sex and Age in Vacaville
According to the poverty statistics in Vacaville, males aged 65 to 74 years and females aged 12 to 14 years are the age groups that are most secure financially, with 96.5% of males and 97.7% of females in these age groups living above the poverty line.
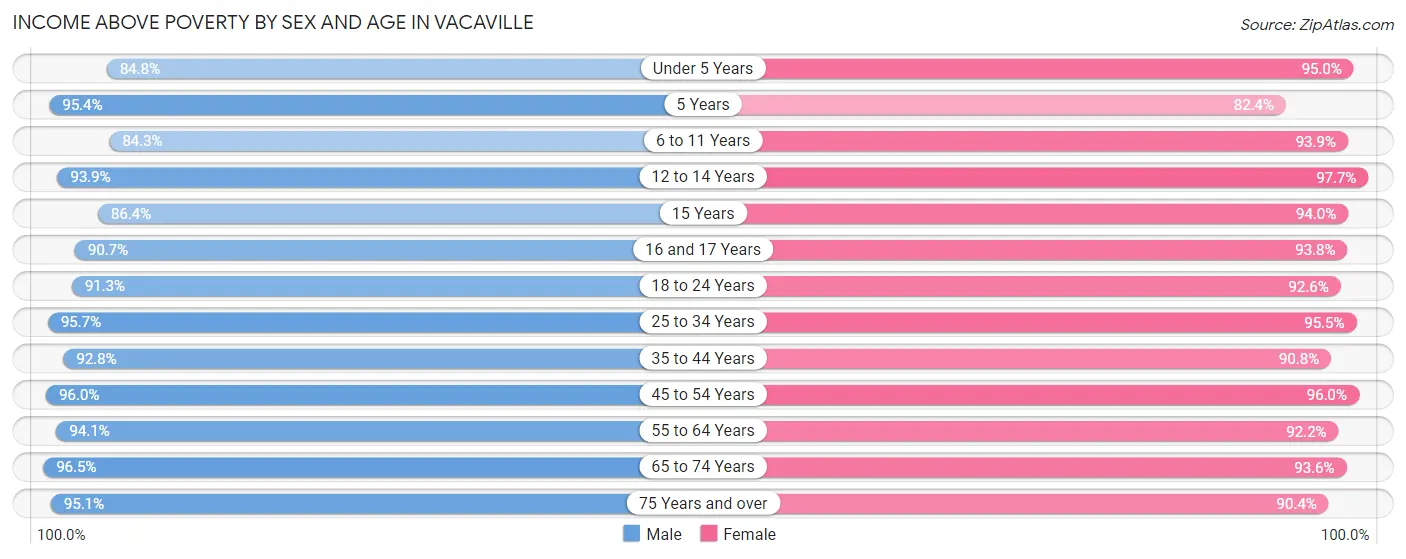
| Age Bracket | Male | Female |
| Under 5 Years | 2,679 (84.8%) | 2,648 (95.0%) |
| 5 Years | 603 (95.4%) | 755 (82.4%) |
| 6 to 11 Years | 3,064 (84.3%) | 3,804 (93.9%) |
| 12 to 14 Years | 1,579 (93.9%) | 1,827 (97.7%) |
| 15 Years | 743 (86.4%) | 513 (94.0%) |
| 16 and 17 Years | 1,390 (90.7%) | 820 (93.8%) |
| 18 to 24 Years | 3,607 (91.2%) | 3,883 (92.6%) |
| 25 to 34 Years | 6,949 (95.7%) | 7,119 (95.5%) |
| 35 to 44 Years | 6,114 (92.8%) | 6,172 (90.8%) |
| 45 to 54 Years | 5,064 (96.0%) | 5,003 (96.0%) |
| 55 to 64 Years | 5,410 (94.1%) | 5,816 (92.2%) |
| 65 to 74 Years | 3,901 (96.5%) | 4,345 (93.6%) |
| 75 Years and over | 2,142 (95.1%) | 2,803 (90.4%) |
| Total | 43,245 (92.8%) | 45,508 (93.3%) |
Income Below Poverty Among Married-Couple Families in Vacaville
The poverty statistics for married-couple families in Vacaville show that 3.0% or 555 of the total 18,308 families live below the poverty line. Families with 5 or more children have the highest poverty rate of 29.9%, comprising of 29 families. On the other hand, families with 1 or 2 children have the lowest poverty rate of 2.2%, which includes 132 families.
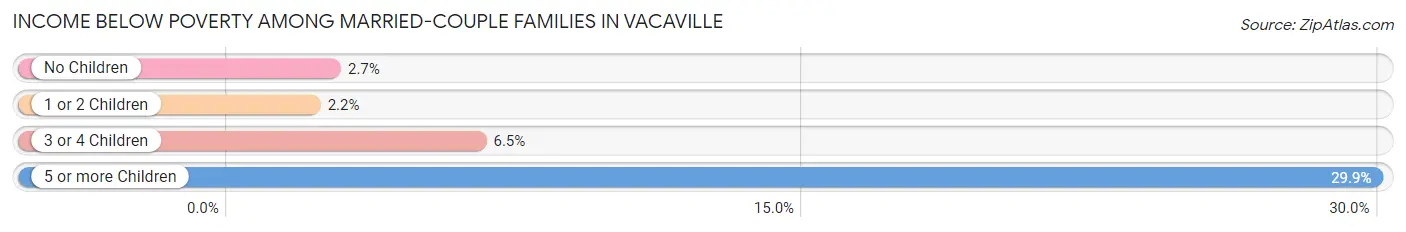
| Children | Above Poverty | Below Poverty |
| No Children | 10,029 (97.3%) | 277 (2.7%) |
| 1 or 2 Children | 5,969 (97.8%) | 132 (2.2%) |
| 3 or 4 Children | 1,687 (93.5%) | 117 (6.5%) |
| 5 or more Children | 68 (70.1%) | 29 (29.9%) |
| Total | 17,753 (97.0%) | 555 (3.0%) |
Income Below Poverty Among Single-Parent Households in Vacaville
According to the poverty data in Vacaville, 2.5% or 54 single-father households and 15.1% or 618 single-mother households are living below the poverty line. Among single-father households, those with 3 or 4 children have the highest poverty rate, with 15 households (36.6%) experiencing poverty. Likewise, among single-mother households, those with 3 or 4 children have the highest poverty rate, with 153 households (25.3%) falling below the poverty line.
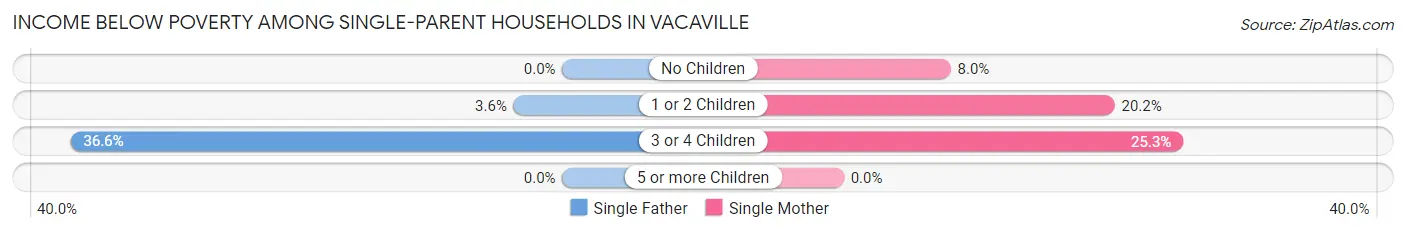
| Children | Single Father | Single Mother |
| No Children | 0 (0.0%) | 157 (8.0%) |
| 1 or 2 Children | 39 (3.6%) | 308 (20.2%) |
| 3 or 4 Children | 15 (36.6%) | 153 (25.3%) |
| 5 or more Children | 0 (0.0%) | 0 (0.0%) |
| Total | 54 (2.5%) | 618 (15.1%) |
Income Below Poverty Among Married-Couple vs Single-Parent Households in Vacaville
The poverty data for Vacaville shows that 555 of the married-couple family households (3.0%) and 672 of the single-parent households (10.7%) are living below the poverty level. Within the married-couple family households, those with 5 or more children have the highest poverty rate, with 29 households (29.9%) falling below the poverty line. Among the single-parent households, those with 3 or 4 children have the highest poverty rate, with 168 household (26.0%) living below poverty.
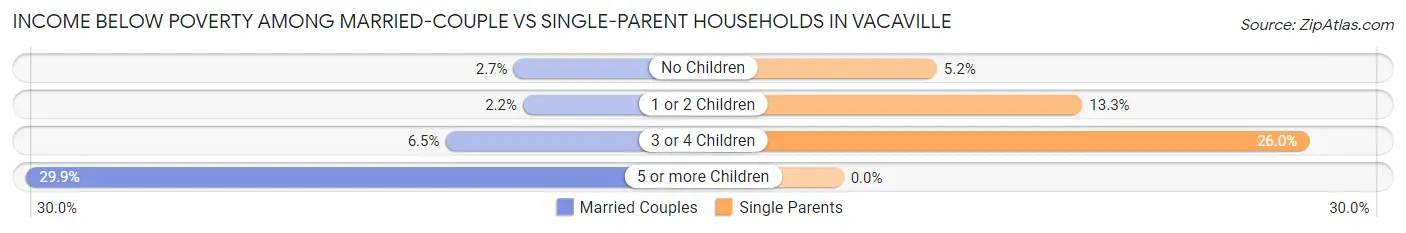
| Children | Married-Couple Families | Single-Parent Households |
| No Children | 277 (2.7%) | 157 (5.2%) |
| 1 or 2 Children | 132 (2.2%) | 347 (13.3%) |
| 3 or 4 Children | 117 (6.5%) | 168 (26.0%) |
| 5 or more Children | 29 (29.9%) | 0 (0.0%) |
| Total | 555 (3.0%) | 672 (10.7%) |
Race in Vacaville
The most populous races in Vacaville are White / Caucasian (61,879 | 60.9%), Hispanic or Latino (26,521 | 26.1%), and Two or more Races (11,808 | 11.6%).
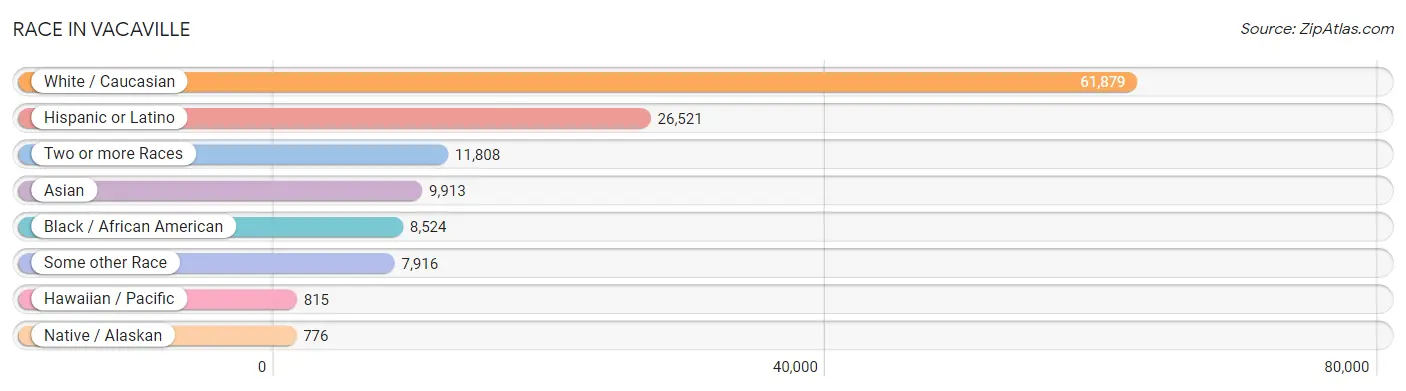
| Race | # Population | % Population |
| Asian | 9,913 | 9.8% |
| Black / African American | 8,524 | 8.4% |
| Hawaiian / Pacific | 815 | 0.8% |
| Hispanic or Latino | 26,521 | 26.1% |
| Native / Alaskan | 776 | 0.8% |
| White / Caucasian | 61,879 | 60.9% |
| Two or more Races | 11,808 | 11.6% |
| Some other Race | 7,916 | 7.8% |
| Total | 101,631 | 100.0% |
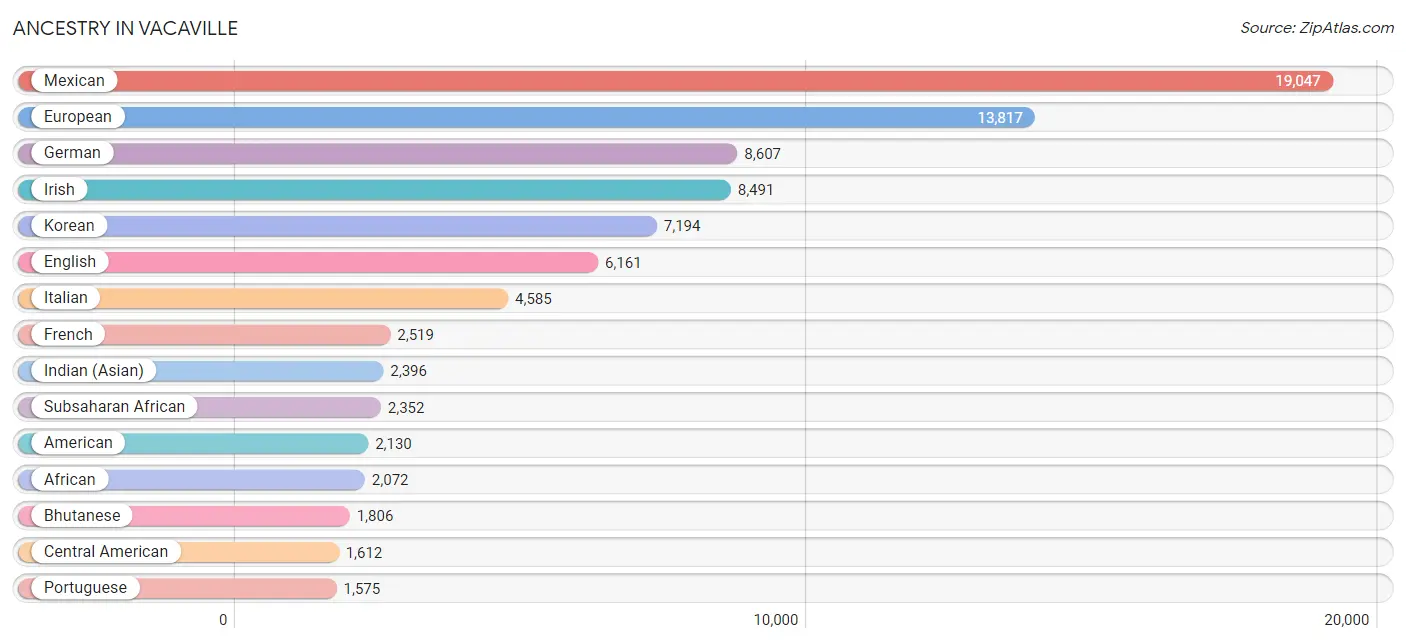
Ancestry in Vacaville
The most populous ancestries reported in Vacaville are Mexican (19,047 | 18.7%), European (13,817 | 13.6%), German (8,607 | 8.5%), Irish (8,491 | 8.4%), and Korean (7,194 | 7.1%), together accounting for 56.2% of all Vacaville residents.
| Ancestry | # Population | % Population |
| Afghan | 52 | 0.1% |
| African | 2,072 | 2.0% |
| Alaska Native | 14 | 0.0% |
| American | 2,130 | 2.1% |
| Apache | 27 | 0.0% |
| Arab | 235 | 0.2% |
| Argentinean | 28 | 0.0% |
| Armenian | 62 | 0.1% |
| Austrian | 88 | 0.1% |
| Bangladeshi | 21 | 0.0% |
| Belgian | 57 | 0.1% |
| Belizean | 48 | 0.1% |
| Bhutanese | 1,806 | 1.8% |
| Blackfeet | 126 | 0.1% |
| Bolivian | 41 | 0.0% |
| British | 575 | 0.6% |
| Burmese | 1,042 | 1.0% |
| Cajun | 41 | 0.0% |
| Canadian | 221 | 0.2% |
| Cape Verdean | 14 | 0.0% |
| Celtic | 7 | 0.0% |
| Central American | 1,612 | 1.6% |
| Central American Indian | 247 | 0.2% |
| Cherokee | 610 | 0.6% |
| Chilean | 98 | 0.1% |
| Chinese | 31 | 0.0% |
| Chippewa | 42 | 0.0% |
| Choctaw | 176 | 0.2% |
| Colombian | 129 | 0.1% |
| Costa Rican | 31 | 0.0% |
| Cree | 12 | 0.0% |
| Creek | 56 | 0.1% |
| Croatian | 65 | 0.1% |
| Cuban | 432 | 0.4% |
| Czech | 72 | 0.1% |
| Czechoslovakian | 59 | 0.1% |
| Danish | 435 | 0.4% |
| Delaware | 128 | 0.1% |
| Dominican | 210 | 0.2% |
| Dutch | 753 | 0.7% |
| Eastern European | 129 | 0.1% |
| Ecuadorian | 5 | 0.0% |
| Egyptian | 100 | 0.1% |
| English | 6,161 | 6.1% |
| Ethiopian | 22 | 0.0% |
| European | 13,817 | 13.6% |
| Filipino | 194 | 0.2% |
| Finnish | 198 | 0.2% |
| French | 2,519 | 2.5% |
| French Canadian | 370 | 0.4% |
| German | 8,607 | 8.5% |
| Greek | 507 | 0.5% |
| Guamanian / Chamorro | 487 | 0.5% |
| Guatemalan | 409 | 0.4% |
| Guyanese | 19 | 0.0% |
| Haitian | 13 | 0.0% |
| Honduran | 47 | 0.1% |
| Hungarian | 91 | 0.1% |
| Icelander | 9 | 0.0% |
| Indian (Asian) | 2,396 | 2.4% |
| Indonesian | 35 | 0.0% |
| Iranian | 119 | 0.1% |
| Irish | 8,491 | 8.4% |
| Iroquois | 28 | 0.0% |
| Italian | 4,585 | 4.5% |
| Jamaican | 120 | 0.1% |
| Japanese | 99 | 0.1% |
| Jordanian | 73 | 0.1% |
| Kiowa | 14 | 0.0% |
| Korean | 7,194 | 7.1% |
| Laotian | 33 | 0.0% |
| Lebanese | 15 | 0.0% |
| Liberian | 62 | 0.1% |
| Lithuanian | 110 | 0.1% |
| Luxembourger | 7 | 0.0% |
| Macedonian | 32 | 0.0% |
| Malaysian | 104 | 0.1% |
| Maltese | 65 | 0.1% |
| Mexican | 19,047 | 18.7% |
| Mexican American Indian | 28 | 0.0% |
| Mongolian | 69 | 0.1% |
| Moroccan | 6 | 0.0% |
| Native Hawaiian | 563 | 0.5% |
| Navajo | 221 | 0.2% |
| Nicaraguan | 360 | 0.4% |
| Nigerian | 141 | 0.1% |
| Northern European | 224 | 0.2% |
| Norwegian | 1,180 | 1.2% |
| Osage | 57 | 0.1% |
| Pakistani | 321 | 0.3% |
| Palestinian | 15 | 0.0% |
| Panamanian | 85 | 0.1% |
| Pennsylvania German | 44 | 0.0% |
| Peruvian | 173 | 0.2% |
| Polish | 908 | 0.9% |
| Portuguese | 1,575 | 1.5% |
| Potawatomi | 9 | 0.0% |
| Pueblo | 148 | 0.2% |
| Puerto Rican | 1,163 | 1.1% |
| Romanian | 60 | 0.1% |
| Russian | 225 | 0.2% |
| Salvadoran | 668 | 0.7% |
| Samoan | 435 | 0.4% |
| Scandinavian | 415 | 0.4% |
| Scotch-Irish | 1,075 | 1.1% |
| Scottish | 1,066 | 1.1% |
| Serbian | 36 | 0.0% |
| Shoshone | 6 | 0.0% |
| Sioux | 49 | 0.1% |
| Slavic | 27 | 0.0% |
| Slovak | 17 | 0.0% |
| Slovene | 20 | 0.0% |
| Somali | 4 | 0.0% |
| South African | 25 | 0.0% |
| South American | 526 | 0.5% |
| South American Indian | 4 | 0.0% |
| Spaniard | 1,341 | 1.3% |
| Spanish | 810 | 0.8% |
| Sri Lankan | 661 | 0.6% |
| Subsaharan African | 2,352 | 2.3% |
| Swedish | 912 | 0.9% |
| Swiss | 166 | 0.2% |
| Syrian | 7 | 0.0% |
| Taiwanese | 92 | 0.1% |
| Thai | 1,054 | 1.0% |
| Ukrainian | 106 | 0.1% |
| Venezuelan | 52 | 0.1% |
| Welsh | 565 | 0.6% |
| West Indian | 35 | 0.0% |
| Yaqui | 201 | 0.2% |
| Yugoslavian | 30 | 0.0% | View All 131 Rows |
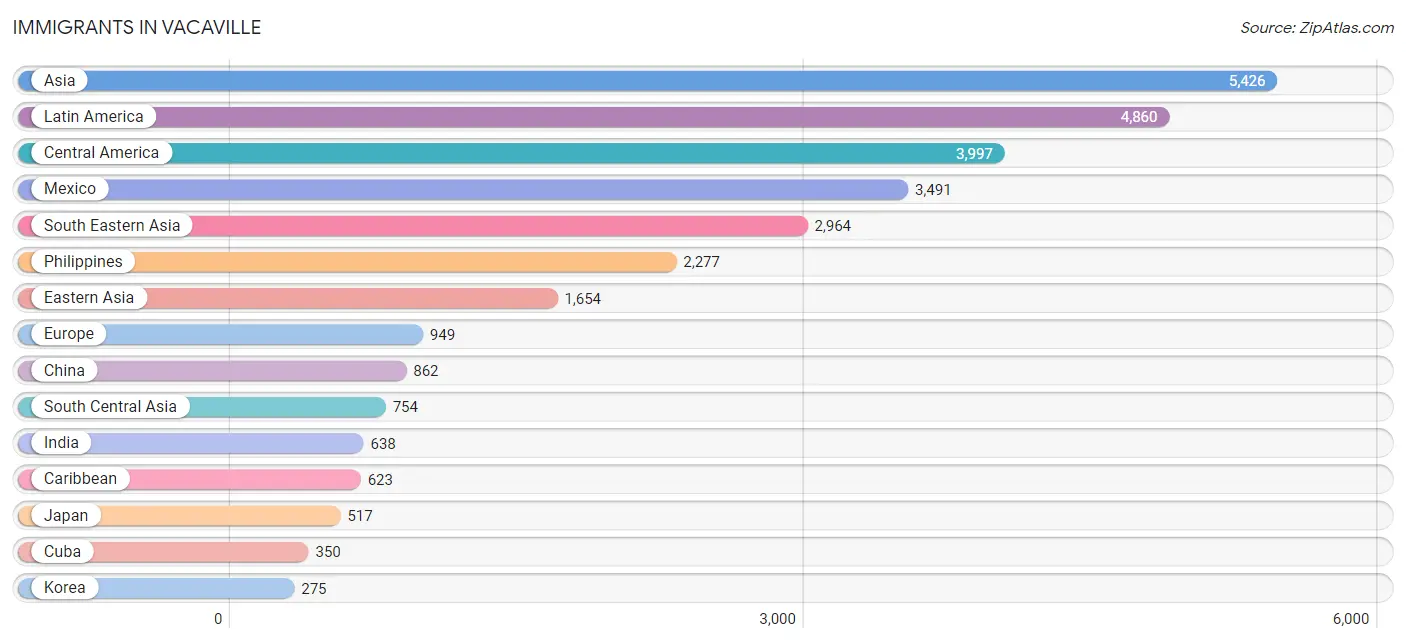
Immigrants in Vacaville
The most numerous immigrant groups reported in Vacaville came from Asia (5,426 | 5.3%), Latin America (4,860 | 4.8%), Central America (3,997 | 3.9%), Mexico (3,491 | 3.4%), and South Eastern Asia (2,964 | 2.9%), together accounting for 20.4% of all Vacaville residents.
| Immigration Origin | # Population | % Population |
| Afghanistan | 29 | 0.0% |
| Africa | 272 | 0.3% |
| Argentina | 35 | 0.0% |
| Asia | 5,426 | 5.3% |
| Australia | 9 | 0.0% |
| Azores | 72 | 0.1% |
| Brazil | 20 | 0.0% |
| Cambodia | 92 | 0.1% |
| Cameroon | 33 | 0.0% |
| Canada | 212 | 0.2% |
| Caribbean | 623 | 0.6% |
| Central America | 3,997 | 3.9% |
| China | 862 | 0.9% |
| Colombia | 66 | 0.1% |
| Costa Rica | 12 | 0.0% |
| Croatia | 14 | 0.0% |
| Cuba | 350 | 0.3% |
| Czechoslovakia | 8 | 0.0% |
| Dominica | 11 | 0.0% |
| Dominican Republic | 169 | 0.2% |
| Eastern Africa | 27 | 0.0% |
| Eastern Asia | 1,654 | 1.6% |
| Eastern Europe | 171 | 0.2% |
| Ecuador | 5 | 0.0% |
| Egypt | 31 | 0.0% |
| El Salvador | 201 | 0.2% |
| England | 107 | 0.1% |
| Eritrea | 11 | 0.0% |
| Europe | 949 | 0.9% |
| Fiji | 136 | 0.1% |
| France | 64 | 0.1% |
| Germany | 152 | 0.2% |
| Greece | 55 | 0.1% |
| Guatemala | 248 | 0.2% |
| Hong Kong | 93 | 0.1% |
| Hungary | 14 | 0.0% |
| India | 638 | 0.6% |
| Indonesia | 35 | 0.0% |
| Iran | 11 | 0.0% |
| Ireland | 62 | 0.1% |
| Israel | 7 | 0.0% |
| Italy | 71 | 0.1% |
| Jamaica | 69 | 0.1% |
| Japan | 517 | 0.5% |
| Jordan | 26 | 0.0% |
| Kazakhstan | 21 | 0.0% |
| Korea | 275 | 0.3% |
| Kuwait | 14 | 0.0% |
| Laos | 35 | 0.0% |
| Latin America | 4,860 | 4.8% |
| Lebanon | 7 | 0.0% |
| Liberia | 62 | 0.1% |
| Malaysia | 81 | 0.1% |
| Mexico | 3,491 | 3.4% |
| Middle Africa | 33 | 0.0% |
| Moldova | 8 | 0.0% |
| Nepal | 55 | 0.1% |
| Netherlands | 20 | 0.0% |
| Nicaragua | 45 | 0.0% |
| Nigeria | 104 | 0.1% |
| North Macedonia | 32 | 0.0% |
| Northern Africa | 31 | 0.0% |
| Northern Europe | 275 | 0.3% |
| Oceania | 254 | 0.3% |
| Peru | 83 | 0.1% |
| Philippines | 2,277 | 2.2% |
| Poland | 9 | 0.0% |
| Portugal | 117 | 0.1% |
| Russia | 37 | 0.0% |
| Singapore | 10 | 0.0% |
| Somalia | 16 | 0.0% |
| South Africa | 15 | 0.0% |
| South America | 240 | 0.2% |
| South Central Asia | 754 | 0.7% |
| South Eastern Asia | 2,964 | 2.9% |
| Southern Europe | 267 | 0.3% |
| Spain | 24 | 0.0% |
| Taiwan | 215 | 0.2% |
| Thailand | 168 | 0.2% |
| Ukraine | 49 | 0.1% |
| Venezuela | 22 | 0.0% |
| Vietnam | 231 | 0.2% |
| West Indies | 7 | 0.0% |
| Western Africa | 166 | 0.2% |
| Western Asia | 54 | 0.1% |
| Western Europe | 236 | 0.2% | View All 86 Rows |
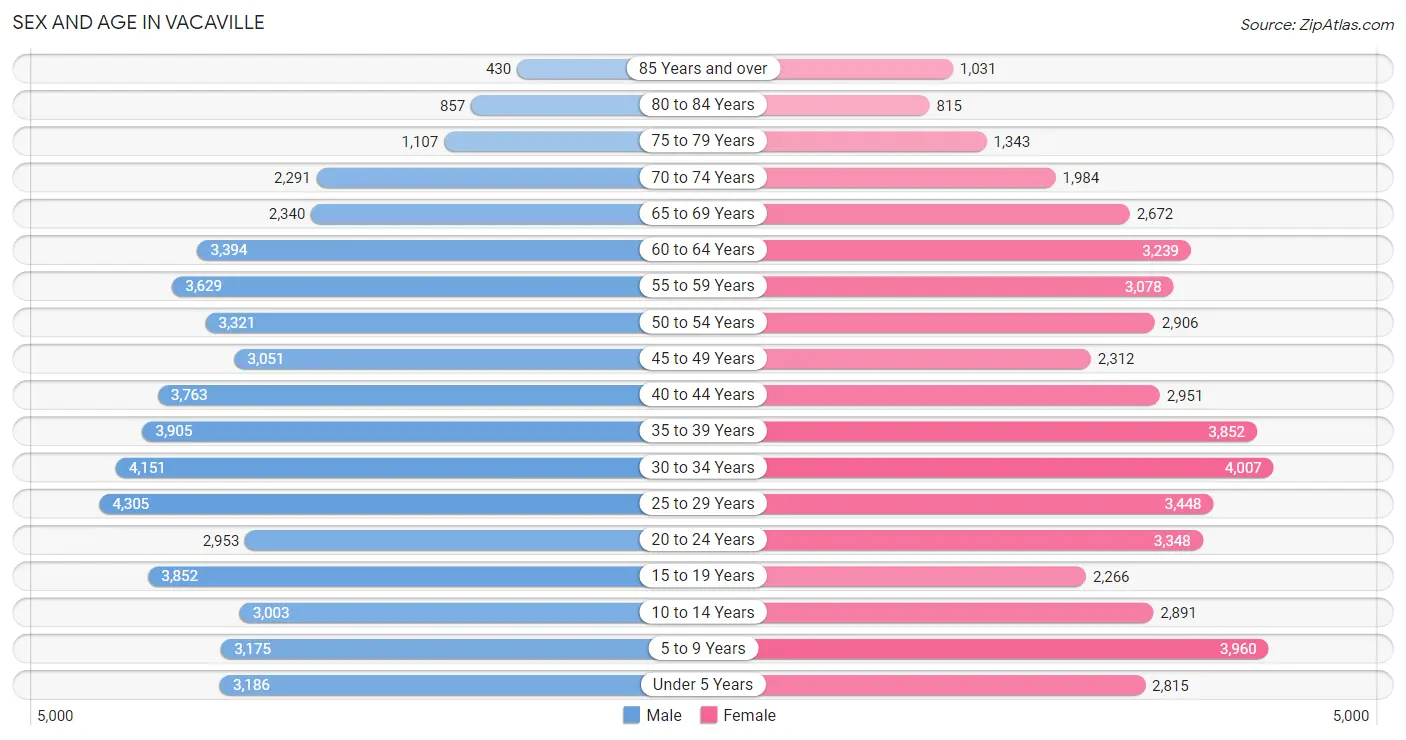
Sex and Age in Vacaville
Sex and Age in Vacaville
The most populous age groups in Vacaville are 25 to 29 Years (4,305 | 8.2%) for men and 30 to 34 Years (4,007 | 8.2%) for women.
| Age Bracket | Male | Female |
| Under 5 Years | 3,186 (6.0%) | 2,815 (5.8%) |
| 5 to 9 Years | 3,175 (6.0%) | 3,960 (8.1%) |
| 10 to 14 Years | 3,003 (5.7%) | 2,891 (5.9%) |
| 15 to 19 Years | 3,852 (7.3%) | 2,266 (4.6%) |
| 20 to 24 Years | 2,953 (5.6%) | 3,348 (6.8%) |
| 25 to 29 Years | 4,305 (8.2%) | 3,448 (7.0%) |
| 30 to 34 Years | 4,151 (7.9%) | 4,007 (8.2%) |
| 35 to 39 Years | 3,905 (7.4%) | 3,852 (7.9%) |
| 40 to 44 Years | 3,763 (7.1%) | 2,951 (6.0%) |
| 45 to 49 Years | 3,051 (5.8%) | 2,312 (4.7%) |
| 50 to 54 Years | 3,321 (6.3%) | 2,906 (5.9%) |
| 55 to 59 Years | 3,629 (6.9%) | 3,078 (6.3%) |
| 60 to 64 Years | 3,394 (6.4%) | 3,239 (6.6%) |
| 65 to 69 Years | 2,340 (4.4%) | 2,672 (5.5%) |
| 70 to 74 Years | 2,291 (4.3%) | 1,984 (4.1%) |
| 75 to 79 Years | 1,107 (2.1%) | 1,343 (2.8%) |
| 80 to 84 Years | 857 (1.6%) | 815 (1.7%) |
| 85 Years and over | 430 (0.8%) | 1,031 (2.1%) |
| Total | 52,713 (100.0%) | 48,918 (100.0%) |
Families and Households in Vacaville
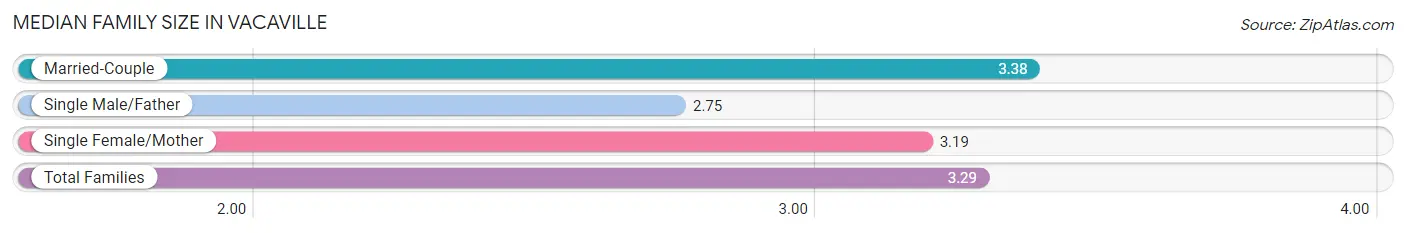
Median Family Size in Vacaville
The median family size in Vacaville is 3.29 persons per family, with married-couple families (18,308 | 74.5%) accounting for the largest median family size of 3.38 persons per family. On the other hand, single male/father families (2,157 | 8.8%) represent the smallest median family size with 2.75 persons per family.
| Family Type | # Families | Family Size |
| Married-Couple | 18,308 (74.5%) | 3.38 |
| Single Male/Father | 2,157 (8.8%) | 2.75 |
| Single Female/Mother | 4,101 (16.7%) | 3.19 |
| Total Families | 24,566 (100.0%) | 3.29 |
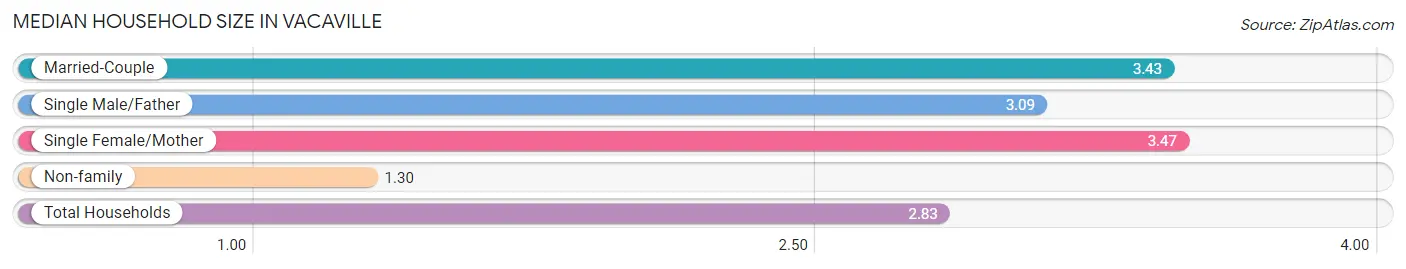
Median Household Size in Vacaville
The median household size in Vacaville is 2.83 persons per household, with single female/mother households (4,101 | 12.2%) accounting for the largest median household size of 3.47 persons per household. non-family households (9,157 | 27.2%) represent the smallest median household size with 1.30 persons per household.
| Household Type | # Households | Household Size |
| Married-Couple | 18,308 (54.3%) | 3.43 |
| Single Male/Father | 2,157 (6.4%) | 3.09 |
| Single Female/Mother | 4,101 (12.2%) | 3.47 |
| Non-family | 9,157 (27.2%) | 1.30 |
| Total Households | 33,723 (100.0%) | 2.83 |
Household Size by Marriage Status in Vacaville
Out of a total of 33,723 households in Vacaville, 24,566 (72.9%) are family households, while 9,157 (27.2%) are nonfamily households. The most numerous type of family households are 2-person households, comprising 9,377, and the most common type of nonfamily households are 1-person households, comprising 7,160.
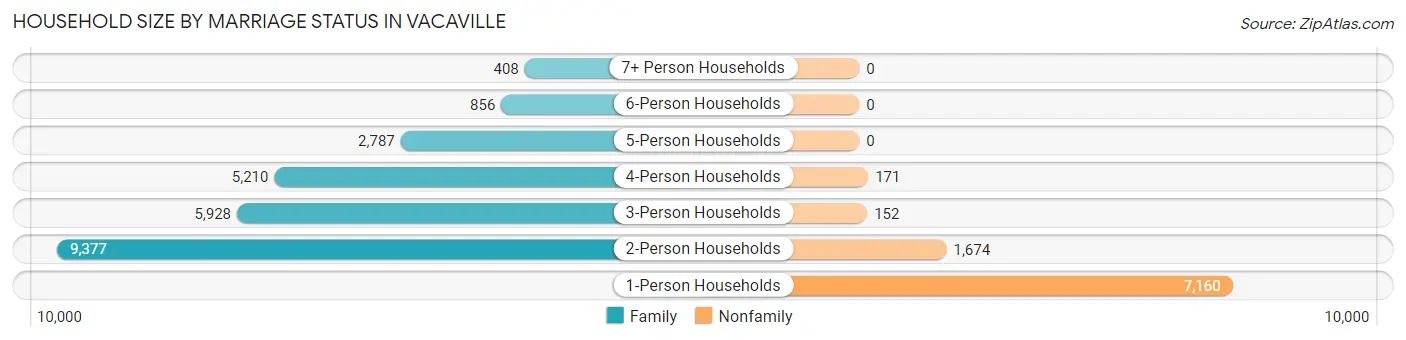
| Household Size | Family Households | Nonfamily Households |
| 1-Person Households | - | 7,160 (21.2%) |
| 2-Person Households | 9,377 (27.8%) | 1,674 (5.0%) |
| 3-Person Households | 5,928 (17.6%) | 152 (0.4%) |
| 4-Person Households | 5,210 (15.4%) | 171 (0.5%) |
| 5-Person Households | 2,787 (8.3%) | 0 (0.0%) |
| 6-Person Households | 856 (2.5%) | 0 (0.0%) |
| 7+ Person Households | 408 (1.2%) | 0 (0.0%) |
| Total | 24,566 (72.9%) | 9,157 (27.2%) |
Female Fertility in Vacaville
Fertility by Age in Vacaville
Average fertility rate in Vacaville is 62.0 births per 1,000 women. Women in the age bracket of 20 to 34 years have the highest fertility rate with 86.0 births per 1,000 women. Women in the age bracket of 20 to 34 years acount for 66.4% of all women with births.
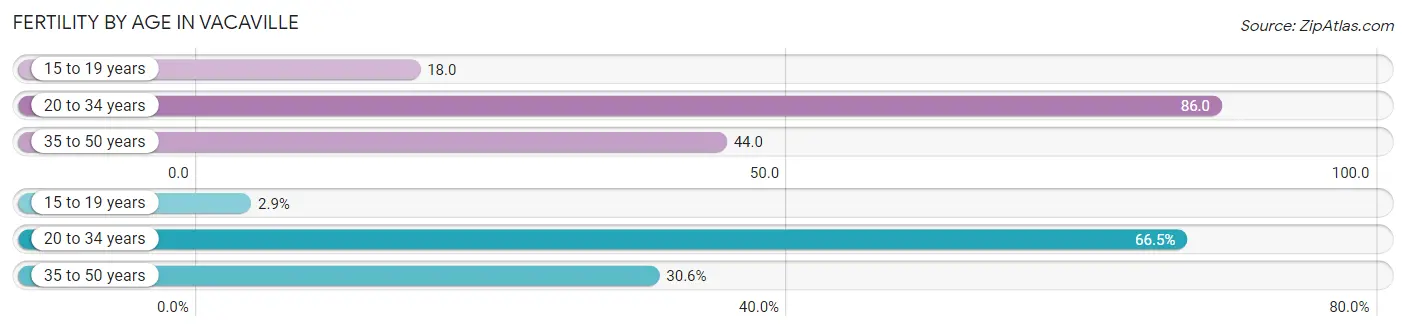
| Age Bracket | Women with Births | Births / 1,000 Women |
| 15 to 19 years | 41 (2.9%) | 18.0 |
| 20 to 34 years | 933 (66.4%) | 86.0 |
| 35 to 50 years | 430 (30.6%) | 44.0 |
| Total | 1,404 (100.0%) | 62.0 |
Fertility by Age by Marriage Status in Vacaville
68.2% of women with births (1,404) in Vacaville are married. The highest percentage of unmarried women with births falls into 20 to 34 years age bracket with 41.0% of them unmarried at the time of birth, while the lowest percentage of unmarried women with births belong to 15 to 19 years age bracket with 0.0% of them unmarried.
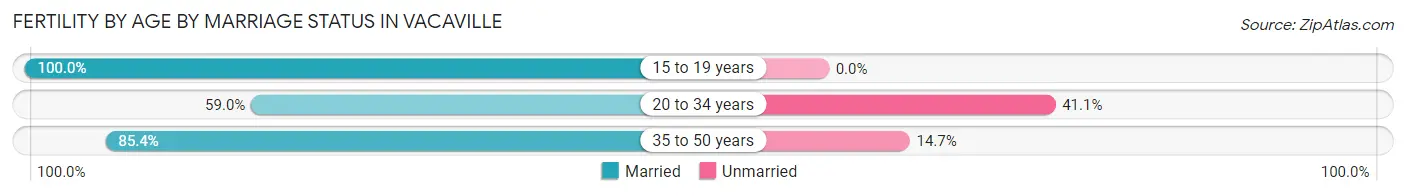
| Age Bracket | Married | Unmarried |
| 15 to 19 years | 41 (100.0%) | 0 (0.0%) |
| 20 to 34 years | 550 (59.0%) | 383 (41.0%) |
| 35 to 50 years | 367 (85.4%) | 63 (14.6%) |
| Total | 958 (68.2%) | 446 (31.8%) |
Fertility by Education in Vacaville
Average fertility rate in Vacaville is 62.0 births per 1,000 women. Women with the education attainment of high school diploma have the highest fertility rate of 85.0 births per 1,000 women, while women with the education attainment of graduate degree have the lowest fertility at 29.0 births per 1,000 women. Women with the education attainment of college or associate's degree represent 35.5% of all women with births.
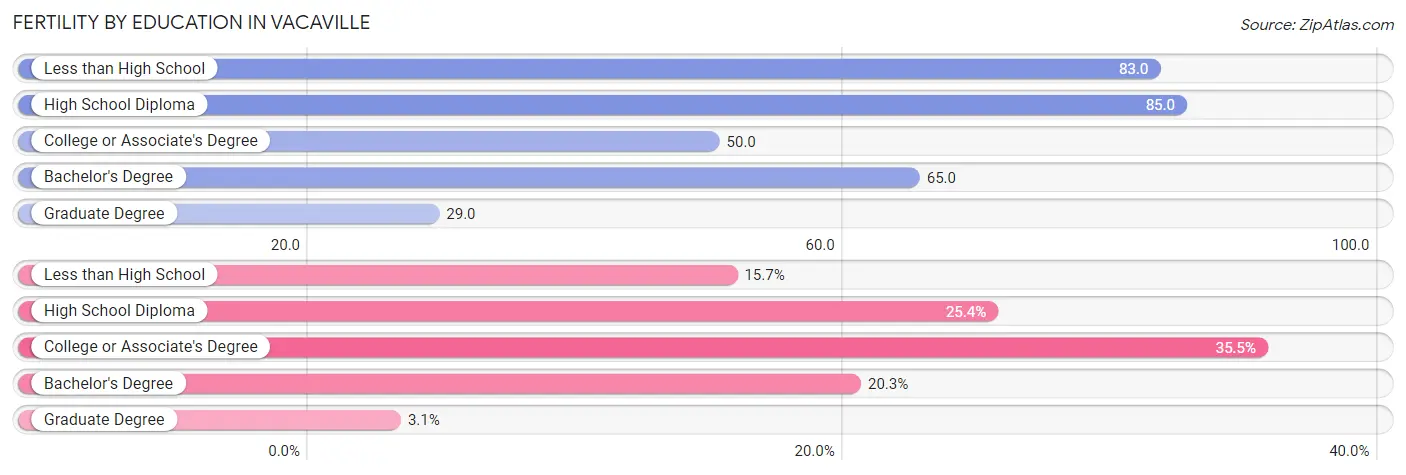
| Educational Attainment | Women with Births | Births / 1,000 Women |
| Less than High School | 220 (15.7%) | 83.0 |
| High School Diploma | 357 (25.4%) | 85.0 |
| College or Associate's Degree | 499 (35.5%) | 50.0 |
| Bachelor's Degree | 285 (20.3%) | 65.0 |
| Graduate Degree | 43 (3.1%) | 29.0 |
| Total | 1,404 (100.0%) | 62.0 |
Fertility by Education by Marriage Status in Vacaville
31.8% of women with births in Vacaville are unmarried. Women with the educational attainment of graduate degree are most likely to be married with 100.0% of them married at childbirth, while women with the educational attainment of high school diploma are least likely to be married with 84.6% of them unmarried at childbirth.
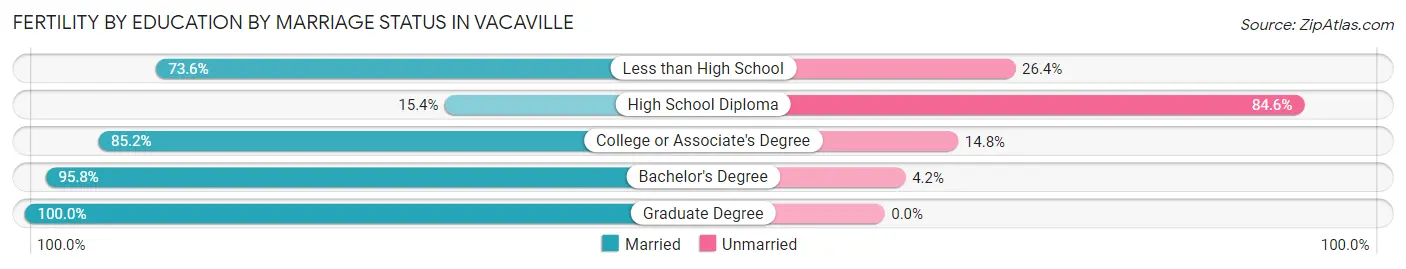
| Educational Attainment | Married | Unmarried |
| Less than High School | 162 (73.6%) | 58 (26.4%) |
| High School Diploma | 55 (15.4%) | 302 (84.6%) |
| College or Associate's Degree | 425 (85.2%) | 74 (14.8%) |
| Bachelor's Degree | 273 (95.8%) | 12 (4.2%) |
| Graduate Degree | 43 (100.0%) | 0 (0.0%) |
| Total | 958 (68.2%) | 446 (31.8%) |
Employment Characteristics in Vacaville
Employment by Class of Employer in Vacaville
Among the 46,252 employed individuals in Vacaville, private company employees (27,952 | 60.4%), local government employees (4,761 | 10.3%), and not-for-profit organizations (3,703 | 8.0%) make up the most common classes of employment.
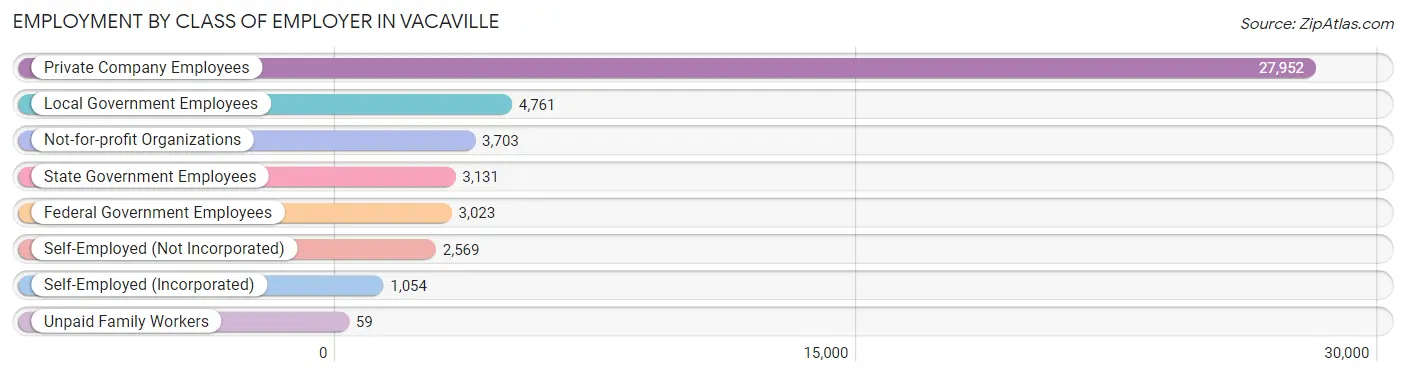
| Employer Class | # Employees | % Employees |
| Private Company Employees | 27,952 | 60.4% |
| Self-Employed (Incorporated) | 1,054 | 2.3% |
| Self-Employed (Not Incorporated) | 2,569 | 5.6% |
| Not-for-profit Organizations | 3,703 | 8.0% |
| Local Government Employees | 4,761 | 10.3% |
| State Government Employees | 3,131 | 6.8% |
| Federal Government Employees | 3,023 | 6.5% |
| Unpaid Family Workers | 59 | 0.1% |
| Total | 46,252 | 100.0% |
Employment Status by Age in Vacaville
According to the labor force statistics for Vacaville, out of the total population over 16 years of age (81,195), 61.5% or 49,935 individuals are in the labor force, with 5.4% or 2,696 of them unemployed. The age group with the highest labor force participation rate is 25 to 29 years, with 79.8% or 6,187 individuals in the labor force. Within the labor force, the 16 to 19 years age range has the highest percentage of unemployed individuals, with 10.2% or 214 of them being unemployed.
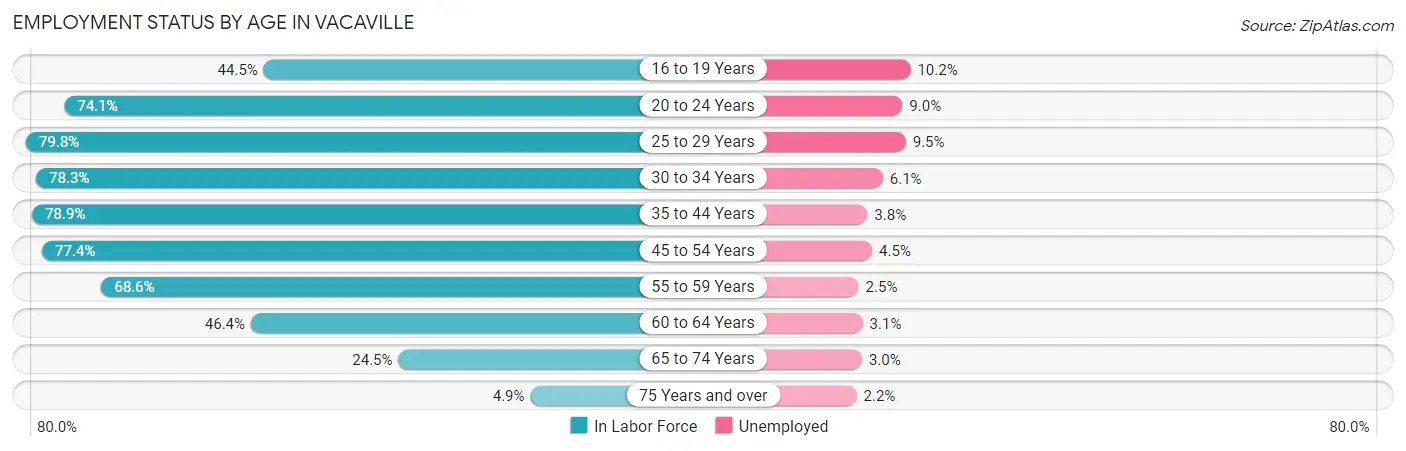
| Age Bracket | In Labor Force | Unemployed |
| 16 to 19 Years | 2,097 (44.5%) | 214 (10.2%) |
| 20 to 24 Years | 4,669 (74.1%) | 420 (9.0%) |
| 25 to 29 Years | 6,187 (79.8%) | 588 (9.5%) |
| 30 to 34 Years | 6,388 (78.3%) | 390 (6.1%) |
| 35 to 44 Years | 11,418 (78.9%) | 434 (3.8%) |
| 45 to 54 Years | 8,971 (77.4%) | 404 (4.5%) |
| 55 to 59 Years | 4,601 (68.6%) | 115 (2.5%) |
| 60 to 64 Years | 3,078 (46.4%) | 95 (3.1%) |
| 65 to 74 Years | 2,275 (24.5%) | 68 (3.0%) |
| 75 Years and over | 274 (4.9%) | 6 (2.2%) |
| Total | 49,935 (61.5%) | 2,696 (5.4%) |
Employment Status by Educational Attainment in Vacaville
According to labor force statistics for Vacaville, 73.5% of individuals (40,654) out of the total population between 25 and 64 years of age (55,312) are in the labor force, with 4.9% or 1,992 of them being unemployed. The group with the highest labor force participation rate are those with the educational attainment of bachelor's degree or higher, with 85.8% or 12,421 individuals in the labor force. Within the labor force, individuals with high school diploma education have the highest percentage of unemployment, with 6.1% or 526 of them being unemployed.
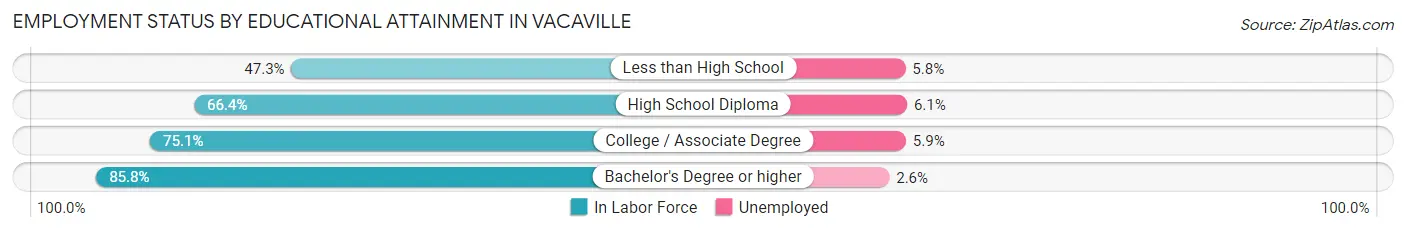
| Educational Attainment | In Labor Force | Unemployed |
| Less than High School | 2,273 (47.3%) | 279 (5.8%) |
| High School Diploma | 8,628 (66.4%) | 793 (6.1%) |
| College / Associate Degree | 17,299 (75.1%) | 1,359 (5.9%) |
| Bachelor's Degree or higher | 12,421 (85.8%) | 376 (2.6%) |
| Total | 40,654 (73.5%) | 2,710 (4.9%) |
Employment Occupations by Sex in Vacaville
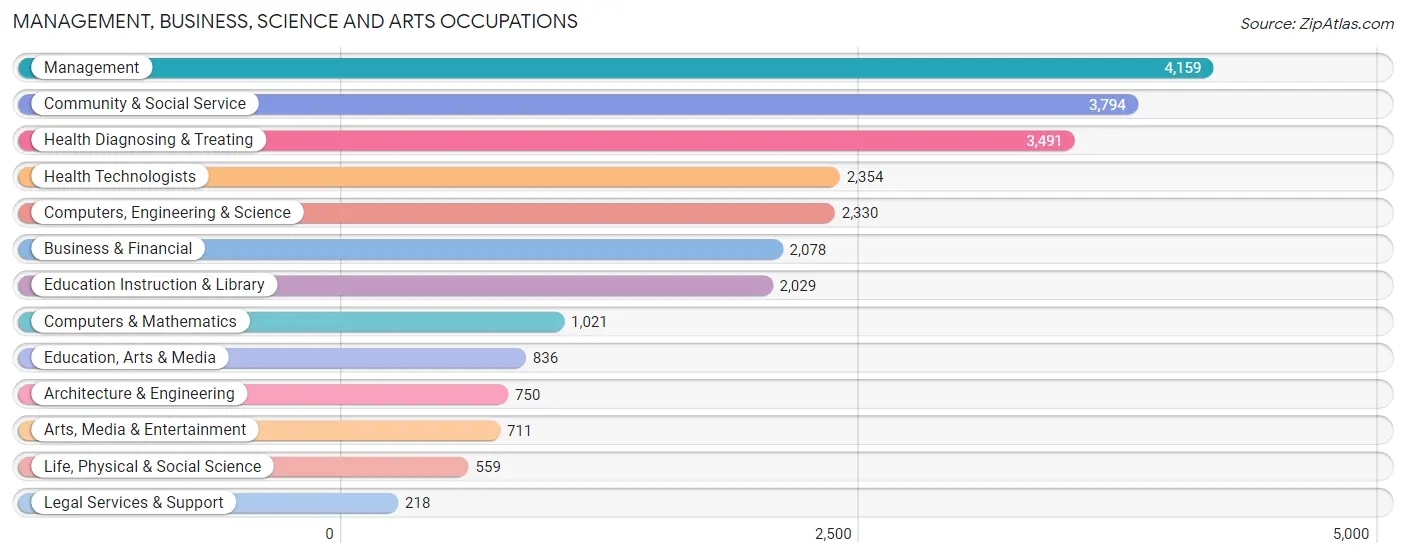
Management, Business, Science and Arts Occupations
The most common Management, Business, Science and Arts occupations in Vacaville are Management (4,159 | 9.1%), Community & Social Service (3,794 | 8.3%), Health Diagnosing & Treating (3,491 | 7.6%), Health Technologists (2,354 | 5.1%), and Computers, Engineering & Science (2,330 | 5.1%).
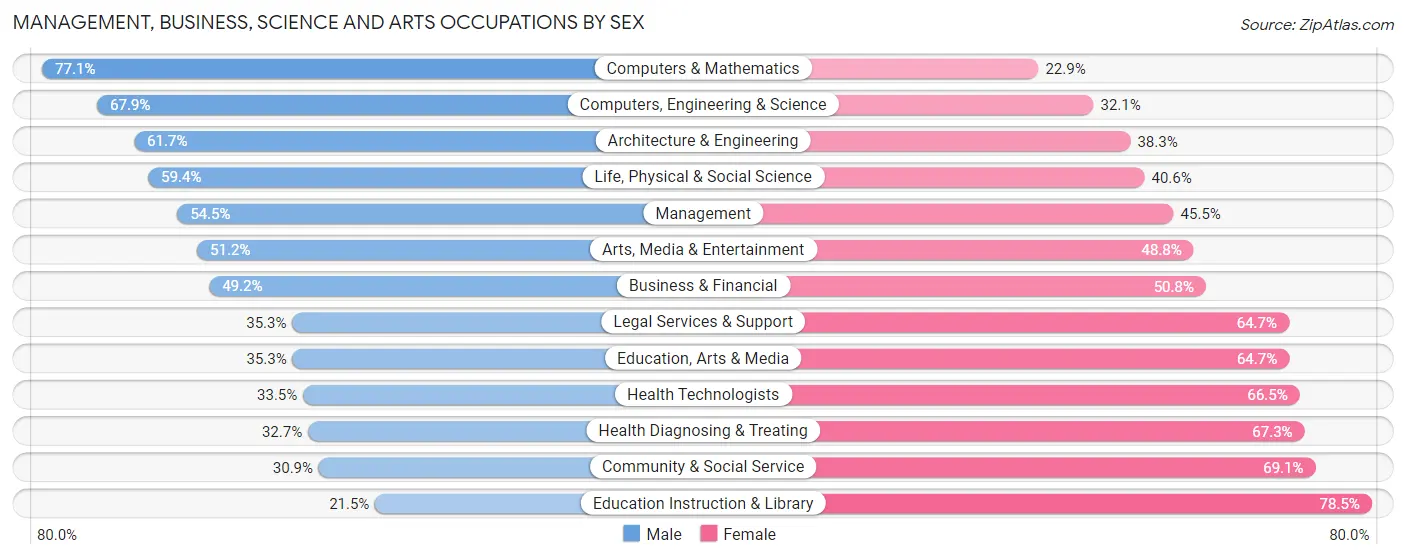
Management, Business, Science and Arts Occupations by Sex
Within the Management, Business, Science and Arts occupations in Vacaville, the most male-oriented occupations are Computers & Mathematics (77.1%), Computers, Engineering & Science (67.9%), and Architecture & Engineering (61.7%), while the most female-oriented occupations are Education Instruction & Library (78.5%), Community & Social Service (69.1%), and Health Diagnosing & Treating (67.3%).
| Occupation | Male | Female |
| Management | 2,268 (54.5%) | 1,891 (45.5%) |
| Business & Financial | 1,022 (49.2%) | 1,056 (50.8%) |
| Computers, Engineering & Science | 1,582 (67.9%) | 748 (32.1%) |
| Computers & Mathematics | 787 (77.1%) | 234 (22.9%) |
| Architecture & Engineering | 463 (61.7%) | 287 (38.3%) |
| Life, Physical & Social Science | 332 (59.4%) | 227 (40.6%) |
| Community & Social Service | 1,172 (30.9%) | 2,622 (69.1%) |
| Education, Arts & Media | 295 (35.3%) | 541 (64.7%) |
| Legal Services & Support | 77 (35.3%) | 141 (64.7%) |
| Education Instruction & Library | 436 (21.5%) | 1,593 (78.5%) |
| Arts, Media & Entertainment | 364 (51.2%) | 347 (48.8%) |
| Health Diagnosing & Treating | 1,142 (32.7%) | 2,349 (67.3%) |
| Health Technologists | 789 (33.5%) | 1,565 (66.5%) |
| Total (Category) | 7,186 (45.3%) | 8,666 (54.7%) |
| Total (Overall) | 22,892 (49.9%) | 22,950 (50.1%) |
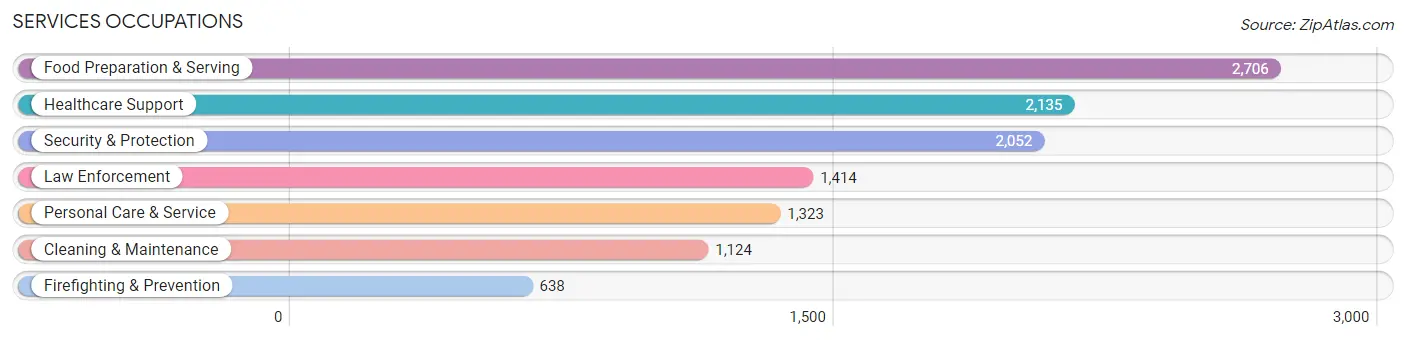
Services Occupations
The most common Services occupations in Vacaville are Food Preparation & Serving (2,706 | 5.9%), Healthcare Support (2,135 | 4.7%), Security & Protection (2,052 | 4.5%), Law Enforcement (1,414 | 3.1%), and Personal Care & Service (1,323 | 2.9%).
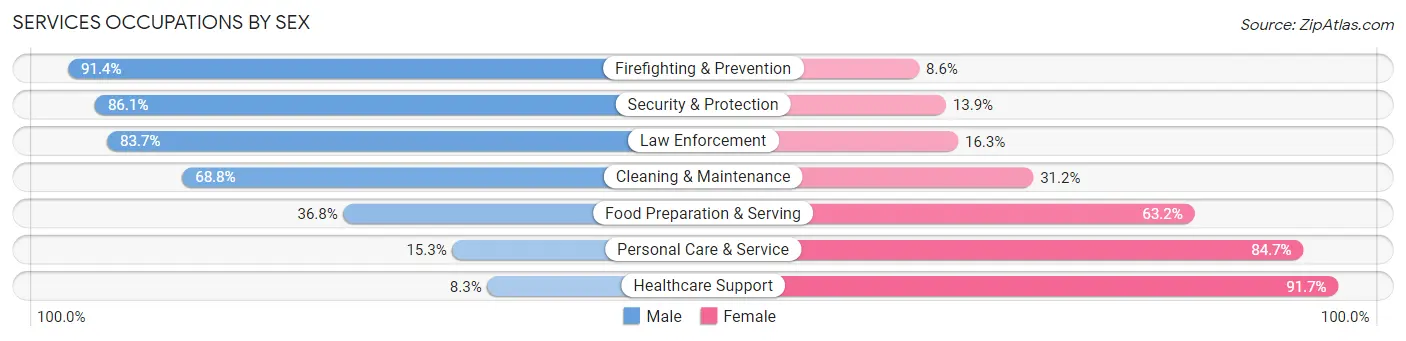
Services Occupations by Sex
Within the Services occupations in Vacaville, the most male-oriented occupations are Firefighting & Prevention (91.4%), Security & Protection (86.1%), and Law Enforcement (83.7%), while the most female-oriented occupations are Healthcare Support (91.7%), Personal Care & Service (84.7%), and Food Preparation & Serving (63.2%).
| Occupation | Male | Female |
| Healthcare Support | 178 (8.3%) | 1,957 (91.7%) |
| Security & Protection | 1,766 (86.1%) | 286 (13.9%) |
| Firefighting & Prevention | 583 (91.4%) | 55 (8.6%) |
| Law Enforcement | 1,183 (83.7%) | 231 (16.3%) |
| Food Preparation & Serving | 997 (36.8%) | 1,709 (63.2%) |
| Cleaning & Maintenance | 773 (68.8%) | 351 (31.2%) |
| Personal Care & Service | 202 (15.3%) | 1,121 (84.7%) |
| Total (Category) | 3,916 (41.9%) | 5,424 (58.1%) |
| Total (Overall) | 22,892 (49.9%) | 22,950 (50.1%) |
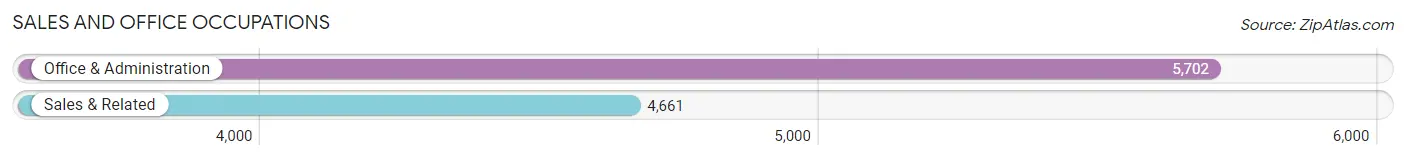
Sales and Office Occupations
The most common Sales and Office occupations in Vacaville are Office & Administration (5,702 | 12.4%), and Sales & Related (4,661 | 10.2%).
Sales and Office Occupations by Sex
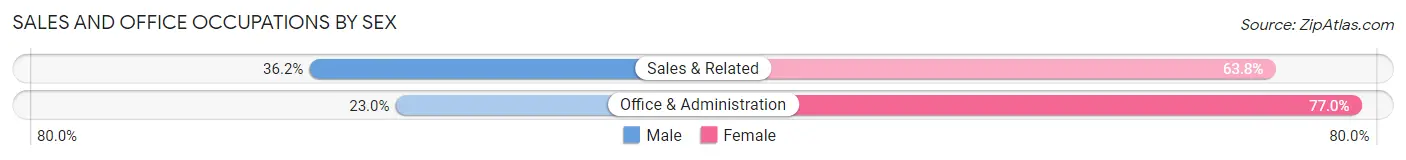
| Occupation | Male | Female |
| Sales & Related | 1,688 (36.2%) | 2,973 (63.8%) |
| Office & Administration | 1,310 (23.0%) | 4,392 (77.0%) |
| Total (Category) | 2,998 (28.9%) | 7,365 (71.1%) |
| Total (Overall) | 22,892 (49.9%) | 22,950 (50.1%) |
Natural Resources, Construction and Maintenance Occupations
The most common Natural Resources, Construction and Maintenance occupations in Vacaville are Construction & Extraction (3,358 | 7.3%), Installation, Maintenance & Repair (1,517 | 3.3%), and Farming, Fishing & Forestry (19 | 0.0%).

Natural Resources, Construction and Maintenance Occupations by Sex
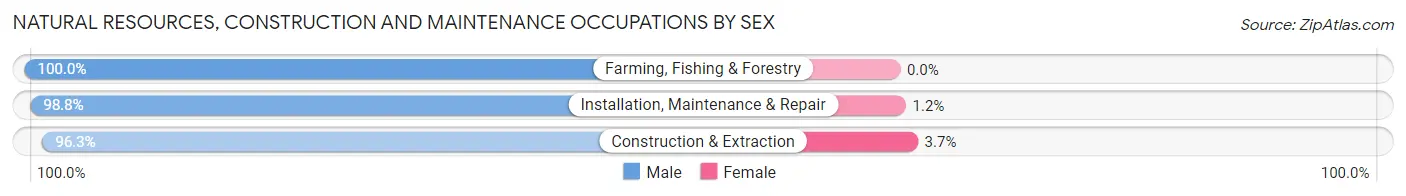
| Occupation | Male | Female |
| Farming, Fishing & Forestry | 19 (100.0%) | 0 (0.0%) |
| Construction & Extraction | 3,234 (96.3%) | 124 (3.7%) |
| Installation, Maintenance & Repair | 1,499 (98.8%) | 18 (1.2%) |
| Total (Category) | 4,752 (97.1%) | 142 (2.9%) |
| Total (Overall) | 22,892 (49.9%) | 22,950 (50.1%) |
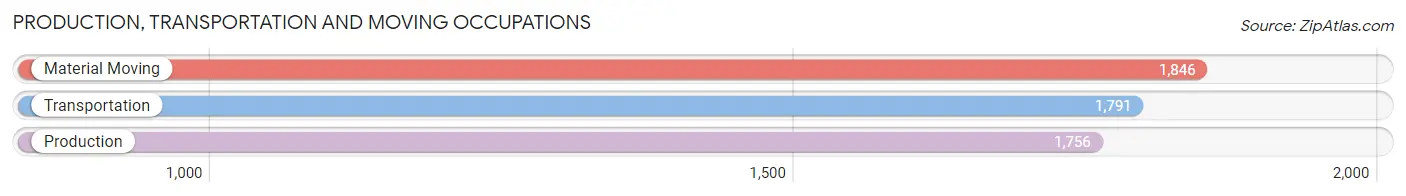
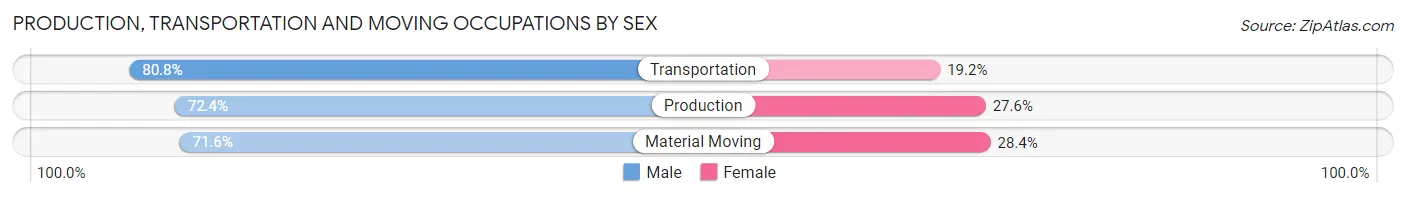
Production, Transportation and Moving Occupations
The most common Production, Transportation and Moving occupations in Vacaville are Material Moving (1,846 | 4.0%), Transportation (1,791 | 3.9%), and Production (1,756 | 3.8%).
Production, Transportation and Moving Occupations by Sex
| Occupation | Male | Female |
| Production | 1,272 (72.4%) | 484 (27.6%) |
| Transportation | 1,447 (80.8%) | 344 (19.2%) |
| Material Moving | 1,321 (71.6%) | 525 (28.4%) |
| Total (Category) | 4,040 (74.9%) | 1,353 (25.1%) |
| Total (Overall) | 22,892 (49.9%) | 22,950 (50.1%) |
Employment Industries by Sex in Vacaville
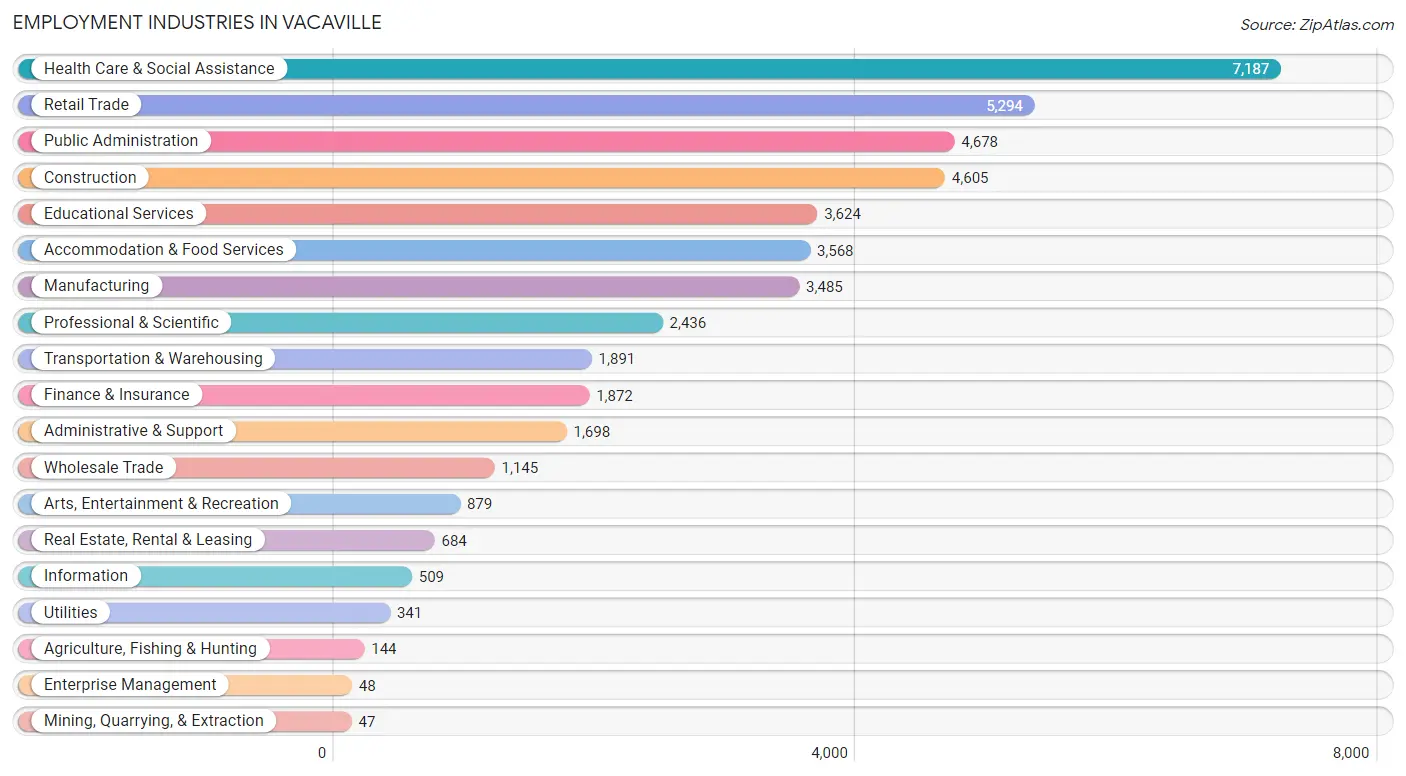
Employment Industries in Vacaville
The major employment industries in Vacaville include Health Care & Social Assistance (7,187 | 15.7%), Retail Trade (5,294 | 11.6%), Public Administration (4,678 | 10.2%), Construction (4,605 | 10.1%), and Educational Services (3,624 | 7.9%).
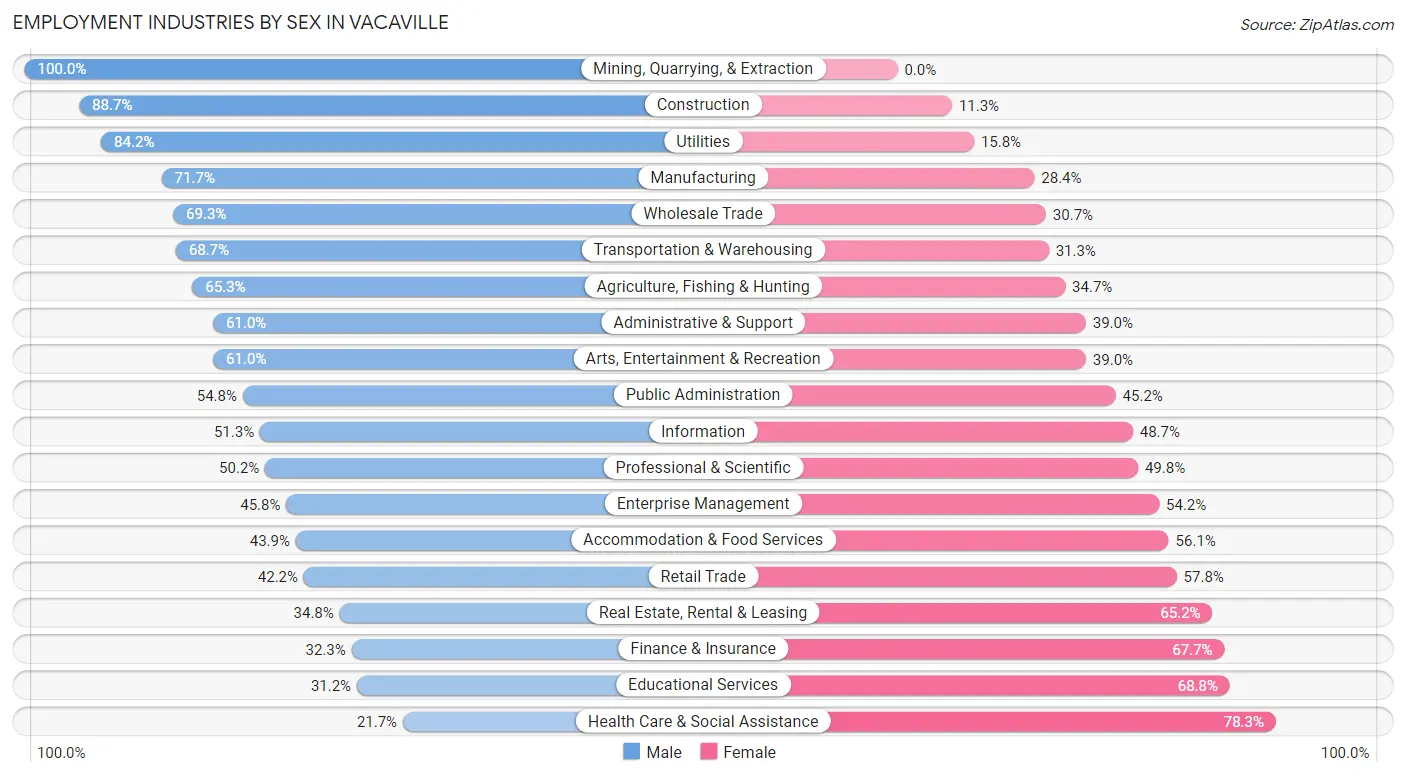
Employment Industries by Sex in Vacaville
The Vacaville industries that see more men than women are Mining, Quarrying, & Extraction (100.0%), Construction (88.7%), and Utilities (84.2%), whereas the industries that tend to have a higher number of women are Health Care & Social Assistance (78.3%), Educational Services (68.8%), and Finance & Insurance (67.7%).
| Industry | Male | Female |
| Agriculture, Fishing & Hunting | 94 (65.3%) | 50 (34.7%) |
| Mining, Quarrying, & Extraction | 47 (100.0%) | 0 (0.0%) |
| Construction | 4,085 (88.7%) | 520 (11.3%) |
| Manufacturing | 2,497 (71.7%) | 988 (28.3%) |
| Wholesale Trade | 793 (69.3%) | 352 (30.7%) |
| Retail Trade | 2,234 (42.2%) | 3,060 (57.8%) |
| Transportation & Warehousing | 1,299 (68.7%) | 592 (31.3%) |
| Utilities | 287 (84.2%) | 54 (15.8%) |
| Information | 261 (51.3%) | 248 (48.7%) |
| Finance & Insurance | 605 (32.3%) | 1,267 (67.7%) |
| Real Estate, Rental & Leasing | 238 (34.8%) | 446 (65.2%) |
| Professional & Scientific | 1,223 (50.2%) | 1,213 (49.8%) |
| Enterprise Management | 22 (45.8%) | 26 (54.2%) |
| Administrative & Support | 1,036 (61.0%) | 662 (39.0%) |
| Educational Services | 1,131 (31.2%) | 2,493 (68.8%) |
| Health Care & Social Assistance | 1,559 (21.7%) | 5,628 (78.3%) |
| Arts, Entertainment & Recreation | 536 (61.0%) | 343 (39.0%) |
| Accommodation & Food Services | 1,565 (43.9%) | 2,003 (56.1%) |
| Public Administration | 2,565 (54.8%) | 2,113 (45.2%) |
| Total | 22,892 (49.9%) | 22,950 (50.1%) |
Education in Vacaville
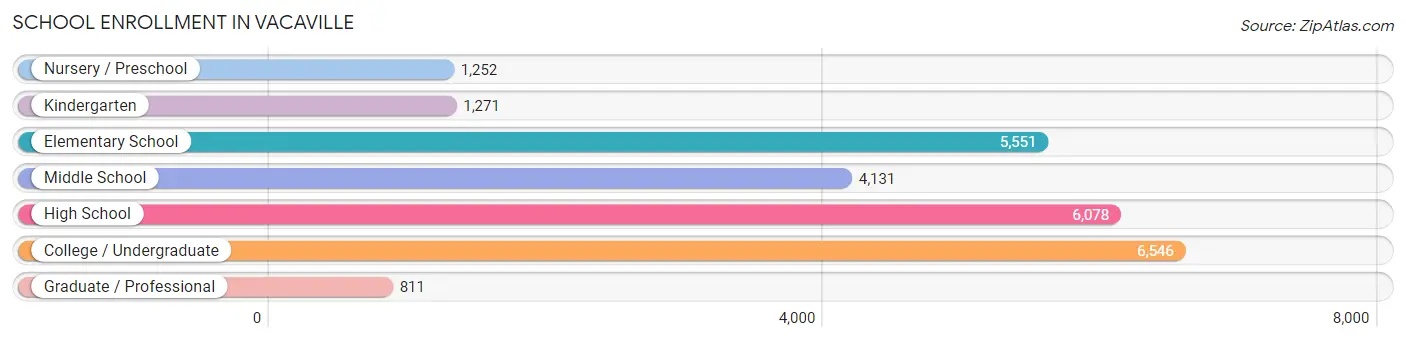
School Enrollment in Vacaville
The most common levels of schooling among the 25,640 students in Vacaville are college / undergraduate (6,546 | 25.5%), high school (6,078 | 23.7%), and elementary school (5,551 | 21.6%).
| School Level | # Students | % Students |
| Nursery / Preschool | 1,252 | 4.9% |
| Kindergarten | 1,271 | 5.0% |
| Elementary School | 5,551 | 21.6% |
| Middle School | 4,131 | 16.1% |
| High School | 6,078 | 23.7% |
| College / Undergraduate | 6,546 | 25.5% |
| Graduate / Professional | 811 | 3.2% |
| Total | 25,640 | 100.0% |
School Enrollment by Age by Funding Source in Vacaville
Out of a total of 25,640 students who are enrolled in schools in Vacaville, 3,051 (11.9%) attend a private institution, while the remaining 22,589 (88.1%) are enrolled in public schools. The age group of 3 to 4 year olds has the highest likelihood of being enrolled in private schools, with 464 (56.7% in the age bracket) enrolled. Conversely, the age group of 15 to 17 year olds has the lowest likelihood of being enrolled in a private school, with 3,714 (98.6% in the age bracket) attending a public institution.
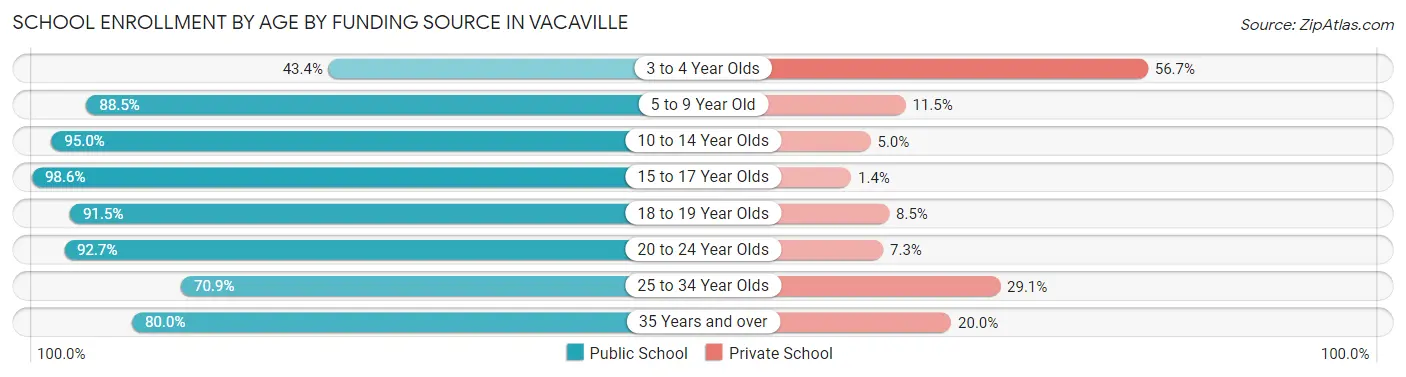
| Age Bracket | Public School | Private School |
| 3 to 4 Year Olds | 355 (43.3%) | 464 (56.7%) |
| 5 to 9 Year Old | 5,889 (88.5%) | 767 (11.5%) |
| 10 to 14 Year Olds | 5,354 (95.0%) | 282 (5.0%) |
| 15 to 17 Year Olds | 3,714 (98.6%) | 52 (1.4%) |
| 18 to 19 Year Olds | 1,536 (91.5%) | 142 (8.5%) |
| 20 to 24 Year Olds | 2,273 (92.7%) | 180 (7.3%) |
| 25 to 34 Year Olds | 1,809 (70.9%) | 744 (29.1%) |
| 35 Years and over | 1,663 (80.0%) | 416 (20.0%) |
| Total | 22,589 (88.1%) | 3,051 (11.9%) |
Educational Attainment by Field of Study in Vacaville
Business (3,214 | 16.5%), science & technology (2,884 | 14.8%), social sciences (1,880 | 9.6%), arts & humanities (1,828 | 9.4%), and bio, nature & agricultural (1,588 | 8.1%) are the most common fields of study among 19,536 individuals in Vacaville who have obtained a bachelor's degree or higher.
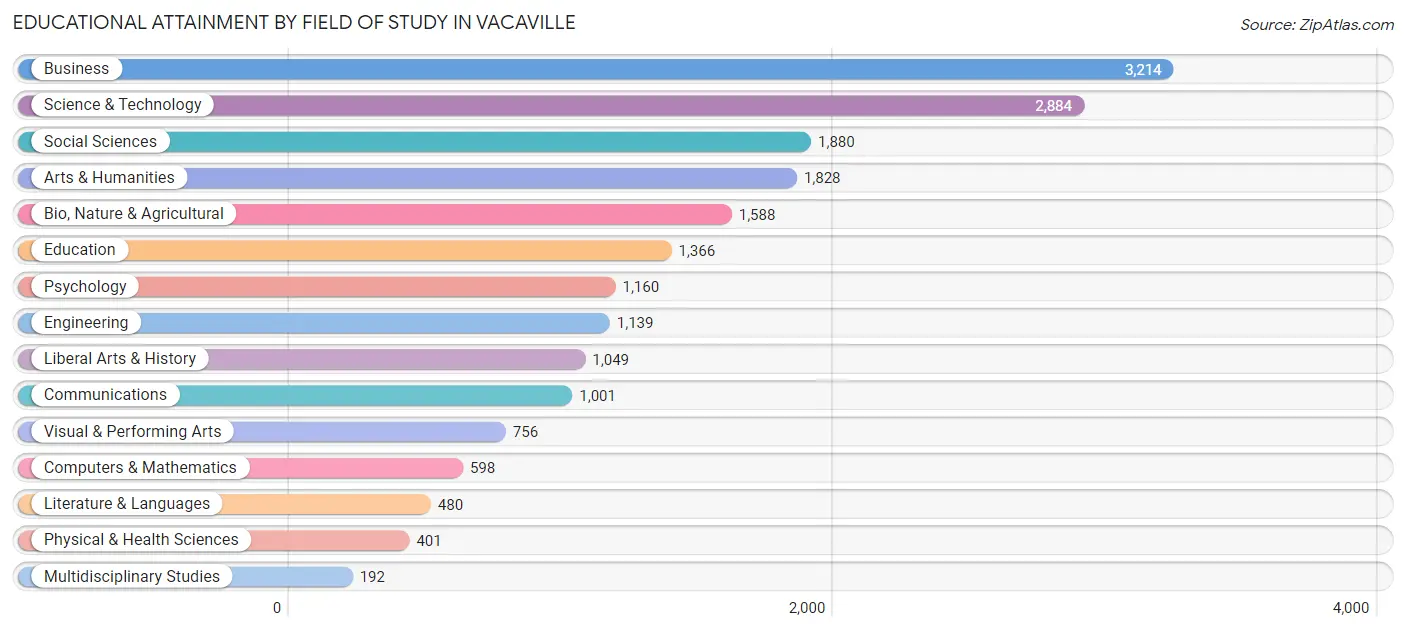
| Field of Study | # Graduates | % Graduates |
| Computers & Mathematics | 598 | 3.1% |
| Bio, Nature & Agricultural | 1,588 | 8.1% |
| Physical & Health Sciences | 401 | 2.1% |
| Psychology | 1,160 | 5.9% |
| Social Sciences | 1,880 | 9.6% |
| Engineering | 1,139 | 5.8% |
| Multidisciplinary Studies | 192 | 1.0% |
| Science & Technology | 2,884 | 14.8% |
| Business | 3,214 | 16.5% |
| Education | 1,366 | 7.0% |
| Literature & Languages | 480 | 2.5% |
| Liberal Arts & History | 1,049 | 5.4% |
| Visual & Performing Arts | 756 | 3.9% |
| Communications | 1,001 | 5.1% |
| Arts & Humanities | 1,828 | 9.4% |
| Total | 19,536 | 100.0% |
Transportation & Commute in Vacaville
Vehicle Availability by Sex in Vacaville
The most prevalent vehicle ownership categories in Vacaville are males with 2 vehicles (8,980, accounting for 38.0%) and females with 2 vehicles (7,679, making up 39.7%).
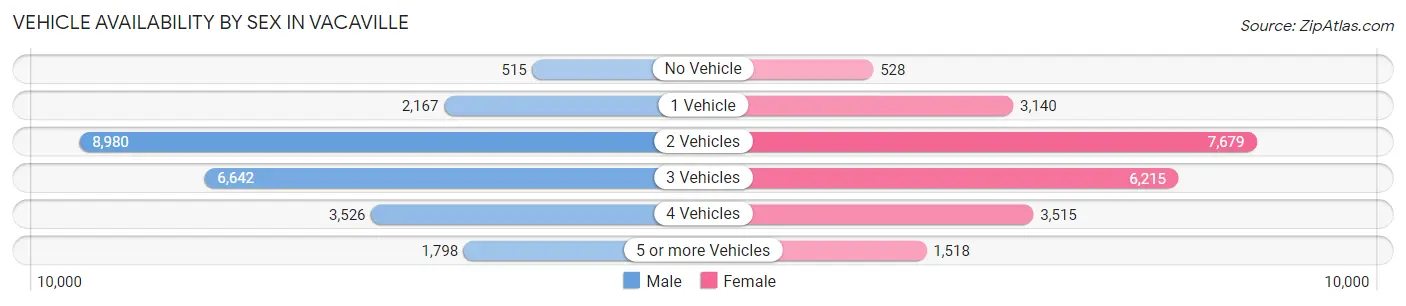
| Vehicles Available | Male | Female |
| No Vehicle | 515 (2.2%) | 528 (2.3%) |
| 1 Vehicle | 2,167 (9.2%) | 3,140 (13.9%) |
| 2 Vehicles | 8,980 (38.0%) | 7,679 (34.0%) |
| 3 Vehicles | 6,642 (28.1%) | 6,215 (27.5%) |
| 4 Vehicles | 3,526 (14.9%) | 3,515 (15.6%) |
| 5 or more Vehicles | 1,798 (7.6%) | 1,518 (6.7%) |
| Total | 23,628 (100.0%) | 22,595 (100.0%) |
Commute Time in Vacaville
The most frequently occuring commute durations in Vacaville are 10 to 14 minutes (7,047 commuters, 16.9%), 15 to 19 minutes (5,784 commuters, 13.9%), and 5 to 9 minutes (5,363 commuters, 12.8%).
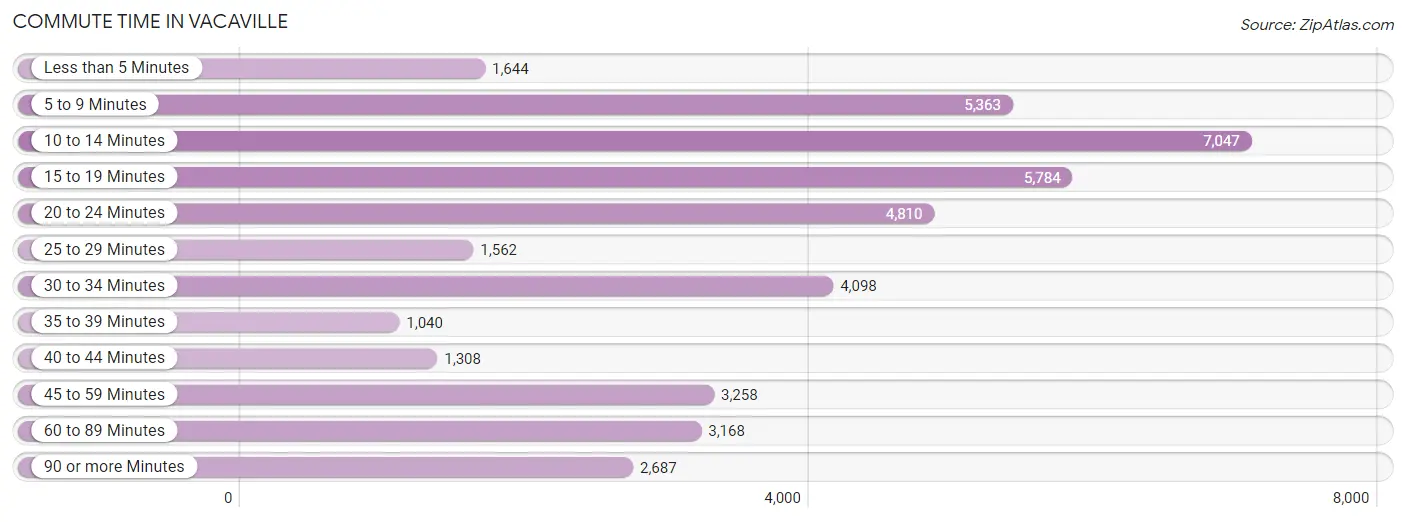
| Commute Time | # Commuters | % Commuters |
| Less than 5 Minutes | 1,644 | 3.9% |
| 5 to 9 Minutes | 5,363 | 12.8% |
| 10 to 14 Minutes | 7,047 | 16.9% |
| 15 to 19 Minutes | 5,784 | 13.9% |
| 20 to 24 Minutes | 4,810 | 11.5% |
| 25 to 29 Minutes | 1,562 | 3.7% |
| 30 to 34 Minutes | 4,098 | 9.8% |
| 35 to 39 Minutes | 1,040 | 2.5% |
| 40 to 44 Minutes | 1,308 | 3.1% |
| 45 to 59 Minutes | 3,258 | 7.8% |
| 60 to 89 Minutes | 3,168 | 7.6% |
| 90 or more Minutes | 2,687 | 6.4% |
Commute Time by Sex in Vacaville
The most common commute times in Vacaville are 10 to 14 minutes (2,835 commuters, 13.0%) for males and 10 to 14 minutes (4,212 commuters, 21.0%) for females.
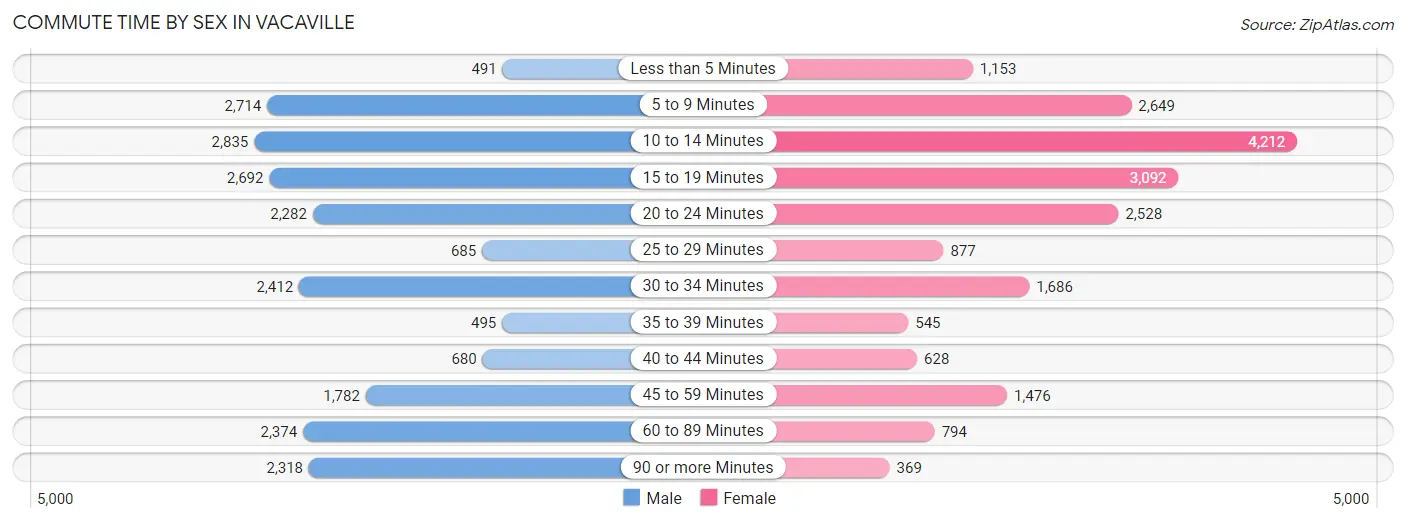
| Commute Time | Male | Female |
| Less than 5 Minutes | 491 (2.3%) | 1,153 (5.8%) |
| 5 to 9 Minutes | 2,714 (12.5%) | 2,649 (13.2%) |
| 10 to 14 Minutes | 2,835 (13.0%) | 4,212 (21.0%) |
| 15 to 19 Minutes | 2,692 (12.4%) | 3,092 (15.4%) |
| 20 to 24 Minutes | 2,282 (10.5%) | 2,528 (12.6%) |
| 25 to 29 Minutes | 685 (3.2%) | 877 (4.4%) |
| 30 to 34 Minutes | 2,412 (11.1%) | 1,686 (8.4%) |
| 35 to 39 Minutes | 495 (2.3%) | 545 (2.7%) |
| 40 to 44 Minutes | 680 (3.1%) | 628 (3.1%) |
| 45 to 59 Minutes | 1,782 (8.2%) | 1,476 (7.4%) |
| 60 to 89 Minutes | 2,374 (10.9%) | 794 (4.0%) |
| 90 or more Minutes | 2,318 (10.6%) | 369 (1.8%) |
Time of Departure to Work by Sex in Vacaville
The most frequent times of departure to work in Vacaville are 12:00 AM to 4:59 AM (2,499, 11.5%) for males and 7:00 AM to 7:29 AM (3,369, 16.8%) for females.
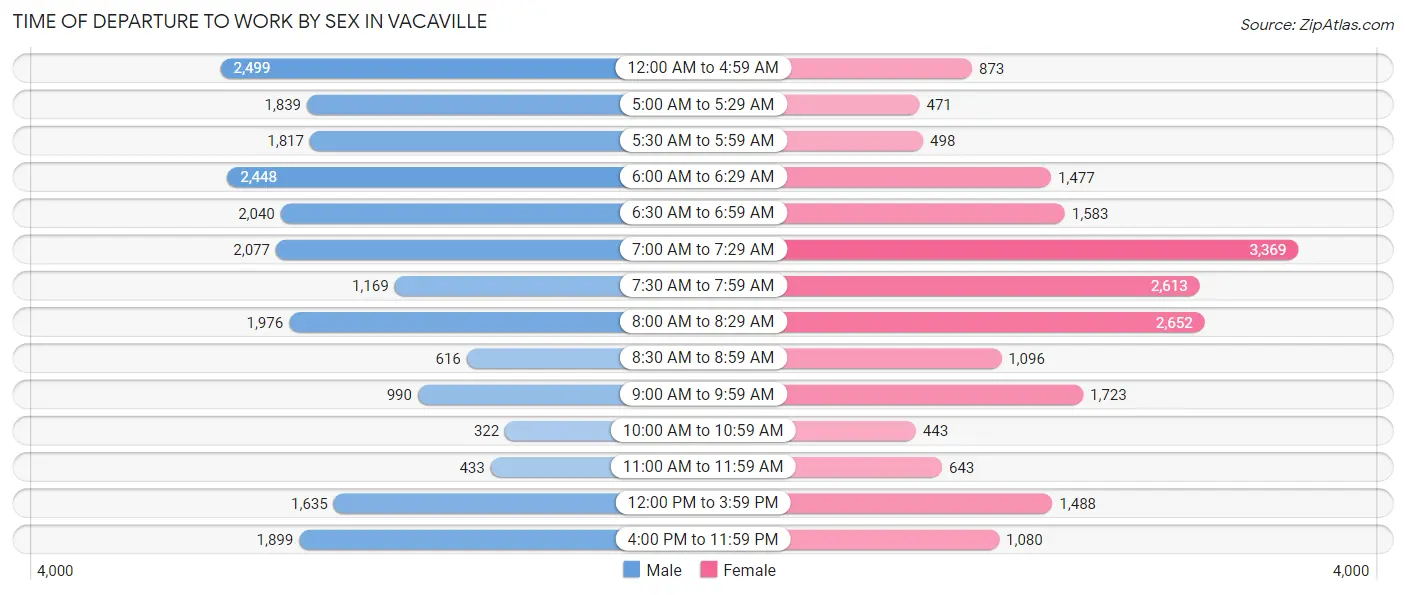
| Time of Departure | Male | Female |
| 12:00 AM to 4:59 AM | 2,499 (11.5%) | 873 (4.4%) |
| 5:00 AM to 5:29 AM | 1,839 (8.5%) | 471 (2.4%) |
| 5:30 AM to 5:59 AM | 1,817 (8.4%) | 498 (2.5%) |
| 6:00 AM to 6:29 AM | 2,448 (11.3%) | 1,477 (7.4%) |
| 6:30 AM to 6:59 AM | 2,040 (9.4%) | 1,583 (7.9%) |
| 7:00 AM to 7:29 AM | 2,077 (9.6%) | 3,369 (16.8%) |
| 7:30 AM to 7:59 AM | 1,169 (5.4%) | 2,613 (13.1%) |
| 8:00 AM to 8:29 AM | 1,976 (9.1%) | 2,652 (13.3%) |
| 8:30 AM to 8:59 AM | 616 (2.8%) | 1,096 (5.5%) |
| 9:00 AM to 9:59 AM | 990 (4.5%) | 1,723 (8.6%) |
| 10:00 AM to 10:59 AM | 322 (1.5%) | 443 (2.2%) |
| 11:00 AM to 11:59 AM | 433 (2.0%) | 643 (3.2%) |
| 12:00 PM to 3:59 PM | 1,635 (7.5%) | 1,488 (7.4%) |
| 4:00 PM to 11:59 PM | 1,899 (8.7%) | 1,080 (5.4%) |
| Total | 21,760 (100.0%) | 20,009 (100.0%) |
Housing Occupancy in Vacaville
Occupancy by Ownership in Vacaville
Of the total 33,723 dwellings in Vacaville, owner-occupied units account for 22,341 (66.2%), while renter-occupied units make up 11,382 (33.8%).
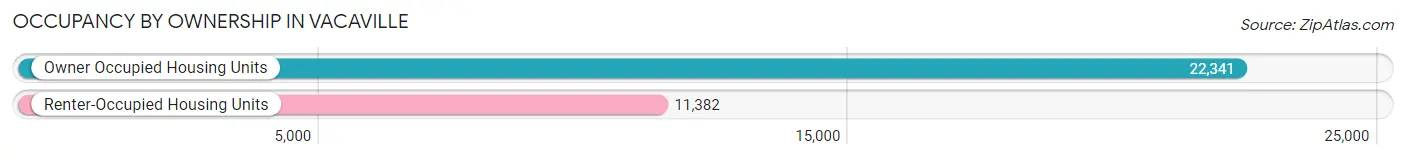
| Occupancy | # Housing Units | % Housing Units |
| Owner Occupied Housing Units | 22,341 | 66.2% |
| Renter-Occupied Housing Units | 11,382 | 33.8% |
| Total Occupied Housing Units | 33,723 | 100.0% |
Occupancy by Household Size in Vacaville
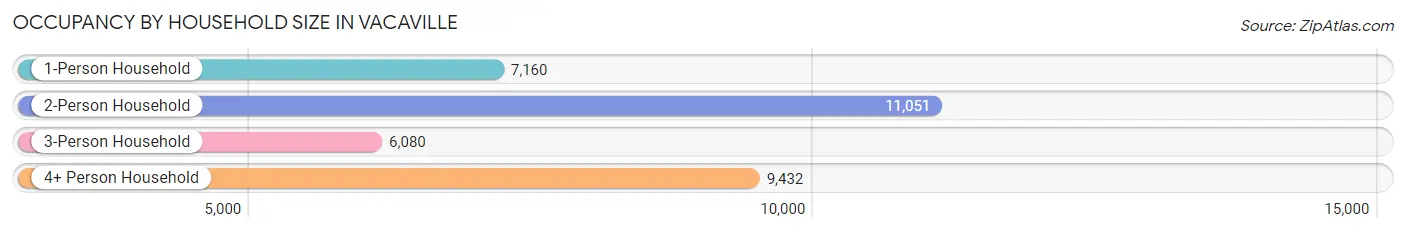
| Household Size | # Housing Units | % Housing Units |
| 1-Person Household | 7,160 | 21.2% |
| 2-Person Household | 11,051 | 32.8% |
| 3-Person Household | 6,080 | 18.0% |
| 4+ Person Household | 9,432 | 28.0% |
| Total Housing Units | 33,723 | 100.0% |
Occupancy by Ownership by Household Size in Vacaville
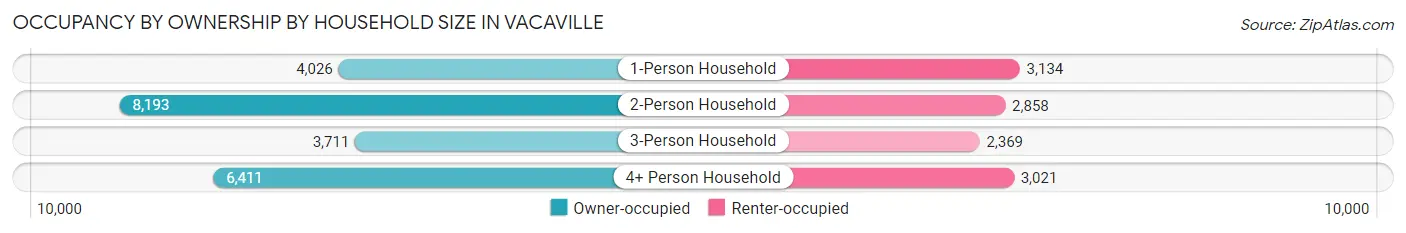
| Household Size | Owner-occupied | Renter-occupied |
| 1-Person Household | 4,026 (56.2%) | 3,134 (43.8%) |
| 2-Person Household | 8,193 (74.1%) | 2,858 (25.9%) |
| 3-Person Household | 3,711 (61.0%) | 2,369 (39.0%) |
| 4+ Person Household | 6,411 (68.0%) | 3,021 (32.0%) |
| Total Housing Units | 22,341 (66.2%) | 11,382 (33.8%) |
Occupancy by Educational Attainment in Vacaville
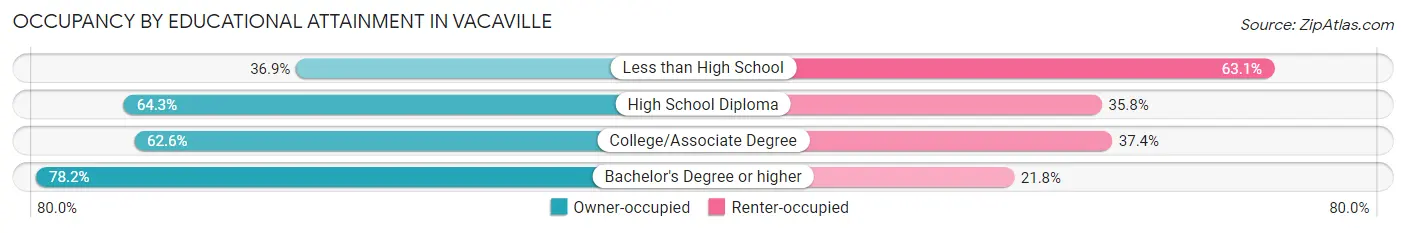
| Household Size | Owner-occupied | Renter-occupied |
| Less than High School | 682 (36.9%) | 1,165 (63.1%) |
| High School Diploma | 4,373 (64.2%) | 2,433 (35.7%) |
| College/Associate Degree | 9,307 (62.6%) | 5,555 (37.4%) |
| Bachelor's Degree or higher | 7,979 (78.2%) | 2,229 (21.8%) |
Occupancy by Age of Householder in Vacaville
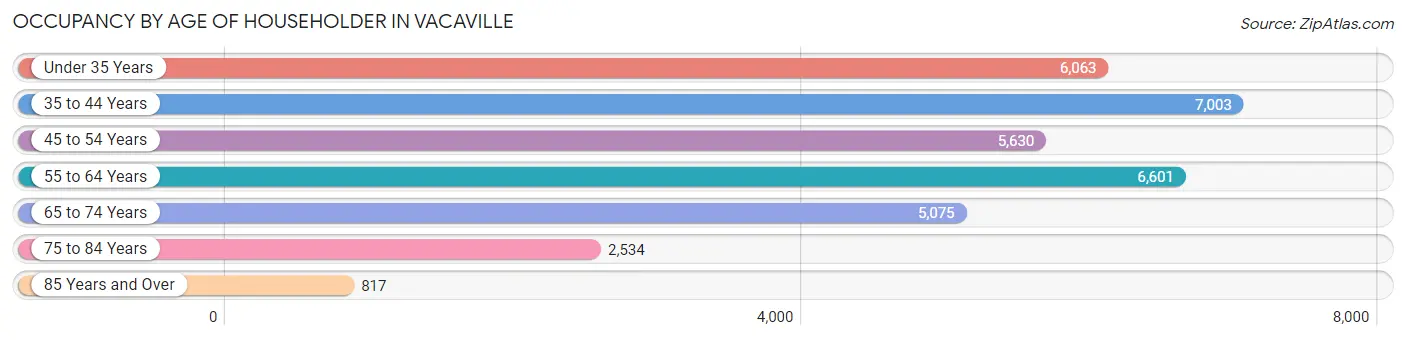
| Age Bracket | # Households | % Households |
| Under 35 Years | 6,063 | 18.0% |
| 35 to 44 Years | 7,003 | 20.8% |
| 45 to 54 Years | 5,630 | 16.7% |
| 55 to 64 Years | 6,601 | 19.6% |
| 65 to 74 Years | 5,075 | 15.0% |
| 75 to 84 Years | 2,534 | 7.5% |
| 85 Years and Over | 817 | 2.4% |
| Total | 33,723 | 100.0% |
Housing Finances in Vacaville
Median Income by Occupancy in Vacaville
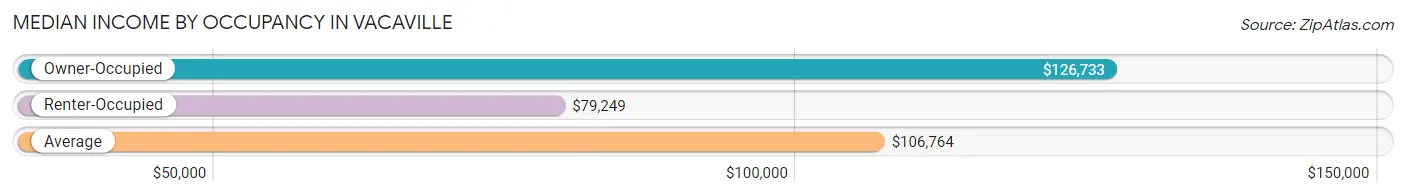
| Occupancy Type | # Households | Median Income |
| Owner-Occupied | 22,341 (66.2%) | $126,733 |
| Renter-Occupied | 11,382 (33.8%) | $79,249 |
| Average | 33,723 (100.0%) | $106,764 |
Occupancy by Householder Income Bracket in Vacaville
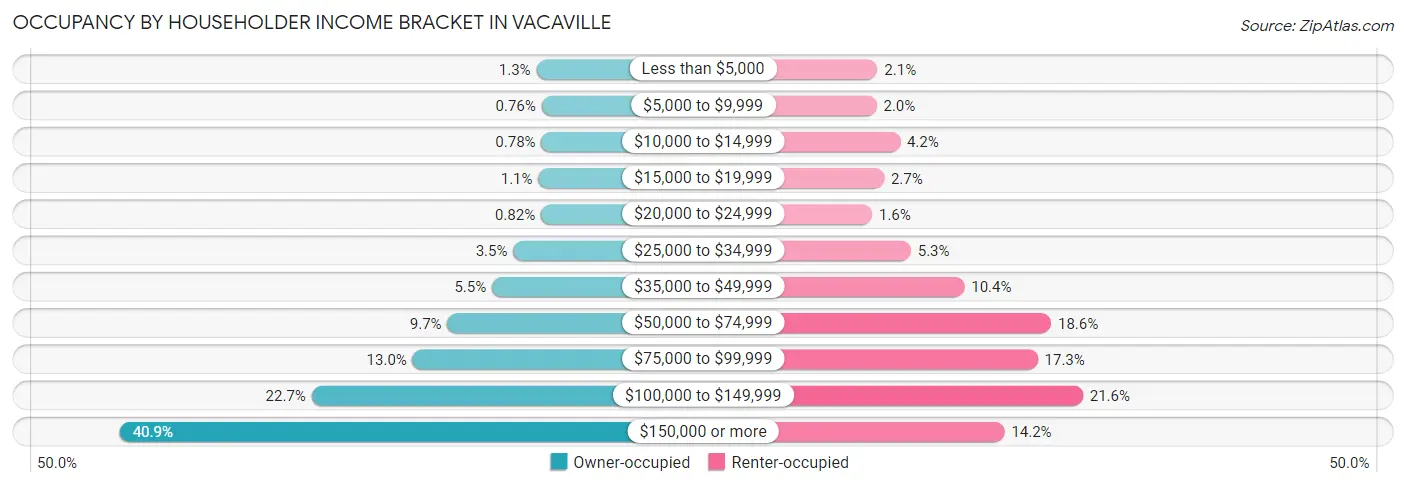
| Income Bracket | Owner-occupied | Renter-occupied |
| Less than $5,000 | 279 (1.3%) | 237 (2.1%) |
| $5,000 to $9,999 | 170 (0.8%) | 228 (2.0%) |
| $10,000 to $14,999 | 174 (0.8%) | 482 (4.2%) |
| $15,000 to $19,999 | 240 (1.1%) | 308 (2.7%) |
| $20,000 to $24,999 | 183 (0.8%) | 179 (1.6%) |
| $25,000 to $34,999 | 774 (3.5%) | 599 (5.3%) |
| $35,000 to $49,999 | 1,225 (5.5%) | 1,179 (10.4%) |
| $50,000 to $74,999 | 2,173 (9.7%) | 2,119 (18.6%) |
| $75,000 to $99,999 | 2,914 (13.0%) | 1,974 (17.3%) |
| $100,000 to $149,999 | 5,063 (22.7%) | 2,463 (21.6%) |
| $150,000 or more | 9,146 (40.9%) | 1,614 (14.2%) |
| Total | 22,341 (100.0%) | 11,382 (100.0%) |
Monthly Housing Cost Tiers in Vacaville
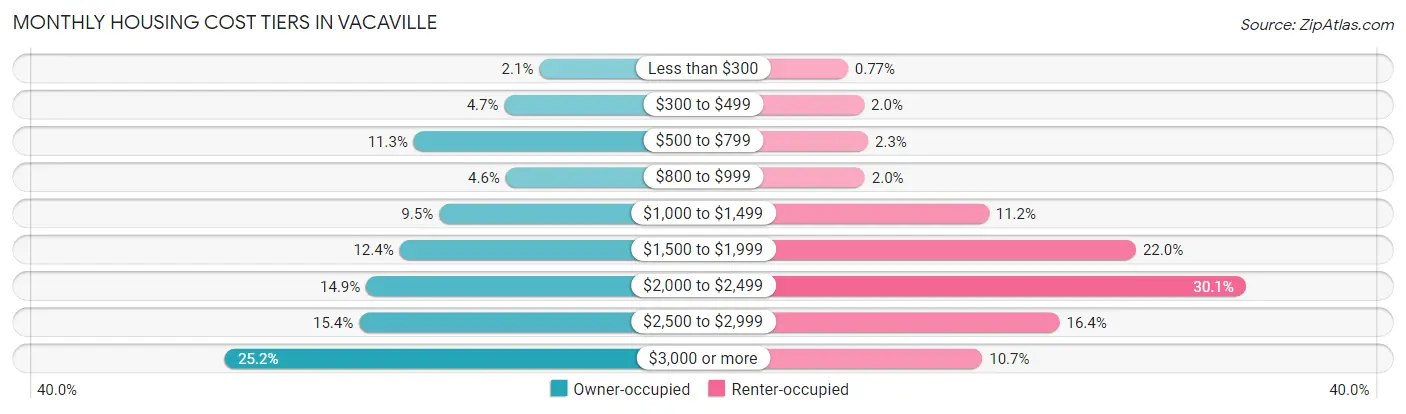
| Monthly Cost | Owner-occupied | Renter-occupied |
| Less than $300 | 469 (2.1%) | 88 (0.8%) |
| $300 to $499 | 1,044 (4.7%) | 224 (2.0%) |
| $500 to $799 | 2,533 (11.3%) | 257 (2.3%) |
| $800 to $999 | 1,021 (4.6%) | 230 (2.0%) |
| $1,000 to $1,499 | 2,118 (9.5%) | 1,269 (11.2%) |
| $1,500 to $1,999 | 2,767 (12.4%) | 2,503 (22.0%) |
| $2,000 to $2,499 | 3,317 (14.8%) | 3,421 (30.1%) |
| $2,500 to $2,999 | 3,433 (15.4%) | 1,862 (16.4%) |
| $3,000 or more | 5,639 (25.2%) | 1,215 (10.7%) |
| Total | 22,341 (100.0%) | 11,382 (100.0%) |
Physical Housing Characteristics in Vacaville
Housing Structures in Vacaville
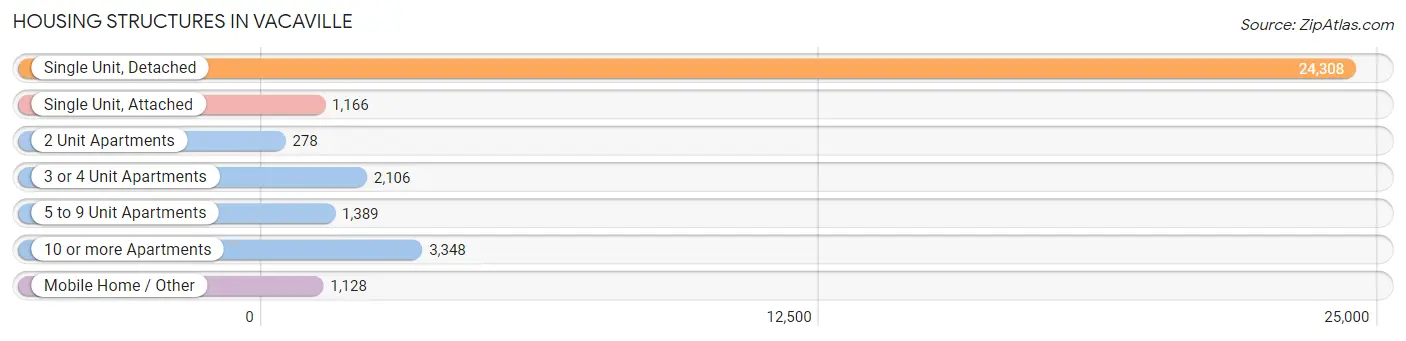
| Structure Type | # Housing Units | % Housing Units |
| Single Unit, Detached | 24,308 | 72.1% |
| Single Unit, Attached | 1,166 | 3.5% |
| 2 Unit Apartments | 278 | 0.8% |
| 3 or 4 Unit Apartments | 2,106 | 6.2% |
| 5 to 9 Unit Apartments | 1,389 | 4.1% |
| 10 or more Apartments | 3,348 | 9.9% |
| Mobile Home / Other | 1,128 | 3.3% |
| Total | 33,723 | 100.0% |
Housing Structures by Occupancy in Vacaville
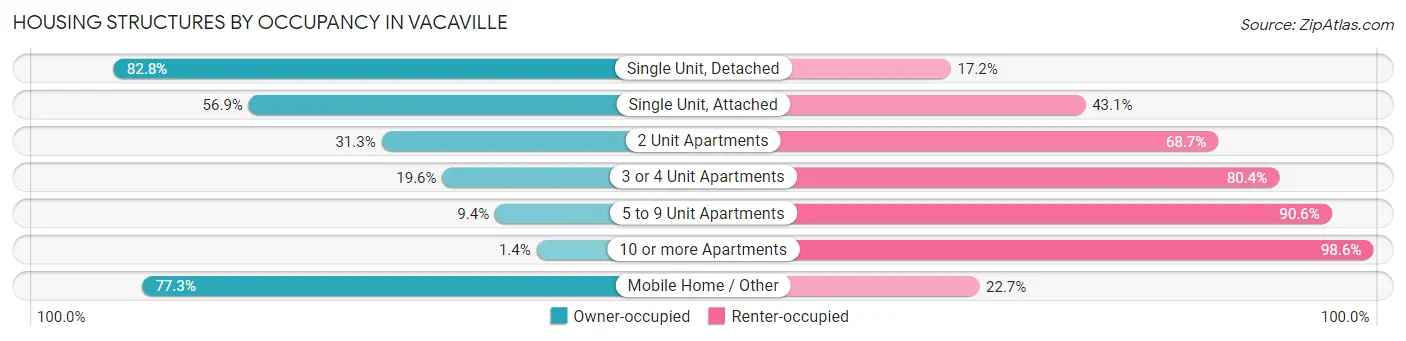
| Structure Type | Owner-occupied | Renter-occupied |
| Single Unit, Detached | 20,128 (82.8%) | 4,180 (17.2%) |
| Single Unit, Attached | 663 (56.9%) | 503 (43.1%) |
| 2 Unit Apartments | 87 (31.3%) | 191 (68.7%) |
| 3 or 4 Unit Apartments | 412 (19.6%) | 1,694 (80.4%) |
| 5 to 9 Unit Apartments | 131 (9.4%) | 1,258 (90.6%) |
| 10 or more Apartments | 48 (1.4%) | 3,300 (98.6%) |
| Mobile Home / Other | 872 (77.3%) | 256 (22.7%) |
| Total | 22,341 (66.2%) | 11,382 (33.8%) |
Housing Structures by Number of Rooms in Vacaville
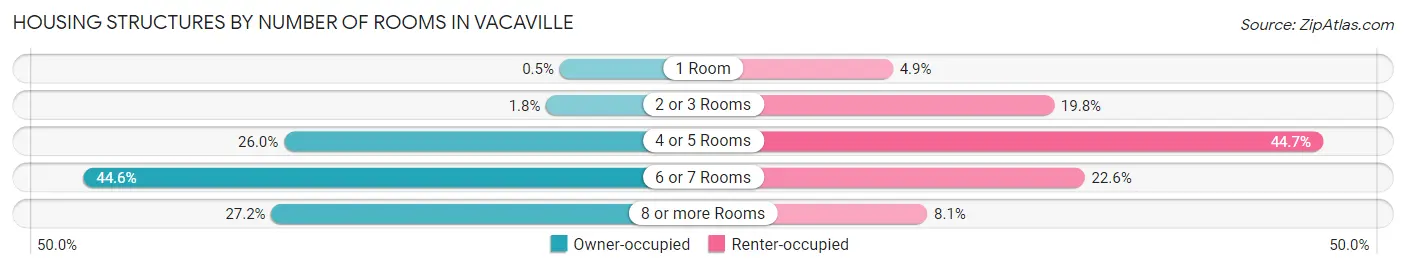
| Number of Rooms | Owner-occupied | Renter-occupied |
| 1 Room | 111 (0.5%) | 556 (4.9%) |
| 2 or 3 Rooms | 392 (1.8%) | 2,252 (19.8%) |
| 4 or 5 Rooms | 5,809 (26.0%) | 5,082 (44.7%) |
| 6 or 7 Rooms | 9,958 (44.6%) | 2,575 (22.6%) |
| 8 or more Rooms | 6,071 (27.2%) | 917 (8.1%) |
| Total | 22,341 (100.0%) | 11,382 (100.0%) |
Housing Structure by Heating Type in Vacaville
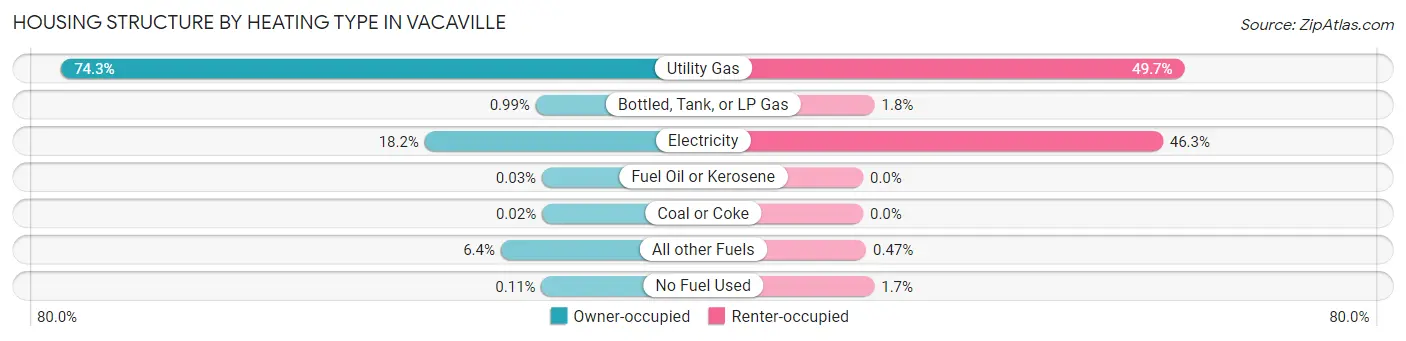
| Heating Type | Owner-occupied | Renter-occupied |
| Utility Gas | 16,605 (74.3%) | 5,653 (49.7%) |
| Bottled, Tank, or LP Gas | 221 (1.0%) | 204 (1.8%) |
| Electricity | 4,054 (18.1%) | 5,274 (46.3%) |
| Fuel Oil or Kerosene | 7 (0.0%) | 0 (0.0%) |
| Coal or Coke | 5 (0.0%) | 0 (0.0%) |
| All other Fuels | 1,425 (6.4%) | 53 (0.5%) |
| No Fuel Used | 24 (0.1%) | 198 (1.7%) |
| Total | 22,341 (100.0%) | 11,382 (100.0%) |
Household Vehicle Usage in Vacaville
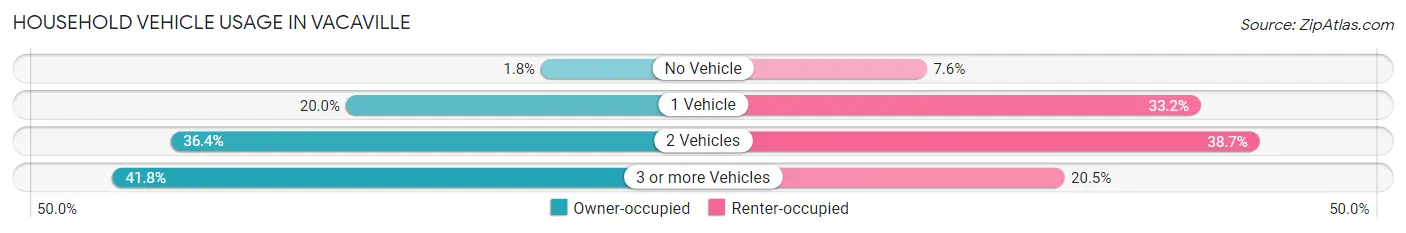
| Vehicles per Household | Owner-occupied | Renter-occupied |
| No Vehicle | 403 (1.8%) | 866 (7.6%) |
| 1 Vehicle | 4,472 (20.0%) | 3,781 (33.2%) |
| 2 Vehicles | 8,132 (36.4%) | 4,406 (38.7%) |
| 3 or more Vehicles | 9,334 (41.8%) | 2,329 (20.5%) |
| Total | 22,341 (100.0%) | 11,382 (100.0%) |
Real Estate & Mortgages in Vacaville
Real Estate and Mortgage Overview in Vacaville
| Characteristic | Without Mortgage | With Mortgage |
| Housing Units | 5,776 | 16,565 |
| Median Property Value | $514,500 | $573,600 |
| Median Household Income | $90,172 | $7,482 |
| Monthly Housing Costs | $666 | $5,617 |
| Real Estate Taxes | $3,090 | $367 |
Property Value by Mortgage Status in Vacaville
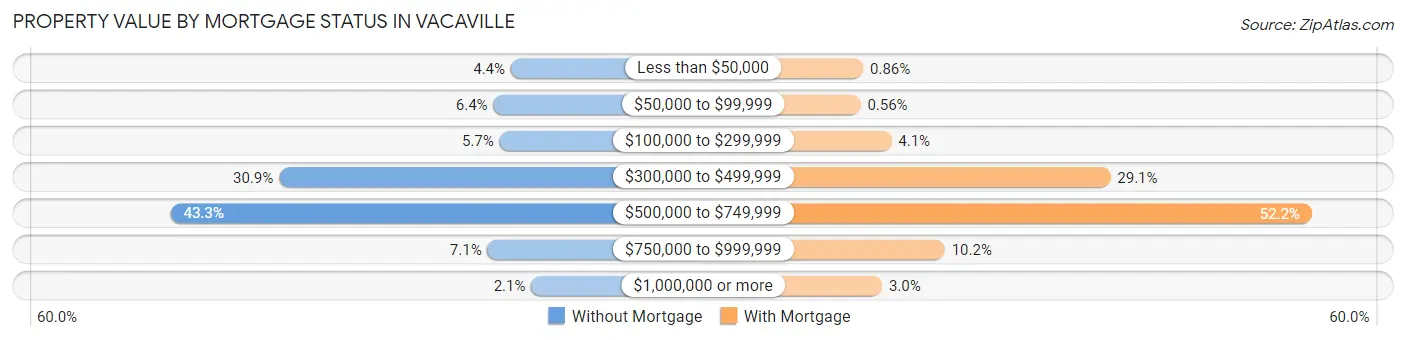
| Property Value | Without Mortgage | With Mortgage |
| Less than $50,000 | 256 (4.4%) | 143 (0.9%) |
| $50,000 to $99,999 | 371 (6.4%) | 93 (0.6%) |
| $100,000 to $299,999 | 330 (5.7%) | 678 (4.1%) |
| $300,000 to $499,999 | 1,786 (30.9%) | 4,824 (29.1%) |
| $500,000 to $749,999 | 2,502 (43.3%) | 8,638 (52.1%) |
| $750,000 to $999,999 | 410 (7.1%) | 1,688 (10.2%) |
| $1,000,000 or more | 121 (2.1%) | 501 (3.0%) |
| Total | 5,776 (100.0%) | 16,565 (100.0%) |
Household Income by Mortgage Status in Vacaville
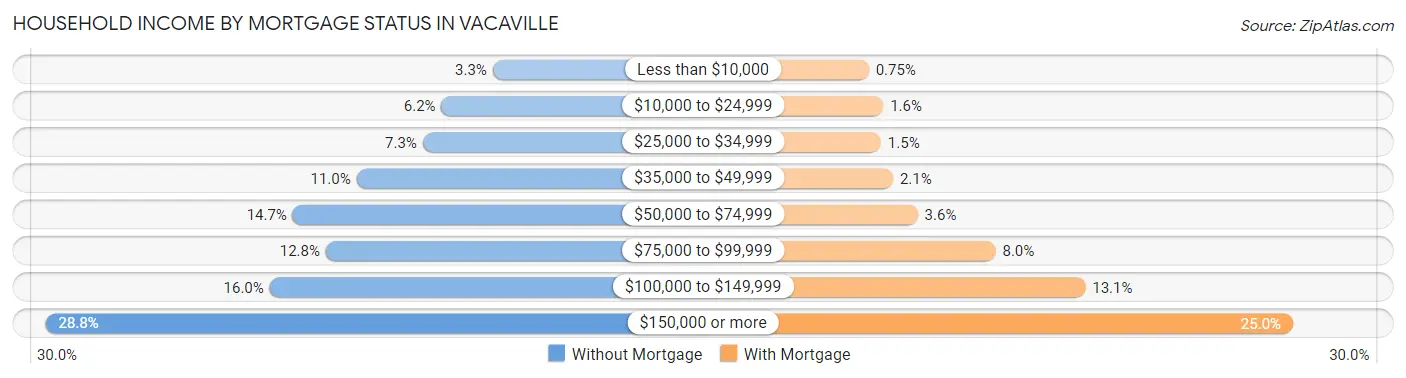
| Household Income | Without Mortgage | With Mortgage |
| Less than $10,000 | 188 (3.3%) | 125 (0.7%) |
| $10,000 to $24,999 | 357 (6.2%) | 261 (1.6%) |
| $25,000 to $34,999 | 419 (7.2%) | 240 (1.5%) |
| $35,000 to $49,999 | 637 (11.0%) | 355 (2.1%) |
| $50,000 to $74,999 | 848 (14.7%) | 588 (3.5%) |
| $75,000 to $99,999 | 739 (12.8%) | 1,325 (8.0%) |
| $100,000 to $149,999 | 924 (16.0%) | 2,175 (13.1%) |
| $150,000 or more | 1,664 (28.8%) | 4,139 (25.0%) |
| Total | 5,776 (100.0%) | 16,565 (100.0%) |
Property Value to Household Income Ratio in Vacaville
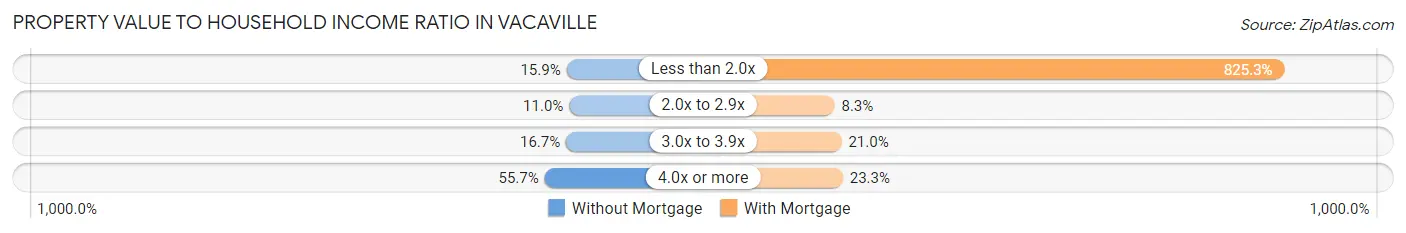
| Value-to-Income Ratio | Without Mortgage | With Mortgage |
| Less than 2.0x | 919 (15.9%) | 136,717 (825.3%) |
| 2.0x to 2.9x | 637 (11.0%) | 1,381 (8.3%) |
| 3.0x to 3.9x | 967 (16.7%) | 3,484 (21.0%) |
| 4.0x or more | 3,216 (55.7%) | 3,861 (23.3%) |
| Total | 5,776 (100.0%) | 16,565 (100.0%) |
Real Estate Taxes by Mortgage Status in Vacaville
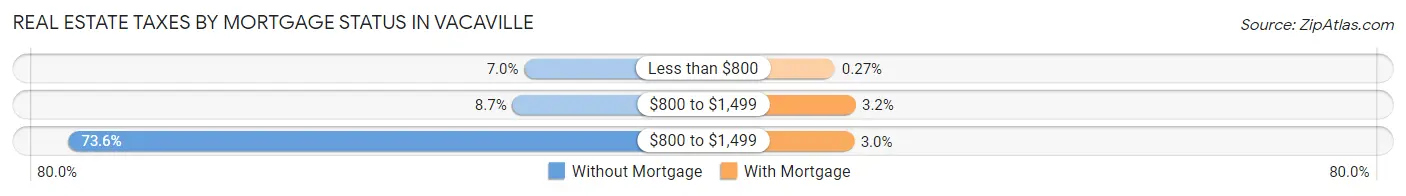
| Property Taxes | Without Mortgage | With Mortgage |
| Less than $800 | 403 (7.0%) | 45 (0.3%) |
| $800 to $1,499 | 503 (8.7%) | 531 (3.2%) |
| $800 to $1,499 | 4,252 (73.6%) | 500 (3.0%) |
| Total | 5,776 (100.0%) | 16,565 (100.0%) |
Health & Disability in Vacaville
Health Insurance Coverage by Age in Vacaville
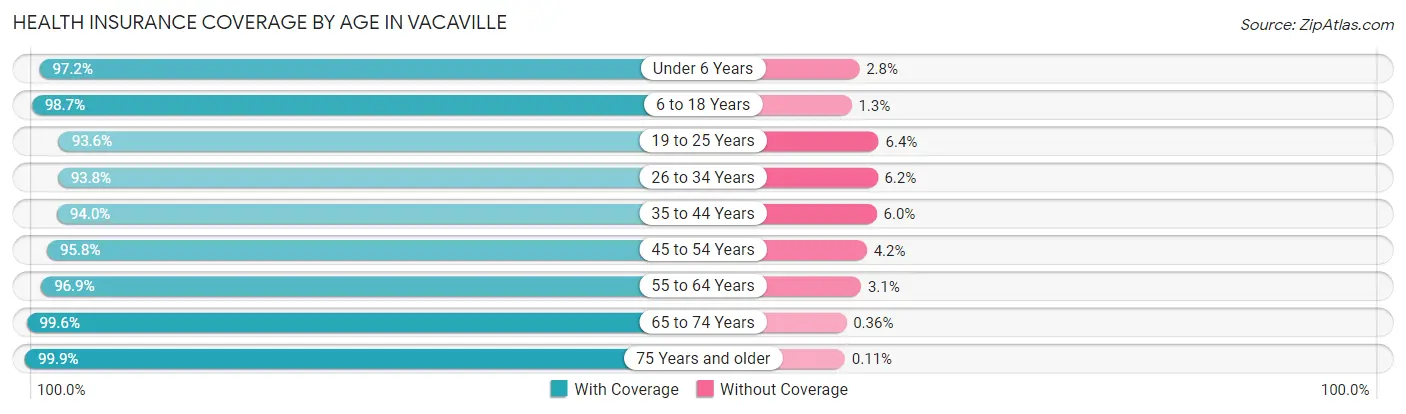
| Age Bracket | With Coverage | Without Coverage |
| Under 6 Years | 7,345 (97.2%) | 210 (2.8%) |
| 6 to 18 Years | 16,303 (98.7%) | 222 (1.3%) |
| 19 to 25 Years | 7,236 (93.6%) | 494 (6.4%) |
| 26 to 34 Years | 12,013 (93.8%) | 791 (6.2%) |
| 35 to 44 Years | 12,346 (94.0%) | 792 (6.0%) |
| 45 to 54 Years | 9,901 (95.8%) | 432 (4.2%) |
| 55 to 64 Years | 11,685 (96.9%) | 375 (3.1%) |
| 65 to 74 Years | 8,650 (99.6%) | 31 (0.4%) |
| 75 Years and older | 5,348 (99.9%) | 6 (0.1%) |
| Total | 90,827 (96.4%) | 3,353 (3.6%) |
Health Insurance Coverage by Citizenship Status in Vacaville
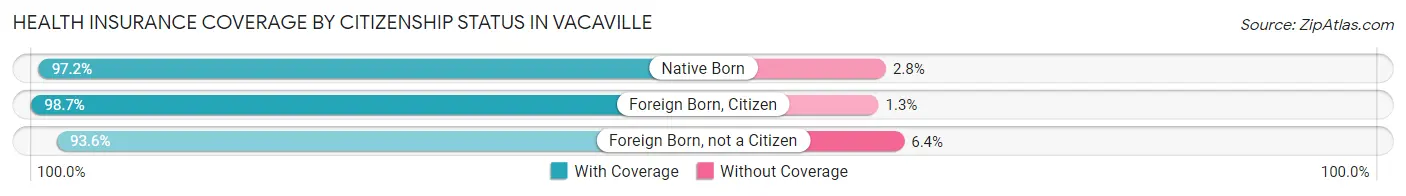
| Citizenship Status | With Coverage | Without Coverage |
| Native Born | 7,345 (97.2%) | 210 (2.8%) |
| Foreign Born, Citizen | 16,303 (98.7%) | 222 (1.3%) |
| Foreign Born, not a Citizen | 7,236 (93.6%) | 494 (6.4%) |
Health Insurance Coverage by Household Income in Vacaville
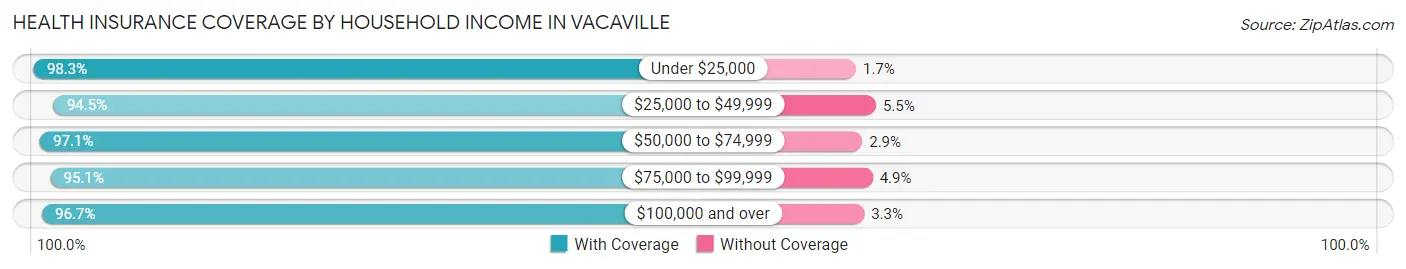
| Household Income | With Coverage | Without Coverage |
| Under $25,000 | 4,308 (98.3%) | 76 (1.7%) |
| $25,000 to $49,999 | 7,882 (94.5%) | 455 (5.5%) |
| $50,000 to $74,999 | 10,173 (97.1%) | 304 (2.9%) |
| $75,000 to $99,999 | 12,077 (95.1%) | 617 (4.9%) |
| $100,000 and over | 56,262 (96.7%) | 1,900 (3.3%) |
Public vs Private Health Insurance Coverage by Age in Vacaville
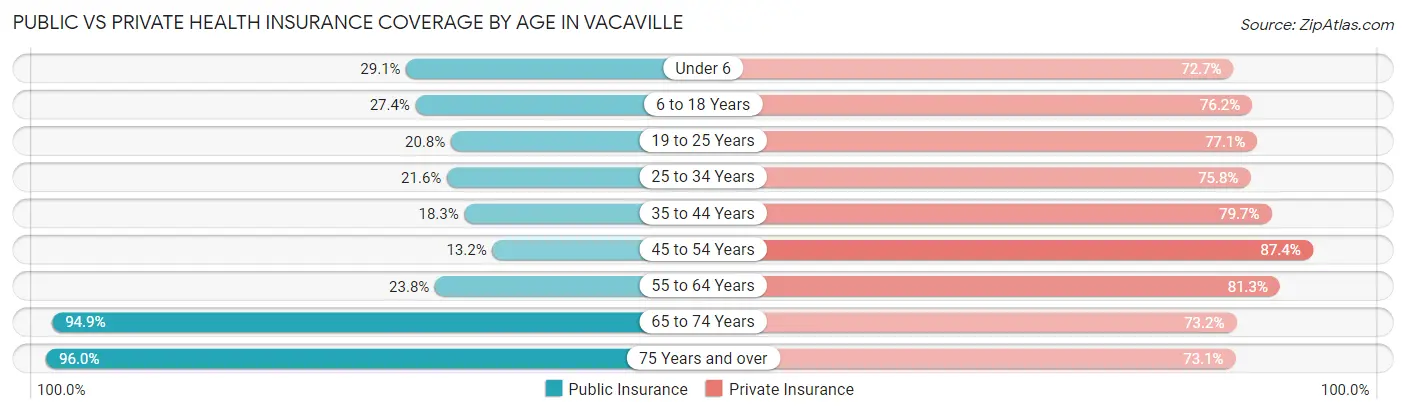
| Age Bracket | Public Insurance | Private Insurance |
| Under 6 | 2,201 (29.1%) | 5,491 (72.7%) |
| 6 to 18 Years | 4,529 (27.4%) | 12,586 (76.2%) |
| 19 to 25 Years | 1,610 (20.8%) | 5,960 (77.1%) |
| 25 to 34 Years | 2,762 (21.6%) | 9,705 (75.8%) |
| 35 to 44 Years | 2,410 (18.3%) | 10,475 (79.7%) |
| 45 to 54 Years | 1,359 (13.2%) | 9,030 (87.4%) |
| 55 to 64 Years | 2,870 (23.8%) | 9,805 (81.3%) |
| 65 to 74 Years | 8,235 (94.9%) | 6,355 (73.2%) |
| 75 Years and over | 5,140 (96.0%) | 3,911 (73.1%) |
| Total | 31,116 (33.0%) | 73,318 (77.8%) |
Disability Status by Sex by Age in Vacaville
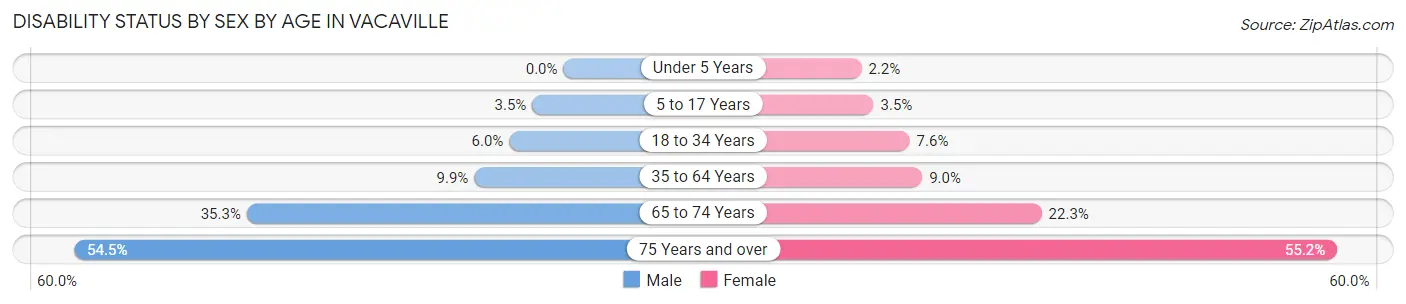
| Age Bracket | Male | Female |
| Under 5 Years | 0 (0.0%) | 62 (2.2%) |
| 5 to 17 Years | 297 (3.5%) | 293 (3.5%) |
| 18 to 34 Years | 624 (6.0%) | 864 (7.6%) |
| 35 to 64 Years | 1,714 (9.9%) | 1,638 (9.0%) |
| 65 to 74 Years | 1,425 (35.3%) | 1,033 (22.3%) |
| 75 Years and over | 1,227 (54.5%) | 1,711 (55.2%) |
Disability Class by Sex by Age in Vacaville
Disability Class: Hearing Difficulty
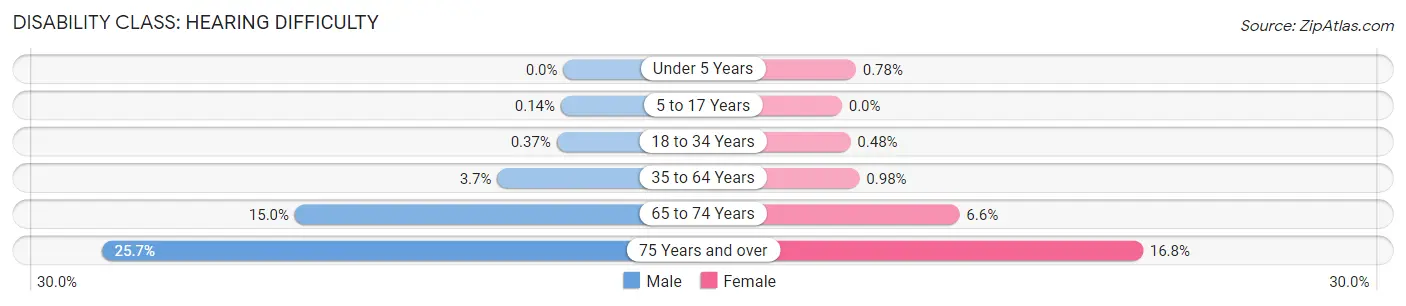
| Age Bracket | Male | Female |
| Under 5 Years | 0 (0.0%) | 22 (0.8%) |
| 5 to 17 Years | 12 (0.1%) | 0 (0.0%) |
| 18 to 34 Years | 38 (0.4%) | 55 (0.5%) |
| 35 to 64 Years | 635 (3.7%) | 179 (1.0%) |
| 65 to 74 Years | 604 (14.9%) | 304 (6.6%) |
| 75 Years and over | 579 (25.7%) | 520 (16.8%) |
Disability Class: Vision Difficulty
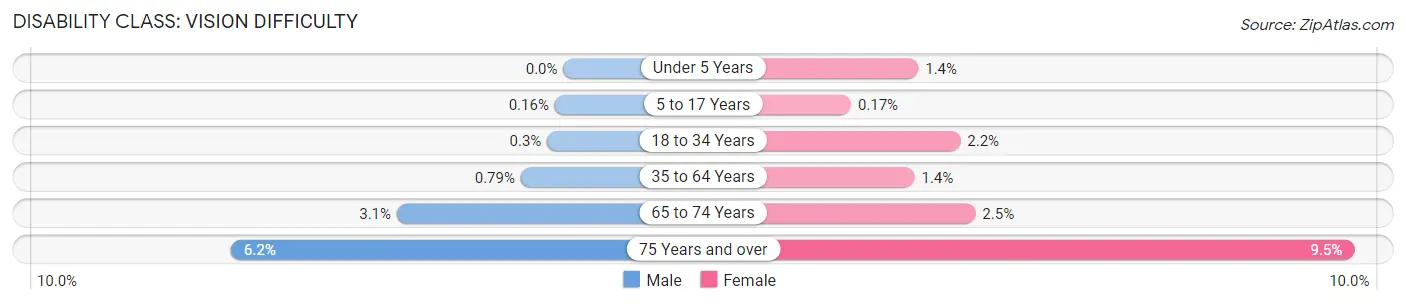
| Age Bracket | Male | Female |
| Under 5 Years | 0 (0.0%) | 40 (1.4%) |
| 5 to 17 Years | 14 (0.2%) | 14 (0.2%) |
| 18 to 34 Years | 31 (0.3%) | 251 (2.2%) |
| 35 to 64 Years | 137 (0.8%) | 246 (1.3%) |
| 65 to 74 Years | 125 (3.1%) | 115 (2.5%) |
| 75 Years and over | 139 (6.2%) | 295 (9.5%) |
Disability Class: Cognitive Difficulty
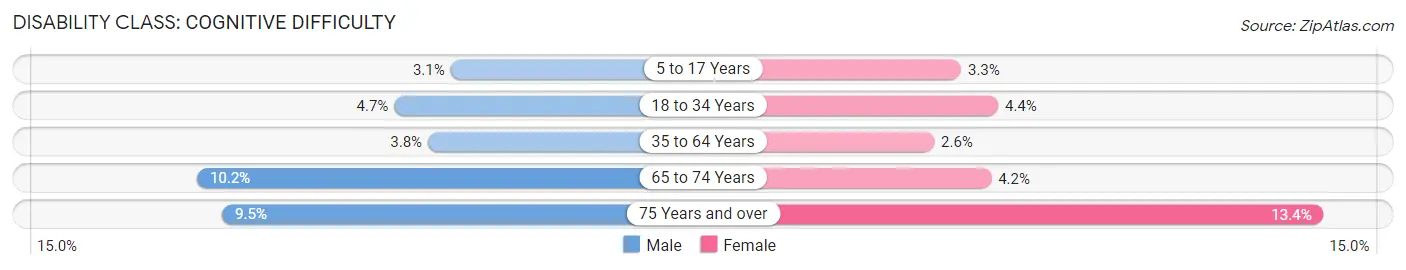
| Age Bracket | Male | Female |
| 5 to 17 Years | 269 (3.1%) | 275 (3.3%) |
| 18 to 34 Years | 487 (4.7%) | 497 (4.3%) |
| 35 to 64 Years | 651 (3.8%) | 470 (2.6%) |
| 65 to 74 Years | 412 (10.2%) | 193 (4.2%) |
| 75 Years and over | 214 (9.5%) | 416 (13.4%) |
Disability Class: Ambulatory Difficulty
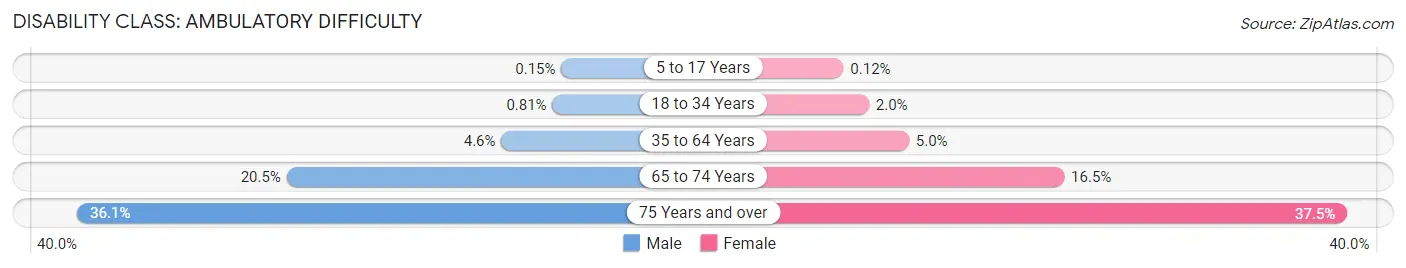
| Age Bracket | Male | Female |
| 5 to 17 Years | 13 (0.2%) | 10 (0.1%) |
| 18 to 34 Years | 84 (0.8%) | 230 (2.0%) |
| 35 to 64 Years | 794 (4.6%) | 910 (5.0%) |
| 65 to 74 Years | 830 (20.5%) | 766 (16.5%) |
| 75 Years and over | 813 (36.1%) | 1,164 (37.5%) |
Disability Class: Self-Care Difficulty
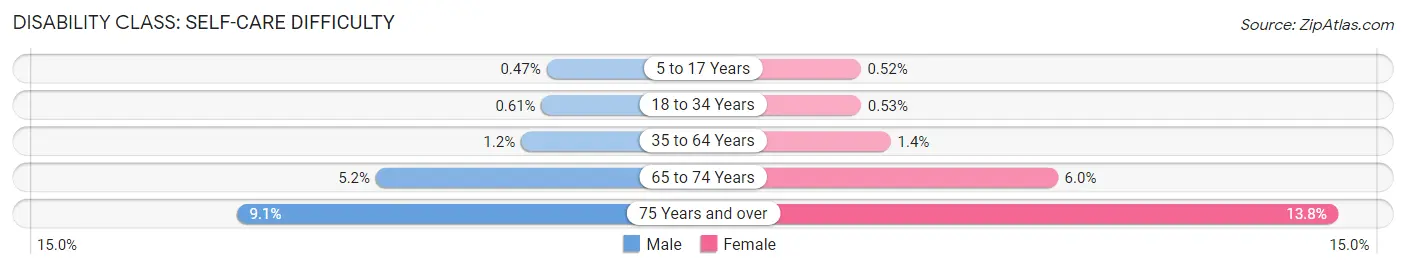
| Age Bracket | Male | Female |
| 5 to 17 Years | 40 (0.5%) | 43 (0.5%) |
| 18 to 34 Years | 63 (0.6%) | 61 (0.5%) |
| 35 to 64 Years | 204 (1.2%) | 248 (1.4%) |
| 65 to 74 Years | 211 (5.2%) | 279 (6.0%) |
| 75 Years and over | 205 (9.1%) | 429 (13.8%) |
Technology Access in Vacaville
Computing Device Access in Vacaville
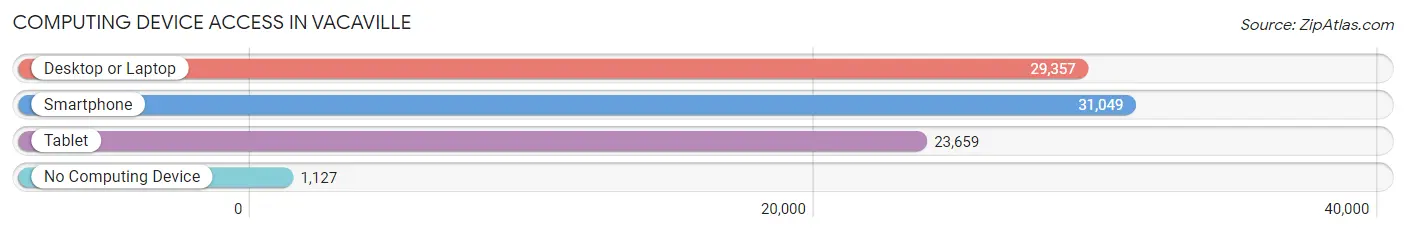
| Device Type | # Households | % Households |
| Desktop or Laptop | 29,357 | 87.1% |
| Smartphone | 31,049 | 92.1% |
| Tablet | 23,659 | 70.2% |
| No Computing Device | 1,127 | 3.3% |
| Total | 33,723 | 100.0% |
Internet Access in Vacaville
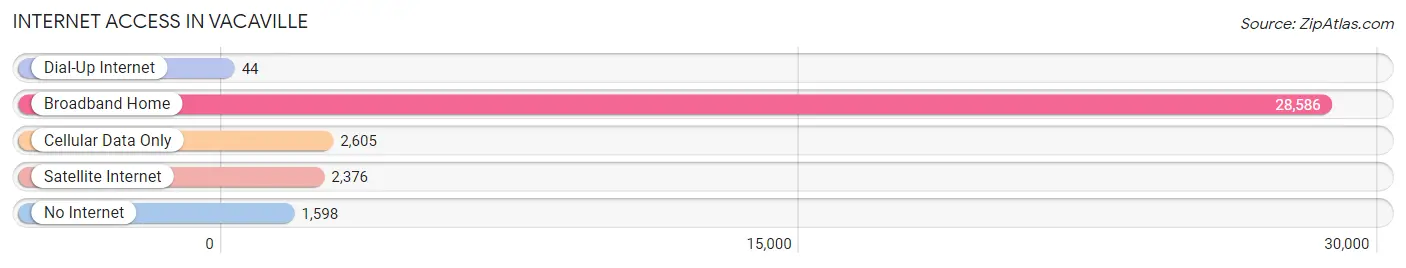
| Internet Type | # Households | % Households |
| Dial-Up Internet | 44 | 0.1% |
| Broadband Home | 28,586 | 84.8% |
| Cellular Data Only | 2,605 | 7.7% |
| Satellite Internet | 2,376 | 7.0% |
| No Internet | 1,598 | 4.7% |
| Total | 33,723 | 100.0% |
Vacaville Summary
Vacaville is a city located in Solano County, California, United States. It is located approximately 35 miles (56 km) from Sacramento and 55 miles (89 km) from San Francisco. The population was 92,428 at the 2010 census. The city was founded in 1851 by William McDaniel and was a Pony Express stop in 1860.
History
Vacaville was founded in 1851 by William McDaniel, a pioneer from Tennessee. He named the city after his hometown of Vacaville, Tennessee. The city was a Pony Express stop in 1860.
In the late 19th century, Vacaville was a major stop on the California-Nevada stagecoach line. The city was also a major stop on the Southern Pacific Railroad.
In the early 20th century, Vacaville was a major agricultural center, producing fruits, vegetables, and nuts. The city was also home to a large cannery, which processed tomatoes, peaches, and other fruits.
Geography
Vacaville is located in the northern part of Solano County, California. It is situated between the cities of Fairfield and Davis. The city is located at the base of the Vaca Mountains, which are part of the Coast Range.
The city has a total area of 28.2 square miles (73.1 km2), of which 28.1 square miles (72.9 km2) is land and 0.1 square miles (0.2 km2) is water.
Economy
Vacaville is a major agricultural center, producing fruits, vegetables, and nuts. The city is also home to a large cannery, which processes tomatoes, peaches, and other fruits.
The city is also home to a number of manufacturing and technology companies, including Genentech, Intel, and Varian Medical Systems.
Demographics
As of the 2010 census, Vacaville had a population of 92,428. The racial makeup of the city was 68.2% White, 8.3% African American, 0.7% Native American, 8.2% Asian, 0.3% Pacific Islander, 8.7% from other races, and 5.2% from two or more races. Hispanic or Latino of any race were 22.2% of the population.
The median income for a household in the city was $60,945, and the median income for a family was $71,817. The per capita income for the city was $27,845. About 8.2% of families and 11.2% of the population were below the poverty line, including 15.2% of those under age 18 and 6.2% of those age 65 or over.
Common Questions
What is Per Capita Income in Vacaville?
Per Capita income in Vacaville is $44,147.
What is the Median Family Income in Vacaville?
Median Family Income in Vacaville is $119,327.
What is the Median Household income in Vacaville?
Median Household Income in Vacaville is $106,764.
What is Income or Wage Gap in Vacaville?
Income or Wage Gap in Vacaville is 24.5%.
Women in Vacaville earn 75.5 cents for every dollar earned by a man.
What is Family Income Deficit in Vacaville?
Family Income Deficit in Vacaville is $11,224.
Families that are below poverty line in Vacaville earn $11,224 less on average than the poverty threshold level.
What is Inequality or Gini Index in Vacaville?
Inequality or Gini Index in Vacaville is 0.39.
What is the Total Population of Vacaville?
Total Population of Vacaville is 101,631.
What is the Total Male Population of Vacaville?
Total Male Population of Vacaville is 52,713.
What is the Total Female Population of Vacaville?
Total Female Population of Vacaville is 48,918.
What is the Ratio of Males per 100 Females in Vacaville?
There are 107.76 Males per 100 Females in Vacaville.
What is the Ratio of Females per 100 Males in Vacaville?
There are 92.80 Females per 100 Males in Vacaville.
What is the Median Population Age in Vacaville?
Median Population Age in Vacaville is 37.3 Years.
What is the Average Family Size in Vacaville
Average Family Size in Vacaville is 3.3 People.
What is the Average Household Size in Vacaville
Average Household Size in Vacaville is 2.8 People.
How Large is the Labor Force in Vacaville?
There are 49,935 People in the Labor Forcein in Vacaville.
What is the Percentage of People in the Labor Force in Vacaville?
61.5% of People are in the Labor Force in Vacaville.
What is the Unemployment Rate in Vacaville?
Unemployment Rate in Vacaville is 5.4%.