La Mesa, CA Map & Demographics
La Mesa Map
La Mesa Overview
$44,185
PER CAPITA INCOME
$104,548
AVG FAMILY INCOME
$83,649
AVG HOUSEHOLD INCOME
26.5%
WAGE / INCOME GAP [ % ]
73.5¢/ $1
WAGE / INCOME GAP [ $ ]
0.44
INEQUALITY / GINI INDEX
60,888
TOTAL POPULATION
29,039
MALE POPULATION
31,849
FEMALE POPULATION
91.18
MALES / 100 FEMALES
109.68
FEMALES / 100 MALES
36.3
MEDIAN AGE
3.1
AVG FAMILY SIZE
2.4
AVG HOUSEHOLD SIZE
34,132
LABOR FORCE [ PEOPLE ]
69.4%
PERCENT IN LABOR FORCE
6.5%
UNEMPLOYMENT RATE
La Mesa Area Codes
Income in La Mesa
Income Overview in La Mesa
Per Capita Income in La Mesa is $44,185, while median incomes of families and households are $104,548 and $83,649 respectively.
| Characteristic | Number | Measure |
| Per Capita Income | 60,888 | $44,185 |
| Median Family Income | 14,153 | $104,548 |
| Mean Family Income | 14,153 | $122,245 |
| Median Household Income | 24,824 | $83,649 |
| Mean Household Income | 24,824 | $105,161 |
| Income Deficit | 14,153 | $0 |
| Wage / Income Gap (%) | 60,888 | 26.50% |
| Wage / Income Gap ($) | 60,888 | 73.50¢ per $1 |
| Gini / Inequality Index | 60,888 | 0.44 |
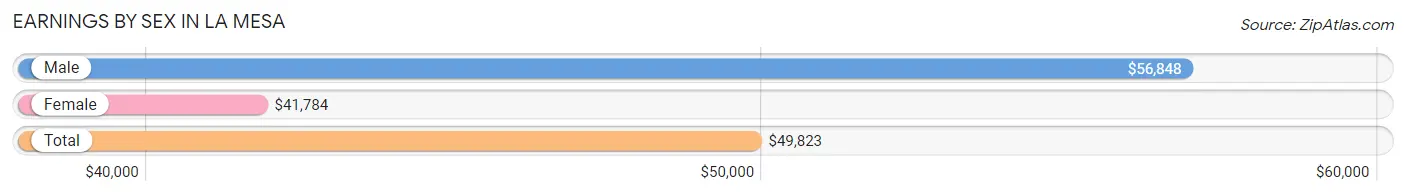
Earnings by Sex in La Mesa
Average Earnings in La Mesa are $49,823, $56,848 for men and $41,784 for women, a difference of 26.5%.
| Sex | Number | Average Earnings |
| Male | 17,514 (50.9%) | $56,848 |
| Female | 16,908 (49.1%) | $41,784 |
| Total | 34,422 (100.0%) | $49,823 |
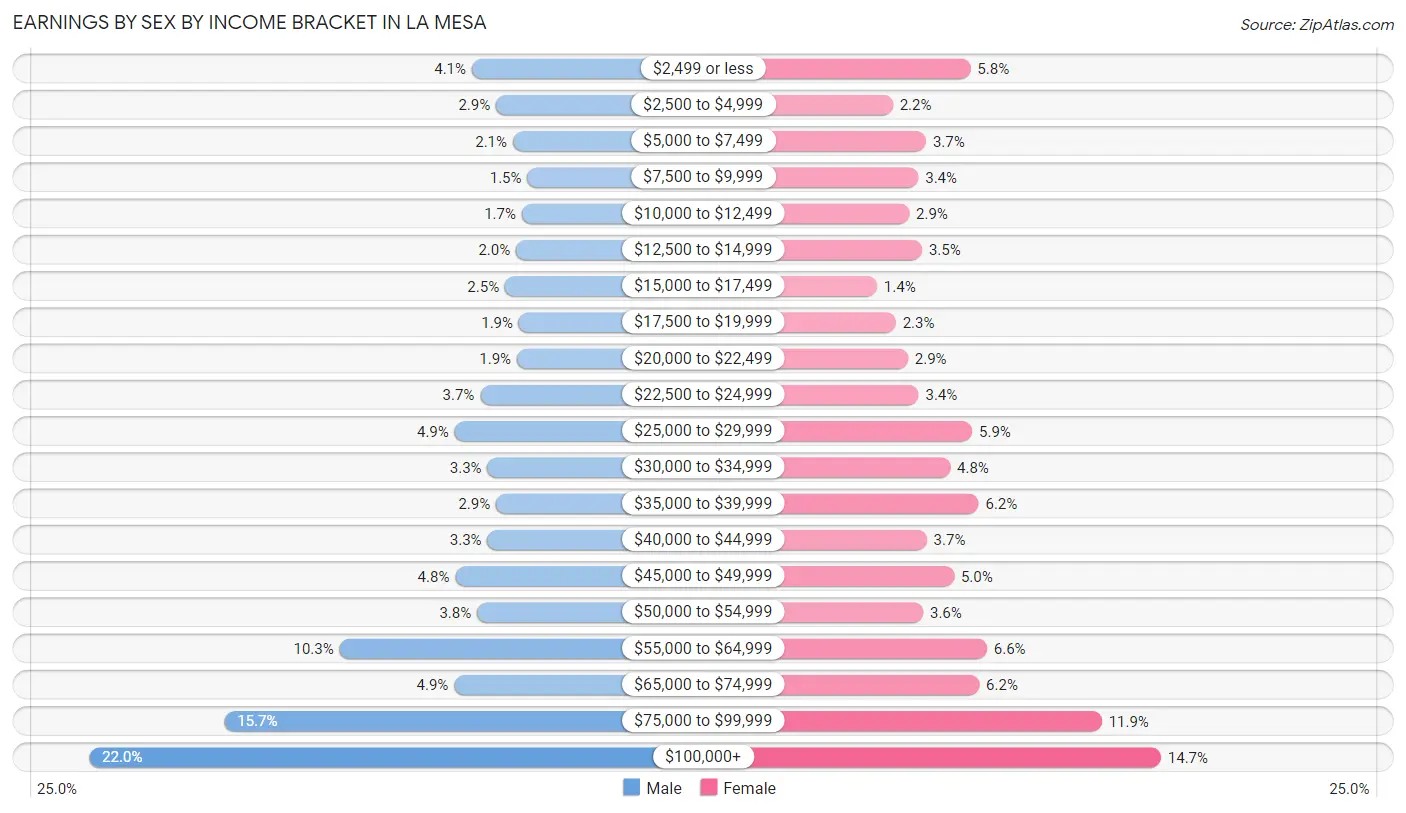
Earnings by Sex by Income Bracket in La Mesa
The most common earnings brackets in La Mesa are $100,000+ for men (3,849 | 22.0%) and $100,000+ for women (2,487 | 14.7%).
| Income | Male | Female |
| $2,499 or less | 709 (4.1%) | 979 (5.8%) |
| $2,500 to $4,999 | 511 (2.9%) | 364 (2.1%) |
| $5,000 to $7,499 | 373 (2.1%) | 627 (3.7%) |
| $7,500 to $9,999 | 254 (1.5%) | 567 (3.4%) |
| $10,000 to $12,499 | 300 (1.7%) | 494 (2.9%) |
| $12,500 to $14,999 | 346 (2.0%) | 596 (3.5%) |
| $15,000 to $17,499 | 437 (2.5%) | 238 (1.4%) |
| $17,500 to $19,999 | 324 (1.8%) | 388 (2.3%) |
| $20,000 to $22,499 | 340 (1.9%) | 484 (2.9%) |
| $22,500 to $24,999 | 641 (3.7%) | 568 (3.4%) |
| $25,000 to $29,999 | 851 (4.9%) | 992 (5.9%) |
| $30,000 to $34,999 | 582 (3.3%) | 819 (4.8%) |
| $35,000 to $39,999 | 512 (2.9%) | 1,044 (6.2%) |
| $40,000 to $44,999 | 582 (3.3%) | 633 (3.7%) |
| $45,000 to $49,999 | 846 (4.8%) | 849 (5.0%) |
| $50,000 to $54,999 | 667 (3.8%) | 604 (3.6%) |
| $55,000 to $64,999 | 1,795 (10.2%) | 1,109 (6.6%) |
| $65,000 to $74,999 | 854 (4.9%) | 1,048 (6.2%) |
| $75,000 to $99,999 | 2,741 (15.7%) | 2,018 (11.9%) |
| $100,000+ | 3,849 (22.0%) | 2,487 (14.7%) |
| Total | 17,514 (100.0%) | 16,908 (100.0%) |
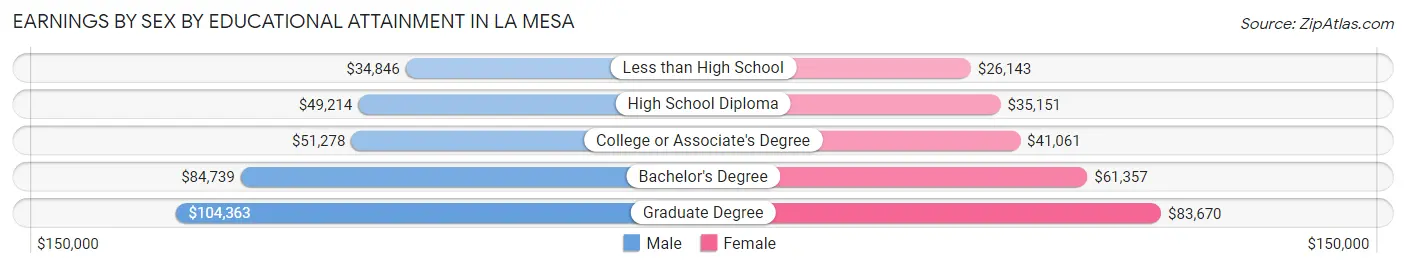
Earnings by Sex by Educational Attainment in La Mesa
Average earnings in La Mesa are $61,508 for men and $47,240 for women, a difference of 23.2%. Men with an educational attainment of graduate degree enjoy the highest average annual earnings of $104,363, while those with less than high school education earn the least with $34,846. Women with an educational attainment of graduate degree earn the most with the average annual earnings of $83,670, while those with less than high school education have the smallest earnings of $26,143.
| Educational Attainment | Male Income | Female Income |
| Less than High School | $34,846 | $26,143 |
| High School Diploma | $49,214 | $35,151 |
| College or Associate's Degree | $51,278 | $41,061 |
| Bachelor's Degree | $84,739 | $61,357 |
| Graduate Degree | $104,363 | $83,670 |
| Total | $61,508 | $47,240 |
Family Income in La Mesa
Family Income Brackets in La Mesa
According to the La Mesa family income data, there are 3,227 families falling into the $100,000 to $149,999 income range, which is the most common income bracket and makes up 22.8% of all families. Conversely, the $10,000 to $14,999 income bracket is the least frequent group with only 184 families (1.3%) belonging to this category.
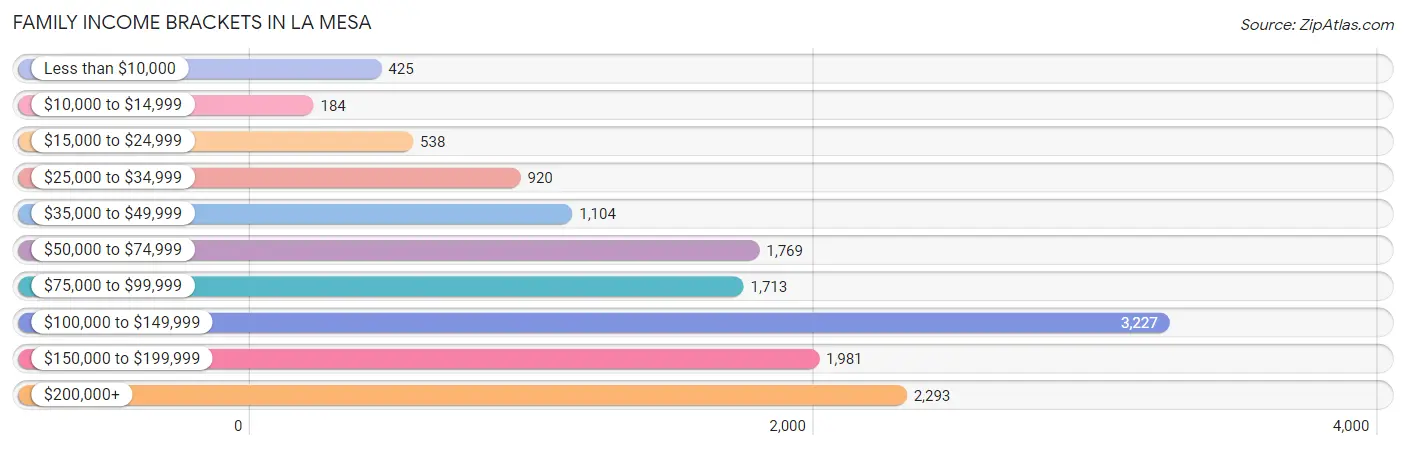
| Income Bracket | # Families | % Families |
| Less than $10,000 | 425 | 3.0% |
| $10,000 to $14,999 | 184 | 1.3% |
| $15,000 to $24,999 | 538 | 3.8% |
| $25,000 to $34,999 | 920 | 6.5% |
| $35,000 to $49,999 | 1,104 | 7.8% |
| $50,000 to $74,999 | 1,769 | 12.5% |
| $75,000 to $99,999 | 1,713 | 12.1% |
| $100,000 to $149,999 | 3,227 | 22.8% |
| $150,000 to $199,999 | 1,981 | 14.0% |
| $200,000+ | 2,293 | 16.2% |
Family Income by Famaliy Size in La Mesa
4-person families (2,527 | 17.8%) account for the highest median family income in La Mesa with $125,464 per family, while 2-person families (6,779 | 47.9%) have the highest median income of $48,008 per family member.
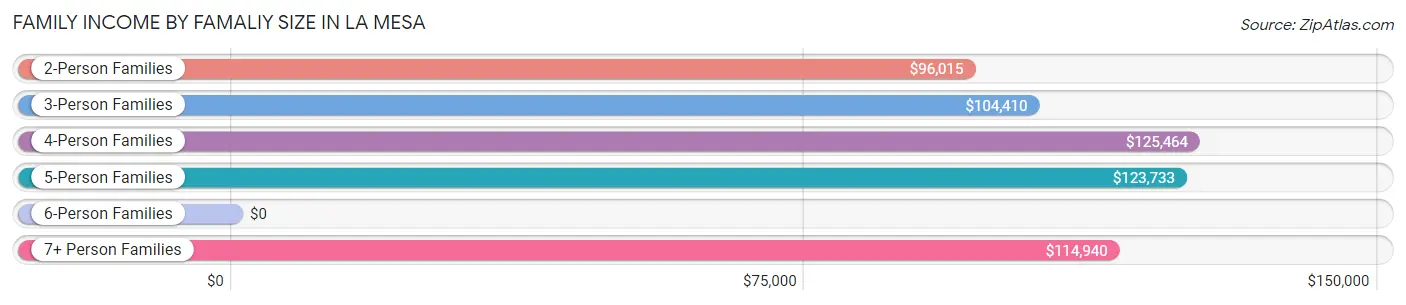
| Income Bracket | # Families | Median Income |
| 2-Person Families | 6,779 (47.9%) | $96,015 |
| 3-Person Families | 3,517 (24.8%) | $104,410 |
| 4-Person Families | 2,527 (17.8%) | $125,464 |
| 5-Person Families | 845 (6.0%) | $123,733 |
| 6-Person Families | 344 (2.4%) | $0 |
| 7+ Person Families | 141 (1.0%) | $114,940 |
| Total | 14,153 (100.0%) | $104,548 |
Family Income by Number of Earners in La Mesa
The median family income in La Mesa is $104,548, with families comprising 3+ earners (1,145) having the highest median family income of $158,201, while families with no earners (1,386) have the lowest median family income of $56,053, accounting for 8.1% and 9.8% of families, respectively.
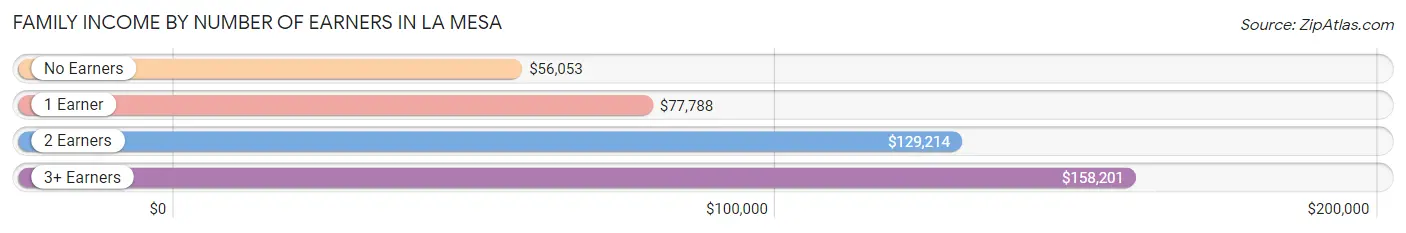
| Number of Earners | # Families | Median Income |
| No Earners | 1,386 (9.8%) | $56,053 |
| 1 Earner | 5,221 (36.9%) | $77,788 |
| 2 Earners | 6,401 (45.2%) | $129,214 |
| 3+ Earners | 1,145 (8.1%) | $158,201 |
| Total | 14,153 (100.0%) | $104,548 |
Household Income in La Mesa
Household Income Brackets in La Mesa
With 4,890 households falling in the category, the $100,000 to $149,999 income range is the most frequent in La Mesa, accounting for 19.7% of all households. In contrast, only 621 households (2.5%) fall into the $10,000 to $14,999 income bracket, making it the least populous group.
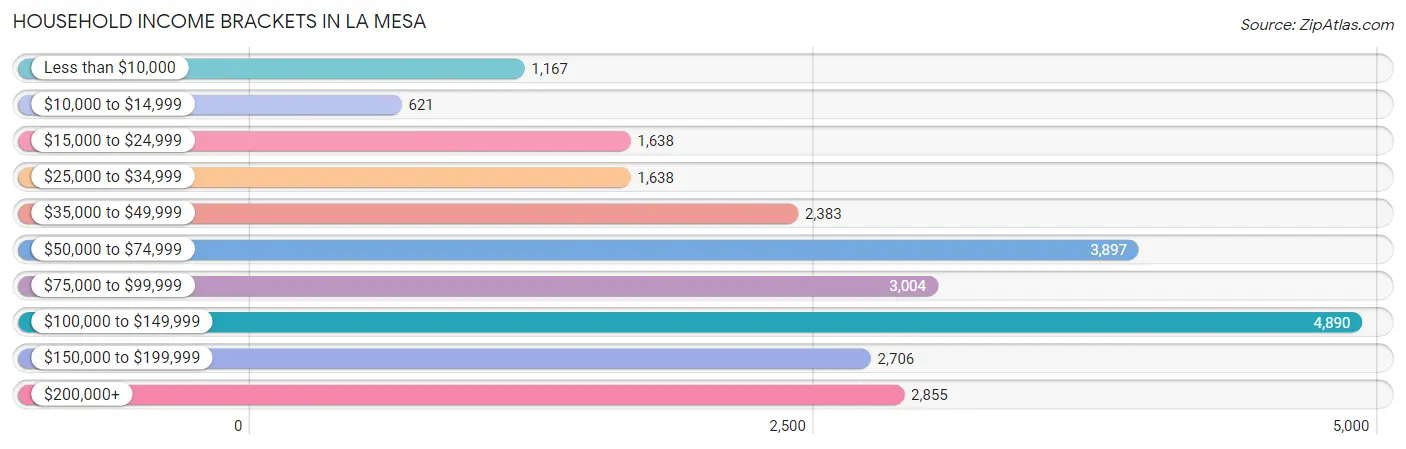
| Income Bracket | # Households | % Households |
| Less than $10,000 | 1,167 | 4.7% |
| $10,000 to $14,999 | 621 | 2.5% |
| $15,000 to $24,999 | 1,638 | 6.6% |
| $25,000 to $34,999 | 1,638 | 6.6% |
| $35,000 to $49,999 | 2,383 | 9.6% |
| $50,000 to $74,999 | 3,897 | 15.7% |
| $75,000 to $99,999 | 3,004 | 12.1% |
| $100,000 to $149,999 | 4,890 | 19.7% |
| $150,000 to $199,999 | 2,706 | 10.9% |
| $200,000+ | 2,855 | 11.5% |
Household Income by Householder Age in La Mesa
The median household income in La Mesa is $83,649, with the highest median household income of $98,333 found in the 25 to 44 years age bracket for the primary householder. A total of 9,470 households (38.2%) fall into this category. Meanwhile, the 65+ years age bracket for the primary householder has the lowest median household income of $54,633, with 5,854 households (23.6%) in this group.
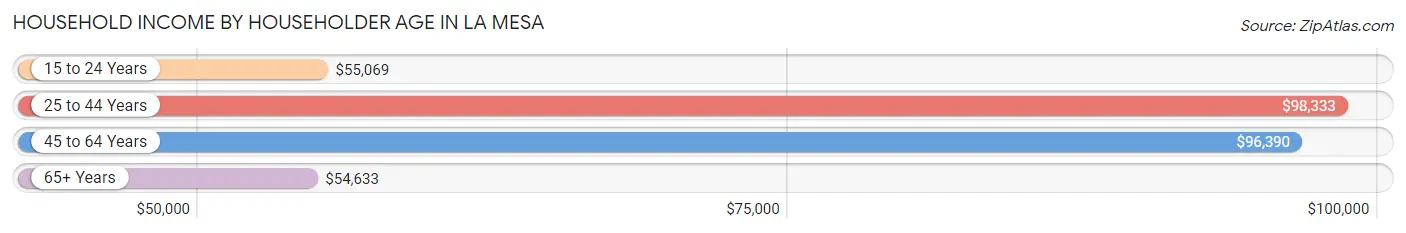
| Income Bracket | # Households | Median Income |
| 15 to 24 Years | 1,297 (5.2%) | $55,069 |
| 25 to 44 Years | 9,470 (38.2%) | $98,333 |
| 45 to 64 Years | 8,203 (33.0%) | $96,390 |
| 65+ Years | 5,854 (23.6%) | $54,633 |
| Total | 24,824 (100.0%) | $83,649 |
Poverty in La Mesa
Income Below Poverty by Sex and Age in La Mesa
With 9.1% poverty level for males and 14.0% for females among the residents of La Mesa, 15 year old males and 18 to 24 year old females are the most vulnerable to poverty, with 130 males (33.7%) and 915 females (34.3%) in their respective age groups living below the poverty level.
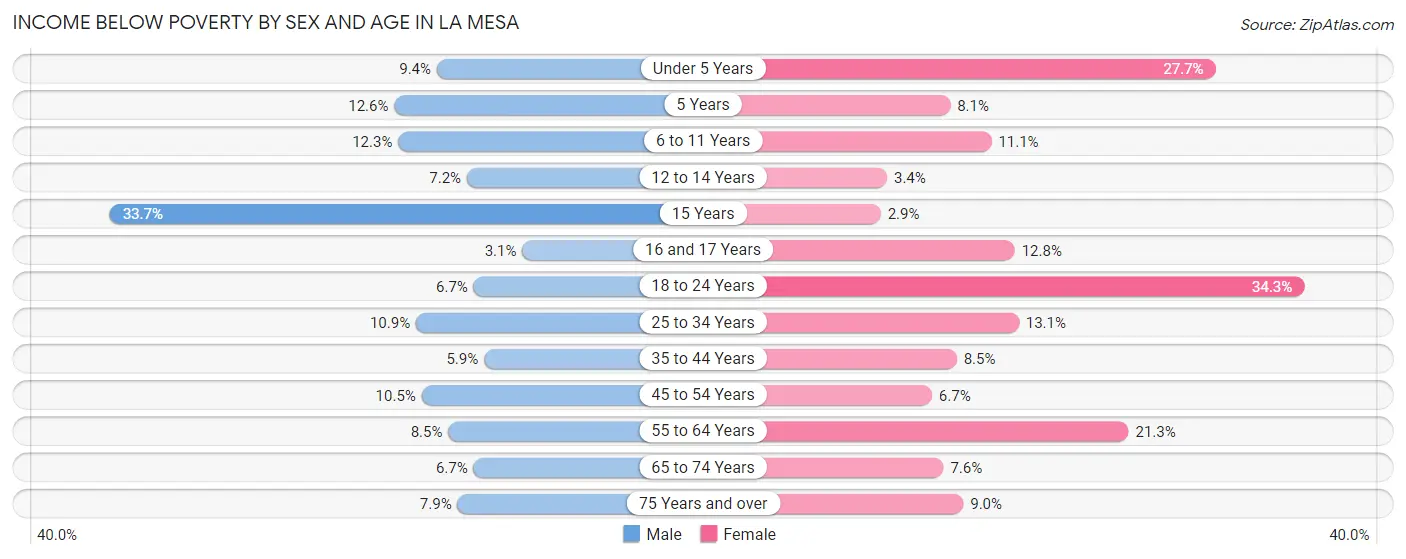
| Age Bracket | Male | Female |
| Under 5 Years | 199 (9.4%) | 600 (27.7%) |
| 5 Years | 30 (12.6%) | 26 (8.1%) |
| 6 to 11 Years | 272 (12.3%) | 180 (11.1%) |
| 12 to 14 Years | 73 (7.2%) | 41 (3.4%) |
| 15 Years | 130 (33.7%) | 9 (2.9%) |
| 16 and 17 Years | 18 (3.0%) | 71 (12.8%) |
| 18 to 24 Years | 148 (6.7%) | 915 (34.3%) |
| 25 to 34 Years | 642 (10.9%) | 733 (13.1%) |
| 35 to 44 Years | 251 (5.9%) | 396 (8.5%) |
| 45 to 54 Years | 355 (10.5%) | 238 (6.7%) |
| 55 to 64 Years | 255 (8.5%) | 773 (21.3%) |
| 65 to 74 Years | 138 (6.7%) | 222 (7.5%) |
| 75 Years and over | 100 (7.9%) | 200 (9.0%) |
| Total | 2,611 (9.1%) | 4,404 (14.0%) |
Income Above Poverty by Sex and Age in La Mesa
According to the poverty statistics in La Mesa, males aged 16 and 17 years and females aged 15 years are the age groups that are most secure financially, with 97.0% of males and 97.1% of females in these age groups living above the poverty line.
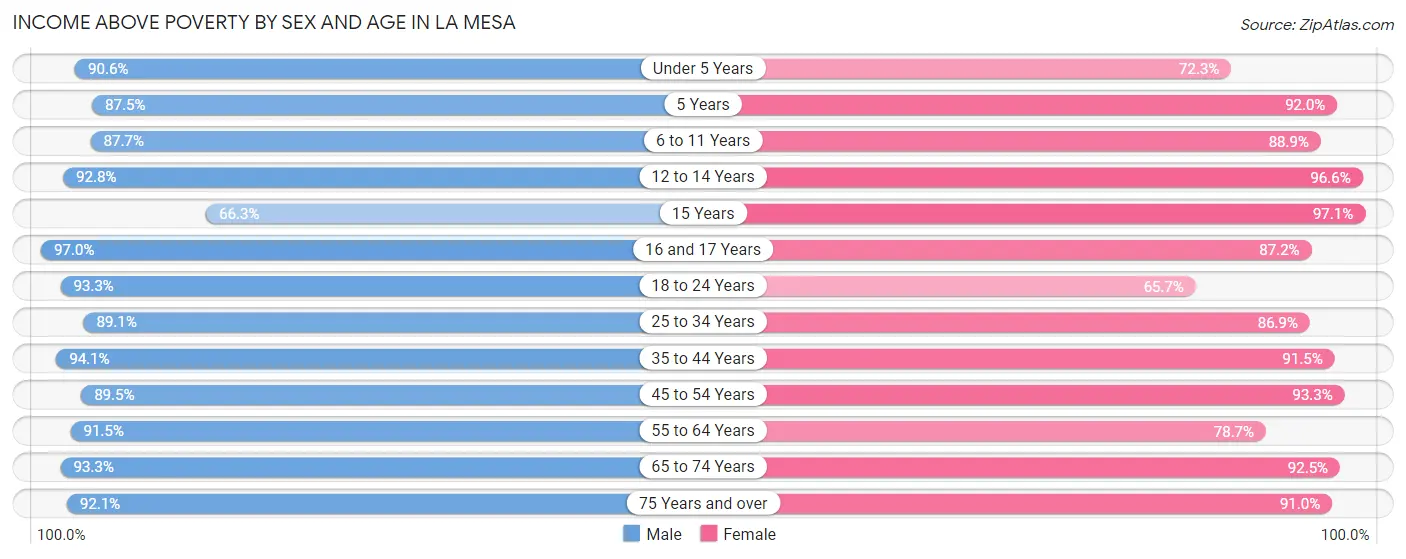
| Age Bracket | Male | Female |
| Under 5 Years | 1,920 (90.6%) | 1,563 (72.3%) |
| 5 Years | 209 (87.5%) | 297 (91.9%) |
| 6 to 11 Years | 1,946 (87.7%) | 1,440 (88.9%) |
| 12 to 14 Years | 947 (92.8%) | 1,181 (96.6%) |
| 15 Years | 256 (66.3%) | 302 (97.1%) |
| 16 and 17 Years | 572 (97.0%) | 482 (87.2%) |
| 18 to 24 Years | 2,075 (93.3%) | 1,751 (65.7%) |
| 25 to 34 Years | 5,227 (89.1%) | 4,844 (86.9%) |
| 35 to 44 Years | 4,011 (94.1%) | 4,246 (91.5%) |
| 45 to 54 Years | 3,018 (89.5%) | 3,321 (93.3%) |
| 55 to 64 Years | 2,730 (91.5%) | 2,858 (78.7%) |
| 65 to 74 Years | 1,932 (93.3%) | 2,718 (92.4%) |
| 75 Years and over | 1,172 (92.1%) | 2,017 (91.0%) |
| Total | 26,015 (90.9%) | 27,020 (86.0%) |
Income Below Poverty Among Married-Couple Families in La Mesa
The poverty statistics for married-couple families in La Mesa show that 5.3% or 527 of the total 9,888 families live below the poverty line. Families with 5 or more children have the highest poverty rate of 78.8%, comprising of 26 families. On the other hand, families with no children have the lowest poverty rate of 3.5%, which includes 185 families.
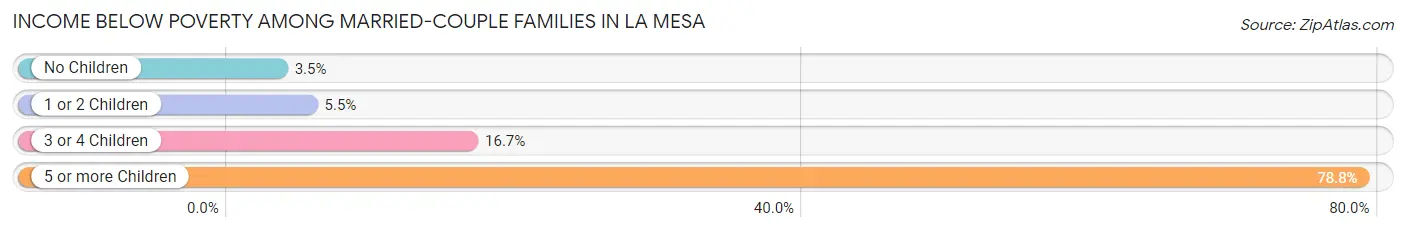
| Children | Above Poverty | Below Poverty |
| No Children | 5,164 (96.5%) | 185 (3.5%) |
| 1 or 2 Children | 3,697 (94.5%) | 217 (5.5%) |
| 3 or 4 Children | 493 (83.3%) | 99 (16.7%) |
| 5 or more Children | 7 (21.2%) | 26 (78.8%) |
| Total | 9,361 (94.7%) | 527 (5.3%) |
Income Below Poverty Among Single-Parent Households in La Mesa
According to the poverty data in La Mesa, 3.5% or 37 single-father households and 14.7% or 473 single-mother households are living below the poverty line. Among single-father households, those with 3 or 4 children have the highest poverty rate, with 14 households (33.3%) experiencing poverty. Likewise, among single-mother households, those with 3 or 4 children have the highest poverty rate, with 114 households (57.6%) falling below the poverty line.
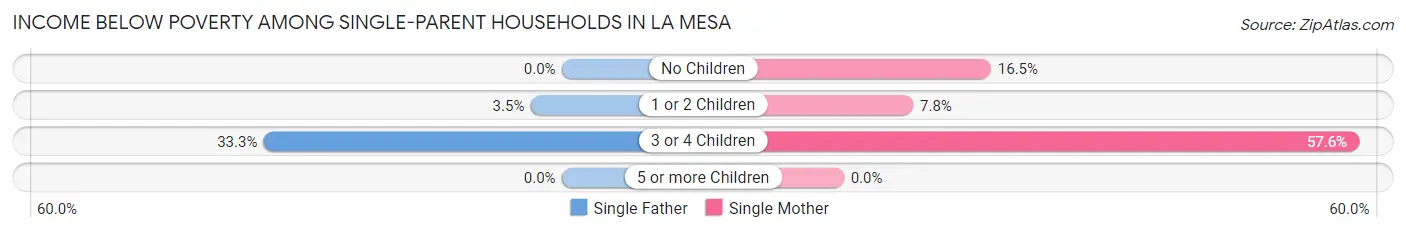
| Children | Single Father | Single Mother |
| No Children | 0 (0.0%) | 236 (16.5%) |
| 1 or 2 Children | 23 (3.5%) | 123 (7.8%) |
| 3 or 4 Children | 14 (33.3%) | 114 (57.6%) |
| 5 or more Children | 0 (0.0%) | 0 (0.0%) |
| Total | 37 (3.5%) | 473 (14.7%) |
Income Below Poverty Among Married-Couple vs Single-Parent Households in La Mesa
The poverty data for La Mesa shows that 527 of the married-couple family households (5.3%) and 510 of the single-parent households (12.0%) are living below the poverty level. Within the married-couple family households, those with 5 or more children have the highest poverty rate, with 26 households (78.8%) falling below the poverty line. Among the single-parent households, those with 3 or 4 children have the highest poverty rate, with 128 household (53.3%) living below poverty.
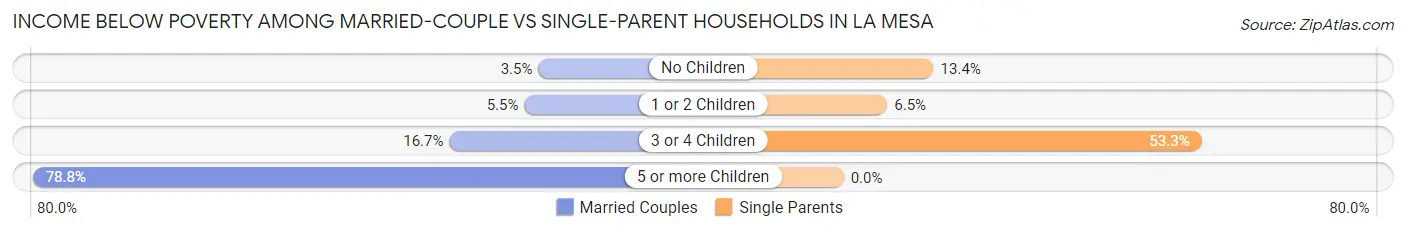
| Children | Married-Couple Families | Single-Parent Households |
| No Children | 185 (3.5%) | 236 (13.4%) |
| 1 or 2 Children | 217 (5.5%) | 146 (6.5%) |
| 3 or 4 Children | 99 (16.7%) | 128 (53.3%) |
| 5 or more Children | 26 (78.8%) | 0 (0.0%) |
| Total | 527 (5.3%) | 510 (12.0%) |
Race in La Mesa
The most populous races in La Mesa are White / Caucasian (38,311 | 62.9%), Hispanic or Latino (17,079 | 28.1%), and Two or more Races (9,267 | 15.2%).
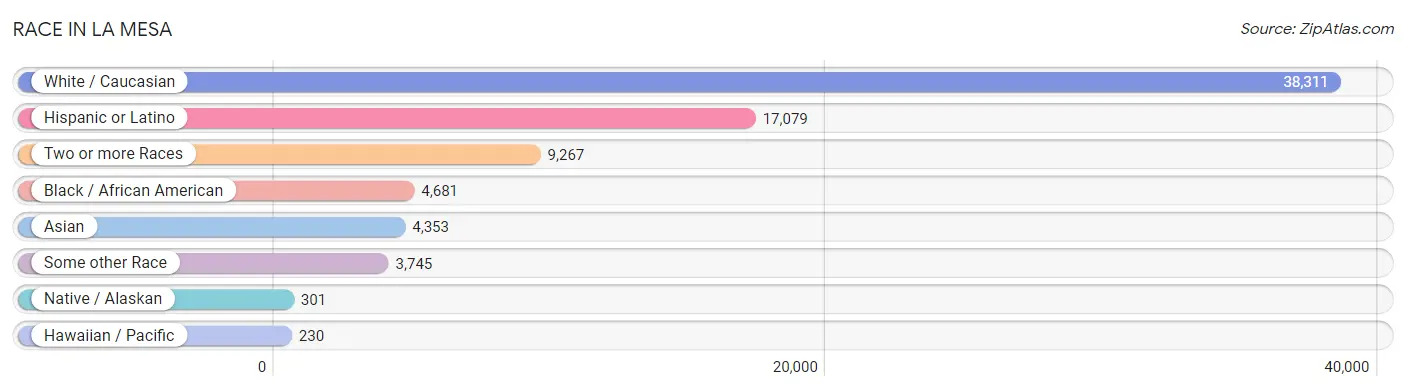
| Race | # Population | % Population |
| Asian | 4,353 | 7.1% |
| Black / African American | 4,681 | 7.7% |
| Hawaiian / Pacific | 230 | 0.4% |
| Hispanic or Latino | 17,079 | 28.1% |
| Native / Alaskan | 301 | 0.5% |
| White / Caucasian | 38,311 | 62.9% |
| Two or more Races | 9,267 | 15.2% |
| Some other Race | 3,745 | 6.1% |
| Total | 60,888 | 100.0% |
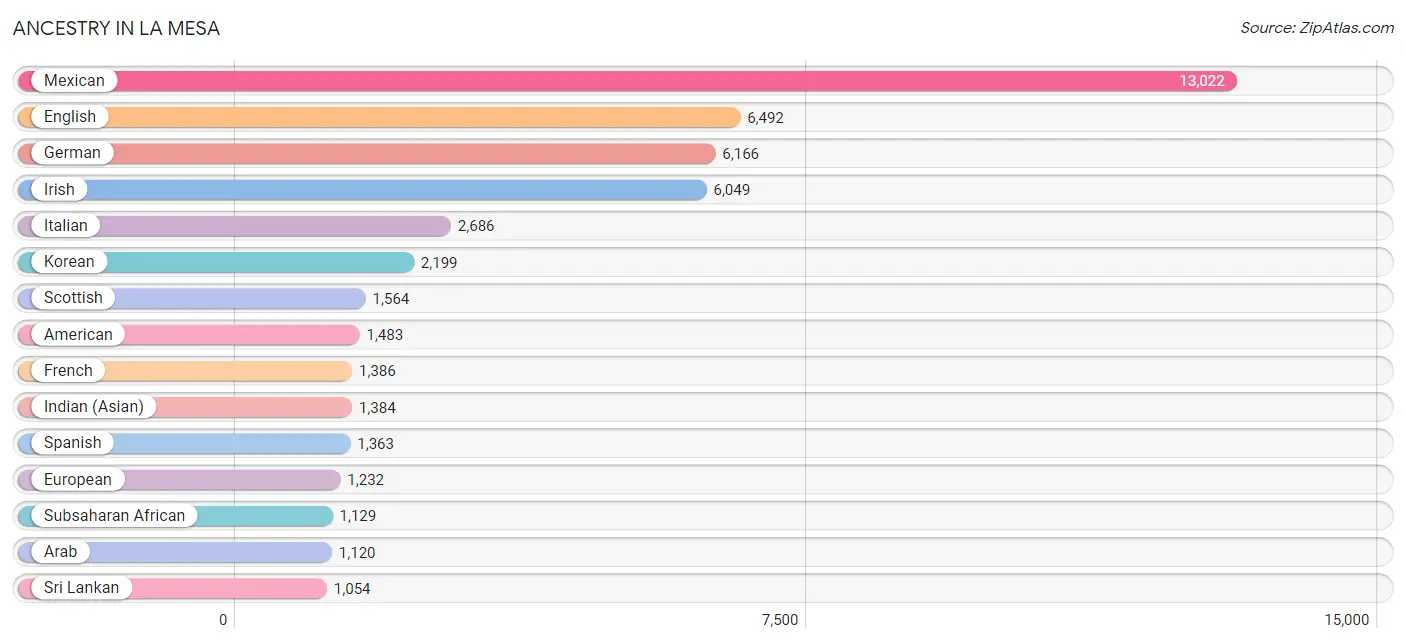
Ancestry in La Mesa
The most populous ancestries reported in La Mesa are Mexican (13,022 | 21.4%), English (6,492 | 10.7%), German (6,166 | 10.1%), Irish (6,049 | 9.9%), and Italian (2,686 | 4.4%), together accounting for 56.5% of all La Mesa residents.
| Ancestry | # Population | % Population |
| Afghan | 14 | 0.0% |
| African | 377 | 0.6% |
| Alsatian | 15 | 0.0% |
| American | 1,483 | 2.4% |
| Arab | 1,120 | 1.8% |
| Argentinean | 49 | 0.1% |
| Armenian | 276 | 0.4% |
| Assyrian / Chaldean / Syriac | 26 | 0.0% |
| Austrian | 148 | 0.2% |
| Bangladeshi | 100 | 0.2% |
| Barbadian | 17 | 0.0% |
| Basque | 27 | 0.0% |
| Belgian | 9 | 0.0% |
| Belizean | 18 | 0.0% |
| Bhutanese | 668 | 1.1% |
| Blackfeet | 80 | 0.1% |
| British | 556 | 0.9% |
| Bulgarian | 157 | 0.3% |
| Burmese | 428 | 0.7% |
| Canadian | 187 | 0.3% |
| Central American | 781 | 1.3% |
| Central American Indian | 25 | 0.0% |
| Cherokee | 105 | 0.2% |
| Chilean | 38 | 0.1% |
| Choctaw | 64 | 0.1% |
| Colombian | 9 | 0.0% |
| Comanche | 16 | 0.0% |
| Costa Rican | 62 | 0.1% |
| Creek | 10 | 0.0% |
| Croatian | 109 | 0.2% |
| Cuban | 75 | 0.1% |
| Czech | 426 | 0.7% |
| Czechoslovakian | 324 | 0.5% |
| Danish | 311 | 0.5% |
| Dominican | 199 | 0.3% |
| Dutch | 603 | 1.0% |
| Eastern European | 226 | 0.4% |
| Ecuadorian | 15 | 0.0% |
| Egyptian | 134 | 0.2% |
| English | 6,492 | 10.7% |
| Ethiopian | 326 | 0.5% |
| European | 1,232 | 2.0% |
| Filipino | 90 | 0.2% |
| Finnish | 97 | 0.2% |
| French | 1,386 | 2.3% |
| French Canadian | 464 | 0.8% |
| German | 6,166 | 10.1% |
| Ghanaian | 86 | 0.1% |
| Greek | 478 | 0.8% |
| Guamanian / Chamorro | 520 | 0.9% |
| Guatemalan | 118 | 0.2% |
| Haitian | 73 | 0.1% |
| Honduran | 2 | 0.0% |
| Hopi | 7 | 0.0% |
| Hungarian | 152 | 0.3% |
| Icelander | 13 | 0.0% |
| Indian (Asian) | 1,384 | 2.3% |
| Iranian | 185 | 0.3% |
| Iraqi | 363 | 0.6% |
| Irish | 6,049 | 9.9% |
| Israeli | 10 | 0.0% |
| Italian | 2,686 | 4.4% |
| Jamaican | 40 | 0.1% |
| Japanese | 68 | 0.1% |
| Korean | 2,199 | 3.6% |
| Laotian | 112 | 0.2% |
| Lebanese | 98 | 0.2% |
| Lithuanian | 127 | 0.2% |
| Malaysian | 43 | 0.1% |
| Mexican | 13,022 | 21.4% |
| Mexican American Indian | 110 | 0.2% |
| Moroccan | 36 | 0.1% |
| Native Hawaiian | 191 | 0.3% |
| Navajo | 38 | 0.1% |
| Nepalese | 58 | 0.1% |
| New Zealander | 15 | 0.0% |
| Nicaraguan | 42 | 0.1% |
| Nigerian | 226 | 0.4% |
| Northern European | 254 | 0.4% |
| Norwegian | 994 | 1.6% |
| Pakistani | 52 | 0.1% |
| Palestinian | 49 | 0.1% |
| Panamanian | 159 | 0.3% |
| Peruvian | 116 | 0.2% |
| Polish | 822 | 1.3% |
| Portuguese | 399 | 0.7% |
| Potawatomi | 26 | 0.0% |
| Pueblo | 27 | 0.0% |
| Puerto Rican | 674 | 1.1% |
| Romanian | 191 | 0.3% |
| Russian | 411 | 0.7% |
| Salvadoran | 119 | 0.2% |
| Samoan | 88 | 0.1% |
| Scandinavian | 206 | 0.3% |
| Scotch-Irish | 532 | 0.9% |
| Scottish | 1,564 | 2.6% |
| Serbian | 13 | 0.0% |
| Shoshone | 10 | 0.0% |
| Slavic | 18 | 0.0% |
| Slovak | 96 | 0.2% |
| Slovene | 9 | 0.0% |
| Somali | 116 | 0.2% |
| South American | 262 | 0.4% |
| Spaniard | 440 | 0.7% |
| Spanish | 1,363 | 2.2% |
| Sri Lankan | 1,054 | 1.7% |
| Subsaharan African | 1,129 | 1.8% |
| Swedish | 749 | 1.2% |
| Swiss | 362 | 0.6% |
| Thai | 245 | 0.4% |
| Turkish | 29 | 0.1% |
| Ukrainian | 293 | 0.5% |
| Ute | 31 | 0.1% |
| Venezuelan | 22 | 0.0% |
| Welsh | 204 | 0.3% |
| West Indian | 15 | 0.0% |
| Yaqui | 124 | 0.2% |
| Yugoslavian | 6 | 0.0% | View All 118 Rows |
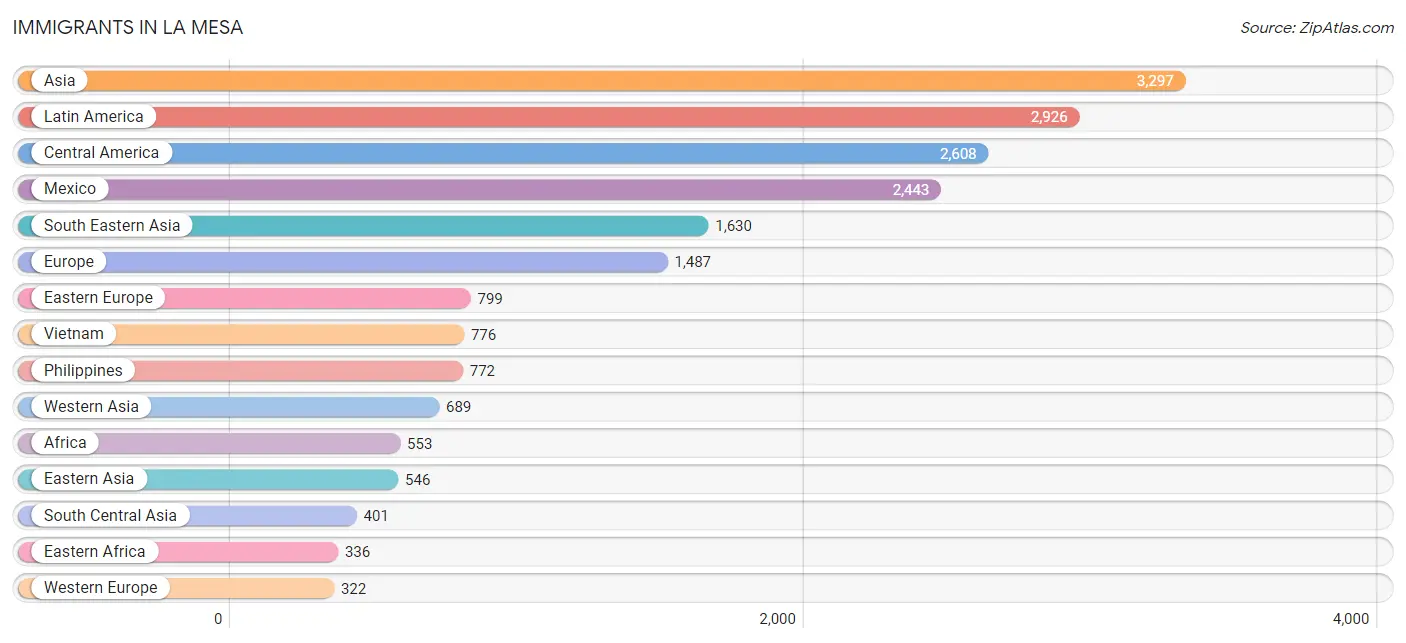
Immigrants in La Mesa
The most numerous immigrant groups reported in La Mesa came from Asia (3,297 | 5.4%), Latin America (2,926 | 4.8%), Central America (2,608 | 4.3%), Mexico (2,443 | 4.0%), and South Eastern Asia (1,630 | 2.7%), together accounting for 21.2% of all La Mesa residents.
| Immigration Origin | # Population | % Population |
| Afghanistan | 14 | 0.0% |
| Africa | 553 | 0.9% |
| Argentina | 28 | 0.1% |
| Armenia | 20 | 0.0% |
| Asia | 3,297 | 5.4% |
| Australia | 14 | 0.0% |
| Barbados | 6 | 0.0% |
| Belarus | 61 | 0.1% |
| Belize | 17 | 0.0% |
| Bulgaria | 30 | 0.1% |
| Cambodia | 1 | 0.0% |
| Canada | 244 | 0.4% |
| Caribbean | 150 | 0.3% |
| Central America | 2,608 | 4.3% |
| Chile | 55 | 0.1% |
| China | 296 | 0.5% |
| Costa Rica | 31 | 0.1% |
| Croatia | 9 | 0.0% |
| Cuba | 42 | 0.1% |
| Czechoslovakia | 9 | 0.0% |
| Dominican Republic | 59 | 0.1% |
| Eastern Africa | 336 | 0.5% |
| Eastern Asia | 546 | 0.9% |
| Eastern Europe | 799 | 1.3% |
| Ecuador | 15 | 0.0% |
| Egypt | 17 | 0.0% |
| El Salvador | 68 | 0.1% |
| England | 96 | 0.2% |
| Eritrea | 190 | 0.3% |
| Ethiopia | 80 | 0.1% |
| Europe | 1,487 | 2.4% |
| France | 64 | 0.1% |
| Germany | 221 | 0.4% |
| Ghana | 68 | 0.1% |
| Greece | 6 | 0.0% |
| Guatemala | 10 | 0.0% |
| Guyana | 18 | 0.0% |
| Haiti | 43 | 0.1% |
| India | 107 | 0.2% |
| Indonesia | 51 | 0.1% |
| Iran | 122 | 0.2% |
| Iraq | 305 | 0.5% |
| Ireland | 50 | 0.1% |
| Israel | 14 | 0.0% |
| Italy | 92 | 0.2% |
| Japan | 139 | 0.2% |
| Kazakhstan | 57 | 0.1% |
| Korea | 111 | 0.2% |
| Laos | 11 | 0.0% |
| Latin America | 2,926 | 4.8% |
| Lebanon | 9 | 0.0% |
| Liberia | 1 | 0.0% |
| Mexico | 2,443 | 4.0% |
| Morocco | 25 | 0.0% |
| Nepal | 16 | 0.0% |
| Netherlands | 27 | 0.0% |
| Nicaragua | 31 | 0.1% |
| Nigeria | 64 | 0.1% |
| Northern Africa | 47 | 0.1% |
| Northern Europe | 238 | 0.4% |
| Norway | 36 | 0.1% |
| Oceania | 33 | 0.1% |
| Pakistan | 38 | 0.1% |
| Panama | 8 | 0.0% |
| Peru | 32 | 0.1% |
| Philippines | 772 | 1.3% |
| Poland | 256 | 0.4% |
| Romania | 87 | 0.1% |
| Russia | 233 | 0.4% |
| Scotland | 17 | 0.0% |
| Somalia | 15 | 0.0% |
| South America | 168 | 0.3% |
| South Central Asia | 401 | 0.7% |
| South Eastern Asia | 1,630 | 2.7% |
| Southern Europe | 114 | 0.2% |
| Spain | 16 | 0.0% |
| Sweden | 13 | 0.0% |
| Switzerland | 10 | 0.0% |
| Syria | 172 | 0.3% |
| Taiwan | 60 | 0.1% |
| Thailand | 19 | 0.0% |
| Turkey | 14 | 0.0% |
| Uganda | 46 | 0.1% |
| Ukraine | 114 | 0.2% |
| Uzbekistan | 47 | 0.1% |
| Venezuela | 20 | 0.0% |
| Vietnam | 776 | 1.3% |
| Western Africa | 147 | 0.2% |
| Western Asia | 689 | 1.1% |
| Western Europe | 322 | 0.5% | View All 90 Rows |
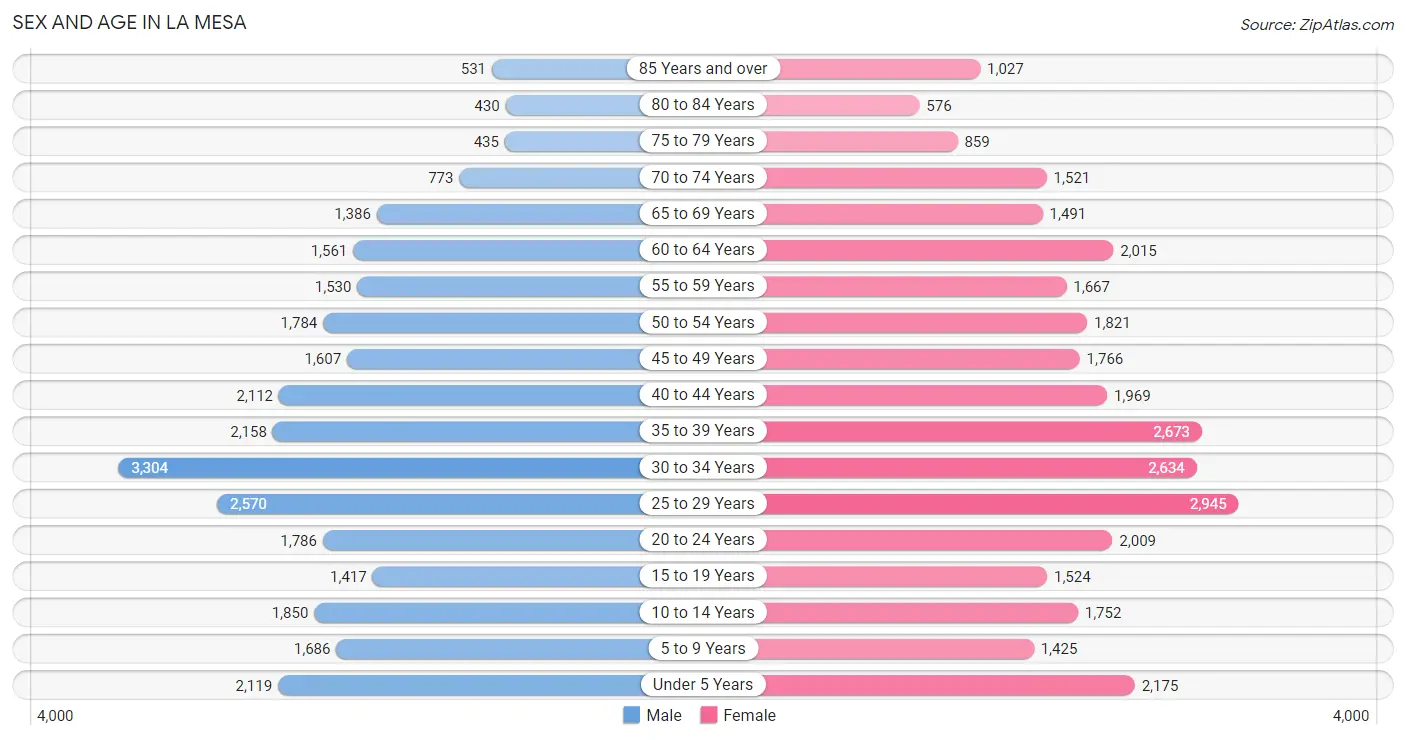
Sex and Age in La Mesa
Sex and Age in La Mesa
The most populous age groups in La Mesa are 30 to 34 Years (3,304 | 11.4%) for men and 25 to 29 Years (2,945 | 9.2%) for women.
| Age Bracket | Male | Female |
| Under 5 Years | 2,119 (7.3%) | 2,175 (6.8%) |
| 5 to 9 Years | 1,686 (5.8%) | 1,425 (4.5%) |
| 10 to 14 Years | 1,850 (6.4%) | 1,752 (5.5%) |
| 15 to 19 Years | 1,417 (4.9%) | 1,524 (4.8%) |
| 20 to 24 Years | 1,786 (6.1%) | 2,009 (6.3%) |
| 25 to 29 Years | 2,570 (8.8%) | 2,945 (9.2%) |
| 30 to 34 Years | 3,304 (11.4%) | 2,634 (8.3%) |
| 35 to 39 Years | 2,158 (7.4%) | 2,673 (8.4%) |
| 40 to 44 Years | 2,112 (7.3%) | 1,969 (6.2%) |
| 45 to 49 Years | 1,607 (5.5%) | 1,766 (5.5%) |
| 50 to 54 Years | 1,784 (6.1%) | 1,821 (5.7%) |
| 55 to 59 Years | 1,530 (5.3%) | 1,667 (5.2%) |
| 60 to 64 Years | 1,561 (5.4%) | 2,015 (6.3%) |
| 65 to 69 Years | 1,386 (4.8%) | 1,491 (4.7%) |
| 70 to 74 Years | 773 (2.7%) | 1,521 (4.8%) |
| 75 to 79 Years | 435 (1.5%) | 859 (2.7%) |
| 80 to 84 Years | 430 (1.5%) | 576 (1.8%) |
| 85 Years and over | 531 (1.8%) | 1,027 (3.2%) |
| Total | 29,039 (100.0%) | 31,849 (100.0%) |
Families and Households in La Mesa
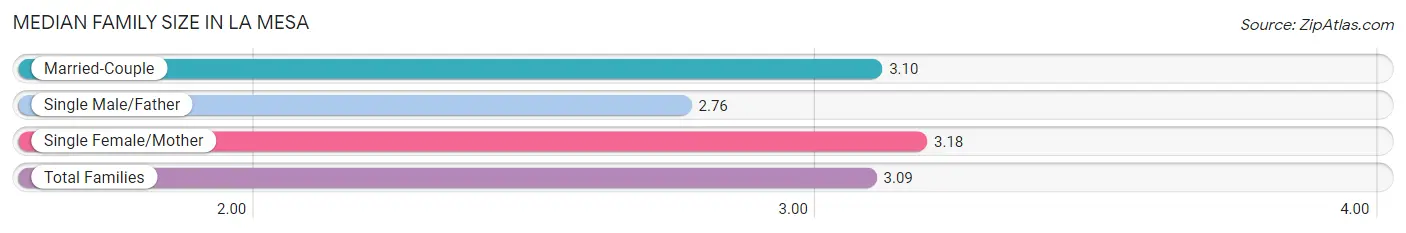
Median Family Size in La Mesa
The median family size in La Mesa is 3.09 persons per family, with single female/mother families (3,218 | 22.7%) accounting for the largest median family size of 3.18 persons per family. On the other hand, single male/father families (1,047 | 7.4%) represent the smallest median family size with 2.76 persons per family.
| Family Type | # Families | Family Size |
| Married-Couple | 9,888 (69.9%) | 3.10 |
| Single Male/Father | 1,047 (7.4%) | 2.76 |
| Single Female/Mother | 3,218 (22.7%) | 3.18 |
| Total Families | 14,153 (100.0%) | 3.09 |
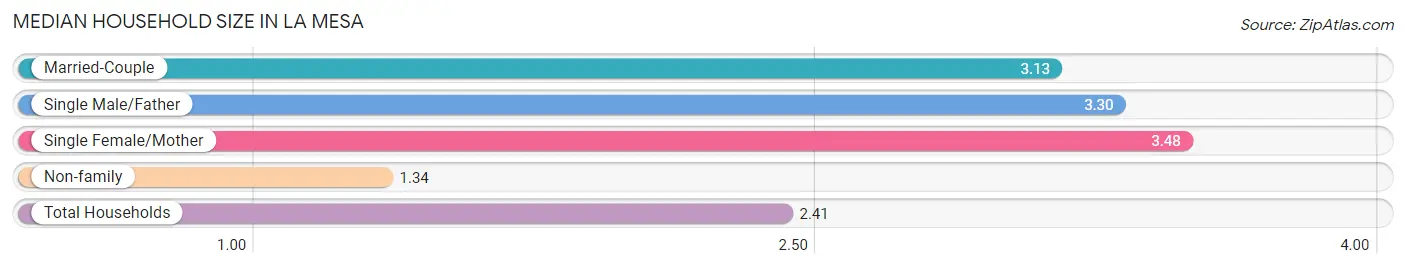
Median Household Size in La Mesa
The median household size in La Mesa is 2.41 persons per household, with single female/mother households (3,218 | 13.0%) accounting for the largest median household size of 3.48 persons per household. non-family households (10,671 | 43.0%) represent the smallest median household size with 1.34 persons per household.
| Household Type | # Households | Household Size |
| Married-Couple | 9,888 (39.8%) | 3.13 |
| Single Male/Father | 1,047 (4.2%) | 3.30 |
| Single Female/Mother | 3,218 (13.0%) | 3.48 |
| Non-family | 10,671 (43.0%) | 1.34 |
| Total Households | 24,824 (100.0%) | 2.41 |
Household Size by Marriage Status in La Mesa
Out of a total of 24,824 households in La Mesa, 14,153 (57.0%) are family households, while 10,671 (43.0%) are nonfamily households. The most numerous type of family households are 2-person households, comprising 5,986, and the most common type of nonfamily households are 1-person households, comprising 8,216.
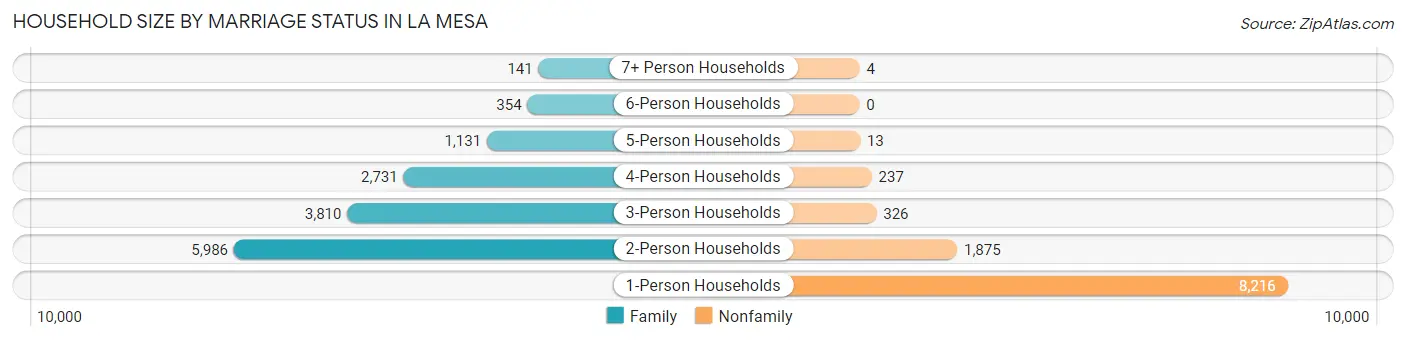
| Household Size | Family Households | Nonfamily Households |
| 1-Person Households | - | 8,216 (33.1%) |
| 2-Person Households | 5,986 (24.1%) | 1,875 (7.5%) |
| 3-Person Households | 3,810 (15.3%) | 326 (1.3%) |
| 4-Person Households | 2,731 (11.0%) | 237 (0.9%) |
| 5-Person Households | 1,131 (4.6%) | 13 (0.1%) |
| 6-Person Households | 354 (1.4%) | 0 (0.0%) |
| 7+ Person Households | 141 (0.6%) | 4 (0.0%) |
| Total | 14,153 (57.0%) | 10,671 (43.0%) |
Female Fertility in La Mesa
Fertility by Age in La Mesa
Average fertility rate in La Mesa is 56.0 births per 1,000 women. Women in the age bracket of 20 to 34 years have the highest fertility rate with 59.0 births per 1,000 women. Women in the age bracket of 20 to 34 years acount for 50.1% of all women with births.
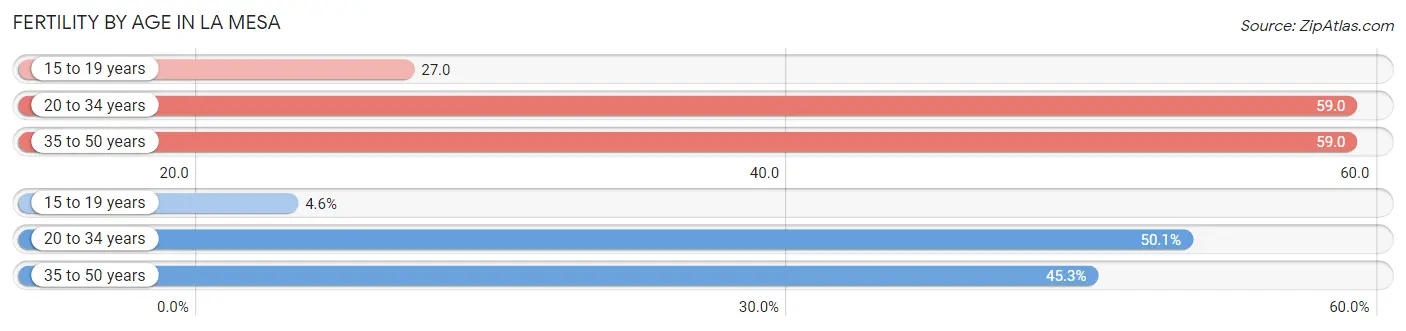
| Age Bracket | Women with Births | Births / 1,000 Women |
| 15 to 19 years | 41 (4.6%) | 27.0 |
| 20 to 34 years | 448 (50.1%) | 59.0 |
| 35 to 50 years | 405 (45.3%) | 59.0 |
| Total | 894 (100.0%) | 56.0 |
Fertility by Age by Marriage Status in La Mesa
72.7% of women with births (894) in La Mesa are married. The highest percentage of unmarried women with births falls into 35 to 50 years age bracket with 34.8% of them unmarried at the time of birth, while the lowest percentage of unmarried women with births belong to 15 to 19 years age bracket with 0.0% of them unmarried.
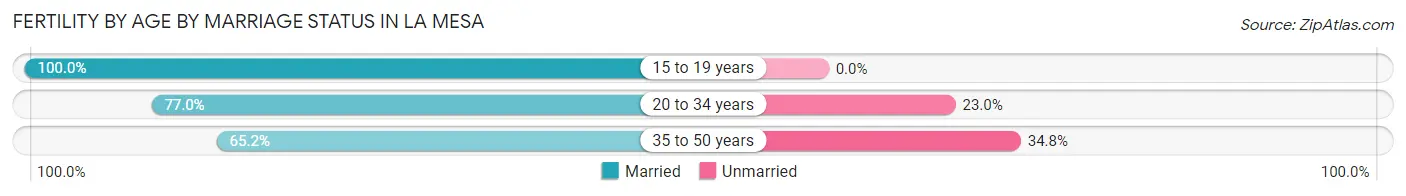
| Age Bracket | Married | Unmarried |
| 15 to 19 years | 41 (100.0%) | 0 (0.0%) |
| 20 to 34 years | 345 (77.0%) | 103 (23.0%) |
| 35 to 50 years | 264 (65.2%) | 141 (34.8%) |
| Total | 650 (72.7%) | 244 (27.3%) |
Fertility by Education in La Mesa
Average fertility rate in La Mesa is 56.0 births per 1,000 women. Women with the education attainment of graduate degree have the highest fertility rate of 116.0 births per 1,000 women, while women with the education attainment of high school diploma have the lowest fertility at 32.0 births per 1,000 women. Women with the education attainment of college or associate's degree represent 40.3% of all women with births.
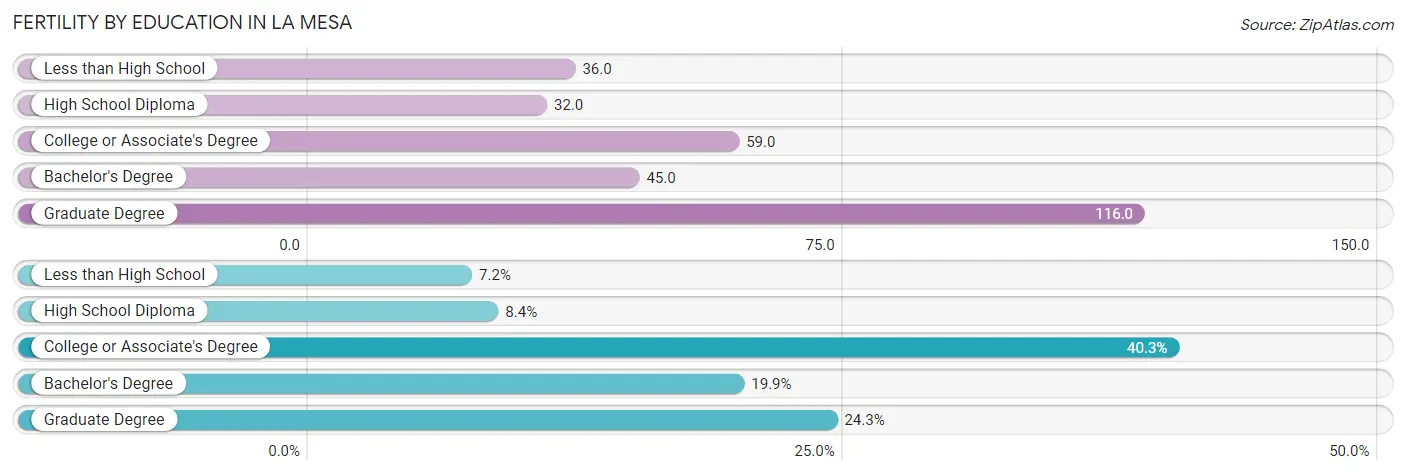
| Educational Attainment | Women with Births | Births / 1,000 Women |
| Less than High School | 64 (7.2%) | 36.0 |
| High School Diploma | 75 (8.4%) | 32.0 |
| College or Associate's Degree | 360 (40.3%) | 59.0 |
| Bachelor's Degree | 178 (19.9%) | 45.0 |
| Graduate Degree | 217 (24.3%) | 116.0 |
| Total | 894 (100.0%) | 56.0 |
Fertility by Education by Marriage Status in La Mesa
27.3% of women with births in La Mesa are unmarried. Women with the educational attainment of less than high school are most likely to be married with 100.0% of them married at childbirth, while women with the educational attainment of bachelor's degree are least likely to be married with 44.4% of them unmarried at childbirth.
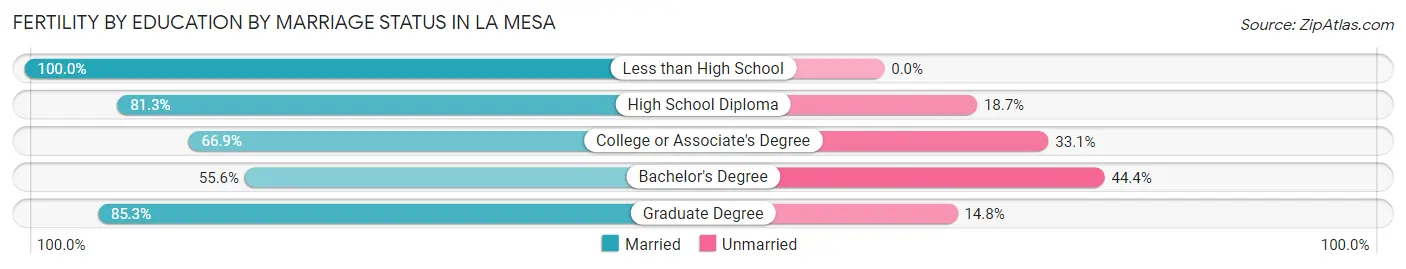
| Educational Attainment | Married | Unmarried |
| Less than High School | 64 (100.0%) | 0 (0.0%) |
| High School Diploma | 61 (81.3%) | 14 (18.7%) |
| College or Associate's Degree | 241 (66.9%) | 119 (33.1%) |
| Bachelor's Degree | 99 (55.6%) | 79 (44.4%) |
| Graduate Degree | 185 (85.3%) | 32 (14.7%) |
| Total | 650 (72.7%) | 244 (27.3%) |
Employment Characteristics in La Mesa
Employment by Class of Employer in La Mesa
Among the 31,203 employed individuals in La Mesa, private company employees (18,570 | 59.5%), local government employees (3,029 | 9.7%), and not-for-profit organizations (2,569 | 8.2%) make up the most common classes of employment.
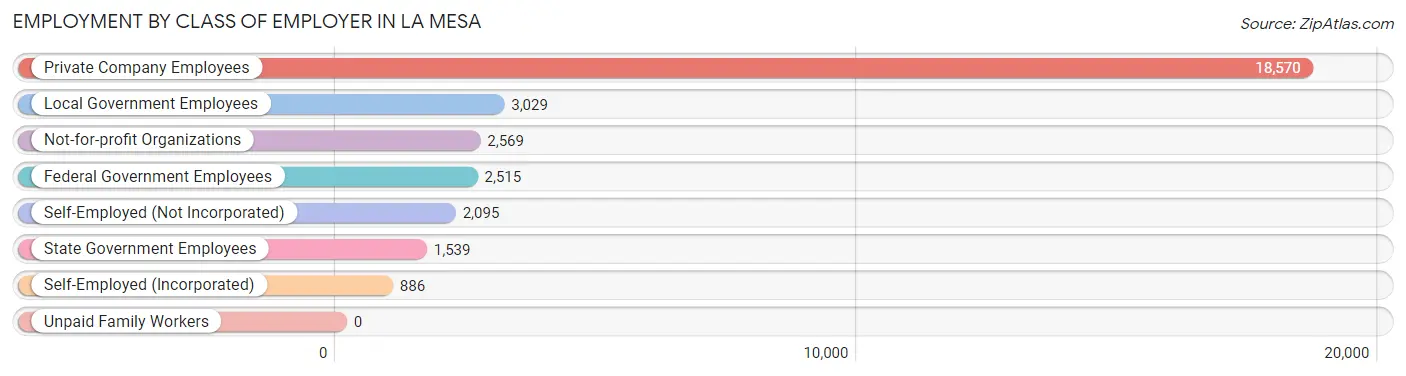
| Employer Class | # Employees | % Employees |
| Private Company Employees | 18,570 | 59.5% |
| Self-Employed (Incorporated) | 886 | 2.8% |
| Self-Employed (Not Incorporated) | 2,095 | 6.7% |
| Not-for-profit Organizations | 2,569 | 8.2% |
| Local Government Employees | 3,029 | 9.7% |
| State Government Employees | 1,539 | 4.9% |
| Federal Government Employees | 2,515 | 8.1% |
| Unpaid Family Workers | 0 | 0.0% |
| Total | 31,203 | 100.0% |
Employment Status by Age in La Mesa
According to the labor force statistics for La Mesa, out of the total population over 16 years of age (49,182), 69.4% or 34,132 individuals are in the labor force, with 6.5% or 2,219 of them unemployed. The age group with the highest labor force participation rate is 25 to 29 years, with 89.6% or 4,941 individuals in the labor force. Within the labor force, the 16 to 19 years age range has the highest percentage of unemployed individuals, with 15.6% or 132 of them being unemployed.
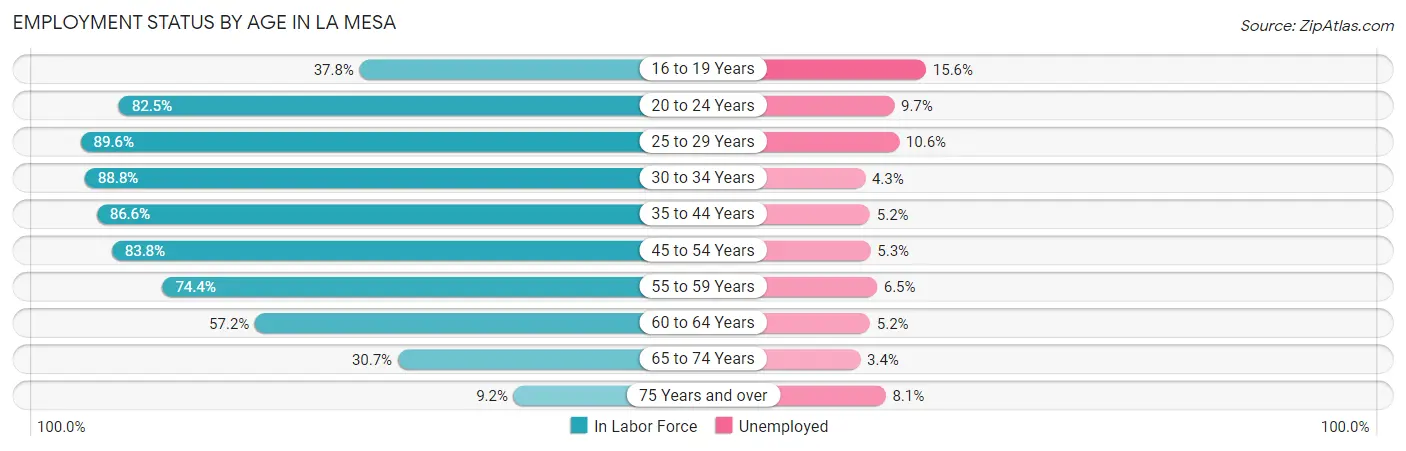
| Age Bracket | In Labor Force | Unemployed |
| 16 to 19 Years | 847 (37.8%) | 132 (15.6%) |
| 20 to 24 Years | 3,131 (82.5%) | 304 (9.7%) |
| 25 to 29 Years | 4,941 (89.6%) | 524 (10.6%) |
| 30 to 34 Years | 5,273 (88.8%) | 227 (4.3%) |
| 35 to 44 Years | 7,718 (86.6%) | 401 (5.2%) |
| 45 to 54 Years | 5,848 (83.8%) | 310 (5.3%) |
| 55 to 59 Years | 2,379 (74.4%) | 155 (6.5%) |
| 60 to 64 Years | 2,045 (57.2%) | 106 (5.2%) |
| 65 to 74 Years | 1,587 (30.7%) | 54 (3.4%) |
| 75 Years and over | 355 (9.2%) | 29 (8.1%) |
| Total | 34,132 (69.4%) | 2,219 (6.5%) |
Employment Status by Educational Attainment in La Mesa
According to labor force statistics for La Mesa, 82.7% of individuals (28,214) out of the total population between 25 and 64 years of age (34,116) are in the labor force, with 6.1% or 1,721 of them being unemployed. The group with the highest labor force participation rate are those with the educational attainment of bachelor's degree or higher, with 89.4% or 11,731 individuals in the labor force. Within the labor force, individuals with less than high school education have the highest percentage of unemployment, with 12.1% or 157 of them being unemployed.
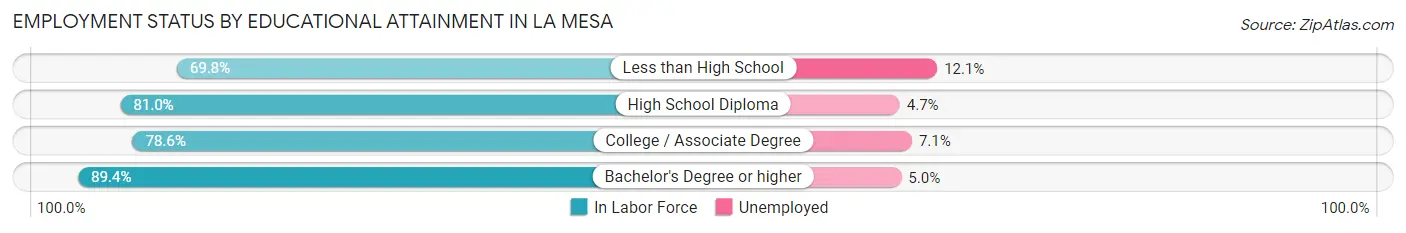
| Educational Attainment | In Labor Force | Unemployed |
| Less than High School | 1,296 (69.8%) | 225 (12.1%) |
| High School Diploma | 4,467 (81.0%) | 259 (4.7%) |
| College / Associate Degree | 10,707 (78.6%) | 967 (7.1%) |
| Bachelor's Degree or higher | 11,731 (89.4%) | 656 (5.0%) |
| Total | 28,214 (82.7%) | 2,081 (6.1%) |
Employment Occupations by Sex in La Mesa
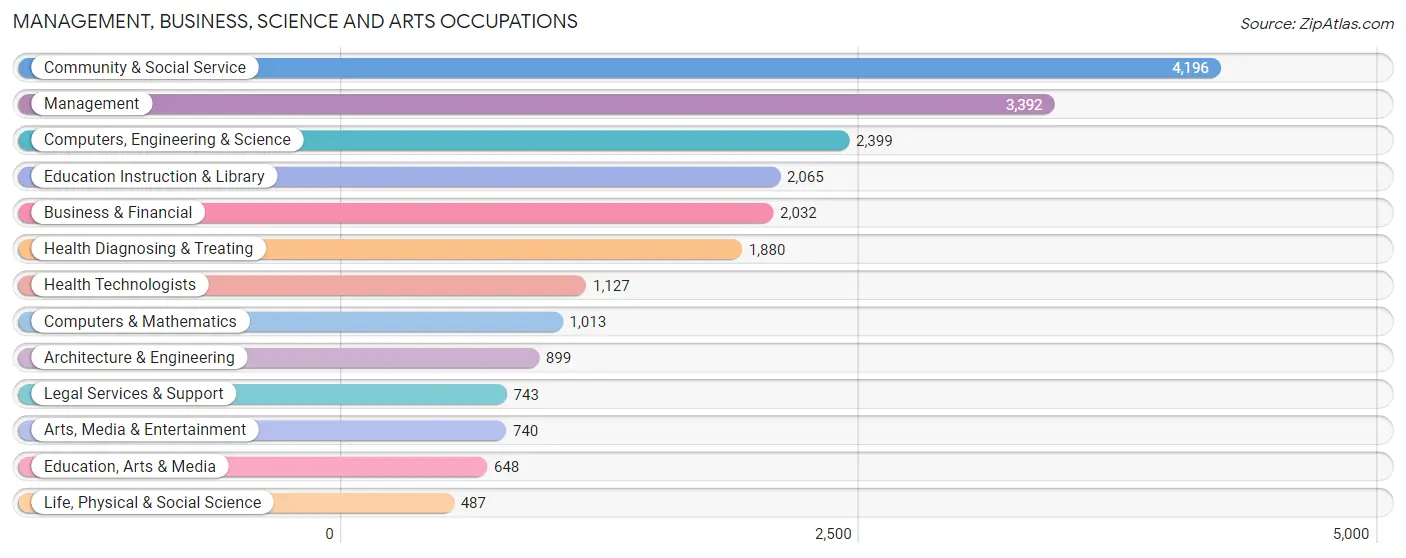
Management, Business, Science and Arts Occupations
The most common Management, Business, Science and Arts occupations in La Mesa are Community & Social Service (4,196 | 13.6%), Management (3,392 | 11.0%), Computers, Engineering & Science (2,399 | 7.7%), Education Instruction & Library (2,065 | 6.7%), and Business & Financial (2,032 | 6.6%).
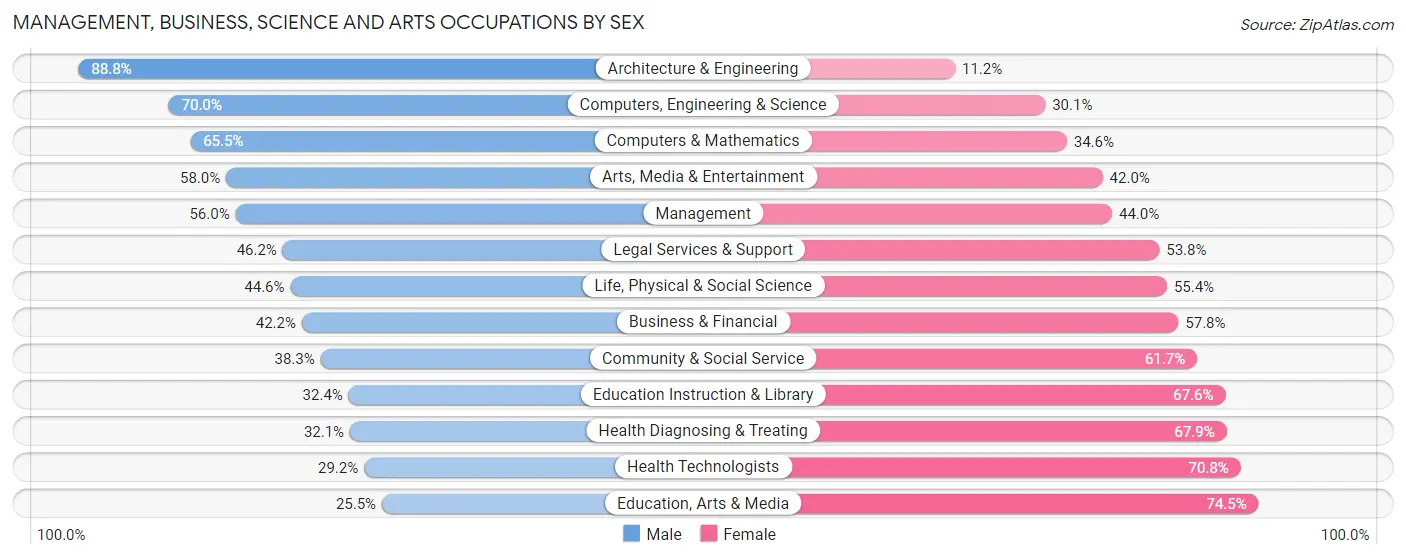
Management, Business, Science and Arts Occupations by Sex
Within the Management, Business, Science and Arts occupations in La Mesa, the most male-oriented occupations are Architecture & Engineering (88.8%), Computers, Engineering & Science (70.0%), and Computers & Mathematics (65.4%), while the most female-oriented occupations are Education, Arts & Media (74.5%), Health Technologists (70.8%), and Health Diagnosing & Treating (67.9%).
| Occupation | Male | Female |
| Management | 1,900 (56.0%) | 1,492 (44.0%) |
| Business & Financial | 857 (42.2%) | 1,175 (57.8%) |
| Computers, Engineering & Science | 1,678 (70.0%) | 721 (30.0%) |
| Computers & Mathematics | 663 (65.4%) | 350 (34.5%) |
| Architecture & Engineering | 798 (88.8%) | 101 (11.2%) |
| Life, Physical & Social Science | 217 (44.6%) | 270 (55.4%) |
| Community & Social Service | 1,606 (38.3%) | 2,590 (61.7%) |
| Education, Arts & Media | 165 (25.5%) | 483 (74.5%) |
| Legal Services & Support | 343 (46.2%) | 400 (53.8%) |
| Education Instruction & Library | 669 (32.4%) | 1,396 (67.6%) |
| Arts, Media & Entertainment | 429 (58.0%) | 311 (42.0%) |
| Health Diagnosing & Treating | 604 (32.1%) | 1,276 (67.9%) |
| Health Technologists | 329 (29.2%) | 798 (70.8%) |
| Total (Category) | 6,645 (47.8%) | 7,254 (52.2%) |
| Total (Overall) | 15,434 (49.9%) | 15,506 (50.1%) |
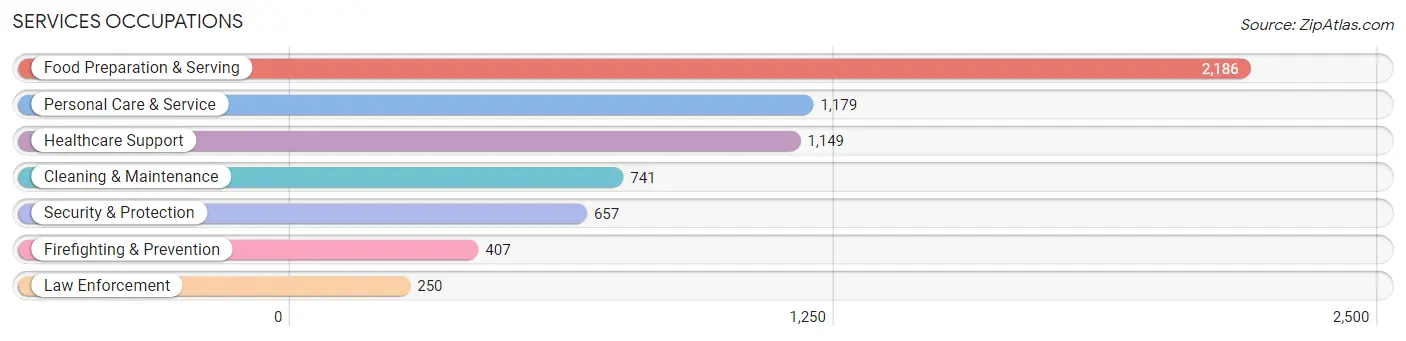
Services Occupations
The most common Services occupations in La Mesa are Food Preparation & Serving (2,186 | 7.1%), Personal Care & Service (1,179 | 3.8%), Healthcare Support (1,149 | 3.7%), Cleaning & Maintenance (741 | 2.4%), and Security & Protection (657 | 2.1%).
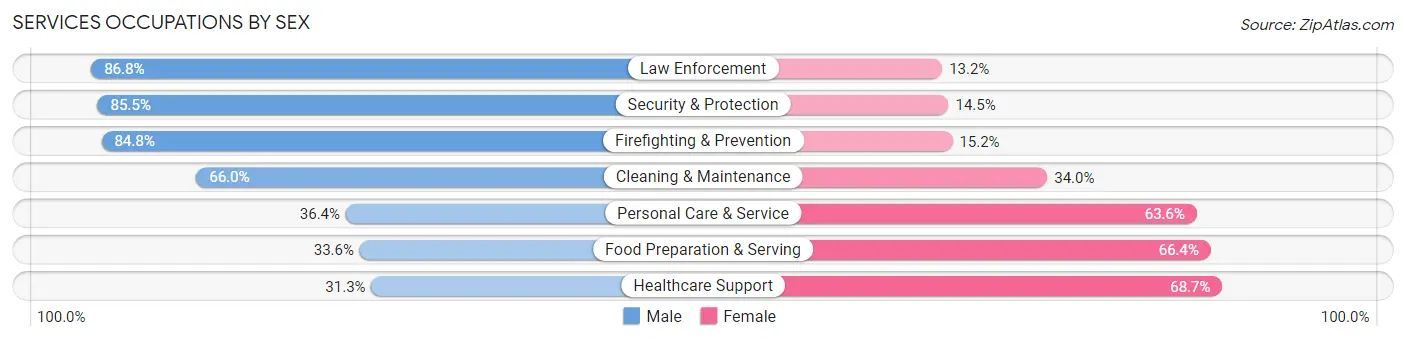
Services Occupations by Sex
Within the Services occupations in La Mesa, the most male-oriented occupations are Law Enforcement (86.8%), Security & Protection (85.5%), and Firefighting & Prevention (84.8%), while the most female-oriented occupations are Healthcare Support (68.7%), Food Preparation & Serving (66.4%), and Personal Care & Service (63.6%).
| Occupation | Male | Female |
| Healthcare Support | 360 (31.3%) | 789 (68.7%) |
| Security & Protection | 562 (85.5%) | 95 (14.5%) |
| Firefighting & Prevention | 345 (84.8%) | 62 (15.2%) |
| Law Enforcement | 217 (86.8%) | 33 (13.2%) |
| Food Preparation & Serving | 735 (33.6%) | 1,451 (66.4%) |
| Cleaning & Maintenance | 489 (66.0%) | 252 (34.0%) |
| Personal Care & Service | 429 (36.4%) | 750 (63.6%) |
| Total (Category) | 2,575 (43.6%) | 3,337 (56.4%) |
| Total (Overall) | 15,434 (49.9%) | 15,506 (50.1%) |
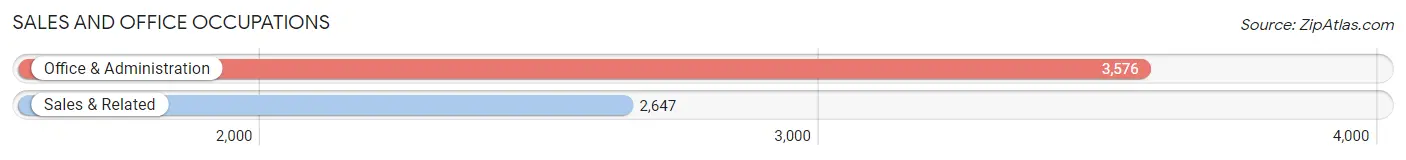
Sales and Office Occupations
The most common Sales and Office occupations in La Mesa are Office & Administration (3,576 | 11.6%), and Sales & Related (2,647 | 8.6%).
Sales and Office Occupations by Sex
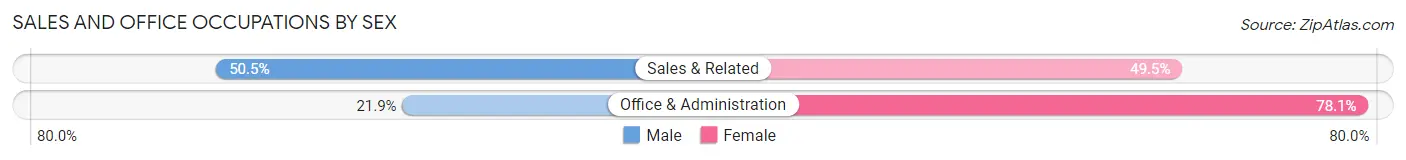
| Occupation | Male | Female |
| Sales & Related | 1,337 (50.5%) | 1,310 (49.5%) |
| Office & Administration | 782 (21.9%) | 2,794 (78.1%) |
| Total (Category) | 2,119 (34.1%) | 4,104 (65.9%) |
| Total (Overall) | 15,434 (49.9%) | 15,506 (50.1%) |
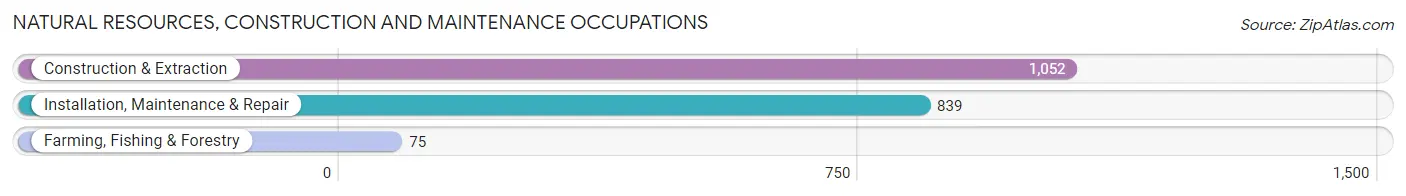
Natural Resources, Construction and Maintenance Occupations
The most common Natural Resources, Construction and Maintenance occupations in La Mesa are Construction & Extraction (1,052 | 3.4%), Installation, Maintenance & Repair (839 | 2.7%), and Farming, Fishing & Forestry (75 | 0.2%).
Natural Resources, Construction and Maintenance Occupations by Sex
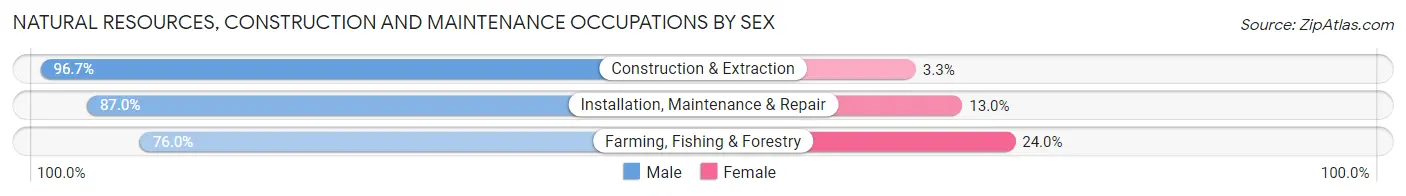
| Occupation | Male | Female |
| Farming, Fishing & Forestry | 57 (76.0%) | 18 (24.0%) |
| Construction & Extraction | 1,017 (96.7%) | 35 (3.3%) |
| Installation, Maintenance & Repair | 730 (87.0%) | 109 (13.0%) |
| Total (Category) | 1,804 (91.8%) | 162 (8.2%) |
| Total (Overall) | 15,434 (49.9%) | 15,506 (50.1%) |
Production, Transportation and Moving Occupations
The most common Production, Transportation and Moving occupations in La Mesa are Production (1,235 | 4.0%), Material Moving (874 | 2.8%), and Transportation (831 | 2.7%).
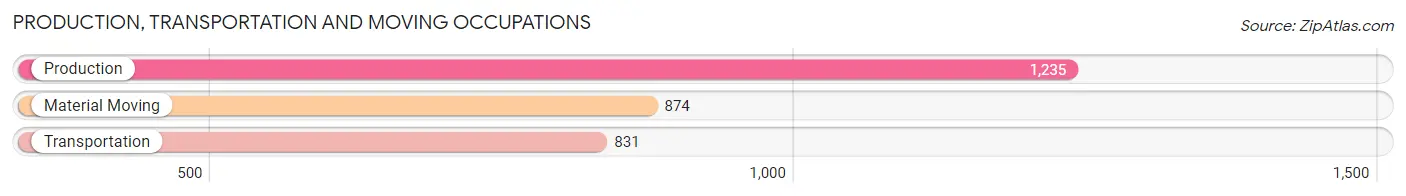
Production, Transportation and Moving Occupations by Sex
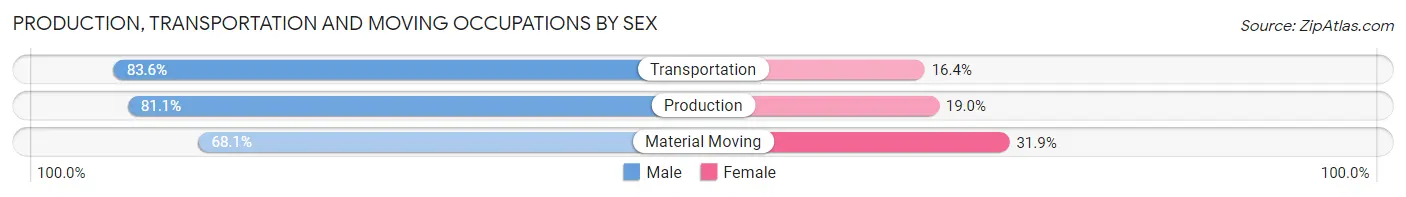
| Occupation | Male | Female |
| Production | 1,001 (81.0%) | 234 (19.0%) |
| Transportation | 695 (83.6%) | 136 (16.4%) |
| Material Moving | 595 (68.1%) | 279 (31.9%) |
| Total (Category) | 2,291 (77.9%) | 649 (22.1%) |
| Total (Overall) | 15,434 (49.9%) | 15,506 (50.1%) |
Employment Industries by Sex in La Mesa
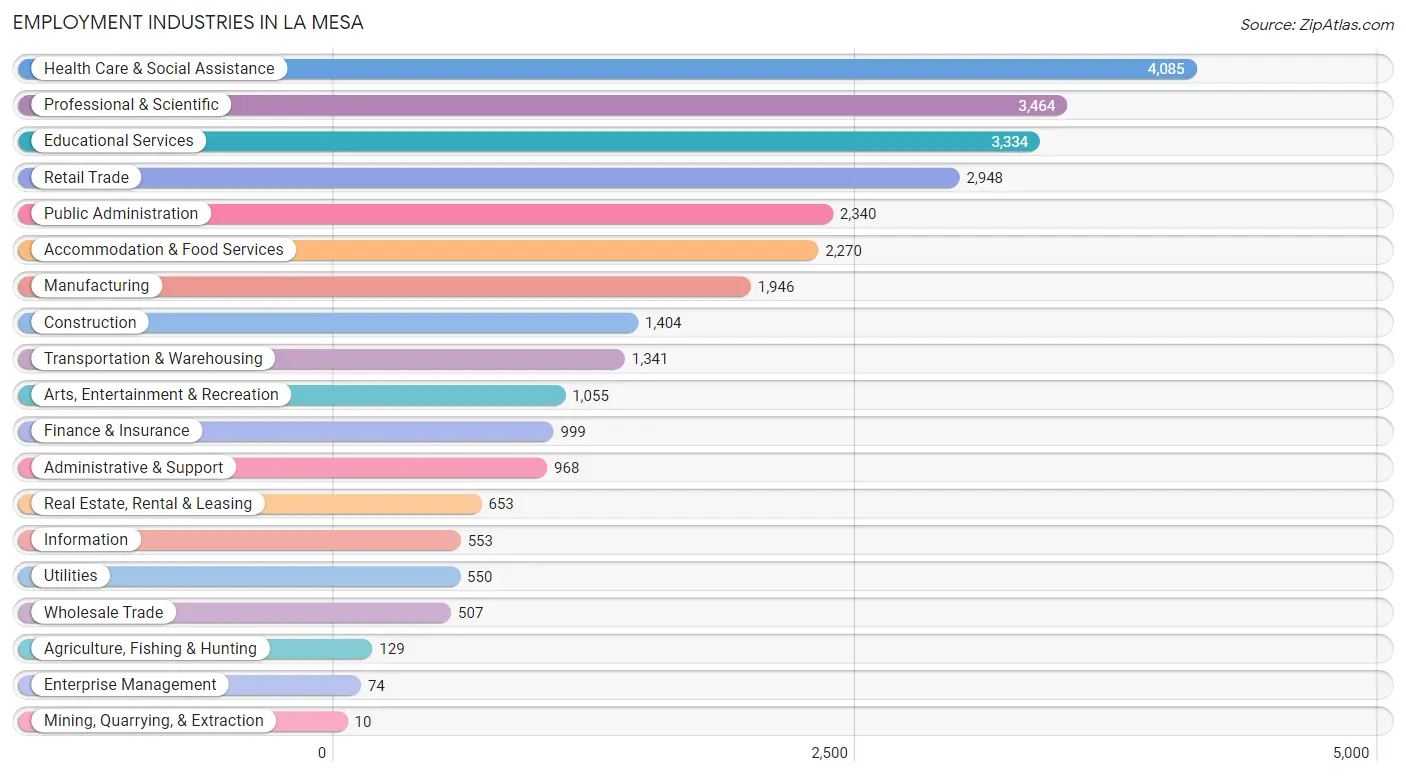
Employment Industries in La Mesa
The major employment industries in La Mesa include Health Care & Social Assistance (4,085 | 13.2%), Professional & Scientific (3,464 | 11.2%), Educational Services (3,334 | 10.8%), Retail Trade (2,948 | 9.5%), and Public Administration (2,340 | 7.6%).
Employment Industries by Sex in La Mesa
The La Mesa industries that see more men than women are Mining, Quarrying, & Extraction (100.0%), Construction (87.3%), and Utilities (82.7%), whereas the industries that tend to have a higher number of women are Health Care & Social Assistance (68.6%), Educational Services (65.9%), and Finance & Insurance (64.1%).
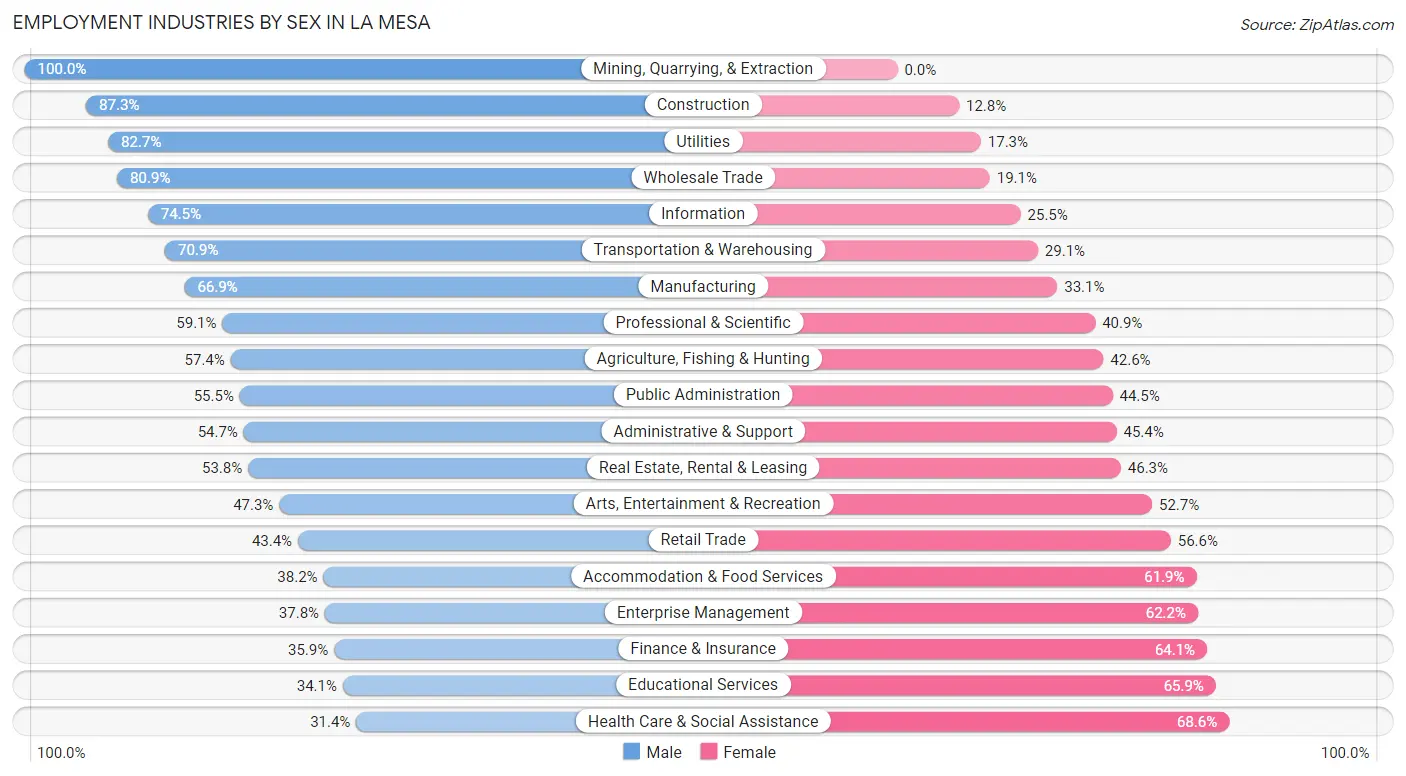
| Industry | Male | Female |
| Agriculture, Fishing & Hunting | 74 (57.4%) | 55 (42.6%) |
| Mining, Quarrying, & Extraction | 10 (100.0%) | 0 (0.0%) |
| Construction | 1,225 (87.3%) | 179 (12.8%) |
| Manufacturing | 1,302 (66.9%) | 644 (33.1%) |
| Wholesale Trade | 410 (80.9%) | 97 (19.1%) |
| Retail Trade | 1,280 (43.4%) | 1,668 (56.6%) |
| Transportation & Warehousing | 951 (70.9%) | 390 (29.1%) |
| Utilities | 455 (82.7%) | 95 (17.3%) |
| Information | 412 (74.5%) | 141 (25.5%) |
| Finance & Insurance | 359 (35.9%) | 640 (64.1%) |
| Real Estate, Rental & Leasing | 351 (53.7%) | 302 (46.3%) |
| Professional & Scientific | 2,046 (59.1%) | 1,418 (40.9%) |
| Enterprise Management | 28 (37.8%) | 46 (62.2%) |
| Administrative & Support | 529 (54.6%) | 439 (45.4%) |
| Educational Services | 1,138 (34.1%) | 2,196 (65.9%) |
| Health Care & Social Assistance | 1,281 (31.4%) | 2,804 (68.6%) |
| Arts, Entertainment & Recreation | 499 (47.3%) | 556 (52.7%) |
| Accommodation & Food Services | 866 (38.2%) | 1,404 (61.9%) |
| Public Administration | 1,298 (55.5%) | 1,042 (44.5%) |
| Total | 15,434 (49.9%) | 15,506 (50.1%) |
Education in La Mesa
School Enrollment in La Mesa
The most common levels of schooling among the 14,327 students in La Mesa are college / undergraduate (3,718 | 26.0%), middle school (2,858 | 20.0%), and high school (2,562 | 17.9%).
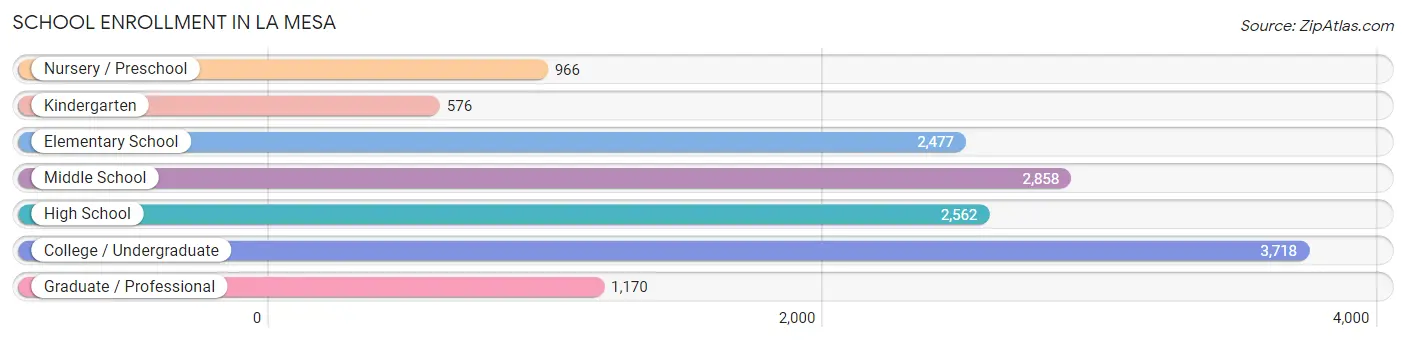
| School Level | # Students | % Students |
| Nursery / Preschool | 966 | 6.7% |
| Kindergarten | 576 | 4.0% |
| Elementary School | 2,477 | 17.3% |
| Middle School | 2,858 | 20.0% |
| High School | 2,562 | 17.9% |
| College / Undergraduate | 3,718 | 26.0% |
| Graduate / Professional | 1,170 | 8.2% |
| Total | 14,327 | 100.0% |
School Enrollment by Age by Funding Source in La Mesa
Out of a total of 14,327 students who are enrolled in schools in La Mesa, 2,378 (16.6%) attend a private institution, while the remaining 11,949 (83.4%) are enrolled in public schools. The age group of 3 to 4 year olds has the highest likelihood of being enrolled in private schools, with 564 (69.5% in the age bracket) enrolled. Conversely, the age group of 18 to 19 year olds has the lowest likelihood of being enrolled in a private school, with 838 (95.1% in the age bracket) attending a public institution.
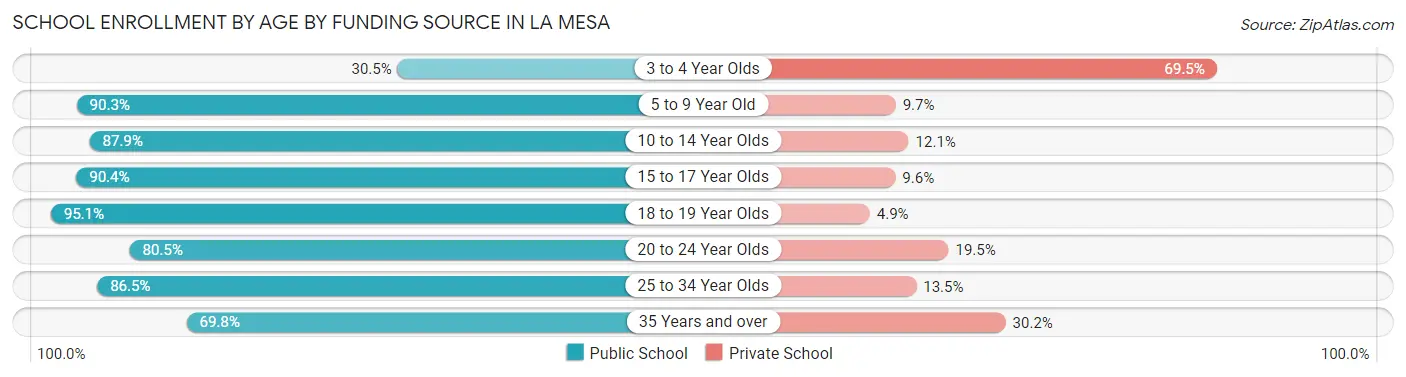
| Age Bracket | Public School | Private School |
| 3 to 4 Year Olds | 248 (30.5%) | 564 (69.5%) |
| 5 to 9 Year Old | 2,691 (90.3%) | 289 (9.7%) |
| 10 to 14 Year Olds | 3,072 (87.9%) | 423 (12.1%) |
| 15 to 17 Year Olds | 1,668 (90.4%) | 178 (9.6%) |
| 18 to 19 Year Olds | 838 (95.1%) | 43 (4.9%) |
| 20 to 24 Year Olds | 1,153 (80.5%) | 280 (19.5%) |
| 25 to 34 Year Olds | 1,361 (86.5%) | 213 (13.5%) |
| 35 Years and over | 912 (69.8%) | 394 (30.2%) |
| Total | 11,949 (83.4%) | 2,378 (16.6%) |
Educational Attainment by Field of Study in La Mesa
Business (2,535 | 14.6%), social sciences (1,831 | 10.5%), psychology (1,366 | 7.9%), bio, nature & agricultural (1,344 | 7.7%), and engineering (1,327 | 7.6%) are the most common fields of study among 17,381 individuals in La Mesa who have obtained a bachelor's degree or higher.
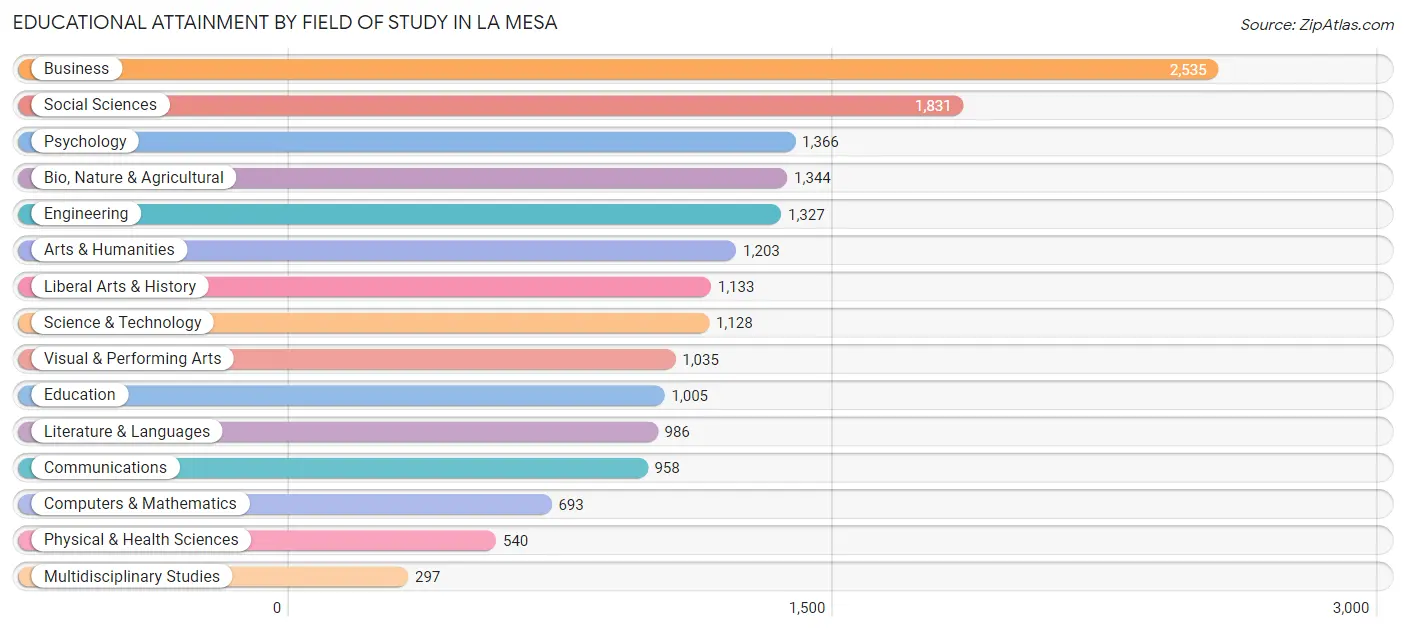
| Field of Study | # Graduates | % Graduates |
| Computers & Mathematics | 693 | 4.0% |
| Bio, Nature & Agricultural | 1,344 | 7.7% |
| Physical & Health Sciences | 540 | 3.1% |
| Psychology | 1,366 | 7.9% |
| Social Sciences | 1,831 | 10.5% |
| Engineering | 1,327 | 7.6% |
| Multidisciplinary Studies | 297 | 1.7% |
| Science & Technology | 1,128 | 6.5% |
| Business | 2,535 | 14.6% |
| Education | 1,005 | 5.8% |
| Literature & Languages | 986 | 5.7% |
| Liberal Arts & History | 1,133 | 6.5% |
| Visual & Performing Arts | 1,035 | 5.9% |
| Communications | 958 | 5.5% |
| Arts & Humanities | 1,203 | 6.9% |
| Total | 17,381 | 100.0% |
Transportation & Commute in La Mesa
Vehicle Availability by Sex in La Mesa
The most prevalent vehicle ownership categories in La Mesa are males with 2 vehicles (7,285, accounting for 46.0%) and females with 2 vehicles (6,317, making up 47.5%).
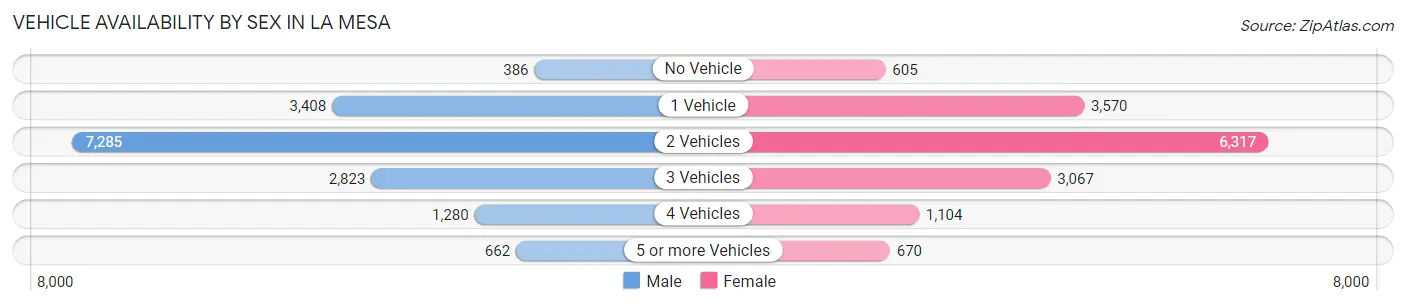
| Vehicles Available | Male | Female |
| No Vehicle | 386 (2.4%) | 605 (4.0%) |
| 1 Vehicle | 3,408 (21.5%) | 3,570 (23.3%) |
| 2 Vehicles | 7,285 (46.0%) | 6,317 (41.2%) |
| 3 Vehicles | 2,823 (17.8%) | 3,067 (20.0%) |
| 4 Vehicles | 1,280 (8.1%) | 1,104 (7.2%) |
| 5 or more Vehicles | 662 (4.2%) | 670 (4.4%) |
| Total | 15,844 (100.0%) | 15,333 (100.0%) |
Commute Time in La Mesa
The most frequently occuring commute durations in La Mesa are 20 to 24 minutes (5,366 commuters, 19.8%), 30 to 34 minutes (4,547 commuters, 16.7%), and 15 to 19 minutes (4,198 commuters, 15.4%).
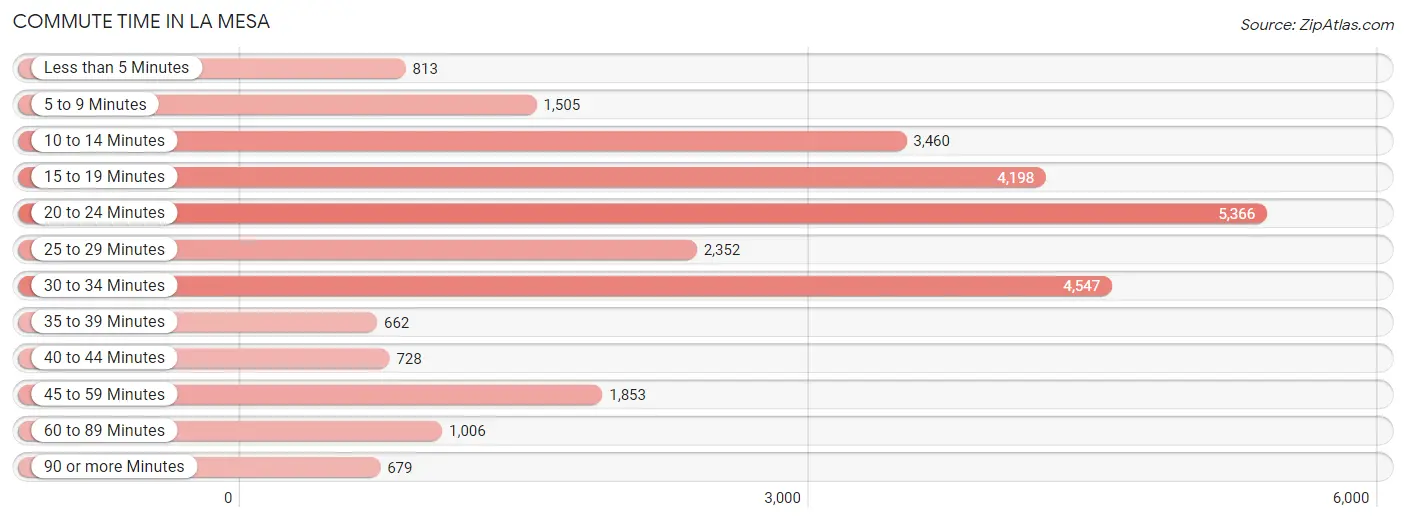
| Commute Time | # Commuters | % Commuters |
| Less than 5 Minutes | 813 | 3.0% |
| 5 to 9 Minutes | 1,505 | 5.5% |
| 10 to 14 Minutes | 3,460 | 12.7% |
| 15 to 19 Minutes | 4,198 | 15.4% |
| 20 to 24 Minutes | 5,366 | 19.8% |
| 25 to 29 Minutes | 2,352 | 8.7% |
| 30 to 34 Minutes | 4,547 | 16.7% |
| 35 to 39 Minutes | 662 | 2.4% |
| 40 to 44 Minutes | 728 | 2.7% |
| 45 to 59 Minutes | 1,853 | 6.8% |
| 60 to 89 Minutes | 1,006 | 3.7% |
| 90 or more Minutes | 679 | 2.5% |
Commute Time by Sex in La Mesa
The most common commute times in La Mesa are 20 to 24 minutes (3,269 commuters, 23.5%) for males and 15 to 19 minutes (2,266 commuters, 17.1%) for females.
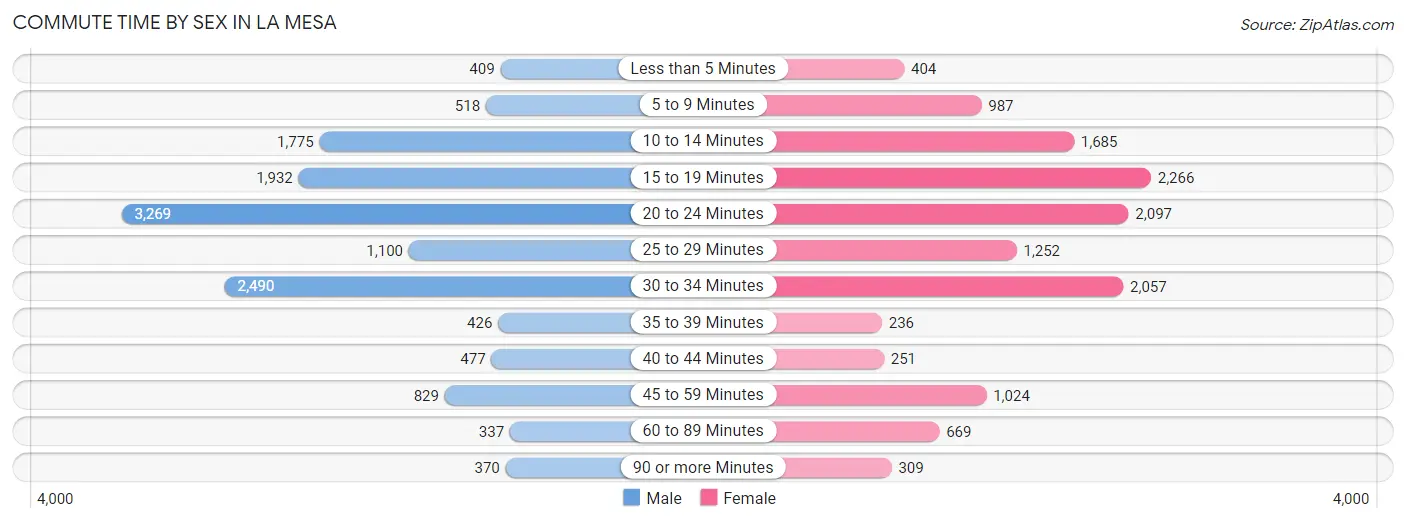
| Commute Time | Male | Female |
| Less than 5 Minutes | 409 (2.9%) | 404 (3.0%) |
| 5 to 9 Minutes | 518 (3.7%) | 987 (7.5%) |
| 10 to 14 Minutes | 1,775 (12.7%) | 1,685 (12.7%) |
| 15 to 19 Minutes | 1,932 (13.9%) | 2,266 (17.1%) |
| 20 to 24 Minutes | 3,269 (23.5%) | 2,097 (15.8%) |
| 25 to 29 Minutes | 1,100 (7.9%) | 1,252 (9.5%) |
| 30 to 34 Minutes | 2,490 (17.9%) | 2,057 (15.5%) |
| 35 to 39 Minutes | 426 (3.1%) | 236 (1.8%) |
| 40 to 44 Minutes | 477 (3.4%) | 251 (1.9%) |
| 45 to 59 Minutes | 829 (5.9%) | 1,024 (7.7%) |
| 60 to 89 Minutes | 337 (2.4%) | 669 (5.1%) |
| 90 or more Minutes | 370 (2.7%) | 309 (2.3%) |
Time of Departure to Work by Sex in La Mesa
The most frequent times of departure to work in La Mesa are 7:00 AM to 7:29 AM (1,967, 14.1%) for males and 7:00 AM to 7:29 AM (2,076, 15.7%) for females.
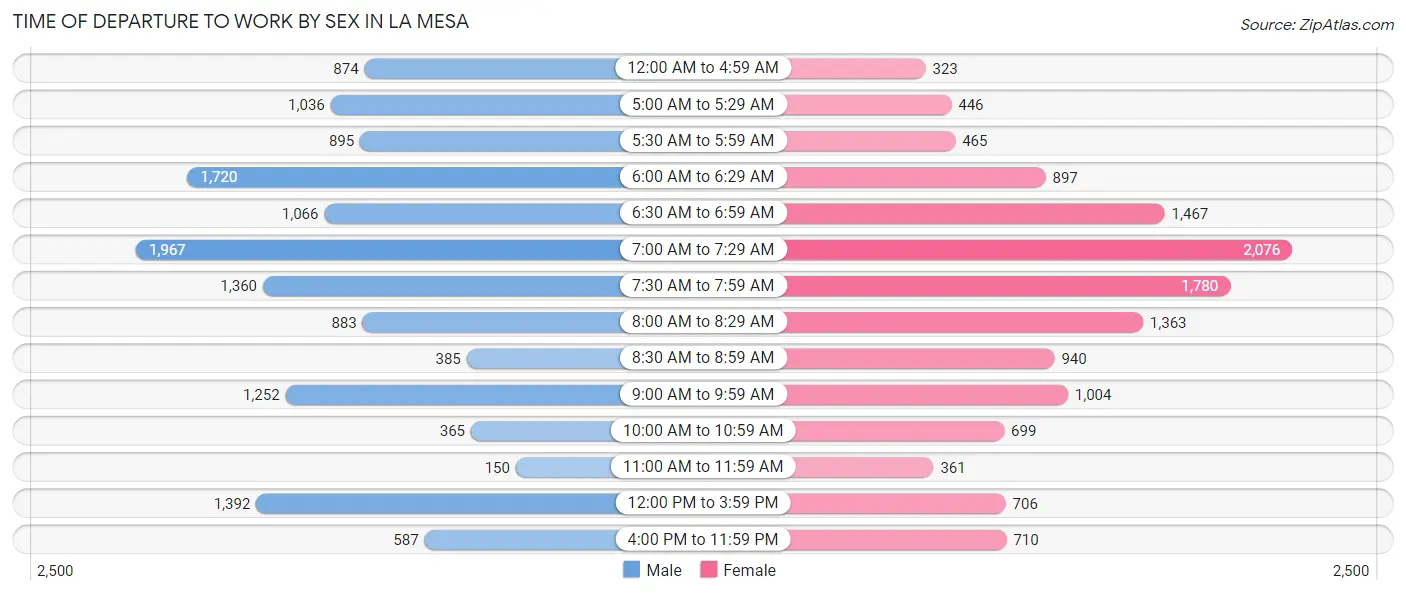
| Time of Departure | Male | Female |
| 12:00 AM to 4:59 AM | 874 (6.3%) | 323 (2.4%) |
| 5:00 AM to 5:29 AM | 1,036 (7.4%) | 446 (3.4%) |
| 5:30 AM to 5:59 AM | 895 (6.4%) | 465 (3.5%) |
| 6:00 AM to 6:29 AM | 1,720 (12.3%) | 897 (6.8%) |
| 6:30 AM to 6:59 AM | 1,066 (7.6%) | 1,467 (11.1%) |
| 7:00 AM to 7:29 AM | 1,967 (14.1%) | 2,076 (15.7%) |
| 7:30 AM to 7:59 AM | 1,360 (9.8%) | 1,780 (13.5%) |
| 8:00 AM to 8:29 AM | 883 (6.3%) | 1,363 (10.3%) |
| 8:30 AM to 8:59 AM | 385 (2.8%) | 940 (7.1%) |
| 9:00 AM to 9:59 AM | 1,252 (9.0%) | 1,004 (7.6%) |
| 10:00 AM to 10:59 AM | 365 (2.6%) | 699 (5.3%) |
| 11:00 AM to 11:59 AM | 150 (1.1%) | 361 (2.7%) |
| 12:00 PM to 3:59 PM | 1,392 (10.0%) | 706 (5.3%) |
| 4:00 PM to 11:59 PM | 587 (4.2%) | 710 (5.4%) |
| Total | 13,932 (100.0%) | 13,237 (100.0%) |
Housing Occupancy in La Mesa
Occupancy by Ownership in La Mesa
Of the total 24,824 dwellings in La Mesa, owner-occupied units account for 11,123 (44.8%), while renter-occupied units make up 13,701 (55.2%).
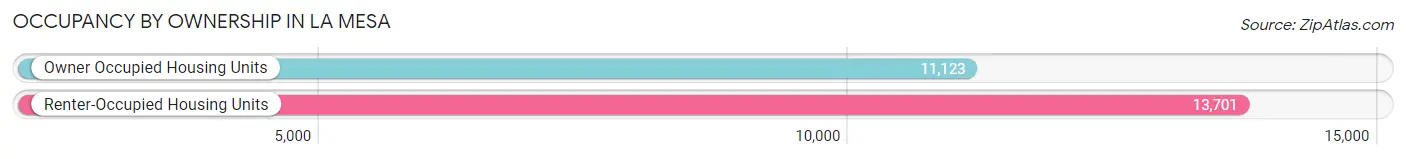
| Occupancy | # Housing Units | % Housing Units |
| Owner Occupied Housing Units | 11,123 | 44.8% |
| Renter-Occupied Housing Units | 13,701 | 55.2% |
| Total Occupied Housing Units | 24,824 | 100.0% |
Occupancy by Household Size in La Mesa
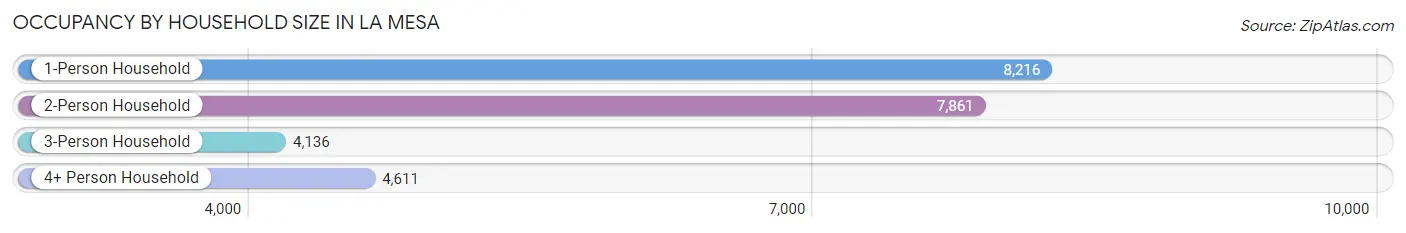
| Household Size | # Housing Units | % Housing Units |
| 1-Person Household | 8,216 | 33.1% |
| 2-Person Household | 7,861 | 31.7% |
| 3-Person Household | 4,136 | 16.7% |
| 4+ Person Household | 4,611 | 18.6% |
| Total Housing Units | 24,824 | 100.0% |
Occupancy by Ownership by Household Size in La Mesa
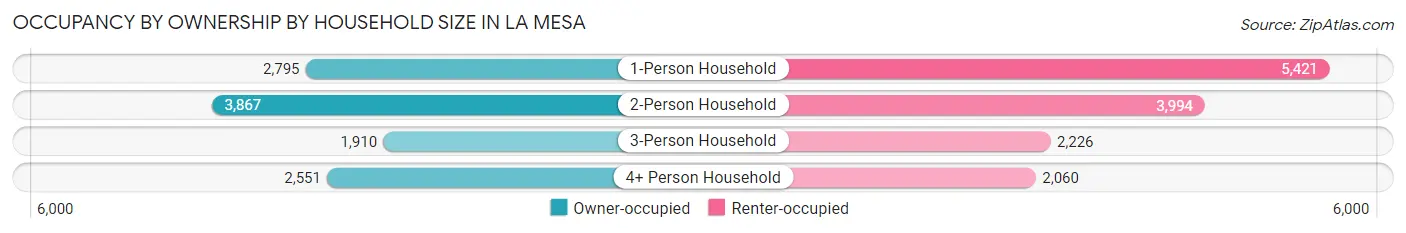
| Household Size | Owner-occupied | Renter-occupied |
| 1-Person Household | 2,795 (34.0%) | 5,421 (66.0%) |
| 2-Person Household | 3,867 (49.2%) | 3,994 (50.8%) |
| 3-Person Household | 1,910 (46.2%) | 2,226 (53.8%) |
| 4+ Person Household | 2,551 (55.3%) | 2,060 (44.7%) |
| Total Housing Units | 11,123 (44.8%) | 13,701 (55.2%) |
Occupancy by Educational Attainment in La Mesa
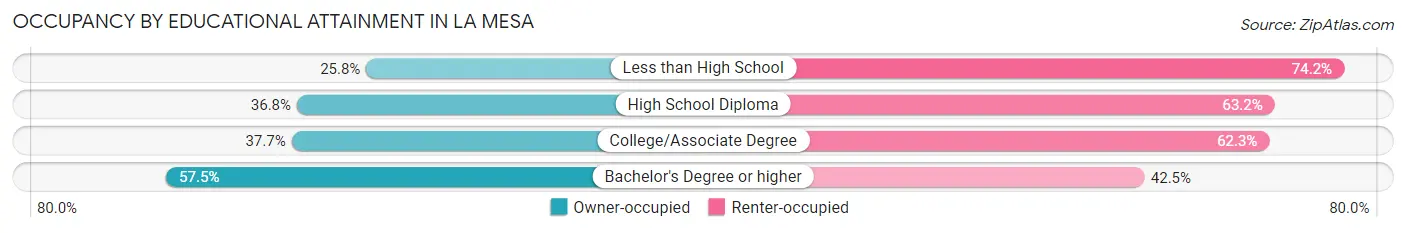
| Household Size | Owner-occupied | Renter-occupied |
| Less than High School | 362 (25.8%) | 1,040 (74.2%) |
| High School Diploma | 1,427 (36.8%) | 2,449 (63.2%) |
| College/Associate Degree | 3,626 (37.7%) | 6,000 (62.3%) |
| Bachelor's Degree or higher | 5,708 (57.5%) | 4,212 (42.5%) |
Occupancy by Age of Householder in La Mesa
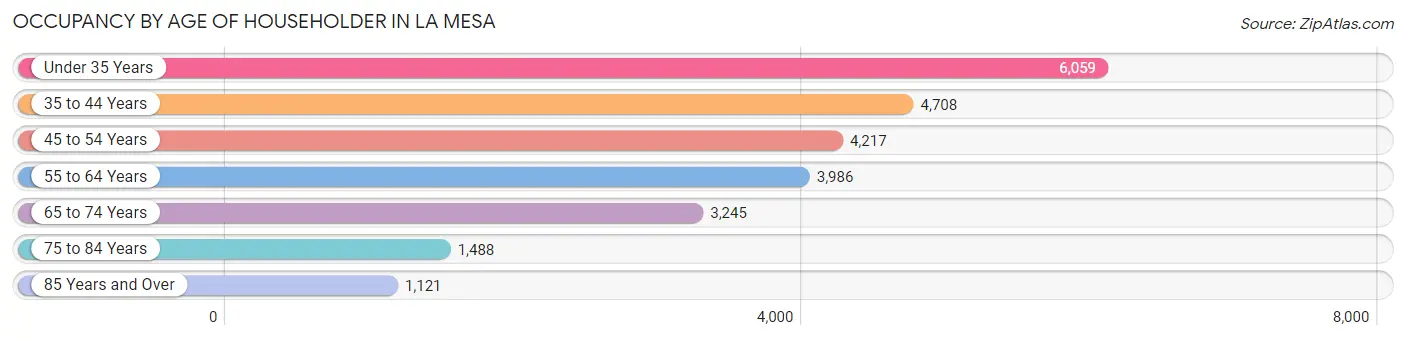
| Age Bracket | # Households | % Households |
| Under 35 Years | 6,059 | 24.4% |
| 35 to 44 Years | 4,708 | 19.0% |
| 45 to 54 Years | 4,217 | 17.0% |
| 55 to 64 Years | 3,986 | 16.1% |
| 65 to 74 Years | 3,245 | 13.1% |
| 75 to 84 Years | 1,488 | 6.0% |
| 85 Years and Over | 1,121 | 4.5% |
| Total | 24,824 | 100.0% |
Housing Finances in La Mesa
Median Income by Occupancy in La Mesa
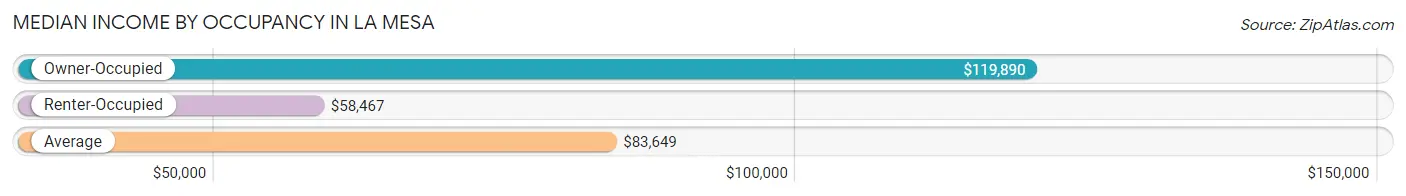
| Occupancy Type | # Households | Median Income |
| Owner-Occupied | 11,123 (44.8%) | $119,890 |
| Renter-Occupied | 13,701 (55.2%) | $58,467 |
| Average | 24,824 (100.0%) | $83,649 |
Occupancy by Householder Income Bracket in La Mesa
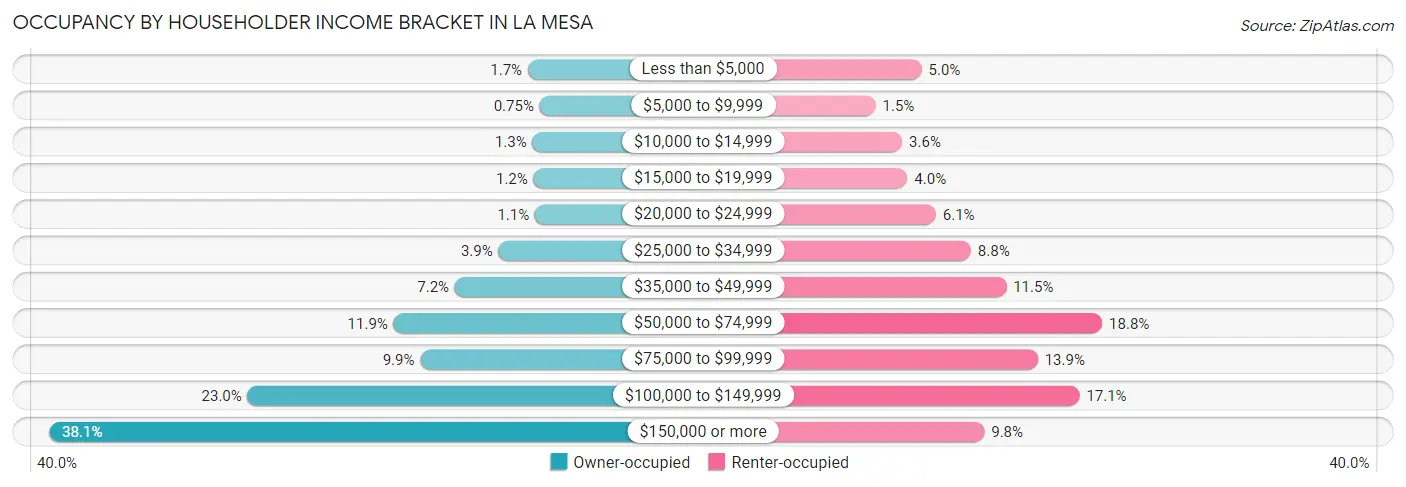
| Income Bracket | Owner-occupied | Renter-occupied |
| Less than $5,000 | 183 (1.7%) | 689 (5.0%) |
| $5,000 to $9,999 | 83 (0.7%) | 210 (1.5%) |
| $10,000 to $14,999 | 145 (1.3%) | 487 (3.5%) |
| $15,000 to $19,999 | 136 (1.2%) | 541 (4.0%) |
| $20,000 to $24,999 | 124 (1.1%) | 838 (6.1%) |
| $25,000 to $34,999 | 433 (3.9%) | 1,205 (8.8%) |
| $35,000 to $49,999 | 802 (7.2%) | 1,573 (11.5%) |
| $50,000 to $74,999 | 1,321 (11.9%) | 2,575 (18.8%) |
| $75,000 to $99,999 | 1,096 (9.9%) | 1,902 (13.9%) |
| $100,000 to $149,999 | 2,559 (23.0%) | 2,337 (17.1%) |
| $150,000 or more | 4,241 (38.1%) | 1,344 (9.8%) |
| Total | 11,123 (100.0%) | 13,701 (100.0%) |
Monthly Housing Cost Tiers in La Mesa
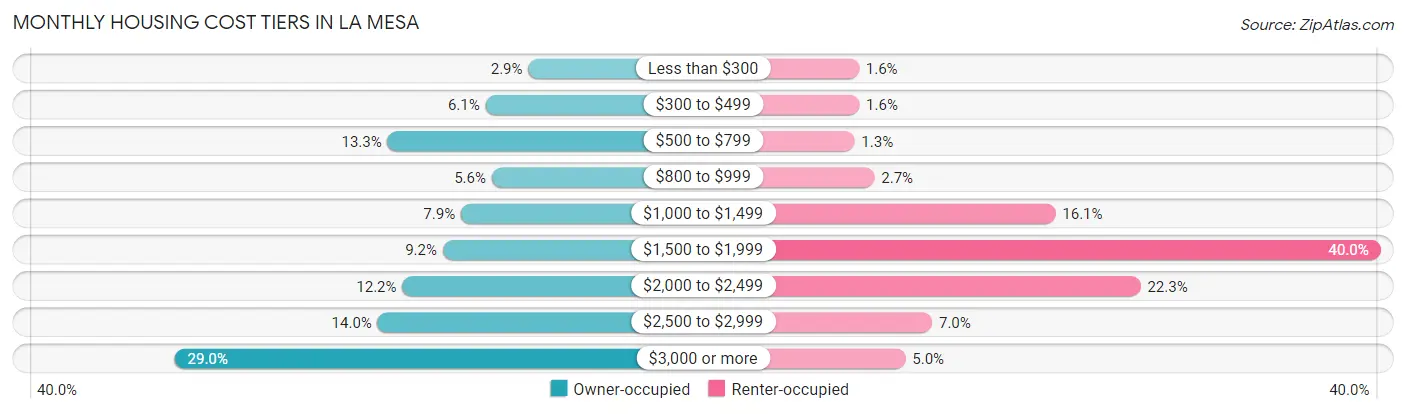
| Monthly Cost | Owner-occupied | Renter-occupied |
| Less than $300 | 323 (2.9%) | 217 (1.6%) |
| $300 to $499 | 673 (6.0%) | 219 (1.6%) |
| $500 to $799 | 1,476 (13.3%) | 171 (1.3%) |
| $800 to $999 | 622 (5.6%) | 372 (2.7%) |
| $1,000 to $1,499 | 874 (7.9%) | 2,199 (16.1%) |
| $1,500 to $1,999 | 1,023 (9.2%) | 5,481 (40.0%) |
| $2,000 to $2,499 | 1,355 (12.2%) | 3,058 (22.3%) |
| $2,500 to $2,999 | 1,557 (14.0%) | 955 (7.0%) |
| $3,000 or more | 3,220 (28.9%) | 685 (5.0%) |
| Total | 11,123 (100.0%) | 13,701 (100.0%) |
Physical Housing Characteristics in La Mesa
Housing Structures in La Mesa
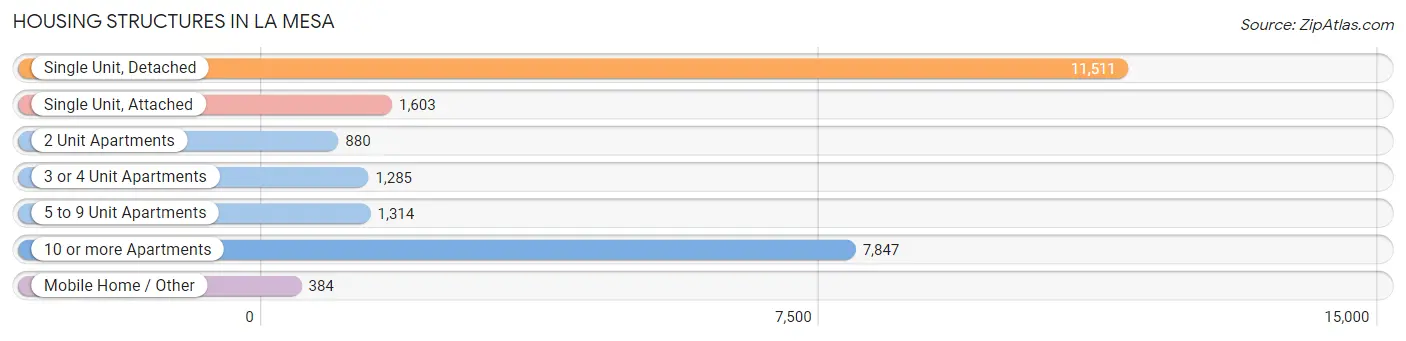
| Structure Type | # Housing Units | % Housing Units |
| Single Unit, Detached | 11,511 | 46.4% |
| Single Unit, Attached | 1,603 | 6.5% |
| 2 Unit Apartments | 880 | 3.5% |
| 3 or 4 Unit Apartments | 1,285 | 5.2% |
| 5 to 9 Unit Apartments | 1,314 | 5.3% |
| 10 or more Apartments | 7,847 | 31.6% |
| Mobile Home / Other | 384 | 1.5% |
| Total | 24,824 | 100.0% |
Housing Structures by Occupancy in La Mesa
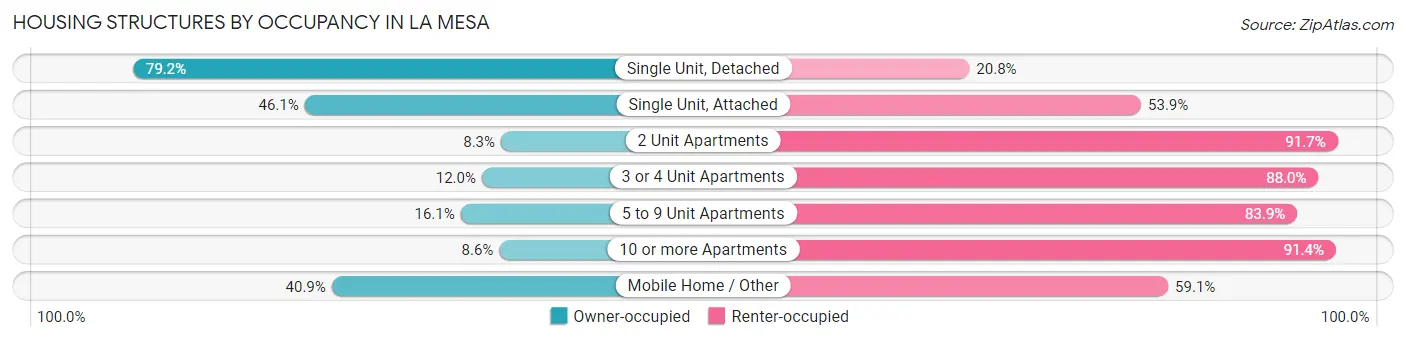
| Structure Type | Owner-occupied | Renter-occupied |
| Single Unit, Detached | 9,112 (79.2%) | 2,399 (20.8%) |
| Single Unit, Attached | 739 (46.1%) | 864 (53.9%) |
| 2 Unit Apartments | 73 (8.3%) | 807 (91.7%) |
| 3 or 4 Unit Apartments | 154 (12.0%) | 1,131 (88.0%) |
| 5 to 9 Unit Apartments | 211 (16.1%) | 1,103 (83.9%) |
| 10 or more Apartments | 677 (8.6%) | 7,170 (91.4%) |
| Mobile Home / Other | 157 (40.9%) | 227 (59.1%) |
| Total | 11,123 (44.8%) | 13,701 (55.2%) |
Housing Structures by Number of Rooms in La Mesa
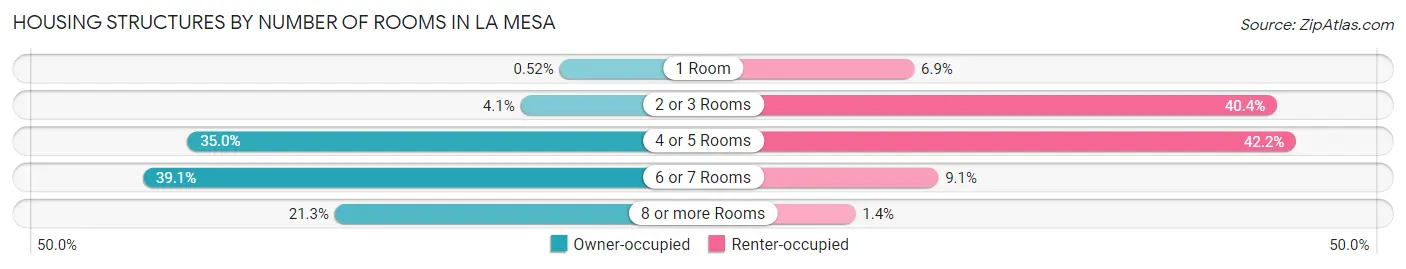
| Number of Rooms | Owner-occupied | Renter-occupied |
| 1 Room | 58 (0.5%) | 940 (6.9%) |
| 2 or 3 Rooms | 461 (4.1%) | 5,538 (40.4%) |
| 4 or 5 Rooms | 3,889 (35.0%) | 5,781 (42.2%) |
| 6 or 7 Rooms | 4,345 (39.1%) | 1,246 (9.1%) |
| 8 or more Rooms | 2,370 (21.3%) | 196 (1.4%) |
| Total | 11,123 (100.0%) | 13,701 (100.0%) |
Housing Structure by Heating Type in La Mesa
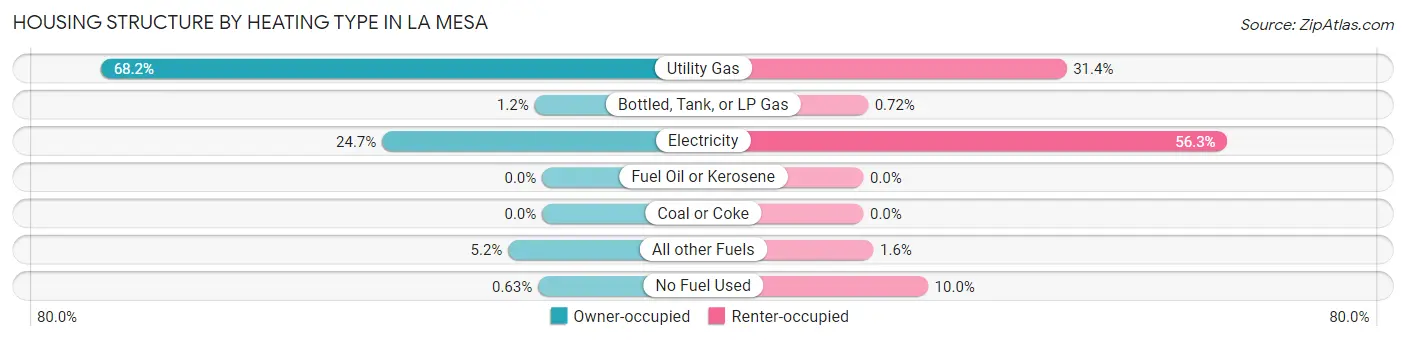
| Heating Type | Owner-occupied | Renter-occupied |
| Utility Gas | 7,589 (68.2%) | 4,304 (31.4%) |
| Bottled, Tank, or LP Gas | 130 (1.2%) | 98 (0.7%) |
| Electricity | 2,751 (24.7%) | 7,717 (56.3%) |
| Fuel Oil or Kerosene | 0 (0.0%) | 0 (0.0%) |
| Coal or Coke | 0 (0.0%) | 0 (0.0%) |
| All other Fuels | 583 (5.2%) | 213 (1.5%) |
| No Fuel Used | 70 (0.6%) | 1,369 (10.0%) |
| Total | 11,123 (100.0%) | 13,701 (100.0%) |
Household Vehicle Usage in La Mesa
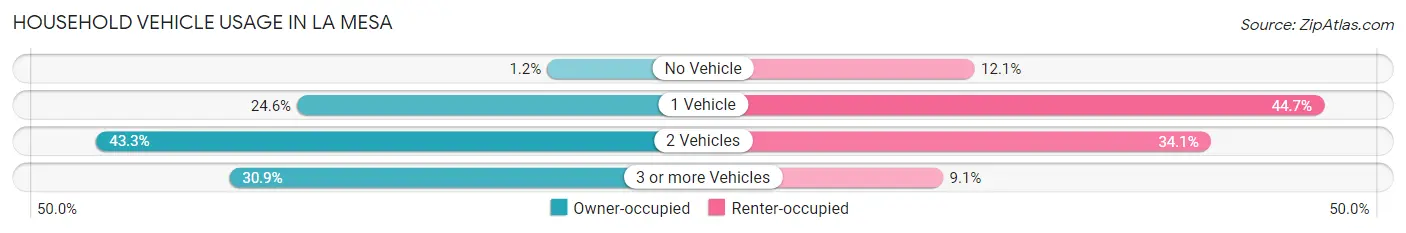
| Vehicles per Household | Owner-occupied | Renter-occupied |
| No Vehicle | 137 (1.2%) | 1,653 (12.1%) |
| 1 Vehicle | 2,734 (24.6%) | 6,124 (44.7%) |
| 2 Vehicles | 4,816 (43.3%) | 4,675 (34.1%) |
| 3 or more Vehicles | 3,436 (30.9%) | 1,249 (9.1%) |
| Total | 11,123 (100.0%) | 13,701 (100.0%) |
Real Estate & Mortgages in La Mesa
Real Estate and Mortgage Overview in La Mesa
| Characteristic | Without Mortgage | With Mortgage |
| Housing Units | 3,458 | 7,665 |
| Median Property Value | $646,000 | $698,700 |
| Median Household Income | $87,171 | $3,399 |
| Monthly Housing Costs | $667 | $3,209 |
| Real Estate Taxes | $2,992 | $107 |
Property Value by Mortgage Status in La Mesa
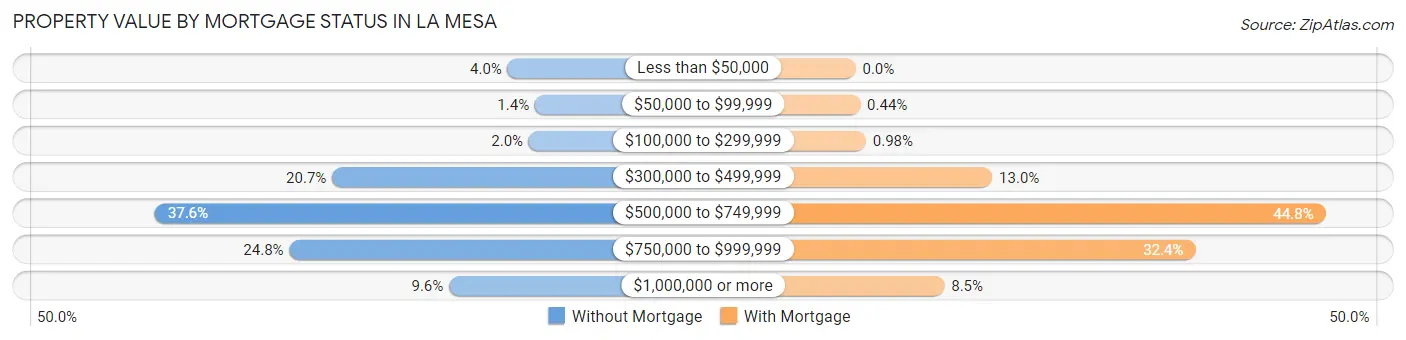
| Property Value | Without Mortgage | With Mortgage |
| Less than $50,000 | 138 (4.0%) | 0 (0.0%) |
| $50,000 to $99,999 | 48 (1.4%) | 34 (0.4%) |
| $100,000 to $299,999 | 68 (2.0%) | 75 (1.0%) |
| $300,000 to $499,999 | 716 (20.7%) | 997 (13.0%) |
| $500,000 to $749,999 | 1,300 (37.6%) | 3,431 (44.8%) |
| $750,000 to $999,999 | 857 (24.8%) | 2,480 (32.4%) |
| $1,000,000 or more | 331 (9.6%) | 648 (8.5%) |
| Total | 3,458 (100.0%) | 7,665 (100.0%) |
Household Income by Mortgage Status in La Mesa
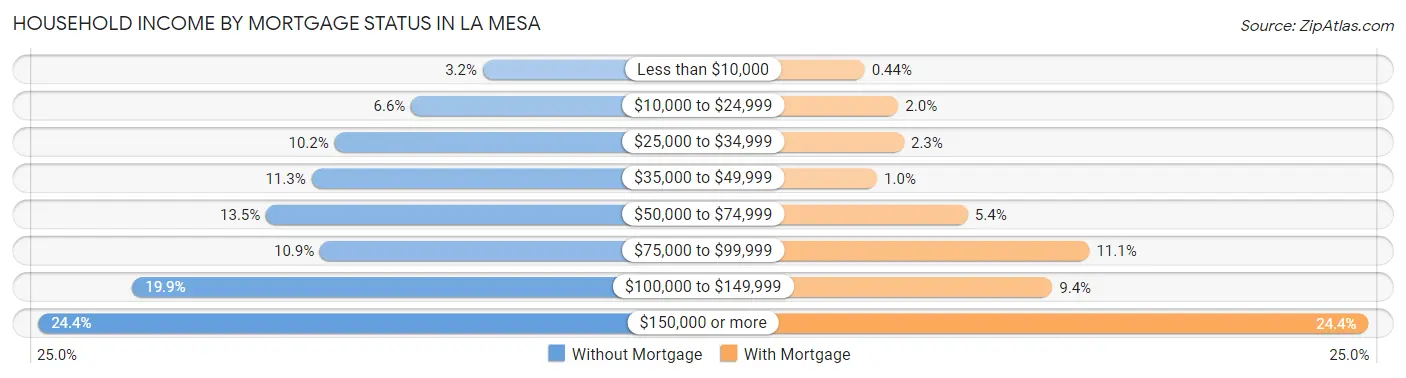
| Household Income | Without Mortgage | With Mortgage |
| Less than $10,000 | 110 (3.2%) | 34 (0.4%) |
| $10,000 to $24,999 | 228 (6.6%) | 156 (2.0%) |
| $25,000 to $34,999 | 354 (10.2%) | 177 (2.3%) |
| $35,000 to $49,999 | 392 (11.3%) | 79 (1.0%) |
| $50,000 to $74,999 | 467 (13.5%) | 410 (5.3%) |
| $75,000 to $99,999 | 378 (10.9%) | 854 (11.1%) |
| $100,000 to $149,999 | 687 (19.9%) | 718 (9.4%) |
| $150,000 or more | 842 (24.3%) | 1,872 (24.4%) |
| Total | 3,458 (100.0%) | 7,665 (100.0%) |
Property Value to Household Income Ratio in La Mesa
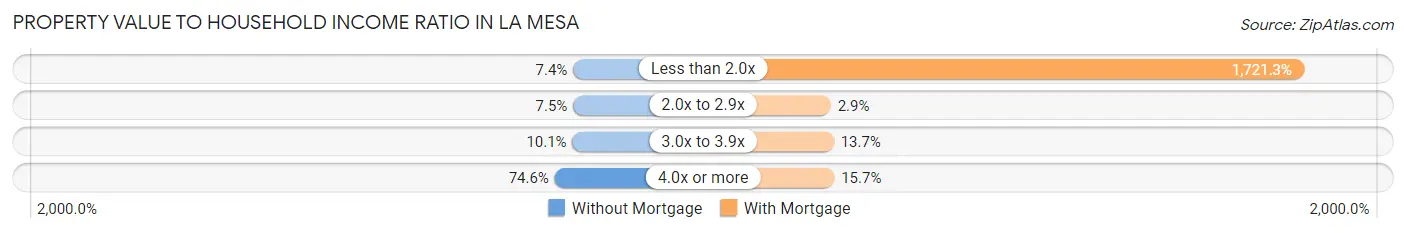
| Value-to-Income Ratio | Without Mortgage | With Mortgage |
| Less than 2.0x | 256 (7.4%) | 131,934 (1,721.2%) |
| 2.0x to 2.9x | 258 (7.5%) | 221 (2.9%) |
| 3.0x to 3.9x | 350 (10.1%) | 1,047 (13.7%) |
| 4.0x or more | 2,579 (74.6%) | 1,203 (15.7%) |
| Total | 3,458 (100.0%) | 7,665 (100.0%) |
Real Estate Taxes by Mortgage Status in La Mesa
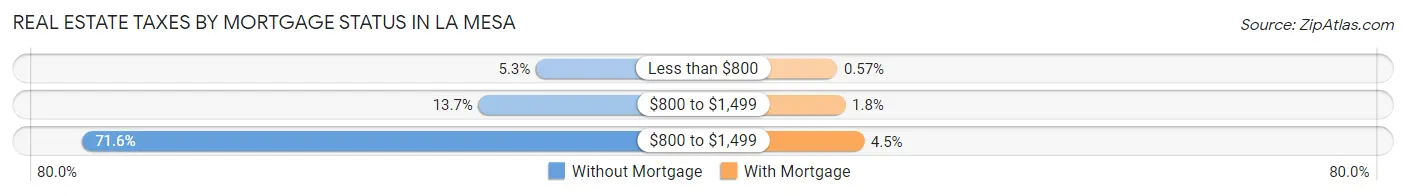
| Property Taxes | Without Mortgage | With Mortgage |
| Less than $800 | 182 (5.3%) | 44 (0.6%) |
| $800 to $1,499 | 472 (13.7%) | 135 (1.8%) |
| $800 to $1,499 | 2,475 (71.6%) | 345 (4.5%) |
| Total | 3,458 (100.0%) | 7,665 (100.0%) |
Health & Disability in La Mesa
Health Insurance Coverage by Age in La Mesa
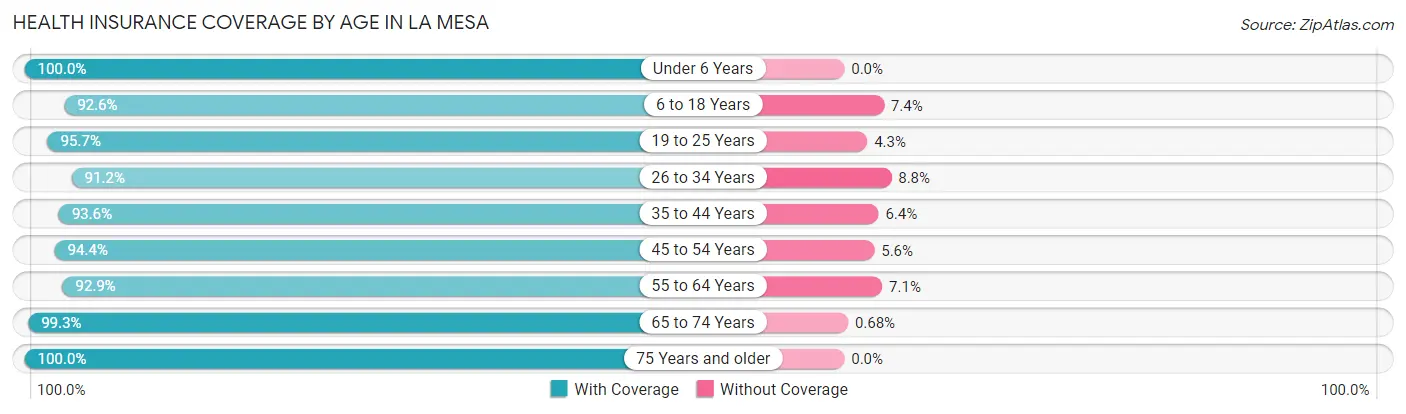
| Age Bracket | With Coverage | Without Coverage |
| Under 6 Years | 4,856 (100.0%) | 0 (0.0%) |
| 6 to 18 Years | 8,001 (92.6%) | 638 (7.4%) |
| 19 to 25 Years | 4,645 (95.7%) | 207 (4.3%) |
| 26 to 34 Years | 9,105 (91.2%) | 874 (8.8%) |
| 35 to 44 Years | 8,178 (93.6%) | 556 (6.4%) |
| 45 to 54 Years | 6,536 (94.4%) | 387 (5.6%) |
| 55 to 64 Years | 6,149 (92.9%) | 467 (7.1%) |
| 65 to 74 Years | 4,976 (99.3%) | 34 (0.7%) |
| 75 Years and older | 3,489 (100.0%) | 0 (0.0%) |
| Total | 55,935 (94.7%) | 3,163 (5.3%) |
Health Insurance Coverage by Citizenship Status in La Mesa
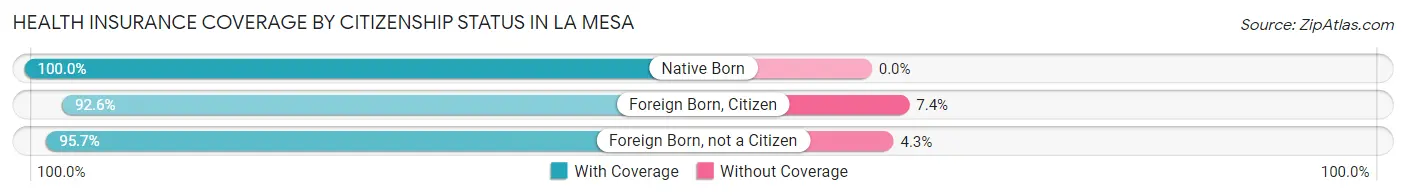
| Citizenship Status | With Coverage | Without Coverage |
| Native Born | 4,856 (100.0%) | 0 (0.0%) |
| Foreign Born, Citizen | 8,001 (92.6%) | 638 (7.4%) |
| Foreign Born, not a Citizen | 4,645 (95.7%) | 207 (4.3%) |
Health Insurance Coverage by Household Income in La Mesa
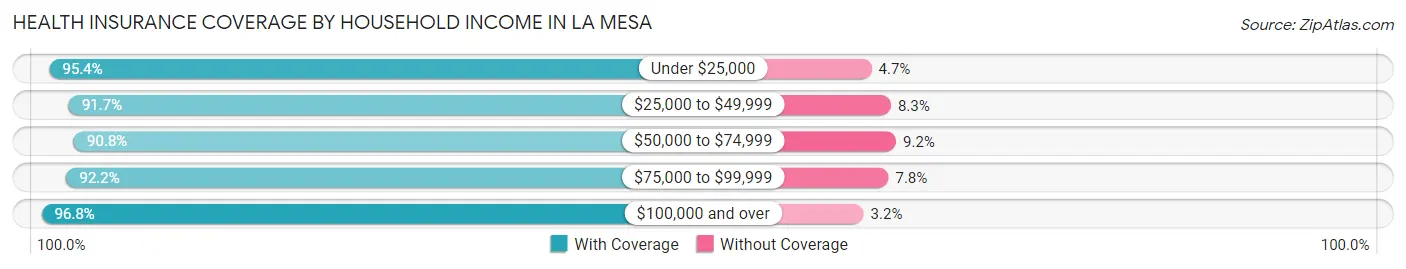
| Household Income | With Coverage | Without Coverage |
| Under $25,000 | 5,720 (95.4%) | 279 (4.6%) |
| $25,000 to $49,999 | 6,702 (91.7%) | 604 (8.3%) |
| $50,000 to $74,999 | 7,408 (90.8%) | 754 (9.2%) |
| $75,000 to $99,999 | 6,542 (92.2%) | 555 (7.8%) |
| $100,000 and over | 29,379 (96.8%) | 958 (3.2%) |
Public vs Private Health Insurance Coverage by Age in La Mesa
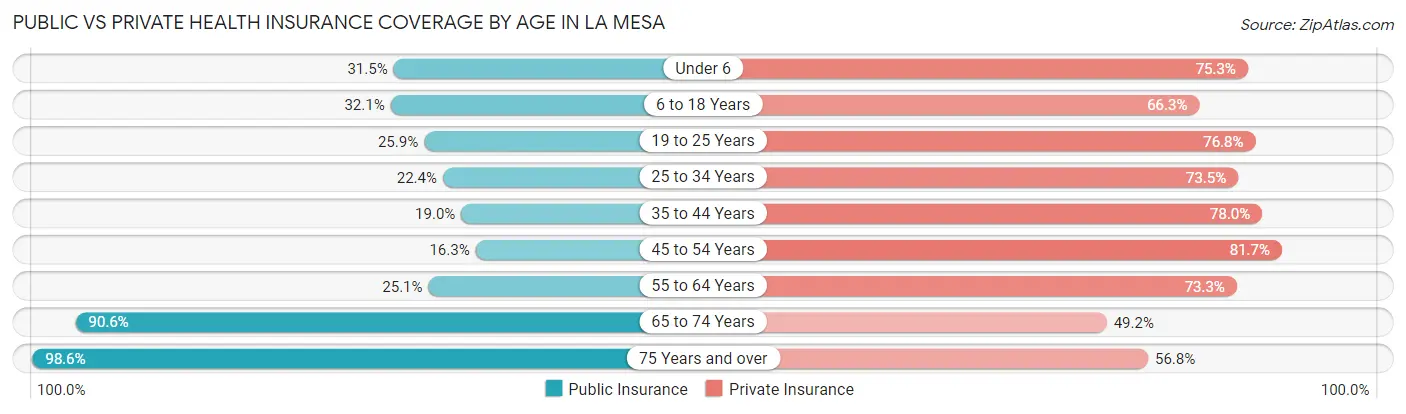
| Age Bracket | Public Insurance | Private Insurance |
| Under 6 | 1,531 (31.5%) | 3,658 (75.3%) |
| 6 to 18 Years | 2,772 (32.1%) | 5,731 (66.3%) |
| 19 to 25 Years | 1,255 (25.9%) | 3,724 (76.7%) |
| 25 to 34 Years | 2,232 (22.4%) | 7,339 (73.5%) |
| 35 to 44 Years | 1,657 (19.0%) | 6,813 (78.0%) |
| 45 to 54 Years | 1,129 (16.3%) | 5,653 (81.7%) |
| 55 to 64 Years | 1,658 (25.1%) | 4,849 (73.3%) |
| 65 to 74 Years | 4,537 (90.6%) | 2,464 (49.2%) |
| 75 Years and over | 3,439 (98.6%) | 1,983 (56.8%) |
| Total | 20,210 (34.2%) | 42,214 (71.4%) |
Disability Status by Sex by Age in La Mesa
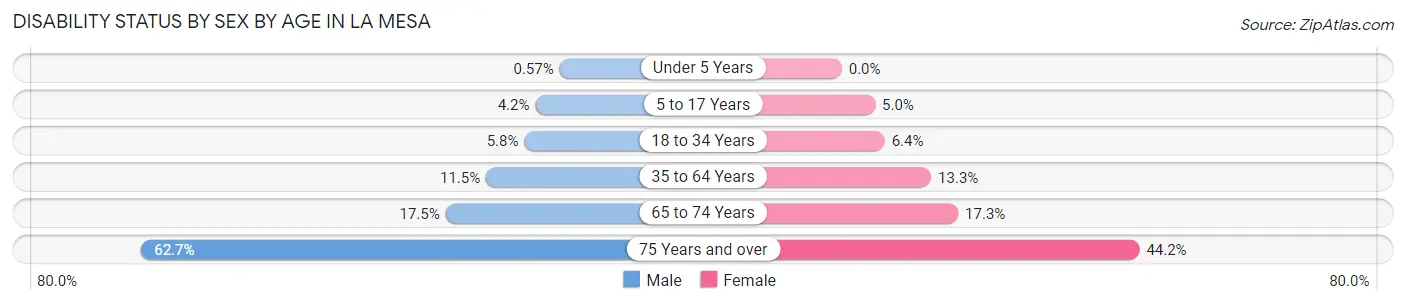
| Age Bracket | Male | Female |
| Under 5 Years | 12 (0.6%) | 0 (0.0%) |
| 5 to 17 Years | 188 (4.2%) | 200 (5.0%) |
| 18 to 34 Years | 429 (5.8%) | 515 (6.4%) |
| 35 to 64 Years | 1,200 (11.5%) | 1,569 (13.3%) |
| 65 to 74 Years | 362 (17.5%) | 508 (17.3%) |
| 75 Years and over | 797 (62.7%) | 980 (44.2%) |
Disability Class by Sex by Age in La Mesa
Disability Class: Hearing Difficulty
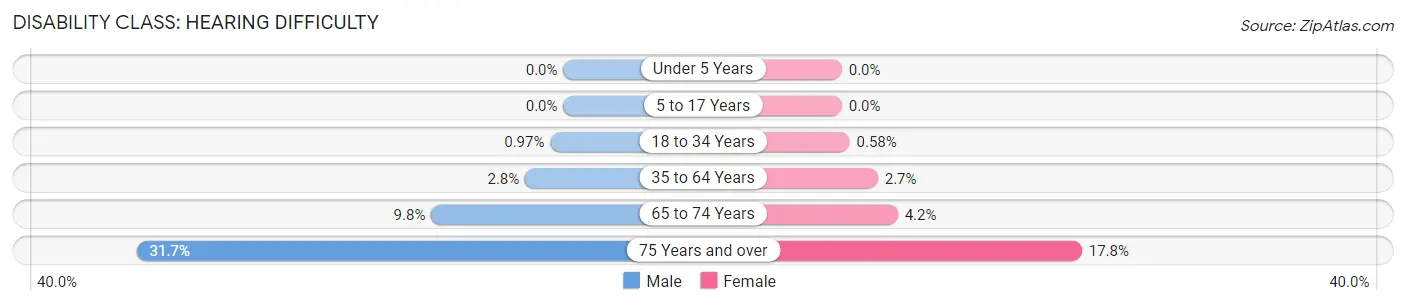
| Age Bracket | Male | Female |
| Under 5 Years | 0 (0.0%) | 0 (0.0%) |
| 5 to 17 Years | 0 (0.0%) | 0 (0.0%) |
| 18 to 34 Years | 72 (1.0%) | 47 (0.6%) |
| 35 to 64 Years | 297 (2.8%) | 316 (2.7%) |
| 65 to 74 Years | 203 (9.8%) | 122 (4.2%) |
| 75 Years and over | 403 (31.7%) | 395 (17.8%) |
Disability Class: Vision Difficulty
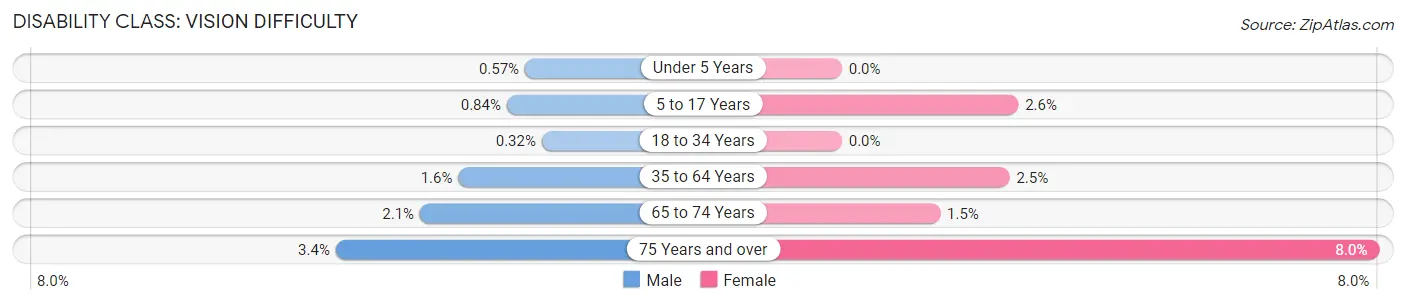
| Age Bracket | Male | Female |
| Under 5 Years | 12 (0.6%) | 0 (0.0%) |
| 5 to 17 Years | 38 (0.8%) | 106 (2.6%) |
| 18 to 34 Years | 24 (0.3%) | 0 (0.0%) |
| 35 to 64 Years | 163 (1.6%) | 294 (2.5%) |
| 65 to 74 Years | 44 (2.1%) | 43 (1.5%) |
| 75 Years and over | 43 (3.4%) | 177 (8.0%) |
Disability Class: Cognitive Difficulty
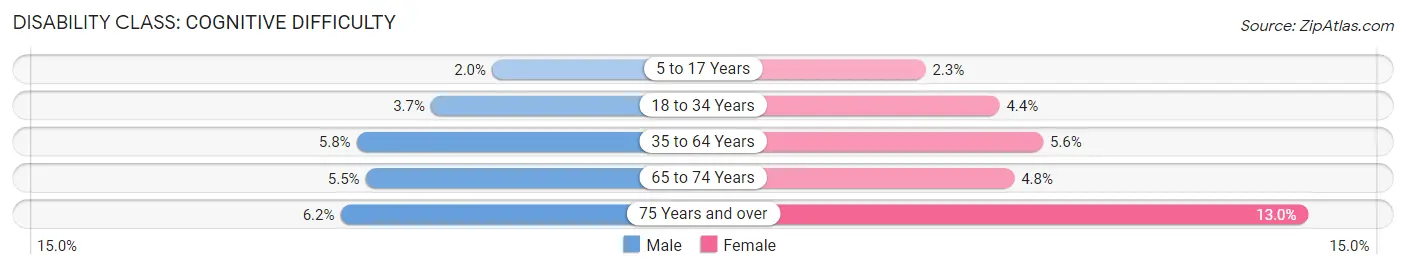
| Age Bracket | Male | Female |
| 5 to 17 Years | 90 (2.0%) | 94 (2.3%) |
| 18 to 34 Years | 273 (3.7%) | 355 (4.4%) |
| 35 to 64 Years | 602 (5.8%) | 662 (5.6%) |
| 65 to 74 Years | 114 (5.5%) | 141 (4.8%) |
| 75 Years and over | 79 (6.2%) | 288 (13.0%) |
Disability Class: Ambulatory Difficulty
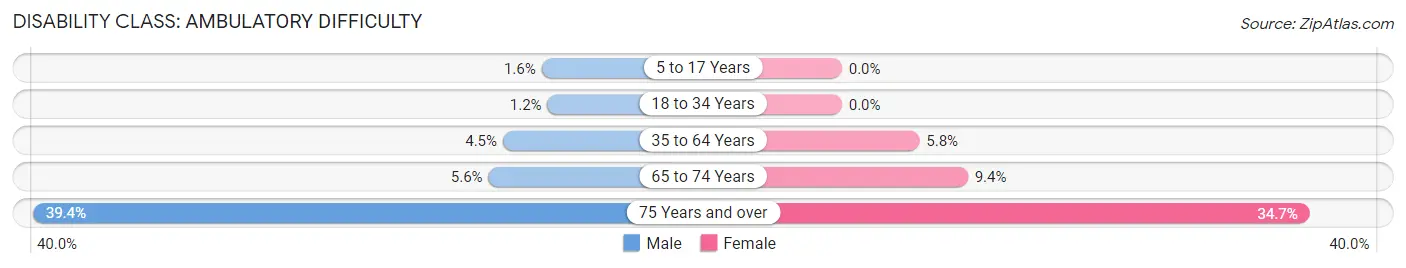
| Age Bracket | Male | Female |
| 5 to 17 Years | 73 (1.6%) | 0 (0.0%) |
| 18 to 34 Years | 87 (1.2%) | 0 (0.0%) |
| 35 to 64 Years | 469 (4.5%) | 681 (5.8%) |
| 65 to 74 Years | 115 (5.6%) | 275 (9.3%) |
| 75 Years and over | 501 (39.4%) | 770 (34.7%) |
Disability Class: Self-Care Difficulty
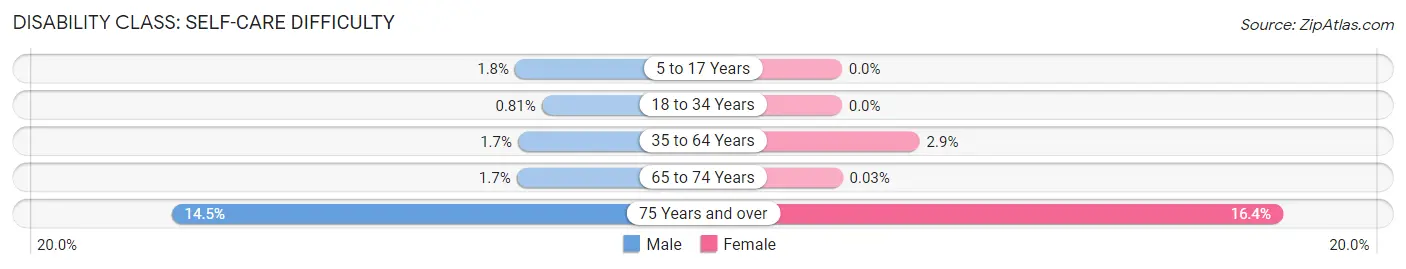
| Age Bracket | Male | Female |
| 5 to 17 Years | 81 (1.8%) | 0 (0.0%) |
| 18 to 34 Years | 60 (0.8%) | 0 (0.0%) |
| 35 to 64 Years | 177 (1.7%) | 342 (2.9%) |
| 65 to 74 Years | 36 (1.7%) | 1 (0.0%) |
| 75 Years and over | 185 (14.5%) | 363 (16.4%) |
Technology Access in La Mesa
Computing Device Access in La Mesa
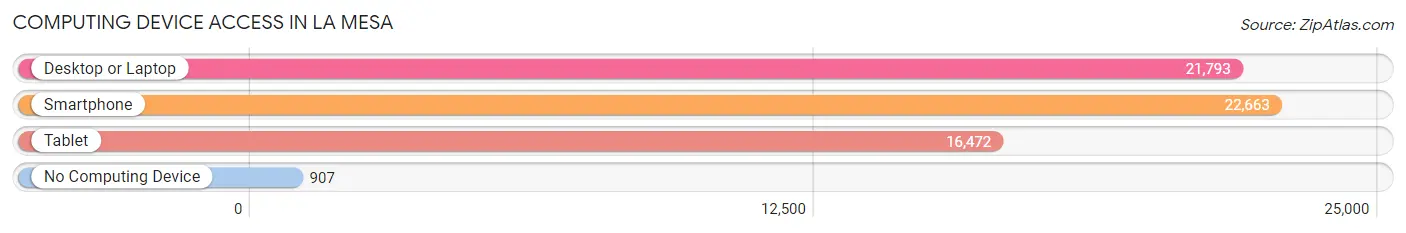
| Device Type | # Households | % Households |
| Desktop or Laptop | 21,793 | 87.8% |
| Smartphone | 22,663 | 91.3% |
| Tablet | 16,472 | 66.4% |
| No Computing Device | 907 | 3.6% |
| Total | 24,824 | 100.0% |
Internet Access in La Mesa
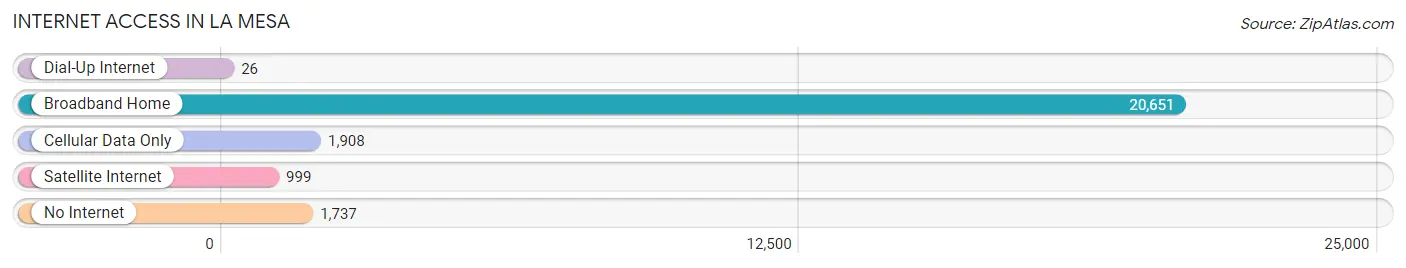
| Internet Type | # Households | % Households |
| Dial-Up Internet | 26 | 0.1% |
| Broadband Home | 20,651 | 83.2% |
| Cellular Data Only | 1,908 | 7.7% |
| Satellite Internet | 999 | 4.0% |
| No Internet | 1,737 | 7.0% |
| Total | 24,824 | 100.0% |
La Mesa Summary
History
La Mesa is a city located in San Diego County, California. It is situated in the foothills of the Cuyamaca Mountains and is located about 10 miles east of downtown San Diego. The city was founded in 1869 and incorporated in 1912. La Mesa is Spanish for “the table” and was named for the flat mesa that the city is built on.
The area that is now La Mesa was originally inhabited by the Kumeyaay people. The first Europeans to settle in the area were Spanish missionaries who established a mission in 1769. The area was then part of Mexico until 1848 when it became part of the United States after the Mexican-American War.
In 1869, the area was surveyed and divided into lots by a man named John T. Frazier. Frazier named the area La Mesa and began selling lots to settlers. The first settlers were mostly farmers and ranchers who grew crops such as wheat, barley, and oats.
In 1887, the first railroad line was built through La Mesa, connecting it to San Diego. This allowed for the growth of the city as it became a popular destination for tourists and vacationers.
In 1912, La Mesa was officially incorporated as a city. The city continued to grow and by the 1950s, it had become a popular suburb of San Diego.
Geography
La Mesa is located in San Diego County, California. It is situated in the foothills of the Cuyamaca Mountains and is located about 10 miles east of downtown San Diego. The city covers an area of 9.2 square miles and has an elevation of 486 feet.
The city is bordered by the cities of El Cajon to the north, Lemon Grove to the east, and San Diego to the south and west. La Mesa is located in a semi-arid climate zone and has an average annual temperature of 64°F.
Economy
La Mesa has a diverse economy that is driven by a variety of industries. The city is home to several large employers, including Sharp HealthCare, San Diego State University, and the Grossmont Union High School District.
The city is also home to a number of small businesses, including restaurants, retail stores, and professional services. La Mesa is also home to several shopping centers, including Grossmont Center and La Mesa Village.
Demographics
As of the 2010 census, La Mesa had a population of 57,065. The population is made up of a diverse mix of ethnicities, including White (63.2%), Hispanic or Latino (25.2%), Asian (4.7%), African American (3.2%), and Native American (0.7%).
The median household income in La Mesa is $63,845 and the median home value is $521,000. The city has a high rate of homeownership, with 73.3% of residents owning their own homes.
La Mesa is a diverse and vibrant city that is home to a variety of cultures and lifestyles. The city is known for its small-town charm and is a popular destination for tourists and vacationers.
Common Questions
What is Per Capita Income in La Mesa?
Per Capita income in La Mesa is $44,185.
What is the Median Family Income in La Mesa?
Median Family Income in La Mesa is $104,548.
What is the Median Household income in La Mesa?
Median Household Income in La Mesa is $83,649.
What is Income or Wage Gap in La Mesa?
Income or Wage Gap in La Mesa is 26.5%.
Women in La Mesa earn 73.5 cents for every dollar earned by a man.
What is Inequality or Gini Index in La Mesa?
Inequality or Gini Index in La Mesa is 0.44.
What is the Total Population of La Mesa?
Total Population of La Mesa is 60,888.
What is the Total Male Population of La Mesa?
Total Male Population of La Mesa is 29,039.
What is the Total Female Population of La Mesa?
Total Female Population of La Mesa is 31,849.
What is the Ratio of Males per 100 Females in La Mesa?
There are 91.18 Males per 100 Females in La Mesa.
What is the Ratio of Females per 100 Males in La Mesa?
There are 109.68 Females per 100 Males in La Mesa.
What is the Median Population Age in La Mesa?
Median Population Age in La Mesa is 36.3 Years.
What is the Average Family Size in La Mesa
Average Family Size in La Mesa is 3.1 People.
What is the Average Household Size in La Mesa
Average Household Size in La Mesa is 2.4 People.
How Large is the Labor Force in La Mesa?
There are 34,132 People in the Labor Forcein in La Mesa.
What is the Percentage of People in the Labor Force in La Mesa?
69.4% of People are in the Labor Force in La Mesa.
What is the Unemployment Rate in La Mesa?
Unemployment Rate in La Mesa is 6.5%.