Cornelia, GA Map & Demographics
Cornelia Map
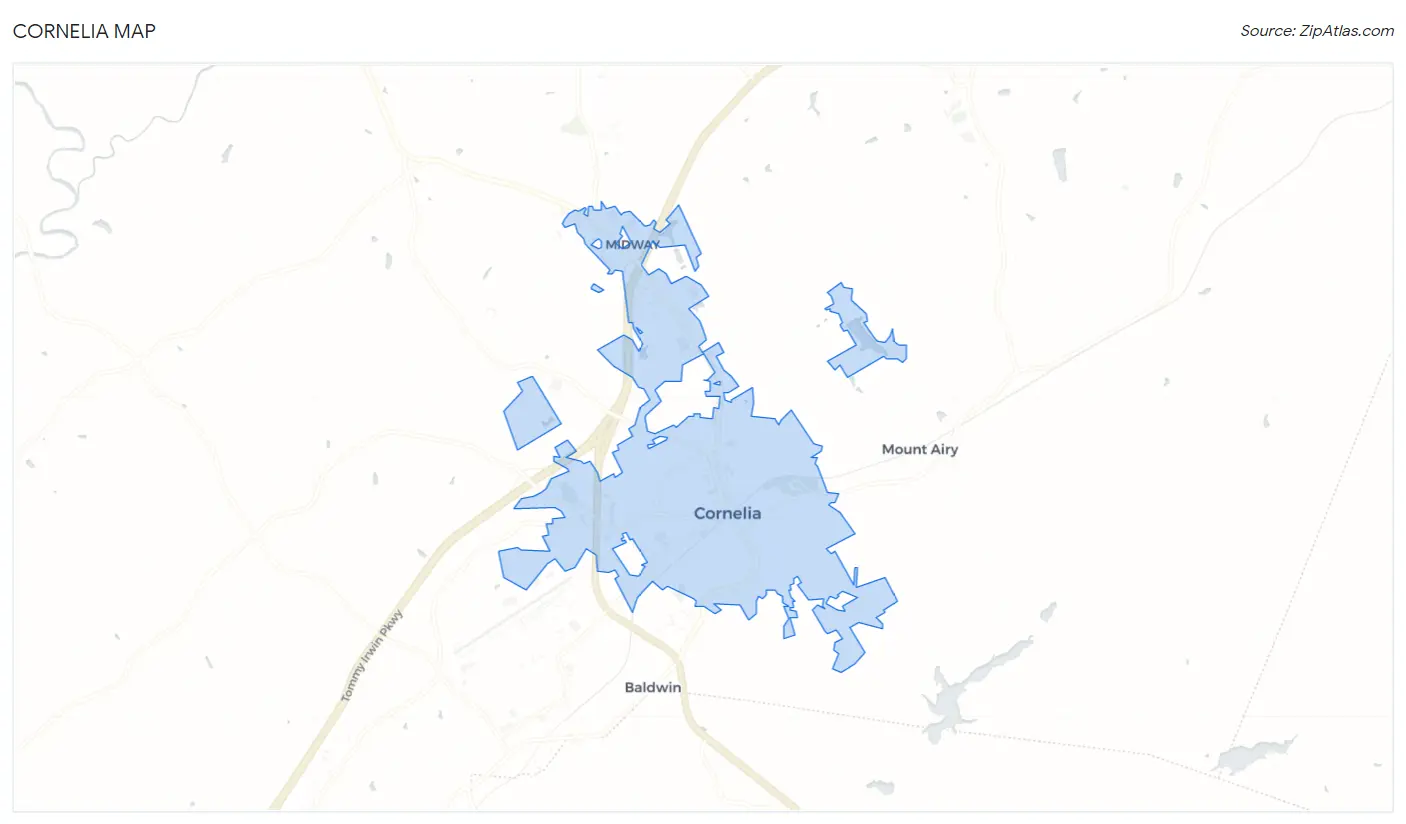
Cornelia Overview
$27,224
PER CAPITA INCOME
$62,835
AVG FAMILY INCOME
$46,211
AVG HOUSEHOLD INCOME
12.2%
WAGE / INCOME GAP [ % ]
87.8¢/ $1
WAGE / INCOME GAP [ $ ]
0.54
INEQUALITY / GINI INDEX
4,648
TOTAL POPULATION
2,333
MALE POPULATION
2,315
FEMALE POPULATION
100.78
MALES / 100 FEMALES
99.23
FEMALES / 100 MALES
30.4
MEDIAN AGE
3.9
AVG FAMILY SIZE
3.0
AVG HOUSEHOLD SIZE
2,364
LABOR FORCE [ PEOPLE ]
60.4%
PERCENT IN LABOR FORCE
1.2%
UNEMPLOYMENT RATE
Cornelia Zip Codes
Cornelia Area Codes
Income in Cornelia
Income Overview in Cornelia
Per Capita Income in Cornelia is $27,224, while median incomes of families and households are $62,835 and $46,211 respectively.
| Characteristic | Number | Measure |
| Per Capita Income | 4,648 | $27,224 |
| Median Family Income | 941 | $62,835 |
| Mean Family Income | 941 | $100,033 |
| Median Household Income | 1,535 | $46,211 |
| Mean Household Income | 1,535 | $79,536 |
| Income Deficit | 941 | $0 |
| Wage / Income Gap (%) | 4,648 | 12.20% |
| Wage / Income Gap ($) | 4,648 | 87.80¢ per $1 |
| Gini / Inequality Index | 4,648 | 0.54 |
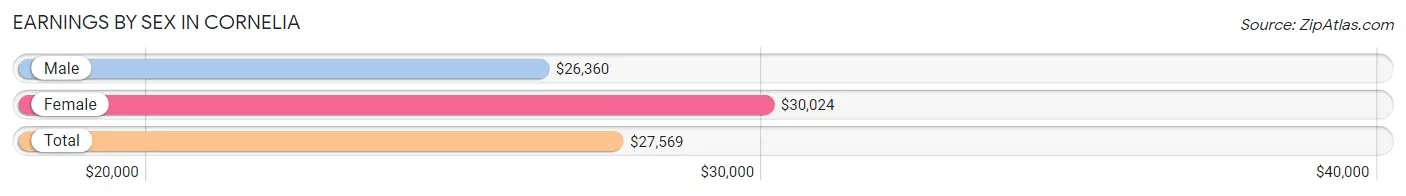
Earnings by Sex in Cornelia
Average Earnings in Cornelia are $27,569, $26,360 for men and $30,024 for women, a difference of 12.2%.
| Sex | Number | Average Earnings |
| Male | 1,347 (55.2%) | $26,360 |
| Female | 1,093 (44.8%) | $30,024 |
| Total | 2,440 (100.0%) | $27,569 |
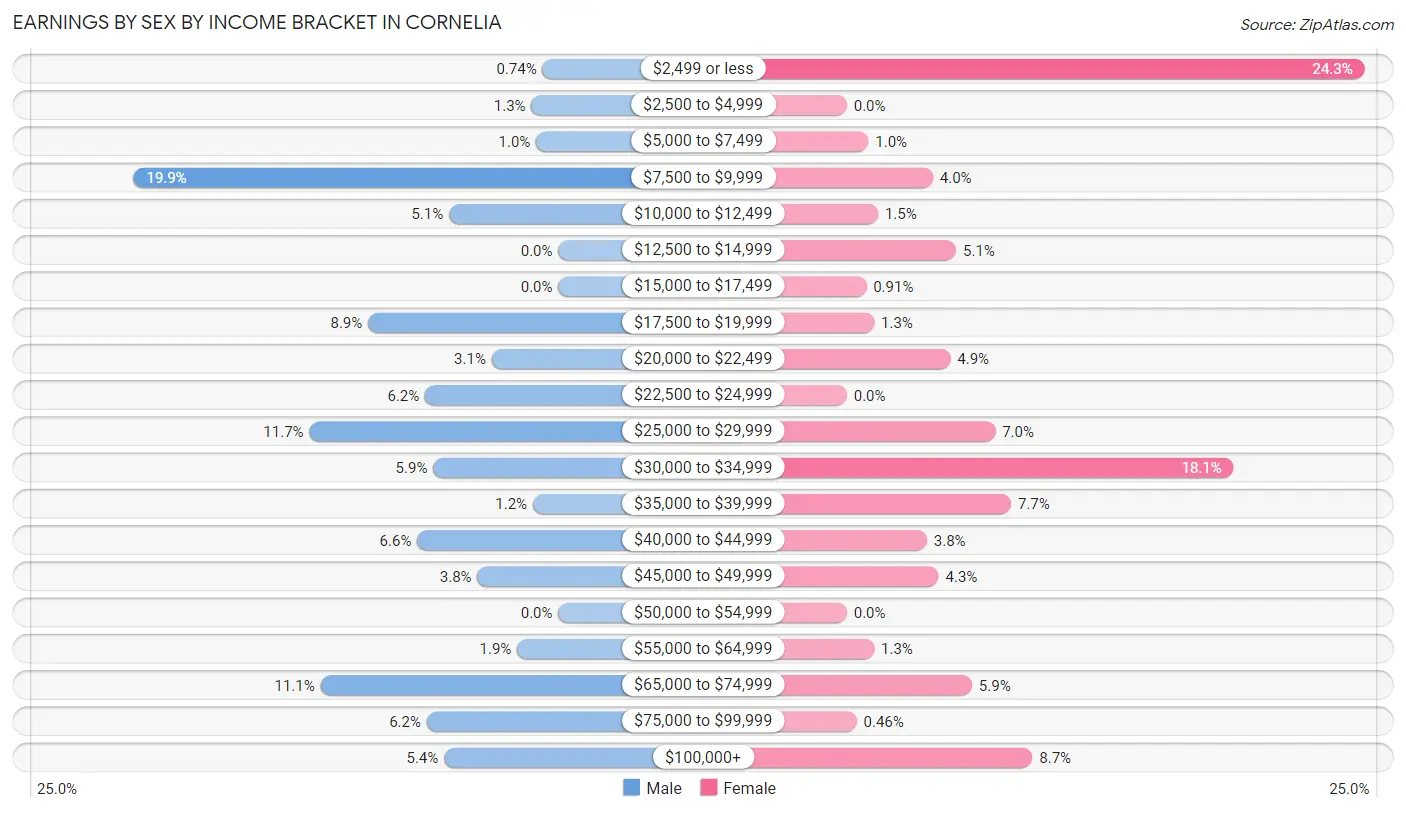
Earnings by Sex by Income Bracket in Cornelia
The most common earnings brackets in Cornelia are $7,500 to $9,999 for men (268 | 19.9%) and $2,499 or less for women (265 | 24.2%).
| Income | Male | Female |
| $2,499 or less | 10 (0.7%) | 265 (24.2%) |
| $2,500 to $4,999 | 17 (1.3%) | 0 (0.0%) |
| $5,000 to $7,499 | 14 (1.0%) | 11 (1.0%) |
| $7,500 to $9,999 | 268 (19.9%) | 44 (4.0%) |
| $10,000 to $12,499 | 69 (5.1%) | 16 (1.5%) |
| $12,500 to $14,999 | 0 (0.0%) | 56 (5.1%) |
| $15,000 to $17,499 | 0 (0.0%) | 10 (0.9%) |
| $17,500 to $19,999 | 120 (8.9%) | 14 (1.3%) |
| $20,000 to $22,499 | 42 (3.1%) | 53 (4.9%) |
| $22,500 to $24,999 | 84 (6.2%) | 0 (0.0%) |
| $25,000 to $29,999 | 157 (11.7%) | 76 (7.0%) |
| $30,000 to $34,999 | 79 (5.9%) | 198 (18.1%) |
| $35,000 to $39,999 | 16 (1.2%) | 84 (7.7%) |
| $40,000 to $44,999 | 89 (6.6%) | 41 (3.7%) |
| $45,000 to $49,999 | 51 (3.8%) | 47 (4.3%) |
| $50,000 to $54,999 | 0 (0.0%) | 0 (0.0%) |
| $55,000 to $64,999 | 26 (1.9%) | 14 (1.3%) |
| $65,000 to $74,999 | 150 (11.1%) | 64 (5.9%) |
| $75,000 to $99,999 | 83 (6.2%) | 5 (0.5%) |
| $100,000+ | 72 (5.3%) | 95 (8.7%) |
| Total | 1,347 (100.0%) | 1,093 (100.0%) |
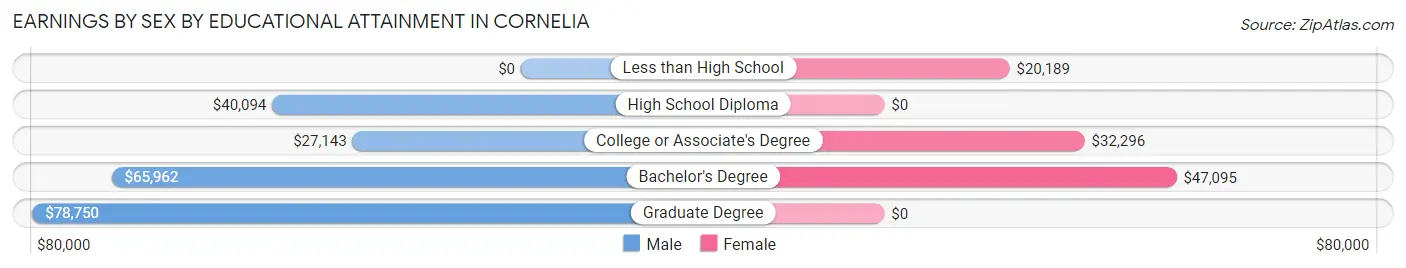
Earnings by Sex by Educational Attainment in Cornelia
Average earnings in Cornelia are $29,394 for men and $32,152 for women, a difference of 8.6%. Men with an educational attainment of graduate degree enjoy the highest average annual earnings of $78,750, while those with college or associate's degree education earn the least with $27,143. Women with an educational attainment of bachelor's degree earn the most with the average annual earnings of $47,095, while those with less than high school education have the smallest earnings of $20,189.
| Educational Attainment | Male Income | Female Income |
| Less than High School | - | - |
| High School Diploma | $40,094 | $0 |
| College or Associate's Degree | $27,143 | $32,296 |
| Bachelor's Degree | $65,962 | $47,095 |
| Graduate Degree | $78,750 | $0 |
| Total | $29,394 | $32,152 |
Family Income in Cornelia
Family Income Brackets in Cornelia
According to the Cornelia family income data, there are 198 families falling into the $35,000 to $49,999 income range, which is the most common income bracket and makes up 21.0% of all families. Conversely, the $15,000 to $24,999 income bracket is the least frequent group with only 4 families (0.4%) belonging to this category.
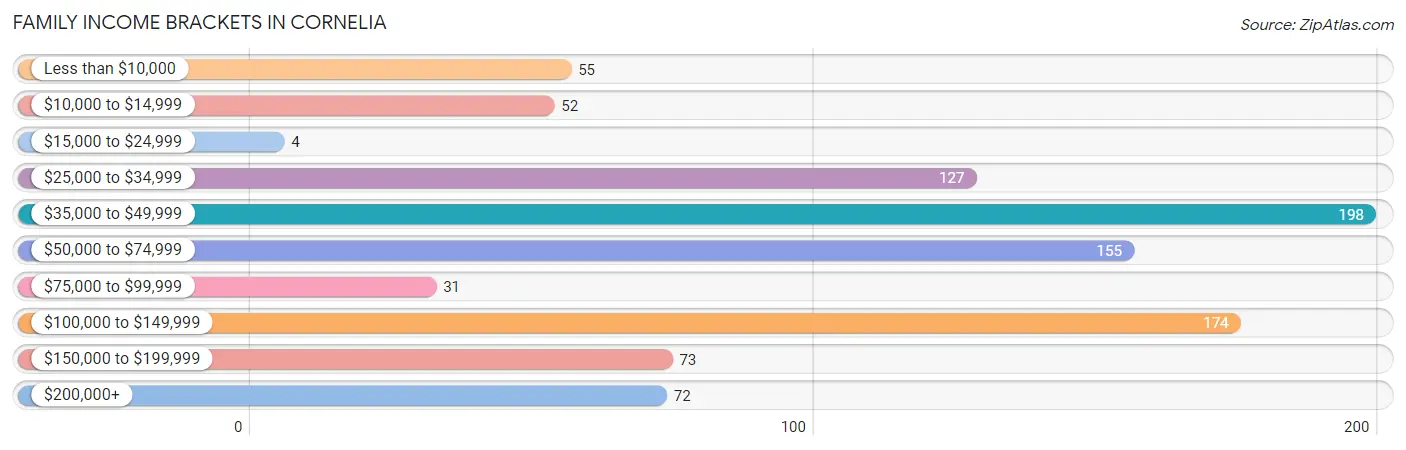
| Income Bracket | # Families | % Families |
| Less than $10,000 | 55 | 5.8% |
| $10,000 to $14,999 | 52 | 5.5% |
| $15,000 to $24,999 | 4 | 0.4% |
| $25,000 to $34,999 | 127 | 13.5% |
| $35,000 to $49,999 | 198 | 21.0% |
| $50,000 to $74,999 | 155 | 16.5% |
| $75,000 to $99,999 | 31 | 3.3% |
| $100,000 to $149,999 | 174 | 18.5% |
| $150,000 to $199,999 | 73 | 7.8% |
| $200,000+ | 72 | 7.7% |
Family Income by Famaliy Size in Cornelia
3-person families (209 | 22.2%) account for the highest median family income in Cornelia with $62,831 per family, while 2-person families (311 | 33.1%) have the highest median income of $20,949 per family member.
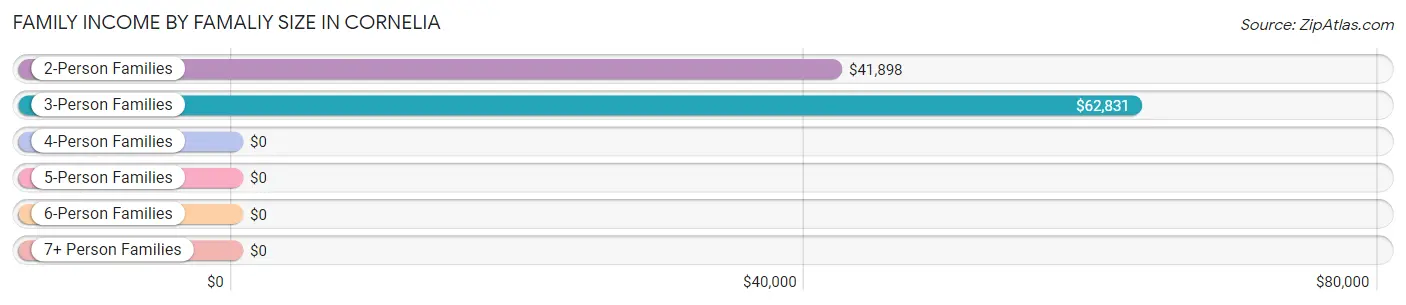
| Income Bracket | # Families | Median Income |
| 2-Person Families | 311 (33.1%) | $41,898 |
| 3-Person Families | 209 (22.2%) | $62,831 |
| 4-Person Families | 222 (23.6%) | $0 |
| 5-Person Families | 120 (12.8%) | $0 |
| 6-Person Families | 73 (7.8%) | $0 |
| 7+ Person Families | 6 (0.6%) | $0 |
| Total | 941 (100.0%) | $62,835 |
Family Income by Number of Earners in Cornelia
The median family income in Cornelia is $62,835, with families comprising 2 earners (361) having the highest median family income of $134,129, while families with no earners (111) have the lowest median family income of $33,693, accounting for 38.4% and 11.8% of families, respectively.
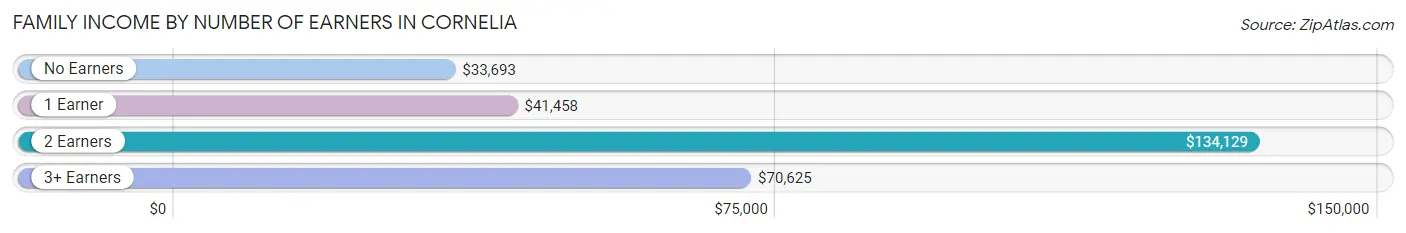
| Number of Earners | # Families | Median Income |
| No Earners | 111 (11.8%) | $33,693 |
| 1 Earner | 215 (22.9%) | $41,458 |
| 2 Earners | 361 (38.4%) | $134,129 |
| 3+ Earners | 254 (27.0%) | $70,625 |
| Total | 941 (100.0%) | $62,835 |
Household Income in Cornelia
Household Income Brackets in Cornelia
With 252 households falling in the category, the $100,000 to $149,999 income range is the most frequent in Cornelia, accounting for 16.4% of all households. In contrast, only 72 households (4.7%) fall into the $15,000 to $24,999 income bracket, making it the least populous group.
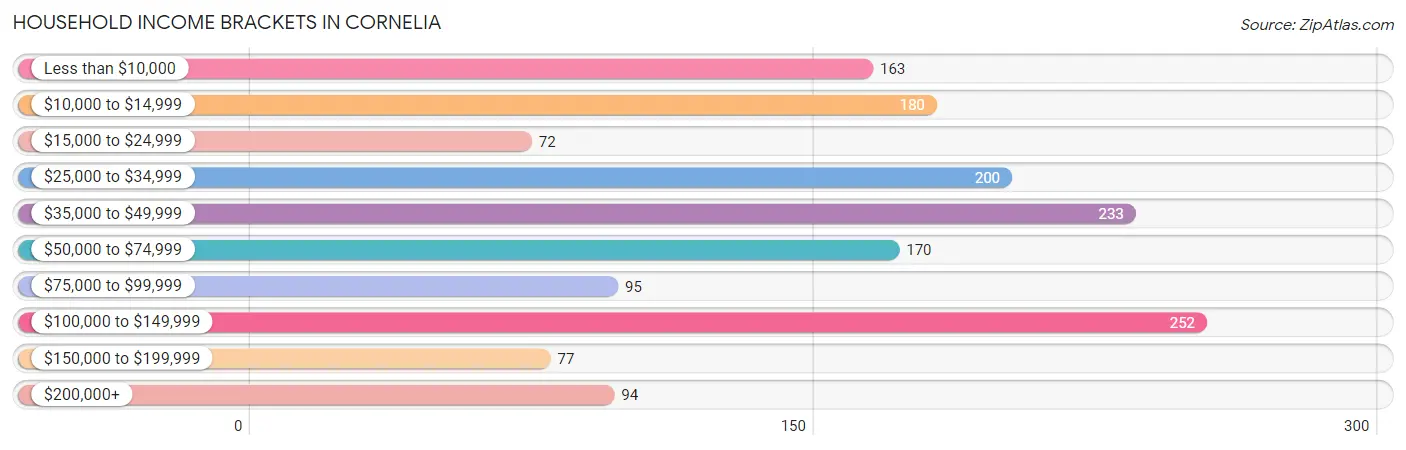
| Income Bracket | # Households | % Households |
| Less than $10,000 | 163 | 10.6% |
| $10,000 to $14,999 | 180 | 11.7% |
| $15,000 to $24,999 | 72 | 4.7% |
| $25,000 to $34,999 | 200 | 13.0% |
| $35,000 to $49,999 | 233 | 15.2% |
| $50,000 to $74,999 | 170 | 11.1% |
| $75,000 to $99,999 | 95 | 6.2% |
| $100,000 to $149,999 | 252 | 16.4% |
| $150,000 to $199,999 | 77 | 5.0% |
| $200,000+ | 94 | 6.1% |
Household Income by Householder Age in Cornelia
The median household income in Cornelia is $46,211, with the highest median household income of $64,875 found in the 25 to 44 years age bracket for the primary householder. A total of 608 households (39.6%) fall into this category. Meanwhile, the 15 to 24 years age bracket for the primary householder has the lowest median household income of $0, with 31 households (2.0%) in this group.
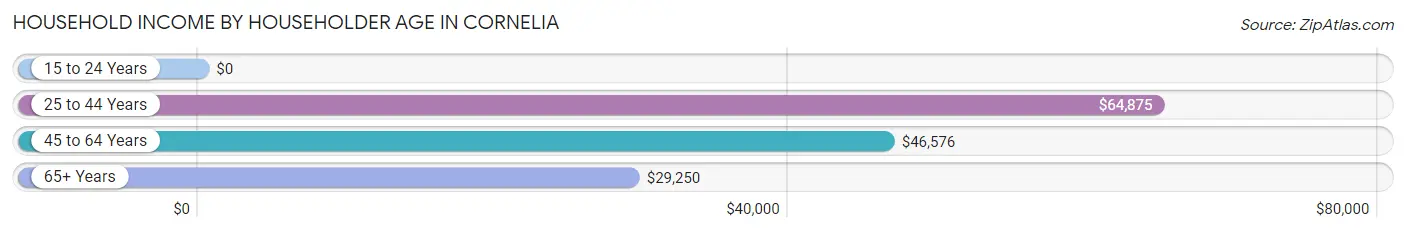
| Income Bracket | # Households | Median Income |
| 15 to 24 Years | 31 (2.0%) | $0 |
| 25 to 44 Years | 608 (39.6%) | $64,875 |
| 45 to 64 Years | 474 (30.9%) | $46,576 |
| 65+ Years | 422 (27.5%) | $29,250 |
| Total | 1,535 (100.0%) | $46,211 |
Poverty in Cornelia
Income Below Poverty by Sex and Age in Cornelia
With 26.1% poverty level for males and 35.3% for females among the residents of Cornelia, 16 and 17 year old males and 16 and 17 year old females are the most vulnerable to poverty, with 179 males (79.2%) and 120 females (80.5%) in their respective age groups living below the poverty level.
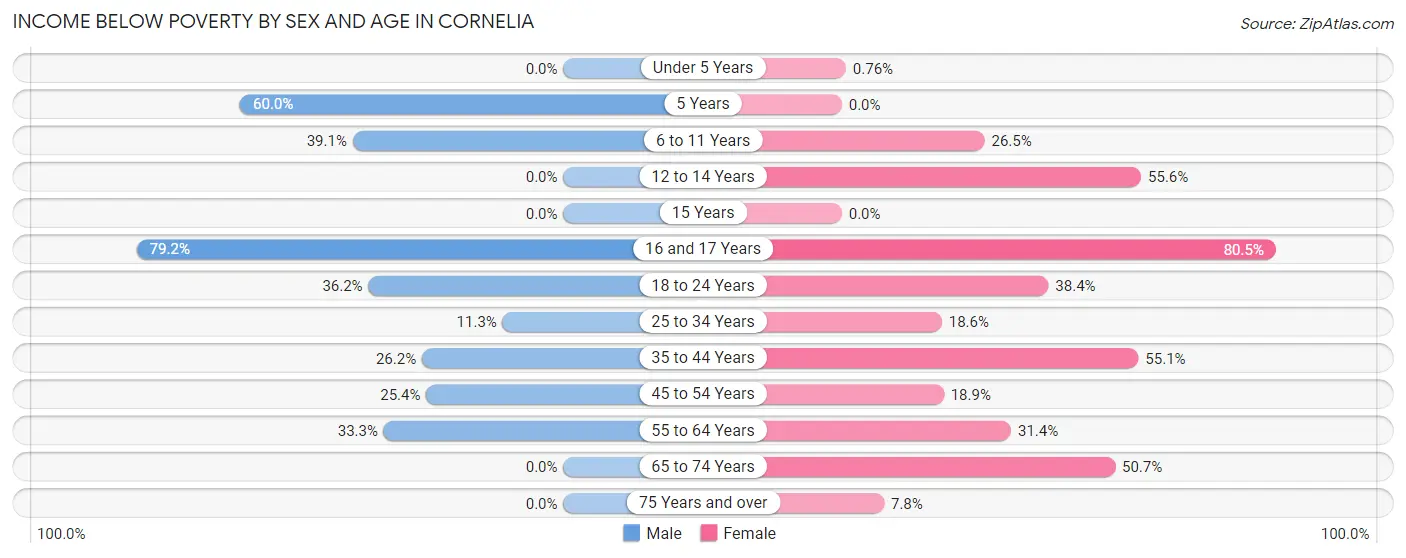
| Age Bracket | Male | Female |
| Under 5 Years | 0 (0.0%) | 1 (0.8%) |
| 5 Years | 21 (60.0%) | 0 (0.0%) |
| 6 to 11 Years | 86 (39.1%) | 40 (26.5%) |
| 12 to 14 Years | 0 (0.0%) | 65 (55.6%) |
| 15 Years | 0 (0.0%) | 0 (0.0%) |
| 16 and 17 Years | 179 (79.2%) | 120 (80.5%) |
| 18 to 24 Years | 89 (36.2%) | 102 (38.4%) |
| 25 to 34 Years | 81 (11.3%) | 62 (18.6%) |
| 35 to 44 Years | 74 (26.2%) | 196 (55.1%) |
| 45 to 54 Years | 43 (25.4%) | 42 (18.9%) |
| 55 to 64 Years | 35 (33.3%) | 71 (31.4%) |
| 65 to 74 Years | 0 (0.0%) | 106 (50.7%) |
| 75 Years and over | 0 (0.0%) | 12 (7.8%) |
| Total | 608 (26.1%) | 817 (35.3%) |
Income Above Poverty by Sex and Age in Cornelia
According to the poverty statistics in Cornelia, males aged under 5 years and females aged under 5 years are the age groups that are most secure financially, with 100.0% of males and 99.2% of females in these age groups living above the poverty line.
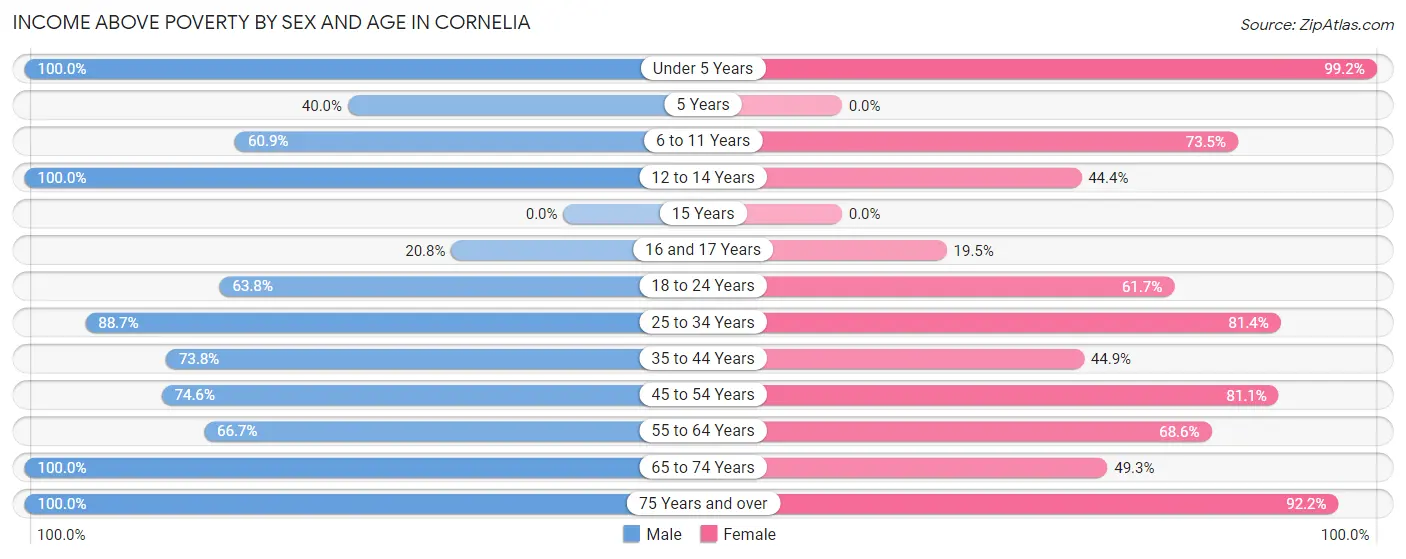
| Age Bracket | Male | Female |
| Under 5 Years | 49 (100.0%) | 131 (99.2%) |
| 5 Years | 14 (40.0%) | 0 (0.0%) |
| 6 to 11 Years | 134 (60.9%) | 111 (73.5%) |
| 12 to 14 Years | 30 (100.0%) | 52 (44.4%) |
| 15 Years | 0 (0.0%) | 0 (0.0%) |
| 16 and 17 Years | 47 (20.8%) | 29 (19.5%) |
| 18 to 24 Years | 157 (63.8%) | 164 (61.7%) |
| 25 to 34 Years | 638 (88.7%) | 272 (81.4%) |
| 35 to 44 Years | 208 (73.8%) | 160 (44.9%) |
| 45 to 54 Years | 126 (74.6%) | 180 (81.1%) |
| 55 to 64 Years | 70 (66.7%) | 155 (68.6%) |
| 65 to 74 Years | 209 (100.0%) | 103 (49.3%) |
| 75 Years and over | 43 (100.0%) | 141 (92.2%) |
| Total | 1,725 (73.9%) | 1,498 (64.7%) |
Income Below Poverty Among Married-Couple Families in Cornelia
The poverty statistics for married-couple families in Cornelia show that 10.8% or 74 of the total 688 families live below the poverty line. Families with 1 or 2 children have the highest poverty rate of 22.8%, comprising of 74 families. On the other hand, families with no children have the lowest poverty rate of 0.0%, which includes 0 families.
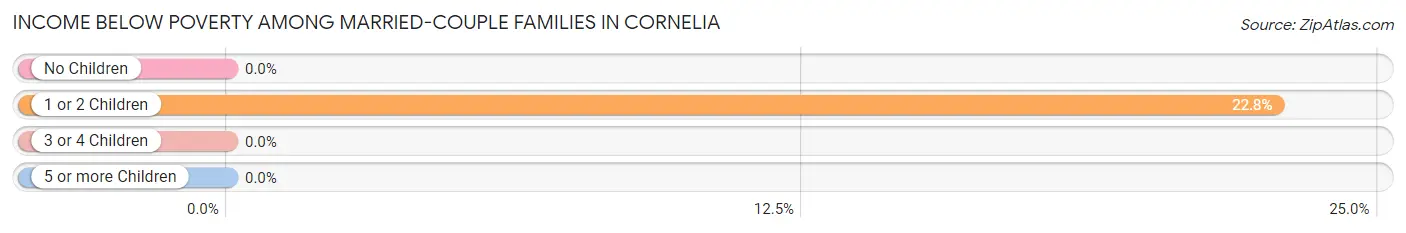
| Children | Above Poverty | Below Poverty |
| No Children | 337 (100.0%) | 0 (0.0%) |
| 1 or 2 Children | 251 (77.2%) | 74 (22.8%) |
| 3 or 4 Children | 26 (100.0%) | 0 (0.0%) |
| 5 or more Children | 0 (0.0%) | 0 (0.0%) |
| Total | 614 (89.2%) | 74 (10.8%) |
Income Below Poverty Among Single-Parent Households in Cornelia
According to the poverty data in Cornelia, 25.9% or 22 single-father households and 51.8% or 87 single-mother households are living below the poverty line. Among single-father households, those with 3 or 4 children have the highest poverty rate, with 22 households (100.0%) experiencing poverty. Likewise, among single-mother households, those with 3 or 4 children have the highest poverty rate, with 16 households (100.0%) falling below the poverty line.
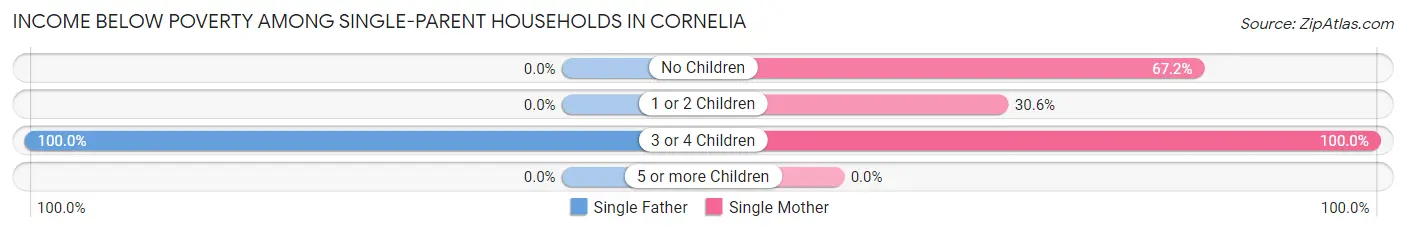
| Children | Single Father | Single Mother |
| No Children | 0 (0.0%) | 45 (67.2%) |
| 1 or 2 Children | 0 (0.0%) | 26 (30.6%) |
| 3 or 4 Children | 22 (100.0%) | 16 (100.0%) |
| 5 or more Children | 0 (0.0%) | 0 (0.0%) |
| Total | 22 (25.9%) | 87 (51.8%) |
Income Below Poverty Among Married-Couple vs Single-Parent Households in Cornelia
The poverty data for Cornelia shows that 74 of the married-couple family households (10.8%) and 109 of the single-parent households (43.1%) are living below the poverty level. Within the married-couple family households, those with 1 or 2 children have the highest poverty rate, with 74 households (22.8%) falling below the poverty line. Among the single-parent households, those with 3 or 4 children have the highest poverty rate, with 38 household (100.0%) living below poverty.
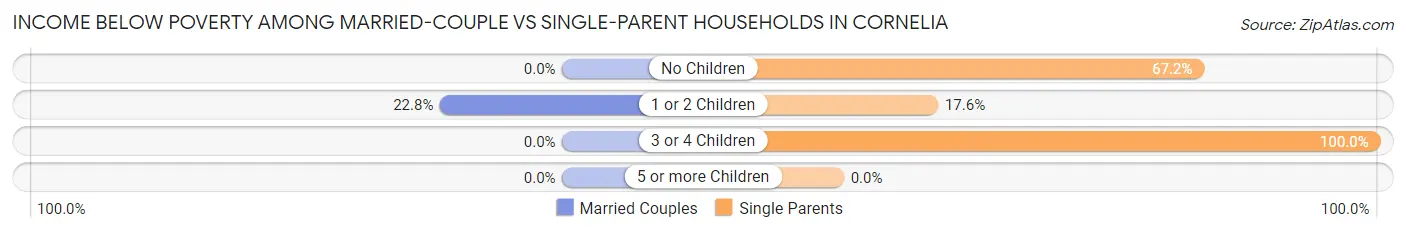
| Children | Married-Couple Families | Single-Parent Households |
| No Children | 0 (0.0%) | 45 (67.2%) |
| 1 or 2 Children | 74 (22.8%) | 26 (17.6%) |
| 3 or 4 Children | 0 (0.0%) | 38 (100.0%) |
| 5 or more Children | 0 (0.0%) | 0 (0.0%) |
| Total | 74 (10.8%) | 109 (43.1%) |
Race in Cornelia
The most populous races in Cornelia are White / Caucasian (2,392 | 51.5%), Hispanic or Latino (1,608 | 34.6%), and Two or more Races (661 | 14.2%).
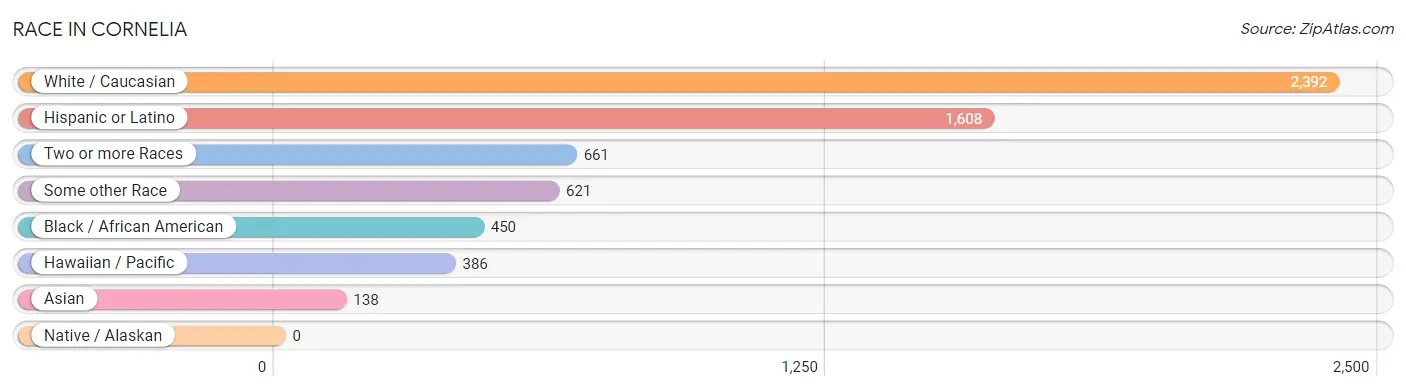
| Race | # Population | % Population |
| Asian | 138 | 3.0% |
| Black / African American | 450 | 9.7% |
| Hawaiian / Pacific | 386 | 8.3% |
| Hispanic or Latino | 1,608 | 34.6% |
| Native / Alaskan | 0 | 0.0% |
| White / Caucasian | 2,392 | 51.5% |
| Two or more Races | 661 | 14.2% |
| Some other Race | 621 | 13.4% |
| Total | 4,648 | 100.0% |
Ancestry in Cornelia
The most populous ancestries reported in Cornelia are Mexican (1,006 | 21.6%), American (705 | 15.2%), Central American (514 | 11.1%), Guatemalan (459 | 9.9%), and Guamanian / Chamorro (386 | 8.3%), together accounting for 66.0% of all Cornelia residents.
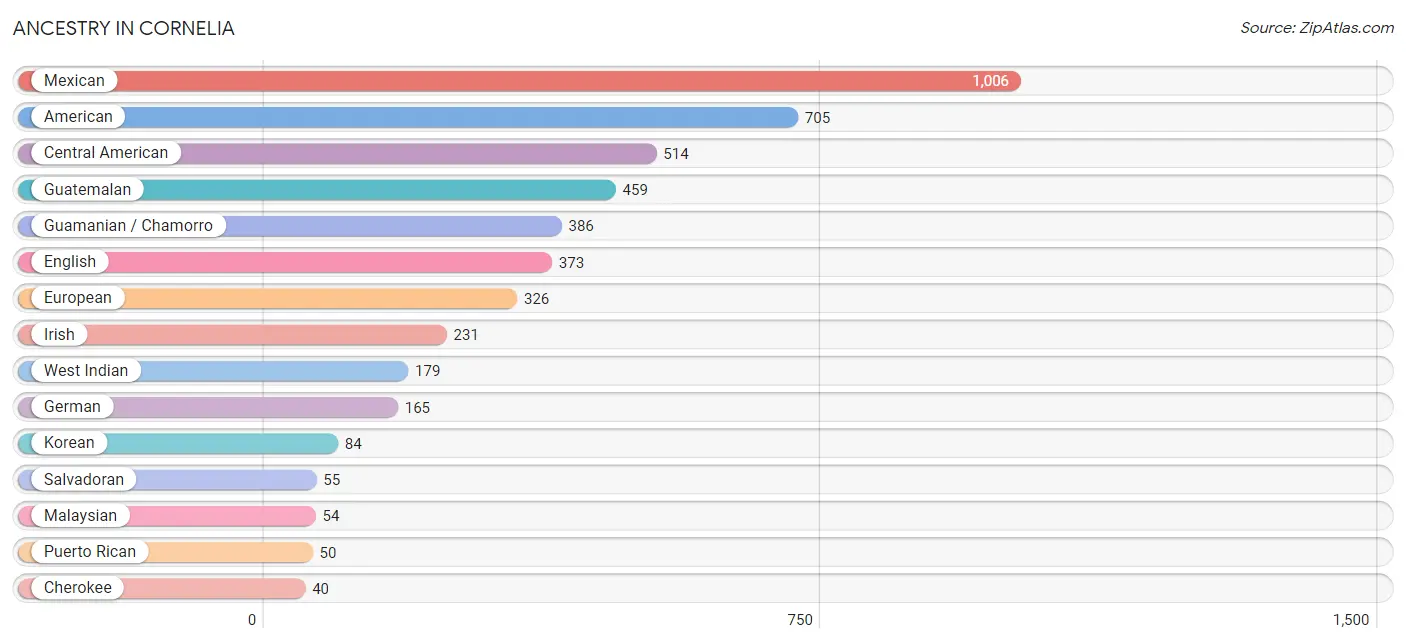
| Ancestry | # Population | % Population |
| American | 705 | 15.2% |
| Central American | 514 | 11.1% |
| Cherokee | 40 | 0.9% |
| Dominican | 37 | 0.8% |
| Dutch | 18 | 0.4% |
| English | 373 | 8.0% |
| European | 326 | 7.0% |
| French | 5 | 0.1% |
| German | 165 | 3.5% |
| Guamanian / Chamorro | 386 | 8.3% |
| Guatemalan | 459 | 9.9% |
| Irish | 231 | 5.0% |
| Korean | 84 | 1.8% |
| Malaysian | 54 | 1.2% |
| Mexican | 1,006 | 21.6% |
| Polish | 9 | 0.2% |
| Puerto Rican | 50 | 1.1% |
| Salvadoran | 55 | 1.2% |
| Scotch-Irish | 10 | 0.2% |
| Sri Lankan | 5 | 0.1% |
| Welsh | 18 | 0.4% |
| West Indian | 179 | 3.8% | View All 22 Rows |
Immigrants in Cornelia
The most numerous immigrant groups reported in Cornelia came from Central America (978 | 21.0%), Latin America (978 | 21.0%), Mexico (470 | 10.1%), Guatemala (449 | 9.7%), and Asia (64 | 1.4%), together accounting for 63.2% of all Cornelia residents.
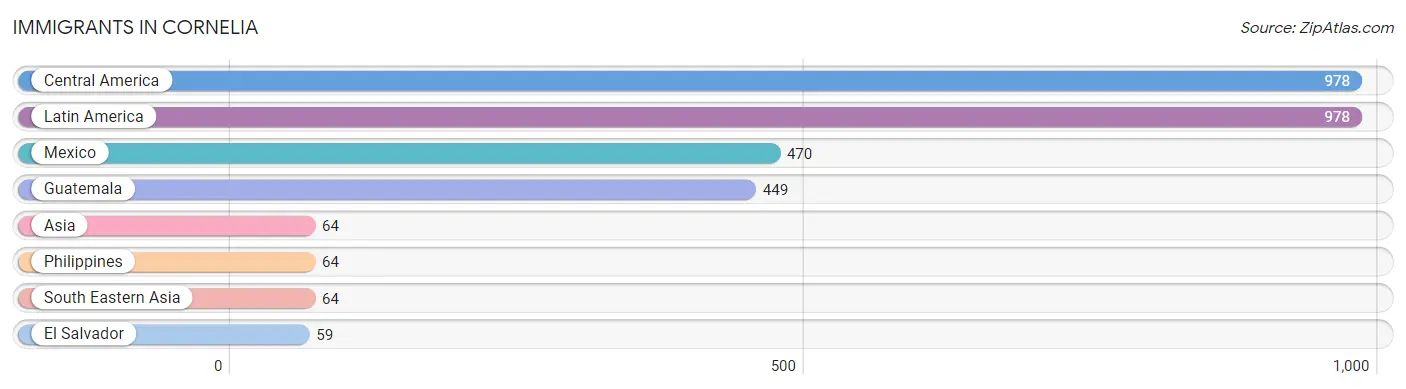
| Immigration Origin | # Population | % Population |
| Asia | 64 | 1.4% |
| Central America | 978 | 21.0% |
| El Salvador | 59 | 1.3% |
| Guatemala | 449 | 9.7% |
| Latin America | 978 | 21.0% |
| Mexico | 470 | 10.1% |
| Philippines | 64 | 1.4% |
| South Eastern Asia | 64 | 1.4% | View All 8 Rows |
Sex and Age in Cornelia
Sex and Age in Cornelia
The most populous age groups in Cornelia are 25 to 29 Years (372 | 16.0%) for men and 40 to 44 Years (246 | 10.6%) for women.
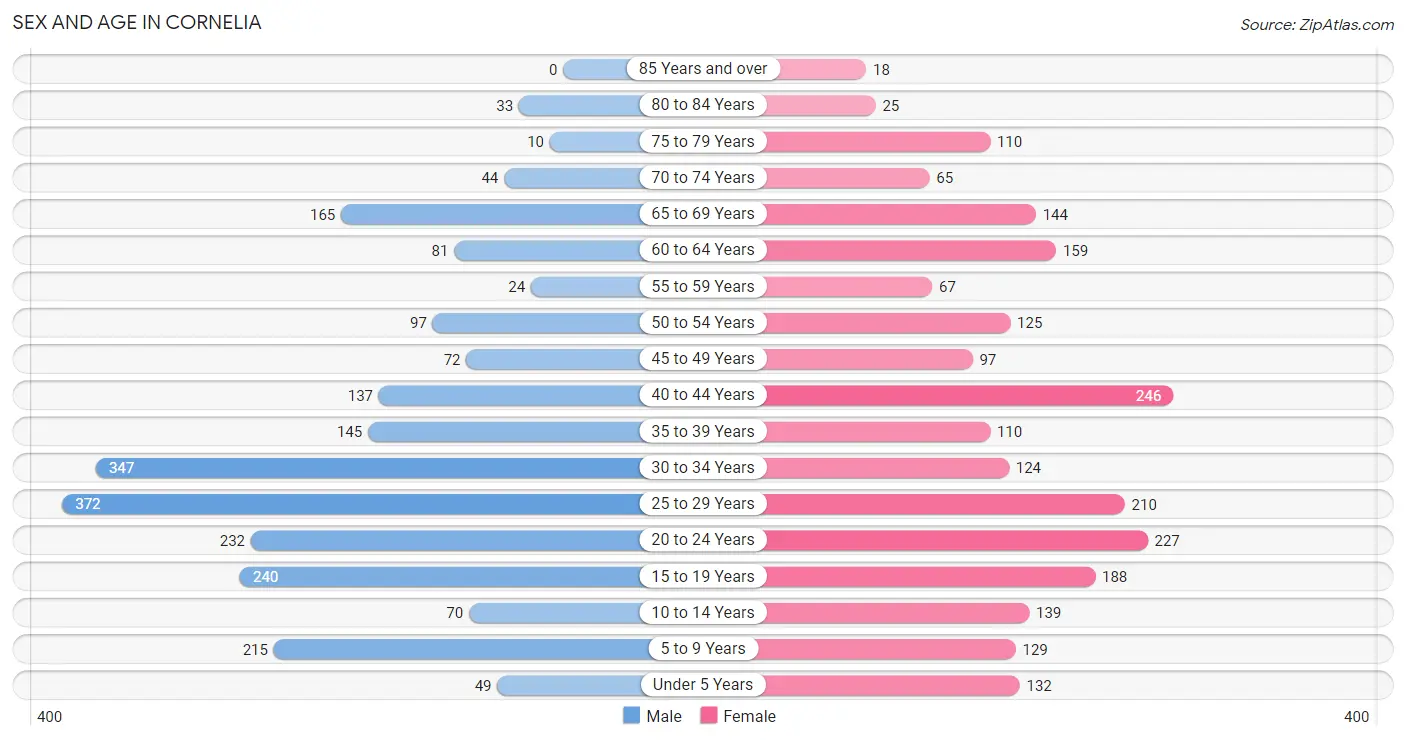
| Age Bracket | Male | Female |
| Under 5 Years | 49 (2.1%) | 132 (5.7%) |
| 5 to 9 Years | 215 (9.2%) | 129 (5.6%) |
| 10 to 14 Years | 70 (3.0%) | 139 (6.0%) |
| 15 to 19 Years | 240 (10.3%) | 188 (8.1%) |
| 20 to 24 Years | 232 (9.9%) | 227 (9.8%) |
| 25 to 29 Years | 372 (16.0%) | 210 (9.1%) |
| 30 to 34 Years | 347 (14.9%) | 124 (5.4%) |
| 35 to 39 Years | 145 (6.2%) | 110 (4.8%) |
| 40 to 44 Years | 137 (5.9%) | 246 (10.6%) |
| 45 to 49 Years | 72 (3.1%) | 97 (4.2%) |
| 50 to 54 Years | 97 (4.2%) | 125 (5.4%) |
| 55 to 59 Years | 24 (1.0%) | 67 (2.9%) |
| 60 to 64 Years | 81 (3.5%) | 159 (6.9%) |
| 65 to 69 Years | 165 (7.1%) | 144 (6.2%) |
| 70 to 74 Years | 44 (1.9%) | 65 (2.8%) |
| 75 to 79 Years | 10 (0.4%) | 110 (4.8%) |
| 80 to 84 Years | 33 (1.4%) | 25 (1.1%) |
| 85 Years and over | 0 (0.0%) | 18 (0.8%) |
| Total | 2,333 (100.0%) | 2,315 (100.0%) |
Families and Households in Cornelia
Median Family Size in Cornelia
The median family size in Cornelia is 3.94 persons per family, with single male/father families (85 | 9.0%) accounting for the largest median family size of 7.82 persons per family. On the other hand, married-couple families (688 | 73.1%) represent the smallest median family size with 3.46 persons per family.
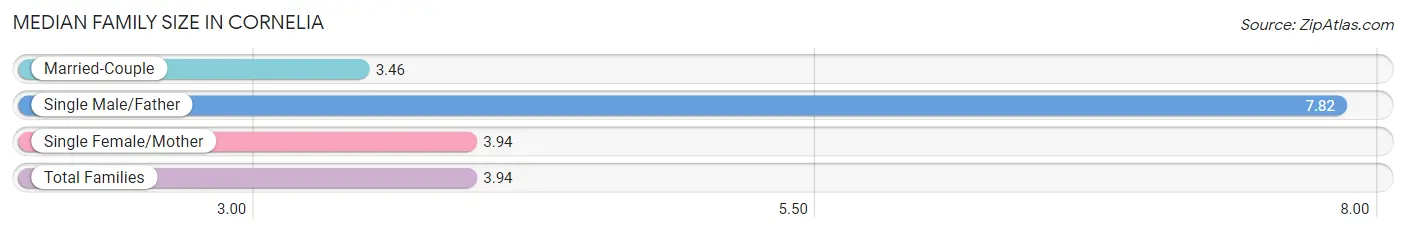
| Family Type | # Families | Family Size |
| Married-Couple | 688 (73.1%) | 3.46 |
| Single Male/Father | 85 (9.0%) | 7.82 |
| Single Female/Mother | 168 (17.8%) | 3.94 |
| Total Families | 941 (100.0%) | 3.94 |
Median Household Size in Cornelia
The median household size in Cornelia is 3.03 persons per household, with single male/father households (85 | 5.5%) accounting for the largest median household size of 8.18 persons per household. non-family households (594 | 38.7%) represent the smallest median household size with 1.14 persons per household.
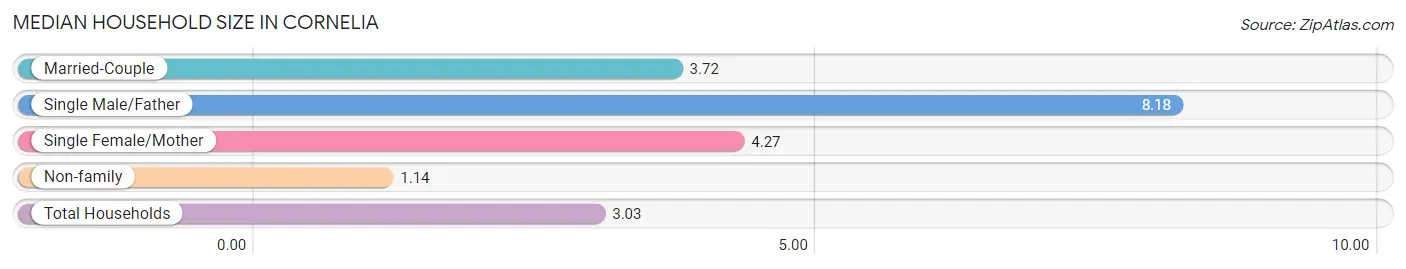
| Household Type | # Households | Household Size |
| Married-Couple | 688 (44.8%) | 3.72 |
| Single Male/Father | 85 (5.5%) | 8.18 |
| Single Female/Mother | 168 (10.9%) | 4.27 |
| Non-family | 594 (38.7%) | 1.14 |
| Total Households | 1,535 (100.0%) | 3.03 |
Household Size by Marriage Status in Cornelia
Out of a total of 1,535 households in Cornelia, 941 (61.3%) are family households, while 594 (38.7%) are nonfamily households. The most numerous type of family households are 2-person households, comprising 299, and the most common type of nonfamily households are 1-person households, comprising 502.
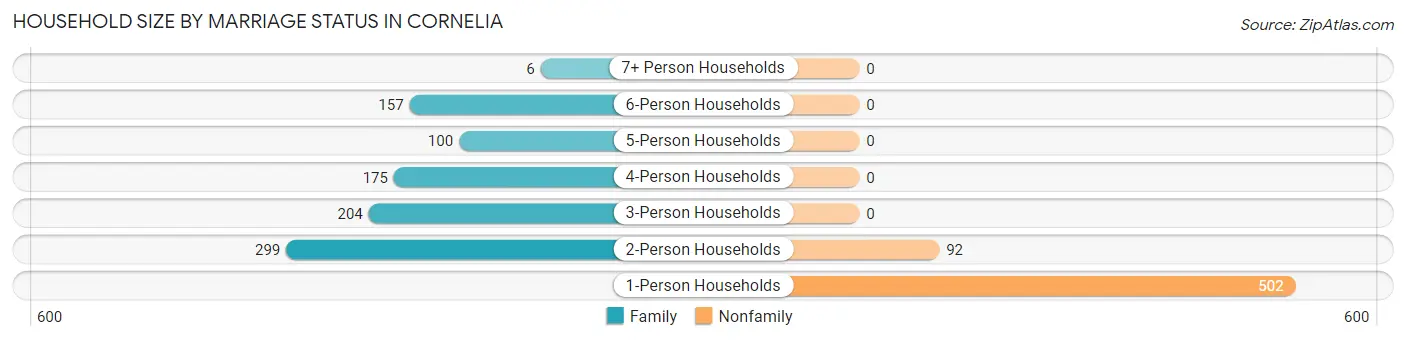
| Household Size | Family Households | Nonfamily Households |
| 1-Person Households | - | 502 (32.7%) |
| 2-Person Households | 299 (19.5%) | 92 (6.0%) |
| 3-Person Households | 204 (13.3%) | 0 (0.0%) |
| 4-Person Households | 175 (11.4%) | 0 (0.0%) |
| 5-Person Households | 100 (6.5%) | 0 (0.0%) |
| 6-Person Households | 157 (10.2%) | 0 (0.0%) |
| 7+ Person Households | 6 (0.4%) | 0 (0.0%) |
| Total | 941 (61.3%) | 594 (38.7%) |
Female Fertility in Cornelia
Fertility by Age in Cornelia
| Age Bracket | Women with Births | Births / 1,000 Women |
| 15 to 19 years | 0 (0.0%) | 0.0 |
| 20 to 34 years | 0 (0.0%) | 0.0 |
| 35 to 50 years | 0 (0.0%) | 0.0 |
| Total | 0 (0.0%) | 0.0 |
Fertility by Age by Marriage Status in Cornelia
| Age Bracket | Married | Unmarried |
| 15 to 19 years | 0 (0.0%) | 0 (0.0%) |
| 20 to 34 years | 0 (0.0%) | 0 (0.0%) |
| 35 to 50 years | 0 (0.0%) | 0 (0.0%) |
| Total | 0 (0.0%) | 0 (0.0%) |
Fertility by Education in Cornelia
| Educational Attainment | Women with Births | Births / 1,000 Women |
| Less than High School | 0 (0.0%) | 0.0 |
| High School Diploma | 0 (0.0%) | 0.0 |
| College or Associate's Degree | 0 (0.0%) | 0.0 |
| Bachelor's Degree | 0 (0.0%) | 0.0 |
| Graduate Degree | 0 (0.0%) | 0.0 |
| Total | 0 (0.0%) | 0.0 |
Fertility by Education by Marriage Status in Cornelia
| Educational Attainment | Married | Unmarried |
| Less than High School | 0 (0.0%) | 0 (0.0%) |
| High School Diploma | 0 (0.0%) | 0 (0.0%) |
| College or Associate's Degree | 0 (0.0%) | 0 (0.0%) |
| Bachelor's Degree | 0 (0.0%) | 0 (0.0%) |
| Graduate Degree | 0 (0.0%) | 0 (0.0%) |
| Total | 0 (0.0%) | 0 (0.0%) |
Employment Characteristics in Cornelia
Employment by Class of Employer in Cornelia
Among the 2,321 employed individuals in Cornelia, private company employees (1,860 | 80.1%), local government employees (255 | 11.0%), and self-employed (incorporated) (84 | 3.6%) make up the most common classes of employment.
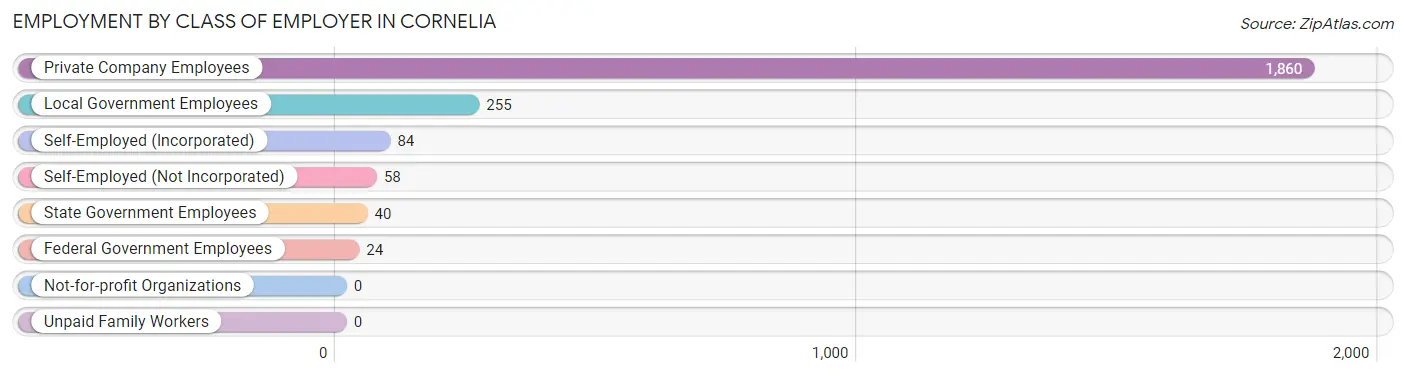
| Employer Class | # Employees | % Employees |
| Private Company Employees | 1,860 | 80.1% |
| Self-Employed (Incorporated) | 84 | 3.6% |
| Self-Employed (Not Incorporated) | 58 | 2.5% |
| Not-for-profit Organizations | 0 | 0.0% |
| Local Government Employees | 255 | 11.0% |
| State Government Employees | 40 | 1.7% |
| Federal Government Employees | 24 | 1.0% |
| Unpaid Family Workers | 0 | 0.0% |
| Total | 2,321 | 100.0% |
Employment Status by Age in Cornelia
According to the labor force statistics for Cornelia, out of the total population over 16 years of age (3,914), 60.4% or 2,364 individuals are in the labor force, with 1.2% or 28 of them unemployed. The age group with the highest labor force participation rate is 25 to 29 years, with 92.1% or 536 individuals in the labor force. Within the labor force, the 45 to 54 years age range has the highest percentage of unemployed individuals, with 9.6% or 29 of them being unemployed.
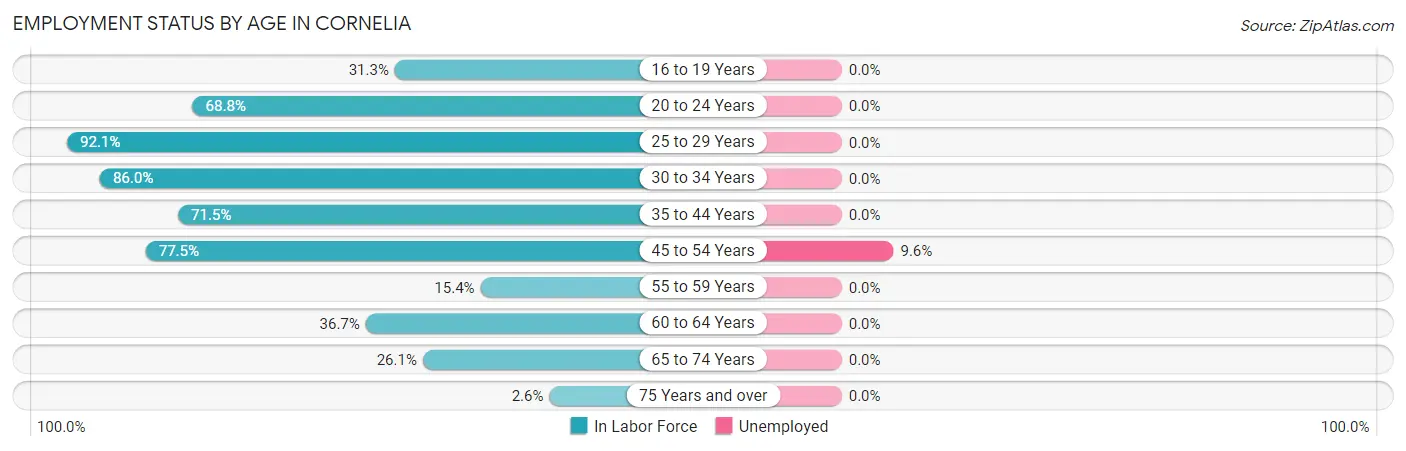
| Age Bracket | In Labor Force | Unemployed |
| 16 to 19 Years | 134 (31.3%) | 0 (0.0%) |
| 20 to 24 Years | 316 (68.8%) | 0 (0.0%) |
| 25 to 29 Years | 536 (92.1%) | 0 (0.0%) |
| 30 to 34 Years | 405 (86.0%) | 0 (0.0%) |
| 35 to 44 Years | 456 (71.5%) | 0 (0.0%) |
| 45 to 54 Years | 303 (77.5%) | 29 (9.6%) |
| 55 to 59 Years | 14 (15.4%) | 0 (0.0%) |
| 60 to 64 Years | 88 (36.7%) | 0 (0.0%) |
| 65 to 74 Years | 109 (26.1%) | 0 (0.0%) |
| 75 Years and over | 5 (2.6%) | 0 (0.0%) |
| Total | 2,364 (60.4%) | 28 (1.2%) |
Employment Status by Educational Attainment in Cornelia
According to labor force statistics for Cornelia, 74.7% of individuals (1,803) out of the total population between 25 and 64 years of age (2,413) are in the labor force, with 1.6% or 29 of them being unemployed. The group with the highest labor force participation rate are those with the educational attainment of bachelor's degree or higher, with 97.4% or 456 individuals in the labor force. Within the labor force, individuals with less than high school education have the highest percentage of unemployment, with 4.8% or 20 of them being unemployed.
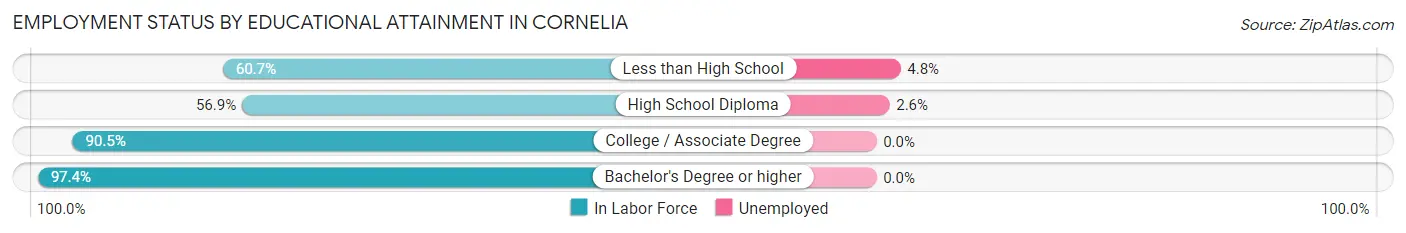
| Educational Attainment | In Labor Force | Unemployed |
| Less than High School | 420 (60.7%) | 33 (4.8%) |
| High School Diploma | 352 (56.9%) | 16 (2.6%) |
| College / Associate Degree | 574 (90.5%) | 0 (0.0%) |
| Bachelor's Degree or higher | 456 (97.4%) | 0 (0.0%) |
| Total | 1,803 (74.7%) | 39 (1.6%) |
Employment Occupations by Sex in Cornelia
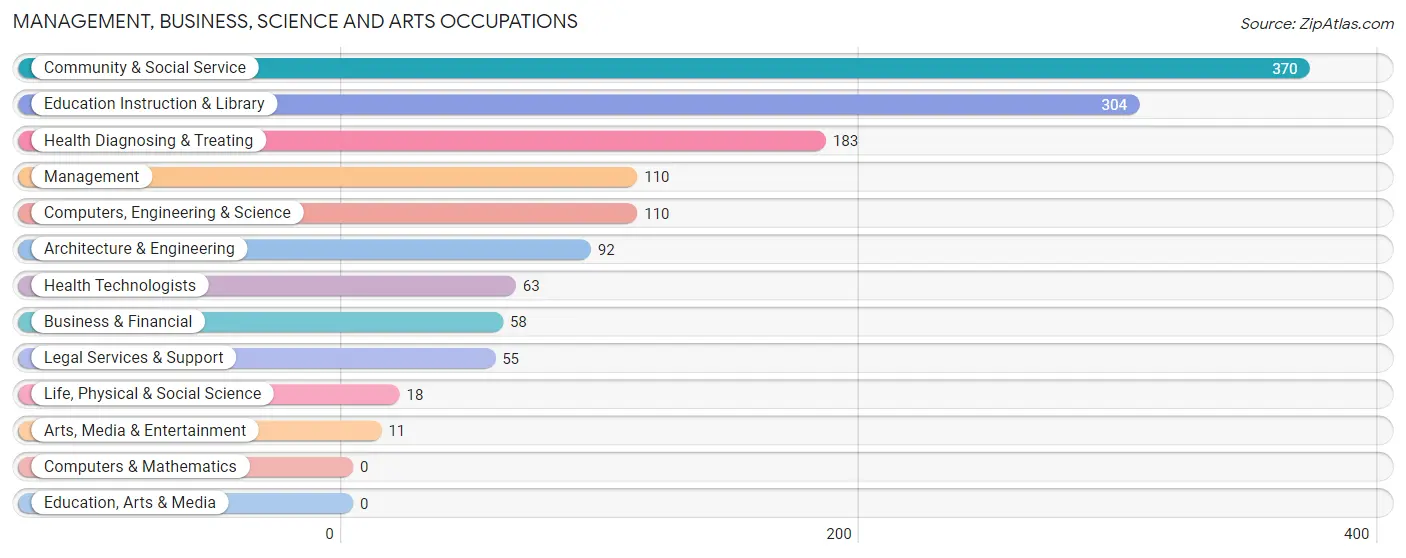
Management, Business, Science and Arts Occupations
The most common Management, Business, Science and Arts occupations in Cornelia are Community & Social Service (370 | 15.8%), Education Instruction & Library (304 | 13.0%), Health Diagnosing & Treating (183 | 7.8%), Management (110 | 4.7%), and Computers, Engineering & Science (110 | 4.7%).
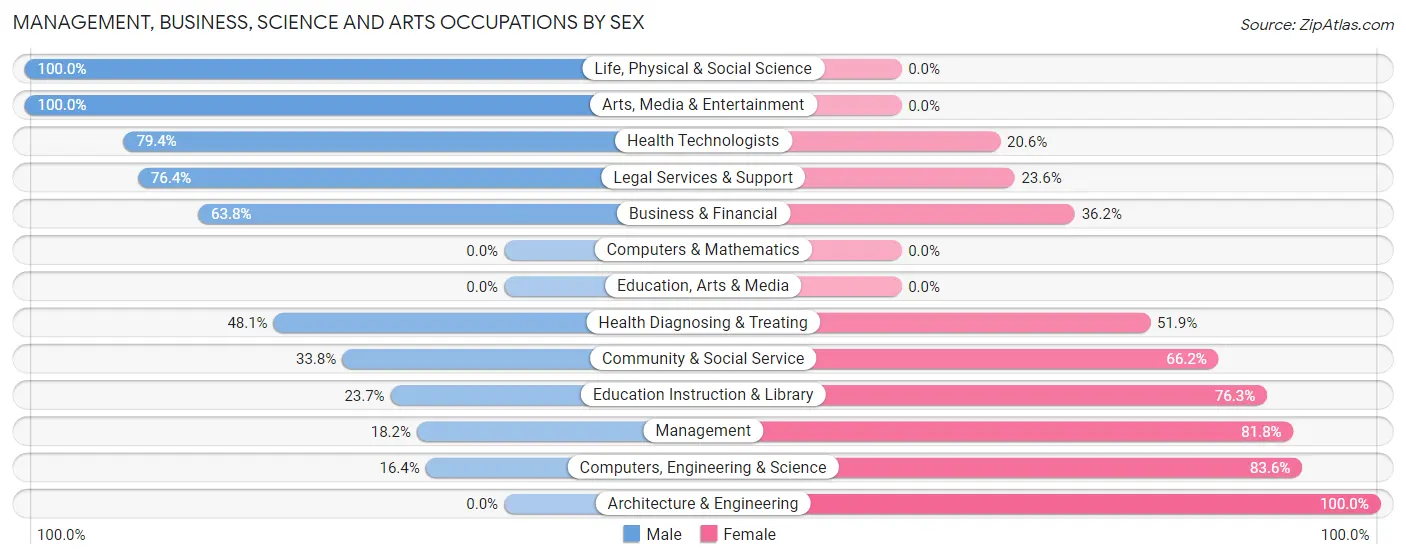
Management, Business, Science and Arts Occupations by Sex
Within the Management, Business, Science and Arts occupations in Cornelia, the most male-oriented occupations are Life, Physical & Social Science (100.0%), Arts, Media & Entertainment (100.0%), and Health Technologists (79.4%), while the most female-oriented occupations are Architecture & Engineering (100.0%), Computers, Engineering & Science (83.6%), and Management (81.8%).
| Occupation | Male | Female |
| Management | 20 (18.2%) | 90 (81.8%) |
| Business & Financial | 37 (63.8%) | 21 (36.2%) |
| Computers, Engineering & Science | 18 (16.4%) | 92 (83.6%) |
| Computers & Mathematics | 0 (0.0%) | 0 (0.0%) |
| Architecture & Engineering | 0 (0.0%) | 92 (100.0%) |
| Life, Physical & Social Science | 18 (100.0%) | 0 (0.0%) |
| Community & Social Service | 125 (33.8%) | 245 (66.2%) |
| Education, Arts & Media | 0 (0.0%) | 0 (0.0%) |
| Legal Services & Support | 42 (76.4%) | 13 (23.6%) |
| Education Instruction & Library | 72 (23.7%) | 232 (76.3%) |
| Arts, Media & Entertainment | 11 (100.0%) | 0 (0.0%) |
| Health Diagnosing & Treating | 88 (48.1%) | 95 (51.9%) |
| Health Technologists | 50 (79.4%) | 13 (20.6%) |
| Total (Category) | 288 (34.7%) | 543 (65.3%) |
| Total (Overall) | 1,347 (57.6%) | 990 (42.4%) |
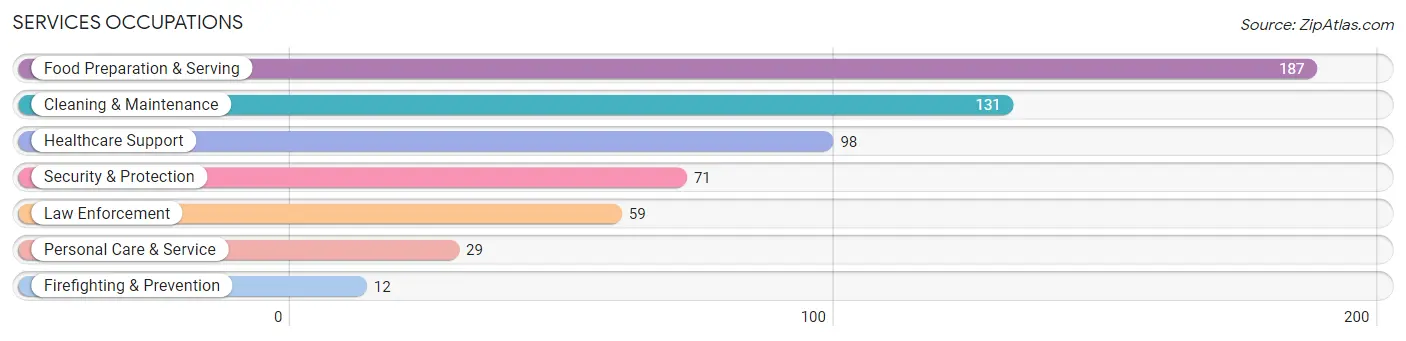
Services Occupations
The most common Services occupations in Cornelia are Food Preparation & Serving (187 | 8.0%), Cleaning & Maintenance (131 | 5.6%), Healthcare Support (98 | 4.2%), Security & Protection (71 | 3.0%), and Law Enforcement (59 | 2.5%).
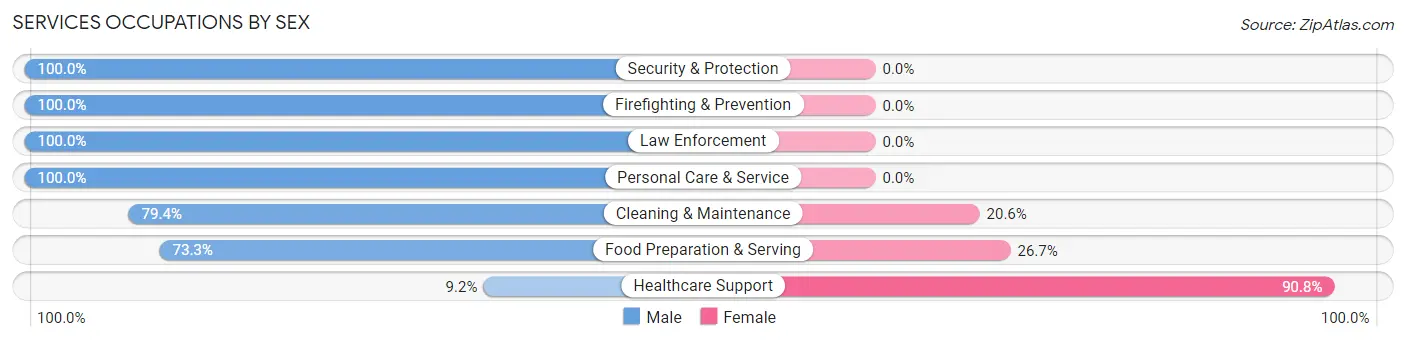
Services Occupations by Sex
Within the Services occupations in Cornelia, the most male-oriented occupations are Security & Protection (100.0%), Firefighting & Prevention (100.0%), and Law Enforcement (100.0%), while the most female-oriented occupations are Healthcare Support (90.8%), Food Preparation & Serving (26.7%), and Cleaning & Maintenance (20.6%).
| Occupation | Male | Female |
| Healthcare Support | 9 (9.2%) | 89 (90.8%) |
| Security & Protection | 71 (100.0%) | 0 (0.0%) |
| Firefighting & Prevention | 12 (100.0%) | 0 (0.0%) |
| Law Enforcement | 59 (100.0%) | 0 (0.0%) |
| Food Preparation & Serving | 137 (73.3%) | 50 (26.7%) |
| Cleaning & Maintenance | 104 (79.4%) | 27 (20.6%) |
| Personal Care & Service | 29 (100.0%) | 0 (0.0%) |
| Total (Category) | 350 (67.8%) | 166 (32.2%) |
| Total (Overall) | 1,347 (57.6%) | 990 (42.4%) |
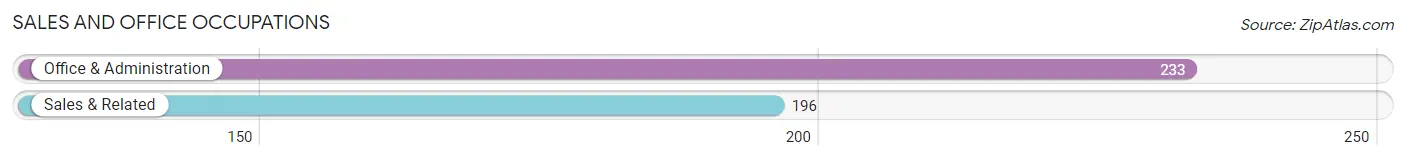
Sales and Office Occupations
The most common Sales and Office occupations in Cornelia are Office & Administration (233 | 10.0%), and Sales & Related (196 | 8.4%).
Sales and Office Occupations by Sex
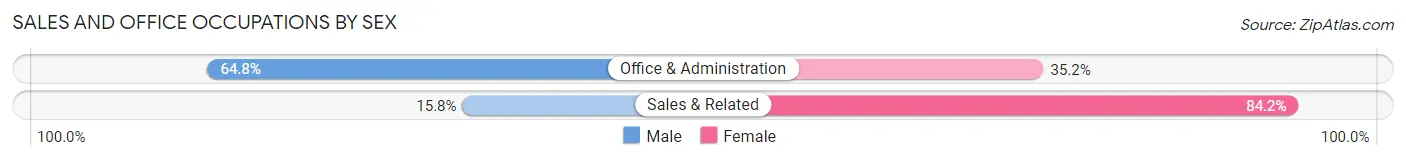
| Occupation | Male | Female |
| Sales & Related | 31 (15.8%) | 165 (84.2%) |
| Office & Administration | 151 (64.8%) | 82 (35.2%) |
| Total (Category) | 182 (42.4%) | 247 (57.6%) |
| Total (Overall) | 1,347 (57.6%) | 990 (42.4%) |
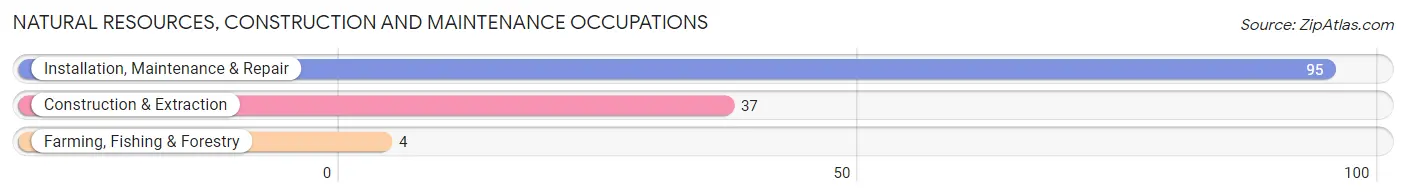
Natural Resources, Construction and Maintenance Occupations
The most common Natural Resources, Construction and Maintenance occupations in Cornelia are Installation, Maintenance & Repair (95 | 4.1%), Construction & Extraction (37 | 1.6%), and Farming, Fishing & Forestry (4 | 0.2%).
Natural Resources, Construction and Maintenance Occupations by Sex
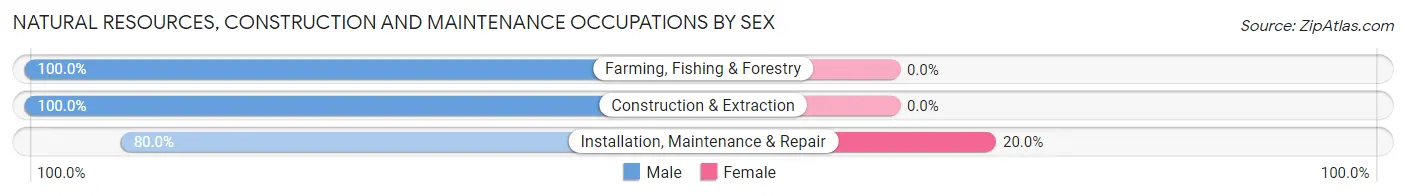
| Occupation | Male | Female |
| Farming, Fishing & Forestry | 4 (100.0%) | 0 (0.0%) |
| Construction & Extraction | 37 (100.0%) | 0 (0.0%) |
| Installation, Maintenance & Repair | 76 (80.0%) | 19 (20.0%) |
| Total (Category) | 117 (86.0%) | 19 (14.0%) |
| Total (Overall) | 1,347 (57.6%) | 990 (42.4%) |
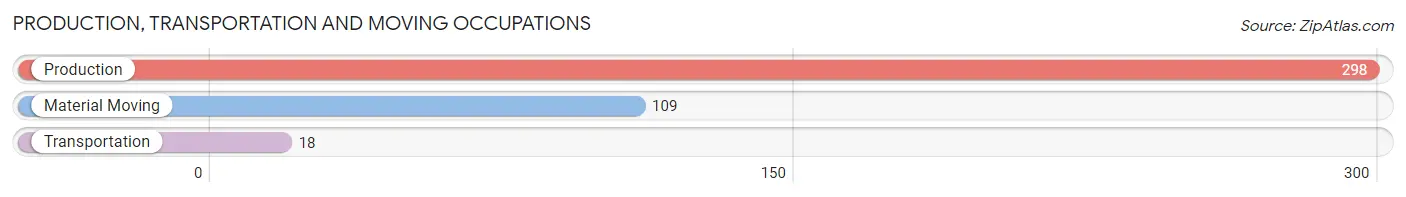
Production, Transportation and Moving Occupations
The most common Production, Transportation and Moving occupations in Cornelia are Production (298 | 12.8%), Material Moving (109 | 4.7%), and Transportation (18 | 0.8%).
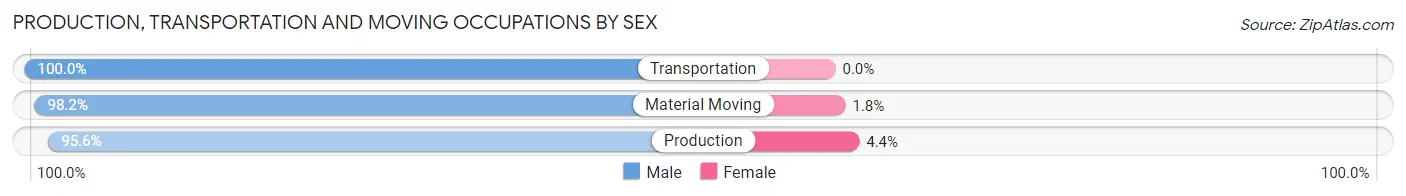
Production, Transportation and Moving Occupations by Sex
| Occupation | Male | Female |
| Production | 285 (95.6%) | 13 (4.4%) |
| Transportation | 18 (100.0%) | 0 (0.0%) |
| Material Moving | 107 (98.2%) | 2 (1.8%) |
| Total (Category) | 410 (96.5%) | 15 (3.5%) |
| Total (Overall) | 1,347 (57.6%) | 990 (42.4%) |
Employment Industries by Sex in Cornelia
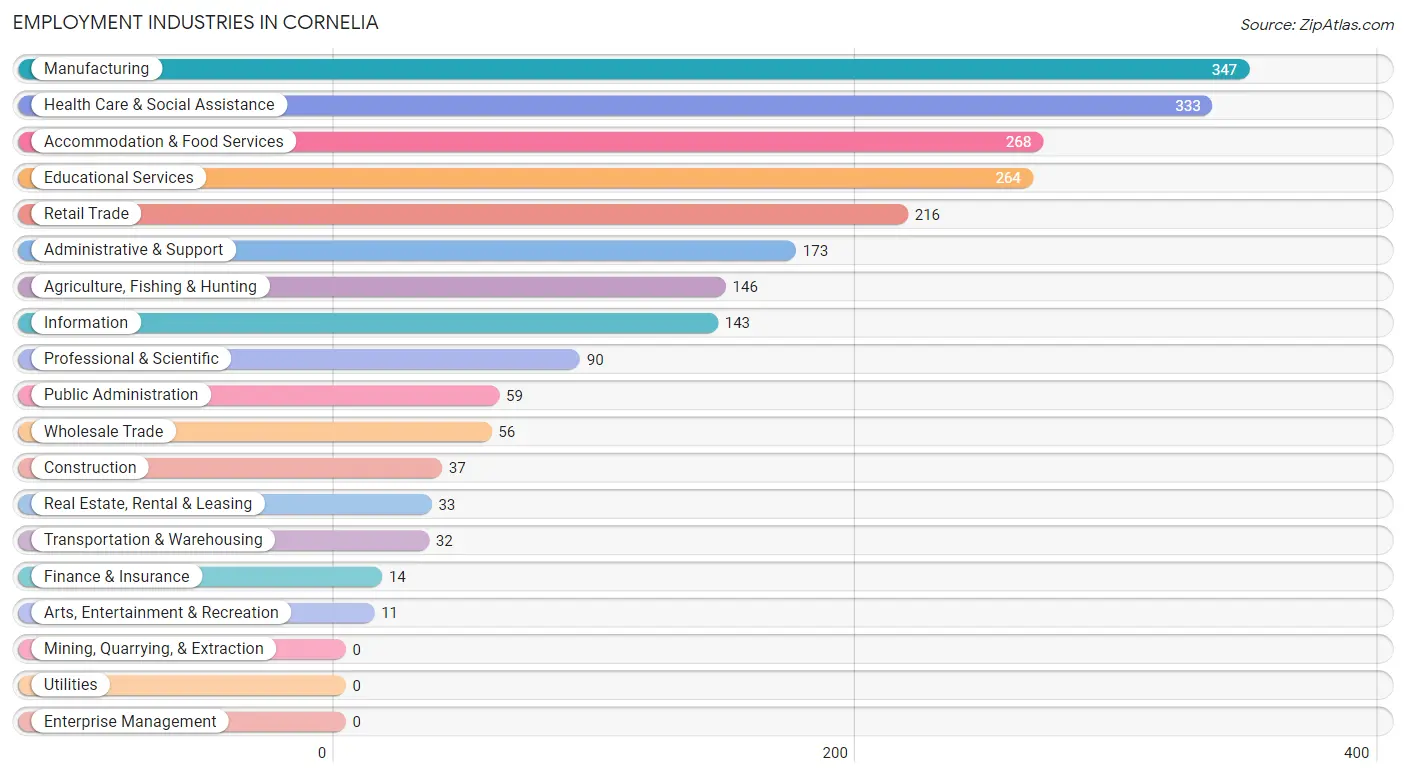
Employment Industries in Cornelia
The major employment industries in Cornelia include Manufacturing (347 | 14.8%), Health Care & Social Assistance (333 | 14.2%), Accommodation & Food Services (268 | 11.5%), Educational Services (264 | 11.3%), and Retail Trade (216 | 9.2%).
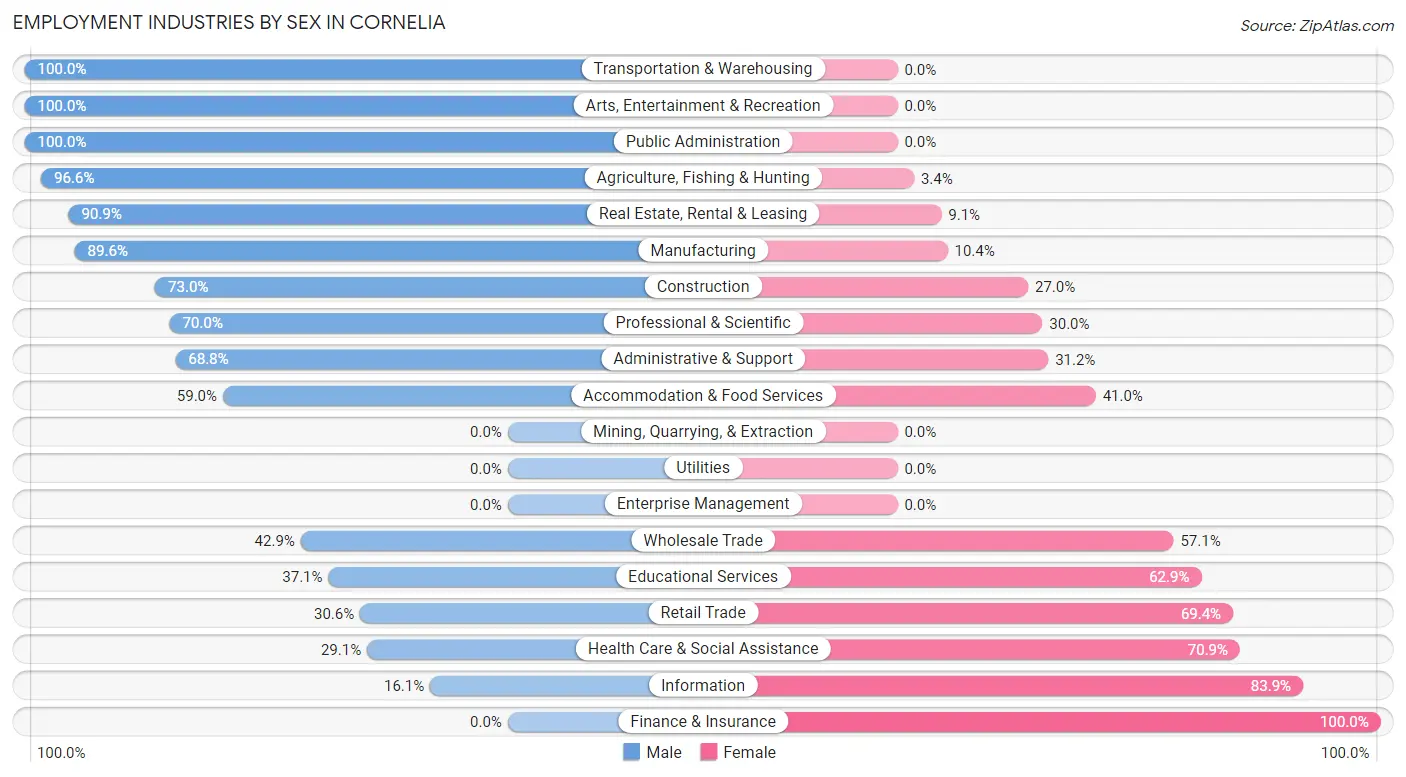
Employment Industries by Sex in Cornelia
The Cornelia industries that see more men than women are Transportation & Warehousing (100.0%), Arts, Entertainment & Recreation (100.0%), and Public Administration (100.0%), whereas the industries that tend to have a higher number of women are Finance & Insurance (100.0%), Information (83.9%), and Health Care & Social Assistance (70.9%).
| Industry | Male | Female |
| Agriculture, Fishing & Hunting | 141 (96.6%) | 5 (3.4%) |
| Mining, Quarrying, & Extraction | 0 (0.0%) | 0 (0.0%) |
| Construction | 27 (73.0%) | 10 (27.0%) |
| Manufacturing | 311 (89.6%) | 36 (10.4%) |
| Wholesale Trade | 24 (42.9%) | 32 (57.1%) |
| Retail Trade | 66 (30.6%) | 150 (69.4%) |
| Transportation & Warehousing | 32 (100.0%) | 0 (0.0%) |
| Utilities | 0 (0.0%) | 0 (0.0%) |
| Information | 23 (16.1%) | 120 (83.9%) |
| Finance & Insurance | 0 (0.0%) | 14 (100.0%) |
| Real Estate, Rental & Leasing | 30 (90.9%) | 3 (9.1%) |
| Professional & Scientific | 63 (70.0%) | 27 (30.0%) |
| Enterprise Management | 0 (0.0%) | 0 (0.0%) |
| Administrative & Support | 119 (68.8%) | 54 (31.2%) |
| Educational Services | 98 (37.1%) | 166 (62.9%) |
| Health Care & Social Assistance | 97 (29.1%) | 236 (70.9%) |
| Arts, Entertainment & Recreation | 11 (100.0%) | 0 (0.0%) |
| Accommodation & Food Services | 158 (59.0%) | 110 (41.0%) |
| Public Administration | 59 (100.0%) | 0 (0.0%) |
| Total | 1,347 (57.6%) | 990 (42.4%) |
Education in Cornelia
School Enrollment in Cornelia
The most common levels of schooling among the 1,276 students in Cornelia are high school (379 | 29.7%), college / undergraduate (290 | 22.7%), and elementary school (278 | 21.8%).
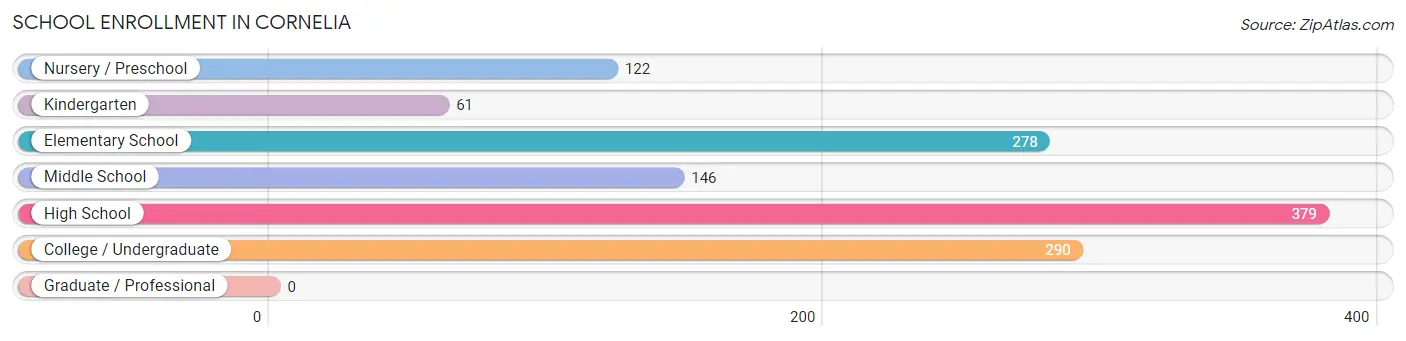
| School Level | # Students | % Students |
| Nursery / Preschool | 122 | 9.6% |
| Kindergarten | 61 | 4.8% |
| Elementary School | 278 | 21.8% |
| Middle School | 146 | 11.4% |
| High School | 379 | 29.7% |
| College / Undergraduate | 290 | 22.7% |
| Graduate / Professional | 0 | 0.0% |
| Total | 1,276 | 100.0% |
School Enrollment by Age by Funding Source in Cornelia
Out of a total of 1,276 students who are enrolled in schools in Cornelia, 145 (11.4%) attend a private institution, while the remaining 1,131 (88.6%) are enrolled in public schools. The age group of 5 to 9 year old has the highest likelihood of being enrolled in private schools, with 86 (25.0% in the age bracket) enrolled. Conversely, the age group of 18 to 19 year olds has the lowest likelihood of being enrolled in a private school, with 53 (100.0% in the age bracket) attending a public institution.
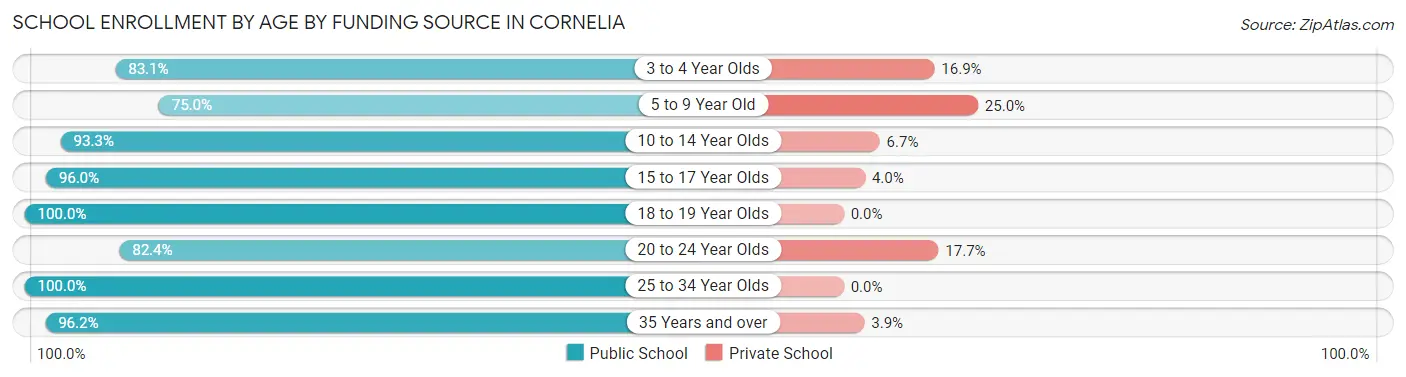
| Age Bracket | Public School | Private School |
| 3 to 4 Year Olds | 59 (83.1%) | 12 (16.9%) |
| 5 to 9 Year Old | 258 (75.0%) | 86 (25.0%) |
| 10 to 14 Year Olds | 195 (93.3%) | 14 (6.7%) |
| 15 to 17 Year Olds | 339 (96.0%) | 14 (4.0%) |
| 18 to 19 Year Olds | 53 (100.0%) | 0 (0.0%) |
| 20 to 24 Year Olds | 84 (82.4%) | 18 (17.6%) |
| 25 to 34 Year Olds | 92 (100.0%) | 0 (0.0%) |
| 35 Years and over | 50 (96.2%) | 2 (3.8%) |
| Total | 1,131 (88.6%) | 145 (11.4%) |
Educational Attainment by Field of Study in Cornelia
Science & technology (139 | 20.1%), social sciences (136 | 19.7%), business (86 | 12.5%), visual & performing arts (52 | 7.5%), and liberal arts & history (44 | 6.4%) are the most common fields of study among 690 individuals in Cornelia who have obtained a bachelor's degree or higher.
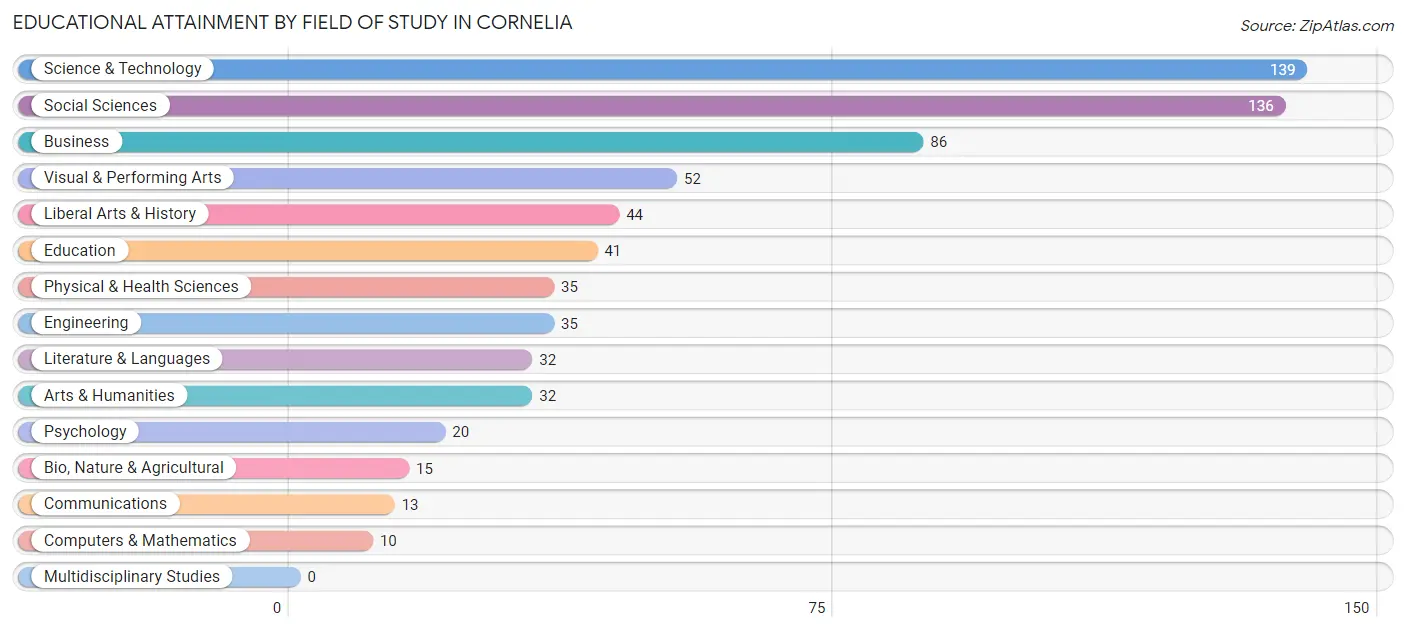
| Field of Study | # Graduates | % Graduates |
| Computers & Mathematics | 10 | 1.5% |
| Bio, Nature & Agricultural | 15 | 2.2% |
| Physical & Health Sciences | 35 | 5.1% |
| Psychology | 20 | 2.9% |
| Social Sciences | 136 | 19.7% |
| Engineering | 35 | 5.1% |
| Multidisciplinary Studies | 0 | 0.0% |
| Science & Technology | 139 | 20.1% |
| Business | 86 | 12.5% |
| Education | 41 | 5.9% |
| Literature & Languages | 32 | 4.6% |
| Liberal Arts & History | 44 | 6.4% |
| Visual & Performing Arts | 52 | 7.5% |
| Communications | 13 | 1.9% |
| Arts & Humanities | 32 | 4.6% |
| Total | 690 | 100.0% |
Transportation & Commute in Cornelia
Vehicle Availability by Sex in Cornelia
The most prevalent vehicle ownership categories in Cornelia are males with 2 vehicles (352, accounting for 26.2%) and females with 2 vehicles (408, making up 36.1%).
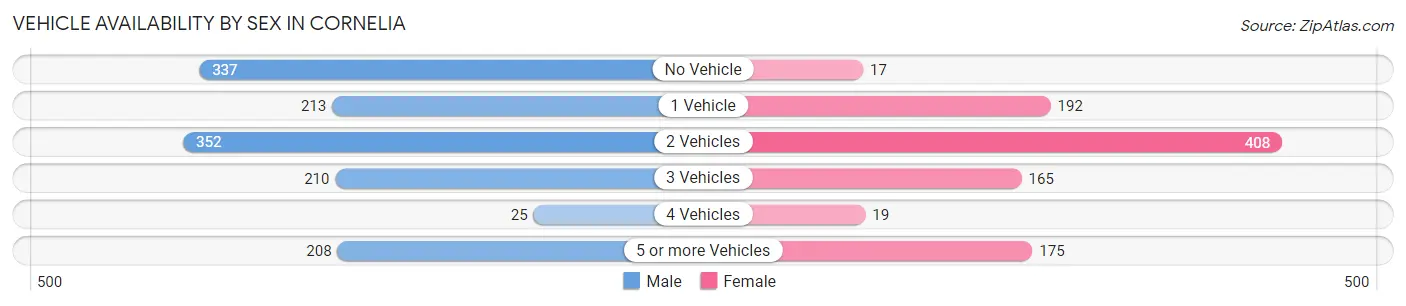
| Vehicles Available | Male | Female |
| No Vehicle | 337 (25.1%) | 17 (1.7%) |
| 1 Vehicle | 213 (15.8%) | 192 (19.7%) |
| 2 Vehicles | 352 (26.2%) | 408 (41.8%) |
| 3 Vehicles | 210 (15.6%) | 165 (16.9%) |
| 4 Vehicles | 25 (1.9%) | 19 (1.9%) |
| 5 or more Vehicles | 208 (15.5%) | 175 (17.9%) |
| Total | 1,345 (100.0%) | 976 (100.0%) |
Commute Time in Cornelia
The most frequently occuring commute durations in Cornelia are 30 to 34 minutes (321 commuters, 14.4%), 5 to 9 minutes (319 commuters, 14.3%), and 10 to 14 minutes (315 commuters, 14.1%).
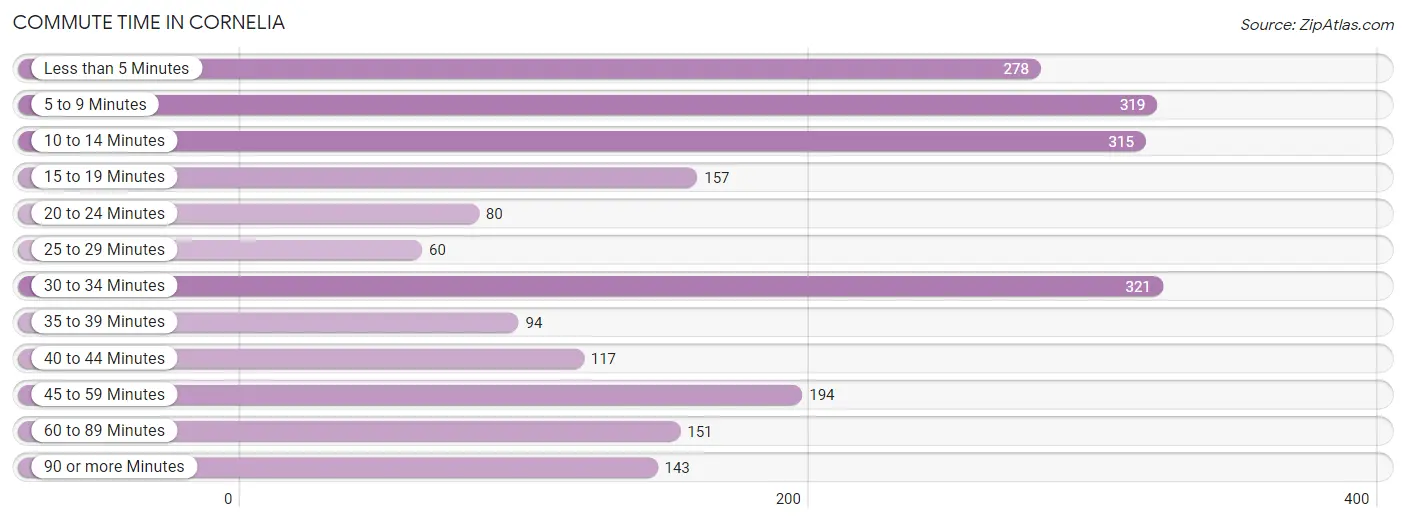
| Commute Time | # Commuters | % Commuters |
| Less than 5 Minutes | 278 | 12.5% |
| 5 to 9 Minutes | 319 | 14.3% |
| 10 to 14 Minutes | 315 | 14.1% |
| 15 to 19 Minutes | 157 | 7.0% |
| 20 to 24 Minutes | 80 | 3.6% |
| 25 to 29 Minutes | 60 | 2.7% |
| 30 to 34 Minutes | 321 | 14.4% |
| 35 to 39 Minutes | 94 | 4.2% |
| 40 to 44 Minutes | 117 | 5.2% |
| 45 to 59 Minutes | 194 | 8.7% |
| 60 to 89 Minutes | 151 | 6.8% |
| 90 or more Minutes | 143 | 6.4% |
Commute Time by Sex in Cornelia
The most common commute times in Cornelia are 30 to 34 minutes (305 commuters, 23.1%) for males and less than 5 minutes (191 commuters, 21.1%) for females.
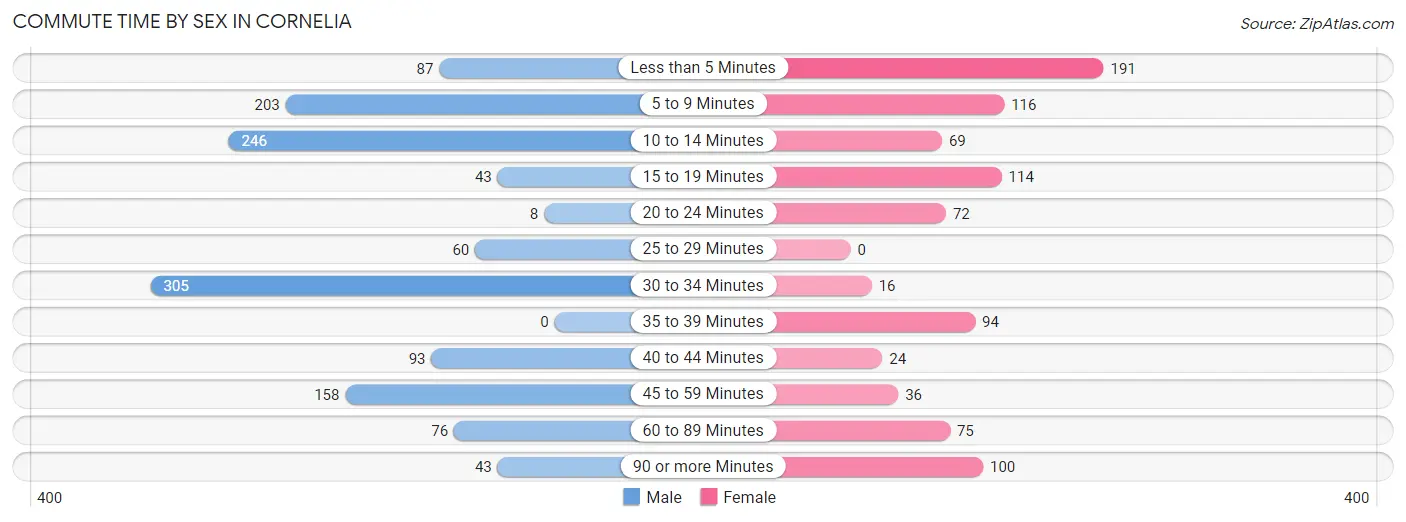
| Commute Time | Male | Female |
| Less than 5 Minutes | 87 (6.6%) | 191 (21.1%) |
| 5 to 9 Minutes | 203 (15.4%) | 116 (12.8%) |
| 10 to 14 Minutes | 246 (18.6%) | 69 (7.6%) |
| 15 to 19 Minutes | 43 (3.3%) | 114 (12.6%) |
| 20 to 24 Minutes | 8 (0.6%) | 72 (7.9%) |
| 25 to 29 Minutes | 60 (4.5%) | 0 (0.0%) |
| 30 to 34 Minutes | 305 (23.1%) | 16 (1.8%) |
| 35 to 39 Minutes | 0 (0.0%) | 94 (10.4%) |
| 40 to 44 Minutes | 93 (7.0%) | 24 (2.6%) |
| 45 to 59 Minutes | 158 (11.9%) | 36 (4.0%) |
| 60 to 89 Minutes | 76 (5.8%) | 75 (8.3%) |
| 90 or more Minutes | 43 (3.3%) | 100 (11.0%) |
Time of Departure to Work by Sex in Cornelia
The most frequent times of departure to work in Cornelia are 6:00 AM to 6:29 AM (316, 23.9%) for males and 5:30 AM to 5:59 AM (203, 22.4%) for females.
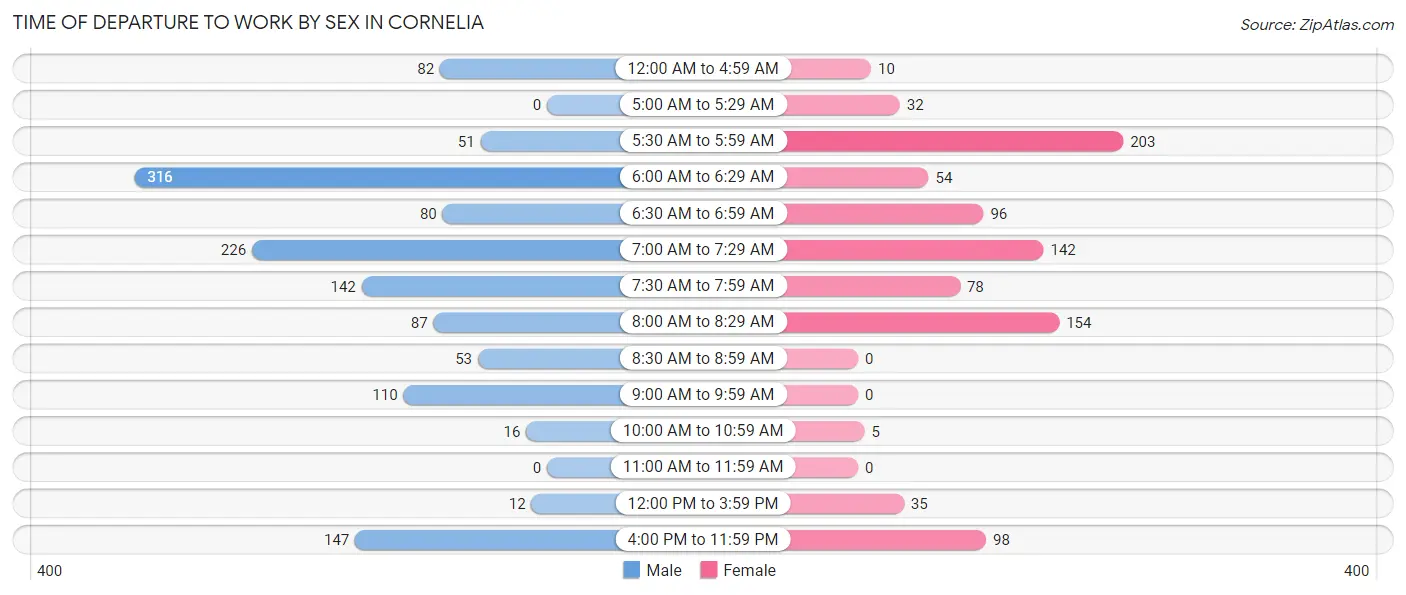
| Time of Departure | Male | Female |
| 12:00 AM to 4:59 AM | 82 (6.2%) | 10 (1.1%) |
| 5:00 AM to 5:29 AM | 0 (0.0%) | 32 (3.5%) |
| 5:30 AM to 5:59 AM | 51 (3.9%) | 203 (22.4%) |
| 6:00 AM to 6:29 AM | 316 (23.9%) | 54 (5.9%) |
| 6:30 AM to 6:59 AM | 80 (6.0%) | 96 (10.6%) |
| 7:00 AM to 7:29 AM | 226 (17.1%) | 142 (15.7%) |
| 7:30 AM to 7:59 AM | 142 (10.7%) | 78 (8.6%) |
| 8:00 AM to 8:29 AM | 87 (6.6%) | 154 (17.0%) |
| 8:30 AM to 8:59 AM | 53 (4.0%) | 0 (0.0%) |
| 9:00 AM to 9:59 AM | 110 (8.3%) | 0 (0.0%) |
| 10:00 AM to 10:59 AM | 16 (1.2%) | 5 (0.5%) |
| 11:00 AM to 11:59 AM | 0 (0.0%) | 0 (0.0%) |
| 12:00 PM to 3:59 PM | 12 (0.9%) | 35 (3.9%) |
| 4:00 PM to 11:59 PM | 147 (11.1%) | 98 (10.8%) |
| Total | 1,322 (100.0%) | 907 (100.0%) |
Housing Occupancy in Cornelia
Occupancy by Ownership in Cornelia
Of the total 1,535 dwellings in Cornelia, owner-occupied units account for 890 (58.0%), while renter-occupied units make up 645 (42.0%).
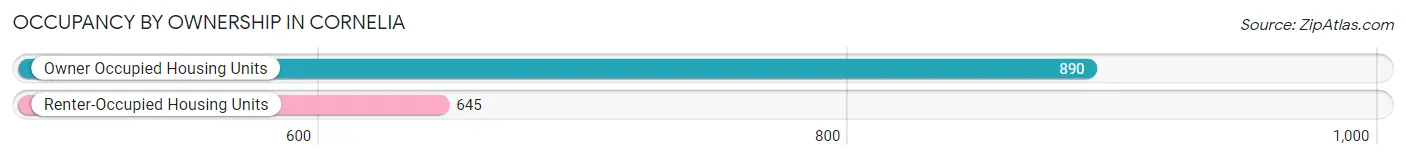
| Occupancy | # Housing Units | % Housing Units |
| Owner Occupied Housing Units | 890 | 58.0% |
| Renter-Occupied Housing Units | 645 | 42.0% |
| Total Occupied Housing Units | 1,535 | 100.0% |
Occupancy by Household Size in Cornelia
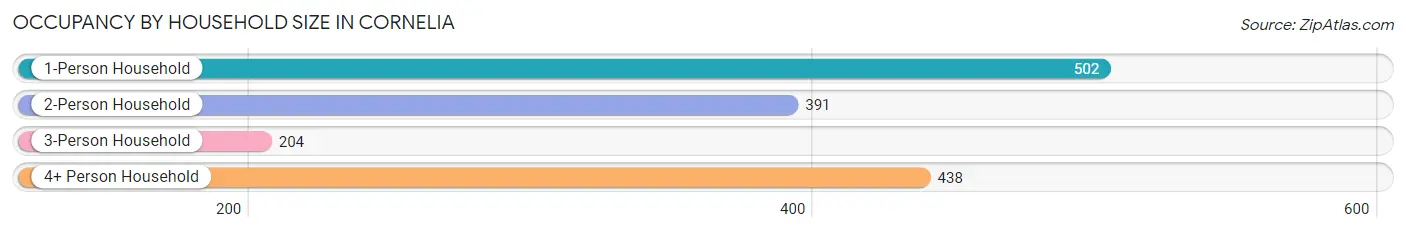
| Household Size | # Housing Units | % Housing Units |
| 1-Person Household | 502 | 32.7% |
| 2-Person Household | 391 | 25.5% |
| 3-Person Household | 204 | 13.3% |
| 4+ Person Household | 438 | 28.5% |
| Total Housing Units | 1,535 | 100.0% |
Occupancy by Ownership by Household Size in Cornelia
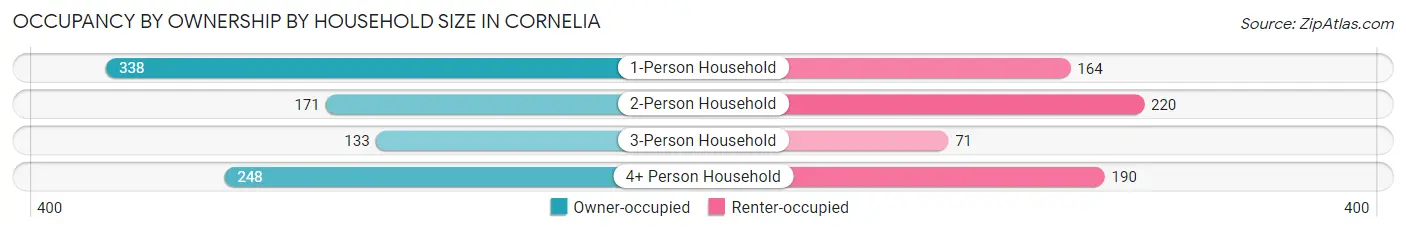
| Household Size | Owner-occupied | Renter-occupied |
| 1-Person Household | 338 (67.3%) | 164 (32.7%) |
| 2-Person Household | 171 (43.7%) | 220 (56.3%) |
| 3-Person Household | 133 (65.2%) | 71 (34.8%) |
| 4+ Person Household | 248 (56.6%) | 190 (43.4%) |
| Total Housing Units | 890 (58.0%) | 645 (42.0%) |
Occupancy by Educational Attainment in Cornelia
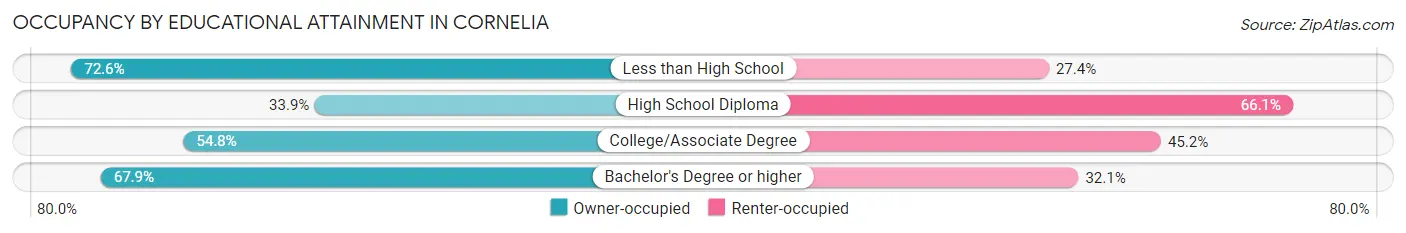
| Household Size | Owner-occupied | Renter-occupied |
| Less than High School | 331 (72.6%) | 125 (27.4%) |
| High School Diploma | 138 (33.9%) | 269 (66.1%) |
| College/Associate Degree | 148 (54.8%) | 122 (45.2%) |
| Bachelor's Degree or higher | 273 (67.9%) | 129 (32.1%) |
Occupancy by Age of Householder in Cornelia
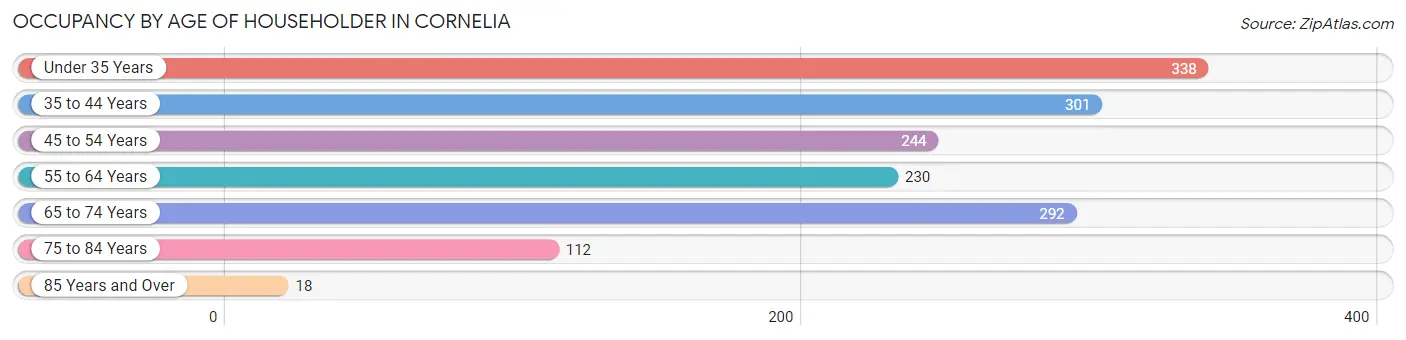
| Age Bracket | # Households | % Households |
| Under 35 Years | 338 | 22.0% |
| 35 to 44 Years | 301 | 19.6% |
| 45 to 54 Years | 244 | 15.9% |
| 55 to 64 Years | 230 | 15.0% |
| 65 to 74 Years | 292 | 19.0% |
| 75 to 84 Years | 112 | 7.3% |
| 85 Years and Over | 18 | 1.2% |
| Total | 1,535 | 100.0% |
Housing Finances in Cornelia
Median Income by Occupancy in Cornelia
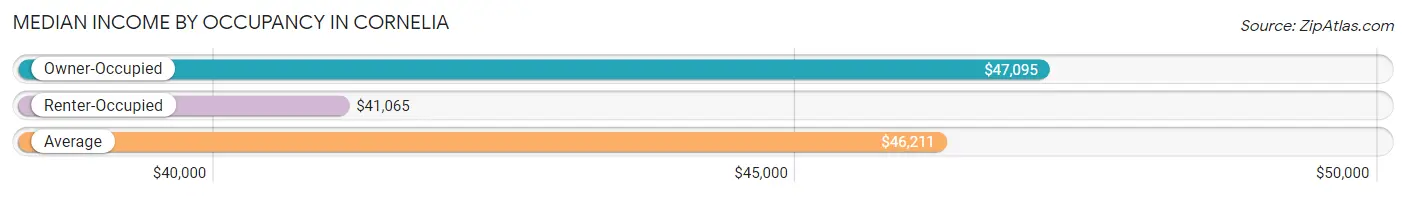
| Occupancy Type | # Households | Median Income |
| Owner-Occupied | 890 (58.0%) | $47,095 |
| Renter-Occupied | 645 (42.0%) | $41,065 |
| Average | 1,535 (100.0%) | $46,211 |
Occupancy by Householder Income Bracket in Cornelia
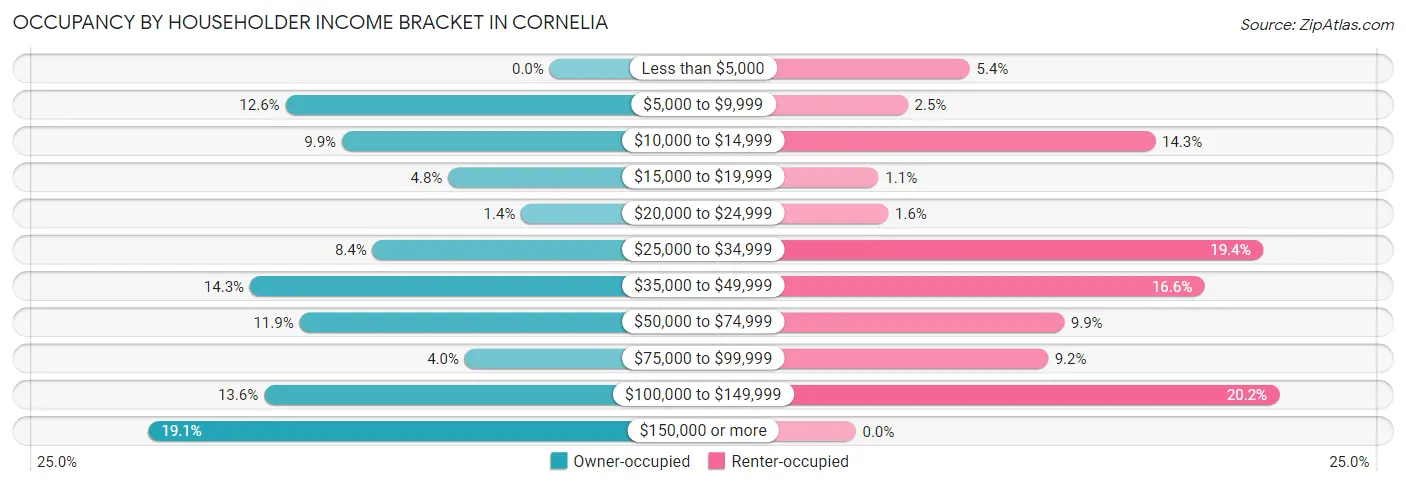
| Income Bracket | Owner-occupied | Renter-occupied |
| Less than $5,000 | 0 (0.0%) | 35 (5.4%) |
| $5,000 to $9,999 | 112 (12.6%) | 16 (2.5%) |
| $10,000 to $14,999 | 88 (9.9%) | 92 (14.3%) |
| $15,000 to $19,999 | 43 (4.8%) | 7 (1.1%) |
| $20,000 to $24,999 | 12 (1.3%) | 10 (1.5%) |
| $25,000 to $34,999 | 75 (8.4%) | 125 (19.4%) |
| $35,000 to $49,999 | 127 (14.3%) | 107 (16.6%) |
| $50,000 to $74,999 | 106 (11.9%) | 64 (9.9%) |
| $75,000 to $99,999 | 36 (4.0%) | 59 (9.1%) |
| $100,000 to $149,999 | 121 (13.6%) | 130 (20.2%) |
| $150,000 or more | 170 (19.1%) | 0 (0.0%) |
| Total | 890 (100.0%) | 645 (100.0%) |
Monthly Housing Cost Tiers in Cornelia
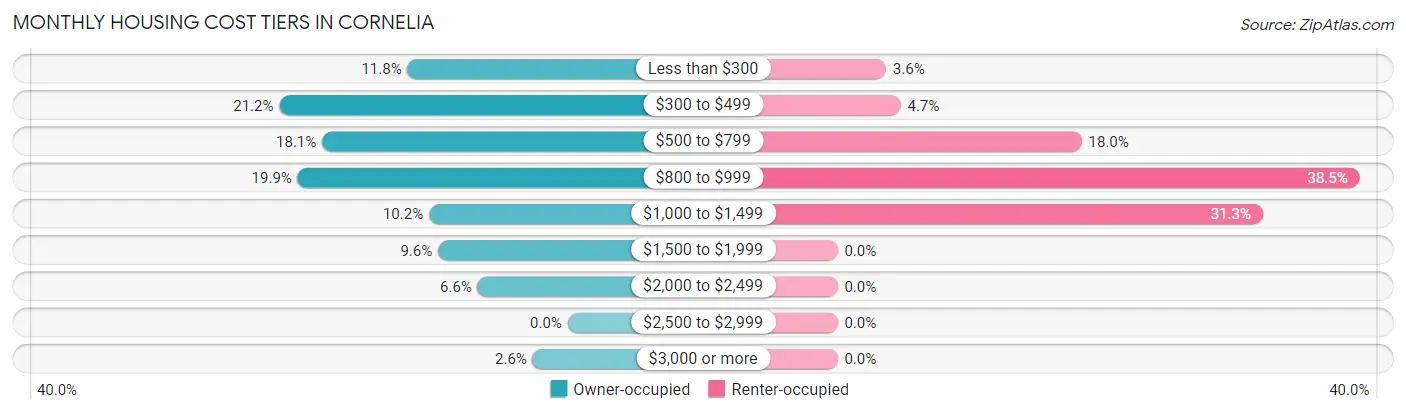
| Monthly Cost | Owner-occupied | Renter-occupied |
| Less than $300 | 105 (11.8%) | 23 (3.6%) |
| $300 to $499 | 189 (21.2%) | 30 (4.6%) |
| $500 to $799 | 161 (18.1%) | 116 (18.0%) |
| $800 to $999 | 177 (19.9%) | 248 (38.5%) |
| $1,000 to $1,499 | 91 (10.2%) | 202 (31.3%) |
| $1,500 to $1,999 | 85 (9.6%) | 0 (0.0%) |
| $2,000 to $2,499 | 59 (6.6%) | 0 (0.0%) |
| $2,500 to $2,999 | 0 (0.0%) | 0 (0.0%) |
| $3,000 or more | 23 (2.6%) | 0 (0.0%) |
| Total | 890 (100.0%) | 645 (100.0%) |
Physical Housing Characteristics in Cornelia
Housing Structures in Cornelia
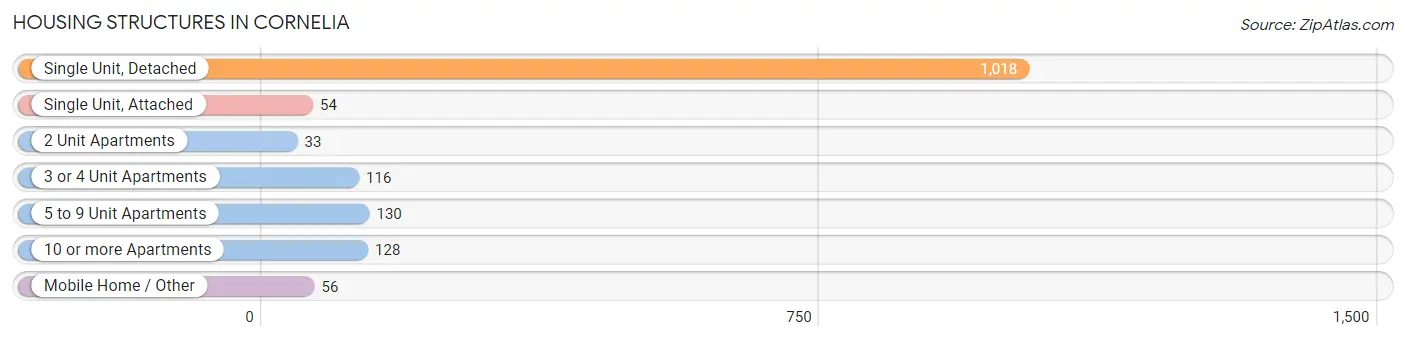
| Structure Type | # Housing Units | % Housing Units |
| Single Unit, Detached | 1,018 | 66.3% |
| Single Unit, Attached | 54 | 3.5% |
| 2 Unit Apartments | 33 | 2.1% |
| 3 or 4 Unit Apartments | 116 | 7.6% |
| 5 to 9 Unit Apartments | 130 | 8.5% |
| 10 or more Apartments | 128 | 8.3% |
| Mobile Home / Other | 56 | 3.6% |
| Total | 1,535 | 100.0% |
Housing Structures by Occupancy in Cornelia
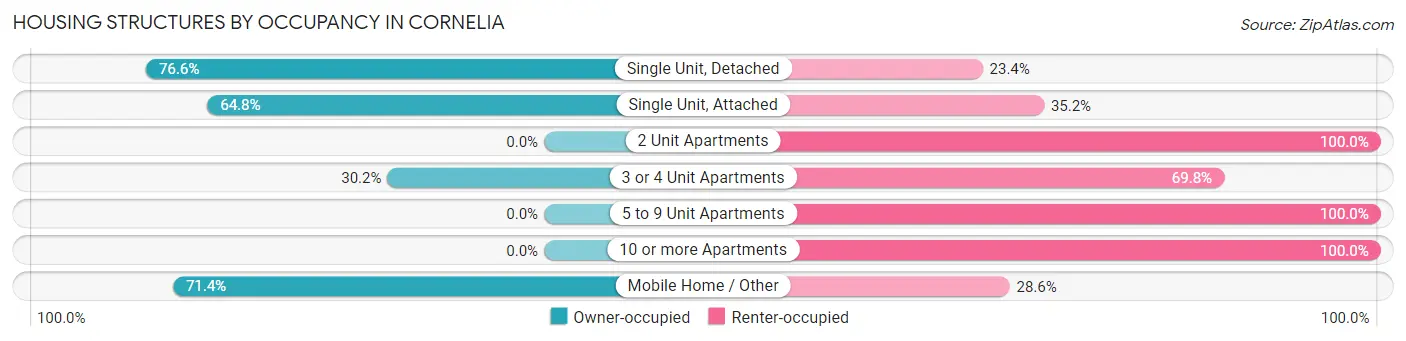
| Structure Type | Owner-occupied | Renter-occupied |
| Single Unit, Detached | 780 (76.6%) | 238 (23.4%) |
| Single Unit, Attached | 35 (64.8%) | 19 (35.2%) |
| 2 Unit Apartments | 0 (0.0%) | 33 (100.0%) |
| 3 or 4 Unit Apartments | 35 (30.2%) | 81 (69.8%) |
| 5 to 9 Unit Apartments | 0 (0.0%) | 130 (100.0%) |
| 10 or more Apartments | 0 (0.0%) | 128 (100.0%) |
| Mobile Home / Other | 40 (71.4%) | 16 (28.6%) |
| Total | 890 (58.0%) | 645 (42.0%) |
Housing Structures by Number of Rooms in Cornelia
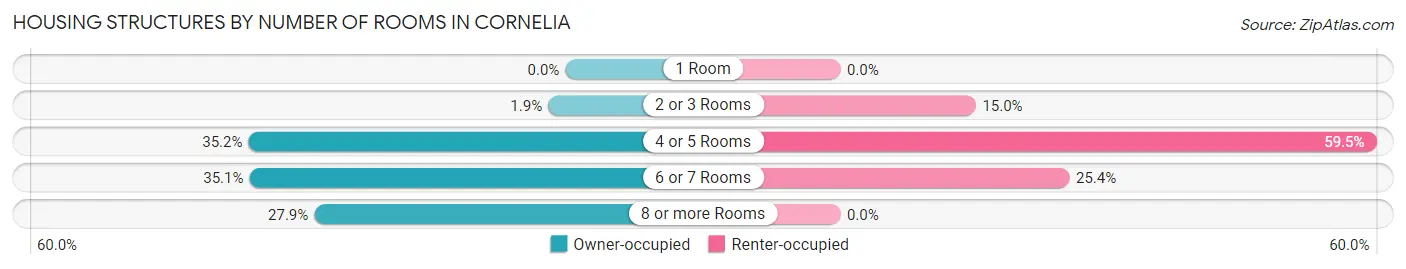
| Number of Rooms | Owner-occupied | Renter-occupied |
| 1 Room | 0 (0.0%) | 0 (0.0%) |
| 2 or 3 Rooms | 17 (1.9%) | 97 (15.0%) |
| 4 or 5 Rooms | 313 (35.2%) | 384 (59.5%) |
| 6 or 7 Rooms | 312 (35.1%) | 164 (25.4%) |
| 8 or more Rooms | 248 (27.9%) | 0 (0.0%) |
| Total | 890 (100.0%) | 645 (100.0%) |
Housing Structure by Heating Type in Cornelia
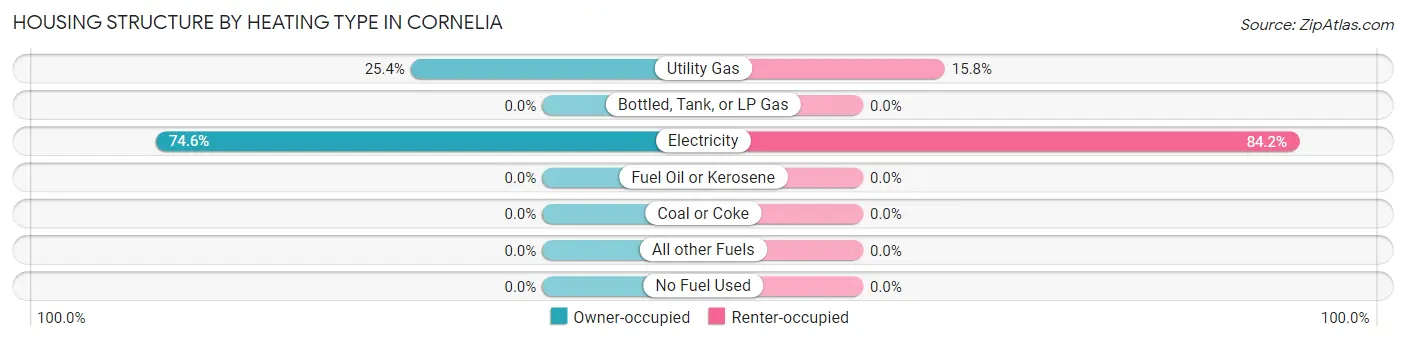
| Heating Type | Owner-occupied | Renter-occupied |
| Utility Gas | 226 (25.4%) | 102 (15.8%) |
| Bottled, Tank, or LP Gas | 0 (0.0%) | 0 (0.0%) |
| Electricity | 664 (74.6%) | 543 (84.2%) |
| Fuel Oil or Kerosene | 0 (0.0%) | 0 (0.0%) |
| Coal or Coke | 0 (0.0%) | 0 (0.0%) |
| All other Fuels | 0 (0.0%) | 0 (0.0%) |
| No Fuel Used | 0 (0.0%) | 0 (0.0%) |
| Total | 890 (100.0%) | 645 (100.0%) |
Household Vehicle Usage in Cornelia
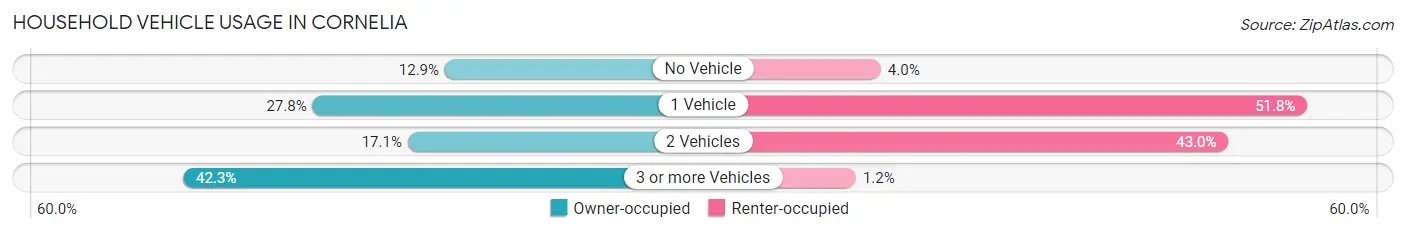
| Vehicles per Household | Owner-occupied | Renter-occupied |
| No Vehicle | 115 (12.9%) | 26 (4.0%) |
| 1 Vehicle | 247 (27.8%) | 334 (51.8%) |
| 2 Vehicles | 152 (17.1%) | 277 (42.9%) |
| 3 or more Vehicles | 376 (42.2%) | 8 (1.2%) |
| Total | 890 (100.0%) | 645 (100.0%) |
Real Estate & Mortgages in Cornelia
Real Estate and Mortgage Overview in Cornelia
| Characteristic | Without Mortgage | With Mortgage |
| Housing Units | 420 | 470 |
| Median Property Value | $116,900 | $194,500 |
| Median Household Income | $34,000 | $108 |
| Monthly Housing Costs | $395 | $23 |
| Real Estate Taxes | $705 | $78 |
Property Value by Mortgage Status in Cornelia
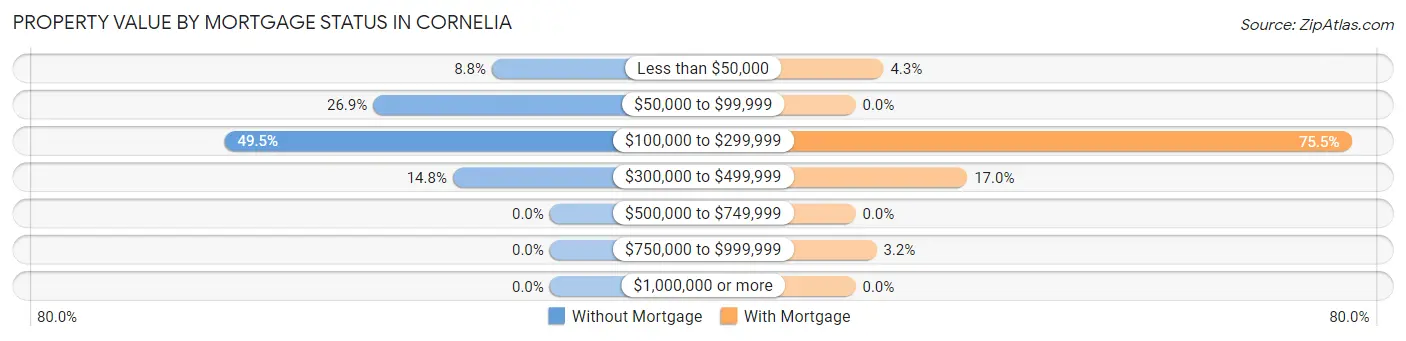
| Property Value | Without Mortgage | With Mortgage |
| Less than $50,000 | 37 (8.8%) | 20 (4.3%) |
| $50,000 to $99,999 | 113 (26.9%) | 0 (0.0%) |
| $100,000 to $299,999 | 208 (49.5%) | 355 (75.5%) |
| $300,000 to $499,999 | 62 (14.8%) | 80 (17.0%) |
| $500,000 to $749,999 | 0 (0.0%) | 0 (0.0%) |
| $750,000 to $999,999 | 0 (0.0%) | 15 (3.2%) |
| $1,000,000 or more | 0 (0.0%) | 0 (0.0%) |
| Total | 420 (100.0%) | 470 (100.0%) |
Household Income by Mortgage Status in Cornelia
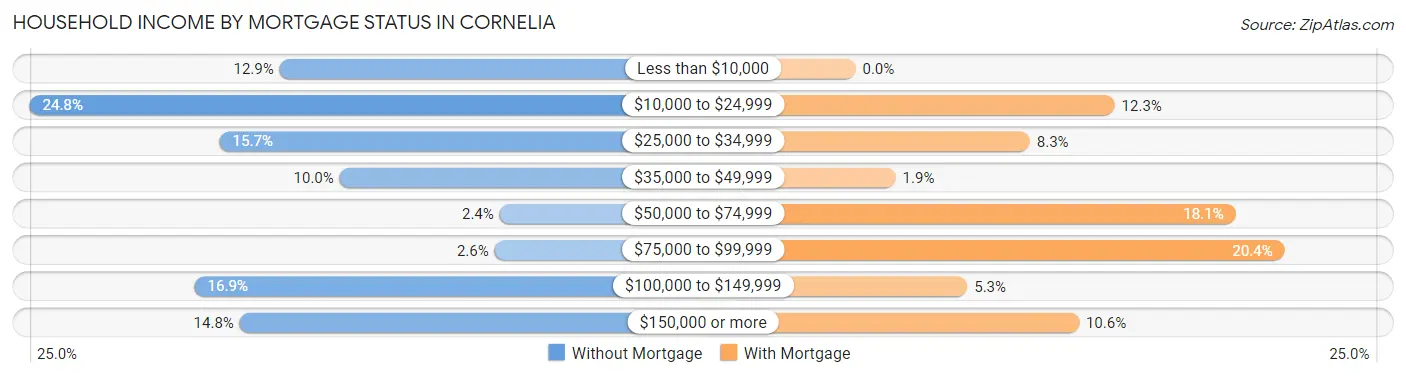
| Household Income | Without Mortgage | With Mortgage |
| Less than $10,000 | 54 (12.9%) | 0 (0.0%) |
| $10,000 to $24,999 | 104 (24.8%) | 58 (12.3%) |
| $25,000 to $34,999 | 66 (15.7%) | 39 (8.3%) |
| $35,000 to $49,999 | 42 (10.0%) | 9 (1.9%) |
| $50,000 to $74,999 | 10 (2.4%) | 85 (18.1%) |
| $75,000 to $99,999 | 11 (2.6%) | 96 (20.4%) |
| $100,000 to $149,999 | 71 (16.9%) | 25 (5.3%) |
| $150,000 or more | 62 (14.8%) | 50 (10.6%) |
| Total | 420 (100.0%) | 470 (100.0%) |
Property Value to Household Income Ratio in Cornelia
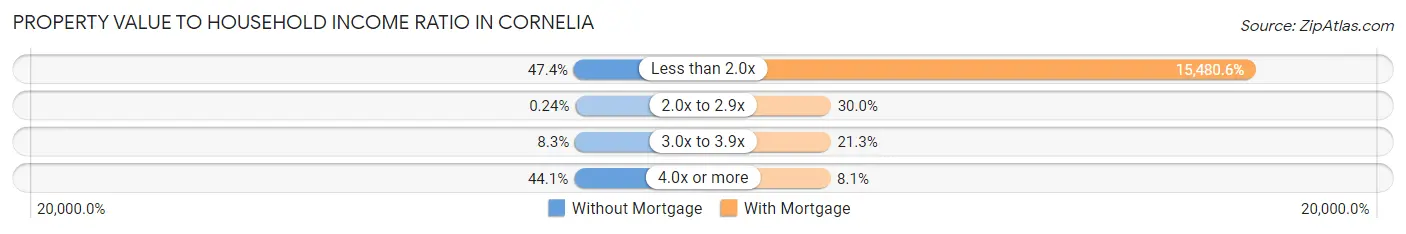
| Value-to-Income Ratio | Without Mortgage | With Mortgage |
| Less than 2.0x | 199 (47.4%) | 72,759 (15,480.6%) |
| 2.0x to 2.9x | 1 (0.2%) | 141 (30.0%) |
| 3.0x to 3.9x | 35 (8.3%) | 100 (21.3%) |
| 4.0x or more | 185 (44.1%) | 38 (8.1%) |
| Total | 420 (100.0%) | 470 (100.0%) |
Real Estate Taxes by Mortgage Status in Cornelia
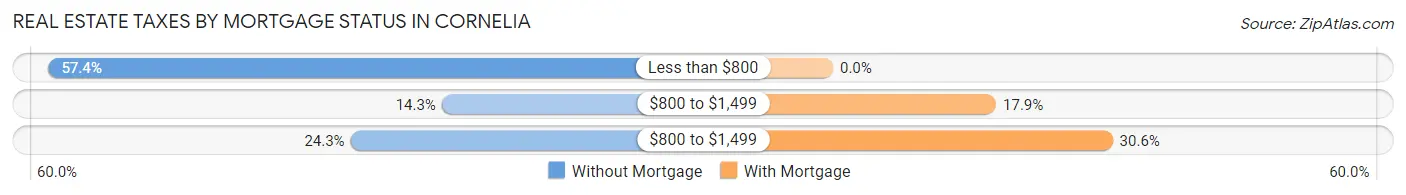
| Property Taxes | Without Mortgage | With Mortgage |
| Less than $800 | 241 (57.4%) | 0 (0.0%) |
| $800 to $1,499 | 60 (14.3%) | 84 (17.9%) |
| $800 to $1,499 | 102 (24.3%) | 144 (30.6%) |
| Total | 420 (100.0%) | 470 (100.0%) |
Health & Disability in Cornelia
Health Insurance Coverage by Age in Cornelia
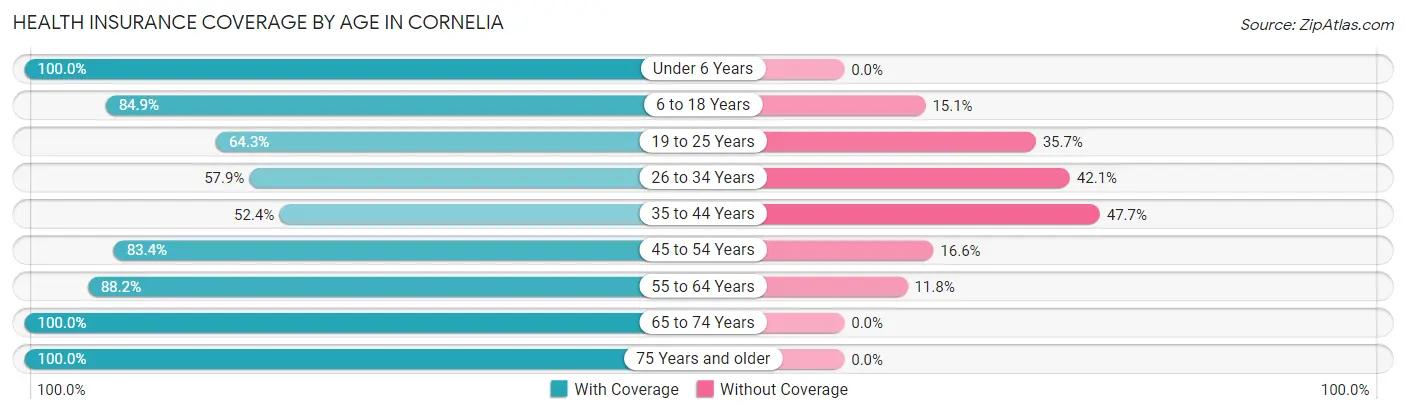
| Age Bracket | With Coverage | Without Coverage |
| Under 6 Years | 216 (100.0%) | 0 (0.0%) |
| 6 to 18 Years | 763 (84.9%) | 136 (15.1%) |
| 19 to 25 Years | 463 (64.3%) | 257 (35.7%) |
| 26 to 34 Years | 486 (57.9%) | 353 (42.1%) |
| 35 to 44 Years | 334 (52.3%) | 304 (47.6%) |
| 45 to 54 Years | 326 (83.4%) | 65 (16.6%) |
| 55 to 64 Years | 292 (88.2%) | 39 (11.8%) |
| 65 to 74 Years | 418 (100.0%) | 0 (0.0%) |
| 75 Years and older | 196 (100.0%) | 0 (0.0%) |
| Total | 3,494 (75.2%) | 1,154 (24.8%) |
Health Insurance Coverage by Citizenship Status in Cornelia
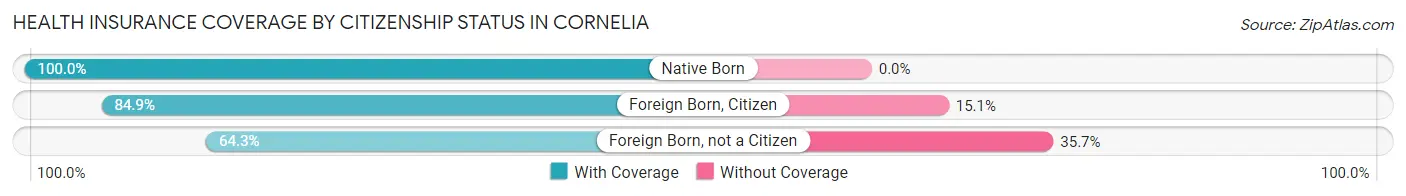
| Citizenship Status | With Coverage | Without Coverage |
| Native Born | 216 (100.0%) | 0 (0.0%) |
| Foreign Born, Citizen | 763 (84.9%) | 136 (15.1%) |
| Foreign Born, not a Citizen | 463 (64.3%) | 257 (35.7%) |
Health Insurance Coverage by Household Income in Cornelia
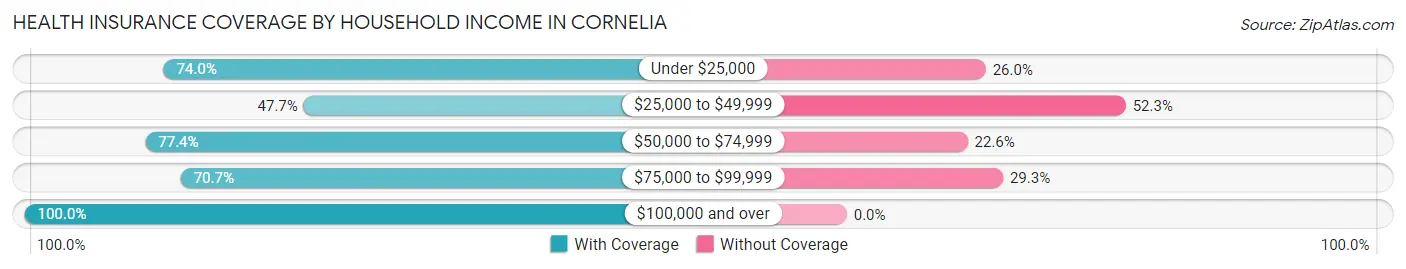
| Household Income | With Coverage | Without Coverage |
| Under $25,000 | 662 (74.0%) | 233 (26.0%) |
| $25,000 to $49,999 | 645 (47.7%) | 706 (52.3%) |
| $50,000 to $74,999 | 424 (77.4%) | 124 (22.6%) |
| $75,000 to $99,999 | 220 (70.7%) | 91 (29.3%) |
| $100,000 and over | 1,543 (100.0%) | 0 (0.0%) |
Public vs Private Health Insurance Coverage by Age in Cornelia
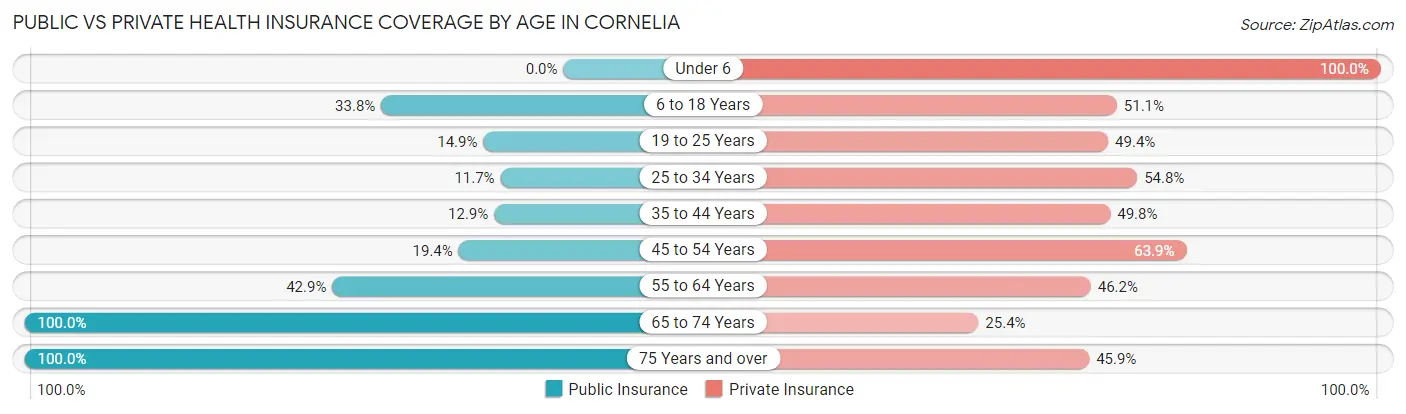
| Age Bracket | Public Insurance | Private Insurance |
| Under 6 | 0 (0.0%) | 216 (100.0%) |
| 6 to 18 Years | 304 (33.8%) | 459 (51.1%) |
| 19 to 25 Years | 107 (14.9%) | 356 (49.4%) |
| 25 to 34 Years | 98 (11.7%) | 460 (54.8%) |
| 35 to 44 Years | 82 (12.9%) | 318 (49.8%) |
| 45 to 54 Years | 76 (19.4%) | 250 (63.9%) |
| 55 to 64 Years | 142 (42.9%) | 153 (46.2%) |
| 65 to 74 Years | 418 (100.0%) | 106 (25.4%) |
| 75 Years and over | 196 (100.0%) | 90 (45.9%) |
| Total | 1,423 (30.6%) | 2,408 (51.8%) |
Disability Status by Sex by Age in Cornelia
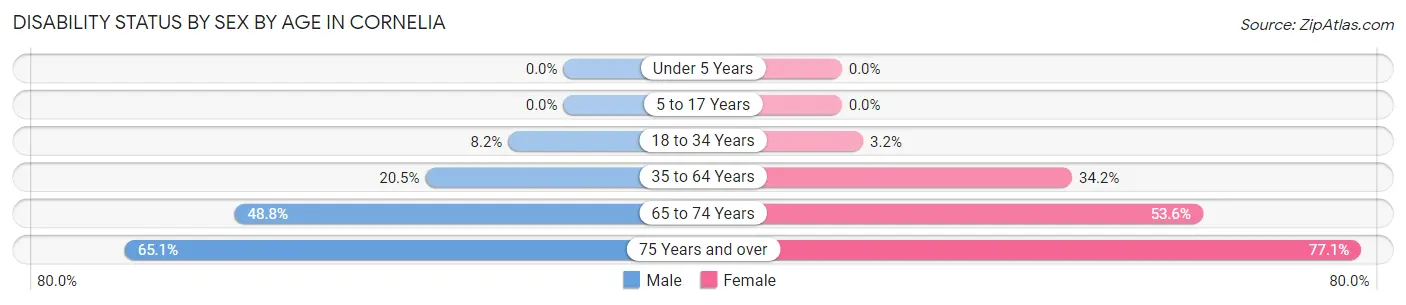
| Age Bracket | Male | Female |
| Under 5 Years | 0 (0.0%) | 0 (0.0%) |
| 5 to 17 Years | 0 (0.0%) | 0 (0.0%) |
| 18 to 34 Years | 79 (8.2%) | 19 (3.2%) |
| 35 to 64 Years | 114 (20.5%) | 275 (34.2%) |
| 65 to 74 Years | 102 (48.8%) | 112 (53.6%) |
| 75 Years and over | 28 (65.1%) | 118 (77.1%) |
Disability Class by Sex by Age in Cornelia
Disability Class: Hearing Difficulty
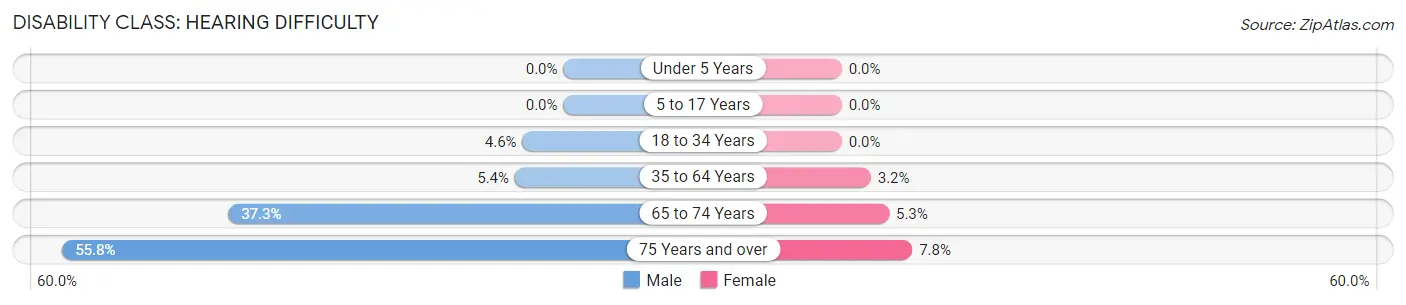
| Age Bracket | Male | Female |
| Under 5 Years | 0 (0.0%) | 0 (0.0%) |
| 5 to 17 Years | 0 (0.0%) | 0 (0.0%) |
| 18 to 34 Years | 44 (4.6%) | 0 (0.0%) |
| 35 to 64 Years | 30 (5.4%) | 26 (3.2%) |
| 65 to 74 Years | 78 (37.3%) | 11 (5.3%) |
| 75 Years and over | 24 (55.8%) | 12 (7.8%) |
Disability Class: Vision Difficulty
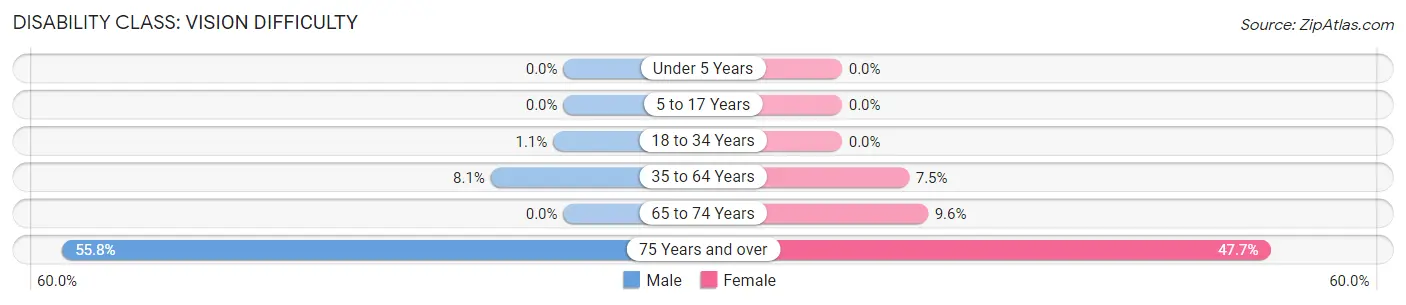
| Age Bracket | Male | Female |
| Under 5 Years | 0 (0.0%) | 0 (0.0%) |
| 5 to 17 Years | 0 (0.0%) | 0 (0.0%) |
| 18 to 34 Years | 11 (1.1%) | 0 (0.0%) |
| 35 to 64 Years | 45 (8.1%) | 60 (7.5%) |
| 65 to 74 Years | 0 (0.0%) | 20 (9.6%) |
| 75 Years and over | 24 (55.8%) | 73 (47.7%) |
Disability Class: Cognitive Difficulty
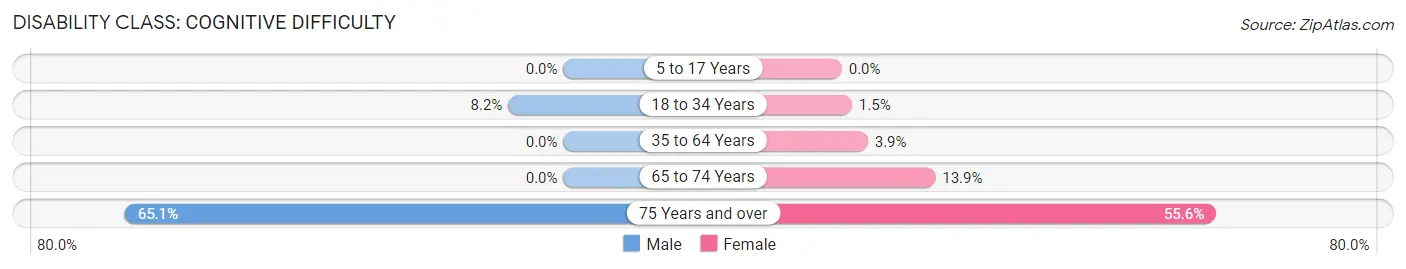
| Age Bracket | Male | Female |
| 5 to 17 Years | 0 (0.0%) | 0 (0.0%) |
| 18 to 34 Years | 79 (8.2%) | 9 (1.5%) |
| 35 to 64 Years | 0 (0.0%) | 31 (3.9%) |
| 65 to 74 Years | 0 (0.0%) | 29 (13.9%) |
| 75 Years and over | 28 (65.1%) | 85 (55.6%) |
Disability Class: Ambulatory Difficulty
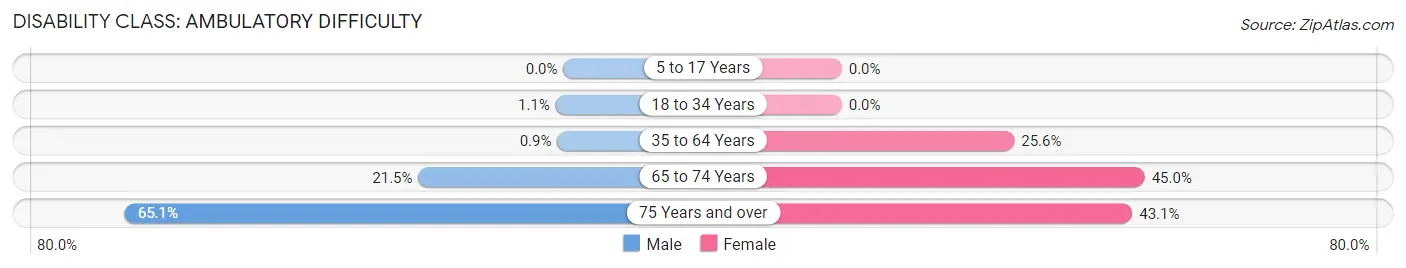
| Age Bracket | Male | Female |
| 5 to 17 Years | 0 (0.0%) | 0 (0.0%) |
| 18 to 34 Years | 11 (1.1%) | 0 (0.0%) |
| 35 to 64 Years | 5 (0.9%) | 206 (25.6%) |
| 65 to 74 Years | 45 (21.5%) | 94 (45.0%) |
| 75 Years and over | 28 (65.1%) | 66 (43.1%) |
Disability Class: Self-Care Difficulty
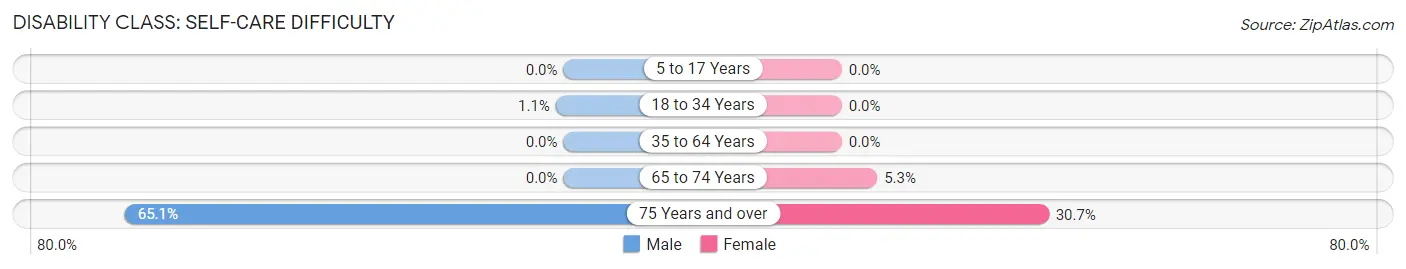
| Age Bracket | Male | Female |
| 5 to 17 Years | 0 (0.0%) | 0 (0.0%) |
| 18 to 34 Years | 11 (1.1%) | 0 (0.0%) |
| 35 to 64 Years | 0 (0.0%) | 0 (0.0%) |
| 65 to 74 Years | 0 (0.0%) | 11 (5.3%) |
| 75 Years and over | 28 (65.1%) | 47 (30.7%) |
Technology Access in Cornelia
Computing Device Access in Cornelia
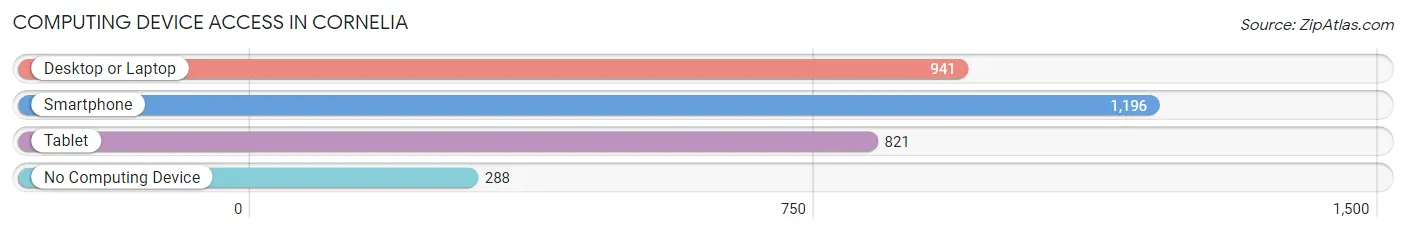
| Device Type | # Households | % Households |
| Desktop or Laptop | 941 | 61.3% |
| Smartphone | 1,196 | 77.9% |
| Tablet | 821 | 53.5% |
| No Computing Device | 288 | 18.8% |
| Total | 1,535 | 100.0% |
Internet Access in Cornelia
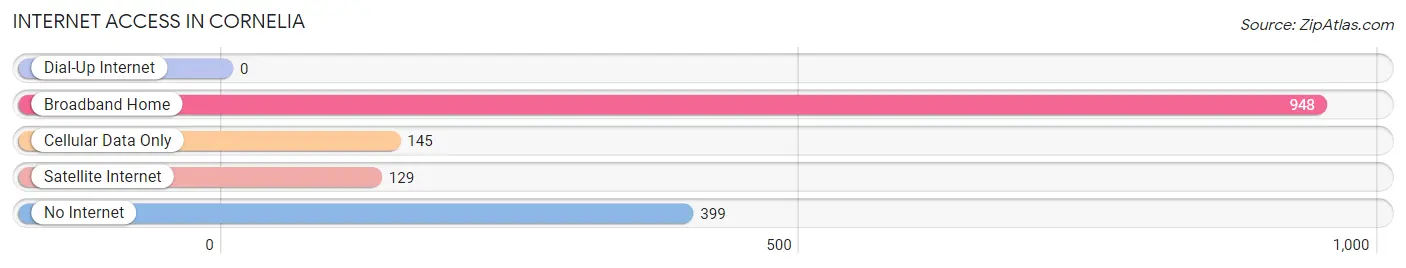
| Internet Type | # Households | % Households |
| Dial-Up Internet | 0 | 0.0% |
| Broadband Home | 948 | 61.8% |
| Cellular Data Only | 145 | 9.5% |
| Satellite Internet | 129 | 8.4% |
| No Internet | 399 | 26.0% |
| Total | 1,535 | 100.0% |
Cornelia Summary
Cornelia, Georgia is a small city located in Habersham County in the northeastern part of the state. It is situated in the foothills of the Blue Ridge Mountains and is part of the Gainesville-Cornelia Metropolitan Statistical Area. The city has a population of 4,160 as of the 2010 census, and is the county seat of Habersham County.
History
The area that is now Cornelia was first settled in the early 1800s by settlers from North Carolina. The town was originally known as "Mud Creek" and was later renamed "Cornelia" in honor of the daughter of a prominent local family. The town was incorporated in 1859 and was named the county seat of Habersham County in 1873.
In the late 1800s, Cornelia was a thriving agricultural center, with cotton, corn, and tobacco being the main crops. The town also had a number of sawmills and gristmills, as well as a number of small businesses.
In the early 1900s, the town began to experience a period of growth and development. The Gainesville Midland Railroad was built through the town in 1906, and the town was connected to the rest of the state by the completion of the Gainesville-Cornelia Highway in 1915.
In the 1920s, the town experienced a period of economic growth and prosperity. The town was home to a number of businesses, including a cotton mill, a furniture factory, and a number of other small businesses.
Geography
Cornelia is located in Habersham County in the northeastern part of the state. It is situated in the foothills of the Blue Ridge Mountains and is part of the Gainesville-Cornelia Metropolitan Statistical Area. The city has a total area of 4.2 square miles, all of which is land.
The city is located along the banks of the Chattahoochee River, and is bordered by the cities of Gainesville to the north, Clarkesville to the east, and Baldwin to the south.
Economy
The economy of Cornelia is largely based on agriculture and manufacturing. The city is home to a number of small businesses, including a furniture factory, a cotton mill, and a number of other small businesses.
The city is also home to a number of large employers, including Habersham County Schools, Habersham Medical Center, and the Habersham County Sheriff's Office.
Demographics
As of the 2010 census, the population of Cornelia was 4,160. The racial makeup of the city was 79.2% White, 16.2% African American, 0.4% Native American, 0.7% Asian, 0.1% Pacific Islander, 1.7% from other races, and 1.7% from two or more races. Hispanic or Latino of any race were 3.3% of the population.
The median household income in Cornelia was $35,938, and the median family income was $45,938. The per capita income for the city was $19,938. About 17.2% of families and 20.2% of the population were below the poverty line, including 28.2% of those under age 18 and 11.2% of those age 65 or over.
Common Questions
What is Per Capita Income in Cornelia?
Per Capita income in Cornelia is $27,224.
What is the Median Family Income in Cornelia?
Median Family Income in Cornelia is $62,835.
What is the Median Household income in Cornelia?
Median Household Income in Cornelia is $46,211.
What is Income or Wage Gap in Cornelia?
Income or Wage Gap in Cornelia is 12.2%.
Women in Cornelia earn 87.8 cents for every dollar earned by a man.
What is Inequality or Gini Index in Cornelia?
Inequality or Gini Index in Cornelia is 0.54.
What is the Total Population of Cornelia?
Total Population of Cornelia is 4,648.
What is the Total Male Population of Cornelia?
Total Male Population of Cornelia is 2,333.
What is the Total Female Population of Cornelia?
Total Female Population of Cornelia is 2,315.
What is the Ratio of Males per 100 Females in Cornelia?
There are 100.78 Males per 100 Females in Cornelia.
What is the Ratio of Females per 100 Males in Cornelia?
There are 99.23 Females per 100 Males in Cornelia.
What is the Median Population Age in Cornelia?
Median Population Age in Cornelia is 30.4 Years.
What is the Average Family Size in Cornelia
Average Family Size in Cornelia is 3.9 People.
What is the Average Household Size in Cornelia
Average Household Size in Cornelia is 3.0 People.
How Large is the Labor Force in Cornelia?
There are 2,364 People in the Labor Forcein in Cornelia.
What is the Percentage of People in the Labor Force in Cornelia?
60.4% of People are in the Labor Force in Cornelia.
What is the Unemployment Rate in Cornelia?
Unemployment Rate in Cornelia is 1.2%.