Seaside, CA Map & Demographics
Seaside Map
Seaside Overview
$33,366
PER CAPITA INCOME
$82,299
AVG FAMILY INCOME
$80,239
AVG HOUSEHOLD INCOME
30.0%
WAGE / INCOME GAP [ % ]
70.0¢/ $1
WAGE / INCOME GAP [ $ ]
$9,856
FAMILY INCOME DEFICIT
0.42
INEQUALITY / GINI INDEX
32,291
TOTAL POPULATION
16,046
MALE POPULATION
16,245
FEMALE POPULATION
98.78
MALES / 100 FEMALES
101.24
FEMALES / 100 MALES
34.0
MEDIAN AGE
3.4
AVG FAMILY SIZE
2.9
AVG HOUSEHOLD SIZE
16,676
LABOR FORCE [ PEOPLE ]
64.4%
PERCENT IN LABOR FORCE
7.1%
UNEMPLOYMENT RATE
Seaside Zip Codes
Income in Seaside
Income Overview in Seaside
Per Capita Income in Seaside is $33,366, while median incomes of families and households are $82,299 and $80,239 respectively.
| Characteristic | Number | Measure |
| Per Capita Income | 32,291 | $33,366 |
| Median Family Income | 7,266 | $82,299 |
| Mean Family Income | 7,266 | $103,759 |
| Median Household Income | 10,493 | $80,239 |
| Mean Household Income | 10,493 | $100,809 |
| Income Deficit | 7,266 | $9,856 |
| Wage / Income Gap (%) | 32,291 | 29.98% |
| Wage / Income Gap ($) | 32,291 | 70.02¢ per $1 |
| Gini / Inequality Index | 32,291 | 0.42 |
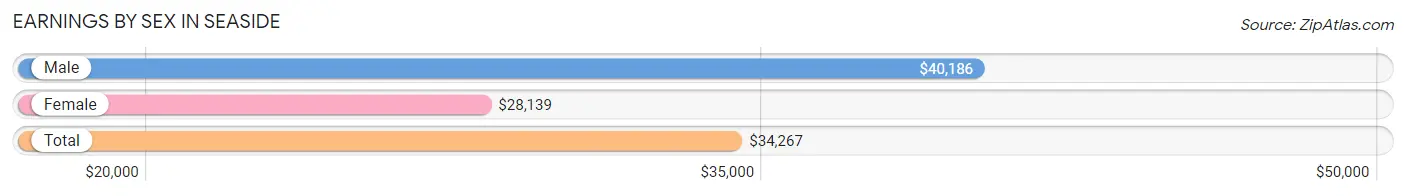
Earnings by Sex in Seaside
Average Earnings in Seaside are $34,267, $40,186 for men and $28,139 for women, a difference of 30.0%.
| Sex | Number | Average Earnings |
| Male | 8,999 (51.6%) | $40,186 |
| Female | 8,423 (48.3%) | $28,139 |
| Total | 17,422 (100.0%) | $34,267 |
Earnings by Sex by Income Bracket in Seaside
The most common earnings brackets in Seaside are $100,000+ for men (1,157 | 12.9%) and $100,000+ for women (786 | 9.3%).
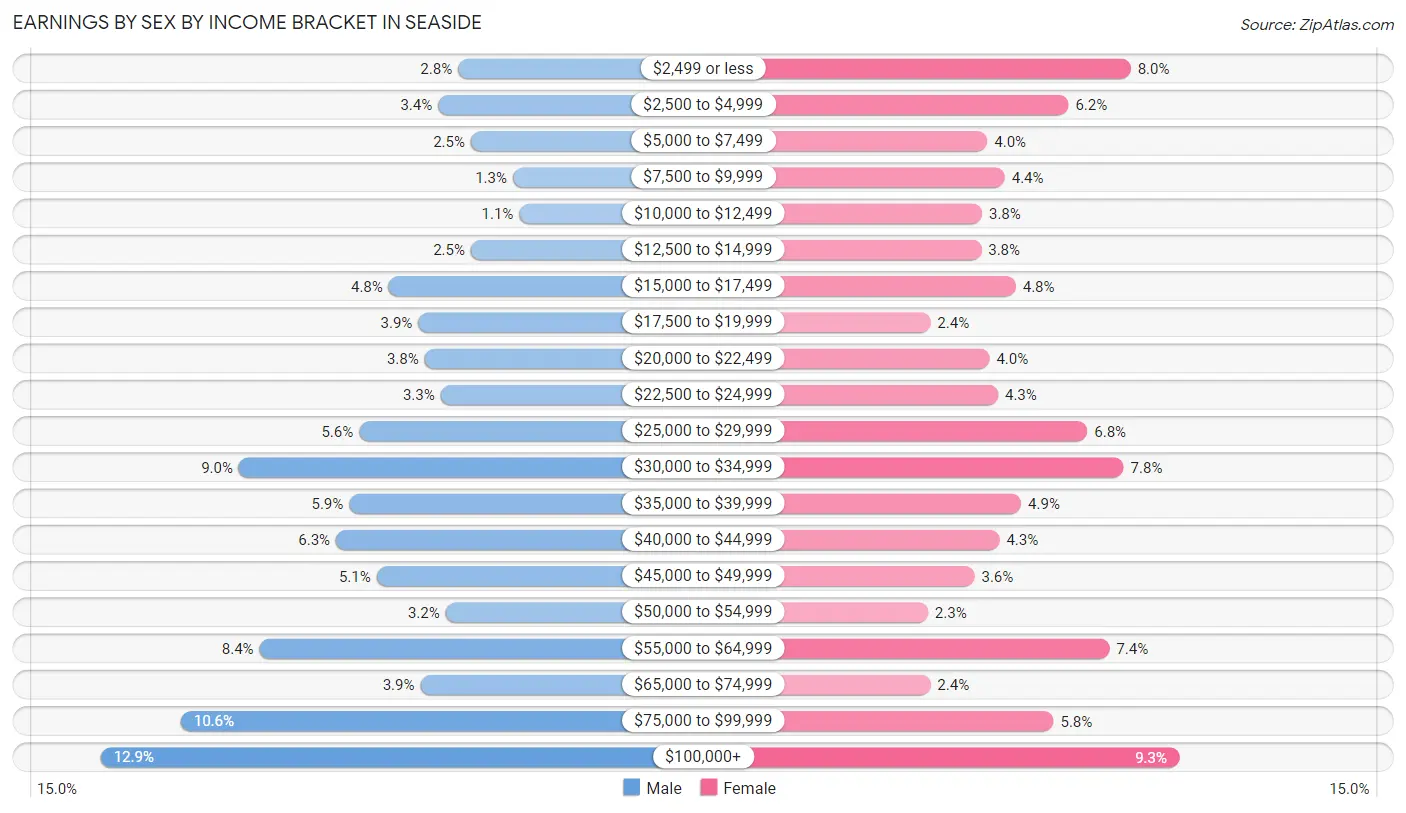
| Income | Male | Female |
| $2,499 or less | 254 (2.8%) | 672 (8.0%) |
| $2,500 to $4,999 | 304 (3.4%) | 525 (6.2%) |
| $5,000 to $7,499 | 221 (2.5%) | 333 (4.0%) |
| $7,500 to $9,999 | 115 (1.3%) | 374 (4.4%) |
| $10,000 to $12,499 | 99 (1.1%) | 320 (3.8%) |
| $12,500 to $14,999 | 221 (2.5%) | 318 (3.8%) |
| $15,000 to $17,499 | 429 (4.8%) | 400 (4.8%) |
| $17,500 to $19,999 | 355 (3.9%) | 198 (2.4%) |
| $20,000 to $22,499 | 338 (3.8%) | 338 (4.0%) |
| $22,500 to $24,999 | 298 (3.3%) | 358 (4.3%) |
| $25,000 to $29,999 | 504 (5.6%) | 569 (6.8%) |
| $30,000 to $34,999 | 808 (9.0%) | 655 (7.8%) |
| $35,000 to $39,999 | 529 (5.9%) | 413 (4.9%) |
| $40,000 to $44,999 | 562 (6.2%) | 361 (4.3%) |
| $45,000 to $49,999 | 460 (5.1%) | 302 (3.6%) |
| $50,000 to $54,999 | 285 (3.2%) | 192 (2.3%) |
| $55,000 to $64,999 | 756 (8.4%) | 622 (7.4%) |
| $65,000 to $74,999 | 349 (3.9%) | 198 (2.4%) |
| $75,000 to $99,999 | 955 (10.6%) | 489 (5.8%) |
| $100,000+ | 1,157 (12.9%) | 786 (9.3%) |
| Total | 8,999 (100.0%) | 8,423 (100.0%) |
Earnings by Sex by Educational Attainment in Seaside
Average earnings in Seaside are $45,045 for men and $35,212 for women, a difference of 21.8%. Men with an educational attainment of graduate degree enjoy the highest average annual earnings of $135,297, while those with less than high school education earn the least with $33,170. Women with an educational attainment of graduate degree earn the most with the average annual earnings of $83,750, while those with less than high school education have the smallest earnings of $21,228.
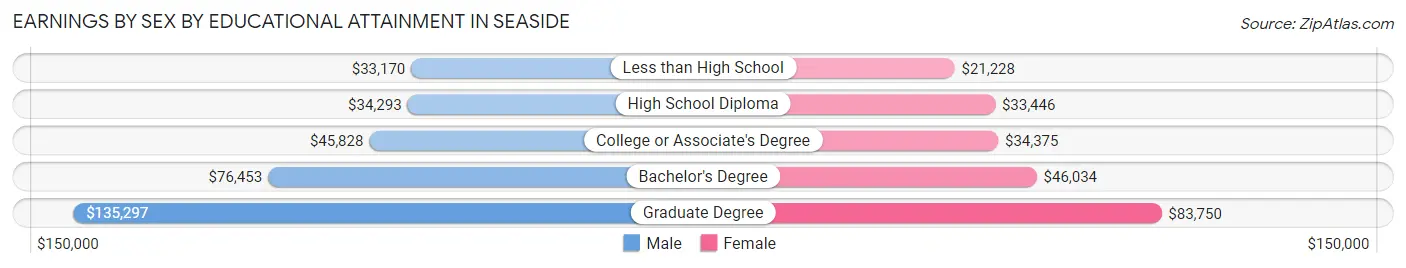
| Educational Attainment | Male Income | Female Income |
| Less than High School | $33,170 | $21,228 |
| High School Diploma | $34,293 | $33,446 |
| College or Associate's Degree | $45,828 | $34,375 |
| Bachelor's Degree | $76,453 | $46,034 |
| Graduate Degree | $135,297 | $83,750 |
| Total | $45,045 | $35,212 |
Family Income in Seaside
Family Income Brackets in Seaside
According to the Seaside family income data, there are 1,351 families falling into the $100,000 to $149,999 income range, which is the most common income bracket and makes up 18.6% of all families. Conversely, the $10,000 to $14,999 income bracket is the least frequent group with only 73 families (1.0%) belonging to this category.
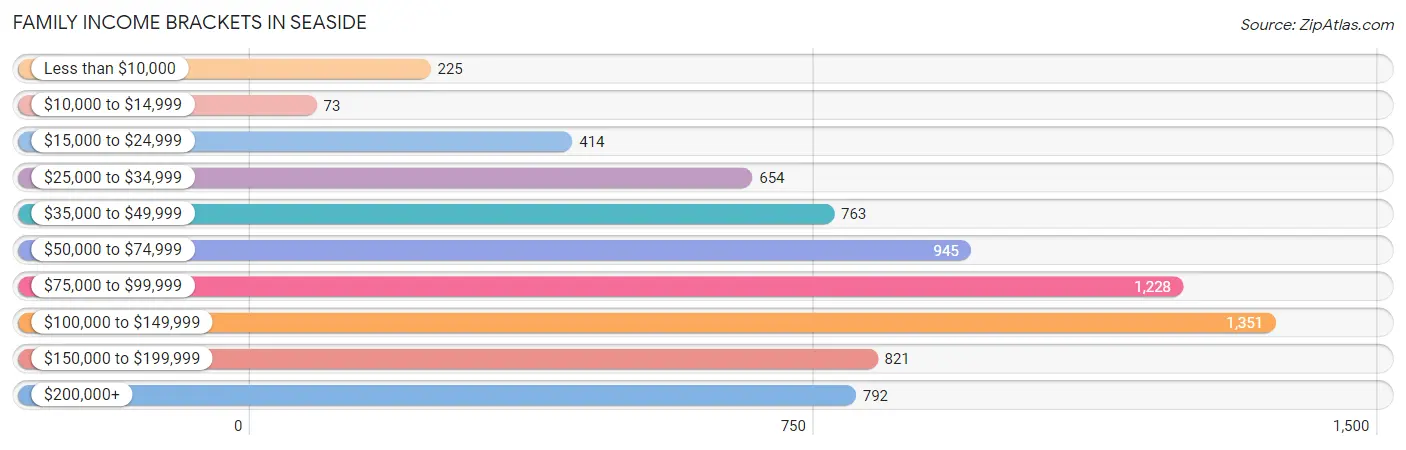
| Income Bracket | # Families | % Families |
| Less than $10,000 | 225 | 3.1% |
| $10,000 to $14,999 | 73 | 1.0% |
| $15,000 to $24,999 | 414 | 5.7% |
| $25,000 to $34,999 | 654 | 9.0% |
| $35,000 to $49,999 | 763 | 10.5% |
| $50,000 to $74,999 | 945 | 13.0% |
| $75,000 to $99,999 | 1,228 | 16.9% |
| $100,000 to $149,999 | 1,351 | 18.6% |
| $150,000 to $199,999 | 821 | 11.3% |
| $200,000+ | 792 | 10.9% |
Family Income by Famaliy Size in Seaside
7+ person families (178 | 2.5%) account for the highest median family income in Seaside with $148,173 per family, while 2-person families (2,687 | 37.0%) have the highest median income of $37,632 per family member.
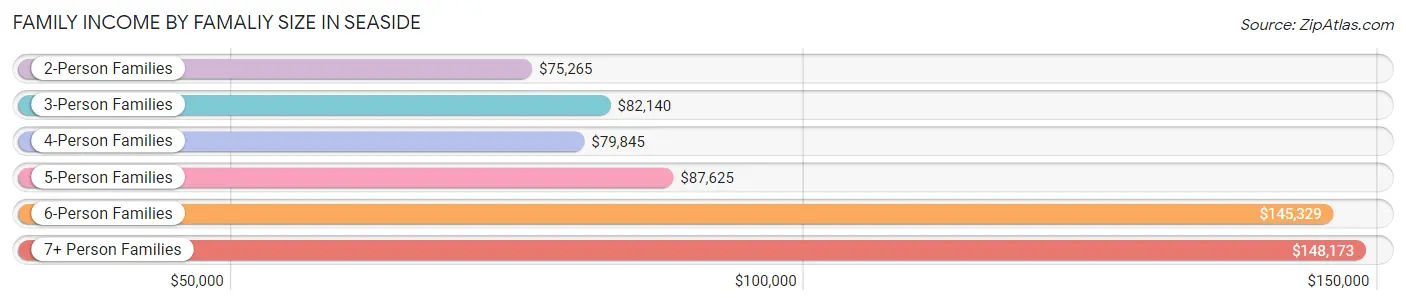
| Income Bracket | # Families | Median Income |
| 2-Person Families | 2,687 (37.0%) | $75,265 |
| 3-Person Families | 1,750 (24.1%) | $82,140 |
| 4-Person Families | 1,769 (24.3%) | $79,845 |
| 5-Person Families | 569 (7.8%) | $87,625 |
| 6-Person Families | 313 (4.3%) | $145,329 |
| 7+ Person Families | 178 (2.5%) | $148,173 |
| Total | 7,266 (100.0%) | $82,299 |
Family Income by Number of Earners in Seaside
The median family income in Seaside is $82,299, with families comprising 3+ earners (1,106) having the highest median family income of $133,281, while families with no earners (735) have the lowest median family income of $50,729, accounting for 15.2% and 10.1% of families, respectively.
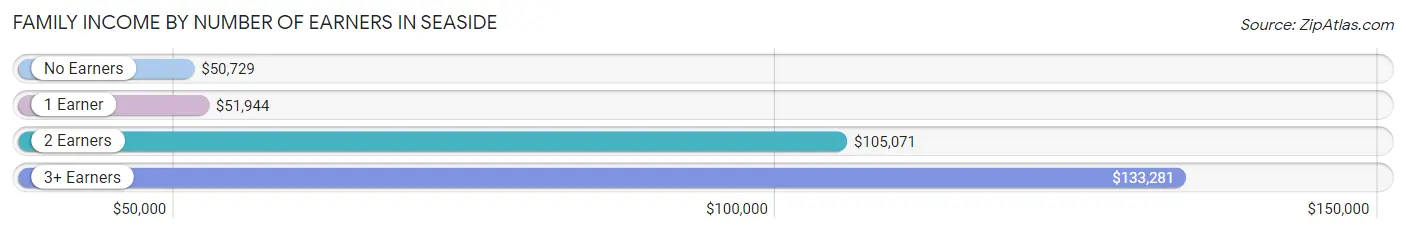
| Number of Earners | # Families | Median Income |
| No Earners | 735 (10.1%) | $50,729 |
| 1 Earner | 2,394 (33.0%) | $51,944 |
| 2 Earners | 3,031 (41.7%) | $105,071 |
| 3+ Earners | 1,106 (15.2%) | $133,281 |
| Total | 7,266 (100.0%) | $82,299 |
Household Income in Seaside
Household Income Brackets in Seaside
With 1,815 households falling in the category, the $100,000 to $149,999 income range is the most frequent in Seaside, accounting for 17.3% of all households. In contrast, only 199 households (1.9%) fall into the $10,000 to $14,999 income bracket, making it the least populous group.
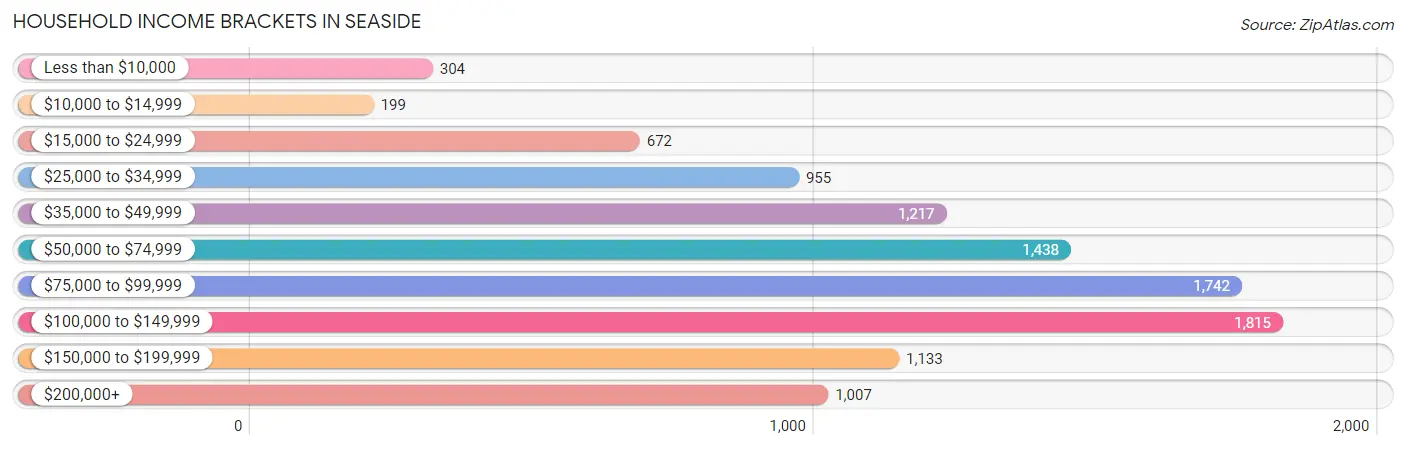
| Income Bracket | # Households | % Households |
| Less than $10,000 | 304 | 2.9% |
| $10,000 to $14,999 | 199 | 1.9% |
| $15,000 to $24,999 | 672 | 6.4% |
| $25,000 to $34,999 | 955 | 9.1% |
| $35,000 to $49,999 | 1,217 | 11.6% |
| $50,000 to $74,999 | 1,438 | 13.7% |
| $75,000 to $99,999 | 1,742 | 16.6% |
| $100,000 to $149,999 | 1,815 | 17.3% |
| $150,000 to $199,999 | 1,133 | 10.8% |
| $200,000+ | 1,007 | 9.6% |
Household Income by Householder Age in Seaside
The median household income in Seaside is $80,239, with the highest median household income of $102,381 found in the 45 to 64 years age bracket for the primary householder. A total of 3,496 households (33.3%) fall into this category. Meanwhile, the 15 to 24 years age bracket for the primary householder has the lowest median household income of $27,355, with 447 households (4.3%) in this group.
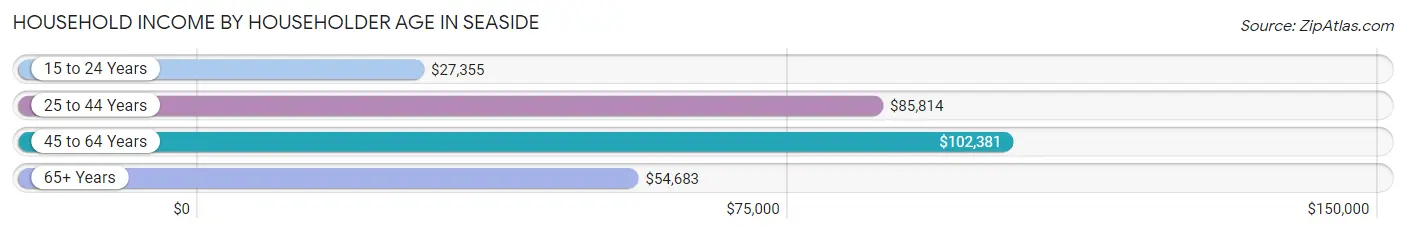
| Income Bracket | # Households | Median Income |
| 15 to 24 Years | 447 (4.3%) | $27,355 |
| 25 to 44 Years | 3,929 (37.4%) | $85,814 |
| 45 to 64 Years | 3,496 (33.3%) | $102,381 |
| 65+ Years | 2,621 (25.0%) | $54,683 |
| Total | 10,493 (100.0%) | $80,239 |
Poverty in Seaside
Income Below Poverty by Sex and Age in Seaside
With 13.5% poverty level for males and 12.5% for females among the residents of Seaside, 12 to 14 year old males and 16 and 17 year old females are the most vulnerable to poverty, with 169 males (40.1%) and 76 females (30.4%) in their respective age groups living below the poverty level.
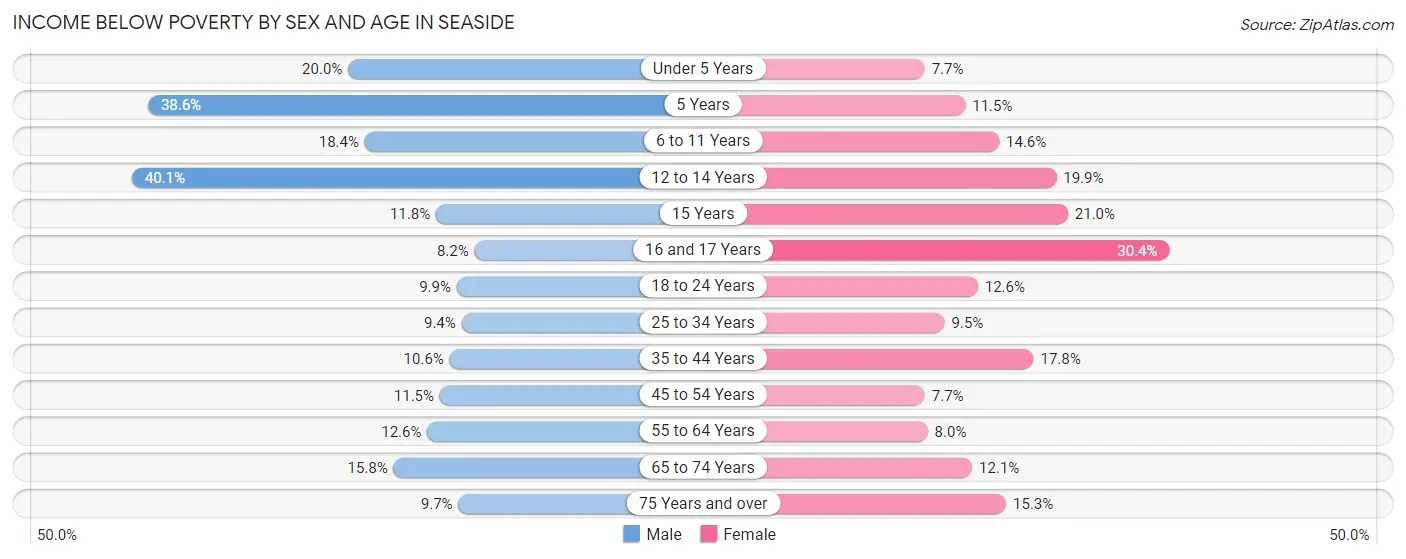
| Age Bracket | Male | Female |
| Under 5 Years | 233 (20.0%) | 51 (7.7%) |
| 5 Years | 64 (38.6%) | 29 (11.5%) |
| 6 to 11 Years | 246 (18.4%) | 170 (14.6%) |
| 12 to 14 Years | 169 (40.1%) | 128 (19.9%) |
| 15 Years | 26 (11.8%) | 60 (21.0%) |
| 16 and 17 Years | 45 (8.2%) | 76 (30.4%) |
| 18 to 24 Years | 132 (9.9%) | 210 (12.6%) |
| 25 to 34 Years | 266 (9.4%) | 242 (9.5%) |
| 35 to 44 Years | 210 (10.5%) | 348 (17.8%) |
| 45 to 54 Years | 206 (11.5%) | 135 (7.7%) |
| 55 to 64 Years | 222 (12.6%) | 148 (8.0%) |
| 65 to 74 Years | 219 (15.8%) | 150 (12.1%) |
| 75 Years and over | 67 (9.7%) | 168 (15.2%) |
| Total | 2,105 (13.5%) | 1,915 (12.5%) |
Income Above Poverty by Sex and Age in Seaside
According to the poverty statistics in Seaside, males aged 16 and 17 years and females aged under 5 years are the age groups that are most secure financially, with 91.8% of males and 92.3% of females in these age groups living above the poverty line.
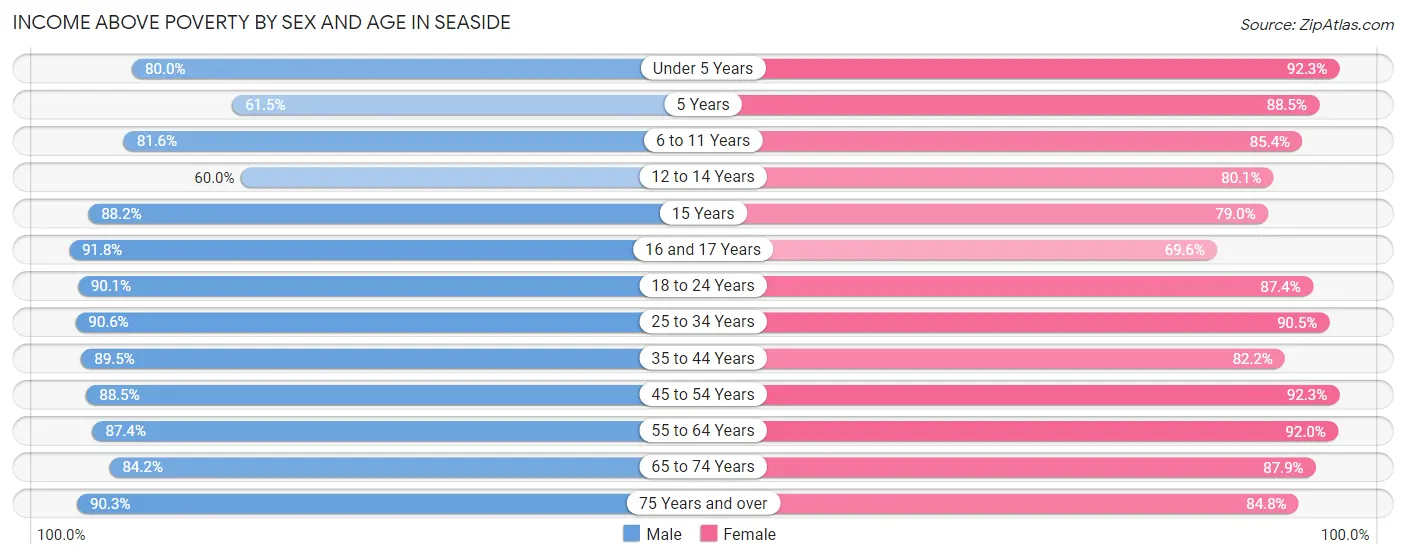
| Age Bracket | Male | Female |
| Under 5 Years | 934 (80.0%) | 611 (92.3%) |
| 5 Years | 102 (61.5%) | 224 (88.5%) |
| 6 to 11 Years | 1,089 (81.6%) | 994 (85.4%) |
| 12 to 14 Years | 253 (60.0%) | 515 (80.1%) |
| 15 Years | 194 (88.2%) | 226 (79.0%) |
| 16 and 17 Years | 501 (91.8%) | 174 (69.6%) |
| 18 to 24 Years | 1,203 (90.1%) | 1,454 (87.4%) |
| 25 to 34 Years | 2,553 (90.6%) | 2,294 (90.5%) |
| 35 to 44 Years | 1,780 (89.4%) | 1,607 (82.2%) |
| 45 to 54 Years | 1,592 (88.5%) | 1,615 (92.3%) |
| 55 to 64 Years | 1,536 (87.4%) | 1,710 (92.0%) |
| 65 to 74 Years | 1,171 (84.2%) | 1,090 (87.9%) |
| 75 Years and over | 621 (90.3%) | 934 (84.8%) |
| Total | 13,529 (86.5%) | 13,448 (87.5%) |
Income Below Poverty Among Married-Couple Families in Seaside
The poverty statistics for married-couple families in Seaside show that 7.1% or 357 of the total 4,995 families live below the poverty line. Families with 3 or 4 children have the highest poverty rate of 13.7%, comprising of 56 families. On the other hand, families with 1 or 2 children have the lowest poverty rate of 5.9%, which includes 118 families.
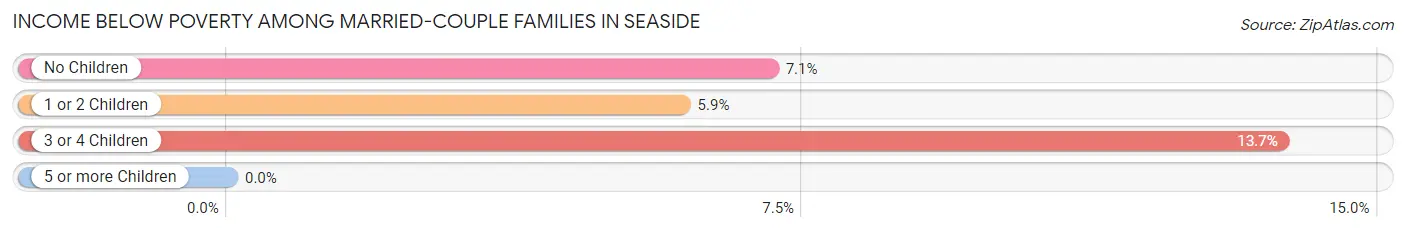
| Children | Above Poverty | Below Poverty |
| No Children | 2,409 (92.9%) | 183 (7.1%) |
| 1 or 2 Children | 1,877 (94.1%) | 118 (5.9%) |
| 3 or 4 Children | 352 (86.3%) | 56 (13.7%) |
| 5 or more Children | 0 (0.0%) | 0 (0.0%) |
| Total | 4,638 (92.8%) | 357 (7.1%) |
Income Below Poverty Among Single-Parent Households in Seaside
According to the poverty data in Seaside, 14.5% or 106 single-father households and 16.6% or 255 single-mother households are living below the poverty line. Among single-father households, those with 3 or 4 children have the highest poverty rate, with 46 households (76.7%) experiencing poverty. Likewise, among single-mother households, those with 3 or 4 children have the highest poverty rate, with 65 households (40.4%) falling below the poverty line.
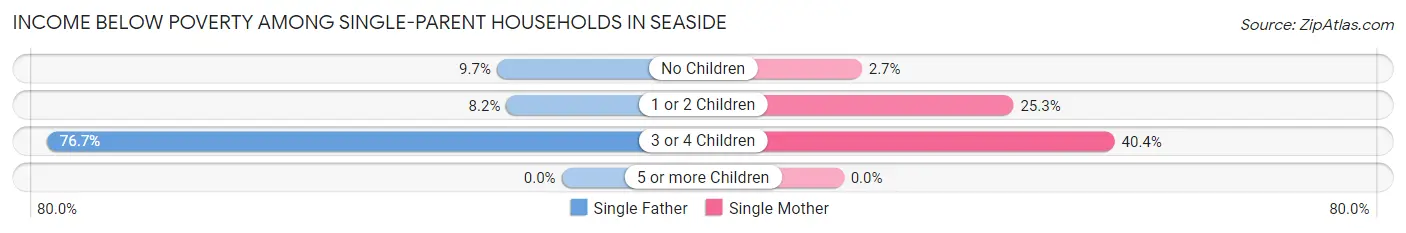
| Children | Single Father | Single Mother |
| No Children | 33 (9.7%) | 19 (2.7%) |
| 1 or 2 Children | 27 (8.2%) | 171 (25.3%) |
| 3 or 4 Children | 46 (76.7%) | 65 (40.4%) |
| 5 or more Children | 0 (0.0%) | 0 (0.0%) |
| Total | 106 (14.5%) | 255 (16.6%) |
Income Below Poverty Among Married-Couple vs Single-Parent Households in Seaside
The poverty data for Seaside shows that 357 of the married-couple family households (7.1%) and 361 of the single-parent households (15.9%) are living below the poverty level. Within the married-couple family households, those with 3 or 4 children have the highest poverty rate, with 56 households (13.7%) falling below the poverty line. Among the single-parent households, those with 3 or 4 children have the highest poverty rate, with 111 household (50.2%) living below poverty.
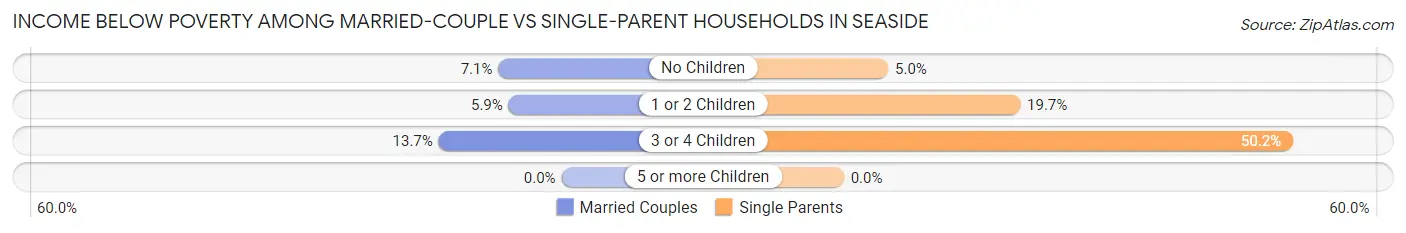
| Children | Married-Couple Families | Single-Parent Households |
| No Children | 183 (7.1%) | 52 (5.0%) |
| 1 or 2 Children | 118 (5.9%) | 198 (19.7%) |
| 3 or 4 Children | 56 (13.7%) | 111 (50.2%) |
| 5 or more Children | 0 (0.0%) | 0 (0.0%) |
| Total | 357 (7.1%) | 361 (15.9%) |
Race in Seaside
The most populous races in Seaside are White / Caucasian (14,536 | 45.0%), Hispanic or Latino (14,402 | 44.6%), and Some other Race (7,312 | 22.6%).
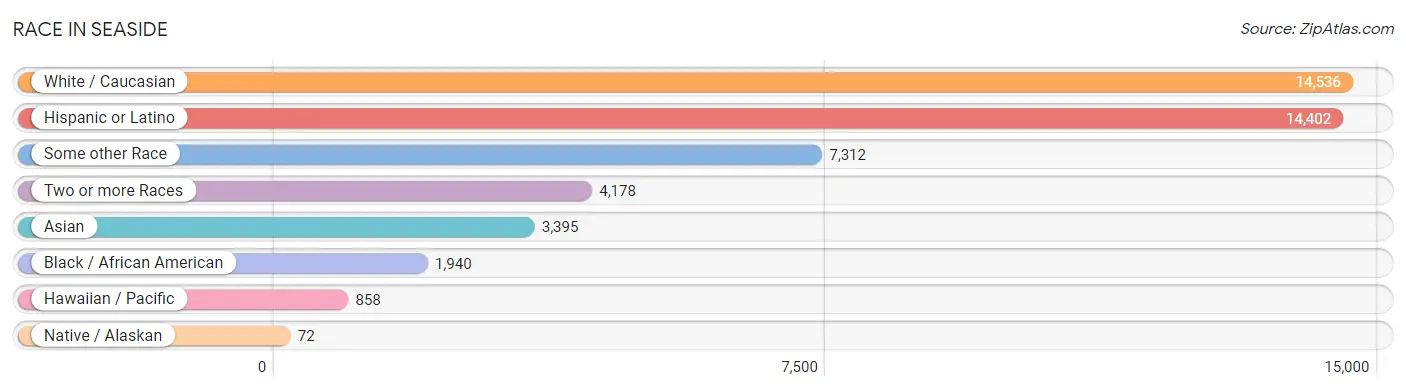
| Race | # Population | % Population |
| Asian | 3,395 | 10.5% |
| Black / African American | 1,940 | 6.0% |
| Hawaiian / Pacific | 858 | 2.7% |
| Hispanic or Latino | 14,402 | 44.6% |
| Native / Alaskan | 72 | 0.2% |
| White / Caucasian | 14,536 | 45.0% |
| Two or more Races | 4,178 | 12.9% |
| Some other Race | 7,312 | 22.6% |
| Total | 32,291 | 100.0% |
Ancestry in Seaside
The most populous ancestries reported in Seaside are Mexican (12,037 | 37.3%), German (2,154 | 6.7%), English (2,111 | 6.5%), Korean (2,039 | 6.3%), and Irish (1,652 | 5.1%), together accounting for 61.9% of all Seaside residents.
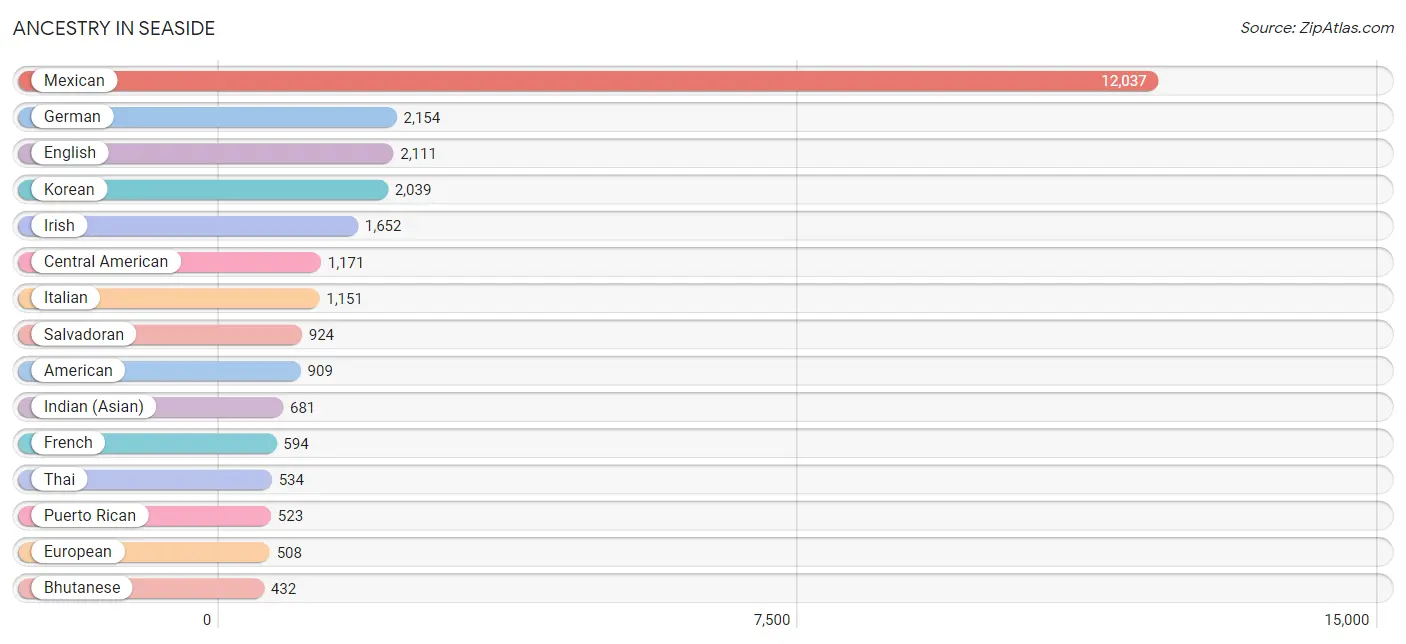
| Ancestry | # Population | % Population |
| African | 65 | 0.2% |
| American | 909 | 2.8% |
| Apache | 10 | 0.0% |
| Arab | 25 | 0.1% |
| Armenian | 93 | 0.3% |
| Australian | 26 | 0.1% |
| Austrian | 14 | 0.0% |
| Basque | 15 | 0.1% |
| Bhutanese | 432 | 1.3% |
| Blackfeet | 14 | 0.0% |
| Brazilian | 19 | 0.1% |
| British | 191 | 0.6% |
| Bulgarian | 14 | 0.0% |
| Burmese | 284 | 0.9% |
| Canadian | 11 | 0.0% |
| Celtic | 6 | 0.0% |
| Central American | 1,171 | 3.6% |
| Central American Indian | 66 | 0.2% |
| Cherokee | 159 | 0.5% |
| Chilean | 46 | 0.1% |
| Choctaw | 45 | 0.1% |
| Colombian | 71 | 0.2% |
| Creek | 8 | 0.0% |
| Croatian | 16 | 0.1% |
| Czech | 59 | 0.2% |
| Danish | 93 | 0.3% |
| Dutch | 237 | 0.7% |
| Eastern European | 15 | 0.1% |
| Egyptian | 14 | 0.0% |
| English | 2,111 | 6.5% |
| Estonian | 19 | 0.1% |
| Ethiopian | 20 | 0.1% |
| European | 508 | 1.6% |
| Filipino | 29 | 0.1% |
| Finnish | 9 | 0.0% |
| French | 594 | 1.8% |
| French American Indian | 30 | 0.1% |
| French Canadian | 67 | 0.2% |
| German | 2,154 | 6.7% |
| Greek | 39 | 0.1% |
| Guamanian / Chamorro | 325 | 1.0% |
| Guatemalan | 185 | 0.6% |
| Honduran | 29 | 0.1% |
| Hungarian | 118 | 0.4% |
| Indian (Asian) | 681 | 2.1% |
| Indonesian | 24 | 0.1% |
| Iranian | 35 | 0.1% |
| Irish | 1,652 | 5.1% |
| Italian | 1,151 | 3.6% |
| Jamaican | 16 | 0.1% |
| Korean | 2,039 | 6.3% |
| Lithuanian | 6 | 0.0% |
| Macedonian | 9 | 0.0% |
| Mexican | 12,037 | 37.3% |
| Mexican American Indian | 146 | 0.4% |
| Native Hawaiian | 130 | 0.4% |
| Navajo | 17 | 0.1% |
| Nicaraguan | 10 | 0.0% |
| Nigerian | 20 | 0.1% |
| Northern European | 5 | 0.0% |
| Norwegian | 147 | 0.5% |
| Pakistani | 157 | 0.5% |
| Panamanian | 23 | 0.1% |
| Pennsylvania German | 7 | 0.0% |
| Peruvian | 269 | 0.8% |
| Polish | 190 | 0.6% |
| Portuguese | 333 | 1.0% |
| Pueblo | 21 | 0.1% |
| Puerto Rican | 523 | 1.6% |
| Russian | 142 | 0.4% |
| Salvadoran | 924 | 2.9% |
| Samoan | 130 | 0.4% |
| Scandinavian | 50 | 0.2% |
| Scotch-Irish | 144 | 0.4% |
| Scottish | 263 | 0.8% |
| Serbian | 122 | 0.4% |
| Slavic | 8 | 0.0% |
| Slovak | 9 | 0.0% |
| South American | 394 | 1.2% |
| Spaniard | 53 | 0.2% |
| Spanish | 133 | 0.4% |
| Sri Lankan | 407 | 1.3% |
| Subsaharan African | 110 | 0.3% |
| Swedish | 318 | 1.0% |
| Swiss | 49 | 0.2% |
| Thai | 534 | 1.7% |
| Tongan | 107 | 0.3% |
| Ukrainian | 20 | 0.1% |
| Venezuelan | 8 | 0.0% |
| Welsh | 142 | 0.4% |
| West Indian | 34 | 0.1% | View All 91 Rows |
Immigrants in Seaside
The most numerous immigrant groups reported in Seaside came from Latin America (5,490 | 17.0%), Central America (5,221 | 16.2%), Mexico (4,113 | 12.7%), Asia (2,183 | 6.8%), and South Eastern Asia (1,444 | 4.5%), together accounting for 57.1% of all Seaside residents.
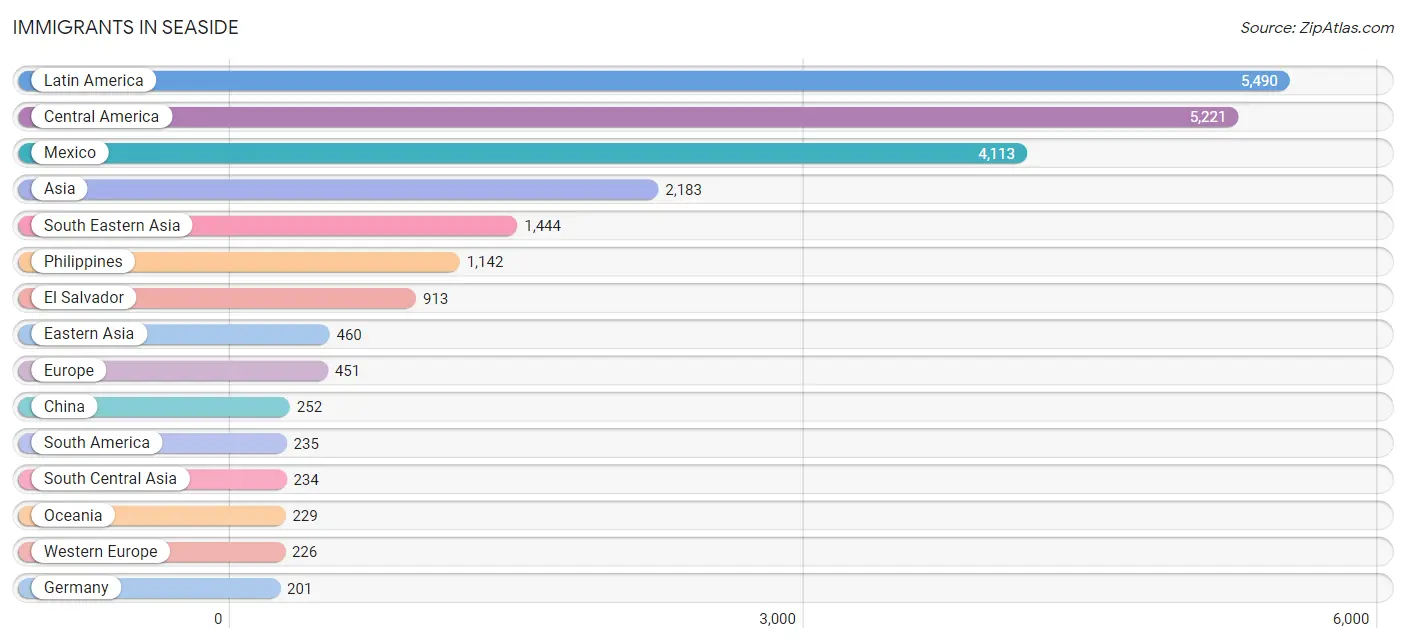
| Immigration Origin | # Population | % Population |
| Africa | 34 | 0.1% |
| Asia | 2,183 | 6.8% |
| Australia | 29 | 0.1% |
| Azores | 29 | 0.1% |
| Brazil | 6 | 0.0% |
| Canada | 68 | 0.2% |
| Caribbean | 34 | 0.1% |
| Central America | 5,221 | 16.2% |
| Chile | 62 | 0.2% |
| China | 252 | 0.8% |
| Colombia | 62 | 0.2% |
| Czechoslovakia | 8 | 0.0% |
| Dominica | 34 | 0.1% |
| Eastern Africa | 25 | 0.1% |
| Eastern Asia | 460 | 1.4% |
| Eastern Europe | 45 | 0.1% |
| Egypt | 9 | 0.0% |
| El Salvador | 913 | 2.8% |
| England | 88 | 0.3% |
| Europe | 451 | 1.4% |
| Fiji | 176 | 0.5% |
| France | 17 | 0.1% |
| Germany | 201 | 0.6% |
| Guatemala | 152 | 0.5% |
| Guyana | 31 | 0.1% |
| Honduras | 29 | 0.1% |
| Hungary | 10 | 0.0% |
| India | 100 | 0.3% |
| Indonesia | 14 | 0.0% |
| Iran | 23 | 0.1% |
| Iraq | 16 | 0.1% |
| Italy | 19 | 0.1% |
| Japan | 121 | 0.4% |
| Kenya | 12 | 0.0% |
| Korea | 87 | 0.3% |
| Latin America | 5,490 | 17.0% |
| Mexico | 4,113 | 12.7% |
| Moldova | 22 | 0.1% |
| Nepal | 87 | 0.3% |
| Netherlands | 8 | 0.0% |
| Northern Africa | 9 | 0.0% |
| Northern Europe | 92 | 0.3% |
| Oceania | 229 | 0.7% |
| Panama | 14 | 0.0% |
| Peru | 66 | 0.2% |
| Philippines | 1,142 | 3.5% |
| Portugal | 46 | 0.1% |
| South America | 235 | 0.7% |
| South Central Asia | 234 | 0.7% |
| South Eastern Asia | 1,444 | 4.5% |
| Southern Europe | 88 | 0.3% |
| Spain | 23 | 0.1% |
| Syria | 9 | 0.0% |
| Taiwan | 37 | 0.1% |
| Thailand | 163 | 0.5% |
| Ukraine | 5 | 0.0% |
| Uzbekistan | 24 | 0.1% |
| Venezuela | 8 | 0.0% |
| Vietnam | 99 | 0.3% |
| Western Asia | 34 | 0.1% |
| Western Europe | 226 | 0.7% | View All 61 Rows |
Sex and Age in Seaside
Sex and Age in Seaside
The most populous age groups in Seaside are 25 to 29 Years (1,524 | 9.5%) for men and 15 to 19 Years (1,516 | 9.3%) for women.
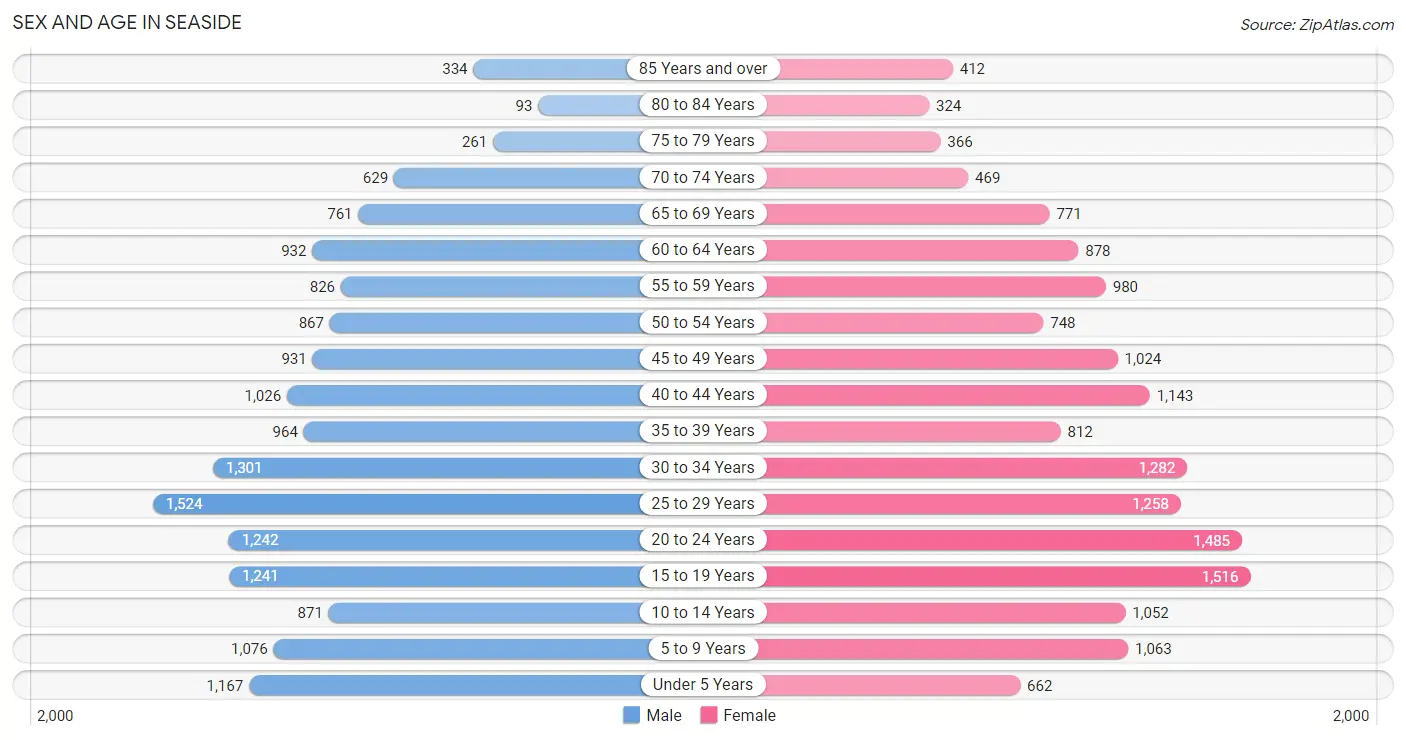
| Age Bracket | Male | Female |
| Under 5 Years | 1,167 (7.3%) | 662 (4.1%) |
| 5 to 9 Years | 1,076 (6.7%) | 1,063 (6.5%) |
| 10 to 14 Years | 871 (5.4%) | 1,052 (6.5%) |
| 15 to 19 Years | 1,241 (7.7%) | 1,516 (9.3%) |
| 20 to 24 Years | 1,242 (7.7%) | 1,485 (9.1%) |
| 25 to 29 Years | 1,524 (9.5%) | 1,258 (7.7%) |
| 30 to 34 Years | 1,301 (8.1%) | 1,282 (7.9%) |
| 35 to 39 Years | 964 (6.0%) | 812 (5.0%) |
| 40 to 44 Years | 1,026 (6.4%) | 1,143 (7.0%) |
| 45 to 49 Years | 931 (5.8%) | 1,024 (6.3%) |
| 50 to 54 Years | 867 (5.4%) | 748 (4.6%) |
| 55 to 59 Years | 826 (5.1%) | 980 (6.0%) |
| 60 to 64 Years | 932 (5.8%) | 878 (5.4%) |
| 65 to 69 Years | 761 (4.7%) | 771 (4.8%) |
| 70 to 74 Years | 629 (3.9%) | 469 (2.9%) |
| 75 to 79 Years | 261 (1.6%) | 366 (2.2%) |
| 80 to 84 Years | 93 (0.6%) | 324 (2.0%) |
| 85 Years and over | 334 (2.1%) | 412 (2.5%) |
| Total | 16,046 (100.0%) | 16,245 (100.0%) |
Families and Households in Seaside
Median Family Size in Seaside
The median family size in Seaside is 3.39 persons per family, with single male/father families (730 | 10.1%) accounting for the largest median family size of 3.63 persons per family. On the other hand, married-couple families (4,995 | 68.7%) represent the smallest median family size with 3.36 persons per family.
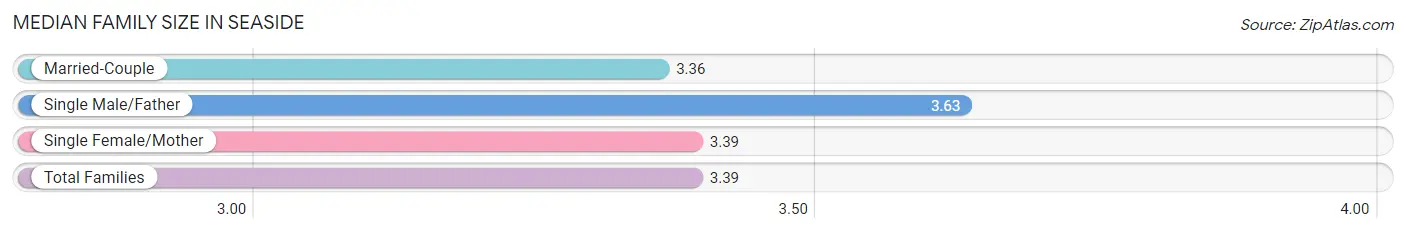
| Family Type | # Families | Family Size |
| Married-Couple | 4,995 (68.7%) | 3.36 |
| Single Male/Father | 730 (10.1%) | 3.63 |
| Single Female/Mother | 1,541 (21.2%) | 3.39 |
| Total Families | 7,266 (100.0%) | 3.39 |
Median Household Size in Seaside
The median household size in Seaside is 2.94 persons per household, with single male/father households (730 | 7.0%) accounting for the largest median household size of 4.05 persons per household. non-family households (3,227 | 30.7%) represent the smallest median household size with 1.48 persons per household.
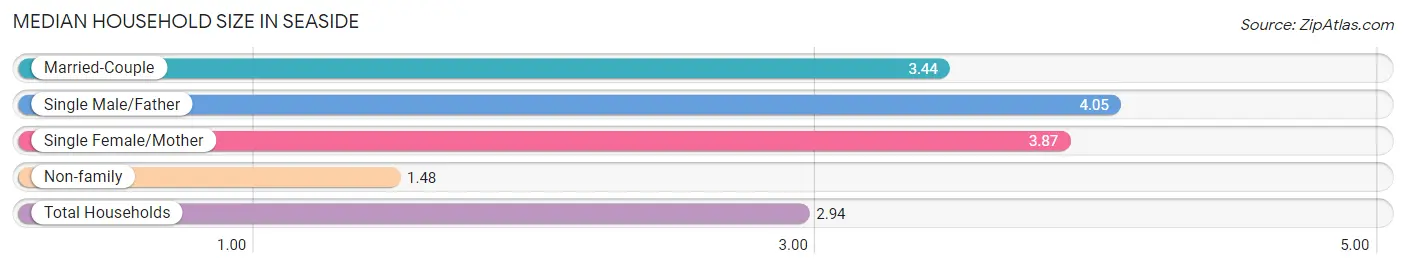
| Household Type | # Households | Household Size |
| Married-Couple | 4,995 (47.6%) | 3.44 |
| Single Male/Father | 730 (7.0%) | 4.05 |
| Single Female/Mother | 1,541 (14.7%) | 3.87 |
| Non-family | 3,227 (30.7%) | 1.48 |
| Total Households | 10,493 (100.0%) | 2.94 |
Household Size by Marriage Status in Seaside
Out of a total of 10,493 households in Seaside, 7,266 (69.3%) are family households, while 3,227 (30.7%) are nonfamily households. The most numerous type of family households are 2-person households, comprising 2,345, and the most common type of nonfamily households are 1-person households, comprising 2,210.
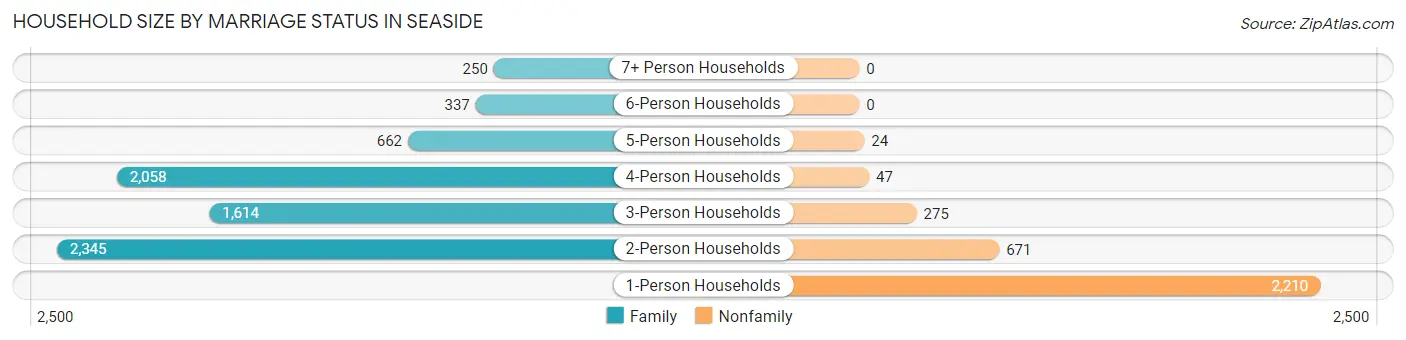
| Household Size | Family Households | Nonfamily Households |
| 1-Person Households | - | 2,210 (21.1%) |
| 2-Person Households | 2,345 (22.4%) | 671 (6.4%) |
| 3-Person Households | 1,614 (15.4%) | 275 (2.6%) |
| 4-Person Households | 2,058 (19.6%) | 47 (0.4%) |
| 5-Person Households | 662 (6.3%) | 24 (0.2%) |
| 6-Person Households | 337 (3.2%) | 0 (0.0%) |
| 7+ Person Households | 250 (2.4%) | 0 (0.0%) |
| Total | 7,266 (69.3%) | 3,227 (30.7%) |
Female Fertility in Seaside
Fertility by Age in Seaside
Average fertility rate in Seaside is 40.0 births per 1,000 women. Women in the age bracket of 20 to 34 years have the highest fertility rate with 61.0 births per 1,000 women. Women in the age bracket of 20 to 34 years acount for 70.7% of all women with births.
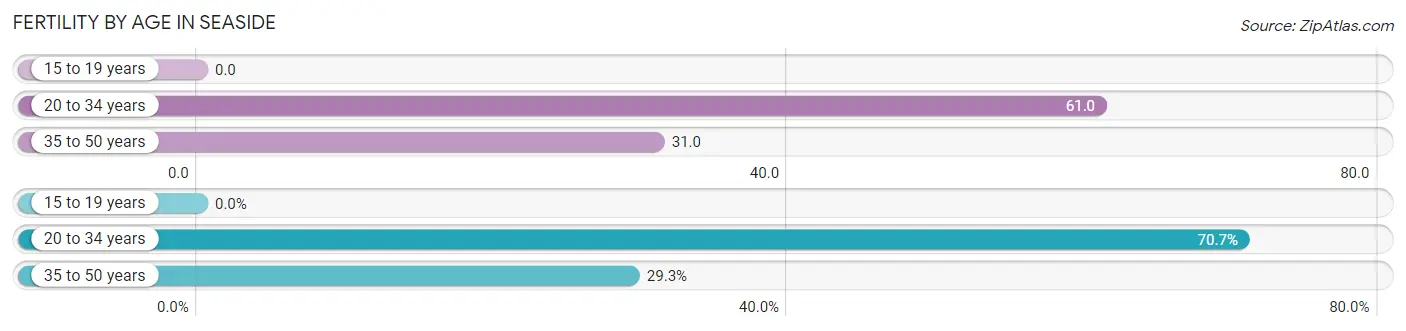
| Age Bracket | Women with Births | Births / 1,000 Women |
| 15 to 19 years | 0 (0.0%) | 0.0 |
| 20 to 34 years | 246 (70.7%) | 61.0 |
| 35 to 50 years | 102 (29.3%) | 31.0 |
| Total | 348 (100.0%) | 40.0 |
Fertility by Age by Marriage Status in Seaside
72.4% of women with births (348) in Seaside are married. The highest percentage of unmarried women with births falls into 20 to 34 years age bracket with 39.0% of them unmarried at the time of birth, while the lowest percentage of unmarried women with births belong to 35 to 50 years age bracket with 0.0% of them unmarried.
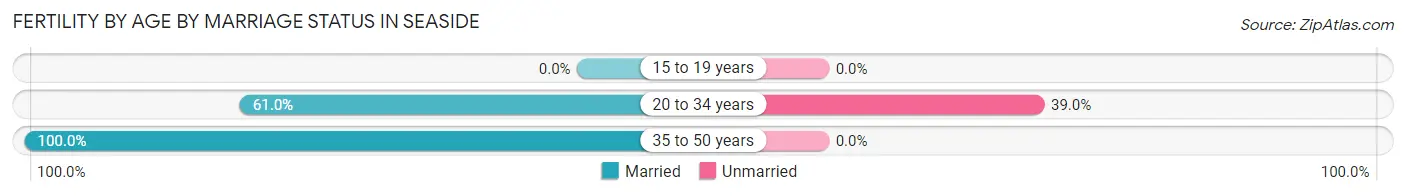
| Age Bracket | Married | Unmarried |
| 15 to 19 years | 0 (0.0%) | 0 (0.0%) |
| 20 to 34 years | 150 (61.0%) | 96 (39.0%) |
| 35 to 50 years | 102 (100.0%) | 0 (0.0%) |
| Total | 252 (72.4%) | 96 (27.6%) |
Fertility by Education in Seaside
Average fertility rate in Seaside is 40.0 births per 1,000 women. Women with the education attainment of graduate degree have the highest fertility rate of 79.0 births per 1,000 women, while women with the education attainment of less than high school have the lowest fertility at 7.0 births per 1,000 women. Women with the education attainment of college or associate's degree represent 59.5% of all women with births.
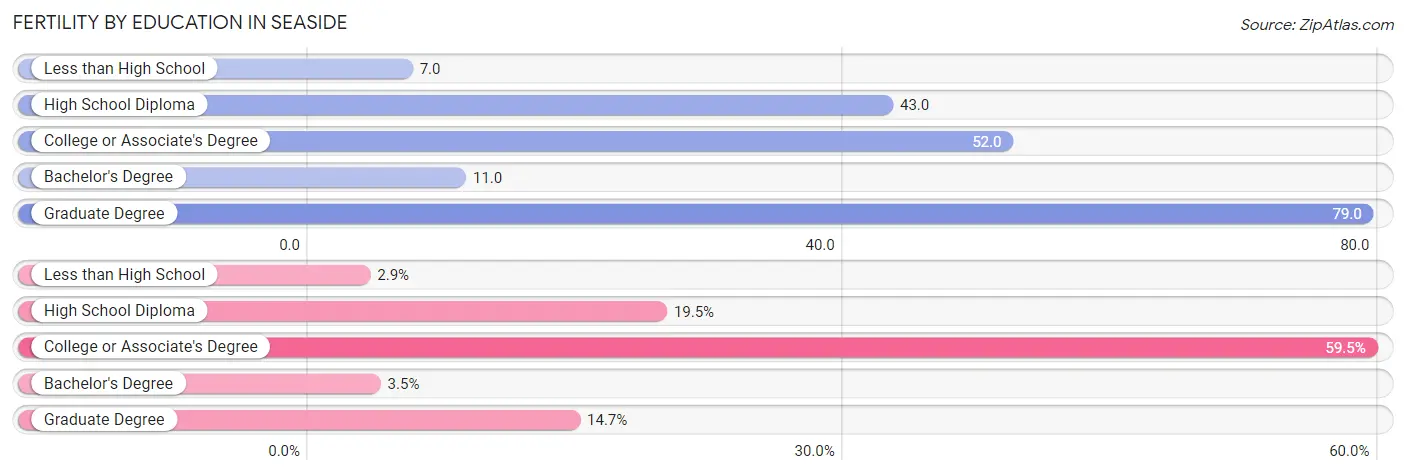
| Educational Attainment | Women with Births | Births / 1,000 Women |
| Less than High School | 10 (2.9%) | 7.0 |
| High School Diploma | 68 (19.5%) | 43.0 |
| College or Associate's Degree | 207 (59.5%) | 52.0 |
| Bachelor's Degree | 12 (3.5%) | 11.0 |
| Graduate Degree | 51 (14.7%) | 79.0 |
| Total | 348 (100.0%) | 40.0 |
Fertility by Education by Marriage Status in Seaside
27.6% of women with births in Seaside are unmarried. Women with the educational attainment of bachelor's degree are most likely to be married with 100.0% of them married at childbirth, while women with the educational attainment of less than high school are least likely to be married with 100.0% of them unmarried at childbirth.
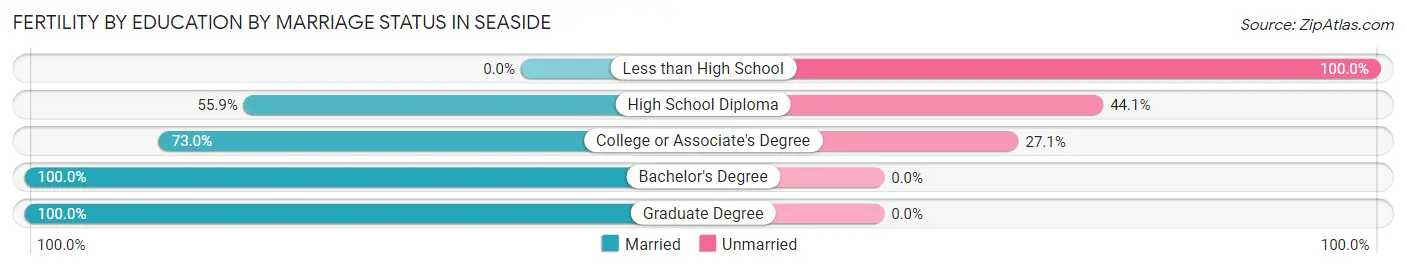
| Educational Attainment | Married | Unmarried |
| Less than High School | 0 (0.0%) | 10 (100.0%) |
| High School Diploma | 38 (55.9%) | 30 (44.1%) |
| College or Associate's Degree | 151 (73.0%) | 56 (27.1%) |
| Bachelor's Degree | 12 (100.0%) | 0 (0.0%) |
| Graduate Degree | 51 (100.0%) | 0 (0.0%) |
| Total | 252 (72.4%) | 96 (27.6%) |
Employment Characteristics in Seaside
Employment by Class of Employer in Seaside
Among the 15,304 employed individuals in Seaside, private company employees (9,796 | 64.0%), federal government employees (1,785 | 11.7%), and self-employed (not incorporated) (1,239 | 8.1%) make up the most common classes of employment.
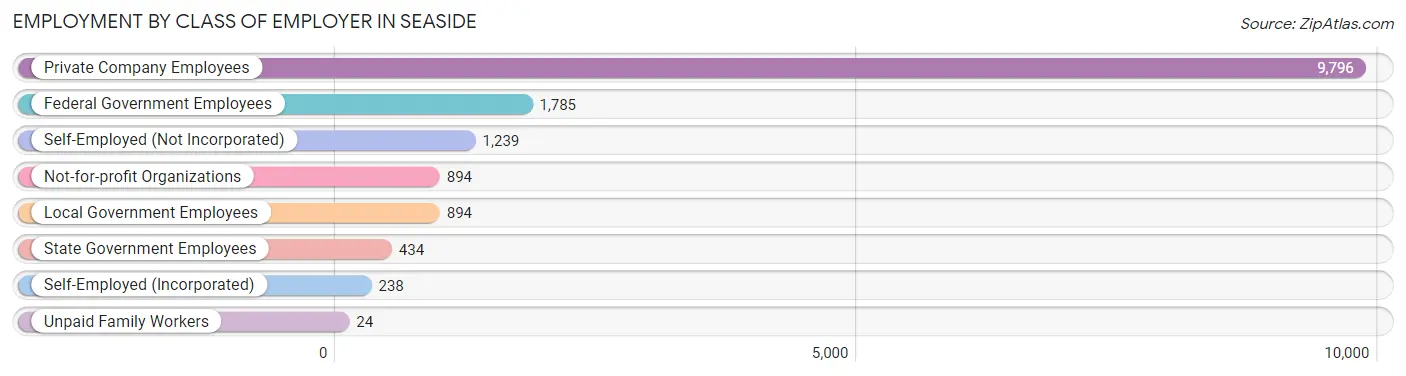
| Employer Class | # Employees | % Employees |
| Private Company Employees | 9,796 | 64.0% |
| Self-Employed (Incorporated) | 238 | 1.6% |
| Self-Employed (Not Incorporated) | 1,239 | 8.1% |
| Not-for-profit Organizations | 894 | 5.8% |
| Local Government Employees | 894 | 5.8% |
| State Government Employees | 434 | 2.8% |
| Federal Government Employees | 1,785 | 11.7% |
| Unpaid Family Workers | 24 | 0.2% |
| Total | 15,304 | 100.0% |
Employment Status by Age in Seaside
According to the labor force statistics for Seaside, out of the total population over 16 years of age (25,894), 64.4% or 16,676 individuals are in the labor force, with 7.1% or 1,184 of them unemployed. The age group with the highest labor force participation rate is 25 to 29 years, with 85.0% or 2,365 individuals in the labor force. Within the labor force, the 16 to 19 years age range has the highest percentage of unemployed individuals, with 18.6% or 152 of them being unemployed.
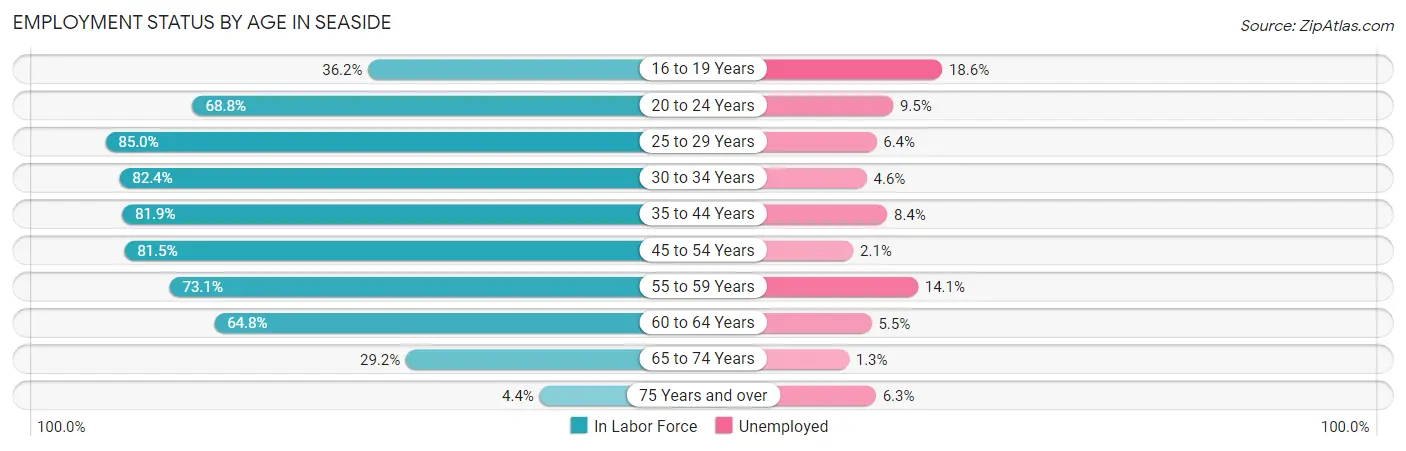
| Age Bracket | In Labor Force | Unemployed |
| 16 to 19 Years | 815 (36.2%) | 152 (18.6%) |
| 20 to 24 Years | 1,876 (68.8%) | 178 (9.5%) |
| 25 to 29 Years | 2,365 (85.0%) | 151 (6.4%) |
| 30 to 34 Years | 2,128 (82.4%) | 98 (4.6%) |
| 35 to 44 Years | 3,231 (81.9%) | 271 (8.4%) |
| 45 to 54 Years | 2,910 (81.5%) | 61 (2.1%) |
| 55 to 59 Years | 1,320 (73.1%) | 186 (14.1%) |
| 60 to 64 Years | 1,173 (64.8%) | 65 (5.5%) |
| 65 to 74 Years | 768 (29.2%) | 10 (1.3%) |
| 75 Years and over | 79 (4.4%) | 5 (6.3%) |
| Total | 16,676 (64.4%) | 1,184 (7.1%) |
Employment Status by Educational Attainment in Seaside
According to labor force statistics for Seaside, 79.6% of individuals (13,131) out of the total population between 25 and 64 years of age (16,496) are in the labor force, with 6.4% or 840 of them being unemployed. The group with the highest labor force participation rate are those with the educational attainment of bachelor's degree or higher, with 88.4% or 3,729 individuals in the labor force. Within the labor force, individuals with college / associate degree education have the highest percentage of unemployment, with 7.8% or 364 of them being unemployed.
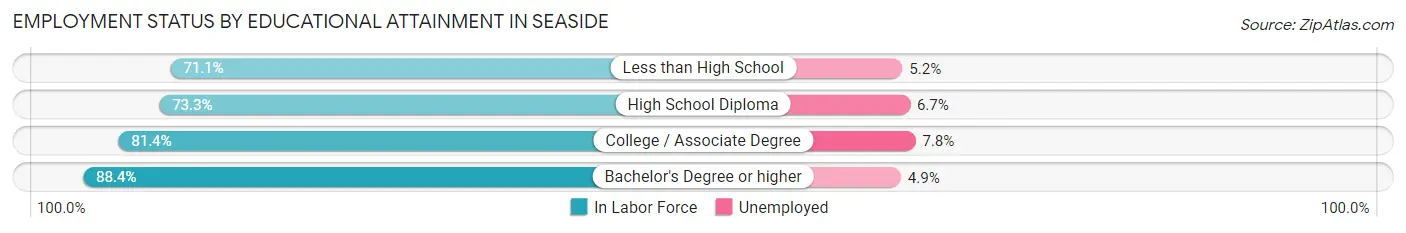
| Educational Attainment | In Labor Force | Unemployed |
| Less than High School | 2,070 (71.1%) | 151 (5.2%) |
| High School Diploma | 2,662 (73.3%) | 243 (6.7%) |
| College / Associate Degree | 4,668 (81.4%) | 447 (7.8%) |
| Bachelor's Degree or higher | 3,729 (88.4%) | 207 (4.9%) |
| Total | 13,131 (79.6%) | 1,056 (6.4%) |
Employment Occupations by Sex in Seaside
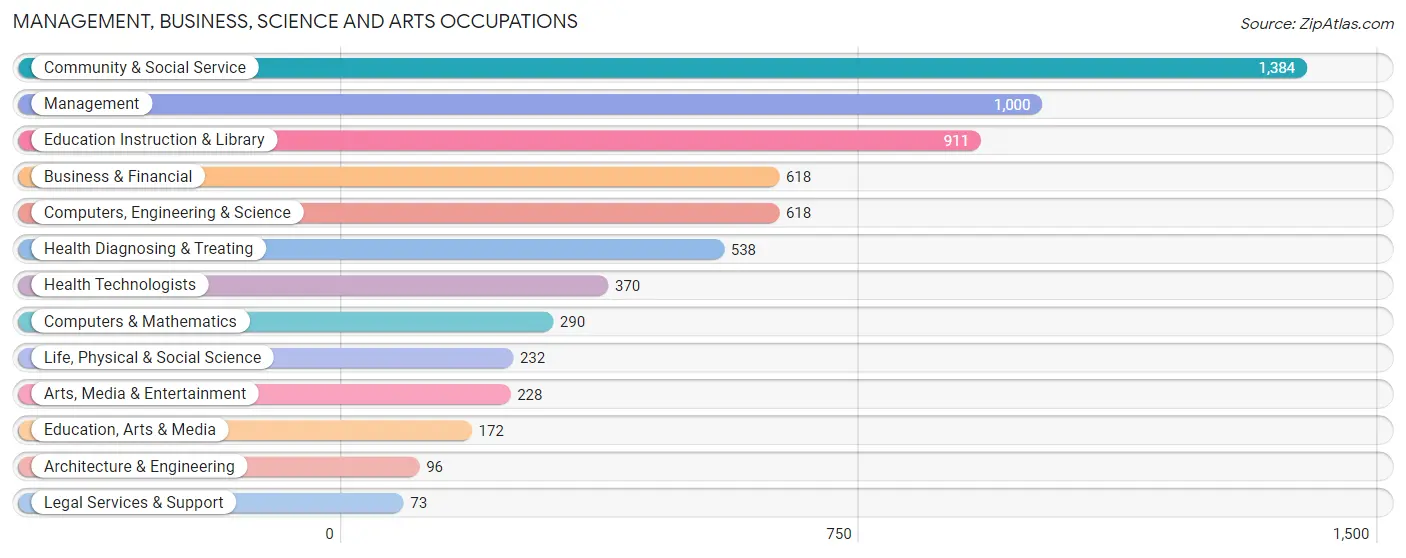
Management, Business, Science and Arts Occupations
The most common Management, Business, Science and Arts occupations in Seaside are Community & Social Service (1,384 | 9.4%), Management (1,000 | 6.8%), Education Instruction & Library (911 | 6.2%), Business & Financial (618 | 4.2%), and Computers, Engineering & Science (618 | 4.2%).
Management, Business, Science and Arts Occupations by Sex
Within the Management, Business, Science and Arts occupations in Seaside, the most male-oriented occupations are Architecture & Engineering (100.0%), Computers & Mathematics (85.2%), and Computers, Engineering & Science (76.5%), while the most female-oriented occupations are Health Diagnosing & Treating (86.6%), Health Technologists (85.4%), and Legal Services & Support (84.9%).
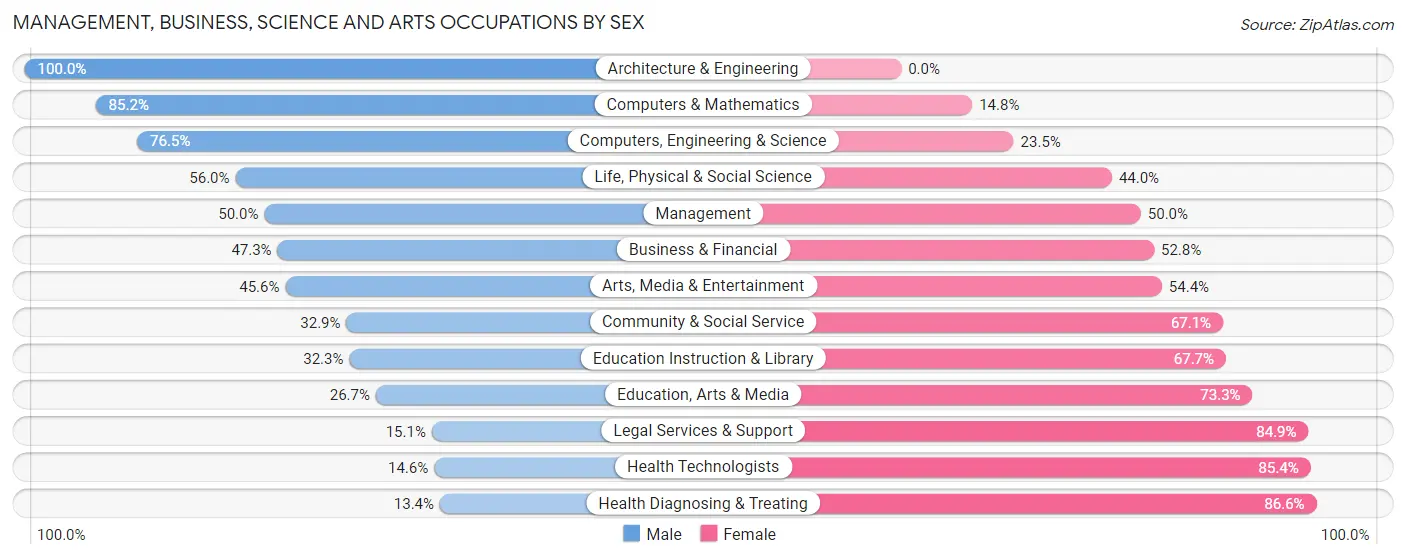
| Occupation | Male | Female |
| Management | 500 (50.0%) | 500 (50.0%) |
| Business & Financial | 292 (47.2%) | 326 (52.7%) |
| Computers, Engineering & Science | 473 (76.5%) | 145 (23.5%) |
| Computers & Mathematics | 247 (85.2%) | 43 (14.8%) |
| Architecture & Engineering | 96 (100.0%) | 0 (0.0%) |
| Life, Physical & Social Science | 130 (56.0%) | 102 (44.0%) |
| Community & Social Service | 455 (32.9%) | 929 (67.1%) |
| Education, Arts & Media | 46 (26.7%) | 126 (73.3%) |
| Legal Services & Support | 11 (15.1%) | 62 (84.9%) |
| Education Instruction & Library | 294 (32.3%) | 617 (67.7%) |
| Arts, Media & Entertainment | 104 (45.6%) | 124 (54.4%) |
| Health Diagnosing & Treating | 72 (13.4%) | 466 (86.6%) |
| Health Technologists | 54 (14.6%) | 316 (85.4%) |
| Total (Category) | 1,792 (43.1%) | 2,366 (56.9%) |
| Total (Overall) | 7,718 (52.4%) | 7,001 (47.6%) |
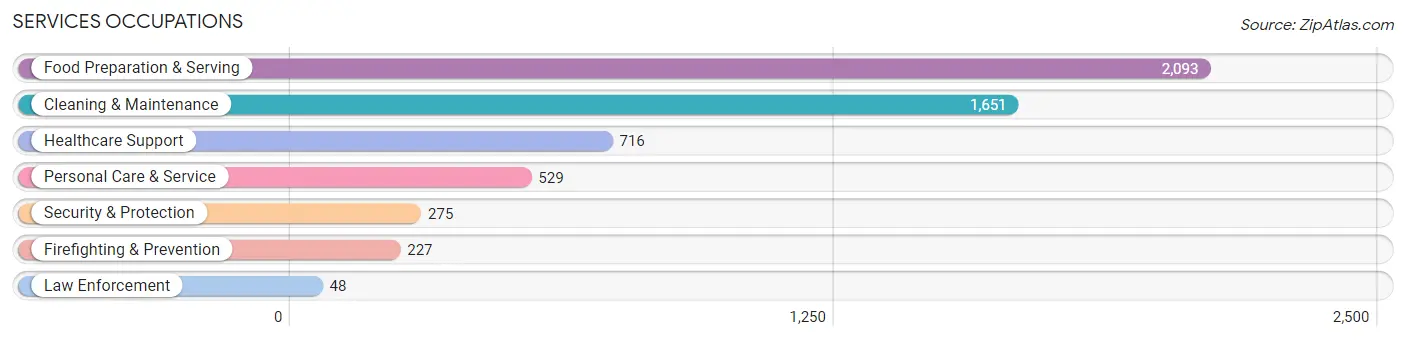
Services Occupations
The most common Services occupations in Seaside are Food Preparation & Serving (2,093 | 14.2%), Cleaning & Maintenance (1,651 | 11.2%), Healthcare Support (716 | 4.9%), Personal Care & Service (529 | 3.6%), and Security & Protection (275 | 1.9%).
Services Occupations by Sex
Within the Services occupations in Seaside, the most male-oriented occupations are Law Enforcement (100.0%), Security & Protection (84.4%), and Firefighting & Prevention (81.1%), while the most female-oriented occupations are Personal Care & Service (76.9%), Healthcare Support (54.6%), and Cleaning & Maintenance (51.7%).
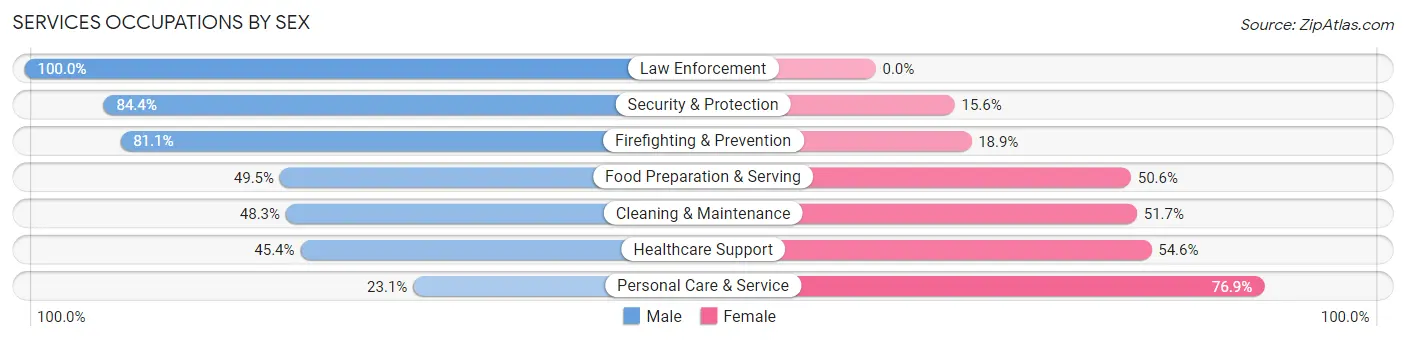
| Occupation | Male | Female |
| Healthcare Support | 325 (45.4%) | 391 (54.6%) |
| Security & Protection | 232 (84.4%) | 43 (15.6%) |
| Firefighting & Prevention | 184 (81.1%) | 43 (18.9%) |
| Law Enforcement | 48 (100.0%) | 0 (0.0%) |
| Food Preparation & Serving | 1,035 (49.4%) | 1,058 (50.5%) |
| Cleaning & Maintenance | 797 (48.3%) | 854 (51.7%) |
| Personal Care & Service | 122 (23.1%) | 407 (76.9%) |
| Total (Category) | 2,511 (47.7%) | 2,753 (52.3%) |
| Total (Overall) | 7,718 (52.4%) | 7,001 (47.6%) |
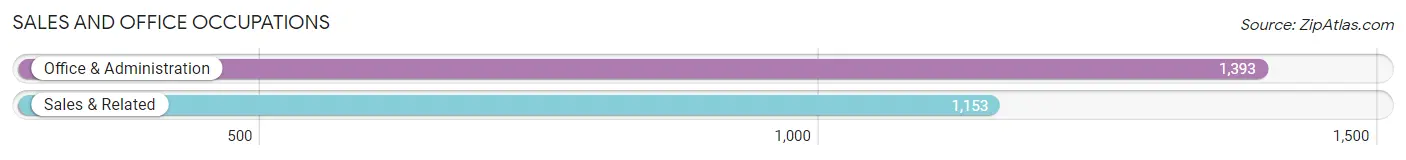
Sales and Office Occupations
The most common Sales and Office occupations in Seaside are Office & Administration (1,393 | 9.5%), and Sales & Related (1,153 | 7.8%).
Sales and Office Occupations by Sex
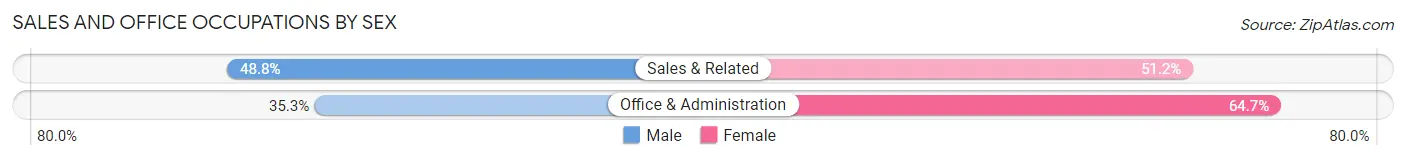
| Occupation | Male | Female |
| Sales & Related | 563 (48.8%) | 590 (51.2%) |
| Office & Administration | 492 (35.3%) | 901 (64.7%) |
| Total (Category) | 1,055 (41.4%) | 1,491 (58.6%) |
| Total (Overall) | 7,718 (52.4%) | 7,001 (47.6%) |
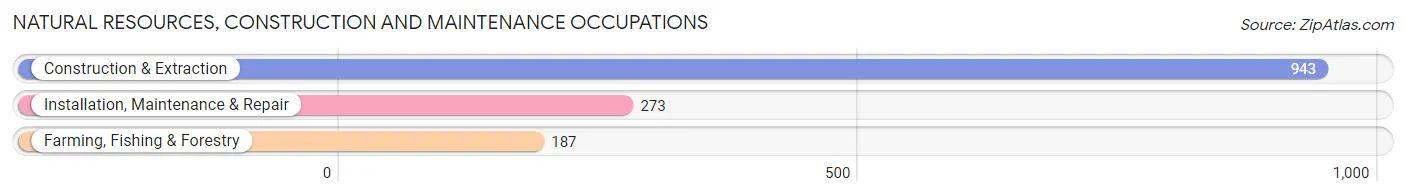
Natural Resources, Construction and Maintenance Occupations
The most common Natural Resources, Construction and Maintenance occupations in Seaside are Construction & Extraction (943 | 6.4%), Installation, Maintenance & Repair (273 | 1.8%), and Farming, Fishing & Forestry (187 | 1.3%).
Natural Resources, Construction and Maintenance Occupations by Sex
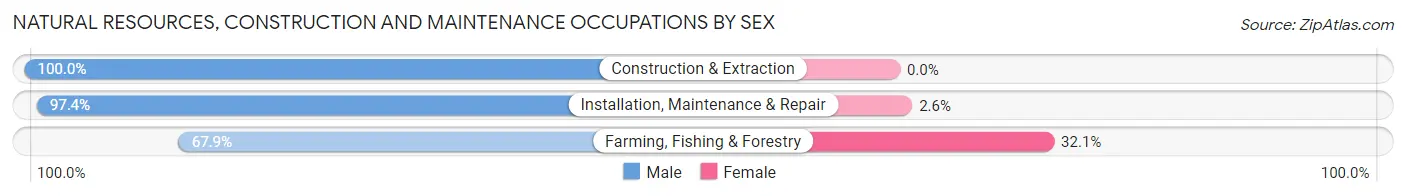
| Occupation | Male | Female |
| Farming, Fishing & Forestry | 127 (67.9%) | 60 (32.1%) |
| Construction & Extraction | 943 (100.0%) | 0 (0.0%) |
| Installation, Maintenance & Repair | 266 (97.4%) | 7 (2.6%) |
| Total (Category) | 1,336 (95.2%) | 67 (4.8%) |
| Total (Overall) | 7,718 (52.4%) | 7,001 (47.6%) |
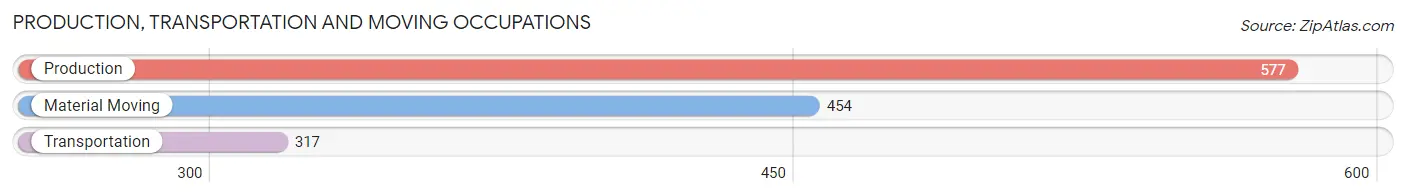
Production, Transportation and Moving Occupations
The most common Production, Transportation and Moving occupations in Seaside are Production (577 | 3.9%), Material Moving (454 | 3.1%), and Transportation (317 | 2.1%).
Production, Transportation and Moving Occupations by Sex
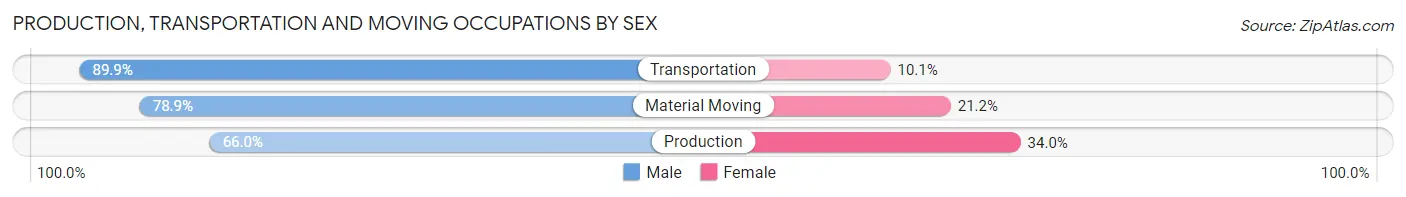
| Occupation | Male | Female |
| Production | 381 (66.0%) | 196 (34.0%) |
| Transportation | 285 (89.9%) | 32 (10.1%) |
| Material Moving | 358 (78.8%) | 96 (21.1%) |
| Total (Category) | 1,024 (76.0%) | 324 (24.0%) |
| Total (Overall) | 7,718 (52.4%) | 7,001 (47.6%) |
Employment Industries by Sex in Seaside
Employment Industries in Seaside
The major employment industries in Seaside include Accommodation & Food Services (2,878 | 19.6%), Health Care & Social Assistance (1,692 | 11.5%), Retail Trade (1,556 | 10.6%), Construction (1,190 | 8.1%), and Administrative & Support (1,068 | 7.3%).
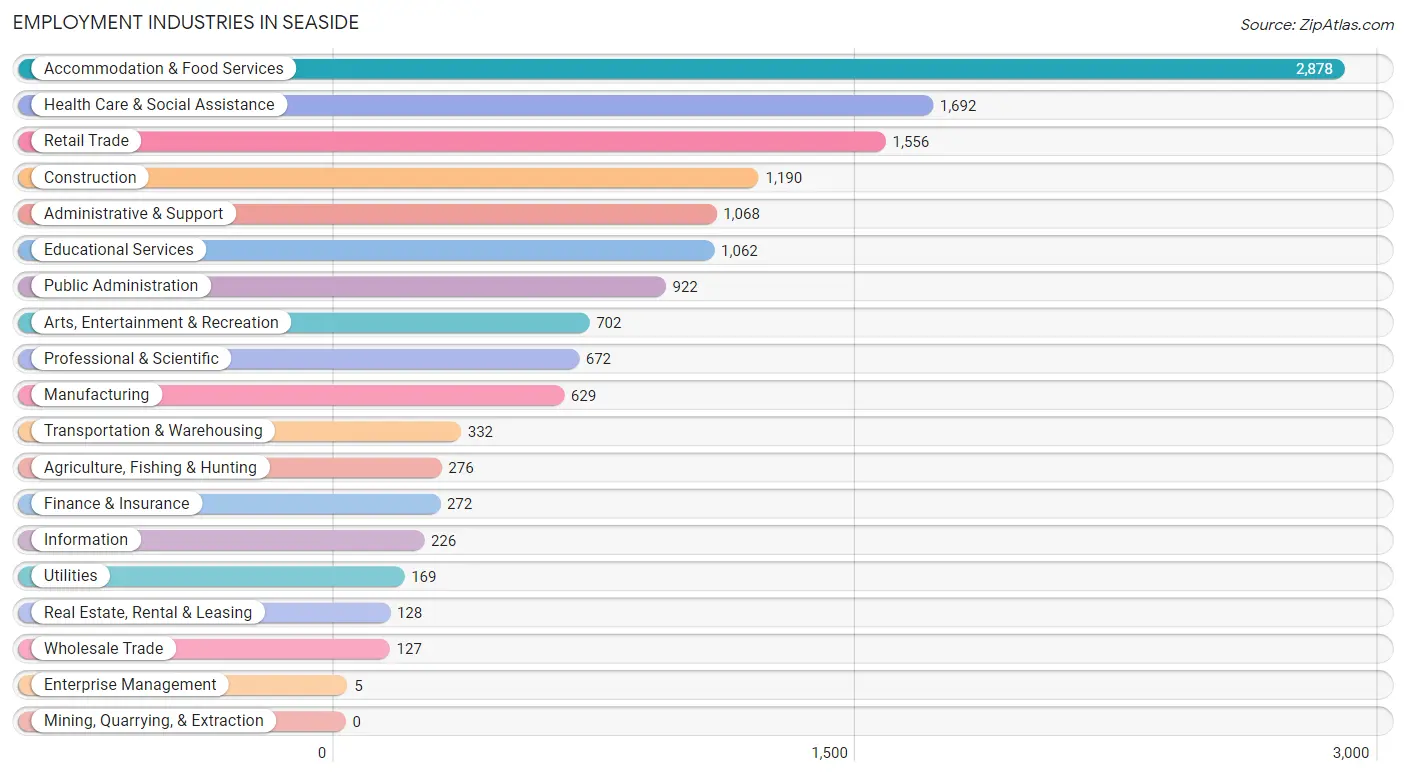
Employment Industries by Sex in Seaside
The Seaside industries that see more men than women are Enterprise Management (100.0%), Construction (98.8%), and Transportation & Warehousing (87.6%), whereas the industries that tend to have a higher number of women are Finance & Insurance (86.0%), Health Care & Social Assistance (75.2%), and Professional & Scientific (62.1%).
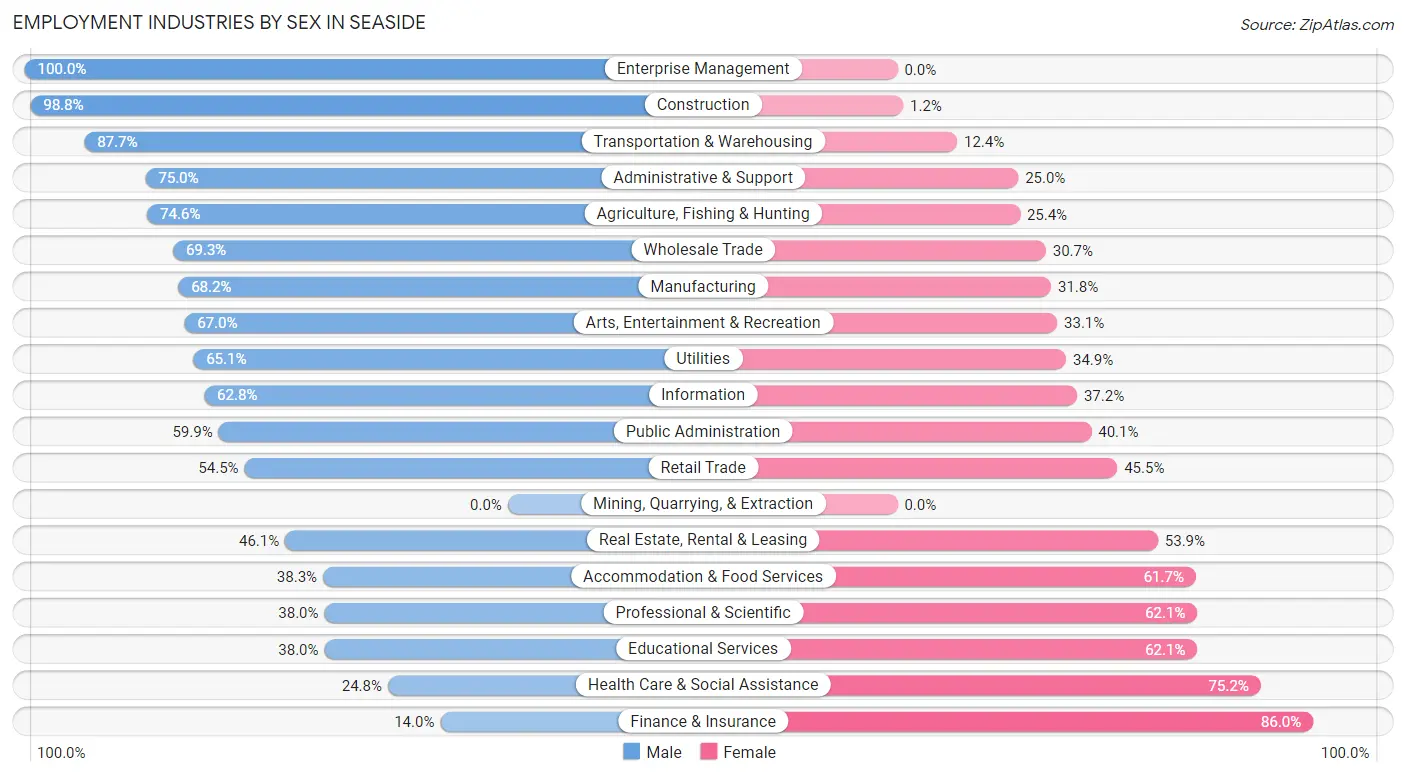
| Industry | Male | Female |
| Agriculture, Fishing & Hunting | 206 (74.6%) | 70 (25.4%) |
| Mining, Quarrying, & Extraction | 0 (0.0%) | 0 (0.0%) |
| Construction | 1,176 (98.8%) | 14 (1.2%) |
| Manufacturing | 429 (68.2%) | 200 (31.8%) |
| Wholesale Trade | 88 (69.3%) | 39 (30.7%) |
| Retail Trade | 848 (54.5%) | 708 (45.5%) |
| Transportation & Warehousing | 291 (87.6%) | 41 (12.3%) |
| Utilities | 110 (65.1%) | 59 (34.9%) |
| Information | 142 (62.8%) | 84 (37.2%) |
| Finance & Insurance | 38 (14.0%) | 234 (86.0%) |
| Real Estate, Rental & Leasing | 59 (46.1%) | 69 (53.9%) |
| Professional & Scientific | 255 (38.0%) | 417 (62.1%) |
| Enterprise Management | 5 (100.0%) | 0 (0.0%) |
| Administrative & Support | 801 (75.0%) | 267 (25.0%) |
| Educational Services | 403 (38.0%) | 659 (62.1%) |
| Health Care & Social Assistance | 420 (24.8%) | 1,272 (75.2%) |
| Arts, Entertainment & Recreation | 470 (66.9%) | 232 (33.1%) |
| Accommodation & Food Services | 1,101 (38.3%) | 1,777 (61.7%) |
| Public Administration | 552 (59.9%) | 370 (40.1%) |
| Total | 7,718 (52.4%) | 7,001 (47.6%) |
Education in Seaside
School Enrollment in Seaside
The most common levels of schooling among the 9,736 students in Seaside are college / undergraduate (3,235 | 33.2%), high school (1,745 | 17.9%), and elementary school (1,577 | 16.2%).
| School Level | # Students | % Students |
| Nursery / Preschool | 369 | 3.8% |
| Kindergarten | 399 | 4.1% |
| Elementary School | 1,577 | 16.2% |
| Middle School | 1,545 | 15.9% |
| High School | 1,745 | 17.9% |
| College / Undergraduate | 3,235 | 33.2% |
| Graduate / Professional | 866 | 8.9% |
| Total | 9,736 | 100.0% |
School Enrollment by Age by Funding Source in Seaside
Out of a total of 9,736 students who are enrolled in schools in Seaside, 1,597 (16.4%) attend a private institution, while the remaining 8,139 (83.6%) are enrolled in public schools. The age group of 25 to 34 year olds has the highest likelihood of being enrolled in private schools, with 470 (47.3% in the age bracket) enrolled. Conversely, the age group of 10 to 14 year olds has the lowest likelihood of being enrolled in a private school, with 1,746 (94.5% in the age bracket) attending a public institution.
| Age Bracket | Public School | Private School |
| 3 to 4 Year Olds | 231 (81.9%) | 51 (18.1%) |
| 5 to 9 Year Old | 1,721 (89.1%) | 211 (10.9%) |
| 10 to 14 Year Olds | 1,746 (94.5%) | 102 (5.5%) |
| 15 to 17 Year Olds | 1,083 (84.9%) | 193 (15.1%) |
| 18 to 19 Year Olds | 1,086 (82.0%) | 238 (18.0%) |
| 20 to 24 Year Olds | 1,112 (83.7%) | 217 (16.3%) |
| 25 to 34 Year Olds | 524 (52.7%) | 470 (47.3%) |
| 35 Years and over | 635 (84.6%) | 116 (15.4%) |
| Total | 8,139 (83.6%) | 1,597 (16.4%) |
Educational Attainment by Field of Study in Seaside
Business (807 | 14.7%), social sciences (557 | 10.2%), arts & humanities (540 | 9.8%), liberal arts & history (469 | 8.6%), and bio, nature & agricultural (464 | 8.5%) are the most common fields of study among 5,486 individuals in Seaside who have obtained a bachelor's degree or higher.
| Field of Study | # Graduates | % Graduates |
| Computers & Mathematics | 193 | 3.5% |
| Bio, Nature & Agricultural | 464 | 8.5% |
| Physical & Health Sciences | 165 | 3.0% |
| Psychology | 365 | 6.7% |
| Social Sciences | 557 | 10.2% |
| Engineering | 446 | 8.1% |
| Multidisciplinary Studies | 50 | 0.9% |
| Science & Technology | 411 | 7.5% |
| Business | 807 | 14.7% |
| Education | 333 | 6.1% |
| Literature & Languages | 371 | 6.8% |
| Liberal Arts & History | 469 | 8.6% |
| Visual & Performing Arts | 148 | 2.7% |
| Communications | 167 | 3.0% |
| Arts & Humanities | 540 | 9.8% |
| Total | 5,486 | 100.0% |
Transportation & Commute in Seaside
Vehicle Availability by Sex in Seaside
The most prevalent vehicle ownership categories in Seaside are males with 2 vehicles (3,391, accounting for 41.3%) and females with 2 vehicles (2,466, making up 51.3%).
| Vehicles Available | Male | Female |
| No Vehicle | 200 (2.4%) | 296 (4.5%) |
| 1 Vehicle | 1,290 (15.7%) | 1,308 (19.8%) |
| 2 Vehicles | 3,391 (41.3%) | 2,466 (37.3%) |
| 3 Vehicles | 1,895 (23.1%) | 1,218 (18.4%) |
| 4 Vehicles | 1,119 (13.6%) | 1,096 (16.6%) |
| 5 or more Vehicles | 316 (3.8%) | 228 (3.5%) |
| Total | 8,211 (100.0%) | 6,612 (100.0%) |
Commute Time in Seaside
The most frequently occuring commute durations in Seaside are 15 to 19 minutes (3,526 commuters, 25.0%), 20 to 24 minutes (2,995 commuters, 21.2%), and 10 to 14 minutes (2,426 commuters, 17.2%).
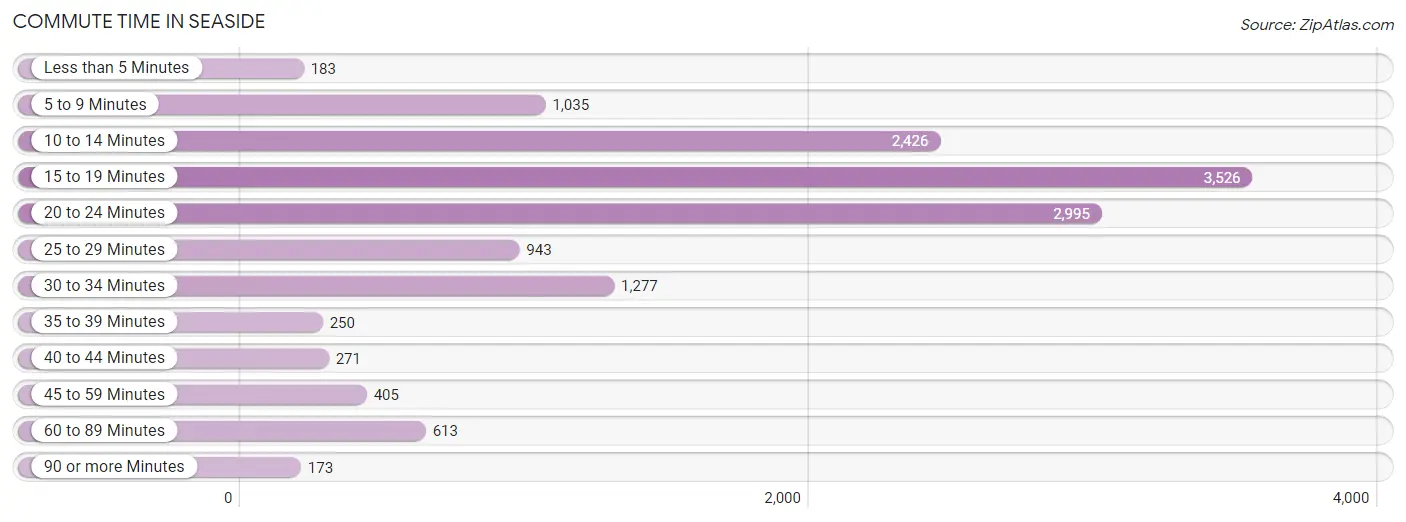
| Commute Time | # Commuters | % Commuters |
| Less than 5 Minutes | 183 | 1.3% |
| 5 to 9 Minutes | 1,035 | 7.3% |
| 10 to 14 Minutes | 2,426 | 17.2% |
| 15 to 19 Minutes | 3,526 | 25.0% |
| 20 to 24 Minutes | 2,995 | 21.2% |
| 25 to 29 Minutes | 943 | 6.7% |
| 30 to 34 Minutes | 1,277 | 9.1% |
| 35 to 39 Minutes | 250 | 1.8% |
| 40 to 44 Minutes | 271 | 1.9% |
| 45 to 59 Minutes | 405 | 2.9% |
| 60 to 89 Minutes | 613 | 4.3% |
| 90 or more Minutes | 173 | 1.2% |
Commute Time by Sex in Seaside
The most common commute times in Seaside are 15 to 19 minutes (1,864 commuters, 23.9%) for males and 15 to 19 minutes (1,662 commuters, 26.4%) for females.
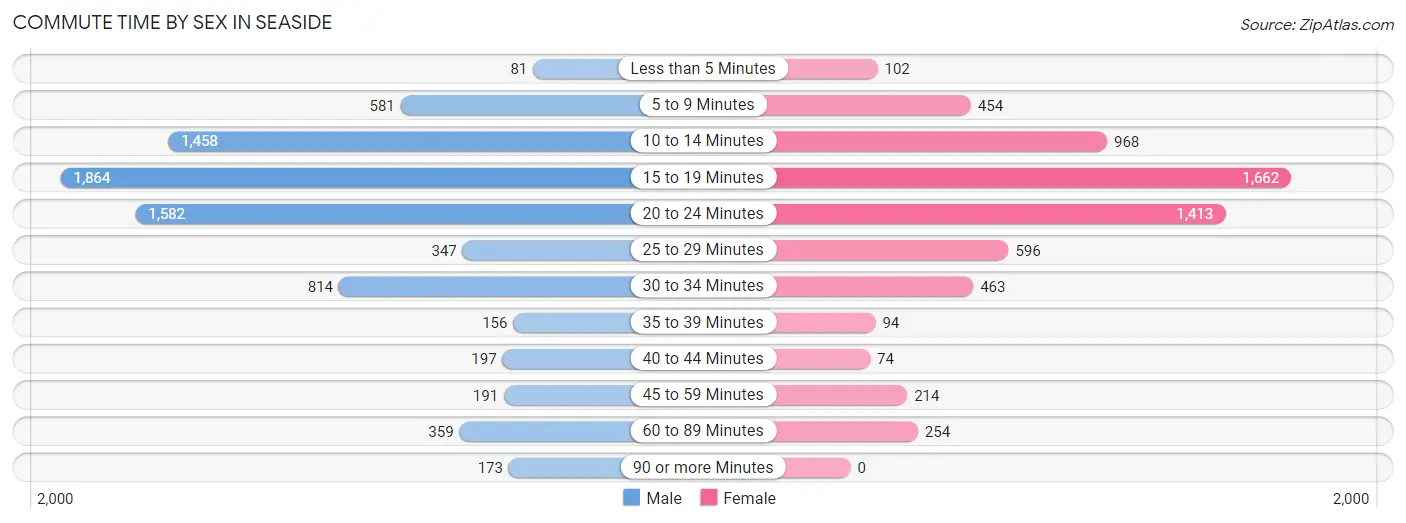
| Commute Time | Male | Female |
| Less than 5 Minutes | 81 (1.0%) | 102 (1.6%) |
| 5 to 9 Minutes | 581 (7.4%) | 454 (7.2%) |
| 10 to 14 Minutes | 1,458 (18.7%) | 968 (15.4%) |
| 15 to 19 Minutes | 1,864 (23.9%) | 1,662 (26.4%) |
| 20 to 24 Minutes | 1,582 (20.3%) | 1,413 (22.5%) |
| 25 to 29 Minutes | 347 (4.4%) | 596 (9.5%) |
| 30 to 34 Minutes | 814 (10.4%) | 463 (7.4%) |
| 35 to 39 Minutes | 156 (2.0%) | 94 (1.5%) |
| 40 to 44 Minutes | 197 (2.5%) | 74 (1.2%) |
| 45 to 59 Minutes | 191 (2.5%) | 214 (3.4%) |
| 60 to 89 Minutes | 359 (4.6%) | 254 (4.0%) |
| 90 or more Minutes | 173 (2.2%) | 0 (0.0%) |
Time of Departure to Work by Sex in Seaside
The most frequent times of departure to work in Seaside are 7:00 AM to 7:29 AM (1,460, 18.7%) for males and 8:00 AM to 8:29 AM (1,279, 20.3%) for females.
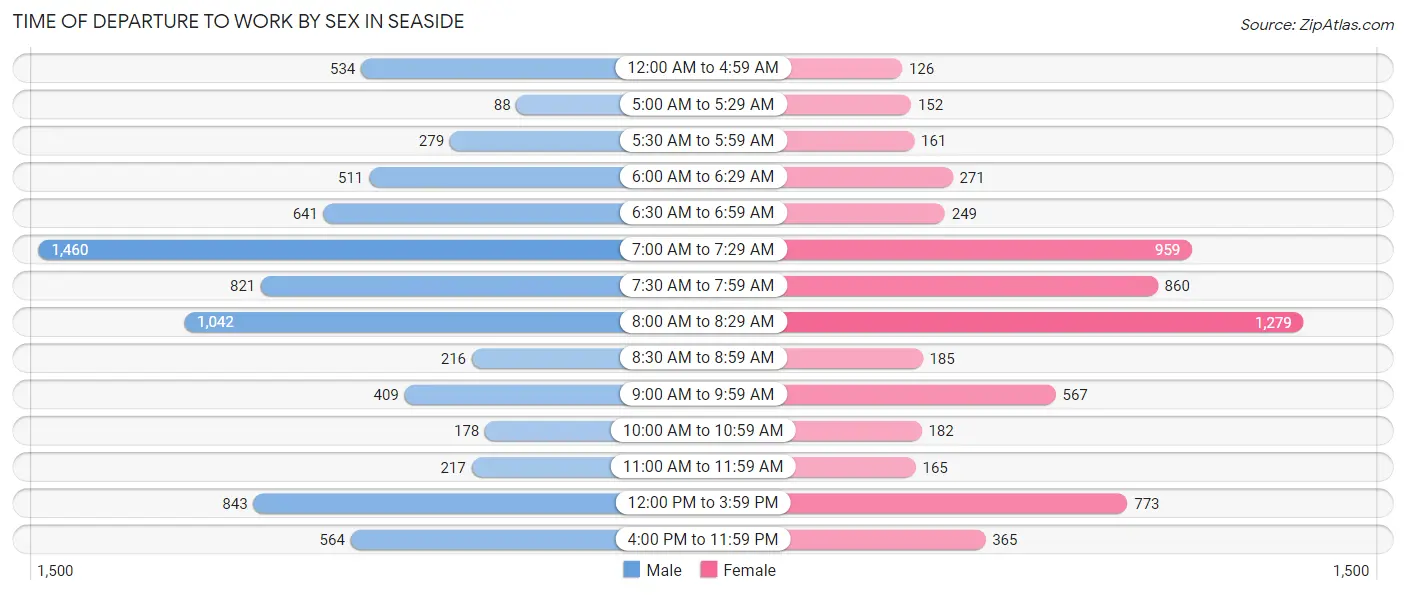
| Time of Departure | Male | Female |
| 12:00 AM to 4:59 AM | 534 (6.8%) | 126 (2.0%) |
| 5:00 AM to 5:29 AM | 88 (1.1%) | 152 (2.4%) |
| 5:30 AM to 5:59 AM | 279 (3.6%) | 161 (2.6%) |
| 6:00 AM to 6:29 AM | 511 (6.6%) | 271 (4.3%) |
| 6:30 AM to 6:59 AM | 641 (8.2%) | 249 (4.0%) |
| 7:00 AM to 7:29 AM | 1,460 (18.7%) | 959 (15.2%) |
| 7:30 AM to 7:59 AM | 821 (10.5%) | 860 (13.7%) |
| 8:00 AM to 8:29 AM | 1,042 (13.4%) | 1,279 (20.3%) |
| 8:30 AM to 8:59 AM | 216 (2.8%) | 185 (2.9%) |
| 9:00 AM to 9:59 AM | 409 (5.2%) | 567 (9.0%) |
| 10:00 AM to 10:59 AM | 178 (2.3%) | 182 (2.9%) |
| 11:00 AM to 11:59 AM | 217 (2.8%) | 165 (2.6%) |
| 12:00 PM to 3:59 PM | 843 (10.8%) | 773 (12.3%) |
| 4:00 PM to 11:59 PM | 564 (7.2%) | 365 (5.8%) |
| Total | 7,803 (100.0%) | 6,294 (100.0%) |
Housing Occupancy in Seaside
Occupancy by Ownership in Seaside
Of the total 10,493 dwellings in Seaside, owner-occupied units account for 4,093 (39.0%), while renter-occupied units make up 6,400 (61.0%).
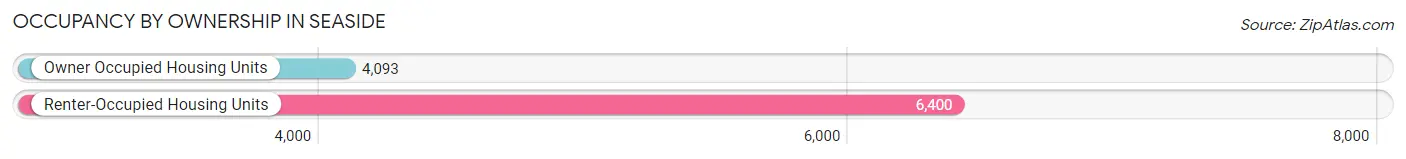
| Occupancy | # Housing Units | % Housing Units |
| Owner Occupied Housing Units | 4,093 | 39.0% |
| Renter-Occupied Housing Units | 6,400 | 61.0% |
| Total Occupied Housing Units | 10,493 | 100.0% |
Occupancy by Household Size in Seaside
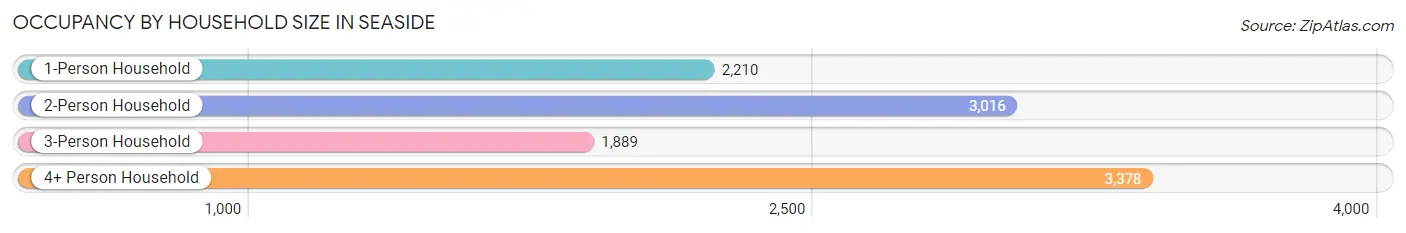
| Household Size | # Housing Units | % Housing Units |
| 1-Person Household | 2,210 | 21.1% |
| 2-Person Household | 3,016 | 28.7% |
| 3-Person Household | 1,889 | 18.0% |
| 4+ Person Household | 3,378 | 32.2% |
| Total Housing Units | 10,493 | 100.0% |
Occupancy by Ownership by Household Size in Seaside
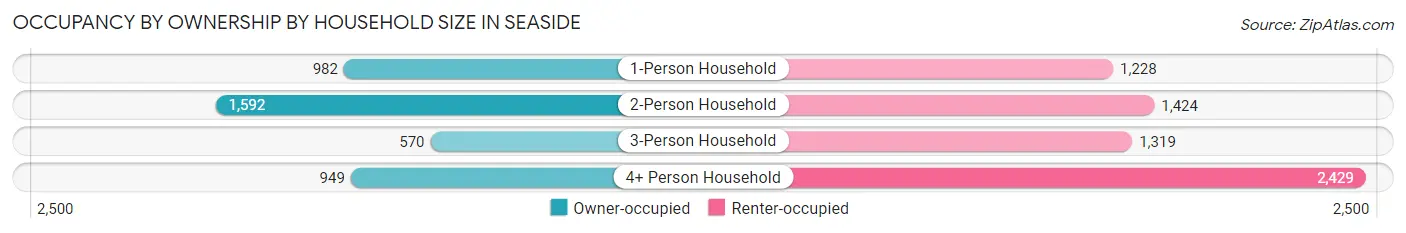
| Household Size | Owner-occupied | Renter-occupied |
| 1-Person Household | 982 (44.4%) | 1,228 (55.6%) |
| 2-Person Household | 1,592 (52.8%) | 1,424 (47.2%) |
| 3-Person Household | 570 (30.2%) | 1,319 (69.8%) |
| 4+ Person Household | 949 (28.1%) | 2,429 (71.9%) |
| Total Housing Units | 4,093 (39.0%) | 6,400 (61.0%) |
Occupancy by Educational Attainment in Seaside
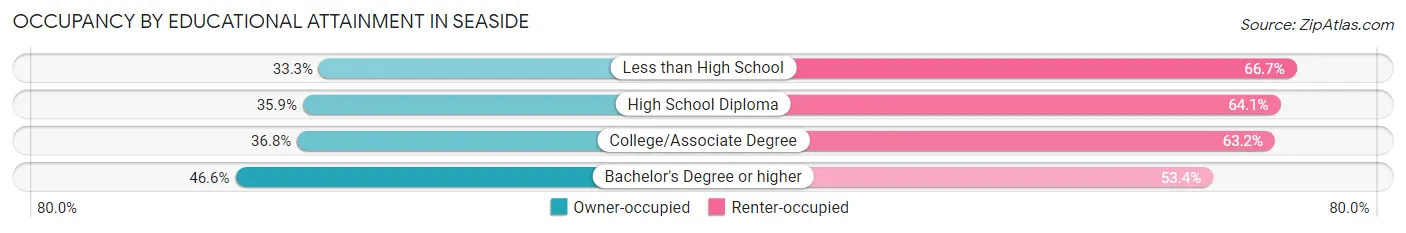
| Household Size | Owner-occupied | Renter-occupied |
| Less than High School | 499 (33.3%) | 998 (66.7%) |
| High School Diploma | 722 (35.9%) | 1,290 (64.1%) |
| College/Associate Degree | 1,428 (36.8%) | 2,456 (63.2%) |
| Bachelor's Degree or higher | 1,444 (46.6%) | 1,656 (53.4%) |
Occupancy by Age of Householder in Seaside
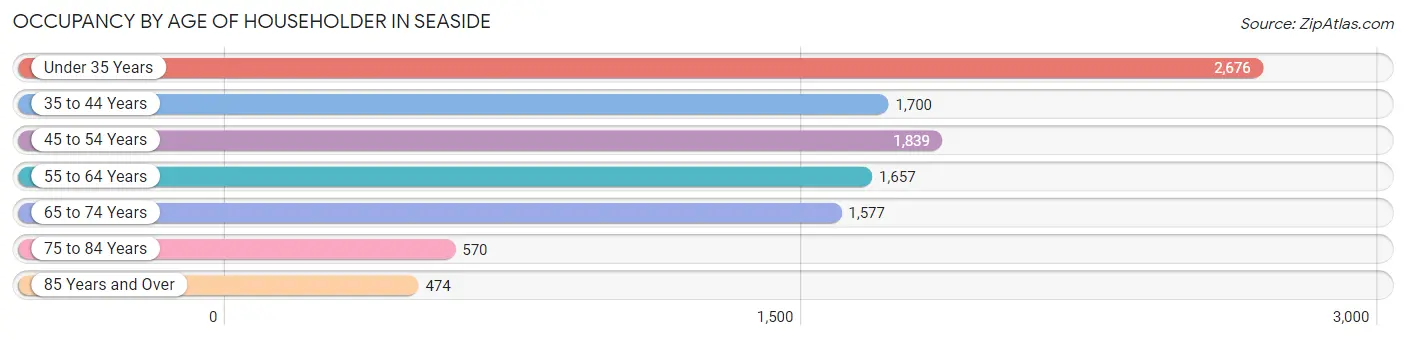
| Age Bracket | # Households | % Households |
| Under 35 Years | 2,676 | 25.5% |
| 35 to 44 Years | 1,700 | 16.2% |
| 45 to 54 Years | 1,839 | 17.5% |
| 55 to 64 Years | 1,657 | 15.8% |
| 65 to 74 Years | 1,577 | 15.0% |
| 75 to 84 Years | 570 | 5.4% |
| 85 Years and Over | 474 | 4.5% |
| Total | 10,493 | 100.0% |
Housing Finances in Seaside
Median Income by Occupancy in Seaside
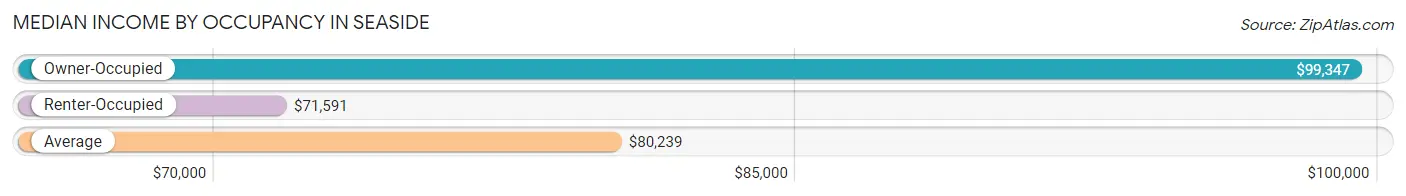
| Occupancy Type | # Households | Median Income |
| Owner-Occupied | 4,093 (39.0%) | $99,347 |
| Renter-Occupied | 6,400 (61.0%) | $71,591 |
| Average | 10,493 (100.0%) | $80,239 |
Occupancy by Householder Income Bracket in Seaside
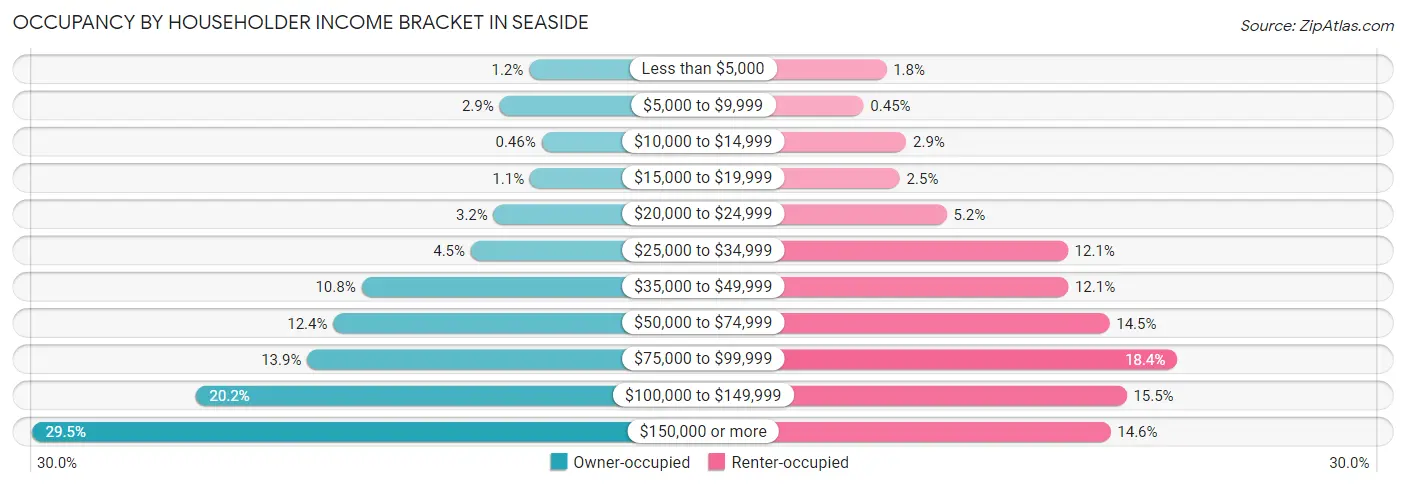
| Income Bracket | Owner-occupied | Renter-occupied |
| Less than $5,000 | 48 (1.2%) | 112 (1.8%) |
| $5,000 to $9,999 | 117 (2.9%) | 29 (0.4%) |
| $10,000 to $14,999 | 19 (0.5%) | 185 (2.9%) |
| $15,000 to $19,999 | 46 (1.1%) | 161 (2.5%) |
| $20,000 to $24,999 | 131 (3.2%) | 333 (5.2%) |
| $25,000 to $34,999 | 184 (4.5%) | 776 (12.1%) |
| $35,000 to $49,999 | 440 (10.7%) | 777 (12.1%) |
| $50,000 to $74,999 | 506 (12.4%) | 928 (14.5%) |
| $75,000 to $99,999 | 567 (13.9%) | 1,176 (18.4%) |
| $100,000 to $149,999 | 826 (20.2%) | 991 (15.5%) |
| $150,000 or more | 1,209 (29.5%) | 932 (14.6%) |
| Total | 4,093 (100.0%) | 6,400 (100.0%) |
Monthly Housing Cost Tiers in Seaside
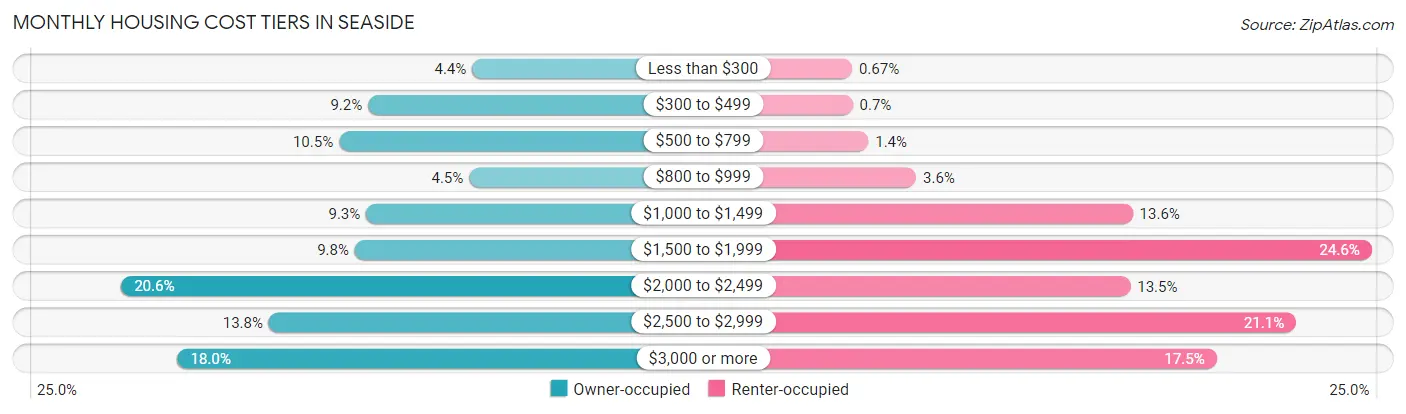
| Monthly Cost | Owner-occupied | Renter-occupied |
| Less than $300 | 180 (4.4%) | 43 (0.7%) |
| $300 to $499 | 376 (9.2%) | 45 (0.7%) |
| $500 to $799 | 431 (10.5%) | 91 (1.4%) |
| $800 to $999 | 186 (4.5%) | 232 (3.6%) |
| $1,000 to $1,499 | 380 (9.3%) | 870 (13.6%) |
| $1,500 to $1,999 | 401 (9.8%) | 1,574 (24.6%) |
| $2,000 to $2,499 | 841 (20.5%) | 863 (13.5%) |
| $2,500 to $2,999 | 563 (13.8%) | 1,351 (21.1%) |
| $3,000 or more | 735 (18.0%) | 1,117 (17.4%) |
| Total | 4,093 (100.0%) | 6,400 (100.0%) |
Physical Housing Characteristics in Seaside
Housing Structures in Seaside
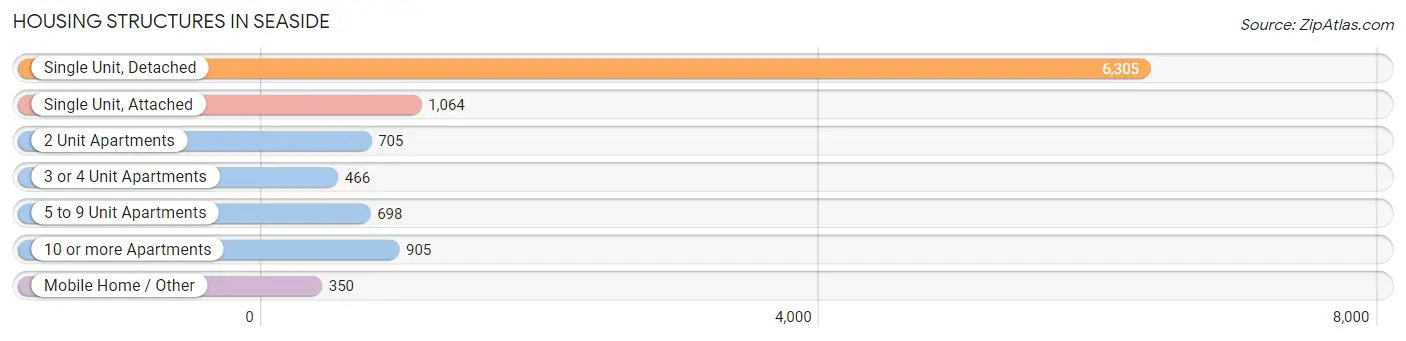
| Structure Type | # Housing Units | % Housing Units |
| Single Unit, Detached | 6,305 | 60.1% |
| Single Unit, Attached | 1,064 | 10.1% |
| 2 Unit Apartments | 705 | 6.7% |
| 3 or 4 Unit Apartments | 466 | 4.4% |
| 5 to 9 Unit Apartments | 698 | 6.7% |
| 10 or more Apartments | 905 | 8.6% |
| Mobile Home / Other | 350 | 3.3% |
| Total | 10,493 | 100.0% |
Housing Structures by Occupancy in Seaside
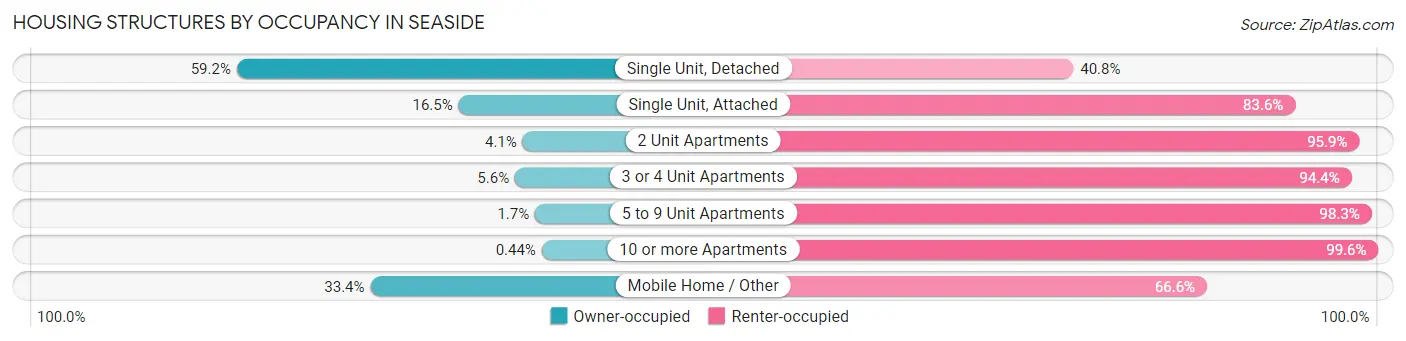
| Structure Type | Owner-occupied | Renter-occupied |
| Single Unit, Detached | 3,730 (59.2%) | 2,575 (40.8%) |
| Single Unit, Attached | 175 (16.5%) | 889 (83.6%) |
| 2 Unit Apartments | 29 (4.1%) | 676 (95.9%) |
| 3 or 4 Unit Apartments | 26 (5.6%) | 440 (94.4%) |
| 5 to 9 Unit Apartments | 12 (1.7%) | 686 (98.3%) |
| 10 or more Apartments | 4 (0.4%) | 901 (99.6%) |
| Mobile Home / Other | 117 (33.4%) | 233 (66.6%) |
| Total | 4,093 (39.0%) | 6,400 (61.0%) |
Housing Structures by Number of Rooms in Seaside
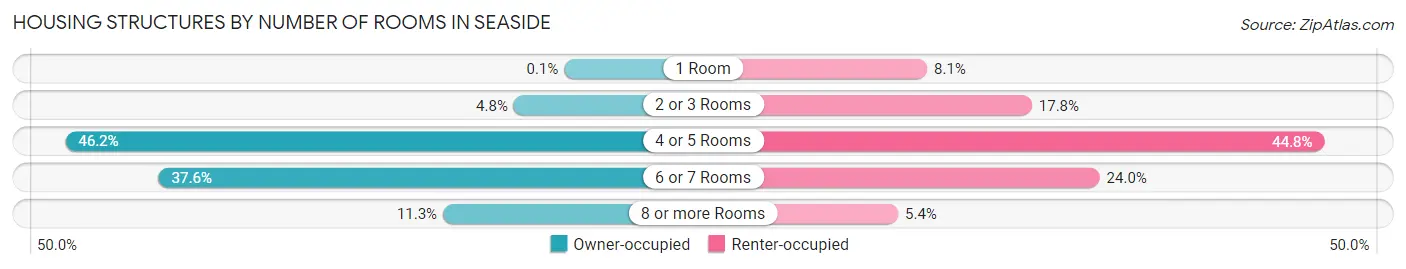
| Number of Rooms | Owner-occupied | Renter-occupied |
| 1 Room | 4 (0.1%) | 516 (8.1%) |
| 2 or 3 Rooms | 195 (4.8%) | 1,136 (17.7%) |
| 4 or 5 Rooms | 1,892 (46.2%) | 2,867 (44.8%) |
| 6 or 7 Rooms | 1,539 (37.6%) | 1,537 (24.0%) |
| 8 or more Rooms | 463 (11.3%) | 344 (5.4%) |
| Total | 4,093 (100.0%) | 6,400 (100.0%) |
Housing Structure by Heating Type in Seaside
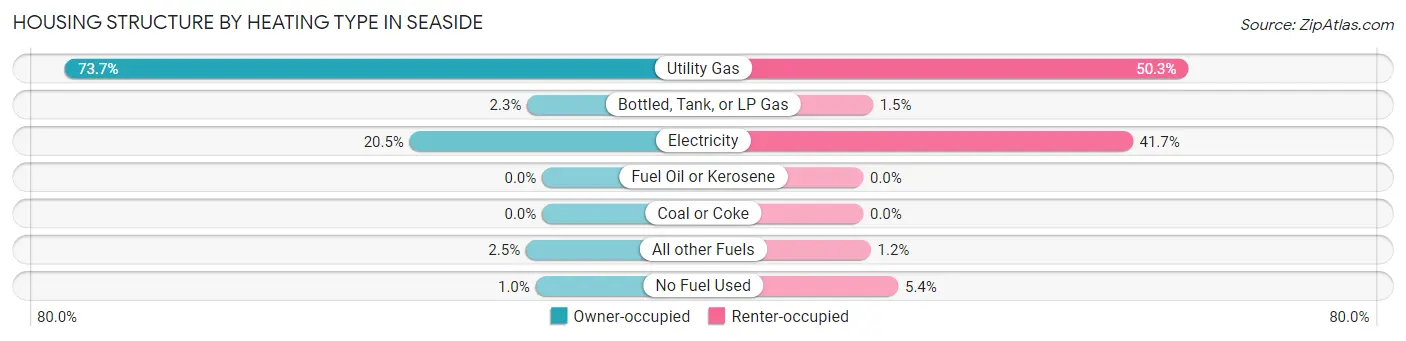
| Heating Type | Owner-occupied | Renter-occupied |
| Utility Gas | 3,018 (73.7%) | 3,217 (50.3%) |
| Bottled, Tank, or LP Gas | 94 (2.3%) | 96 (1.5%) |
| Electricity | 838 (20.5%) | 2,666 (41.7%) |
| Fuel Oil or Kerosene | 0 (0.0%) | 0 (0.0%) |
| Coal or Coke | 0 (0.0%) | 0 (0.0%) |
| All other Fuels | 102 (2.5%) | 75 (1.2%) |
| No Fuel Used | 41 (1.0%) | 346 (5.4%) |
| Total | 4,093 (100.0%) | 6,400 (100.0%) |
Household Vehicle Usage in Seaside
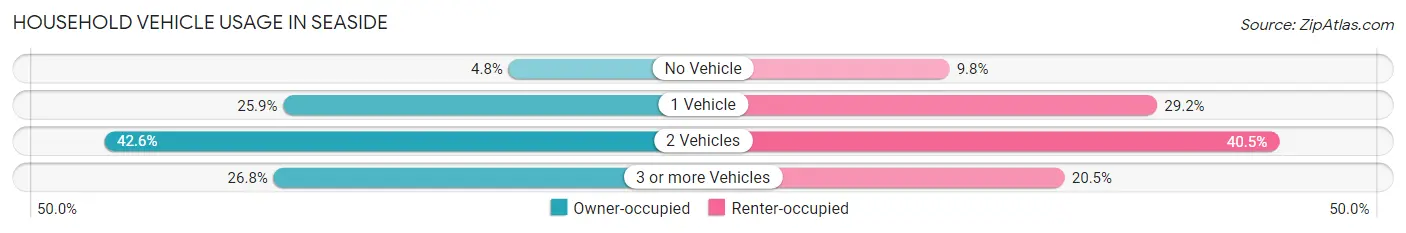
| Vehicles per Household | Owner-occupied | Renter-occupied |
| No Vehicle | 197 (4.8%) | 626 (9.8%) |
| 1 Vehicle | 1,058 (25.9%) | 1,867 (29.2%) |
| 2 Vehicles | 1,743 (42.6%) | 2,593 (40.5%) |
| 3 or more Vehicles | 1,095 (26.8%) | 1,314 (20.5%) |
| Total | 4,093 (100.0%) | 6,400 (100.0%) |
Real Estate & Mortgages in Seaside
Real Estate and Mortgage Overview in Seaside
| Characteristic | Without Mortgage | With Mortgage |
| Housing Units | 1,247 | 2,846 |
| Median Property Value | $623,800 | $662,400 |
| Median Household Income | $70,625 | $992 |
| Monthly Housing Costs | $527 | $735 |
| Real Estate Taxes | $1,646 | $13 |
Property Value by Mortgage Status in Seaside
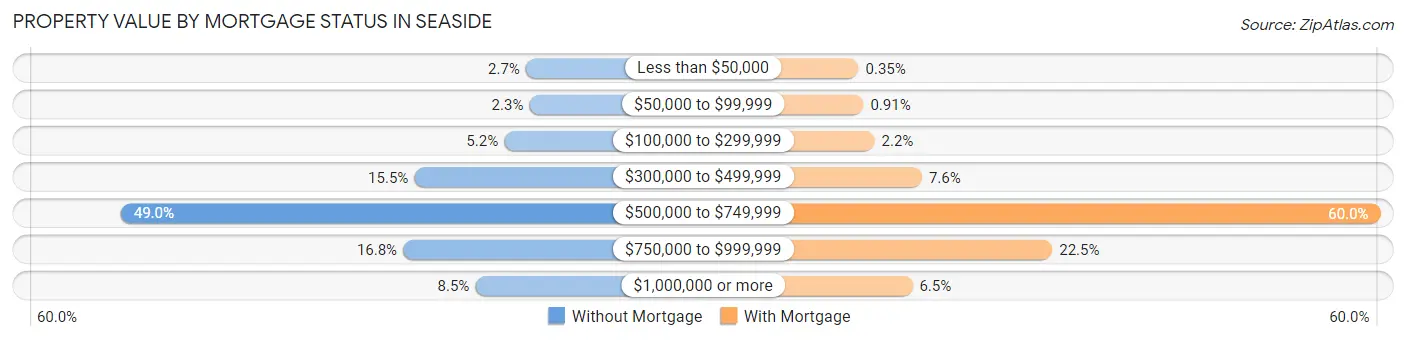
| Property Value | Without Mortgage | With Mortgage |
| Less than $50,000 | 34 (2.7%) | 10 (0.4%) |
| $50,000 to $99,999 | 29 (2.3%) | 26 (0.9%) |
| $100,000 to $299,999 | 65 (5.2%) | 62 (2.2%) |
| $300,000 to $499,999 | 193 (15.5%) | 216 (7.6%) |
| $500,000 to $749,999 | 611 (49.0%) | 1,707 (60.0%) |
| $750,000 to $999,999 | 209 (16.8%) | 640 (22.5%) |
| $1,000,000 or more | 106 (8.5%) | 185 (6.5%) |
| Total | 1,247 (100.0%) | 2,846 (100.0%) |
Household Income by Mortgage Status in Seaside
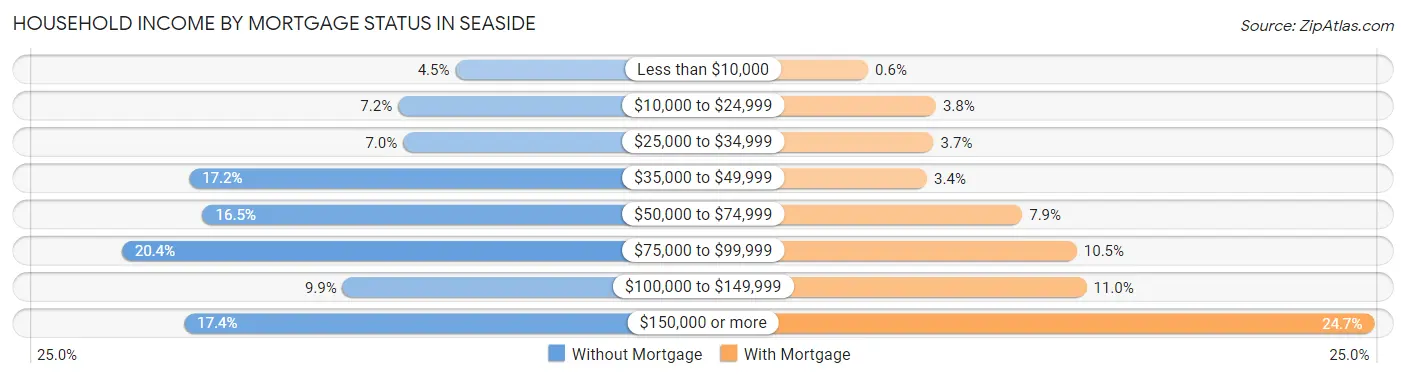
| Household Income | Without Mortgage | With Mortgage |
| Less than $10,000 | 56 (4.5%) | 17 (0.6%) |
| $10,000 to $24,999 | 90 (7.2%) | 109 (3.8%) |
| $25,000 to $34,999 | 87 (7.0%) | 106 (3.7%) |
| $35,000 to $49,999 | 214 (17.2%) | 97 (3.4%) |
| $50,000 to $74,999 | 206 (16.5%) | 226 (7.9%) |
| $75,000 to $99,999 | 254 (20.4%) | 300 (10.5%) |
| $100,000 to $149,999 | 123 (9.9%) | 313 (11.0%) |
| $150,000 or more | 217 (17.4%) | 703 (24.7%) |
| Total | 1,247 (100.0%) | 2,846 (100.0%) |
Property Value to Household Income Ratio in Seaside
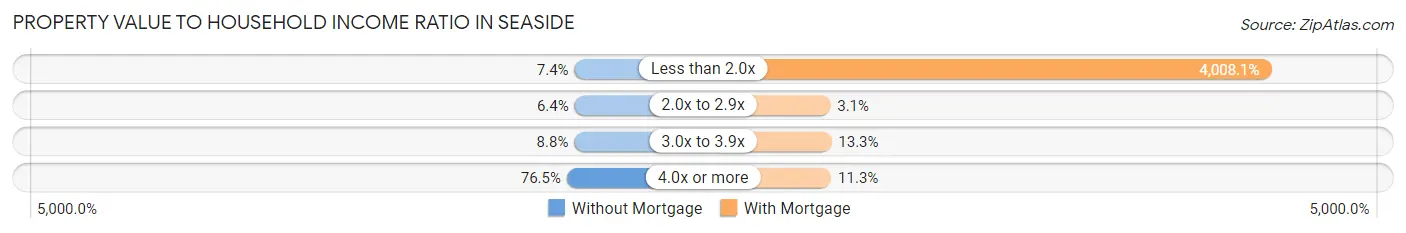
| Value-to-Income Ratio | Without Mortgage | With Mortgage |
| Less than 2.0x | 92 (7.4%) | 114,070 (4,008.1%) |
| 2.0x to 2.9x | 80 (6.4%) | 88 (3.1%) |
| 3.0x to 3.9x | 110 (8.8%) | 377 (13.3%) |
| 4.0x or more | 954 (76.5%) | 321 (11.3%) |
| Total | 1,247 (100.0%) | 2,846 (100.0%) |
Real Estate Taxes by Mortgage Status in Seaside
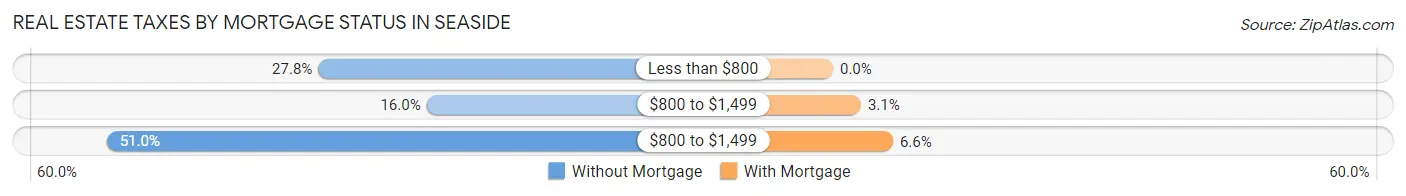
| Property Taxes | Without Mortgage | With Mortgage |
| Less than $800 | 347 (27.8%) | 0 (0.0%) |
| $800 to $1,499 | 199 (16.0%) | 87 (3.1%) |
| $800 to $1,499 | 636 (51.0%) | 187 (6.6%) |
| Total | 1,247 (100.0%) | 2,846 (100.0%) |
Health & Disability in Seaside
Health Insurance Coverage by Age in Seaside
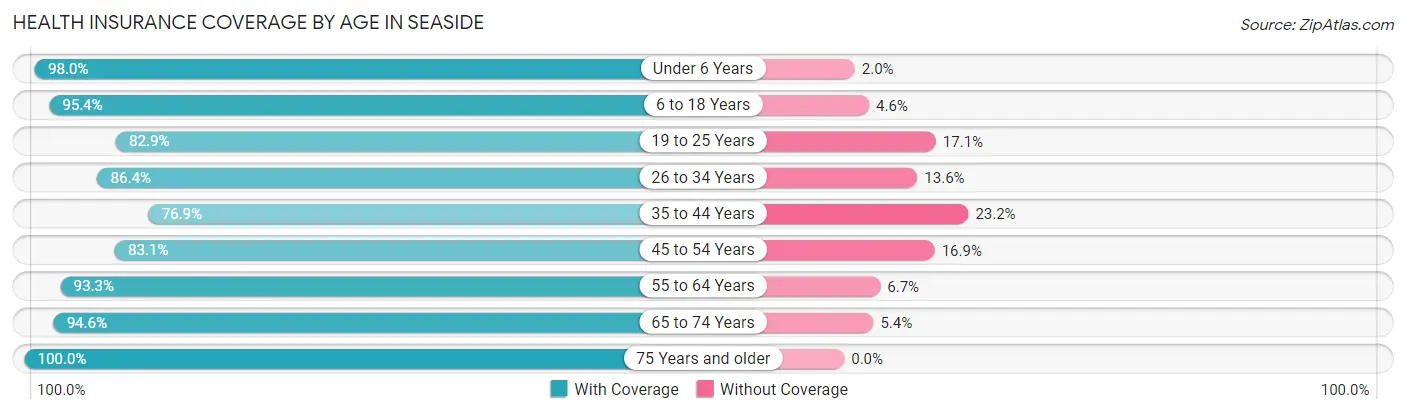
| Age Bracket | With Coverage | Without Coverage |
| Under 6 Years | 2,204 (98.0%) | 44 (2.0%) |
| 6 to 18 Years | 5,353 (95.4%) | 259 (4.6%) |
| 19 to 25 Years | 3,179 (82.9%) | 655 (17.1%) |
| 26 to 34 Years | 3,796 (86.4%) | 599 (13.6%) |
| 35 to 44 Years | 2,924 (76.8%) | 881 (23.2%) |
| 45 to 54 Years | 2,946 (83.1%) | 598 (16.9%) |
| 55 to 64 Years | 3,373 (93.3%) | 243 (6.7%) |
| 65 to 74 Years | 2,487 (94.6%) | 143 (5.4%) |
| 75 Years and older | 1,790 (100.0%) | 0 (0.0%) |
| Total | 28,052 (89.1%) | 3,422 (10.9%) |
Health Insurance Coverage by Citizenship Status in Seaside
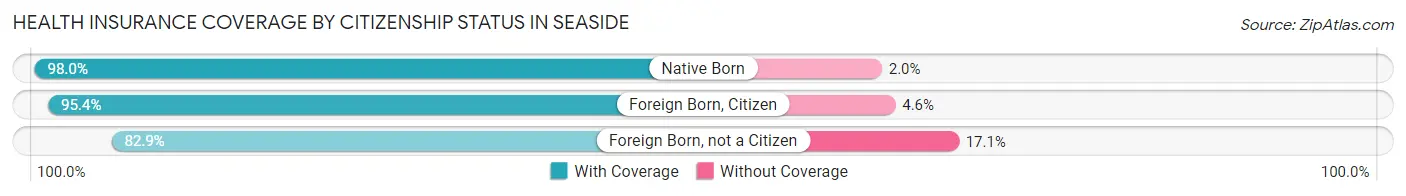
| Citizenship Status | With Coverage | Without Coverage |
| Native Born | 2,204 (98.0%) | 44 (2.0%) |
| Foreign Born, Citizen | 5,353 (95.4%) | 259 (4.6%) |
| Foreign Born, not a Citizen | 3,179 (82.9%) | 655 (17.1%) |
Health Insurance Coverage by Household Income in Seaside
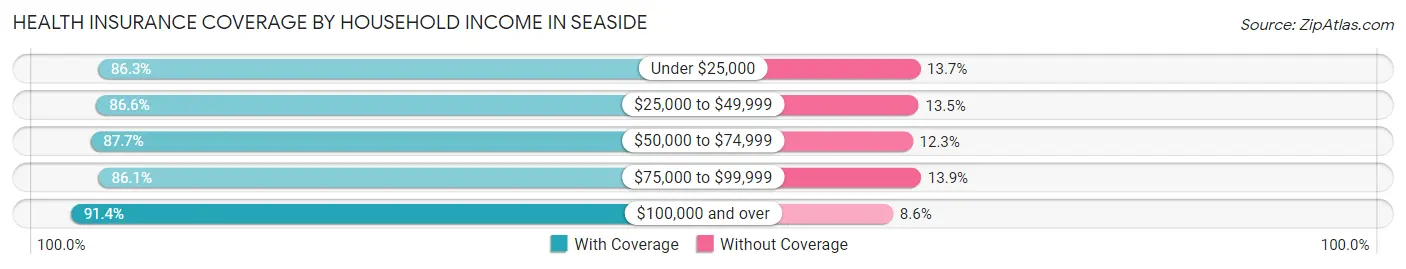
| Household Income | With Coverage | Without Coverage |
| Under $25,000 | 2,285 (86.3%) | 364 (13.7%) |
| $25,000 to $49,999 | 4,255 (86.6%) | 661 (13.5%) |
| $50,000 to $74,999 | 3,143 (87.7%) | 442 (12.3%) |
| $75,000 to $99,999 | 4,369 (86.1%) | 704 (13.9%) |
| $100,000 and over | 12,640 (91.4%) | 1,196 (8.6%) |
Public vs Private Health Insurance Coverage by Age in Seaside
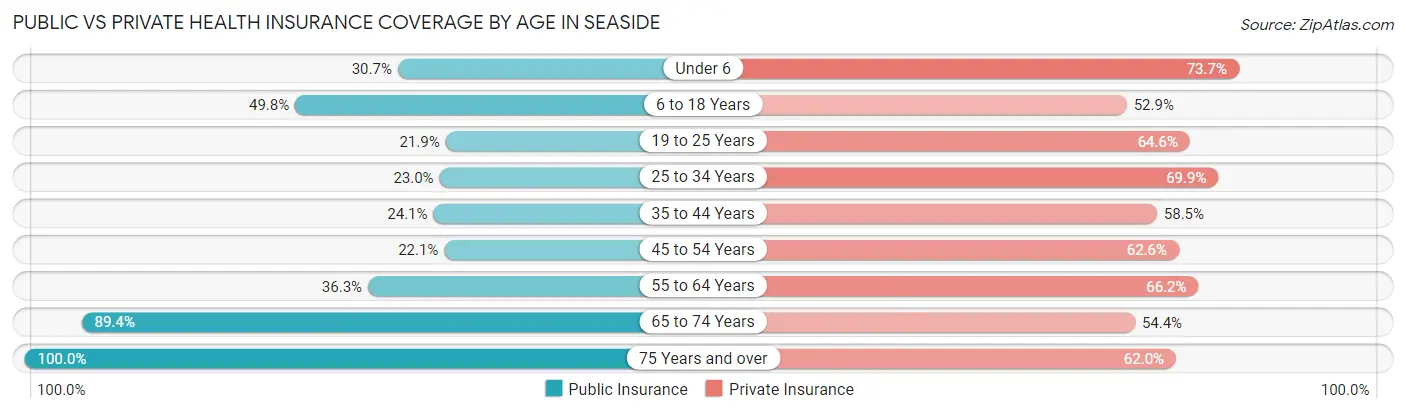
| Age Bracket | Public Insurance | Private Insurance |
| Under 6 | 691 (30.7%) | 1,656 (73.7%) |
| 6 to 18 Years | 2,795 (49.8%) | 2,968 (52.9%) |
| 19 to 25 Years | 839 (21.9%) | 2,476 (64.6%) |
| 25 to 34 Years | 1,011 (23.0%) | 3,071 (69.9%) |
| 35 to 44 Years | 918 (24.1%) | 2,225 (58.5%) |
| 45 to 54 Years | 784 (22.1%) | 2,217 (62.6%) |
| 55 to 64 Years | 1,312 (36.3%) | 2,393 (66.2%) |
| 65 to 74 Years | 2,352 (89.4%) | 1,431 (54.4%) |
| 75 Years and over | 1,790 (100.0%) | 1,110 (62.0%) |
| Total | 12,492 (39.7%) | 19,547 (62.1%) |
Disability Status by Sex by Age in Seaside
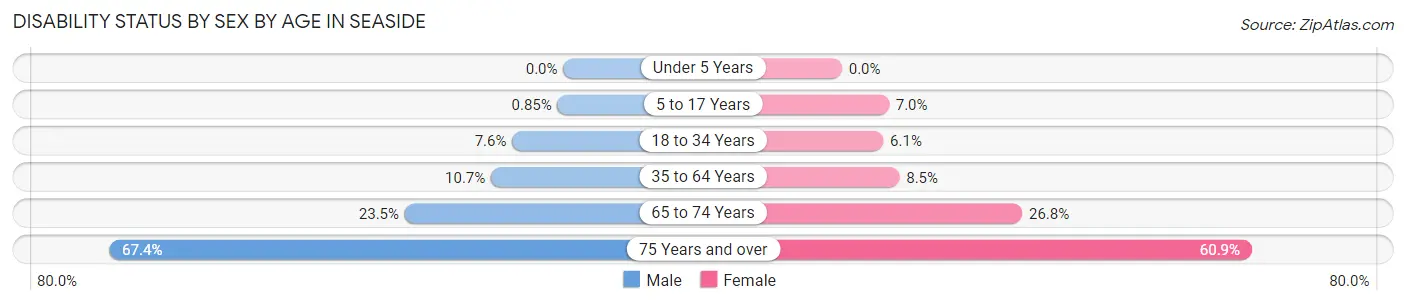
| Age Bracket | Male | Female |
| Under 5 Years | 0 (0.0%) | 0 (0.0%) |
| 5 to 17 Years | 23 (0.9%) | 185 (7.0%) |
| 18 to 34 Years | 300 (7.6%) | 303 (6.1%) |
| 35 to 64 Years | 581 (10.7%) | 474 (8.5%) |
| 65 to 74 Years | 327 (23.5%) | 332 (26.8%) |
| 75 Years and over | 464 (67.4%) | 671 (60.9%) |
Disability Class by Sex by Age in Seaside
Disability Class: Hearing Difficulty
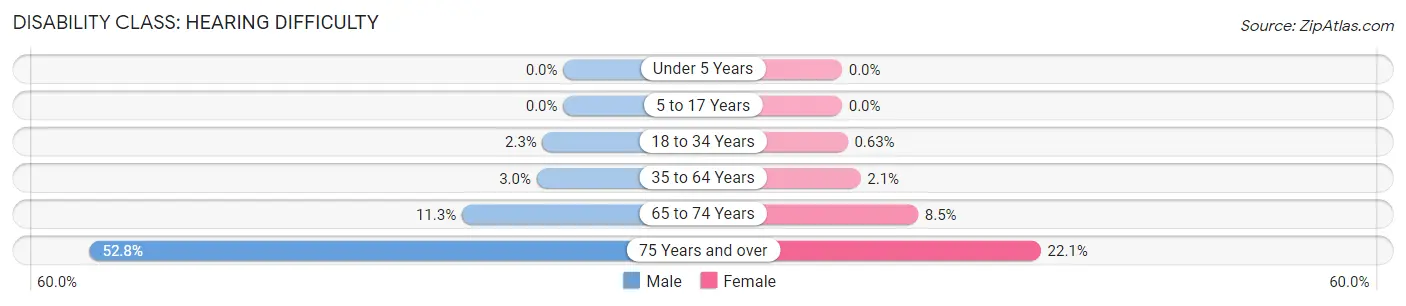
| Age Bracket | Male | Female |
| Under 5 Years | 0 (0.0%) | 0 (0.0%) |
| 5 to 17 Years | 0 (0.0%) | 0 (0.0%) |
| 18 to 34 Years | 91 (2.3%) | 31 (0.6%) |
| 35 to 64 Years | 160 (3.0%) | 115 (2.1%) |
| 65 to 74 Years | 157 (11.3%) | 105 (8.5%) |
| 75 Years and over | 363 (52.8%) | 244 (22.1%) |
Disability Class: Vision Difficulty
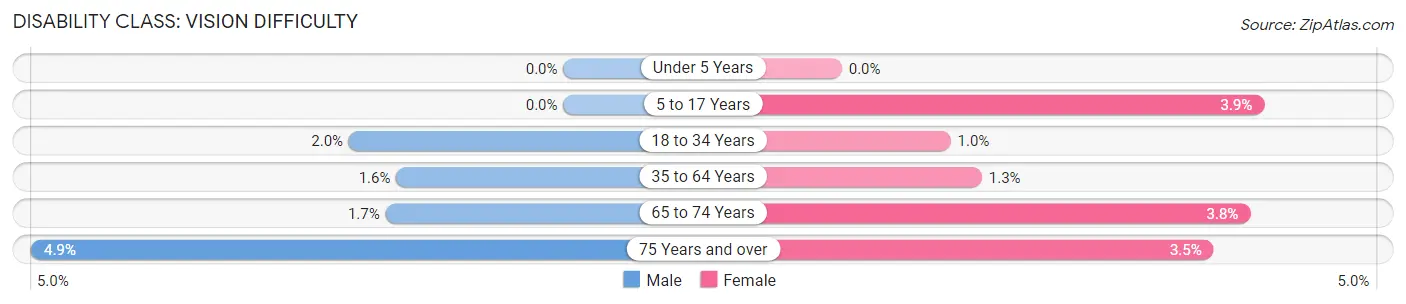
| Age Bracket | Male | Female |
| Under 5 Years | 0 (0.0%) | 0 (0.0%) |
| 5 to 17 Years | 0 (0.0%) | 104 (3.9%) |
| 18 to 34 Years | 79 (2.0%) | 50 (1.0%) |
| 35 to 64 Years | 84 (1.5%) | 72 (1.3%) |
| 65 to 74 Years | 23 (1.7%) | 47 (3.8%) |
| 75 Years and over | 34 (4.9%) | 38 (3.5%) |
Disability Class: Cognitive Difficulty
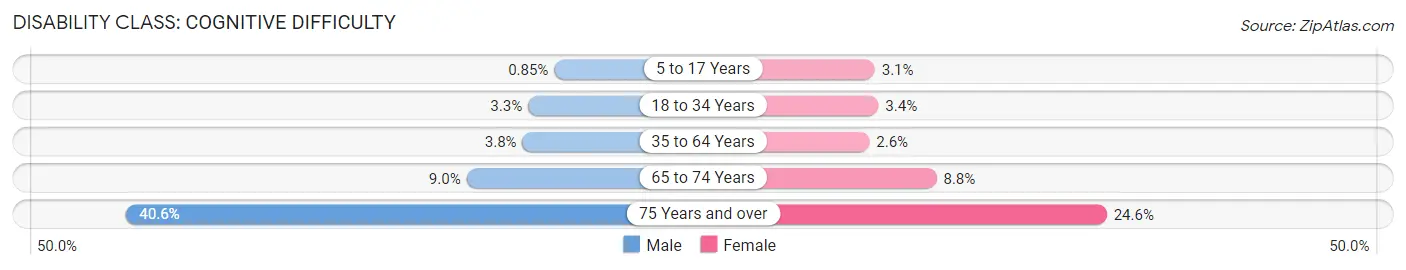
| Age Bracket | Male | Female |
| 5 to 17 Years | 23 (0.9%) | 81 (3.1%) |
| 18 to 34 Years | 130 (3.3%) | 168 (3.4%) |
| 35 to 64 Years | 206 (3.8%) | 142 (2.6%) |
| 65 to 74 Years | 125 (9.0%) | 109 (8.8%) |
| 75 Years and over | 279 (40.6%) | 271 (24.6%) |
Disability Class: Ambulatory Difficulty
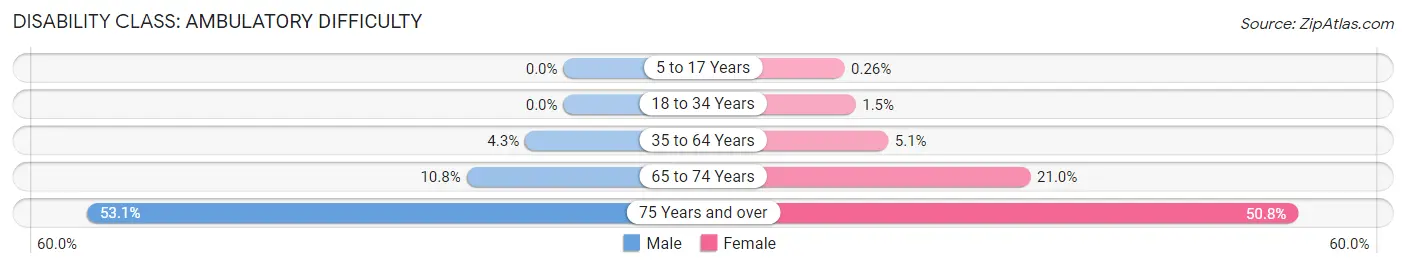
| Age Bracket | Male | Female |
| 5 to 17 Years | 0 (0.0%) | 7 (0.3%) |
| 18 to 34 Years | 0 (0.0%) | 74 (1.5%) |
| 35 to 64 Years | 231 (4.3%) | 285 (5.1%) |
| 65 to 74 Years | 150 (10.8%) | 260 (21.0%) |
| 75 Years and over | 365 (53.0%) | 560 (50.8%) |
Disability Class: Self-Care Difficulty
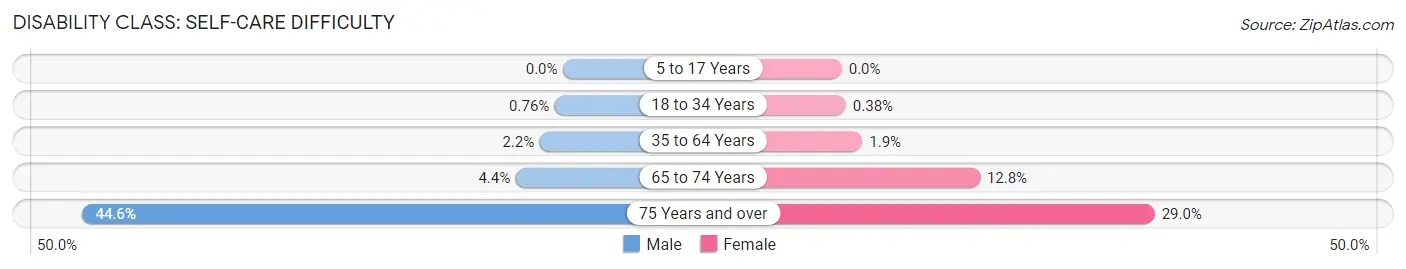
| Age Bracket | Male | Female |
| 5 to 17 Years | 0 (0.0%) | 0 (0.0%) |
| 18 to 34 Years | 30 (0.8%) | 19 (0.4%) |
| 35 to 64 Years | 117 (2.2%) | 106 (1.9%) |
| 65 to 74 Years | 61 (4.4%) | 159 (12.8%) |
| 75 Years and over | 307 (44.6%) | 320 (29.0%) |
Technology Access in Seaside
Computing Device Access in Seaside
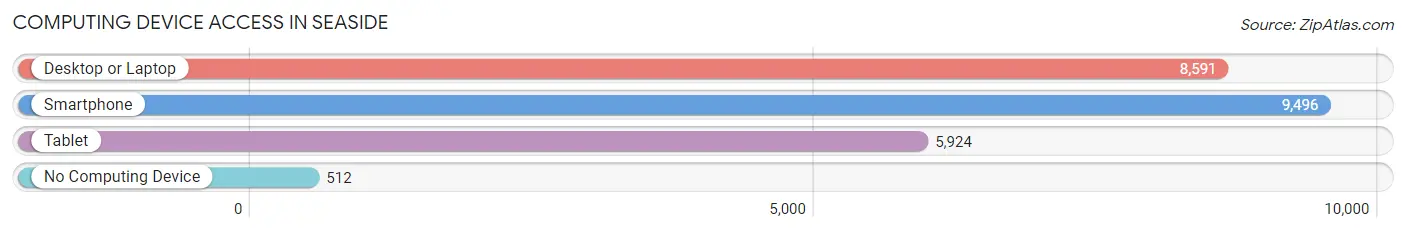
| Device Type | # Households | % Households |
| Desktop or Laptop | 8,591 | 81.9% |
| Smartphone | 9,496 | 90.5% |
| Tablet | 5,924 | 56.5% |
| No Computing Device | 512 | 4.9% |
| Total | 10,493 | 100.0% |
Internet Access in Seaside
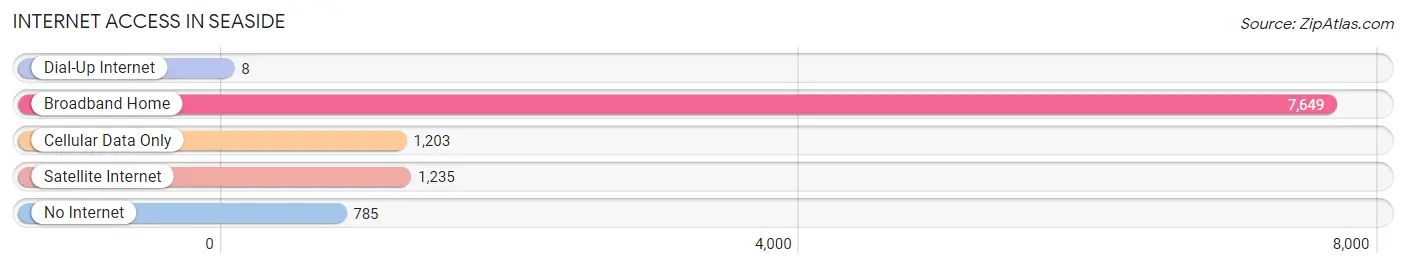
| Internet Type | # Households | % Households |
| Dial-Up Internet | 8 | 0.1% |
| Broadband Home | 7,649 | 72.9% |
| Cellular Data Only | 1,203 | 11.5% |
| Satellite Internet | 1,235 | 11.8% |
| No Internet | 785 | 7.5% |
| Total | 10,493 | 100.0% |
Seaside Summary
Seaside, California is a city located in Monterey County, California, United States. It is situated on the Monterey Bay, approximately 8 miles (13 km) southeast of Monterey and 8 miles (13 km) northwest of Salinas. The population was 33,025 at the 2010 census, up from 26,385 at the 2000 census. Seaside is a popular tourist destination due to its close proximity to the Monterey Bay Aquarium and other attractions.
History
The area that is now Seaside was originally inhabited by the Ohlone people, who lived in the area for thousands of years. The first European to explore the area was Juan Rodríguez Cabrillo in 1542. The area was later explored by Spanish explorer Sebastián Vizcaíno in 1602.
In the late 19th century, the area was developed as a resort town by the Southern Pacific Railroad. The town was named Seaside in 1887, and the first post office was established in 1888. The town was incorporated in 1916.
Geography
Seaside is located at 36°37′17″N 121°51′17″W (36.6214, -121.8547). According to the United States Census Bureau, the city has a total area of 5.7 square miles (14.8 km2), of which 5.6 square miles (14.6 km2) is land and 0.1 square miles (0.2 km2) (1.45%) is water.
Economy
Seaside’s economy is largely based on tourism. The city is home to the Monterey Bay Aquarium, which is one of the most popular tourist attractions in the area. Other attractions include the Old Fisherman’s Wharf, Cannery Row, and the Monterey Bay Coastal Recreation Trail.
The city is also home to several military installations, including the Naval Postgraduate School, the Defense Language Institute, and the Presidio of Monterey. These installations provide a significant number of jobs for the local economy.
Demographics
As of the 2010 census, there were 33,025 people, 11,945 households, and 7,845 families residing in the city. The population density was 5,845.3 people per square mile (2,259.2/km2). There were 12,845 housing units at an average density of 2,269.2 per square mile (876.2/km2). The racial makeup of the city was 57.2% White, 5.2% African American, 1.2% Native American, 8.2% Asian, 0.5% Pacific Islander, 22.2% from other races, and 5.7% from two or more races. Hispanic or Latino of any race were 39.2% of the population.
There were 11,945 households, out of which 33.2% had children under the age of 18 living with them, 44.2% were married couples living together, 15.7% had a female householder with no husband present, and 33.7% were non-families. 25.7% of all households were made up of individuals, and 8.2% had someone living alone who was 65 years of age or older. The average household size was 2.75 and the average family size was 3.30.
In the city, the population was spread out, with 25.7% under the age of 18, 11.2% from 18 to 24, 33.2% from 25 to 44, 19.7% from 45 to 64, and 10.2% who were 65 years of age or older. The median age was 32 years. For every 100 females, there were 97.2 males. For every 100 females age 18 and over, there were 94.7 males.
The median income for a household in the city was $45,837, and the median income for a family was $50,945. Males had a median income of $36,945 versus $30,813 for females. The per capita income for the city was $20,945. About 11.2% of families and 14.2% of the population were below the poverty line, including 19.2% of those under age 18 and 8.2% of those age 65 or over.
Common Questions
What is Per Capita Income in Seaside?
Per Capita income in Seaside is $33,366.
What is the Median Family Income in Seaside?
Median Family Income in Seaside is $82,299.
What is the Median Household income in Seaside?
Median Household Income in Seaside is $80,239.
What is Income or Wage Gap in Seaside?
Income or Wage Gap in Seaside is 30.0%.
Women in Seaside earn 70.0 cents for every dollar earned by a man.
What is Family Income Deficit in Seaside?
Family Income Deficit in Seaside is $9,856.
Families that are below poverty line in Seaside earn $9,856 less on average than the poverty threshold level.
What is Inequality or Gini Index in Seaside?
Inequality or Gini Index in Seaside is 0.42.
What is the Total Population of Seaside?
Total Population of Seaside is 32,291.
What is the Total Male Population of Seaside?
Total Male Population of Seaside is 16,046.
What is the Total Female Population of Seaside?
Total Female Population of Seaside is 16,245.
What is the Ratio of Males per 100 Females in Seaside?
There are 98.78 Males per 100 Females in Seaside.
What is the Ratio of Females per 100 Males in Seaside?
There are 101.24 Females per 100 Males in Seaside.
What is the Median Population Age in Seaside?
Median Population Age in Seaside is 34.0 Years.
What is the Average Family Size in Seaside
Average Family Size in Seaside is 3.4 People.
What is the Average Household Size in Seaside
Average Household Size in Seaside is 2.9 People.
How Large is the Labor Force in Seaside?
There are 16,676 People in the Labor Forcein in Seaside.
What is the Percentage of People in the Labor Force in Seaside?
64.4% of People are in the Labor Force in Seaside.
What is the Unemployment Rate in Seaside?
Unemployment Rate in Seaside is 7.1%.