Poulsbo, WA Map & Demographics
Poulsbo Map
Poulsbo Overview
$48,310
PER CAPITA INCOME
$122,079
AVG FAMILY INCOME
$89,393
AVG HOUSEHOLD INCOME
36.5%
WAGE / INCOME GAP [ % ]
63.5¢/ $1
WAGE / INCOME GAP [ $ ]
0.42
INEQUALITY / GINI INDEX
11,824
TOTAL POPULATION
5,592
MALE POPULATION
6,232
FEMALE POPULATION
89.73
MALES / 100 FEMALES
111.44
FEMALES / 100 MALES
43.7
MEDIAN AGE
2.9
AVG FAMILY SIZE
2.3
AVG HOUSEHOLD SIZE
5,726
LABOR FORCE [ PEOPLE ]
58.1%
PERCENT IN LABOR FORCE
4.2%
UNEMPLOYMENT RATE
Poulsbo Zip Codes
Poulsbo Area Codes
Income in Poulsbo
Income Overview in Poulsbo
Per Capita Income in Poulsbo is $48,310, while median incomes of families and households are $122,079 and $89,393 respectively.
| Characteristic | Number | Measure |
| Per Capita Income | 11,824 | $48,310 |
| Median Family Income | 3,126 | $122,079 |
| Mean Family Income | 3,126 | $138,393 |
| Median Household Income | 5,123 | $89,393 |
| Mean Household Income | 5,123 | $109,060 |
| Income Deficit | 3,126 | $0 |
| Wage / Income Gap (%) | 11,824 | 36.53% |
| Wage / Income Gap ($) | 11,824 | 63.47¢ per $1 |
| Gini / Inequality Index | 11,824 | 0.42 |
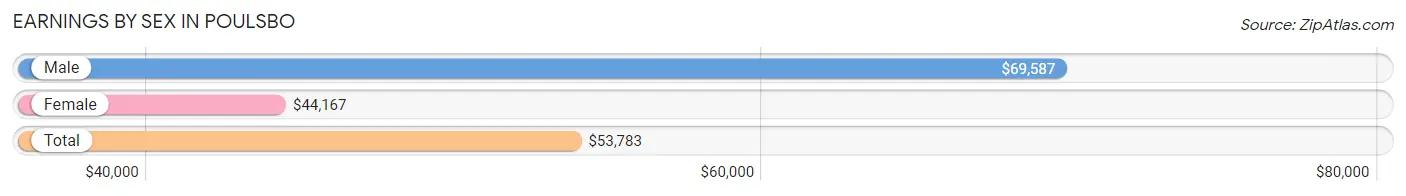
Earnings by Sex in Poulsbo
Average Earnings in Poulsbo are $53,783, $69,587 for men and $44,167 for women, a difference of 36.5%.
| Sex | Number | Average Earnings |
| Male | 3,212 (53.5%) | $69,587 |
| Female | 2,792 (46.5%) | $44,167 |
| Total | 6,004 (100.0%) | $53,783 |
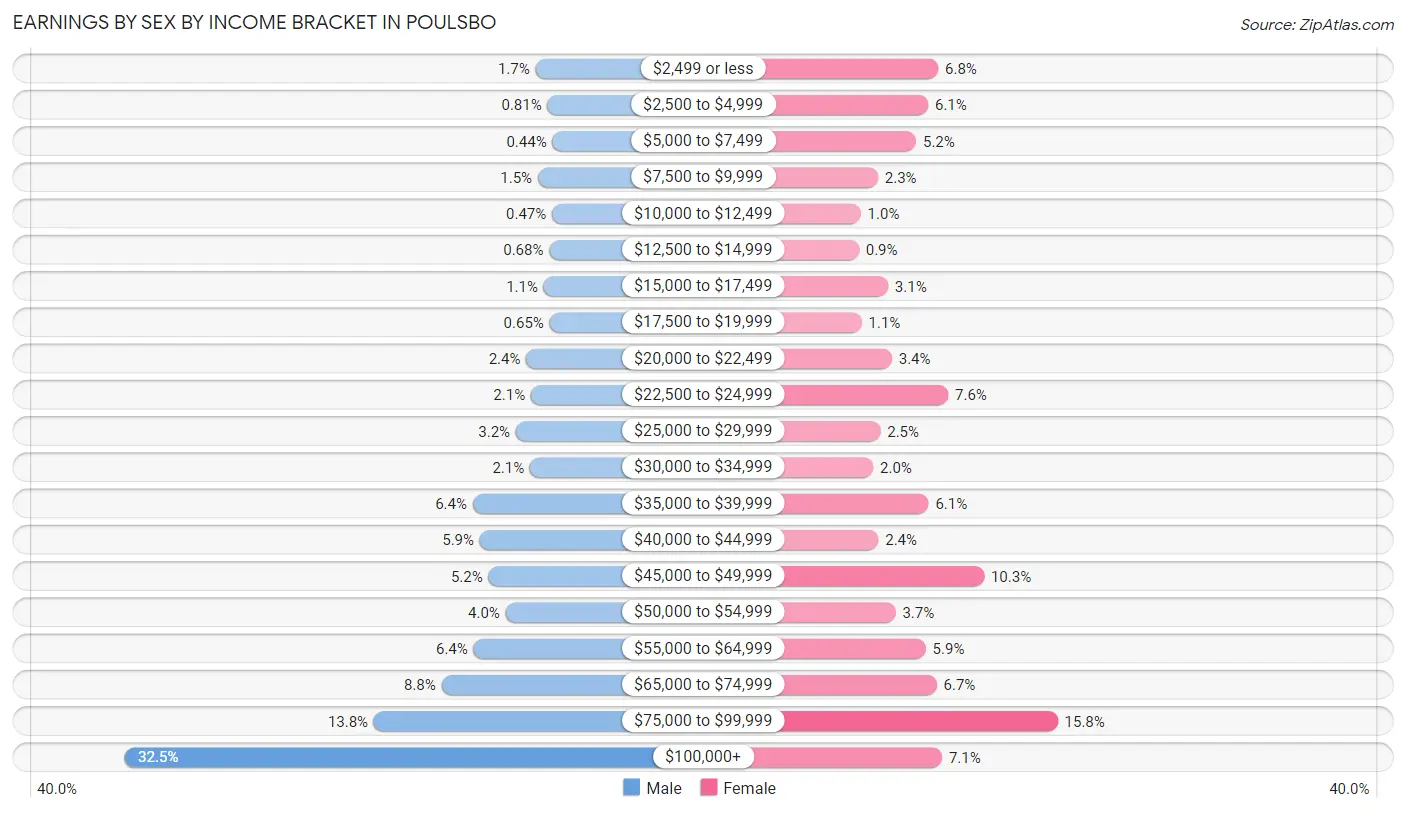
Earnings by Sex by Income Bracket in Poulsbo
The most common earnings brackets in Poulsbo are $100,000+ for men (1,043 | 32.5%) and $75,000 to $99,999 for women (441 | 15.8%).
| Income | Male | Female |
| $2,499 or less | 55 (1.7%) | 191 (6.8%) |
| $2,500 to $4,999 | 26 (0.8%) | 170 (6.1%) |
| $5,000 to $7,499 | 14 (0.4%) | 145 (5.2%) |
| $7,500 to $9,999 | 49 (1.5%) | 65 (2.3%) |
| $10,000 to $12,499 | 15 (0.5%) | 29 (1.0%) |
| $12,500 to $14,999 | 22 (0.7%) | 25 (0.9%) |
| $15,000 to $17,499 | 35 (1.1%) | 86 (3.1%) |
| $17,500 to $19,999 | 21 (0.6%) | 31 (1.1%) |
| $20,000 to $22,499 | 77 (2.4%) | 94 (3.4%) |
| $22,500 to $24,999 | 66 (2.1%) | 212 (7.6%) |
| $25,000 to $29,999 | 102 (3.2%) | 70 (2.5%) |
| $30,000 to $34,999 | 68 (2.1%) | 55 (2.0%) |
| $35,000 to $39,999 | 206 (6.4%) | 171 (6.1%) |
| $40,000 to $44,999 | 189 (5.9%) | 66 (2.4%) |
| $45,000 to $49,999 | 168 (5.2%) | 287 (10.3%) |
| $50,000 to $54,999 | 127 (4.0%) | 102 (3.6%) |
| $55,000 to $64,999 | 204 (6.4%) | 165 (5.9%) |
| $65,000 to $74,999 | 281 (8.7%) | 188 (6.7%) |
| $75,000 to $99,999 | 444 (13.8%) | 441 (15.8%) |
| $100,000+ | 1,043 (32.5%) | 199 (7.1%) |
| Total | 3,212 (100.0%) | 2,792 (100.0%) |
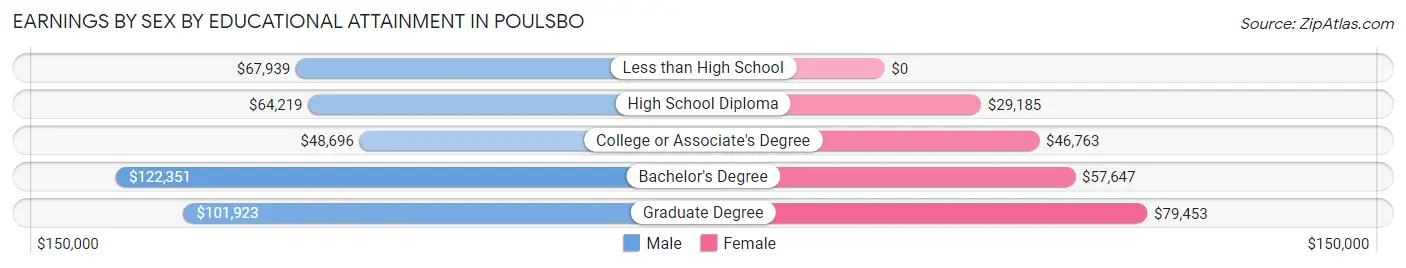
Earnings by Sex by Educational Attainment in Poulsbo
Average earnings in Poulsbo are $75,234 for men and $47,324 for women, a difference of 37.1%. Men with an educational attainment of bachelor's degree enjoy the highest average annual earnings of $122,351, while those with college or associate's degree education earn the least with $48,696. Women with an educational attainment of graduate degree earn the most with the average annual earnings of $79,453, while those with high school diploma education have the smallest earnings of $29,185.
| Educational Attainment | Male Income | Female Income |
| Less than High School | $67,939 | $0 |
| High School Diploma | $64,219 | $29,185 |
| College or Associate's Degree | $48,696 | $46,763 |
| Bachelor's Degree | $122,351 | $57,647 |
| Graduate Degree | $101,923 | $79,453 |
| Total | $75,234 | $47,324 |
Family Income in Poulsbo
Family Income Brackets in Poulsbo
According to the Poulsbo family income data, there are 872 families falling into the $100,000 to $149,999 income range, which is the most common income bracket and makes up 27.9% of all families. Conversely, the $10,000 to $14,999 income bracket is the least frequent group with only 13 families (0.4%) belonging to this category.
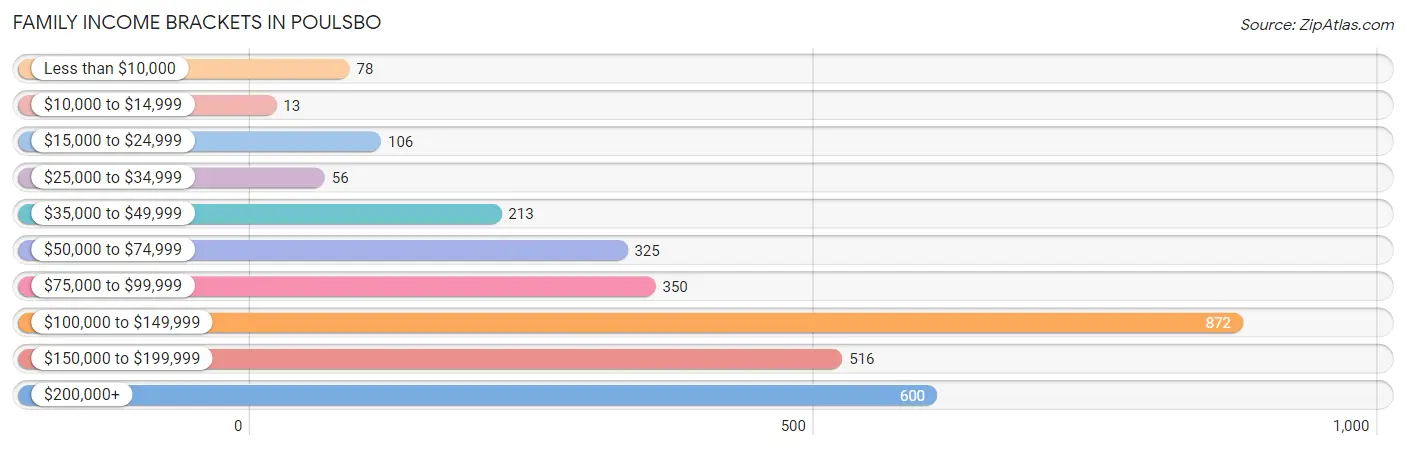
| Income Bracket | # Families | % Families |
| Less than $10,000 | 78 | 2.5% |
| $10,000 to $14,999 | 13 | 0.4% |
| $15,000 to $24,999 | 106 | 3.4% |
| $25,000 to $34,999 | 56 | 1.8% |
| $35,000 to $49,999 | 213 | 6.8% |
| $50,000 to $74,999 | 325 | 10.4% |
| $75,000 to $99,999 | 350 | 11.2% |
| $100,000 to $149,999 | 872 | 27.9% |
| $150,000 to $199,999 | 516 | 16.5% |
| $200,000+ | 600 | 19.2% |
Family Income by Famaliy Size in Poulsbo
5-person families (133 | 4.3%) account for the highest median family income in Poulsbo with $188,063 per family, while 3-person families (838 | 26.8%) have the highest median income of $54,773 per family member.
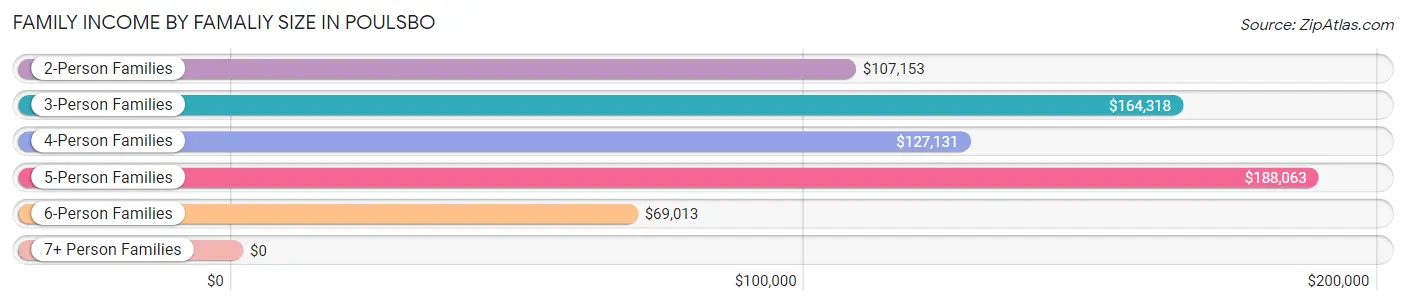
| Income Bracket | # Families | Median Income |
| 2-Person Families | 1,382 (44.2%) | $107,153 |
| 3-Person Families | 838 (26.8%) | $164,318 |
| 4-Person Families | 674 (21.6%) | $127,131 |
| 5-Person Families | 133 (4.3%) | $188,063 |
| 6-Person Families | 99 (3.2%) | $69,013 |
| 7+ Person Families | 0 (0.0%) | $0 |
| Total | 3,126 (100.0%) | $122,079 |
Family Income by Number of Earners in Poulsbo
The median family income in Poulsbo is $122,079, with families comprising 2 earners (1,316) having the highest median family income of $164,545, while families with no earners (549) have the lowest median family income of $66,726, accounting for 42.1% and 17.6% of families, respectively.
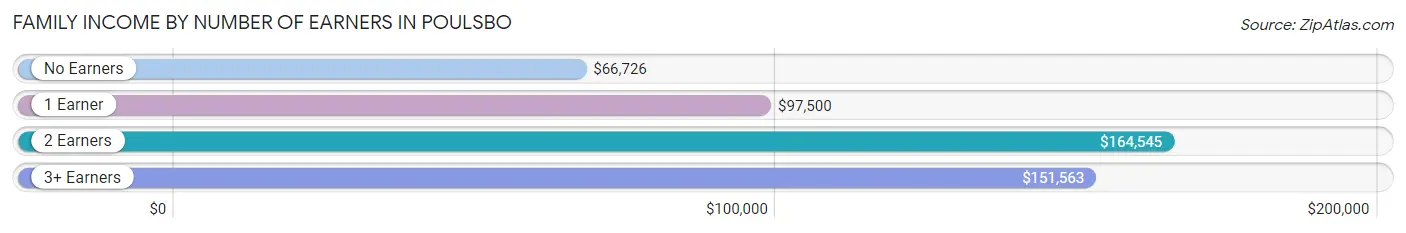
| Number of Earners | # Families | Median Income |
| No Earners | 549 (17.6%) | $66,726 |
| 1 Earner | 966 (30.9%) | $97,500 |
| 2 Earners | 1,316 (42.1%) | $164,545 |
| 3+ Earners | 295 (9.4%) | $151,563 |
| Total | 3,126 (100.0%) | $122,079 |
Household Income in Poulsbo
Household Income Brackets in Poulsbo
With 1,137 households falling in the category, the $100,000 to $149,999 income range is the most frequent in Poulsbo, accounting for 22.2% of all households. In contrast, only 154 households (3.0%) fall into the less than $10,000 income bracket, making it the least populous group.
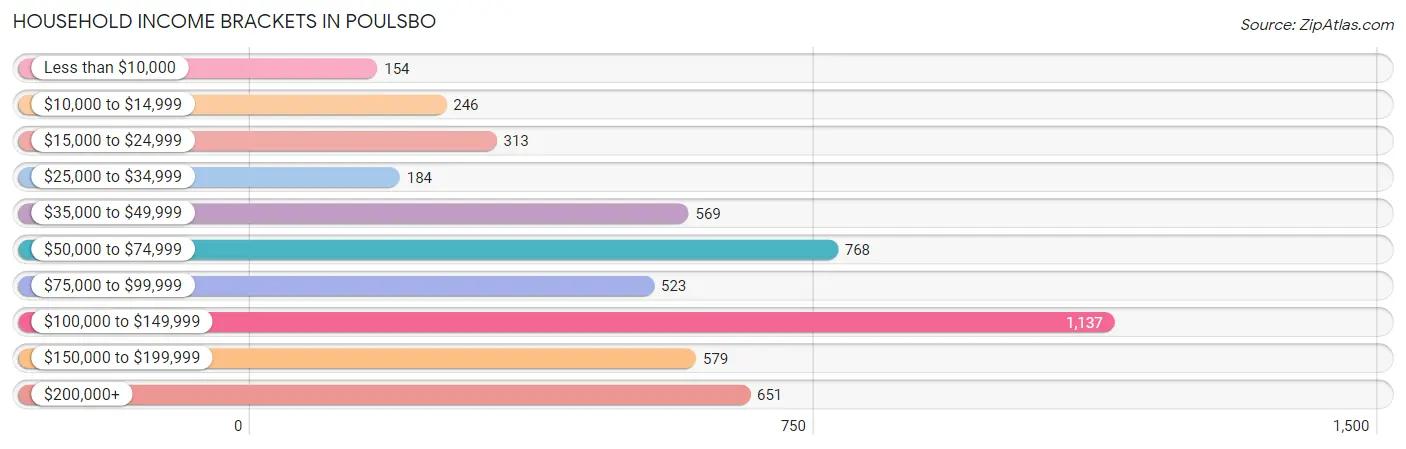
| Income Bracket | # Households | % Households |
| Less than $10,000 | 154 | 3.0% |
| $10,000 to $14,999 | 246 | 4.8% |
| $15,000 to $24,999 | 313 | 6.1% |
| $25,000 to $34,999 | 184 | 3.6% |
| $35,000 to $49,999 | 569 | 11.1% |
| $50,000 to $74,999 | 768 | 15.0% |
| $75,000 to $99,999 | 523 | 10.2% |
| $100,000 to $149,999 | 1,137 | 22.2% |
| $150,000 to $199,999 | 579 | 11.3% |
| $200,000+ | 651 | 12.7% |
Household Income by Householder Age in Poulsbo
The median household income in Poulsbo is $89,393, with the highest median household income of $122,722 found in the 45 to 64 years age bracket for the primary householder. A total of 1,936 households (37.8%) fall into this category. Meanwhile, the 15 to 24 years age bracket for the primary householder has the lowest median household income of $54,896, with 46 households (0.9%) in this group.
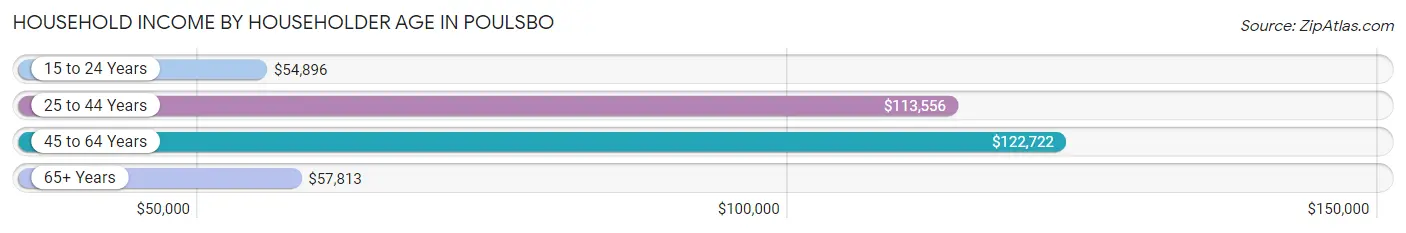
| Income Bracket | # Households | Median Income |
| 15 to 24 Years | 46 (0.9%) | $54,896 |
| 25 to 44 Years | 1,520 (29.7%) | $113,556 |
| 45 to 64 Years | 1,936 (37.8%) | $122,722 |
| 65+ Years | 1,621 (31.6%) | $57,813 |
| Total | 5,123 (100.0%) | $89,393 |
Poverty in Poulsbo
Income Below Poverty by Sex and Age in Poulsbo
With 8.4% poverty level for males and 9.1% for females among the residents of Poulsbo, 15 year old males and 18 to 24 year old females are the most vulnerable to poverty, with 28 males (37.3%) and 125 females (28.9%) in their respective age groups living below the poverty level.
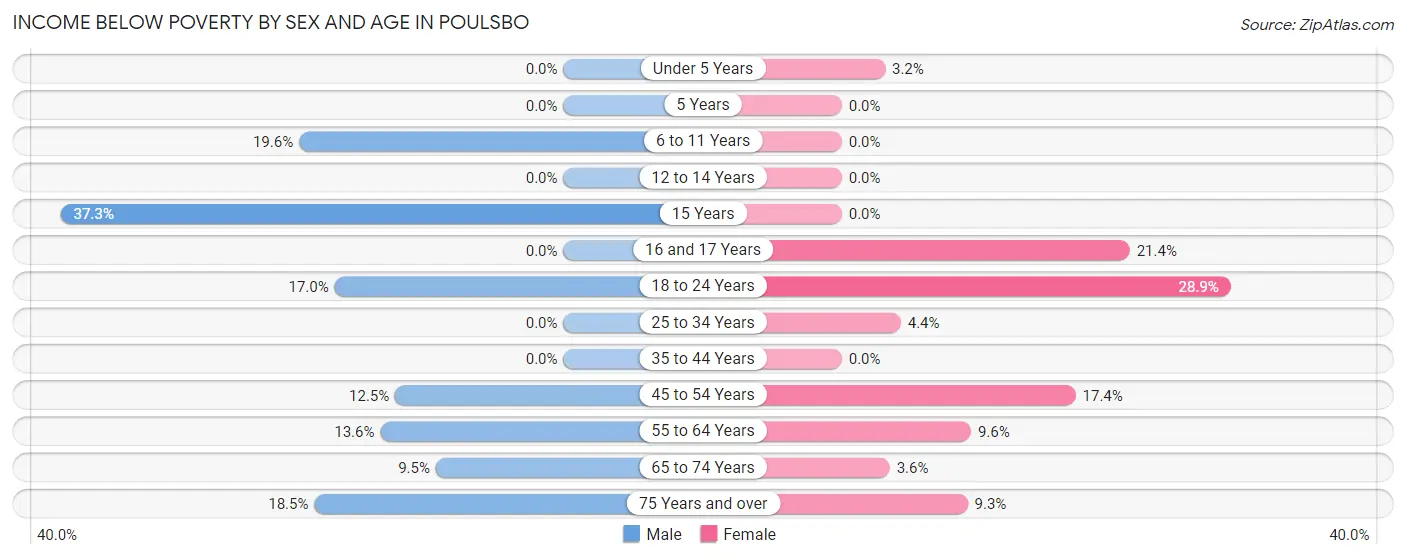
| Age Bracket | Male | Female |
| Under 5 Years | 0 (0.0%) | 12 (3.2%) |
| 5 Years | 0 (0.0%) | 0 (0.0%) |
| 6 to 11 Years | 63 (19.6%) | 0 (0.0%) |
| 12 to 14 Years | 0 (0.0%) | 0 (0.0%) |
| 15 Years | 28 (37.3%) | 0 (0.0%) |
| 16 and 17 Years | 0 (0.0%) | 62 (21.4%) |
| 18 to 24 Years | 62 (17.0%) | 125 (28.9%) |
| 25 to 34 Years | 0 (0.0%) | 33 (4.4%) |
| 35 to 44 Years | 0 (0.0%) | 0 (0.0%) |
| 45 to 54 Years | 111 (12.5%) | 158 (17.4%) |
| 55 to 64 Years | 67 (13.6%) | 85 (9.6%) |
| 65 to 74 Years | 62 (9.5%) | 25 (3.6%) |
| 75 Years and over | 71 (18.5%) | 55 (9.3%) |
| Total | 464 (8.4%) | 555 (9.1%) |
Income Above Poverty by Sex and Age in Poulsbo
According to the poverty statistics in Poulsbo, males aged under 5 years and females aged 5 years are the age groups that are most secure financially, with 100.0% of males and 100.0% of females in these age groups living above the poverty line.
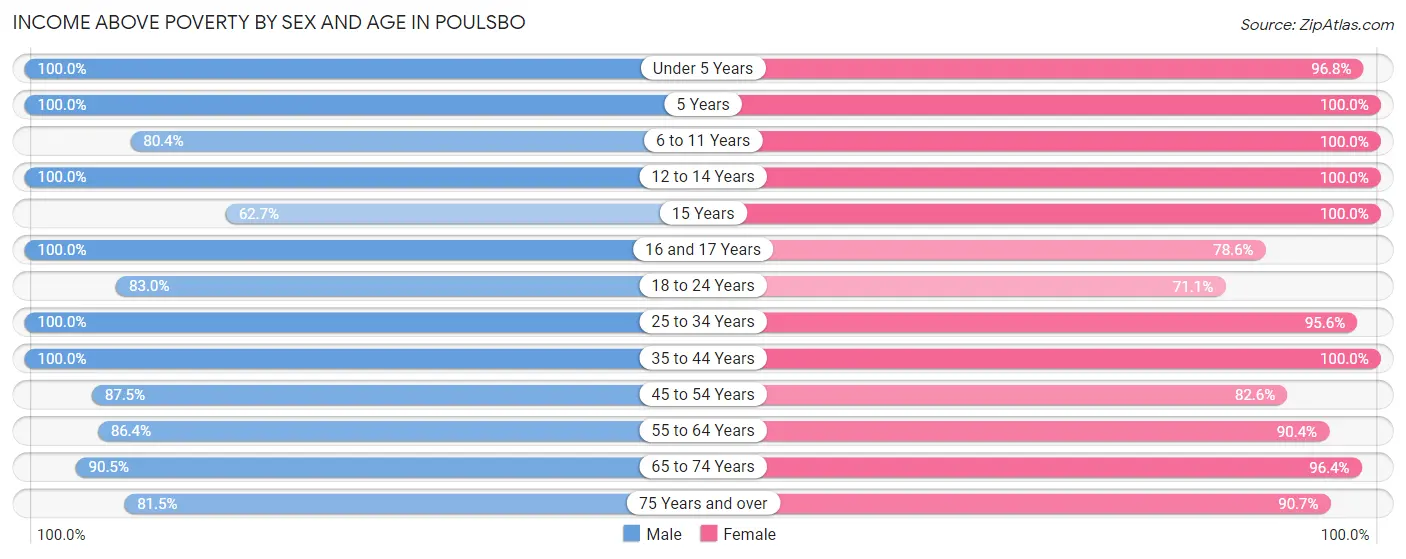
| Age Bracket | Male | Female |
| Under 5 Years | 327 (100.0%) | 362 (96.8%) |
| 5 Years | 68 (100.0%) | 10 (100.0%) |
| 6 to 11 Years | 258 (80.4%) | 347 (100.0%) |
| 12 to 14 Years | 249 (100.0%) | 120 (100.0%) |
| 15 Years | 47 (62.7%) | 57 (100.0%) |
| 16 and 17 Years | 85 (100.0%) | 228 (78.6%) |
| 18 to 24 Years | 303 (83.0%) | 308 (71.1%) |
| 25 to 34 Years | 915 (100.0%) | 721 (95.6%) |
| 35 to 44 Years | 689 (100.0%) | 645 (100.0%) |
| 45 to 54 Years | 778 (87.5%) | 752 (82.6%) |
| 55 to 64 Years | 426 (86.4%) | 801 (90.4%) |
| 65 to 74 Years | 593 (90.5%) | 677 (96.4%) |
| 75 Years and over | 313 (81.5%) | 534 (90.7%) |
| Total | 5,051 (91.6%) | 5,562 (90.9%) |
Income Below Poverty Among Married-Couple Families in Poulsbo
The poverty statistics for married-couple families in Poulsbo show that 3.1% or 76 of the total 2,474 families live below the poverty line. Families with no children have the highest poverty rate of 6.6%, comprising of 76 families. On the other hand, families with 1 or 2 children have the lowest poverty rate of 0.0%, which includes 0 families.
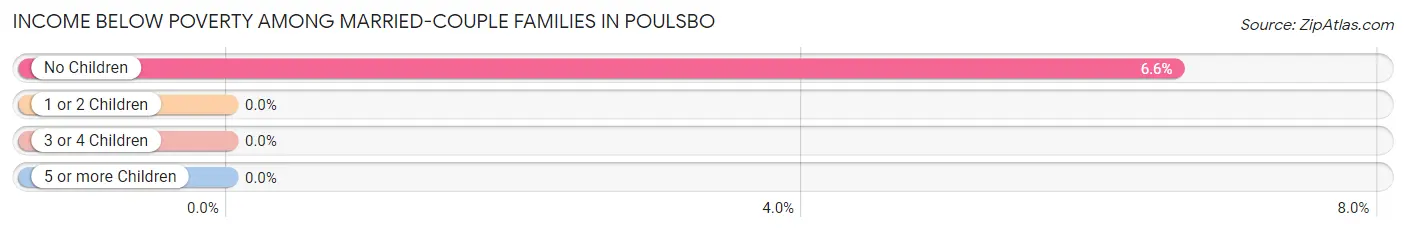
| Children | Above Poverty | Below Poverty |
| No Children | 1,077 (93.4%) | 76 (6.6%) |
| 1 or 2 Children | 1,161 (100.0%) | 0 (0.0%) |
| 3 or 4 Children | 160 (100.0%) | 0 (0.0%) |
| 5 or more Children | 0 (0.0%) | 0 (0.0%) |
| Total | 2,398 (96.9%) | 76 (3.1%) |
Income Below Poverty Among Single-Parent Households in Poulsbo
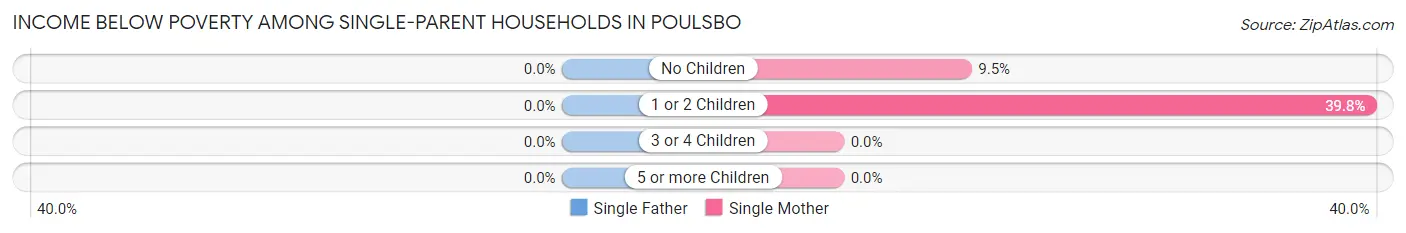
| Children | Single Father | Single Mother |
| No Children | 0 (0.0%) | 25 (9.5%) |
| 1 or 2 Children | 0 (0.0%) | 95 (39.8%) |
| 3 or 4 Children | 0 (0.0%) | 0 (0.0%) |
| 5 or more Children | 0 (0.0%) | 0 (0.0%) |
| Total | 0 (0.0%) | 120 (23.3%) |
Income Below Poverty Among Married-Couple vs Single-Parent Households in Poulsbo
The poverty data for Poulsbo shows that 76 of the married-couple family households (3.1%) and 120 of the single-parent households (18.4%) are living below the poverty level. Within the married-couple family households, those with no children have the highest poverty rate, with 76 households (6.6%) falling below the poverty line. Among the single-parent households, those with 1 or 2 children have the highest poverty rate, with 95 household (30.0%) living below poverty.
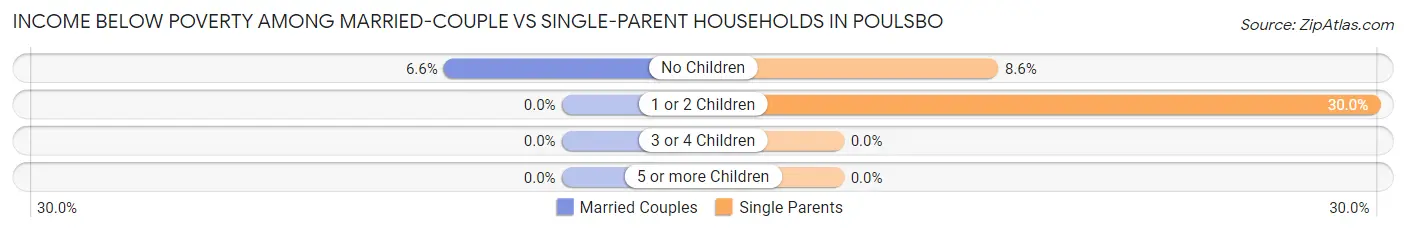
| Children | Married-Couple Families | Single-Parent Households |
| No Children | 76 (6.6%) | 25 (8.6%) |
| 1 or 2 Children | 0 (0.0%) | 95 (30.0%) |
| 3 or 4 Children | 0 (0.0%) | 0 (0.0%) |
| 5 or more Children | 0 (0.0%) | 0 (0.0%) |
| Total | 76 (3.1%) | 120 (18.4%) |
Race in Poulsbo
The most populous races in Poulsbo are White / Caucasian (9,346 | 79.0%), Two or more Races (1,520 | 12.9%), and Hispanic or Latino (1,184 | 10.0%).
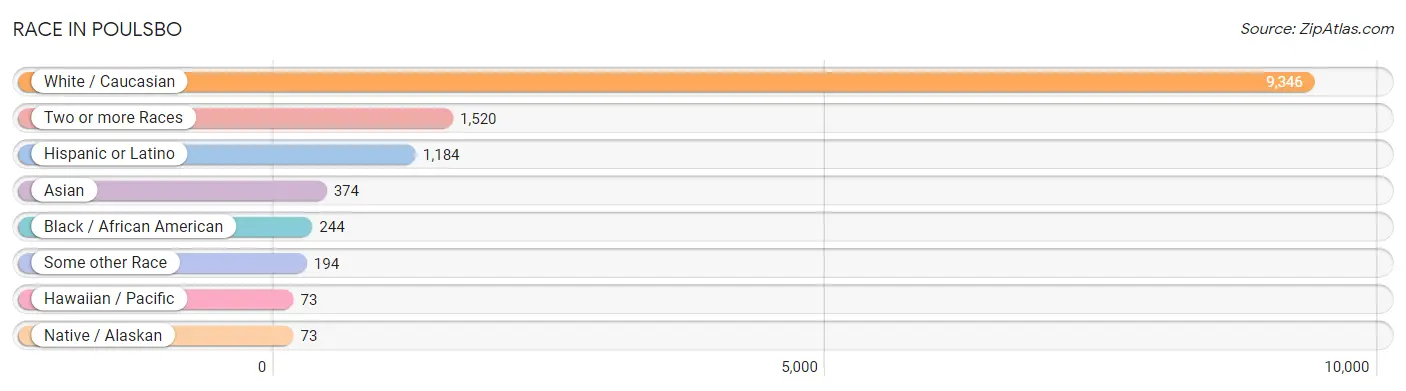
| Race | # Population | % Population |
| Asian | 374 | 3.2% |
| Black / African American | 244 | 2.1% |
| Hawaiian / Pacific | 73 | 0.6% |
| Hispanic or Latino | 1,184 | 10.0% |
| Native / Alaskan | 73 | 0.6% |
| White / Caucasian | 9,346 | 79.0% |
| Two or more Races | 1,520 | 12.9% |
| Some other Race | 194 | 1.6% |
| Total | 11,824 | 100.0% |
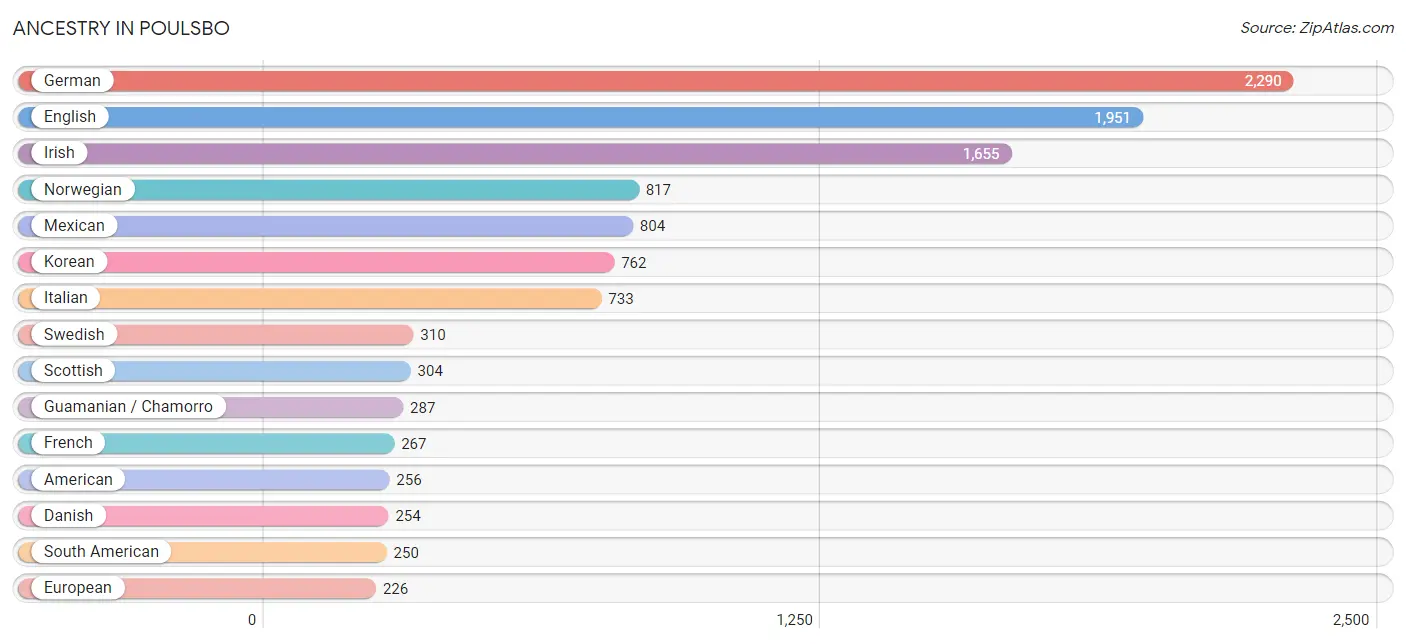
Ancestry in Poulsbo
The most populous ancestries reported in Poulsbo are German (2,290 | 19.4%), English (1,951 | 16.5%), Irish (1,655 | 14.0%), Norwegian (817 | 6.9%), and Mexican (804 | 6.8%), together accounting for 63.6% of all Poulsbo residents.
| Ancestry | # Population | % Population |
| Alaskan Athabascan | 33 | 0.3% |
| American | 256 | 2.2% |
| Arab | 105 | 0.9% |
| Argentinean | 7 | 0.1% |
| Austrian | 58 | 0.5% |
| Basque | 94 | 0.8% |
| Belgian | 11 | 0.1% |
| Bhutanese | 123 | 1.0% |
| British | 156 | 1.3% |
| Burmese | 52 | 0.4% |
| Canadian | 72 | 0.6% |
| Central American | 9 | 0.1% |
| Cherokee | 106 | 0.9% |
| Chilean | 70 | 0.6% |
| Colombian | 17 | 0.1% |
| Czech | 10 | 0.1% |
| Danish | 254 | 2.1% |
| Dutch | 149 | 1.3% |
| Eastern European | 82 | 0.7% |
| Ecuadorian | 156 | 1.3% |
| English | 1,951 | 16.5% |
| European | 226 | 1.9% |
| Finnish | 94 | 0.8% |
| French | 267 | 2.3% |
| French Canadian | 120 | 1.0% |
| German | 2,290 | 19.4% |
| Greek | 24 | 0.2% |
| Guamanian / Chamorro | 287 | 2.4% |
| Hungarian | 11 | 0.1% |
| Icelander | 9 | 0.1% |
| Indian (Asian) | 21 | 0.2% |
| Irish | 1,655 | 14.0% |
| Italian | 733 | 6.2% |
| Jamaican | 115 | 1.0% |
| Korean | 762 | 6.4% |
| Laotian | 12 | 0.1% |
| Latvian | 17 | 0.1% |
| Lebanese | 105 | 0.9% |
| Malaysian | 74 | 0.6% |
| Mexican | 804 | 6.8% |
| Native Hawaiian | 56 | 0.5% |
| Northern European | 117 | 1.0% |
| Norwegian | 817 | 6.9% |
| Pennsylvania German | 55 | 0.5% |
| Polish | 125 | 1.1% |
| Portuguese | 42 | 0.4% |
| Puerto Rican | 38 | 0.3% |
| Puget Sound Salish | 21 | 0.2% |
| Russian | 69 | 0.6% |
| Salvadoran | 9 | 0.1% |
| Samoan | 14 | 0.1% |
| Scandinavian | 71 | 0.6% |
| Scotch-Irish | 163 | 1.4% |
| Scottish | 304 | 2.6% |
| Sioux | 60 | 0.5% |
| Slovak | 18 | 0.2% |
| Slovene | 102 | 0.9% |
| South American | 250 | 2.1% |
| Spaniard | 58 | 0.5% |
| Spanish | 25 | 0.2% |
| Swedish | 310 | 2.6% |
| Swiss | 14 | 0.1% |
| Thai | 42 | 0.4% |
| Trinidadian and Tobagonian | 5 | 0.0% |
| Ukrainian | 37 | 0.3% |
| Welsh | 164 | 1.4% |
| Yugoslavian | 27 | 0.2% | View All 67 Rows |
Immigrants in Poulsbo
The most numerous immigrant groups reported in Poulsbo came from Latin America (388 | 3.3%), Asia (314 | 2.7%), Central America (165 | 1.4%), Mexico (165 | 1.4%), and South Eastern Asia (150 | 1.3%), together accounting for 10.0% of all Poulsbo residents.
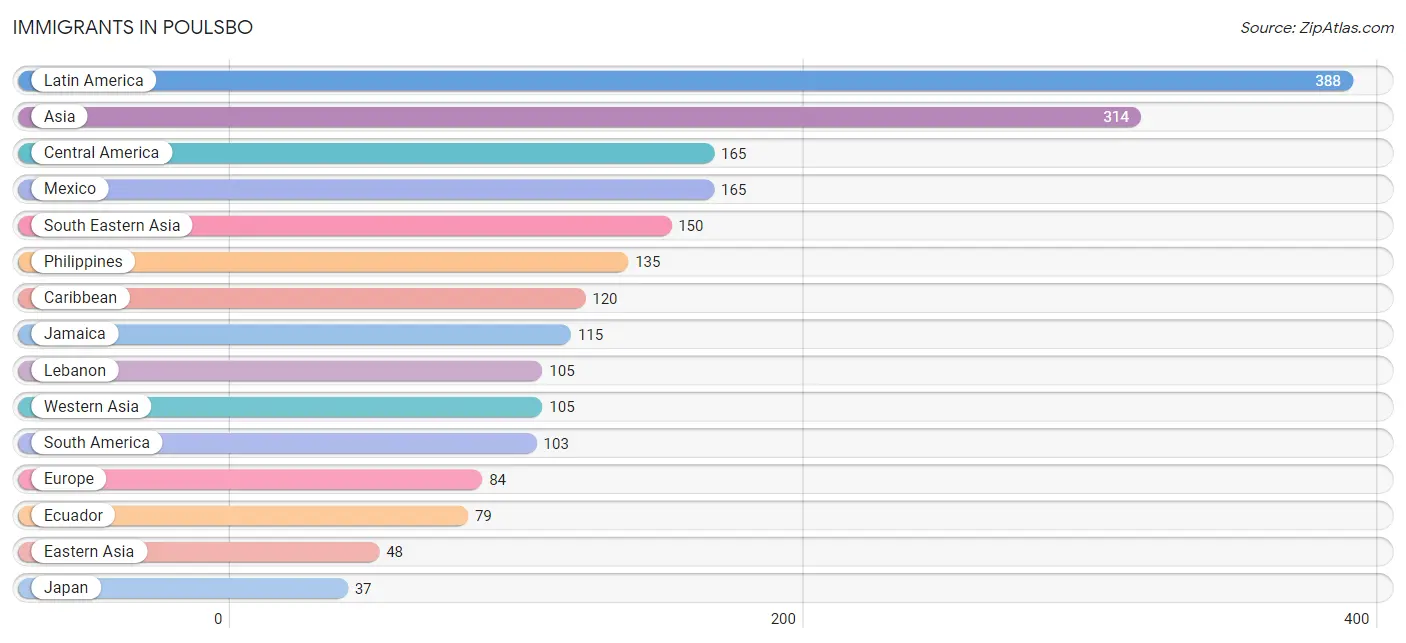
| Immigration Origin | # Population | % Population |
| Africa | 22 | 0.2% |
| Argentina | 24 | 0.2% |
| Asia | 314 | 2.7% |
| Canada | 34 | 0.3% |
| Caribbean | 120 | 1.0% |
| Central America | 165 | 1.4% |
| Eastern Africa | 12 | 0.1% |
| Eastern Asia | 48 | 0.4% |
| Eastern Europe | 12 | 0.1% |
| Ecuador | 79 | 0.7% |
| England | 3 | 0.0% |
| Europe | 84 | 0.7% |
| France | 4 | 0.0% |
| Germany | 9 | 0.1% |
| India | 11 | 0.1% |
| Jamaica | 115 | 1.0% |
| Japan | 37 | 0.3% |
| Kenya | 12 | 0.1% |
| Korea | 11 | 0.1% |
| Laos | 15 | 0.1% |
| Latin America | 388 | 3.3% |
| Lebanon | 105 | 0.9% |
| Mexico | 165 | 1.4% |
| Northern Europe | 27 | 0.2% |
| Philippines | 135 | 1.1% |
| Russia | 12 | 0.1% |
| South Africa | 10 | 0.1% |
| South America | 103 | 0.9% |
| South Central Asia | 11 | 0.1% |
| South Eastern Asia | 150 | 1.3% |
| Southern Europe | 18 | 0.2% |
| Spain | 18 | 0.2% |
| St. Vincent and the Grenadines | 5 | 0.0% |
| Switzerland | 14 | 0.1% |
| Western Asia | 105 | 0.9% |
| Western Europe | 27 | 0.2% | View All 36 Rows |
Sex and Age in Poulsbo
Sex and Age in Poulsbo
The most populous age groups in Poulsbo are 45 to 49 Years (542 | 9.7%) for men and 55 to 59 Years (593 | 9.5%) for women.
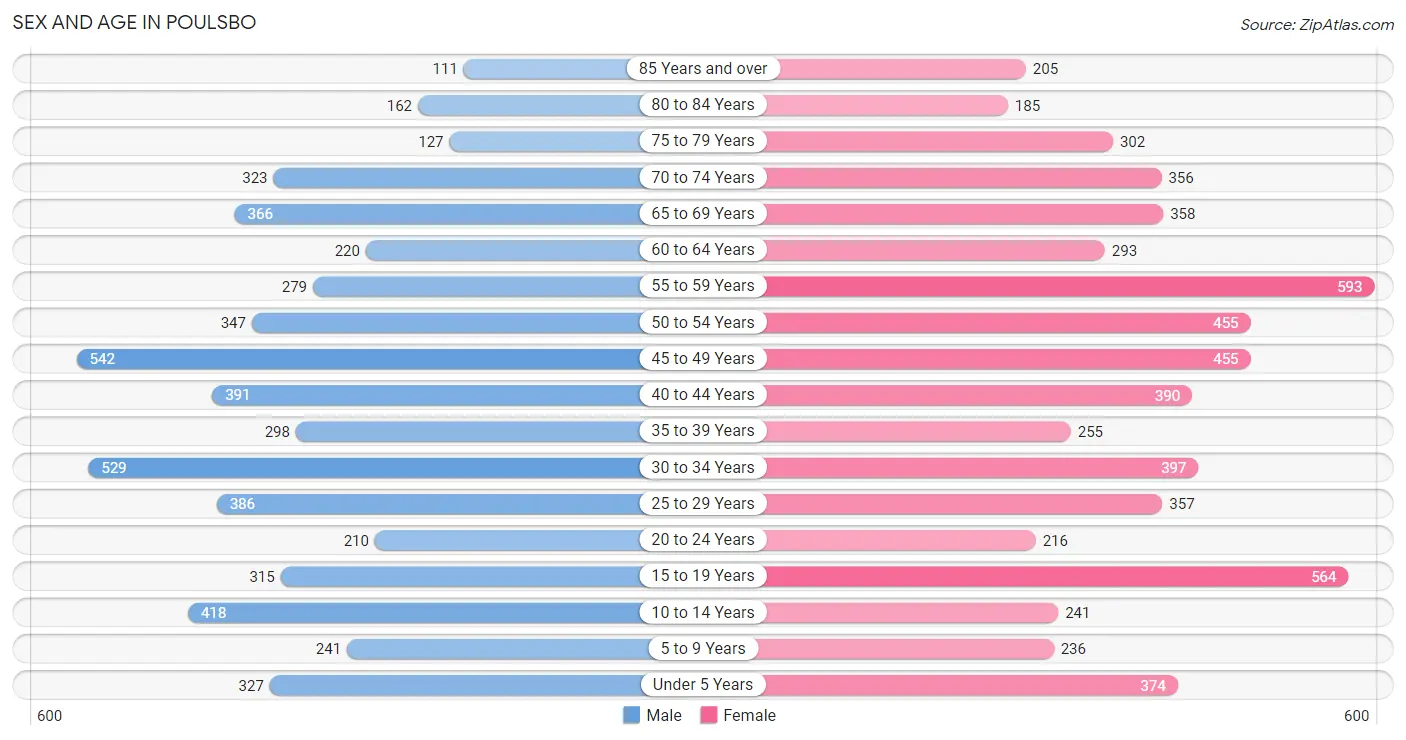
| Age Bracket | Male | Female |
| Under 5 Years | 327 (5.9%) | 374 (6.0%) |
| 5 to 9 Years | 241 (4.3%) | 236 (3.8%) |
| 10 to 14 Years | 418 (7.5%) | 241 (3.9%) |
| 15 to 19 Years | 315 (5.6%) | 564 (9.0%) |
| 20 to 24 Years | 210 (3.8%) | 216 (3.5%) |
| 25 to 29 Years | 386 (6.9%) | 357 (5.7%) |
| 30 to 34 Years | 529 (9.5%) | 397 (6.4%) |
| 35 to 39 Years | 298 (5.3%) | 255 (4.1%) |
| 40 to 44 Years | 391 (7.0%) | 390 (6.3%) |
| 45 to 49 Years | 542 (9.7%) | 455 (7.3%) |
| 50 to 54 Years | 347 (6.2%) | 455 (7.3%) |
| 55 to 59 Years | 279 (5.0%) | 593 (9.5%) |
| 60 to 64 Years | 220 (3.9%) | 293 (4.7%) |
| 65 to 69 Years | 366 (6.6%) | 358 (5.7%) |
| 70 to 74 Years | 323 (5.8%) | 356 (5.7%) |
| 75 to 79 Years | 127 (2.3%) | 302 (4.9%) |
| 80 to 84 Years | 162 (2.9%) | 185 (3.0%) |
| 85 Years and over | 111 (2.0%) | 205 (3.3%) |
| Total | 5,592 (100.0%) | 6,232 (100.0%) |
Families and Households in Poulsbo
Median Family Size in Poulsbo
The median family size in Poulsbo is 2.87 persons per family, with single female/mother families (516 | 16.5%) accounting for the largest median family size of 2.9 persons per family. On the other hand, single male/father families (136 | 4.3%) represent the smallest median family size with 2.44 persons per family.
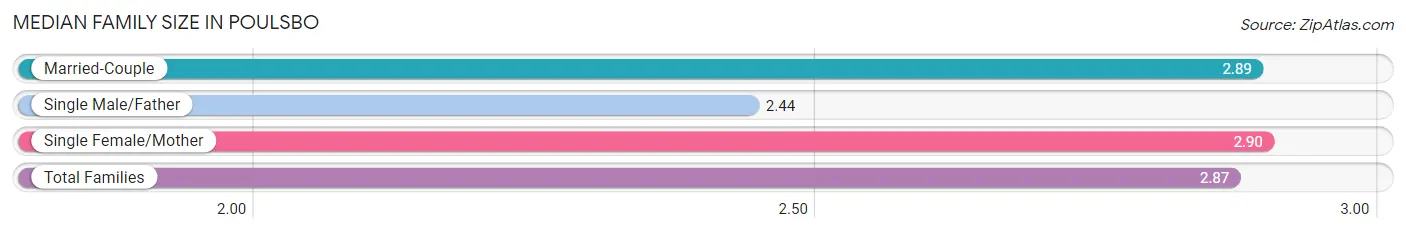
| Family Type | # Families | Family Size |
| Married-Couple | 2,474 (79.1%) | 2.89 |
| Single Male/Father | 136 (4.3%) | 2.44 |
| Single Female/Mother | 516 (16.5%) | 2.90 |
| Total Families | 3,126 (100.0%) | 2.87 |
Median Household Size in Poulsbo
The median household size in Poulsbo is 2.27 persons per household, with single female/mother households (516 | 10.1%) accounting for the largest median household size of 2.94 persons per household. non-family households (1,997 | 39.0%) represent the smallest median household size with 1.27 persons per household.
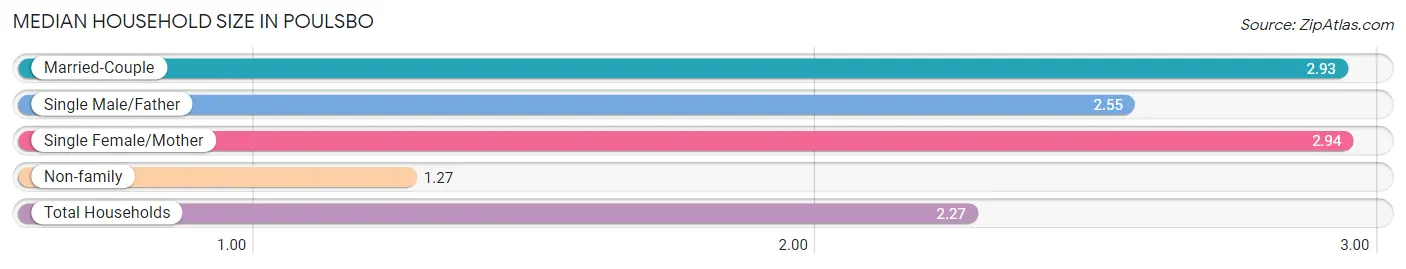
| Household Type | # Households | Household Size |
| Married-Couple | 2,474 (48.3%) | 2.93 |
| Single Male/Father | 136 (2.6%) | 2.55 |
| Single Female/Mother | 516 (10.1%) | 2.94 |
| Non-family | 1,997 (39.0%) | 1.27 |
| Total Households | 5,123 (100.0%) | 2.27 |
Household Size by Marriage Status in Poulsbo
Out of a total of 5,123 households in Poulsbo, 3,126 (61.0%) are family households, while 1,997 (39.0%) are nonfamily households. The most numerous type of family households are 2-person households, comprising 1,346, and the most common type of nonfamily households are 1-person households, comprising 1,677.
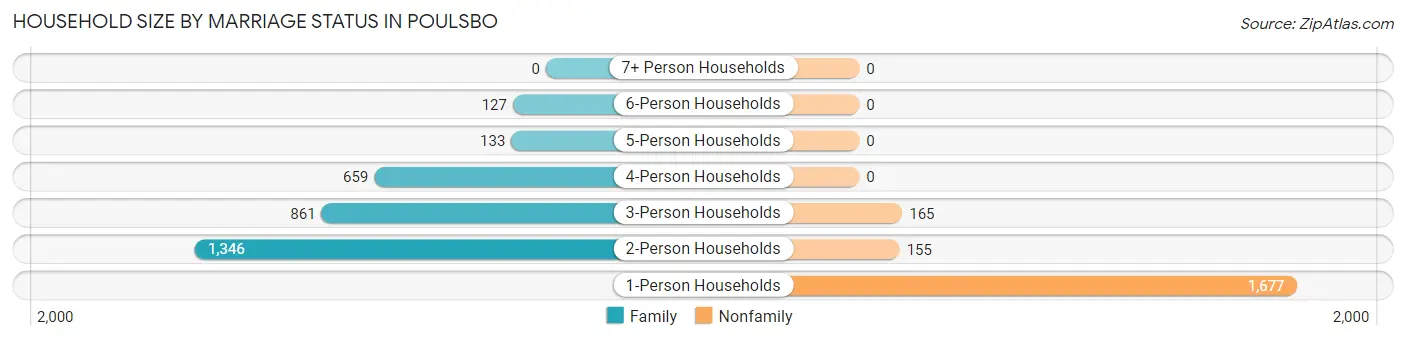
| Household Size | Family Households | Nonfamily Households |
| 1-Person Households | - | 1,677 (32.7%) |
| 2-Person Households | 1,346 (26.3%) | 155 (3.0%) |
| 3-Person Households | 861 (16.8%) | 165 (3.2%) |
| 4-Person Households | 659 (12.9%) | 0 (0.0%) |
| 5-Person Households | 133 (2.6%) | 0 (0.0%) |
| 6-Person Households | 127 (2.5%) | 0 (0.0%) |
| 7+ Person Households | 0 (0.0%) | 0 (0.0%) |
| Total | 3,126 (61.0%) | 1,997 (39.0%) |
Female Fertility in Poulsbo
Fertility by Age in Poulsbo
Average fertility rate in Poulsbo is 73.0 births per 1,000 women. Women in the age bracket of 20 to 34 years have the highest fertility rate with 187.0 births per 1,000 women. Women in the age bracket of 20 to 34 years acount for 92.8% of all women with births.
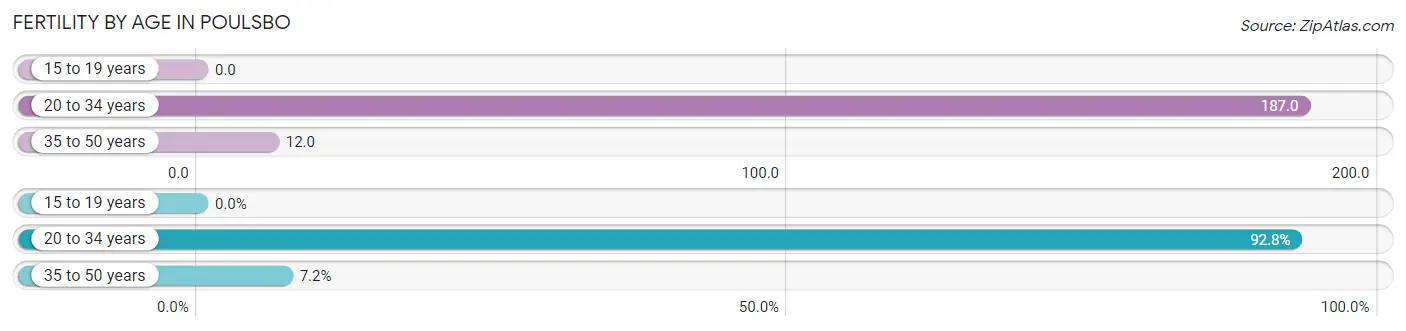
| Age Bracket | Women with Births | Births / 1,000 Women |
| 15 to 19 years | 0 (0.0%) | 0.0 |
| 20 to 34 years | 181 (92.8%) | 187.0 |
| 35 to 50 years | 14 (7.2%) | 12.0 |
| Total | 195 (100.0%) | 73.0 |
Fertility by Age by Marriage Status in Poulsbo
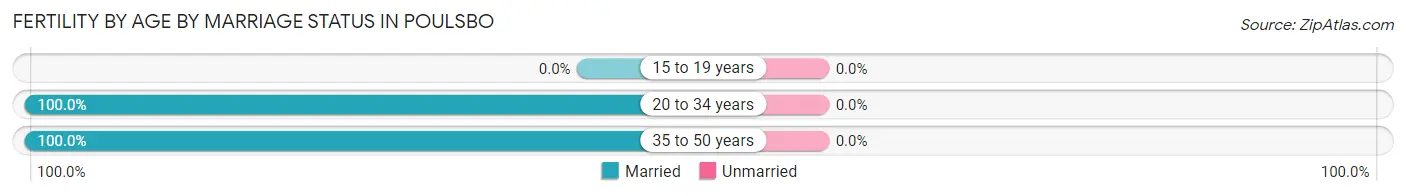
| Age Bracket | Married | Unmarried |
| 15 to 19 years | 0 (0.0%) | 0 (0.0%) |
| 20 to 34 years | 181 (100.0%) | 0 (0.0%) |
| 35 to 50 years | 14 (100.0%) | 0 (0.0%) |
| Total | 195 (100.0%) | 0 (0.0%) |
Fertility by Education in Poulsbo
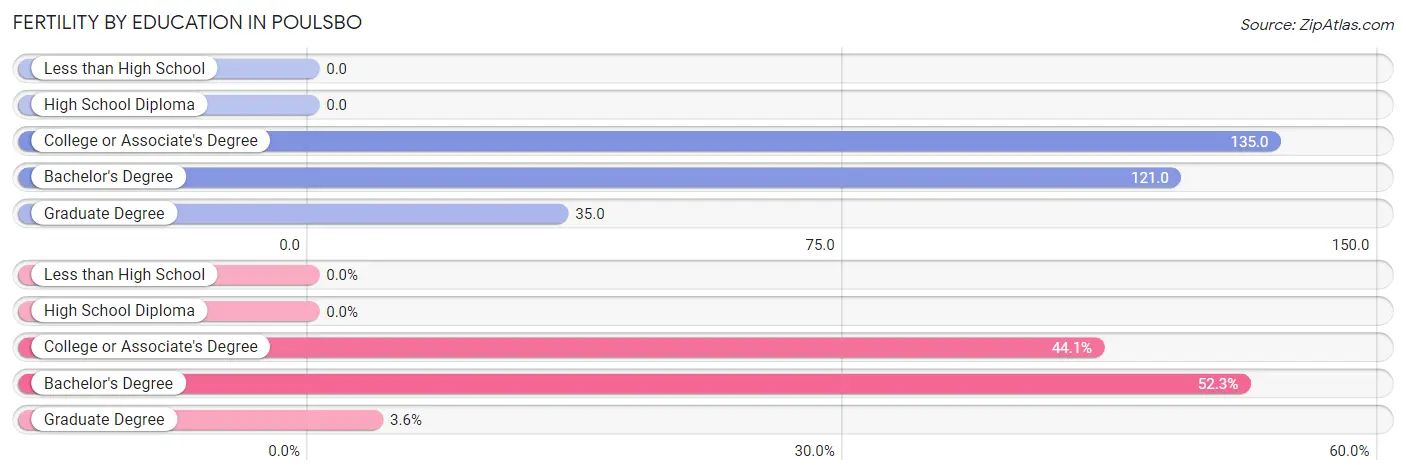
| Educational Attainment | Women with Births | Births / 1,000 Women |
| Less than High School | 0 (0.0%) | 0.0 |
| High School Diploma | 0 (0.0%) | 0.0 |
| College or Associate's Degree | 86 (44.1%) | 135.0 |
| Bachelor's Degree | 102 (52.3%) | 121.0 |
| Graduate Degree | 7 (3.6%) | 35.0 |
| Total | 195 (100.0%) | 73.0 |
Fertility by Education by Marriage Status in Poulsbo
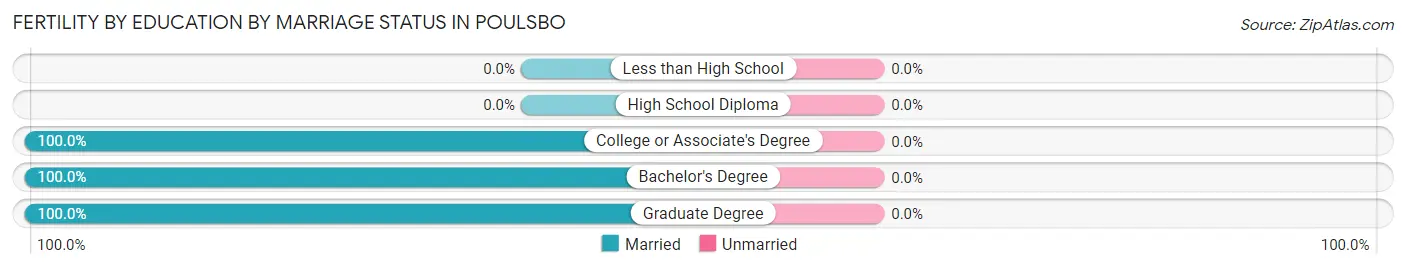
| Educational Attainment | Married | Unmarried |
| Less than High School | 0 (0.0%) | 0 (0.0%) |
| High School Diploma | 0 (0.0%) | 0 (0.0%) |
| College or Associate's Degree | 86 (100.0%) | 0 (0.0%) |
| Bachelor's Degree | 102 (100.0%) | 0 (0.0%) |
| Graduate Degree | 7 (100.0%) | 0 (0.0%) |
| Total | 195 (100.0%) | 0 (0.0%) |
Employment Characteristics in Poulsbo
Employment by Class of Employer in Poulsbo
Among the 5,460 employed individuals in Poulsbo, private company employees (2,987 | 54.7%), federal government employees (1,120 | 20.5%), and local government employees (416 | 7.6%) make up the most common classes of employment.
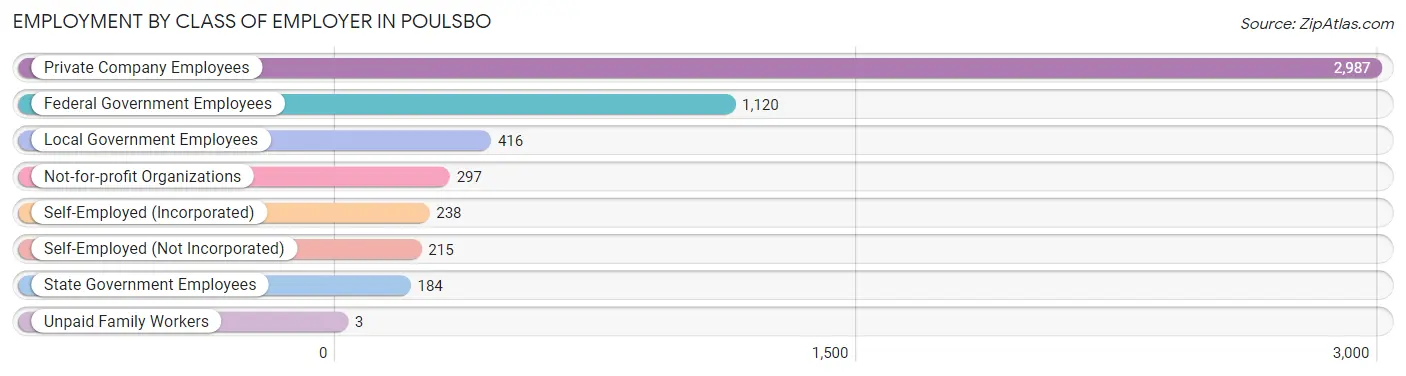
| Employer Class | # Employees | % Employees |
| Private Company Employees | 2,987 | 54.7% |
| Self-Employed (Incorporated) | 238 | 4.4% |
| Self-Employed (Not Incorporated) | 215 | 3.9% |
| Not-for-profit Organizations | 297 | 5.4% |
| Local Government Employees | 416 | 7.6% |
| State Government Employees | 184 | 3.4% |
| Federal Government Employees | 1,120 | 20.5% |
| Unpaid Family Workers | 3 | 0.1% |
| Total | 5,460 | 100.0% |
Employment Status by Age in Poulsbo
According to the labor force statistics for Poulsbo, out of the total population over 16 years of age (9,855), 58.1% or 5,726 individuals are in the labor force, with 4.2% or 240 of them unemployed. The age group with the highest labor force participation rate is 25 to 29 years, with 87.2% or 648 individuals in the labor force. Within the labor force, the 16 to 19 years age range has the highest percentage of unemployed individuals, with 21.4% or 66 of them being unemployed.
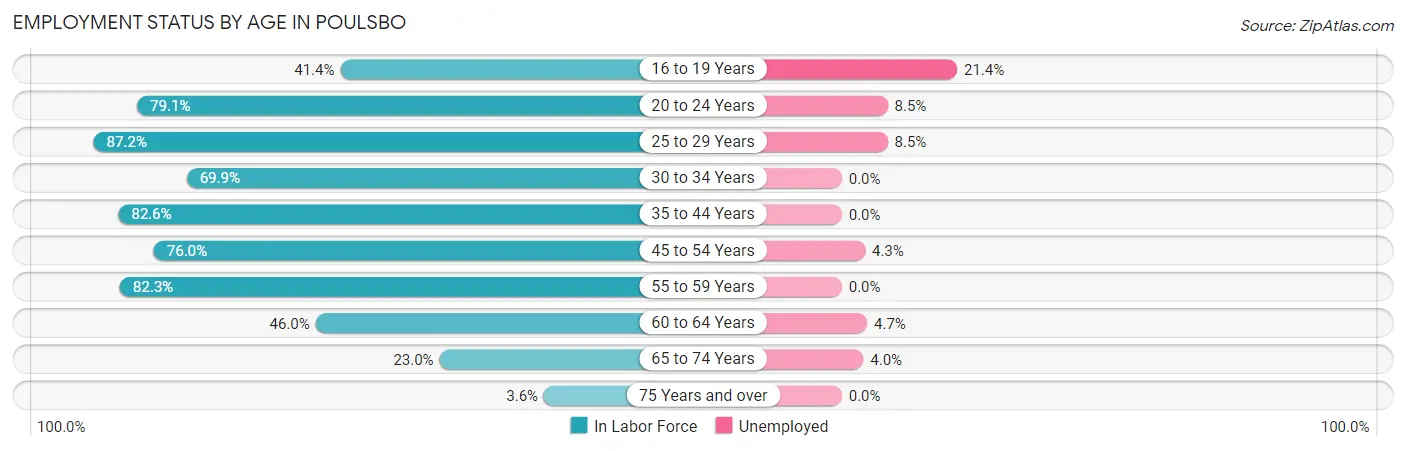
| Age Bracket | In Labor Force | Unemployed |
| 16 to 19 Years | 309 (41.4%) | 66 (21.4%) |
| 20 to 24 Years | 337 (79.1%) | 29 (8.5%) |
| 25 to 29 Years | 648 (87.2%) | 55 (8.5%) |
| 30 to 34 Years | 647 (69.9%) | 0 (0.0%) |
| 35 to 44 Years | 1,102 (82.6%) | 0 (0.0%) |
| 45 to 54 Years | 1,367 (76.0%) | 59 (4.3%) |
| 55 to 59 Years | 718 (82.3%) | 0 (0.0%) |
| 60 to 64 Years | 236 (46.0%) | 11 (4.7%) |
| 65 to 74 Years | 323 (23.0%) | 13 (4.0%) |
| 75 Years and over | 39 (3.6%) | 0 (0.0%) |
| Total | 5,726 (58.1%) | 240 (4.2%) |
Employment Status by Educational Attainment in Poulsbo
According to labor force statistics for Poulsbo, 76.3% of individuals (4,721) out of the total population between 25 and 64 years of age (6,187) are in the labor force, with 2.7% or 127 of them being unemployed. The group with the highest labor force participation rate are those with the educational attainment of bachelor's degree or higher, with 85.1% or 2,233 individuals in the labor force. Within the labor force, individuals with bachelor's degree or higher education have the highest percentage of unemployment, with 3.9% or 87 of them being unemployed.
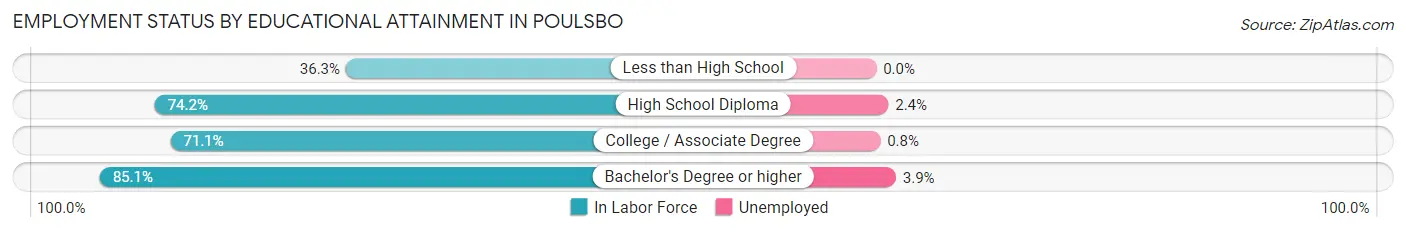
| Educational Attainment | In Labor Force | Unemployed |
| Less than High School | 94 (36.3%) | 0 (0.0%) |
| High School Diploma | 1,005 (74.2%) | 32 (2.4%) |
| College / Associate Degree | 1,386 (71.1%) | 16 (0.8%) |
| Bachelor's Degree or higher | 2,233 (85.1%) | 102 (3.9%) |
| Total | 4,721 (76.3%) | 167 (2.7%) |
Employment Occupations by Sex in Poulsbo
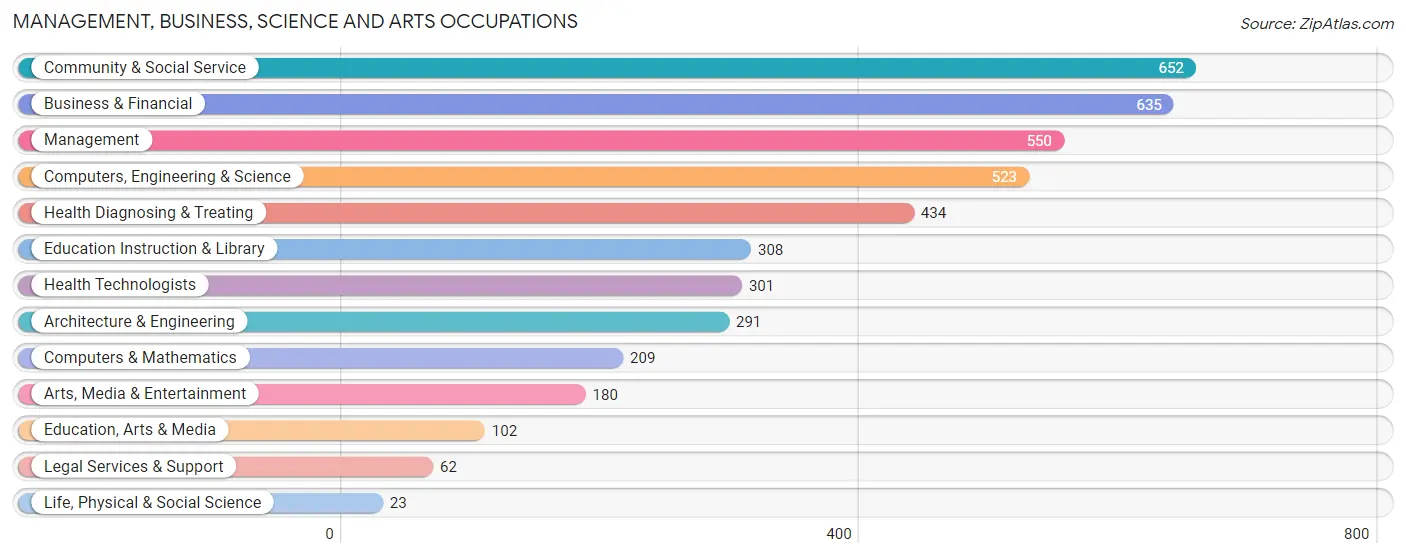
Management, Business, Science and Arts Occupations
The most common Management, Business, Science and Arts occupations in Poulsbo are Community & Social Service (652 | 12.8%), Business & Financial (635 | 12.4%), Management (550 | 10.8%), Computers, Engineering & Science (523 | 10.2%), and Health Diagnosing & Treating (434 | 8.5%).
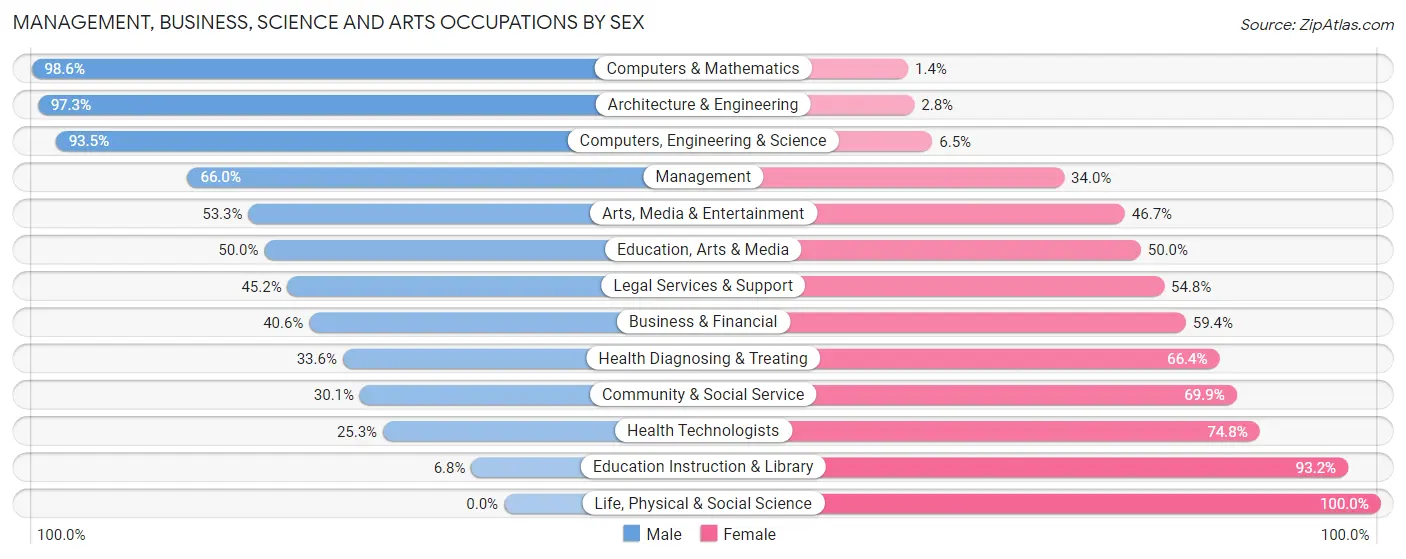
Management, Business, Science and Arts Occupations by Sex
Within the Management, Business, Science and Arts occupations in Poulsbo, the most male-oriented occupations are Computers & Mathematics (98.6%), Architecture & Engineering (97.3%), and Computers, Engineering & Science (93.5%), while the most female-oriented occupations are Life, Physical & Social Science (100.0%), Education Instruction & Library (93.2%), and Health Technologists (74.8%).
| Occupation | Male | Female |
| Management | 363 (66.0%) | 187 (34.0%) |
| Business & Financial | 258 (40.6%) | 377 (59.4%) |
| Computers, Engineering & Science | 489 (93.5%) | 34 (6.5%) |
| Computers & Mathematics | 206 (98.6%) | 3 (1.4%) |
| Architecture & Engineering | 283 (97.3%) | 8 (2.8%) |
| Life, Physical & Social Science | 0 (0.0%) | 23 (100.0%) |
| Community & Social Service | 196 (30.1%) | 456 (69.9%) |
| Education, Arts & Media | 51 (50.0%) | 51 (50.0%) |
| Legal Services & Support | 28 (45.2%) | 34 (54.8%) |
| Education Instruction & Library | 21 (6.8%) | 287 (93.2%) |
| Arts, Media & Entertainment | 96 (53.3%) | 84 (46.7%) |
| Health Diagnosing & Treating | 146 (33.6%) | 288 (66.4%) |
| Health Technologists | 76 (25.3%) | 225 (74.8%) |
| Total (Category) | 1,452 (52.0%) | 1,342 (48.0%) |
| Total (Overall) | 2,690 (52.7%) | 2,410 (47.2%) |
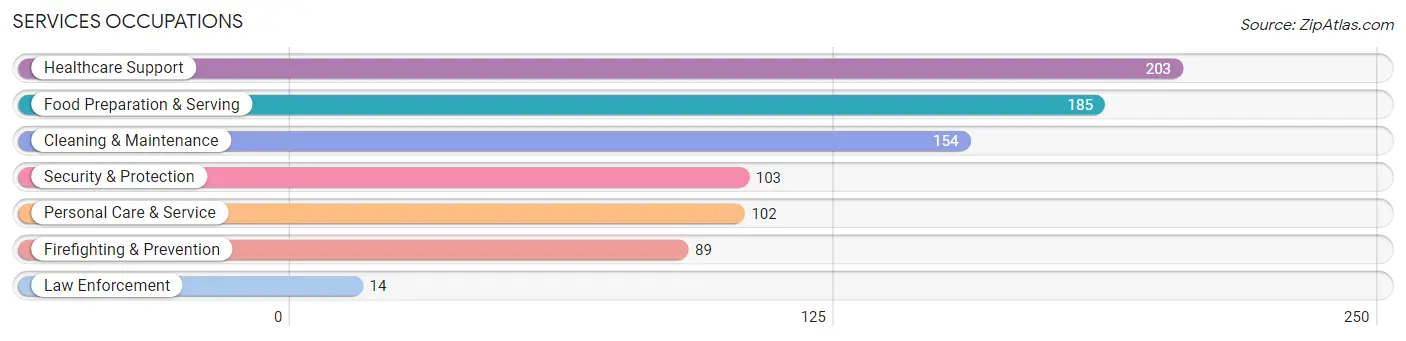
Services Occupations
The most common Services occupations in Poulsbo are Healthcare Support (203 | 4.0%), Food Preparation & Serving (185 | 3.6%), Cleaning & Maintenance (154 | 3.0%), Security & Protection (103 | 2.0%), and Personal Care & Service (102 | 2.0%).
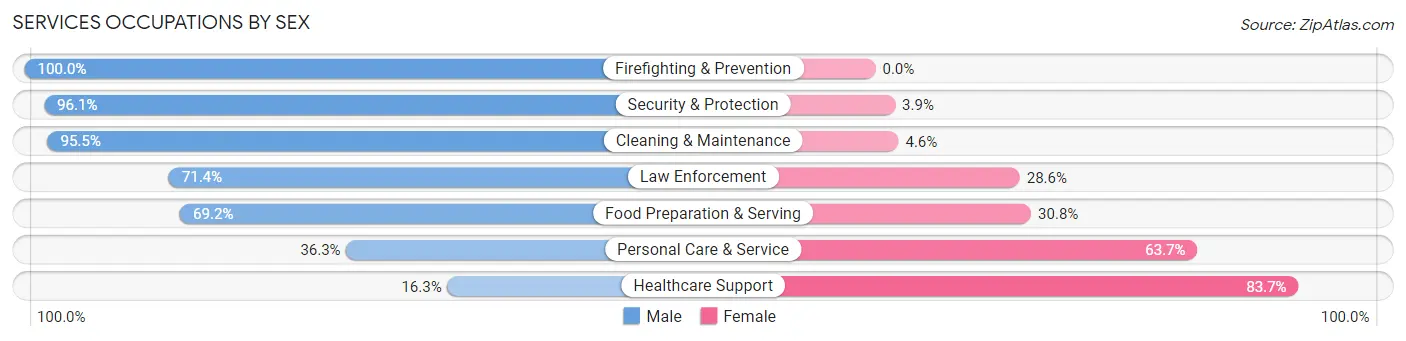
Services Occupations by Sex
Within the Services occupations in Poulsbo, the most male-oriented occupations are Firefighting & Prevention (100.0%), Security & Protection (96.1%), and Cleaning & Maintenance (95.5%), while the most female-oriented occupations are Healthcare Support (83.7%), Personal Care & Service (63.7%), and Food Preparation & Serving (30.8%).
| Occupation | Male | Female |
| Healthcare Support | 33 (16.3%) | 170 (83.7%) |
| Security & Protection | 99 (96.1%) | 4 (3.9%) |
| Firefighting & Prevention | 89 (100.0%) | 0 (0.0%) |
| Law Enforcement | 10 (71.4%) | 4 (28.6%) |
| Food Preparation & Serving | 128 (69.2%) | 57 (30.8%) |
| Cleaning & Maintenance | 147 (95.5%) | 7 (4.5%) |
| Personal Care & Service | 37 (36.3%) | 65 (63.7%) |
| Total (Category) | 444 (59.4%) | 303 (40.6%) |
| Total (Overall) | 2,690 (52.7%) | 2,410 (47.2%) |
Sales and Office Occupations
The most common Sales and Office occupations in Poulsbo are Office & Administration (545 | 10.7%), and Sales & Related (333 | 6.5%).
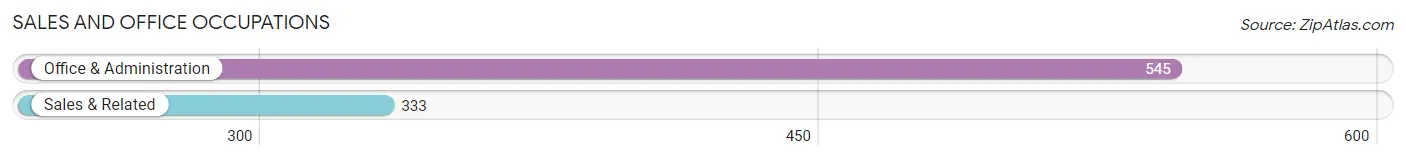
Sales and Office Occupations by Sex
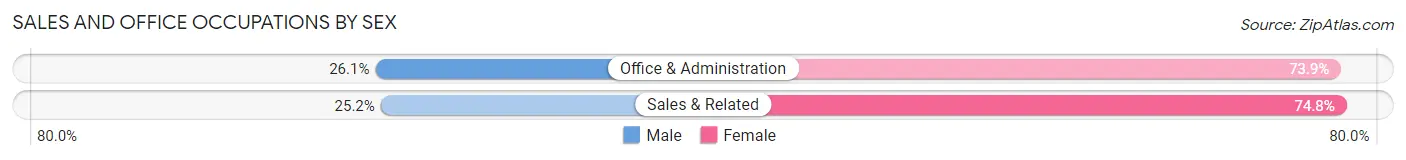
| Occupation | Male | Female |
| Sales & Related | 84 (25.2%) | 249 (74.8%) |
| Office & Administration | 142 (26.1%) | 403 (73.9%) |
| Total (Category) | 226 (25.7%) | 652 (74.3%) |
| Total (Overall) | 2,690 (52.7%) | 2,410 (47.2%) |
Natural Resources, Construction and Maintenance Occupations
The most common Natural Resources, Construction and Maintenance occupations in Poulsbo are Construction & Extraction (154 | 3.0%), Installation, Maintenance & Repair (102 | 2.0%), and Farming, Fishing & Forestry (33 | 0.6%).
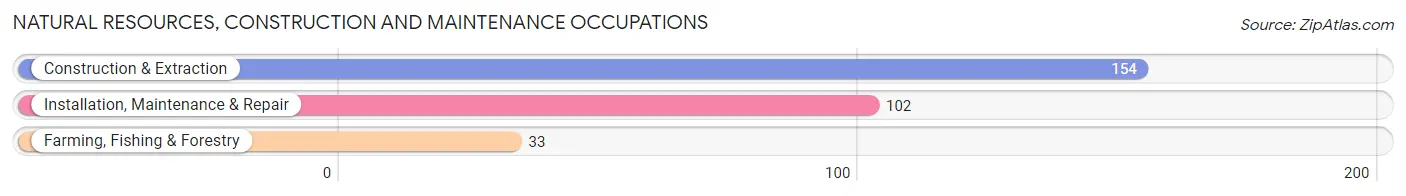
Natural Resources, Construction and Maintenance Occupations by Sex
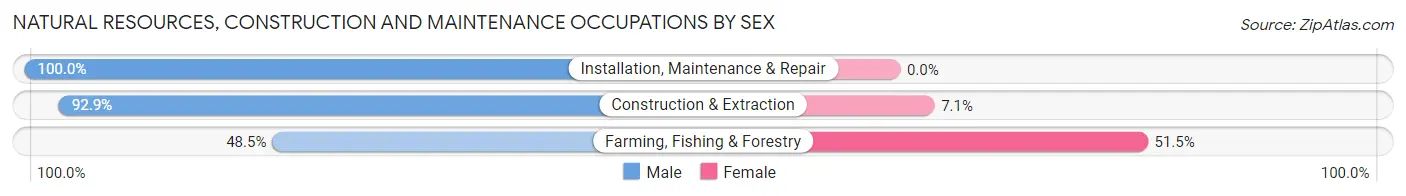
| Occupation | Male | Female |
| Farming, Fishing & Forestry | 16 (48.5%) | 17 (51.5%) |
| Construction & Extraction | 143 (92.9%) | 11 (7.1%) |
| Installation, Maintenance & Repair | 102 (100.0%) | 0 (0.0%) |
| Total (Category) | 261 (90.3%) | 28 (9.7%) |
| Total (Overall) | 2,690 (52.7%) | 2,410 (47.2%) |
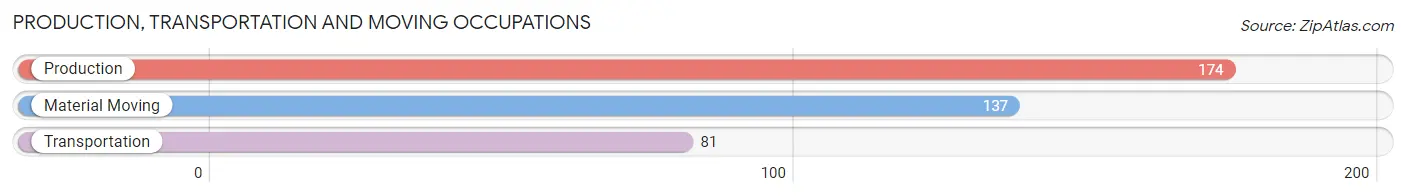
Production, Transportation and Moving Occupations
The most common Production, Transportation and Moving occupations in Poulsbo are Production (174 | 3.4%), Material Moving (137 | 2.7%), and Transportation (81 | 1.6%).
Production, Transportation and Moving Occupations by Sex
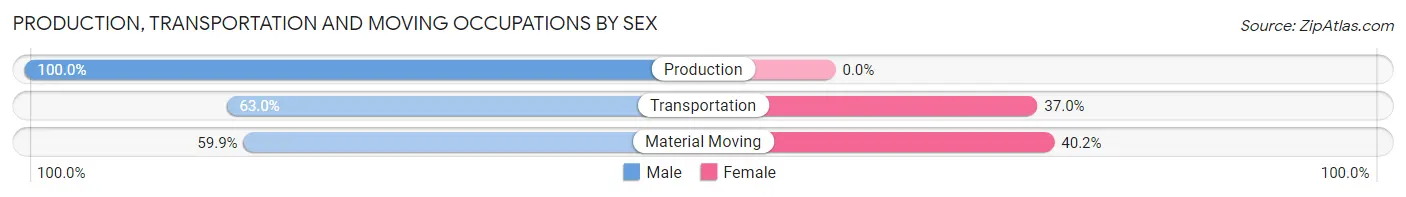
| Occupation | Male | Female |
| Production | 174 (100.0%) | 0 (0.0%) |
| Transportation | 51 (63.0%) | 30 (37.0%) |
| Material Moving | 82 (59.9%) | 55 (40.2%) |
| Total (Category) | 307 (78.3%) | 85 (21.7%) |
| Total (Overall) | 2,690 (52.7%) | 2,410 (47.2%) |
Employment Industries by Sex in Poulsbo
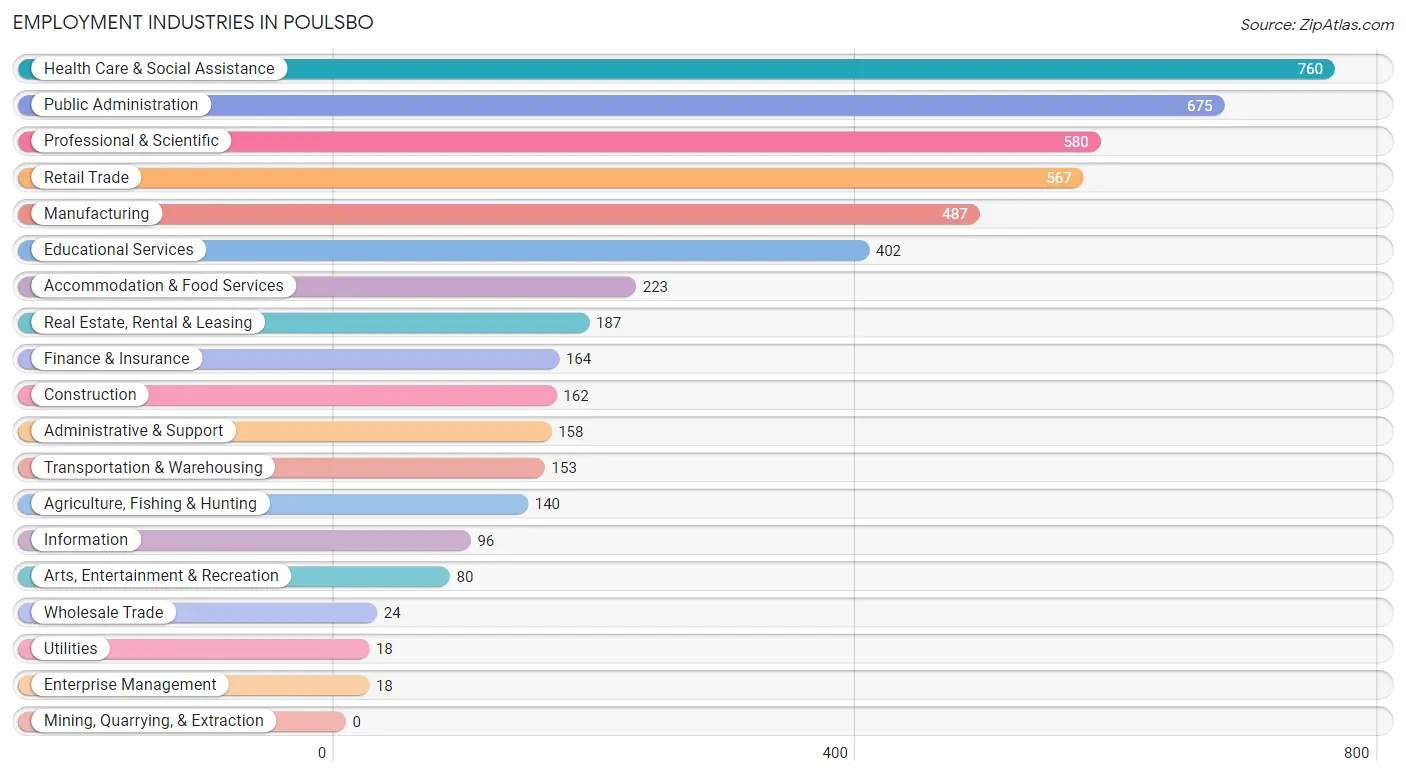
Employment Industries in Poulsbo
The major employment industries in Poulsbo include Health Care & Social Assistance (760 | 14.9%), Public Administration (675 | 13.2%), Professional & Scientific (580 | 11.4%), Retail Trade (567 | 11.1%), and Manufacturing (487 | 9.6%).
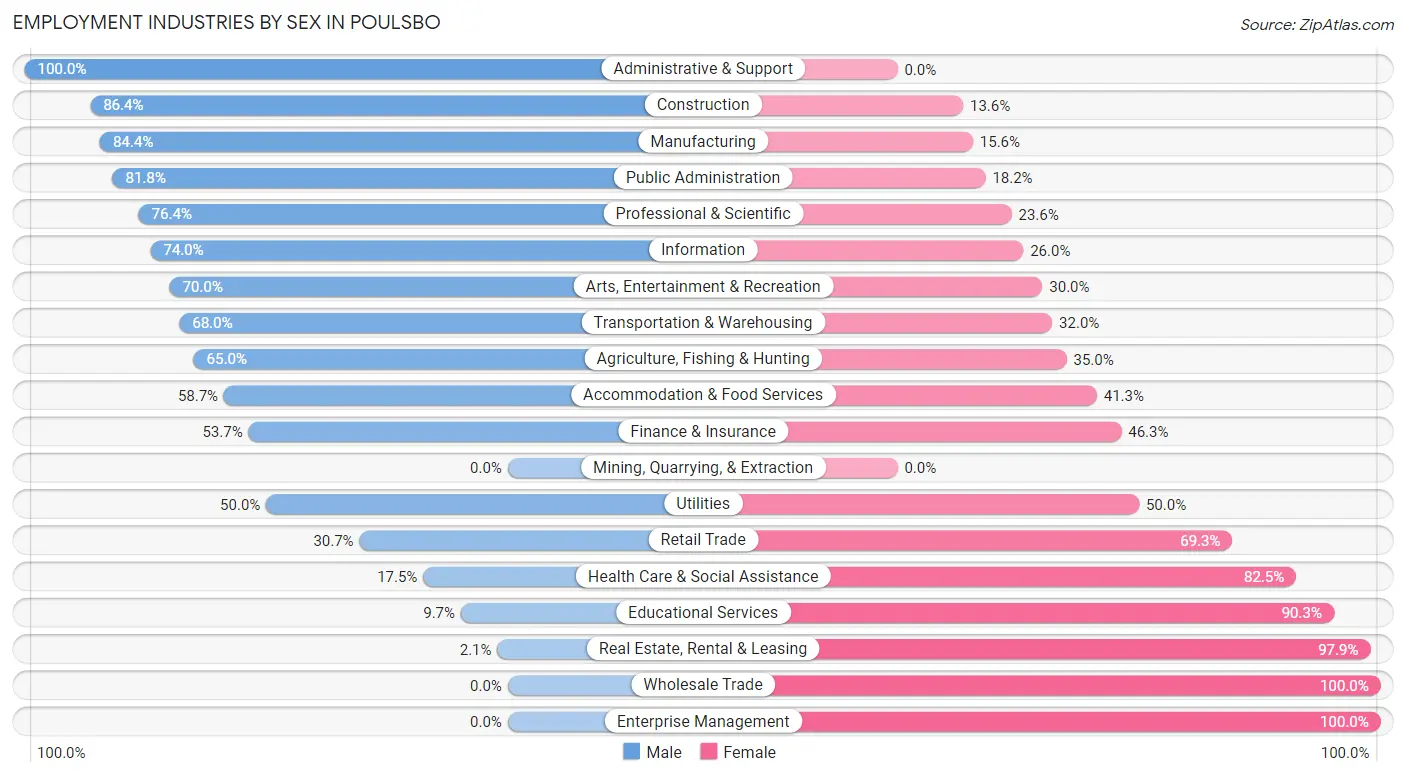
Employment Industries by Sex in Poulsbo
The Poulsbo industries that see more men than women are Administrative & Support (100.0%), Construction (86.4%), and Manufacturing (84.4%), whereas the industries that tend to have a higher number of women are Wholesale Trade (100.0%), Enterprise Management (100.0%), and Real Estate, Rental & Leasing (97.9%).
| Industry | Male | Female |
| Agriculture, Fishing & Hunting | 91 (65.0%) | 49 (35.0%) |
| Mining, Quarrying, & Extraction | 0 (0.0%) | 0 (0.0%) |
| Construction | 140 (86.4%) | 22 (13.6%) |
| Manufacturing | 411 (84.4%) | 76 (15.6%) |
| Wholesale Trade | 0 (0.0%) | 24 (100.0%) |
| Retail Trade | 174 (30.7%) | 393 (69.3%) |
| Transportation & Warehousing | 104 (68.0%) | 49 (32.0%) |
| Utilities | 9 (50.0%) | 9 (50.0%) |
| Information | 71 (74.0%) | 25 (26.0%) |
| Finance & Insurance | 88 (53.7%) | 76 (46.3%) |
| Real Estate, Rental & Leasing | 4 (2.1%) | 183 (97.9%) |
| Professional & Scientific | 443 (76.4%) | 137 (23.6%) |
| Enterprise Management | 0 (0.0%) | 18 (100.0%) |
| Administrative & Support | 158 (100.0%) | 0 (0.0%) |
| Educational Services | 39 (9.7%) | 363 (90.3%) |
| Health Care & Social Assistance | 133 (17.5%) | 627 (82.5%) |
| Arts, Entertainment & Recreation | 56 (70.0%) | 24 (30.0%) |
| Accommodation & Food Services | 131 (58.7%) | 92 (41.3%) |
| Public Administration | 552 (81.8%) | 123 (18.2%) |
| Total | 2,690 (52.7%) | 2,410 (47.2%) |
Education in Poulsbo
School Enrollment in Poulsbo
The most common levels of schooling among the 2,580 students in Poulsbo are high school (660 | 25.6%), college / undergraduate (549 | 21.3%), and middle school (446 | 17.3%).
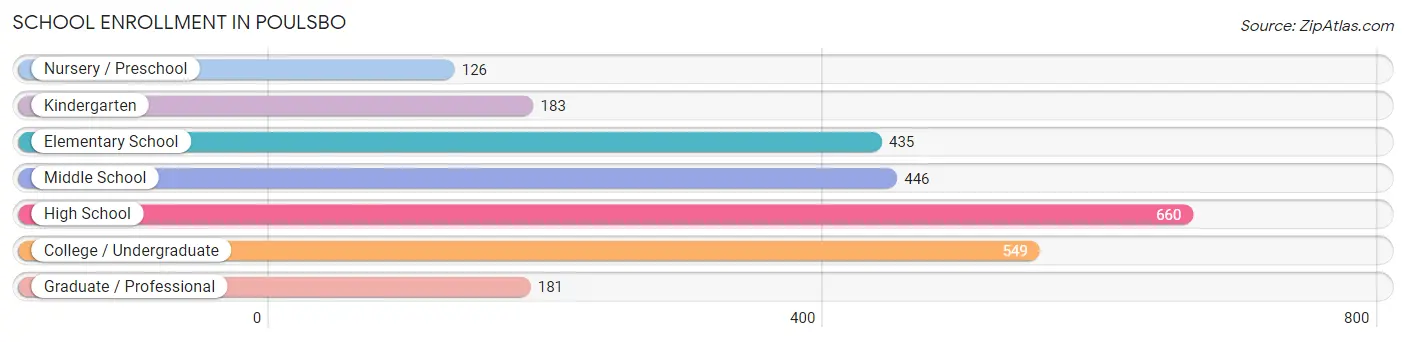
| School Level | # Students | % Students |
| Nursery / Preschool | 126 | 4.9% |
| Kindergarten | 183 | 7.1% |
| Elementary School | 435 | 16.9% |
| Middle School | 446 | 17.3% |
| High School | 660 | 25.6% |
| College / Undergraduate | 549 | 21.3% |
| Graduate / Professional | 181 | 7.0% |
| Total | 2,580 | 100.0% |
School Enrollment by Age by Funding Source in Poulsbo
Out of a total of 2,580 students who are enrolled in schools in Poulsbo, 441 (17.1%) attend a private institution, while the remaining 2,139 (82.9%) are enrolled in public schools. The age group of 3 to 4 year olds has the highest likelihood of being enrolled in private schools, with 112 (79.4% in the age bracket) enrolled. Conversely, the age group of 25 to 34 year olds has the lowest likelihood of being enrolled in a private school, with 338 (100.0% in the age bracket) attending a public institution.
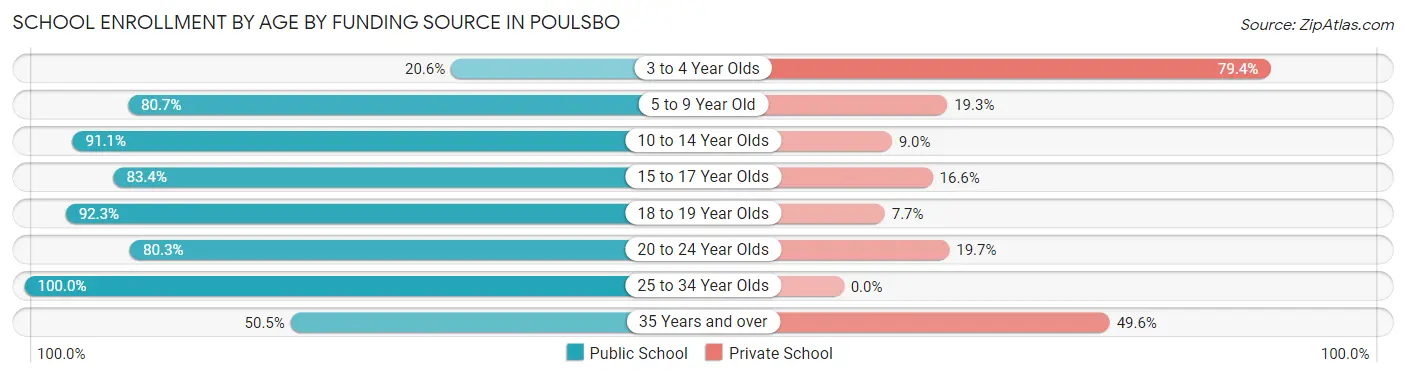
| Age Bracket | Public School | Private School |
| 3 to 4 Year Olds | 29 (20.6%) | 112 (79.4%) |
| 5 to 9 Year Old | 385 (80.7%) | 92 (19.3%) |
| 10 to 14 Year Olds | 600 (91.0%) | 59 (8.9%) |
| 15 to 17 Year Olds | 393 (83.4%) | 78 (16.6%) |
| 18 to 19 Year Olds | 241 (92.3%) | 20 (7.7%) |
| 20 to 24 Year Olds | 98 (80.3%) | 24 (19.7%) |
| 25 to 34 Year Olds | 338 (100.0%) | 0 (0.0%) |
| 35 Years and over | 56 (50.4%) | 55 (49.5%) |
| Total | 2,139 (82.9%) | 441 (17.1%) |
Educational Attainment by Field of Study in Poulsbo
Business (630 | 14.6%), social sciences (488 | 11.3%), science & technology (416 | 9.6%), liberal arts & history (378 | 8.7%), and education (365 | 8.4%) are the most common fields of study among 4,325 individuals in Poulsbo who have obtained a bachelor's degree or higher.
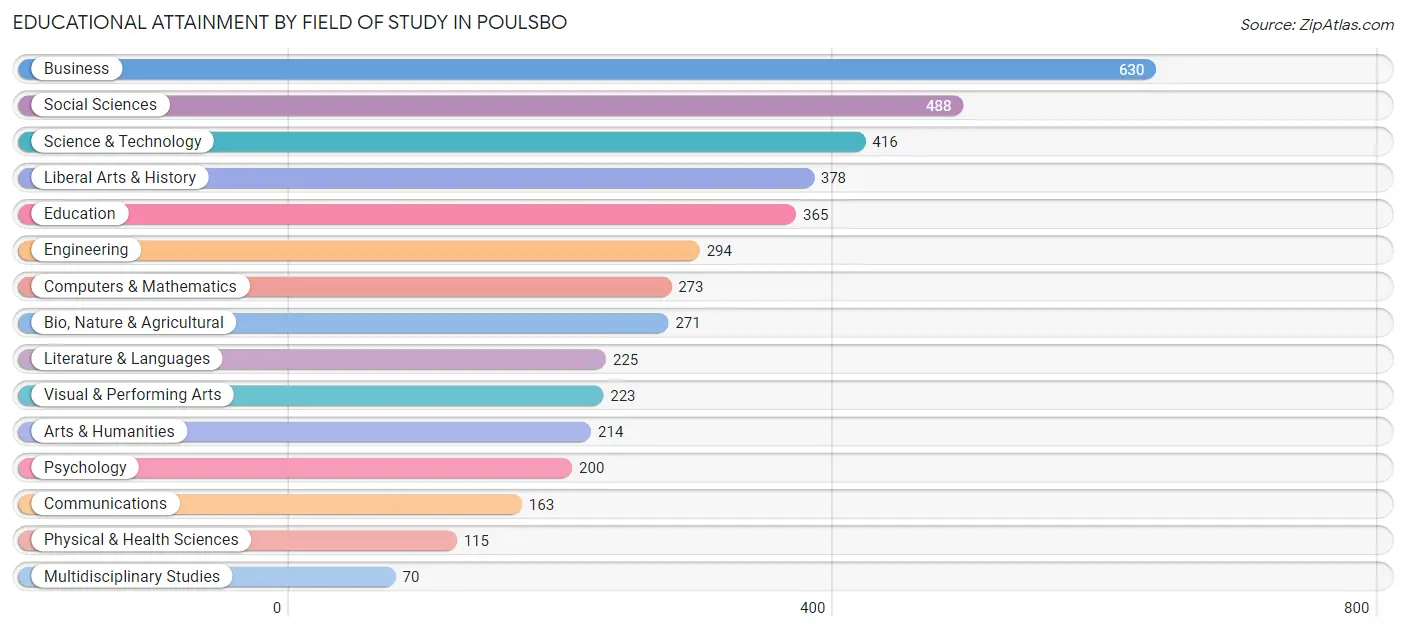
| Field of Study | # Graduates | % Graduates |
| Computers & Mathematics | 273 | 6.3% |
| Bio, Nature & Agricultural | 271 | 6.3% |
| Physical & Health Sciences | 115 | 2.7% |
| Psychology | 200 | 4.6% |
| Social Sciences | 488 | 11.3% |
| Engineering | 294 | 6.8% |
| Multidisciplinary Studies | 70 | 1.6% |
| Science & Technology | 416 | 9.6% |
| Business | 630 | 14.6% |
| Education | 365 | 8.4% |
| Literature & Languages | 225 | 5.2% |
| Liberal Arts & History | 378 | 8.7% |
| Visual & Performing Arts | 223 | 5.2% |
| Communications | 163 | 3.8% |
| Arts & Humanities | 214 | 5.0% |
| Total | 4,325 | 100.0% |
Transportation & Commute in Poulsbo
Vehicle Availability by Sex in Poulsbo
The most prevalent vehicle ownership categories in Poulsbo are males with 2 vehicles (1,432, accounting for 46.8%) and females with 2 vehicles (1,094, making up 59.7%).
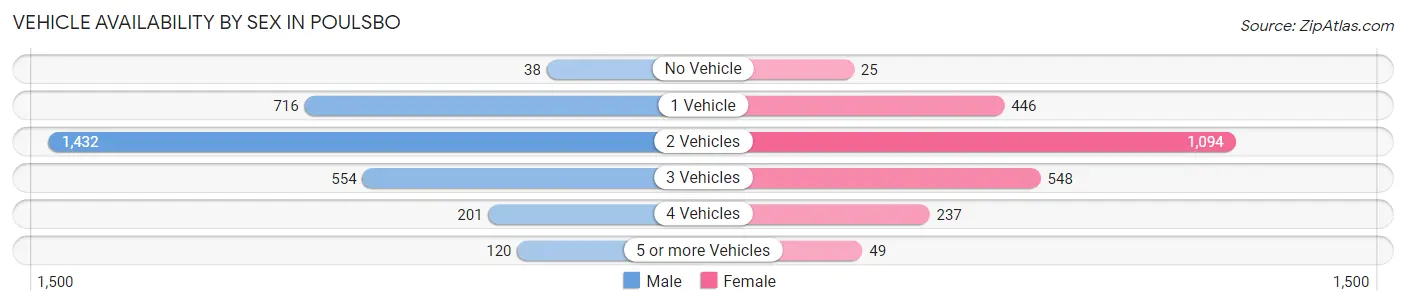
| Vehicles Available | Male | Female |
| No Vehicle | 38 (1.2%) | 25 (1.0%) |
| 1 Vehicle | 716 (23.4%) | 446 (18.6%) |
| 2 Vehicles | 1,432 (46.8%) | 1,094 (45.6%) |
| 3 Vehicles | 554 (18.1%) | 548 (22.8%) |
| 4 Vehicles | 201 (6.6%) | 237 (9.9%) |
| 5 or more Vehicles | 120 (3.9%) | 49 (2.0%) |
| Total | 3,061 (100.0%) | 2,399 (100.0%) |
Commute Time in Poulsbo
The most frequently occuring commute durations in Poulsbo are 5 to 9 minutes (862 commuters, 19.1%), 10 to 14 minutes (649 commuters, 14.4%), and 30 to 34 minutes (535 commuters, 11.9%).
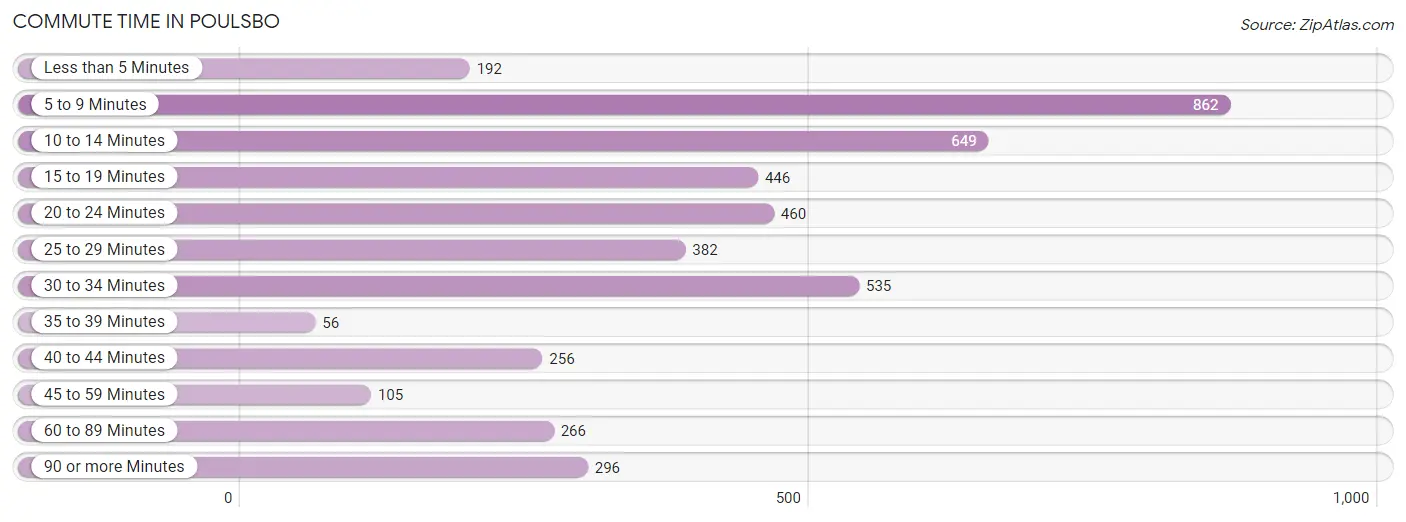
| Commute Time | # Commuters | % Commuters |
| Less than 5 Minutes | 192 | 4.3% |
| 5 to 9 Minutes | 862 | 19.1% |
| 10 to 14 Minutes | 649 | 14.4% |
| 15 to 19 Minutes | 446 | 9.9% |
| 20 to 24 Minutes | 460 | 10.2% |
| 25 to 29 Minutes | 382 | 8.5% |
| 30 to 34 Minutes | 535 | 11.9% |
| 35 to 39 Minutes | 56 | 1.2% |
| 40 to 44 Minutes | 256 | 5.7% |
| 45 to 59 Minutes | 105 | 2.3% |
| 60 to 89 Minutes | 266 | 5.9% |
| 90 or more Minutes | 296 | 6.6% |
Commute Time by Sex in Poulsbo
The most common commute times in Poulsbo are 30 to 34 minutes (426 commuters, 17.8%) for males and 5 to 9 minutes (597 commuters, 28.2%) for females.
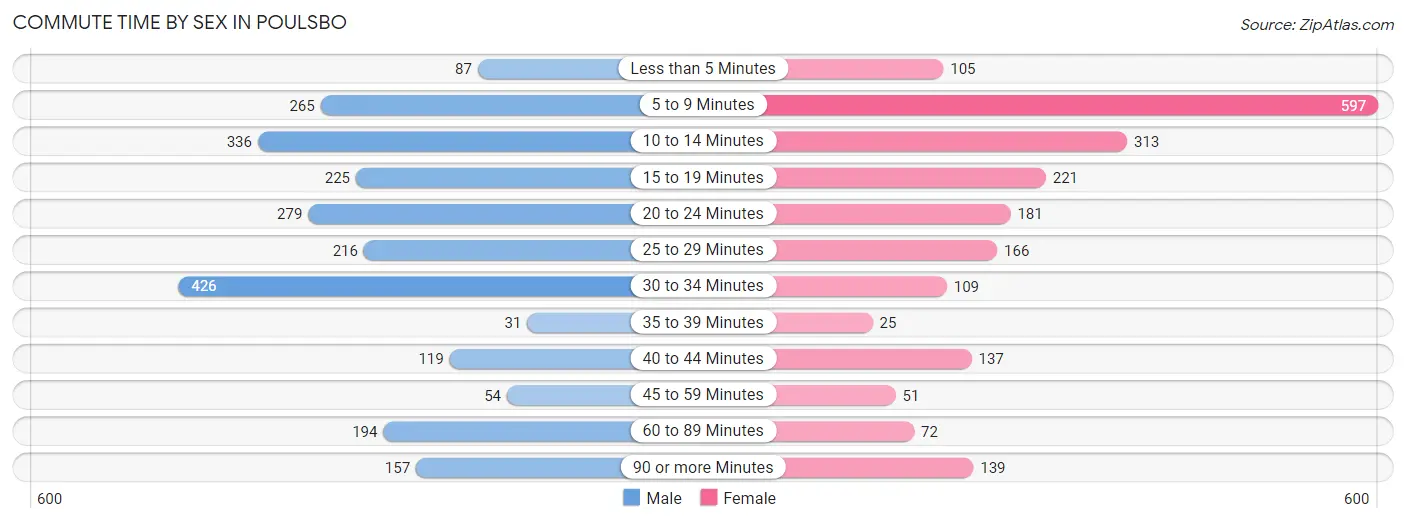
| Commute Time | Male | Female |
| Less than 5 Minutes | 87 (3.6%) | 105 (5.0%) |
| 5 to 9 Minutes | 265 (11.1%) | 597 (28.2%) |
| 10 to 14 Minutes | 336 (14.1%) | 313 (14.8%) |
| 15 to 19 Minutes | 225 (9.4%) | 221 (10.4%) |
| 20 to 24 Minutes | 279 (11.7%) | 181 (8.6%) |
| 25 to 29 Minutes | 216 (9.0%) | 166 (7.8%) |
| 30 to 34 Minutes | 426 (17.8%) | 109 (5.1%) |
| 35 to 39 Minutes | 31 (1.3%) | 25 (1.2%) |
| 40 to 44 Minutes | 119 (5.0%) | 137 (6.5%) |
| 45 to 59 Minutes | 54 (2.3%) | 51 (2.4%) |
| 60 to 89 Minutes | 194 (8.1%) | 72 (3.4%) |
| 90 or more Minutes | 157 (6.6%) | 139 (6.6%) |
Time of Departure to Work by Sex in Poulsbo
The most frequent times of departure to work in Poulsbo are 6:00 AM to 6:29 AM (416, 17.4%) for males and 8:30 AM to 8:59 AM (375, 17.7%) for females.
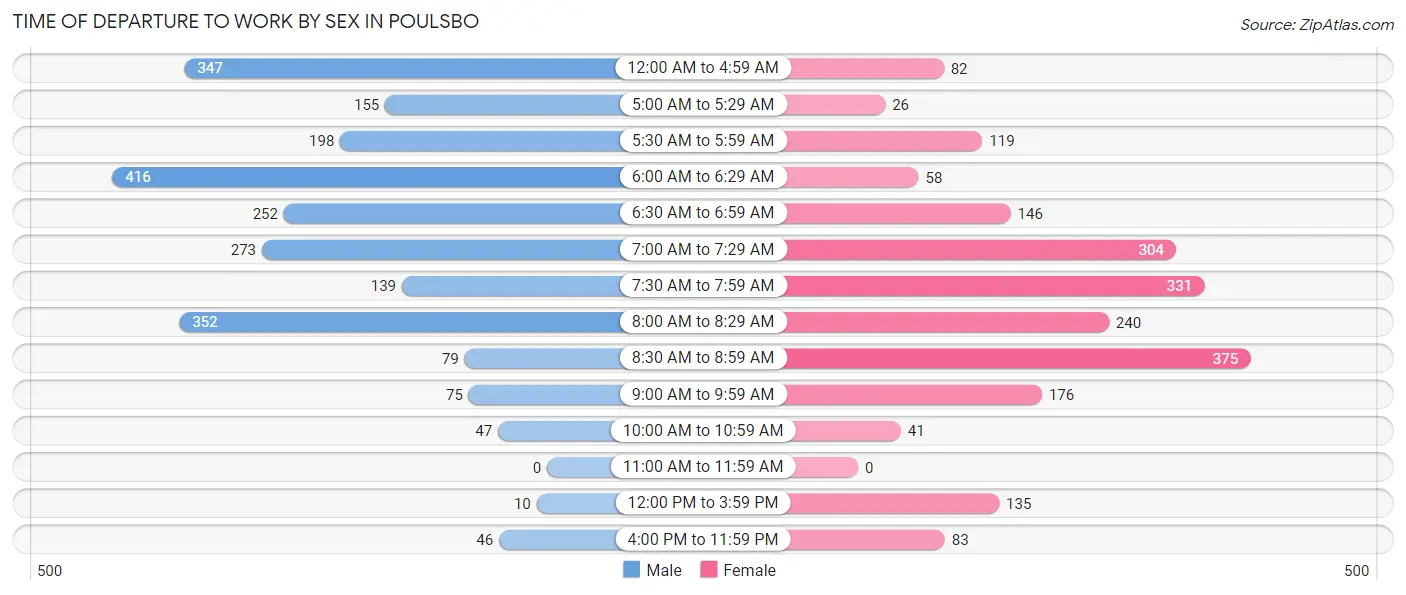
| Time of Departure | Male | Female |
| 12:00 AM to 4:59 AM | 347 (14.5%) | 82 (3.9%) |
| 5:00 AM to 5:29 AM | 155 (6.5%) | 26 (1.2%) |
| 5:30 AM to 5:59 AM | 198 (8.3%) | 119 (5.6%) |
| 6:00 AM to 6:29 AM | 416 (17.4%) | 58 (2.7%) |
| 6:30 AM to 6:59 AM | 252 (10.5%) | 146 (6.9%) |
| 7:00 AM to 7:29 AM | 273 (11.4%) | 304 (14.4%) |
| 7:30 AM to 7:59 AM | 139 (5.8%) | 331 (15.6%) |
| 8:00 AM to 8:29 AM | 352 (14.7%) | 240 (11.3%) |
| 8:30 AM to 8:59 AM | 79 (3.3%) | 375 (17.7%) |
| 9:00 AM to 9:59 AM | 75 (3.1%) | 176 (8.3%) |
| 10:00 AM to 10:59 AM | 47 (2.0%) | 41 (1.9%) |
| 11:00 AM to 11:59 AM | 0 (0.0%) | 0 (0.0%) |
| 12:00 PM to 3:59 PM | 10 (0.4%) | 135 (6.4%) |
| 4:00 PM to 11:59 PM | 46 (1.9%) | 83 (3.9%) |
| Total | 2,389 (100.0%) | 2,116 (100.0%) |
Housing Occupancy in Poulsbo
Occupancy by Ownership in Poulsbo
Of the total 5,123 dwellings in Poulsbo, owner-occupied units account for 3,115 (60.8%), while renter-occupied units make up 2,008 (39.2%).
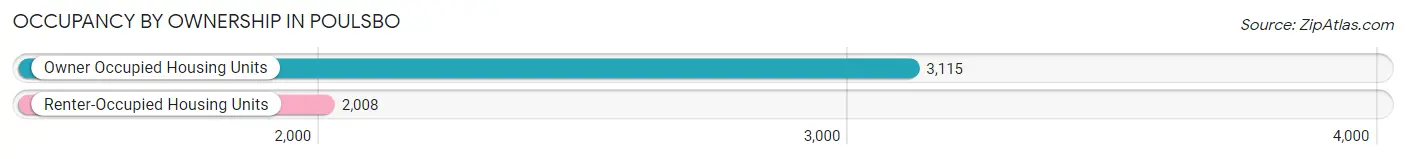
| Occupancy | # Housing Units | % Housing Units |
| Owner Occupied Housing Units | 3,115 | 60.8% |
| Renter-Occupied Housing Units | 2,008 | 39.2% |
| Total Occupied Housing Units | 5,123 | 100.0% |
Occupancy by Household Size in Poulsbo
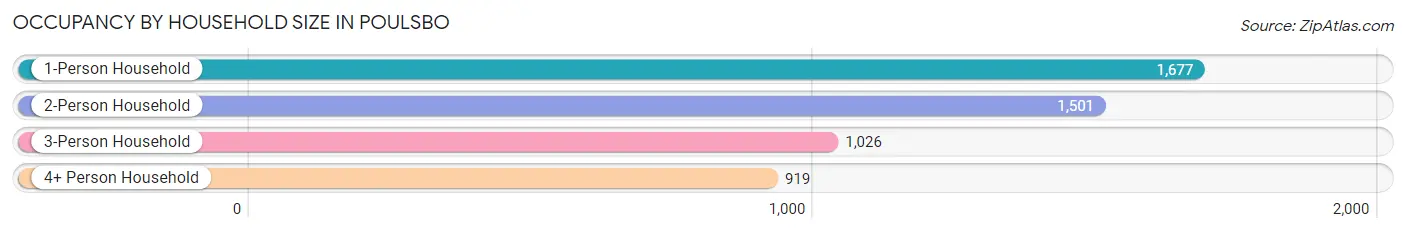
| Household Size | # Housing Units | % Housing Units |
| 1-Person Household | 1,677 | 32.7% |
| 2-Person Household | 1,501 | 29.3% |
| 3-Person Household | 1,026 | 20.0% |
| 4+ Person Household | 919 | 17.9% |
| Total Housing Units | 5,123 | 100.0% |
Occupancy by Ownership by Household Size in Poulsbo
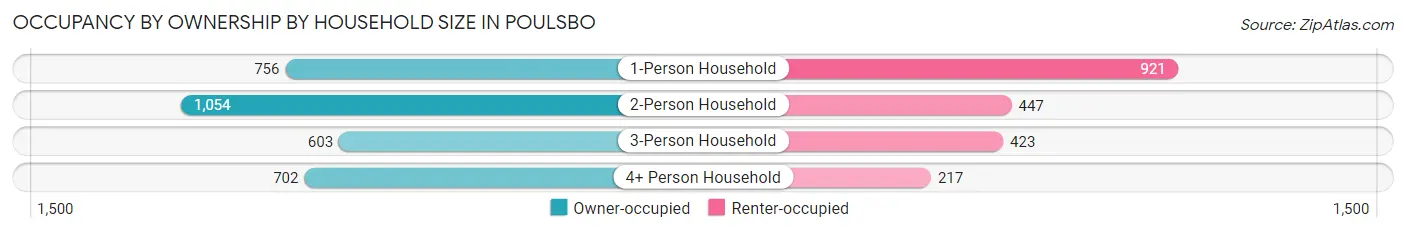
| Household Size | Owner-occupied | Renter-occupied |
| 1-Person Household | 756 (45.1%) | 921 (54.9%) |
| 2-Person Household | 1,054 (70.2%) | 447 (29.8%) |
| 3-Person Household | 603 (58.8%) | 423 (41.2%) |
| 4+ Person Household | 702 (76.4%) | 217 (23.6%) |
| Total Housing Units | 3,115 (60.8%) | 2,008 (39.2%) |
Occupancy by Educational Attainment in Poulsbo
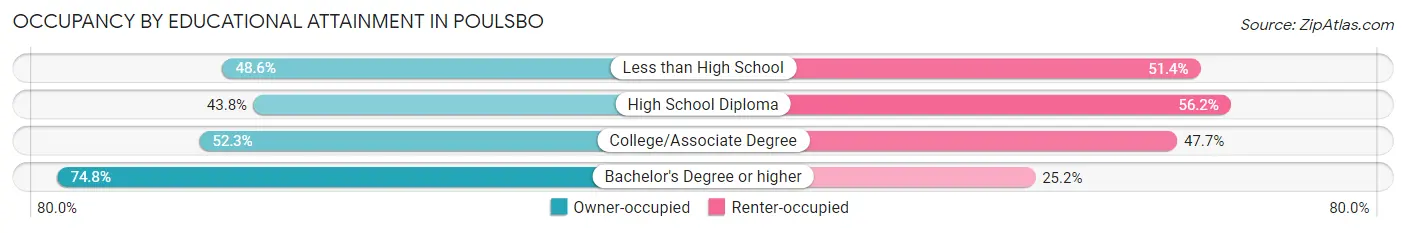
| Household Size | Owner-occupied | Renter-occupied |
| Less than High School | 69 (48.6%) | 73 (51.4%) |
| High School Diploma | 402 (43.8%) | 516 (56.2%) |
| College/Associate Degree | 916 (52.3%) | 836 (47.7%) |
| Bachelor's Degree or higher | 1,728 (74.8%) | 583 (25.2%) |
Occupancy by Age of Householder in Poulsbo
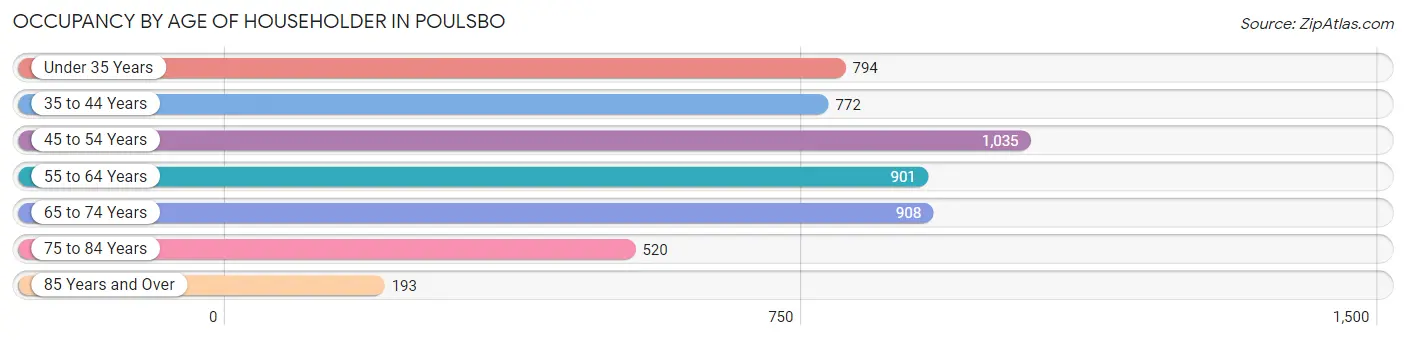
| Age Bracket | # Households | % Households |
| Under 35 Years | 794 | 15.5% |
| 35 to 44 Years | 772 | 15.1% |
| 45 to 54 Years | 1,035 | 20.2% |
| 55 to 64 Years | 901 | 17.6% |
| 65 to 74 Years | 908 | 17.7% |
| 75 to 84 Years | 520 | 10.2% |
| 85 Years and Over | 193 | 3.8% |
| Total | 5,123 | 100.0% |
Housing Finances in Poulsbo
Median Income by Occupancy in Poulsbo
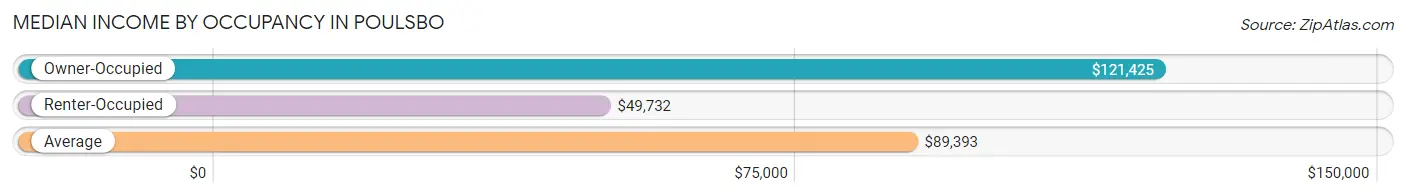
| Occupancy Type | # Households | Median Income |
| Owner-Occupied | 3,115 (60.8%) | $121,425 |
| Renter-Occupied | 2,008 (39.2%) | $49,732 |
| Average | 5,123 (100.0%) | $89,393 |
Occupancy by Householder Income Bracket in Poulsbo
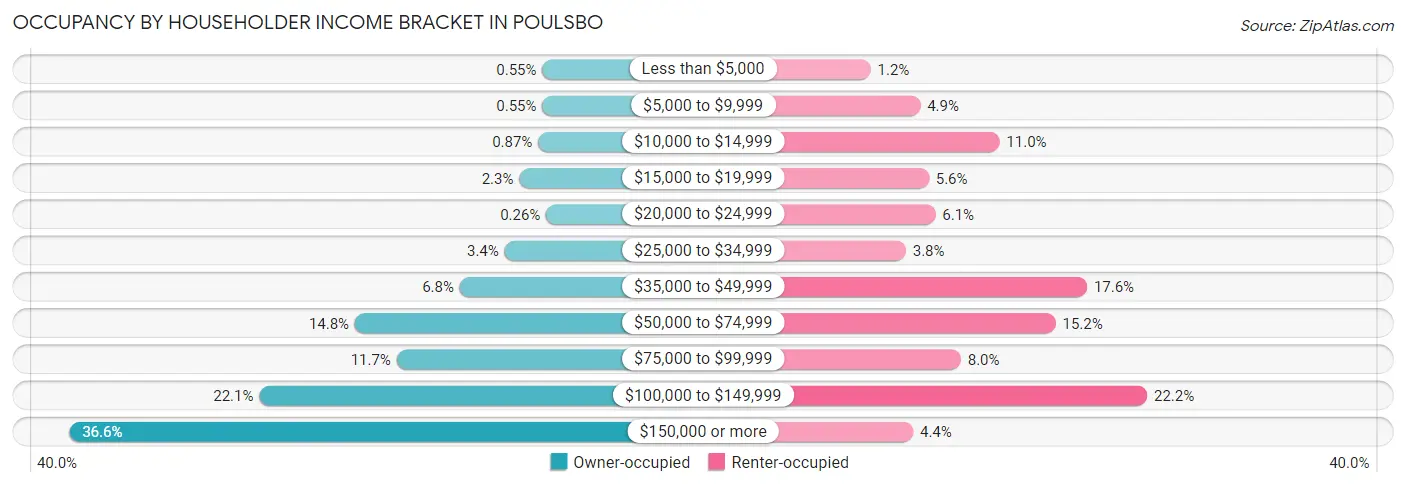
| Income Bracket | Owner-occupied | Renter-occupied |
| Less than $5,000 | 17 (0.5%) | 23 (1.1%) |
| $5,000 to $9,999 | 17 (0.5%) | 99 (4.9%) |
| $10,000 to $14,999 | 27 (0.9%) | 220 (11.0%) |
| $15,000 to $19,999 | 72 (2.3%) | 112 (5.6%) |
| $20,000 to $24,999 | 8 (0.3%) | 122 (6.1%) |
| $25,000 to $34,999 | 107 (3.4%) | 77 (3.8%) |
| $35,000 to $49,999 | 213 (6.8%) | 354 (17.6%) |
| $50,000 to $74,999 | 462 (14.8%) | 306 (15.2%) |
| $75,000 to $99,999 | 363 (11.7%) | 161 (8.0%) |
| $100,000 to $149,999 | 689 (22.1%) | 446 (22.2%) |
| $150,000 or more | 1,140 (36.6%) | 88 (4.4%) |
| Total | 3,115 (100.0%) | 2,008 (100.0%) |
Monthly Housing Cost Tiers in Poulsbo
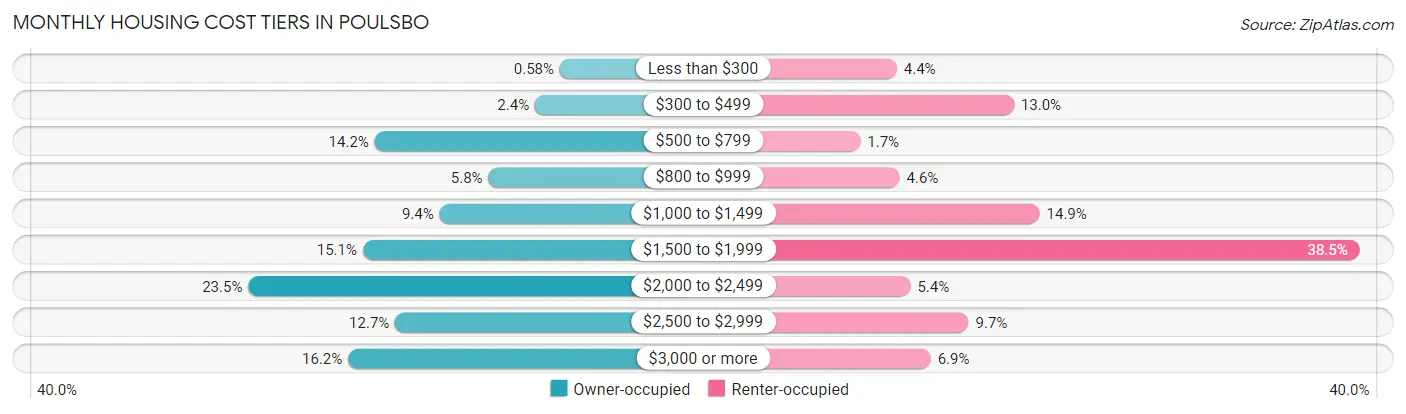
| Monthly Cost | Owner-occupied | Renter-occupied |
| Less than $300 | 18 (0.6%) | 88 (4.4%) |
| $300 to $499 | 75 (2.4%) | 261 (13.0%) |
| $500 to $799 | 443 (14.2%) | 34 (1.7%) |
| $800 to $999 | 182 (5.8%) | 92 (4.6%) |
| $1,000 to $1,499 | 294 (9.4%) | 299 (14.9%) |
| $1,500 to $1,999 | 470 (15.1%) | 772 (38.5%) |
| $2,000 to $2,499 | 733 (23.5%) | 108 (5.4%) |
| $2,500 to $2,999 | 396 (12.7%) | 194 (9.7%) |
| $3,000 or more | 504 (16.2%) | 138 (6.9%) |
| Total | 3,115 (100.0%) | 2,008 (100.0%) |
Physical Housing Characteristics in Poulsbo
Housing Structures in Poulsbo
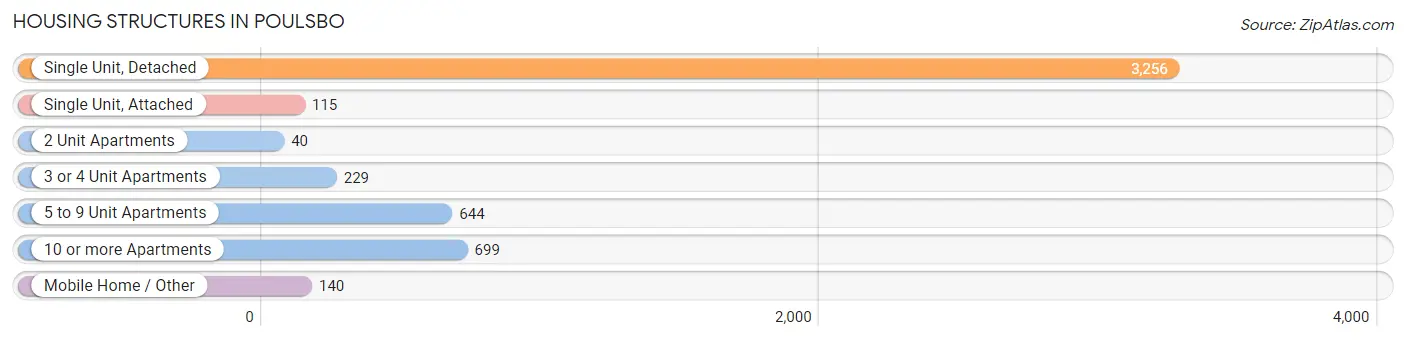
| Structure Type | # Housing Units | % Housing Units |
| Single Unit, Detached | 3,256 | 63.6% |
| Single Unit, Attached | 115 | 2.2% |
| 2 Unit Apartments | 40 | 0.8% |
| 3 or 4 Unit Apartments | 229 | 4.5% |
| 5 to 9 Unit Apartments | 644 | 12.6% |
| 10 or more Apartments | 699 | 13.6% |
| Mobile Home / Other | 140 | 2.7% |
| Total | 5,123 | 100.0% |
Housing Structures by Occupancy in Poulsbo
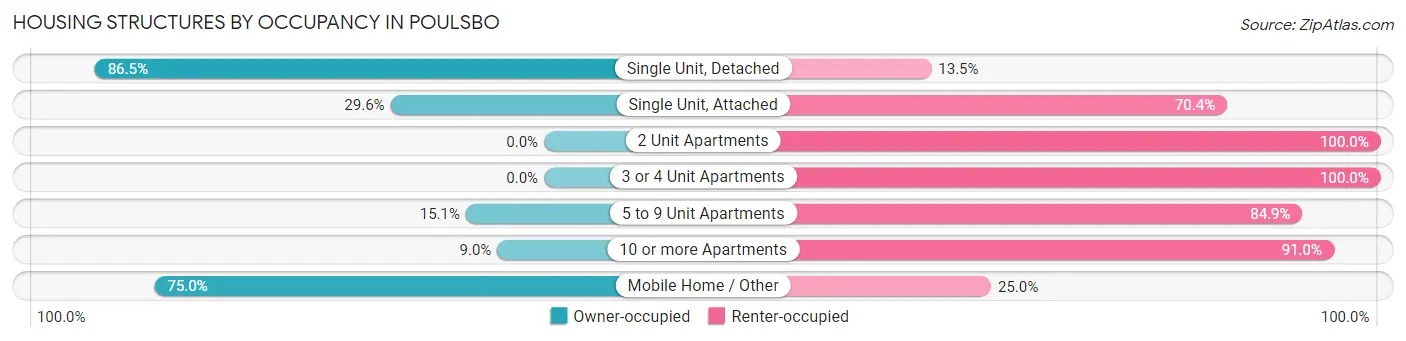
| Structure Type | Owner-occupied | Renter-occupied |
| Single Unit, Detached | 2,816 (86.5%) | 440 (13.5%) |
| Single Unit, Attached | 34 (29.6%) | 81 (70.4%) |
| 2 Unit Apartments | 0 (0.0%) | 40 (100.0%) |
| 3 or 4 Unit Apartments | 0 (0.0%) | 229 (100.0%) |
| 5 to 9 Unit Apartments | 97 (15.1%) | 547 (84.9%) |
| 10 or more Apartments | 63 (9.0%) | 636 (91.0%) |
| Mobile Home / Other | 105 (75.0%) | 35 (25.0%) |
| Total | 3,115 (60.8%) | 2,008 (39.2%) |
Housing Structures by Number of Rooms in Poulsbo
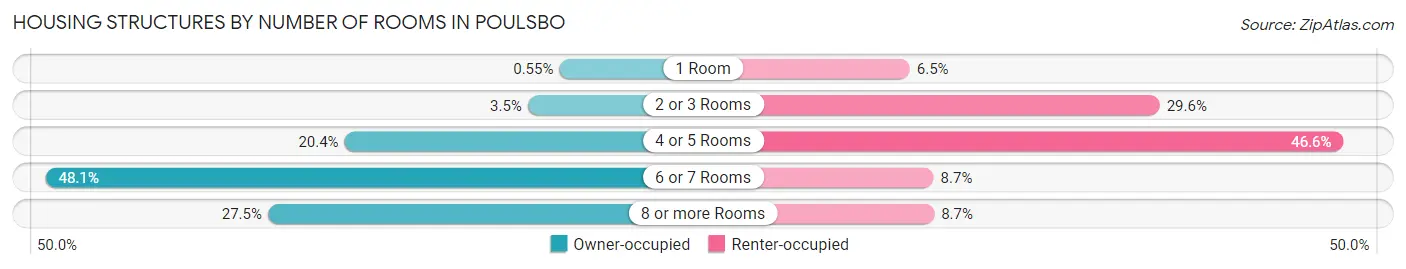
| Number of Rooms | Owner-occupied | Renter-occupied |
| 1 Room | 17 (0.5%) | 130 (6.5%) |
| 2 or 3 Rooms | 108 (3.5%) | 594 (29.6%) |
| 4 or 5 Rooms | 636 (20.4%) | 935 (46.6%) |
| 6 or 7 Rooms | 1,497 (48.1%) | 174 (8.7%) |
| 8 or more Rooms | 857 (27.5%) | 175 (8.7%) |
| Total | 3,115 (100.0%) | 2,008 (100.0%) |
Housing Structure by Heating Type in Poulsbo
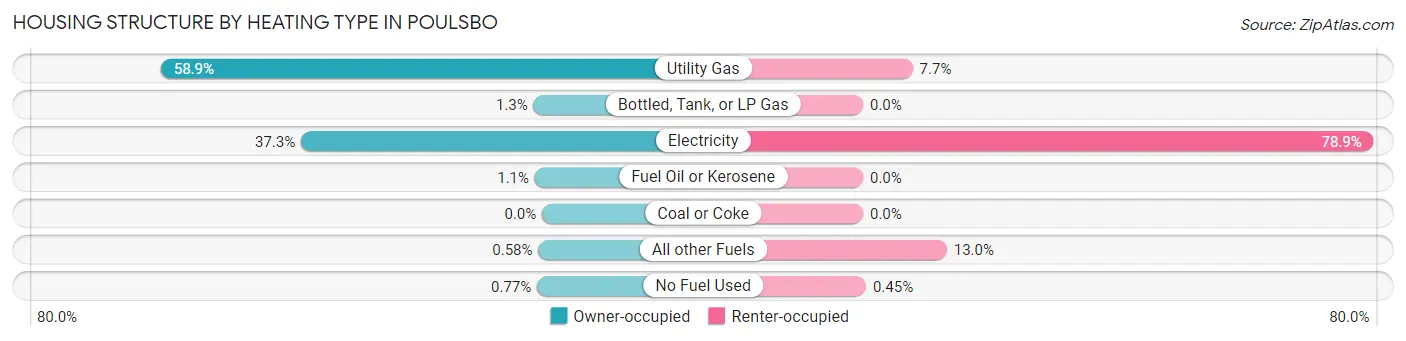
| Heating Type | Owner-occupied | Renter-occupied |
| Utility Gas | 1,836 (58.9%) | 154 (7.7%) |
| Bottled, Tank, or LP Gas | 41 (1.3%) | 0 (0.0%) |
| Electricity | 1,161 (37.3%) | 1,585 (78.9%) |
| Fuel Oil or Kerosene | 35 (1.1%) | 0 (0.0%) |
| Coal or Coke | 0 (0.0%) | 0 (0.0%) |
| All other Fuels | 18 (0.6%) | 260 (13.0%) |
| No Fuel Used | 24 (0.8%) | 9 (0.4%) |
| Total | 3,115 (100.0%) | 2,008 (100.0%) |
Household Vehicle Usage in Poulsbo
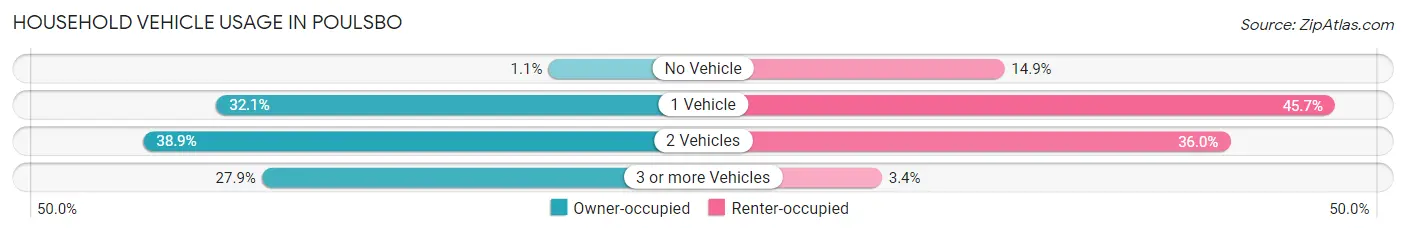
| Vehicles per Household | Owner-occupied | Renter-occupied |
| No Vehicle | 35 (1.1%) | 299 (14.9%) |
| 1 Vehicle | 1,000 (32.1%) | 918 (45.7%) |
| 2 Vehicles | 1,212 (38.9%) | 722 (36.0%) |
| 3 or more Vehicles | 868 (27.9%) | 69 (3.4%) |
| Total | 3,115 (100.0%) | 2,008 (100.0%) |
Real Estate & Mortgages in Poulsbo
Real Estate and Mortgage Overview in Poulsbo
| Characteristic | Without Mortgage | With Mortgage |
| Housing Units | 752 | 2,363 |
| Median Property Value | $511,100 | $517,500 |
| Median Household Income | $87,500 | $928 |
| Monthly Housing Costs | $693 | $504 |
| Real Estate Taxes | $3,863 | $0 |
Property Value by Mortgage Status in Poulsbo
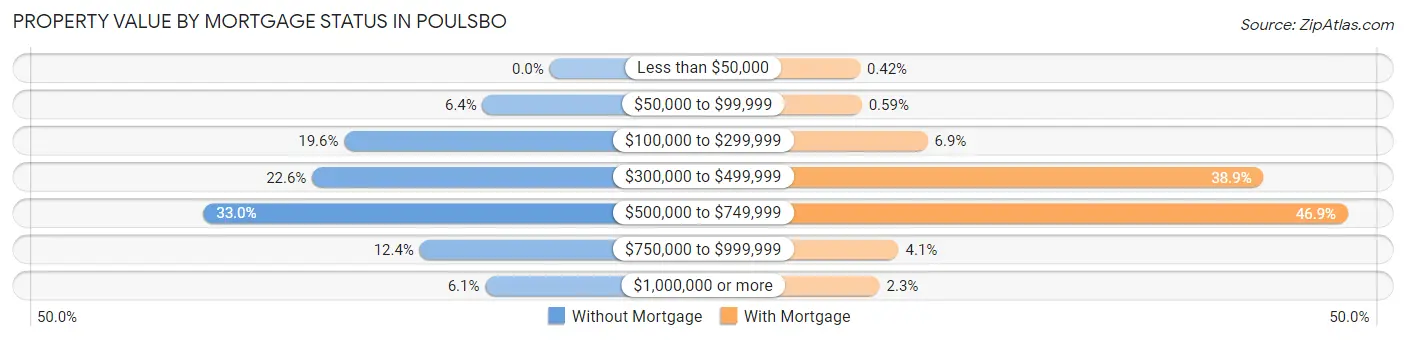
| Property Value | Without Mortgage | With Mortgage |
| Less than $50,000 | 0 (0.0%) | 10 (0.4%) |
| $50,000 to $99,999 | 48 (6.4%) | 14 (0.6%) |
| $100,000 to $299,999 | 147 (19.6%) | 162 (6.9%) |
| $300,000 to $499,999 | 170 (22.6%) | 918 (38.9%) |
| $500,000 to $749,999 | 248 (33.0%) | 1,108 (46.9%) |
| $750,000 to $999,999 | 93 (12.4%) | 97 (4.1%) |
| $1,000,000 or more | 46 (6.1%) | 54 (2.3%) |
| Total | 752 (100.0%) | 2,363 (100.0%) |
Household Income by Mortgage Status in Poulsbo
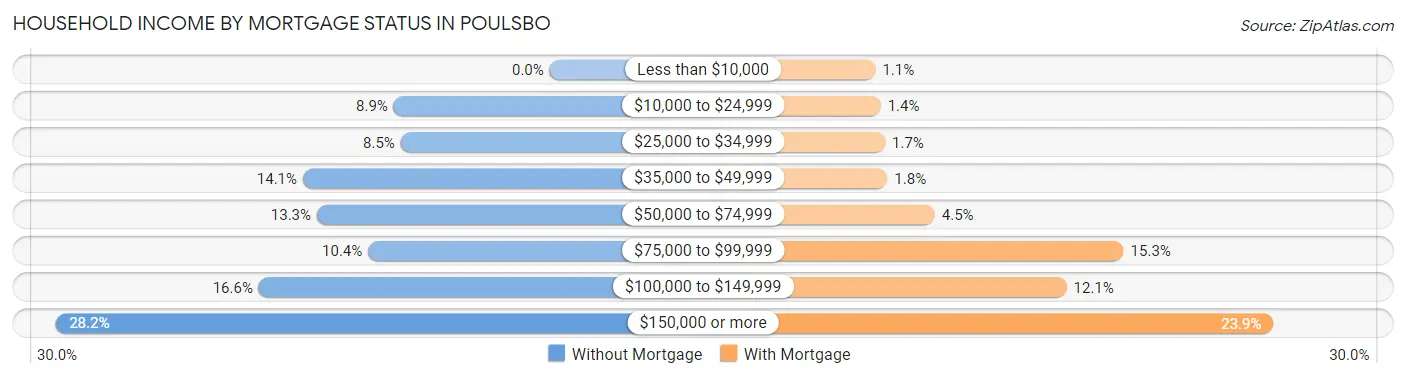
| Household Income | Without Mortgage | With Mortgage |
| Less than $10,000 | 0 (0.0%) | 27 (1.1%) |
| $10,000 to $24,999 | 67 (8.9%) | 34 (1.4%) |
| $25,000 to $34,999 | 64 (8.5%) | 40 (1.7%) |
| $35,000 to $49,999 | 106 (14.1%) | 43 (1.8%) |
| $50,000 to $74,999 | 100 (13.3%) | 107 (4.5%) |
| $75,000 to $99,999 | 78 (10.4%) | 362 (15.3%) |
| $100,000 to $149,999 | 125 (16.6%) | 285 (12.1%) |
| $150,000 or more | 212 (28.2%) | 564 (23.9%) |
| Total | 752 (100.0%) | 2,363 (100.0%) |
Property Value to Household Income Ratio in Poulsbo
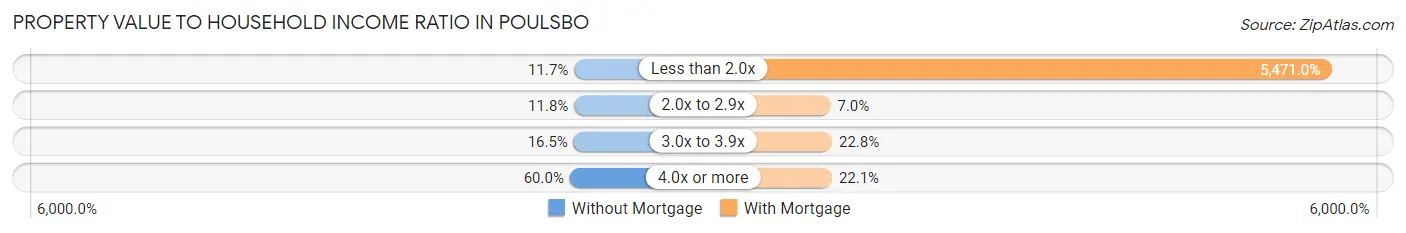
| Value-to-Income Ratio | Without Mortgage | With Mortgage |
| Less than 2.0x | 88 (11.7%) | 129,280 (5,471.0%) |
| 2.0x to 2.9x | 89 (11.8%) | 166 (7.0%) |
| 3.0x to 3.9x | 124 (16.5%) | 539 (22.8%) |
| 4.0x or more | 451 (60.0%) | 522 (22.1%) |
| Total | 752 (100.0%) | 2,363 (100.0%) |
Real Estate Taxes by Mortgage Status in Poulsbo
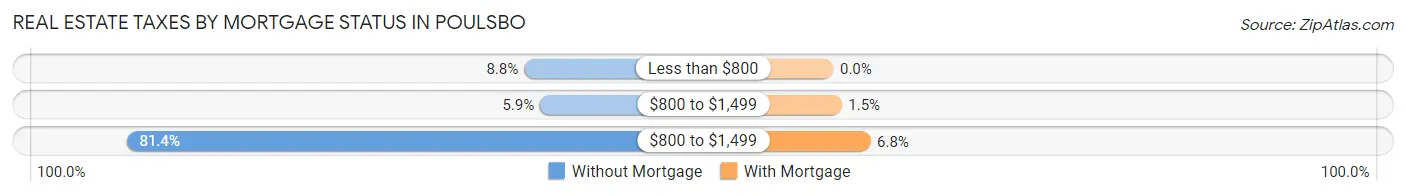
| Property Taxes | Without Mortgage | With Mortgage |
| Less than $800 | 66 (8.8%) | 0 (0.0%) |
| $800 to $1,499 | 44 (5.9%) | 36 (1.5%) |
| $800 to $1,499 | 612 (81.4%) | 160 (6.8%) |
| Total | 752 (100.0%) | 2,363 (100.0%) |
Health & Disability in Poulsbo
Health Insurance Coverage by Age in Poulsbo
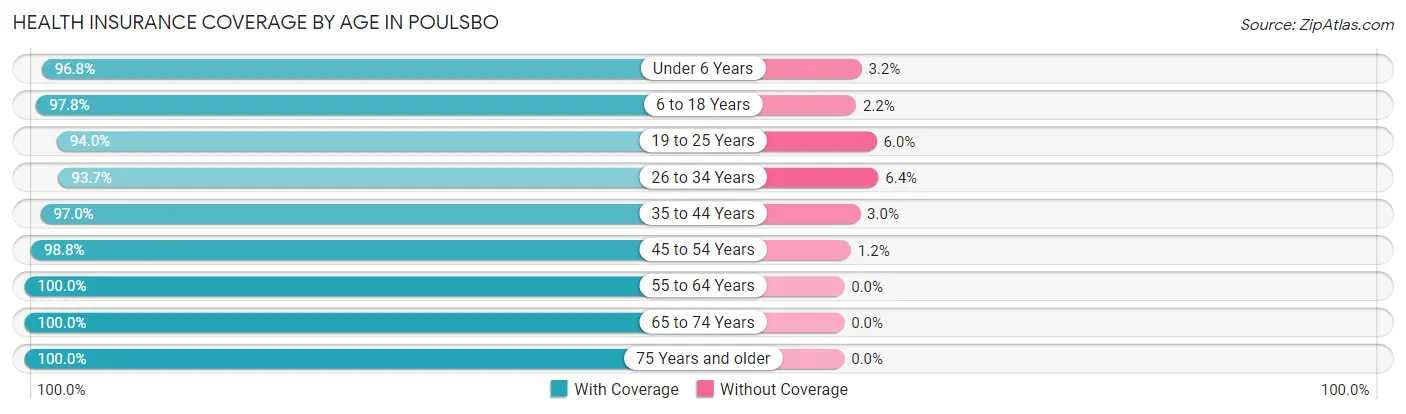
| Age Bracket | With Coverage | Without Coverage |
| Under 6 Years | 754 (96.8%) | 25 (3.2%) |
| 6 to 18 Years | 1,743 (97.8%) | 39 (2.2%) |
| 19 to 25 Years | 608 (94.0%) | 39 (6.0%) |
| 26 to 34 Years | 1,239 (93.6%) | 84 (6.4%) |
| 35 to 44 Years | 1,180 (97.0%) | 36 (3.0%) |
| 45 to 54 Years | 1,770 (98.8%) | 22 (1.2%) |
| 55 to 64 Years | 1,379 (100.0%) | 0 (0.0%) |
| 65 to 74 Years | 1,357 (100.0%) | 0 (0.0%) |
| 75 Years and older | 973 (100.0%) | 0 (0.0%) |
| Total | 11,003 (97.8%) | 245 (2.2%) |
Health Insurance Coverage by Citizenship Status in Poulsbo
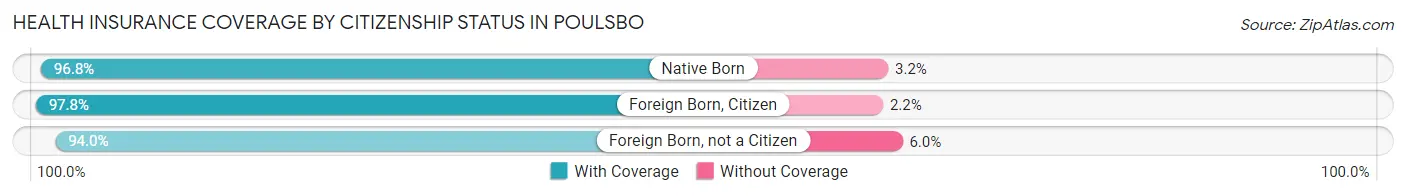
| Citizenship Status | With Coverage | Without Coverage |
| Native Born | 754 (96.8%) | 25 (3.2%) |
| Foreign Born, Citizen | 1,743 (97.8%) | 39 (2.2%) |
| Foreign Born, not a Citizen | 608 (94.0%) | 39 (6.0%) |
Health Insurance Coverage by Household Income in Poulsbo
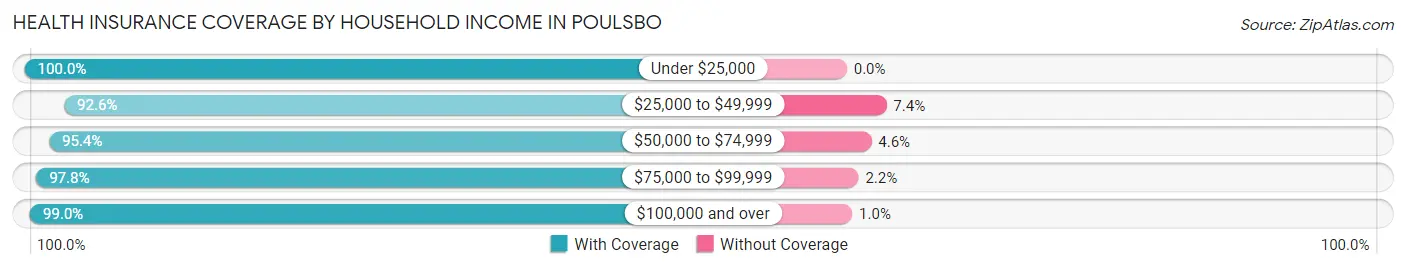
| Household Income | With Coverage | Without Coverage |
| Under $25,000 | 1,035 (100.0%) | 0 (0.0%) |
| $25,000 to $49,999 | 1,098 (92.6%) | 88 (7.4%) |
| $50,000 to $74,999 | 1,452 (95.4%) | 70 (4.6%) |
| $75,000 to $99,999 | 983 (97.8%) | 22 (2.2%) |
| $100,000 and over | 6,431 (99.0%) | 65 (1.0%) |
Public vs Private Health Insurance Coverage by Age in Poulsbo
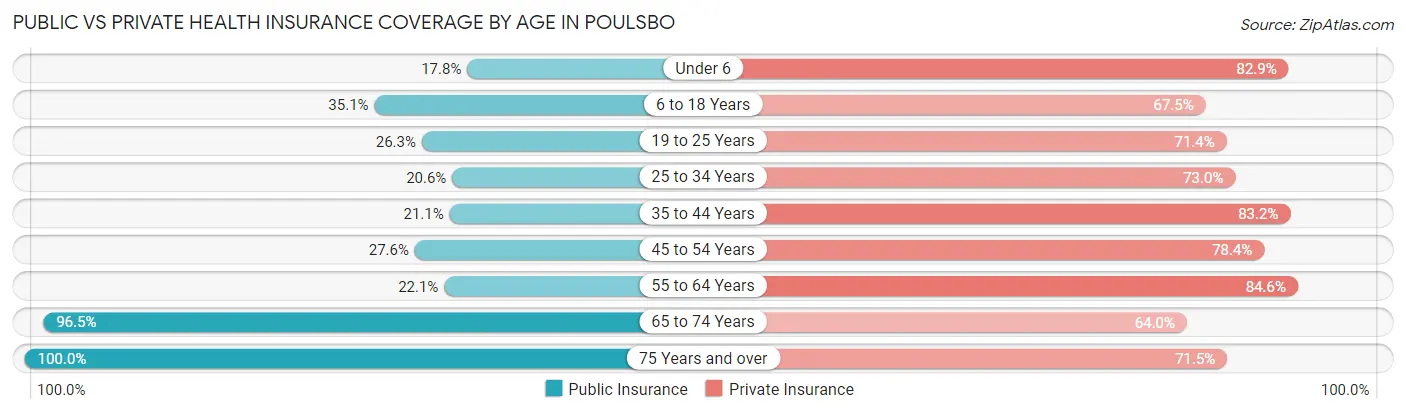
| Age Bracket | Public Insurance | Private Insurance |
| Under 6 | 139 (17.8%) | 646 (82.9%) |
| 6 to 18 Years | 625 (35.1%) | 1,203 (67.5%) |
| 19 to 25 Years | 170 (26.3%) | 462 (71.4%) |
| 25 to 34 Years | 273 (20.6%) | 966 (73.0%) |
| 35 to 44 Years | 257 (21.1%) | 1,012 (83.2%) |
| 45 to 54 Years | 494 (27.6%) | 1,405 (78.4%) |
| 55 to 64 Years | 305 (22.1%) | 1,167 (84.6%) |
| 65 to 74 Years | 1,310 (96.5%) | 869 (64.0%) |
| 75 Years and over | 973 (100.0%) | 696 (71.5%) |
| Total | 4,546 (40.4%) | 8,426 (74.9%) |
Disability Status by Sex by Age in Poulsbo

| Age Bracket | Male | Female |
| Under 5 Years | 0 (0.0%) | 0 (0.0%) |
| 5 to 17 Years | 51 (6.2%) | 18 (2.2%) |
| 18 to 34 Years | 121 (12.0%) | 85 (7.2%) |
| 35 to 64 Years | 181 (9.3%) | 244 (10.0%) |
| 65 to 74 Years | 211 (32.2%) | 148 (21.1%) |
| 75 Years and over | 110 (28.6%) | 282 (47.9%) |
Disability Class by Sex by Age in Poulsbo
Disability Class: Hearing Difficulty
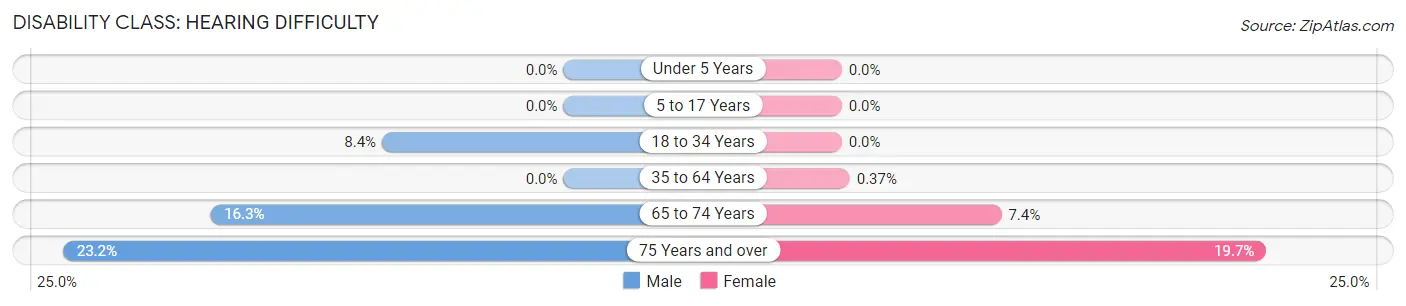
| Age Bracket | Male | Female |
| Under 5 Years | 0 (0.0%) | 0 (0.0%) |
| 5 to 17 Years | 0 (0.0%) | 0 (0.0%) |
| 18 to 34 Years | 85 (8.4%) | 0 (0.0%) |
| 35 to 64 Years | 0 (0.0%) | 9 (0.4%) |
| 65 to 74 Years | 107 (16.3%) | 52 (7.4%) |
| 75 Years and over | 89 (23.2%) | 116 (19.7%) |
Disability Class: Vision Difficulty
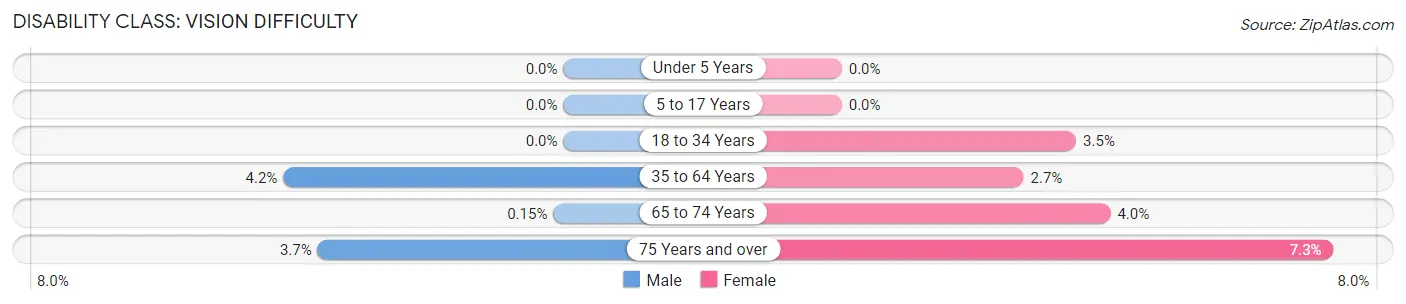
| Age Bracket | Male | Female |
| Under 5 Years | 0 (0.0%) | 0 (0.0%) |
| 5 to 17 Years | 0 (0.0%) | 0 (0.0%) |
| 18 to 34 Years | 0 (0.0%) | 41 (3.5%) |
| 35 to 64 Years | 81 (4.2%) | 66 (2.7%) |
| 65 to 74 Years | 1 (0.2%) | 28 (4.0%) |
| 75 Years and over | 14 (3.6%) | 43 (7.3%) |
Disability Class: Cognitive Difficulty
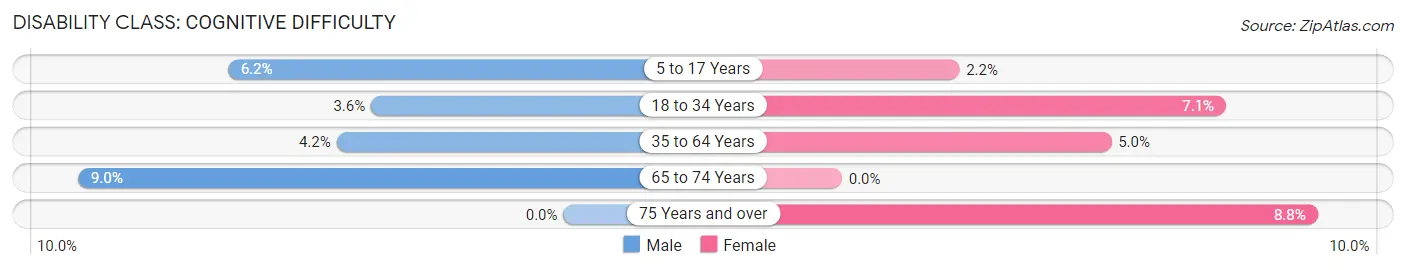
| Age Bracket | Male | Female |
| 5 to 17 Years | 51 (6.2%) | 18 (2.2%) |
| 18 to 34 Years | 36 (3.6%) | 84 (7.1%) |
| 35 to 64 Years | 82 (4.2%) | 122 (5.0%) |
| 65 to 74 Years | 59 (9.0%) | 0 (0.0%) |
| 75 Years and over | 0 (0.0%) | 52 (8.8%) |
Disability Class: Ambulatory Difficulty
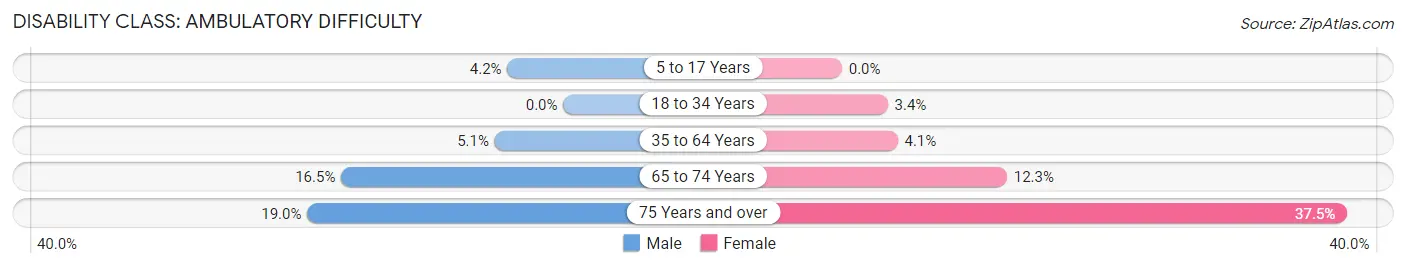
| Age Bracket | Male | Female |
| 5 to 17 Years | 34 (4.2%) | 0 (0.0%) |
| 18 to 34 Years | 0 (0.0%) | 40 (3.4%) |
| 35 to 64 Years | 99 (5.1%) | 101 (4.1%) |
| 65 to 74 Years | 108 (16.5%) | 86 (12.2%) |
| 75 Years and over | 73 (19.0%) | 221 (37.5%) |
Disability Class: Self-Care Difficulty
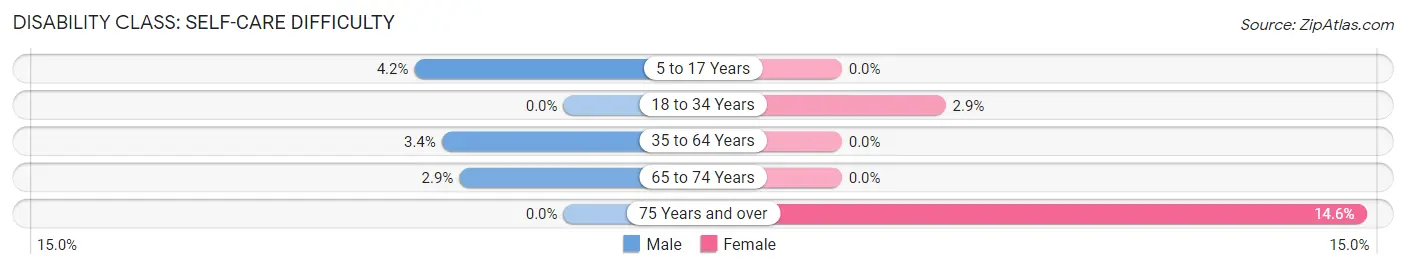
| Age Bracket | Male | Female |
| 5 to 17 Years | 34 (4.2%) | 0 (0.0%) |
| 18 to 34 Years | 0 (0.0%) | 34 (2.9%) |
| 35 to 64 Years | 66 (3.4%) | 0 (0.0%) |
| 65 to 74 Years | 19 (2.9%) | 0 (0.0%) |
| 75 Years and over | 0 (0.0%) | 86 (14.6%) |
Technology Access in Poulsbo
Computing Device Access in Poulsbo
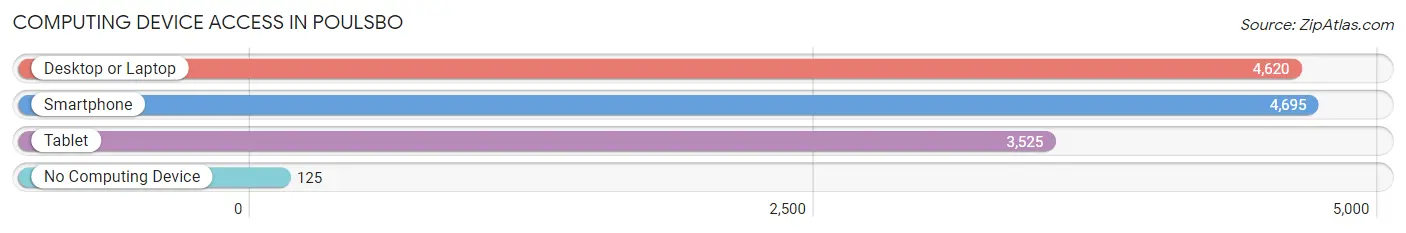
| Device Type | # Households | % Households |
| Desktop or Laptop | 4,620 | 90.2% |
| Smartphone | 4,695 | 91.6% |
| Tablet | 3,525 | 68.8% |
| No Computing Device | 125 | 2.4% |
| Total | 5,123 | 100.0% |
Internet Access in Poulsbo
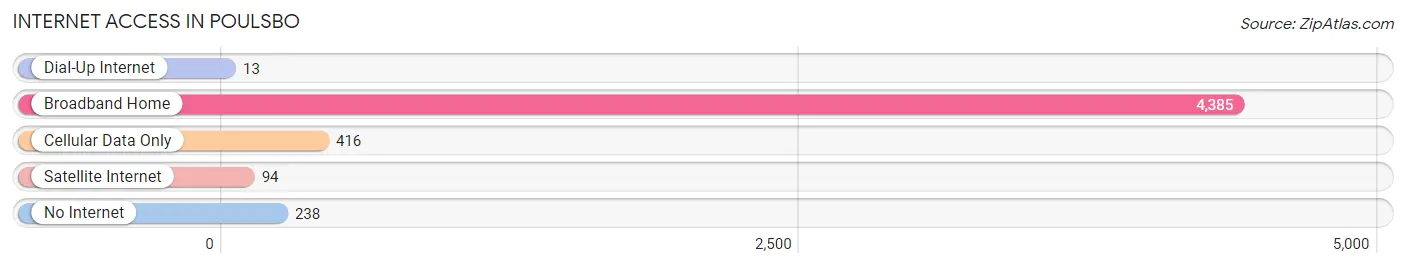
| Internet Type | # Households | % Households |
| Dial-Up Internet | 13 | 0.3% |
| Broadband Home | 4,385 | 85.6% |
| Cellular Data Only | 416 | 8.1% |
| Satellite Internet | 94 | 1.8% |
| No Internet | 238 | 4.6% |
| Total | 5,123 | 100.0% |
Poulsbo Summary
Poulsbo, Washington is a small city located in Kitsap County, Washington, United States. It is situated on Liberty Bay, a part of Puget Sound, and is located approximately 25 miles northwest of Seattle. The city has a population of approximately 10,000 people and is known for its Scandinavian heritage, which is reflected in its architecture, culture, and cuisine.
History
The area that is now Poulsbo was first inhabited by the Suquamish Tribe, who lived in the area for thousands of years before the arrival of European settlers. The first European settlers arrived in the area in the late 1800s, and the town was officially incorporated in 1907. The town was named after the Norwegian town of Poulsbo, which was the hometown of the first postmaster, Jorgen Eliason.
The town grew slowly over the next few decades, and by the mid-1900s, it had become a popular tourist destination due to its proximity to Seattle and its Scandinavian heritage. In the late 1900s, the town experienced a period of rapid growth, as many people moved to the area from Seattle and other parts of the country.
Geography
Poulsbo is located in Kitsap County, Washington, United States. It is situated on Liberty Bay, a part of Puget Sound, and is located approximately 25 miles northwest of Seattle. The city has a total area of 4.2 square miles, of which 3.9 square miles is land and 0.3 square miles is water. The city is located at the base of the Olympic Mountains, and is surrounded by forests and mountains.
Economy
The economy of Poulsbo is largely based on tourism, as the city is a popular destination for visitors from Seattle and other parts of the country. The city is also home to a number of small businesses, including restaurants, retail stores, and art galleries. The city is also home to a number of technology companies, including Microsoft, which has a large campus in the city.
Demographics
As of the 2010 census, the population of Poulsbo was 9,200 people. The racial makeup of the city was 87.3% White, 2.2% African American, 0.7% Native American, 3.2% Asian, 0.2% Pacific Islander, and 4.3% from other races. The median household income in the city was $50,945, and the median family income was $60,945. The per capita income in the city was $25,945. The city has a large Scandinavian population, with approximately 30% of the population claiming Norwegian ancestry.
Common Questions
What is Per Capita Income in Poulsbo?
Per Capita income in Poulsbo is $48,310.
What is the Median Family Income in Poulsbo?
Median Family Income in Poulsbo is $122,079.
What is the Median Household income in Poulsbo?
Median Household Income in Poulsbo is $89,393.
What is Income or Wage Gap in Poulsbo?
Income or Wage Gap in Poulsbo is 36.5%.
Women in Poulsbo earn 63.5 cents for every dollar earned by a man.
What is Inequality or Gini Index in Poulsbo?
Inequality or Gini Index in Poulsbo is 0.42.
What is the Total Population of Poulsbo?
Total Population of Poulsbo is 11,824.
What is the Total Male Population of Poulsbo?
Total Male Population of Poulsbo is 5,592.
What is the Total Female Population of Poulsbo?
Total Female Population of Poulsbo is 6,232.
What is the Ratio of Males per 100 Females in Poulsbo?
There are 89.73 Males per 100 Females in Poulsbo.
What is the Ratio of Females per 100 Males in Poulsbo?
There are 111.44 Females per 100 Males in Poulsbo.
What is the Median Population Age in Poulsbo?
Median Population Age in Poulsbo is 43.7 Years.
What is the Average Family Size in Poulsbo
Average Family Size in Poulsbo is 2.9 People.
What is the Average Household Size in Poulsbo
Average Household Size in Poulsbo is 2.3 People.
How Large is the Labor Force in Poulsbo?
There are 5,726 People in the Labor Forcein in Poulsbo.
What is the Percentage of People in the Labor Force in Poulsbo?
58.1% of People are in the Labor Force in Poulsbo.
What is the Unemployment Rate in Poulsbo?
Unemployment Rate in Poulsbo is 4.2%.