Auburn, WA Map & Demographics
Auburn Map
Auburn Overview
$41,384
PER CAPITA INCOME
$106,723
AVG FAMILY INCOME
$87,406
AVG HOUSEHOLD INCOME
30.9%
WAGE / INCOME GAP [ % ]
69.1¢/ $1
WAGE / INCOME GAP [ $ ]
$12,532
FAMILY INCOME DEFICIT
0.42
INEQUALITY / GINI INDEX
85,623
TOTAL POPULATION
43,065
MALE POPULATION
42,558
FEMALE POPULATION
101.19
MALES / 100 FEMALES
98.82
FEMALES / 100 MALES
35.8
MEDIAN AGE
3.3
AVG FAMILY SIZE
2.7
AVG HOUSEHOLD SIZE
46,087
LABOR FORCE [ PEOPLE ]
69.2%
PERCENT IN LABOR FORCE
4.7%
UNEMPLOYMENT RATE
Auburn Area Codes
Income in Auburn
Income Overview in Auburn
Per Capita Income in Auburn is $41,384, while median incomes of families and households are $106,723 and $87,406 respectively.
| Characteristic | Number | Measure |
| Per Capita Income | 85,623 | $41,384 |
| Median Family Income | 21,099 | $106,723 |
| Mean Family Income | 21,099 | $127,175 |
| Median Household Income | 30,987 | $87,406 |
| Mean Household Income | 30,987 | $110,851 |
| Income Deficit | 21,099 | $12,532 |
| Wage / Income Gap (%) | 85,623 | 30.89% |
| Wage / Income Gap ($) | 85,623 | 69.11¢ per $1 |
| Gini / Inequality Index | 85,623 | 0.42 |
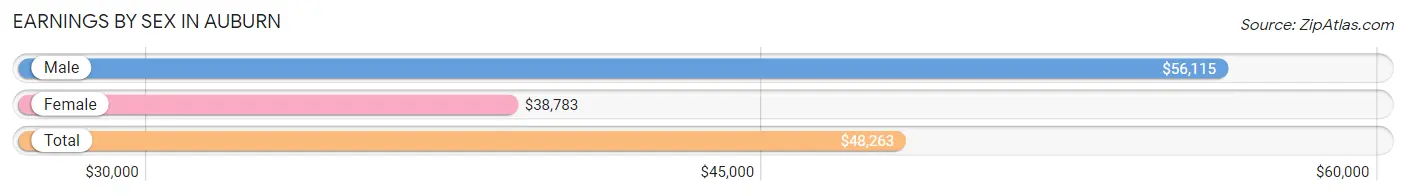
Earnings by Sex in Auburn
Average Earnings in Auburn are $48,263, $56,115 for men and $38,783 for women, a difference of 30.9%.
| Sex | Number | Average Earnings |
| Male | 25,160 (53.5%) | $56,115 |
| Female | 21,861 (46.5%) | $38,783 |
| Total | 47,021 (100.0%) | $48,263 |
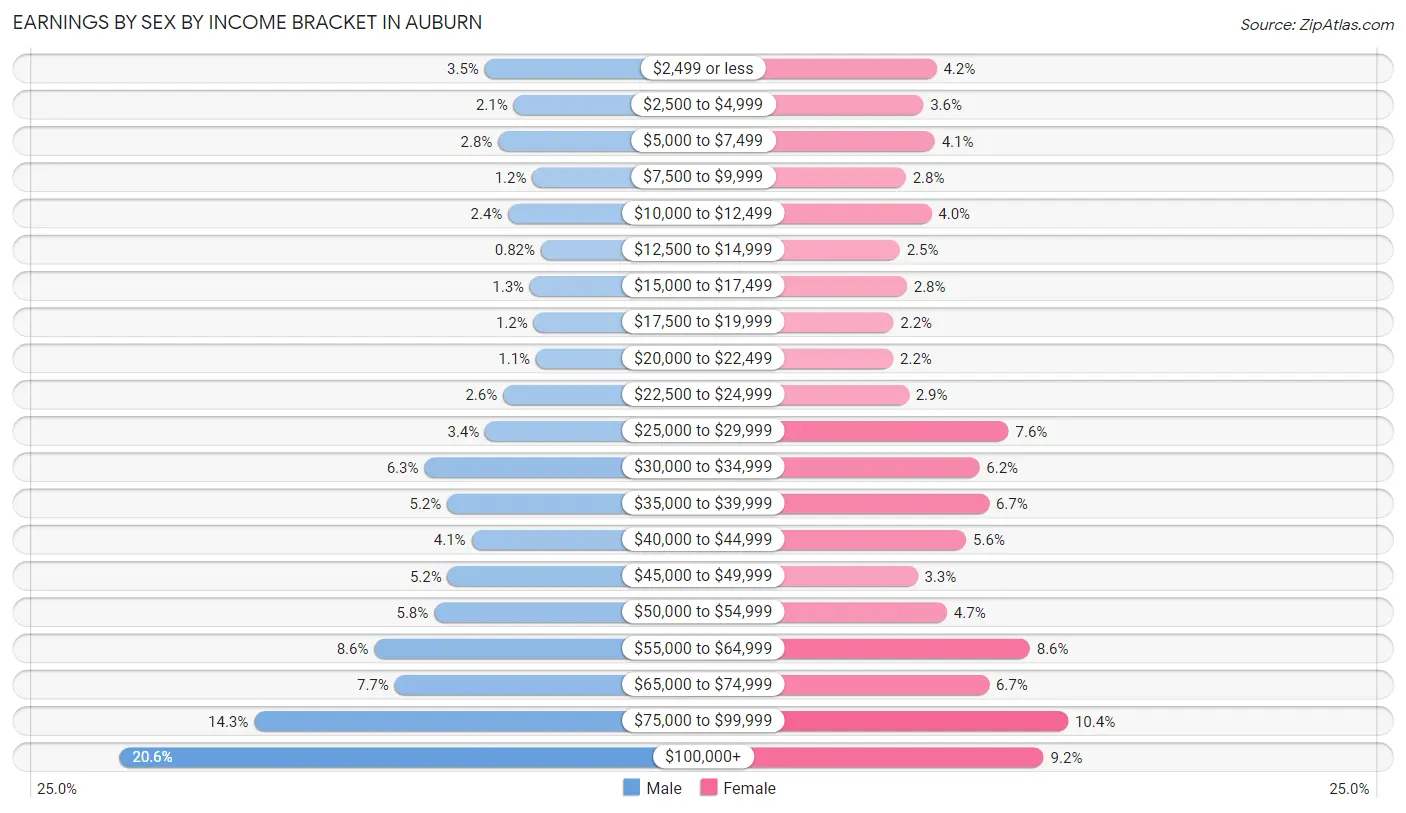
Earnings by Sex by Income Bracket in Auburn
The most common earnings brackets in Auburn are $100,000+ for men (5,172 | 20.6%) and $75,000 to $99,999 for women (2,264 | 10.4%).
| Income | Male | Female |
| $2,499 or less | 869 (3.5%) | 918 (4.2%) |
| $2,500 to $4,999 | 528 (2.1%) | 783 (3.6%) |
| $5,000 to $7,499 | 709 (2.8%) | 900 (4.1%) |
| $7,500 to $9,999 | 307 (1.2%) | 603 (2.8%) |
| $10,000 to $12,499 | 592 (2.4%) | 865 (4.0%) |
| $12,500 to $14,999 | 206 (0.8%) | 542 (2.5%) |
| $15,000 to $17,499 | 334 (1.3%) | 614 (2.8%) |
| $17,500 to $19,999 | 293 (1.2%) | 477 (2.2%) |
| $20,000 to $22,499 | 263 (1.1%) | 474 (2.2%) |
| $22,500 to $24,999 | 652 (2.6%) | 633 (2.9%) |
| $25,000 to $29,999 | 863 (3.4%) | 1,658 (7.6%) |
| $30,000 to $34,999 | 1,581 (6.3%) | 1,358 (6.2%) |
| $35,000 to $39,999 | 1,312 (5.2%) | 1,455 (6.7%) |
| $40,000 to $44,999 | 1,023 (4.1%) | 1,223 (5.6%) |
| $45,000 to $49,999 | 1,306 (5.2%) | 724 (3.3%) |
| $50,000 to $54,999 | 1,465 (5.8%) | 1,026 (4.7%) |
| $55,000 to $64,999 | 2,170 (8.6%) | 1,873 (8.6%) |
| $65,000 to $74,999 | 1,930 (7.7%) | 1,456 (6.7%) |
| $75,000 to $99,999 | 3,585 (14.2%) | 2,264 (10.4%) |
| $100,000+ | 5,172 (20.6%) | 2,015 (9.2%) |
| Total | 25,160 (100.0%) | 21,861 (100.0%) |
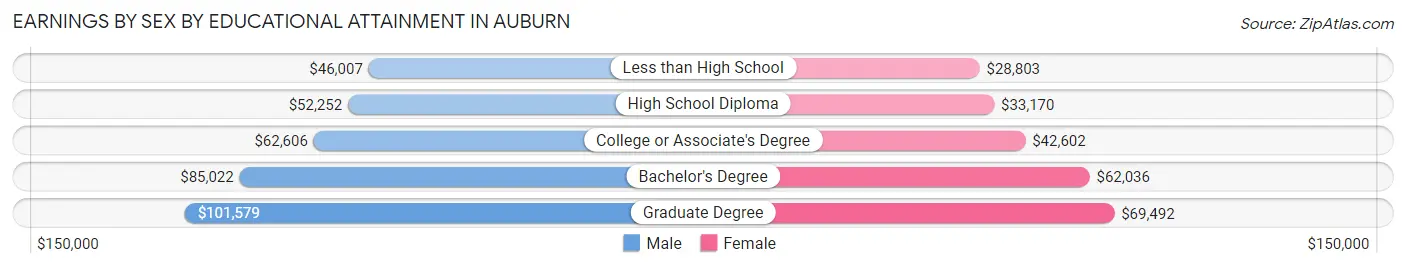
Earnings by Sex by Educational Attainment in Auburn
Average earnings in Auburn are $62,287 for men and $44,151 for women, a difference of 29.1%. Men with an educational attainment of graduate degree enjoy the highest average annual earnings of $101,579, while those with less than high school education earn the least with $46,007. Women with an educational attainment of graduate degree earn the most with the average annual earnings of $69,492, while those with less than high school education have the smallest earnings of $28,803.
| Educational Attainment | Male Income | Female Income |
| Less than High School | $46,007 | $28,803 |
| High School Diploma | $52,252 | $33,170 |
| College or Associate's Degree | $62,606 | $42,602 |
| Bachelor's Degree | $85,022 | $62,036 |
| Graduate Degree | $101,579 | $69,492 |
| Total | $62,287 | $44,151 |
Family Income in Auburn
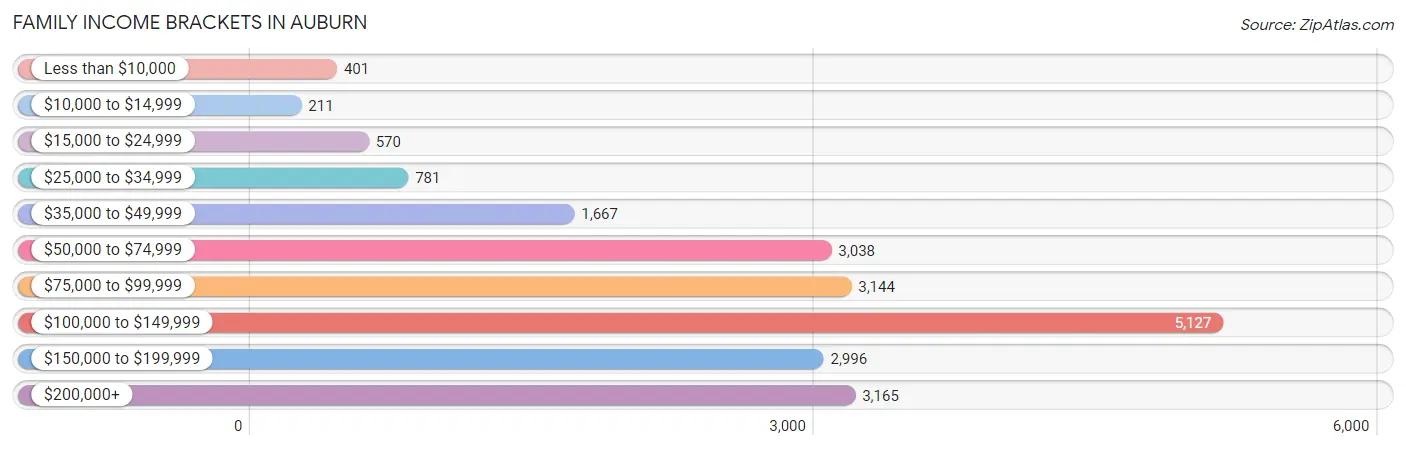
Family Income Brackets in Auburn
According to the Auburn family income data, there are 5,127 families falling into the $100,000 to $149,999 income range, which is the most common income bracket and makes up 24.3% of all families. Conversely, the $10,000 to $14,999 income bracket is the least frequent group with only 211 families (1.0%) belonging to this category.
| Income Bracket | # Families | % Families |
| Less than $10,000 | 401 | 1.9% |
| $10,000 to $14,999 | 211 | 1.0% |
| $15,000 to $24,999 | 570 | 2.7% |
| $25,000 to $34,999 | 781 | 3.7% |
| $35,000 to $49,999 | 1,667 | 7.9% |
| $50,000 to $74,999 | 3,038 | 14.4% |
| $75,000 to $99,999 | 3,144 | 14.9% |
| $100,000 to $149,999 | 5,127 | 24.3% |
| $150,000 to $199,999 | 2,996 | 14.2% |
| $200,000+ | 3,165 | 15.0% |
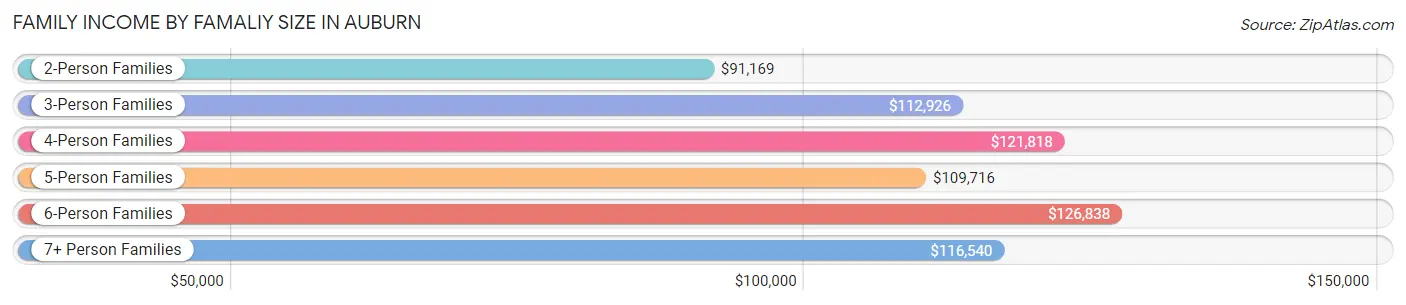
Family Income by Famaliy Size in Auburn
6-person families (840 | 4.0%) account for the highest median family income in Auburn with $126,838 per family, while 2-person families (9,083 | 43.0%) have the highest median income of $45,584 per family member.
| Income Bracket | # Families | Median Income |
| 2-Person Families | 9,083 (43.0%) | $91,169 |
| 3-Person Families | 4,477 (21.2%) | $112,926 |
| 4-Person Families | 3,874 (18.4%) | $121,818 |
| 5-Person Families | 2,138 (10.1%) | $109,716 |
| 6-Person Families | 840 (4.0%) | $126,838 |
| 7+ Person Families | 687 (3.3%) | $116,540 |
| Total | 21,099 (100.0%) | $106,723 |
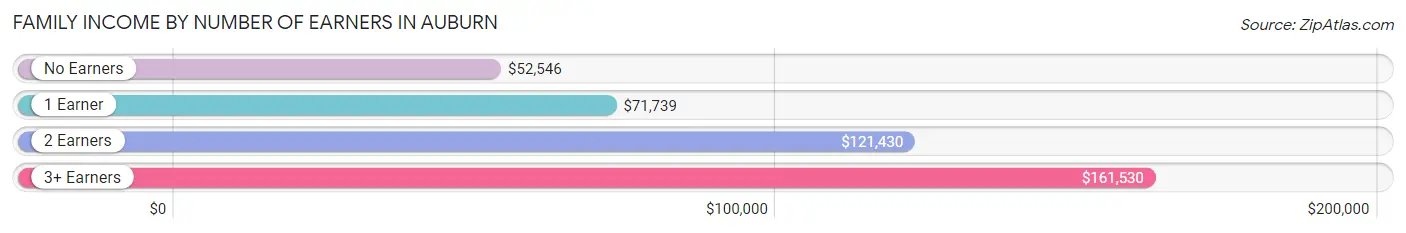
Family Income by Number of Earners in Auburn
The median family income in Auburn is $106,723, with families comprising 3+ earners (3,179) having the highest median family income of $161,530, while families with no earners (1,987) have the lowest median family income of $52,546, accounting for 15.1% and 9.4% of families, respectively.
| Number of Earners | # Families | Median Income |
| No Earners | 1,987 (9.4%) | $52,546 |
| 1 Earner | 6,472 (30.7%) | $71,739 |
| 2 Earners | 9,461 (44.8%) | $121,430 |
| 3+ Earners | 3,179 (15.1%) | $161,530 |
| Total | 21,099 (100.0%) | $106,723 |
Household Income in Auburn
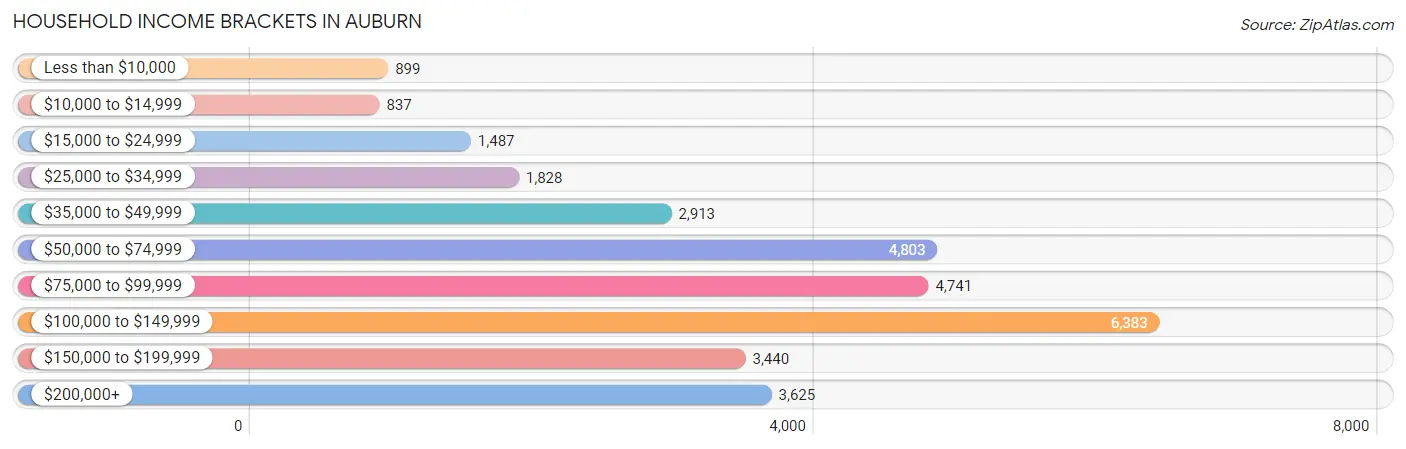
Household Income Brackets in Auburn
With 6,383 households falling in the category, the $100,000 to $149,999 income range is the most frequent in Auburn, accounting for 20.6% of all households. In contrast, only 837 households (2.7%) fall into the $10,000 to $14,999 income bracket, making it the least populous group.
| Income Bracket | # Households | % Households |
| Less than $10,000 | 899 | 2.9% |
| $10,000 to $14,999 | 837 | 2.7% |
| $15,000 to $24,999 | 1,487 | 4.8% |
| $25,000 to $34,999 | 1,828 | 5.9% |
| $35,000 to $49,999 | 2,913 | 9.4% |
| $50,000 to $74,999 | 4,803 | 15.5% |
| $75,000 to $99,999 | 4,741 | 15.3% |
| $100,000 to $149,999 | 6,383 | 20.6% |
| $150,000 to $199,999 | 3,440 | 11.1% |
| $200,000+ | 3,625 | 11.7% |
Household Income by Householder Age in Auburn
The median household income in Auburn is $87,406, with the highest median household income of $100,870 found in the 45 to 64 years age bracket for the primary householder. A total of 11,522 households (37.2%) fall into this category. Meanwhile, the 15 to 24 years age bracket for the primary householder has the lowest median household income of $57,470, with 925 households (3.0%) in this group.
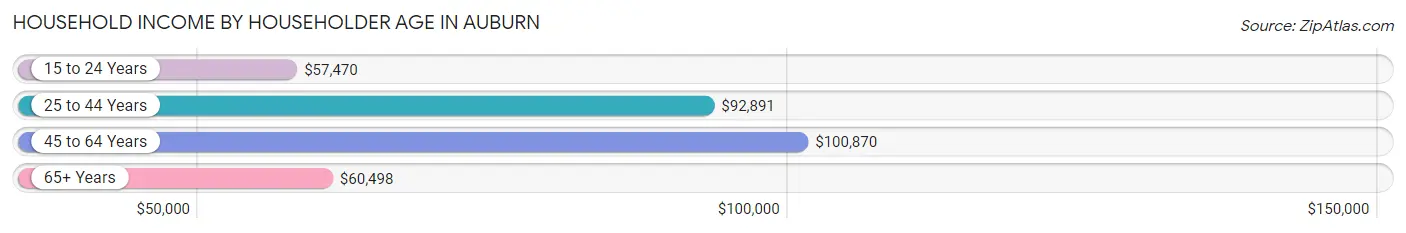
| Income Bracket | # Households | Median Income |
| 15 to 24 Years | 925 (3.0%) | $57,470 |
| 25 to 44 Years | 11,813 (38.1%) | $92,891 |
| 45 to 64 Years | 11,522 (37.2%) | $100,870 |
| 65+ Years | 6,727 (21.7%) | $60,498 |
| Total | 30,987 (100.0%) | $87,406 |
Poverty in Auburn
Income Below Poverty by Sex and Age in Auburn
With 7.0% poverty level for males and 9.0% for females among the residents of Auburn, under 5 year old males and 25 to 34 year old females are the most vulnerable to poverty, with 398 males (15.5%) and 770 females (12.6%) in their respective age groups living below the poverty level.
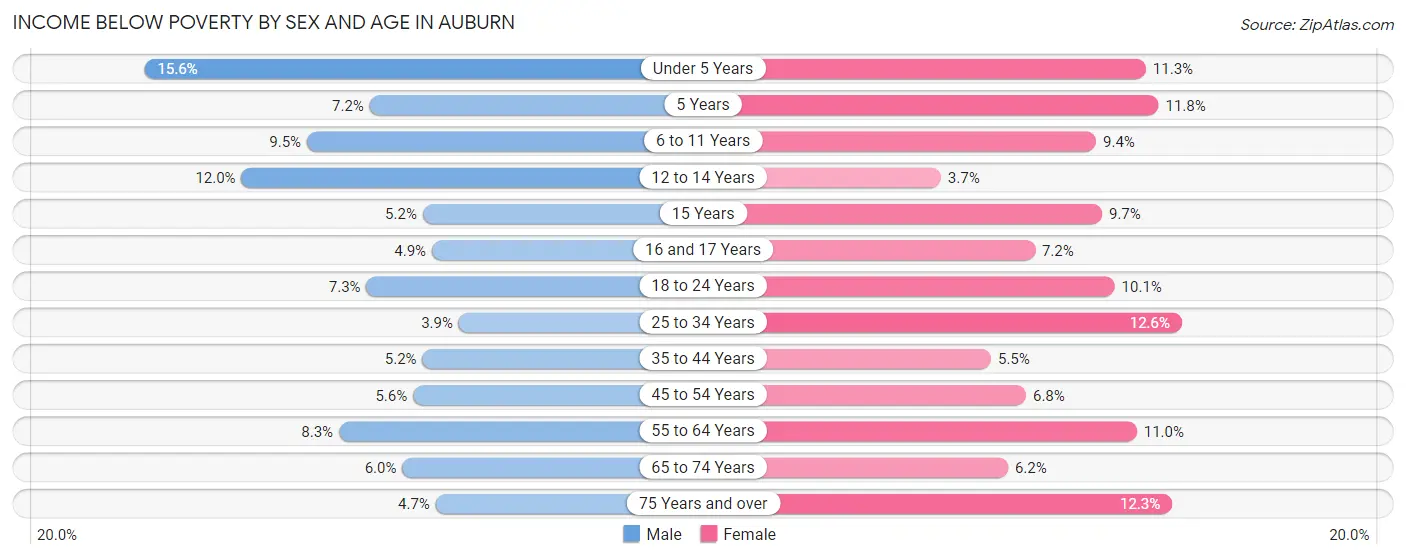
| Age Bracket | Male | Female |
| Under 5 Years | 398 (15.5%) | 327 (11.3%) |
| 5 Years | 31 (7.2%) | 70 (11.8%) |
| 6 to 11 Years | 387 (9.5%) | 328 (9.4%) |
| 12 to 14 Years | 198 (11.9%) | 60 (3.7%) |
| 15 Years | 41 (5.2%) | 54 (9.7%) |
| 16 and 17 Years | 57 (4.9%) | 81 (7.2%) |
| 18 to 24 Years | 270 (7.3%) | 370 (10.1%) |
| 25 to 34 Years | 264 (3.9%) | 770 (12.6%) |
| 35 to 44 Years | 318 (5.2%) | 347 (5.5%) |
| 45 to 54 Years | 308 (5.6%) | 363 (6.8%) |
| 55 to 64 Years | 430 (8.3%) | 538 (11.0%) |
| 65 to 74 Years | 187 (6.0%) | 215 (6.2%) |
| 75 Years and over | 76 (4.7%) | 251 (12.3%) |
| Total | 2,965 (7.0%) | 3,774 (9.0%) |
Income Above Poverty by Sex and Age in Auburn
According to the poverty statistics in Auburn, males aged 25 to 34 years and females aged 12 to 14 years are the age groups that are most secure financially, with 96.1% of males and 96.3% of females in these age groups living above the poverty line.
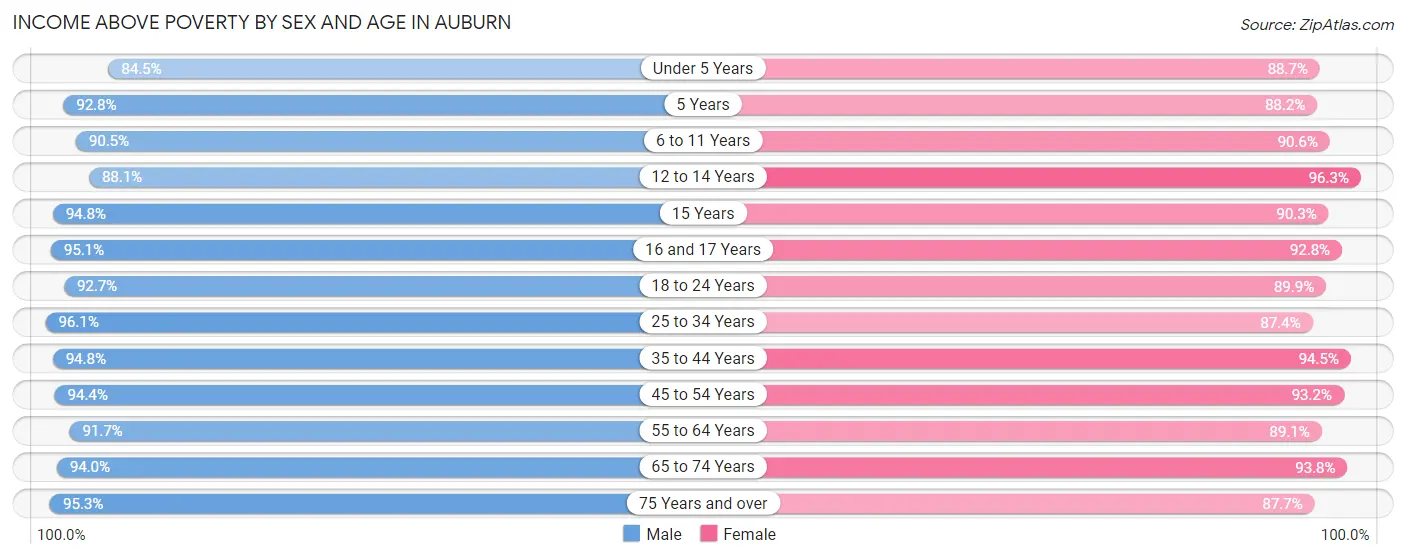
| Age Bracket | Male | Female |
| Under 5 Years | 2,161 (84.5%) | 2,570 (88.7%) |
| 5 Years | 400 (92.8%) | 525 (88.2%) |
| 6 to 11 Years | 3,680 (90.5%) | 3,146 (90.6%) |
| 12 to 14 Years | 1,459 (88.0%) | 1,571 (96.3%) |
| 15 Years | 744 (94.8%) | 505 (90.3%) |
| 16 and 17 Years | 1,110 (95.1%) | 1,048 (92.8%) |
| 18 to 24 Years | 3,423 (92.7%) | 3,283 (89.9%) |
| 25 to 34 Years | 6,546 (96.1%) | 5,331 (87.4%) |
| 35 to 44 Years | 5,764 (94.8%) | 5,918 (94.5%) |
| 45 to 54 Years | 5,212 (94.4%) | 4,945 (93.2%) |
| 55 to 64 Years | 4,732 (91.7%) | 4,377 (89.0%) |
| 65 to 74 Years | 2,939 (94.0%) | 3,267 (93.8%) |
| 75 Years and over | 1,529 (95.3%) | 1,796 (87.7%) |
| Total | 39,699 (93.0%) | 38,282 (91.0%) |
Income Below Poverty Among Married-Couple Families in Auburn
The poverty statistics for married-couple families in Auburn show that 3.0% or 462 of the total 15,289 families live below the poverty line. Families with 5 or more children have the highest poverty rate of 25.5%, comprising of 24 families. On the other hand, families with no children have the lowest poverty rate of 1.7%, which includes 136 families.
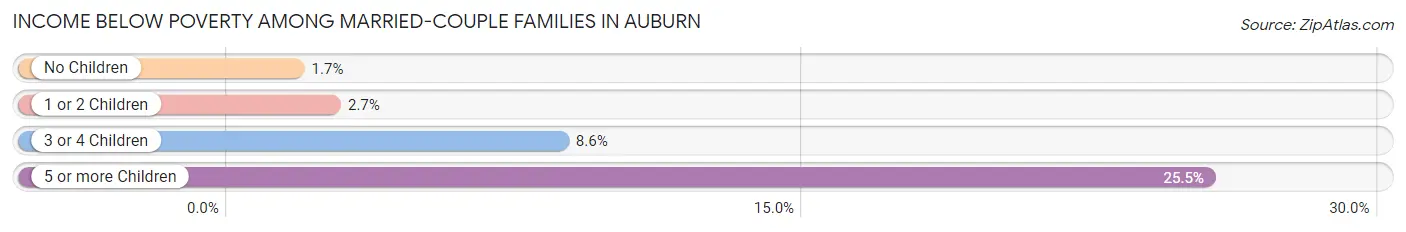
| Children | Above Poverty | Below Poverty |
| No Children | 7,671 (98.3%) | 136 (1.7%) |
| 1 or 2 Children | 5,499 (97.3%) | 152 (2.7%) |
| 3 or 4 Children | 1,587 (91.4%) | 150 (8.6%) |
| 5 or more Children | 70 (74.5%) | 24 (25.5%) |
| Total | 14,827 (97.0%) | 462 (3.0%) |
Income Below Poverty Among Single-Parent Households in Auburn
According to the poverty data in Auburn, 7.1% or 151 single-father households and 14.8% or 544 single-mother households are living below the poverty line. Among single-father households, those with 5 or more children have the highest poverty rate, with 4 households (100.0%) experiencing poverty. Likewise, among single-mother households, those with 3 or 4 children have the highest poverty rate, with 162 households (43.8%) falling below the poverty line.
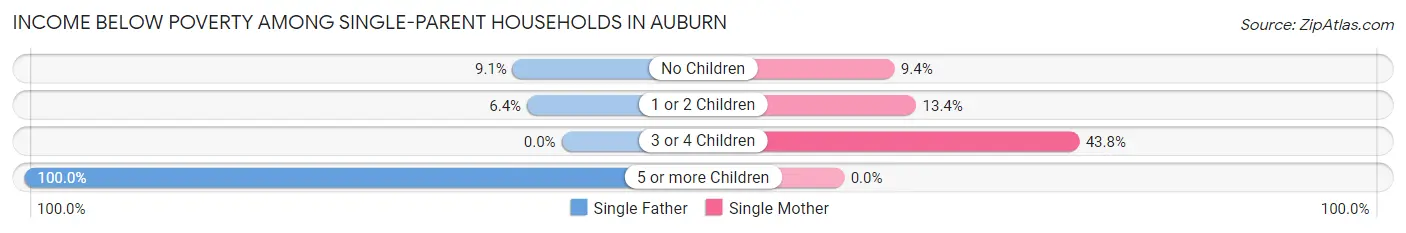
| Children | Single Father | Single Mother |
| No Children | 95 (9.1%) | 141 (9.4%) |
| 1 or 2 Children | 52 (6.4%) | 241 (13.4%) |
| 3 or 4 Children | 0 (0.0%) | 162 (43.8%) |
| 5 or more Children | 4 (100.0%) | 0 (0.0%) |
| Total | 151 (7.1%) | 544 (14.8%) |
Income Below Poverty Among Married-Couple vs Single-Parent Households in Auburn
The poverty data for Auburn shows that 462 of the married-couple family households (3.0%) and 695 of the single-parent households (12.0%) are living below the poverty level. Within the married-couple family households, those with 5 or more children have the highest poverty rate, with 24 households (25.5%) falling below the poverty line. Among the single-parent households, those with 5 or more children have the highest poverty rate, with 4 household (50.0%) living below poverty.
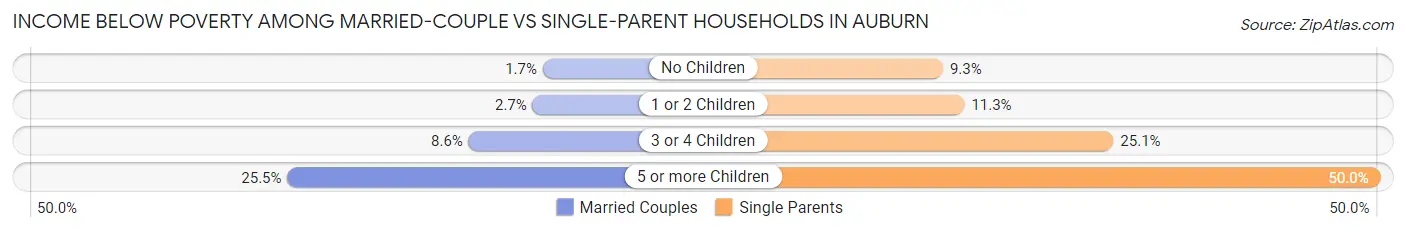
| Children | Married-Couple Families | Single-Parent Households |
| No Children | 136 (1.7%) | 236 (9.2%) |
| 1 or 2 Children | 152 (2.7%) | 293 (11.3%) |
| 3 or 4 Children | 150 (8.6%) | 162 (25.1%) |
| 5 or more Children | 24 (25.5%) | 4 (50.0%) |
| Total | 462 (3.0%) | 695 (12.0%) |
Race in Auburn
The most populous races in Auburn are White / Caucasian (47,948 | 56.0%), Hispanic or Latino (16,253 | 19.0%), and Two or more Races (9,968 | 11.6%).
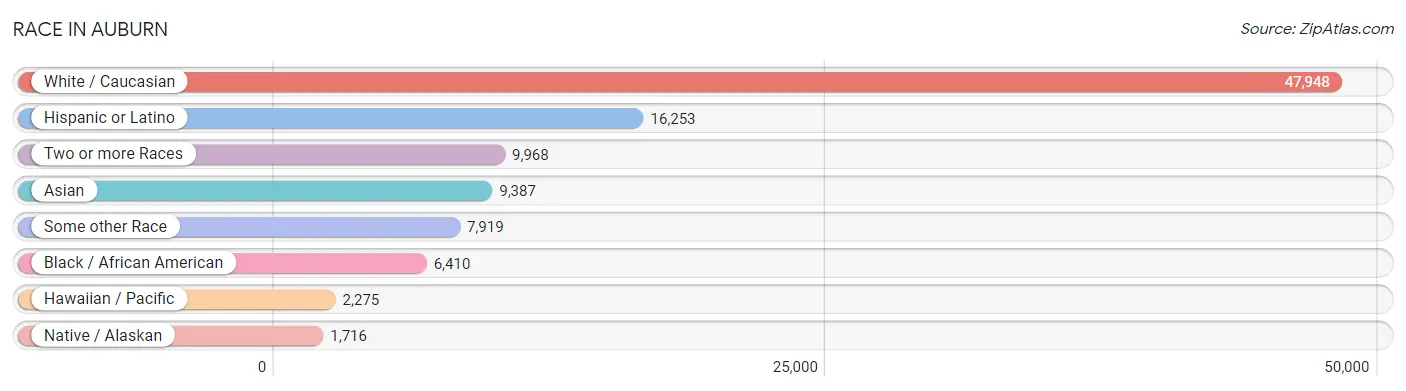
| Race | # Population | % Population |
| Asian | 9,387 | 11.0% |
| Black / African American | 6,410 | 7.5% |
| Hawaiian / Pacific | 2,275 | 2.7% |
| Hispanic or Latino | 16,253 | 19.0% |
| Native / Alaskan | 1,716 | 2.0% |
| White / Caucasian | 47,948 | 56.0% |
| Two or more Races | 9,968 | 11.6% |
| Some other Race | 7,919 | 9.2% |
| Total | 85,623 | 100.0% |
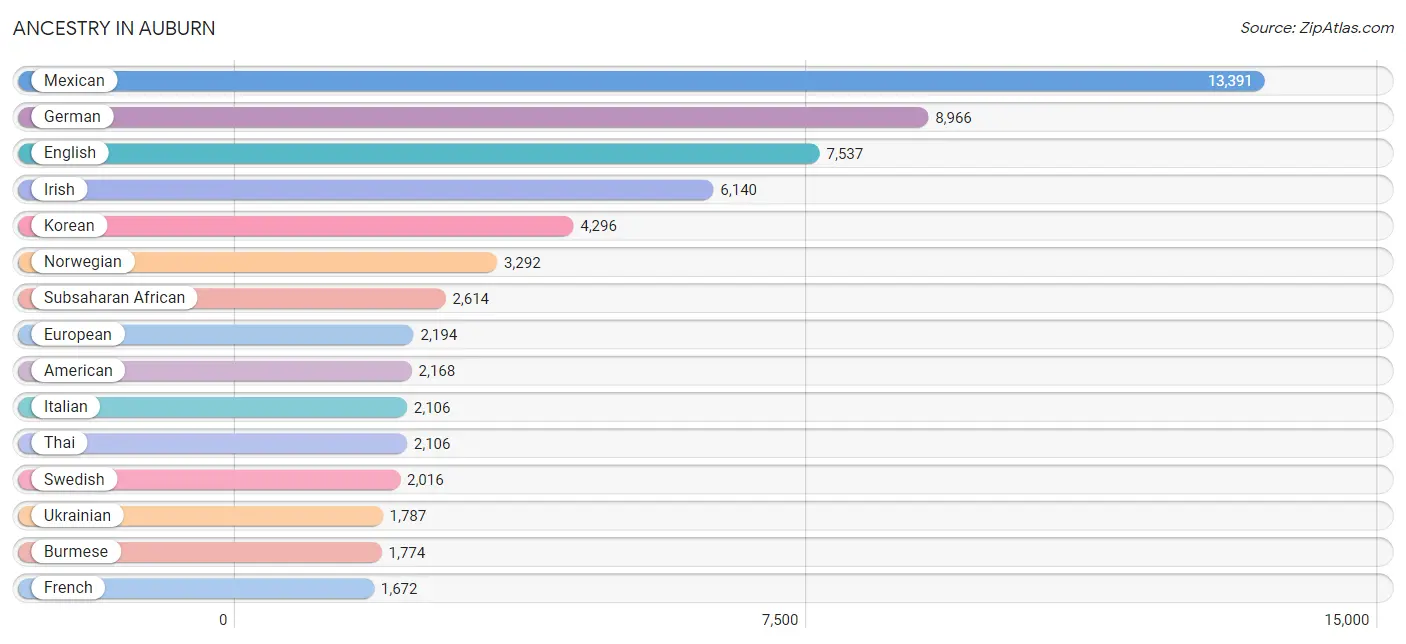
Ancestry in Auburn
The most populous ancestries reported in Auburn are Mexican (13,391 | 15.6%), German (8,966 | 10.5%), English (7,537 | 8.8%), Irish (6,140 | 7.2%), and Korean (4,296 | 5.0%), together accounting for 47.1% of all Auburn residents.
| Ancestry | # Population | % Population |
| Afghan | 469 | 0.5% |
| African | 1,494 | 1.7% |
| Alaska Native | 18 | 0.0% |
| Alaskan Athabascan | 57 | 0.1% |
| Aleut | 38 | 0.0% |
| American | 2,168 | 2.5% |
| Apache | 36 | 0.0% |
| Arab | 754 | 0.9% |
| Arapaho | 89 | 0.1% |
| Argentinean | 109 | 0.1% |
| Armenian | 166 | 0.2% |
| Austrian | 263 | 0.3% |
| Bahamian | 20 | 0.0% |
| Bangladeshi | 170 | 0.2% |
| Belgian | 173 | 0.2% |
| Bhutanese | 664 | 0.8% |
| Blackfeet | 193 | 0.2% |
| Bolivian | 30 | 0.0% |
| Brazilian | 32 | 0.0% |
| British | 450 | 0.5% |
| British West Indian | 62 | 0.1% |
| Bulgarian | 9 | 0.0% |
| Burmese | 1,774 | 2.1% |
| Cajun | 37 | 0.0% |
| Cambodian | 10 | 0.0% |
| Canadian | 156 | 0.2% |
| Cape Verdean | 12 | 0.0% |
| Central American | 1,069 | 1.3% |
| Central American Indian | 32 | 0.0% |
| Cherokee | 368 | 0.4% |
| Chilean | 31 | 0.0% |
| Chinese | 7 | 0.0% |
| Chippewa | 6 | 0.0% |
| Choctaw | 94 | 0.1% |
| Colombian | 77 | 0.1% |
| Colville | 52 | 0.1% |
| Costa Rican | 29 | 0.0% |
| Croatian | 122 | 0.1% |
| Cuban | 145 | 0.2% |
| Czech | 320 | 0.4% |
| Czechoslovakian | 120 | 0.1% |
| Danish | 367 | 0.4% |
| Dominican | 33 | 0.0% |
| Dutch | 936 | 1.1% |
| Eastern European | 90 | 0.1% |
| Ecuadorian | 14 | 0.0% |
| Egyptian | 169 | 0.2% |
| English | 7,537 | 8.8% |
| Estonian | 13 | 0.0% |
| Ethiopian | 131 | 0.2% |
| European | 2,194 | 2.6% |
| Fijian | 877 | 1.0% |
| Filipino | 10 | 0.0% |
| Finnish | 418 | 0.5% |
| French | 1,672 | 1.9% |
| French American Indian | 37 | 0.0% |
| French Canadian | 317 | 0.4% |
| German | 8,966 | 10.5% |
| Ghanaian | 39 | 0.1% |
| Greek | 399 | 0.5% |
| Guamanian / Chamorro | 603 | 0.7% |
| Guatemalan | 400 | 0.5% |
| Honduran | 144 | 0.2% |
| Hungarian | 195 | 0.2% |
| Icelander | 26 | 0.0% |
| Indian (Asian) | 1,397 | 1.6% |
| Indonesian | 83 | 0.1% |
| Inupiat | 56 | 0.1% |
| Iraqi | 280 | 0.3% |
| Irish | 6,140 | 7.2% |
| Iroquois | 92 | 0.1% |
| Italian | 2,106 | 2.5% |
| Jamaican | 227 | 0.3% |
| Japanese | 629 | 0.7% |
| Kenyan | 106 | 0.1% |
| Korean | 4,296 | 5.0% |
| Laotian | 13 | 0.0% |
| Latvian | 34 | 0.0% |
| Lebanese | 106 | 0.1% |
| Lithuanian | 99 | 0.1% |
| Malaysian | 82 | 0.1% |
| Mexican | 13,391 | 15.6% |
| Mexican American Indian | 73 | 0.1% |
| Mongolian | 27 | 0.0% |
| Moroccan | 91 | 0.1% |
| Native Hawaiian | 673 | 0.8% |
| Navajo | 26 | 0.0% |
| New Zealander | 15 | 0.0% |
| Nicaraguan | 158 | 0.2% |
| Nigerian | 206 | 0.2% |
| Northern European | 272 | 0.3% |
| Norwegian | 3,292 | 3.8% |
| Okinawan | 9 | 0.0% |
| Paiute | 40 | 0.1% |
| Pakistani | 189 | 0.2% |
| Pennsylvania German | 22 | 0.0% |
| Peruvian | 80 | 0.1% |
| Polish | 1,123 | 1.3% |
| Portuguese | 101 | 0.1% |
| Pueblo | 24 | 0.0% |
| Puerto Rican | 530 | 0.6% |
| Puget Sound Salish | 648 | 0.8% |
| Romanian | 63 | 0.1% |
| Russian | 977 | 1.1% |
| Salvadoran | 338 | 0.4% |
| Samoan | 898 | 1.1% |
| Scandinavian | 701 | 0.8% |
| Scotch-Irish | 585 | 0.7% |
| Scottish | 1,436 | 1.7% |
| Senegalese | 4 | 0.0% |
| Serbian | 24 | 0.0% |
| Sierra Leonean | 61 | 0.1% |
| Sioux | 251 | 0.3% |
| Slavic | 25 | 0.0% |
| Somali | 365 | 0.4% |
| South American | 397 | 0.5% |
| Spaniard | 110 | 0.1% |
| Spanish | 303 | 0.4% |
| Sri Lankan | 1,610 | 1.9% |
| Subsaharan African | 2,614 | 3.0% |
| Swedish | 2,016 | 2.4% |
| Swiss | 248 | 0.3% |
| Syrian | 78 | 0.1% |
| Thai | 2,106 | 2.5% |
| Tlingit-Haida | 155 | 0.2% |
| Tongan | 45 | 0.1% |
| Tsimshian | 33 | 0.0% |
| Turkish | 357 | 0.4% |
| Ukrainian | 1,787 | 2.1% |
| Uruguayan | 54 | 0.1% |
| Venezuelan | 2 | 0.0% |
| Welsh | 435 | 0.5% |
| West Indian | 19 | 0.0% |
| Yakama | 31 | 0.0% |
| Yugoslavian | 37 | 0.0% |
| Yup'ik | 48 | 0.1% | View All 136 Rows |
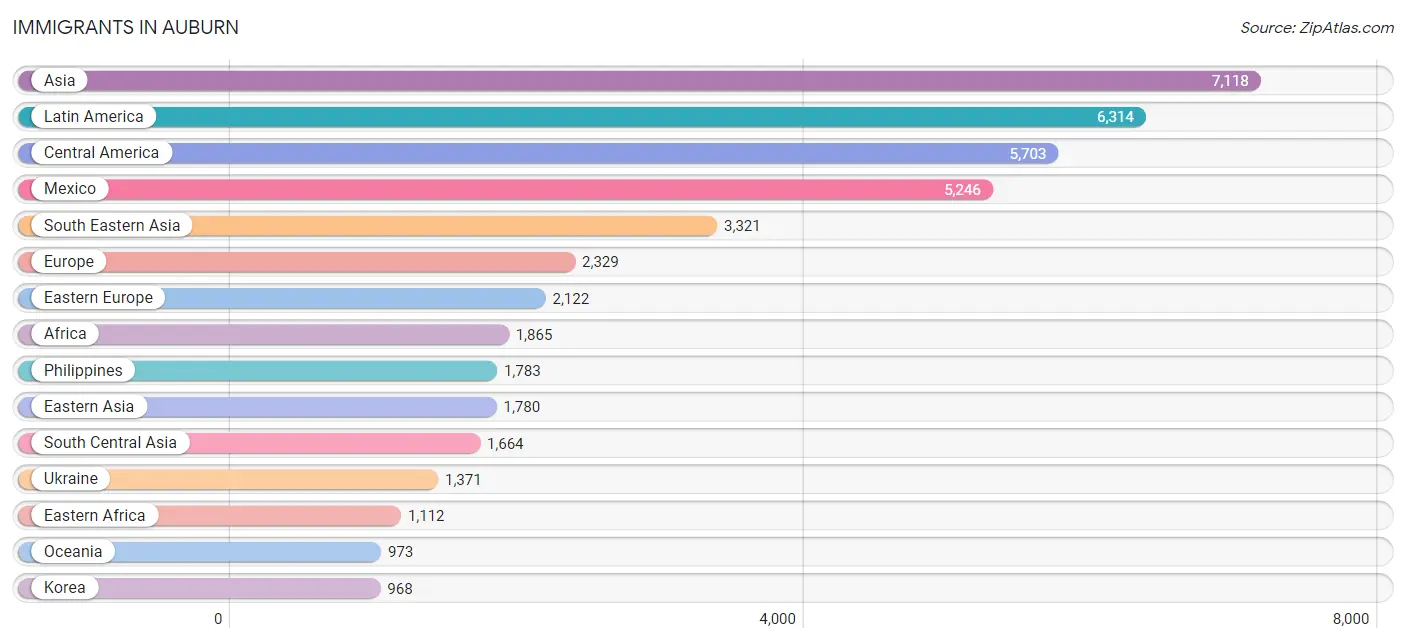
Immigrants in Auburn
The most numerous immigrant groups reported in Auburn came from Asia (7,118 | 8.3%), Latin America (6,314 | 7.4%), Central America (5,703 | 6.7%), Mexico (5,246 | 6.1%), and South Eastern Asia (3,321 | 3.9%), together accounting for 32.4% of all Auburn residents.
| Immigration Origin | # Population | % Population |
| Afghanistan | 441 | 0.5% |
| Africa | 1,865 | 2.2% |
| Argentina | 101 | 0.1% |
| Asia | 7,118 | 8.3% |
| Austria | 7 | 0.0% |
| Bahamas | 20 | 0.0% |
| Belarus | 97 | 0.1% |
| Bolivia | 30 | 0.0% |
| Brazil | 48 | 0.1% |
| Bulgaria | 9 | 0.0% |
| Cambodia | 267 | 0.3% |
| Canada | 243 | 0.3% |
| Caribbean | 216 | 0.3% |
| Central America | 5,703 | 6.7% |
| Chile | 24 | 0.0% |
| China | 690 | 0.8% |
| Colombia | 77 | 0.1% |
| Cuba | 38 | 0.0% |
| Czechoslovakia | 46 | 0.1% |
| Eastern Africa | 1,112 | 1.3% |
| Eastern Asia | 1,780 | 2.1% |
| Eastern Europe | 2,122 | 2.5% |
| Ecuador | 10 | 0.0% |
| Egypt | 145 | 0.2% |
| El Salvador | 194 | 0.2% |
| England | 17 | 0.0% |
| Ethiopia | 100 | 0.1% |
| Europe | 2,329 | 2.7% |
| Fiji | 114 | 0.1% |
| Germany | 91 | 0.1% |
| Ghana | 13 | 0.0% |
| Greece | 15 | 0.0% |
| Grenada | 17 | 0.0% |
| Guatemala | 198 | 0.2% |
| Honduras | 12 | 0.0% |
| Hong Kong | 86 | 0.1% |
| Hungary | 4 | 0.0% |
| India | 871 | 1.0% |
| Indonesia | 28 | 0.0% |
| Iraq | 237 | 0.3% |
| Ireland | 21 | 0.0% |
| Italy | 6 | 0.0% |
| Jamaica | 94 | 0.1% |
| Japan | 122 | 0.1% |
| Kazakhstan | 116 | 0.1% |
| Kenya | 823 | 1.0% |
| Korea | 968 | 1.1% |
| Laos | 127 | 0.2% |
| Latin America | 6,314 | 7.4% |
| Lebanon | 11 | 0.0% |
| Liberia | 117 | 0.1% |
| Malaysia | 46 | 0.1% |
| Mexico | 5,246 | 6.1% |
| Moldova | 9 | 0.0% |
| Morocco | 56 | 0.1% |
| Netherlands | 18 | 0.0% |
| Nicaragua | 53 | 0.1% |
| Nigeria | 67 | 0.1% |
| Northern Africa | 201 | 0.2% |
| Northern Europe | 70 | 0.1% |
| Oceania | 973 | 1.1% |
| Peru | 51 | 0.1% |
| Philippines | 1,783 | 2.1% |
| Poland | 36 | 0.0% |
| Romania | 30 | 0.0% |
| Russia | 435 | 0.5% |
| Sierra Leone | 35 | 0.0% |
| Singapore | 9 | 0.0% |
| Somalia | 165 | 0.2% |
| South Africa | 63 | 0.1% |
| South America | 395 | 0.5% |
| South Central Asia | 1,664 | 1.9% |
| South Eastern Asia | 3,321 | 3.9% |
| Southern Europe | 21 | 0.0% |
| Syria | 78 | 0.1% |
| Taiwan | 97 | 0.1% |
| Thailand | 153 | 0.2% |
| Turkey | 27 | 0.0% |
| Ukraine | 1,371 | 1.6% |
| Uruguay | 54 | 0.1% |
| Uzbekistan | 192 | 0.2% |
| Vietnam | 876 | 1.0% |
| West Indies | 21 | 0.0% |
| Western Africa | 481 | 0.6% |
| Western Asia | 353 | 0.4% |
| Western Europe | 116 | 0.1% | View All 86 Rows |
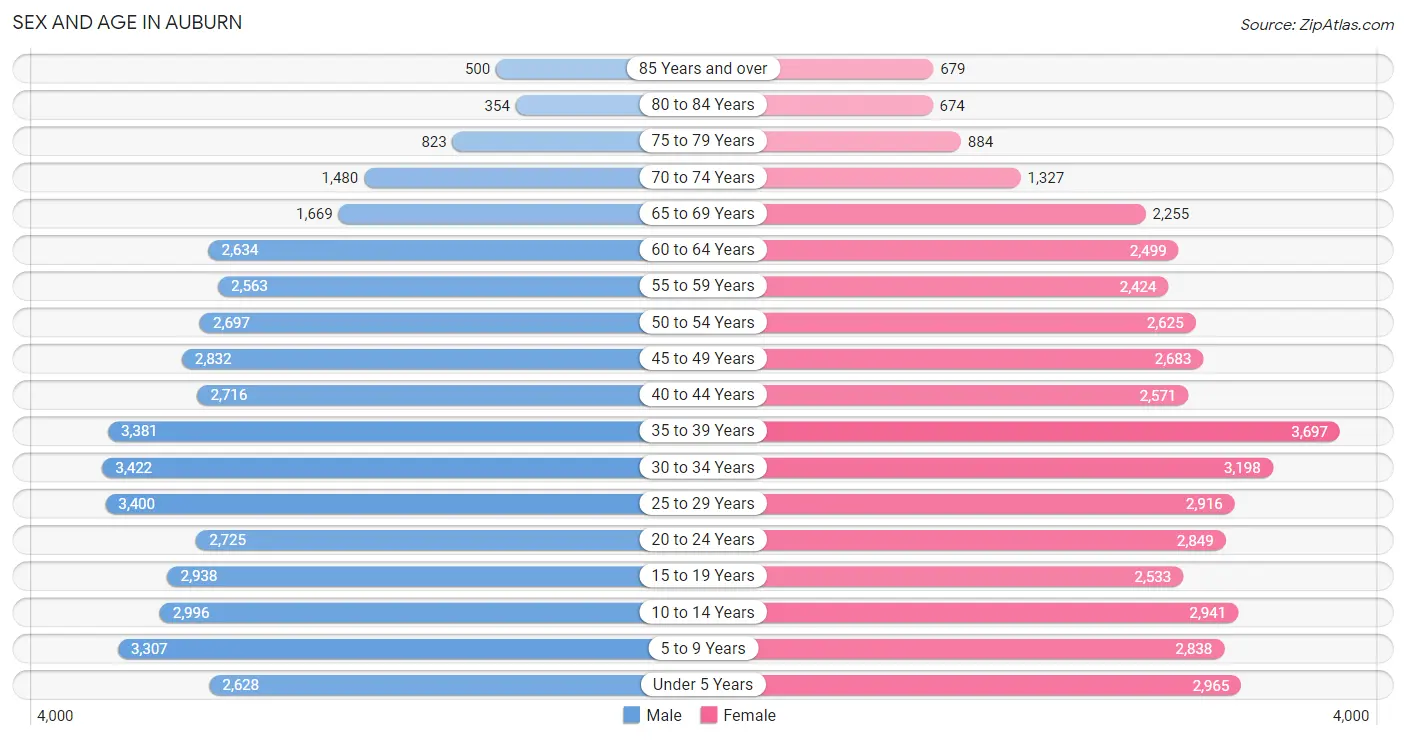
Sex and Age in Auburn
Sex and Age in Auburn
The most populous age groups in Auburn are 30 to 34 Years (3,422 | 8.0%) for men and 35 to 39 Years (3,697 | 8.7%) for women.
| Age Bracket | Male | Female |
| Under 5 Years | 2,628 (6.1%) | 2,965 (7.0%) |
| 5 to 9 Years | 3,307 (7.7%) | 2,838 (6.7%) |
| 10 to 14 Years | 2,996 (7.0%) | 2,941 (6.9%) |
| 15 to 19 Years | 2,938 (6.8%) | 2,533 (5.9%) |
| 20 to 24 Years | 2,725 (6.3%) | 2,849 (6.7%) |
| 25 to 29 Years | 3,400 (7.9%) | 2,916 (6.9%) |
| 30 to 34 Years | 3,422 (8.0%) | 3,198 (7.5%) |
| 35 to 39 Years | 3,381 (7.9%) | 3,697 (8.7%) |
| 40 to 44 Years | 2,716 (6.3%) | 2,571 (6.0%) |
| 45 to 49 Years | 2,832 (6.6%) | 2,683 (6.3%) |
| 50 to 54 Years | 2,697 (6.3%) | 2,625 (6.2%) |
| 55 to 59 Years | 2,563 (5.9%) | 2,424 (5.7%) |
| 60 to 64 Years | 2,634 (6.1%) | 2,499 (5.9%) |
| 65 to 69 Years | 1,669 (3.9%) | 2,255 (5.3%) |
| 70 to 74 Years | 1,480 (3.4%) | 1,327 (3.1%) |
| 75 to 79 Years | 823 (1.9%) | 884 (2.1%) |
| 80 to 84 Years | 354 (0.8%) | 674 (1.6%) |
| 85 Years and over | 500 (1.2%) | 679 (1.6%) |
| Total | 43,065 (100.0%) | 42,558 (100.0%) |
Families and Households in Auburn
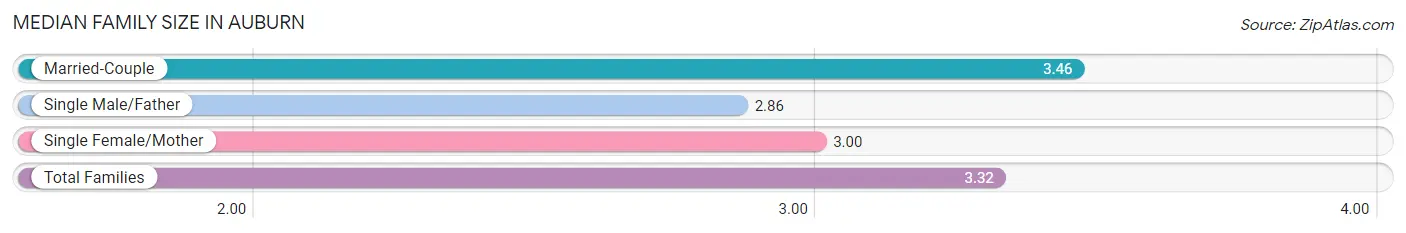
Median Family Size in Auburn
The median family size in Auburn is 3.32 persons per family, with married-couple families (15,289 | 72.5%) accounting for the largest median family size of 3.46 persons per family. On the other hand, single male/father families (2,131 | 10.1%) represent the smallest median family size with 2.86 persons per family.
| Family Type | # Families | Family Size |
| Married-Couple | 15,289 (72.5%) | 3.46 |
| Single Male/Father | 2,131 (10.1%) | 2.86 |
| Single Female/Mother | 3,679 (17.4%) | 3.00 |
| Total Families | 21,099 (100.0%) | 3.32 |
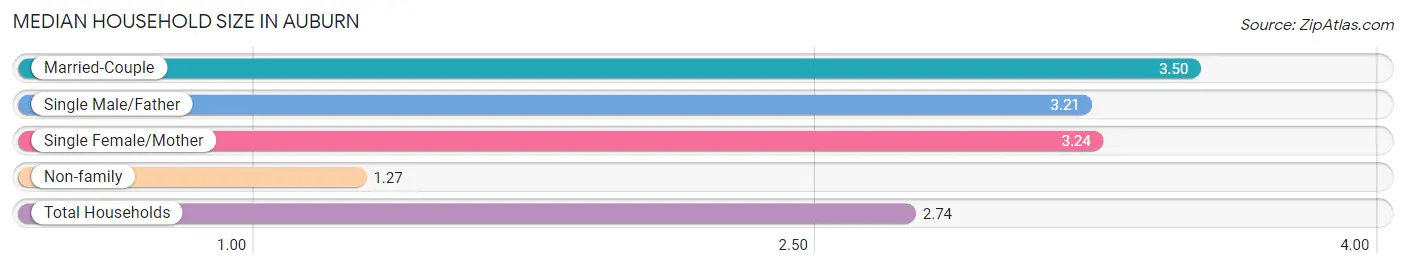
Median Household Size in Auburn
The median household size in Auburn is 2.74 persons per household, with married-couple households (15,289 | 49.3%) accounting for the largest median household size of 3.5 persons per household. non-family households (9,888 | 31.9%) represent the smallest median household size with 1.27 persons per household.
| Household Type | # Households | Household Size |
| Married-Couple | 15,289 (49.3%) | 3.50 |
| Single Male/Father | 2,131 (6.9%) | 3.21 |
| Single Female/Mother | 3,679 (11.9%) | 3.24 |
| Non-family | 9,888 (31.9%) | 1.27 |
| Total Households | 30,987 (100.0%) | 2.74 |
Household Size by Marriage Status in Auburn
Out of a total of 30,987 households in Auburn, 21,099 (68.1%) are family households, while 9,888 (31.9%) are nonfamily households. The most numerous type of family households are 2-person households, comprising 8,329, and the most common type of nonfamily households are 1-person households, comprising 7,733.
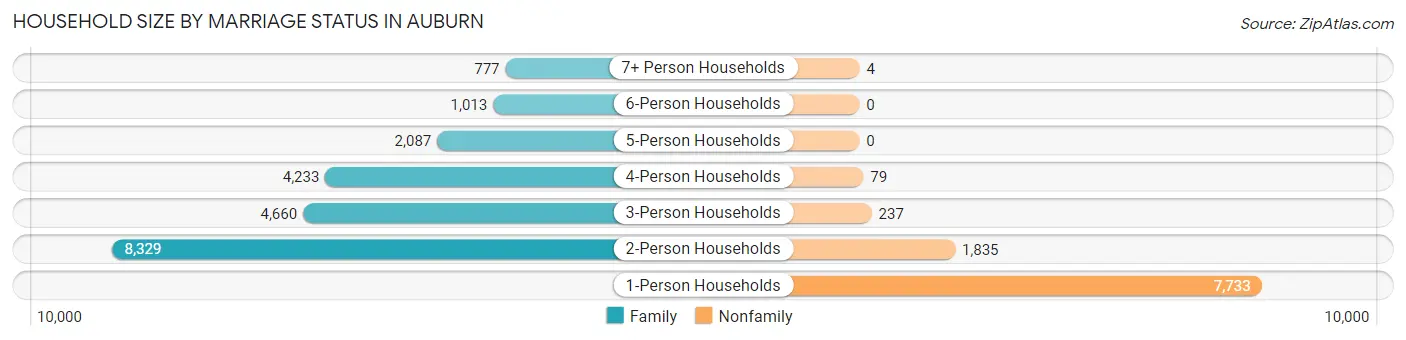
| Household Size | Family Households | Nonfamily Households |
| 1-Person Households | - | 7,733 (25.0%) |
| 2-Person Households | 8,329 (26.9%) | 1,835 (5.9%) |
| 3-Person Households | 4,660 (15.0%) | 237 (0.8%) |
| 4-Person Households | 4,233 (13.7%) | 79 (0.3%) |
| 5-Person Households | 2,087 (6.7%) | 0 (0.0%) |
| 6-Person Households | 1,013 (3.3%) | 0 (0.0%) |
| 7+ Person Households | 777 (2.5%) | 4 (0.0%) |
| Total | 21,099 (68.1%) | 9,888 (31.9%) |
Female Fertility in Auburn
Fertility by Age in Auburn
Average fertility rate in Auburn is 63.0 births per 1,000 women. Women in the age bracket of 20 to 34 years have the highest fertility rate with 94.0 births per 1,000 women. Women in the age bracket of 20 to 34 years acount for 63.7% of all women with births.
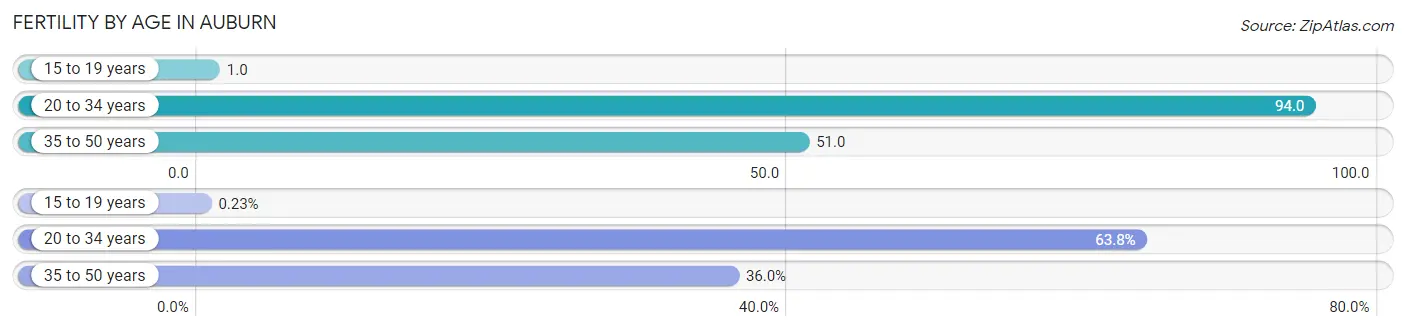
| Age Bracket | Women with Births | Births / 1,000 Women |
| 15 to 19 years | 3 (0.2%) | 1.0 |
| 20 to 34 years | 844 (63.7%) | 94.0 |
| 35 to 50 years | 477 (36.0%) | 51.0 |
| Total | 1,324 (100.0%) | 63.0 |
Fertility by Age by Marriage Status in Auburn
74.8% of women with births (1,324) in Auburn are married. The highest percentage of unmarried women with births falls into 15 to 19 years age bracket with 100.0% of them unmarried at the time of birth, while the lowest percentage of unmarried women with births belong to 35 to 50 years age bracket with 17.6% of them unmarried.
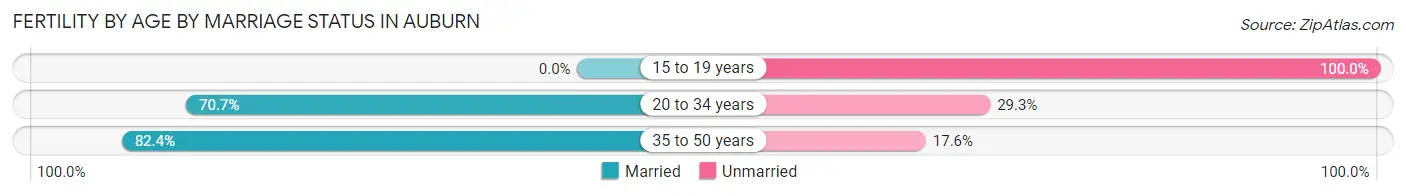
| Age Bracket | Married | Unmarried |
| 15 to 19 years | 0 (0.0%) | 3 (100.0%) |
| 20 to 34 years | 597 (70.7%) | 247 (29.3%) |
| 35 to 50 years | 393 (82.4%) | 84 (17.6%) |
| Total | 990 (74.8%) | 334 (25.2%) |
Fertility by Education in Auburn
Average fertility rate in Auburn is 63.0 births per 1,000 women. Women with the education attainment of high school diploma have the highest fertility rate of 107.0 births per 1,000 women, while women with the education attainment of less than high school have the lowest fertility at 24.0 births per 1,000 women. Women with the education attainment of high school diploma represent 37.2% of all women with births.
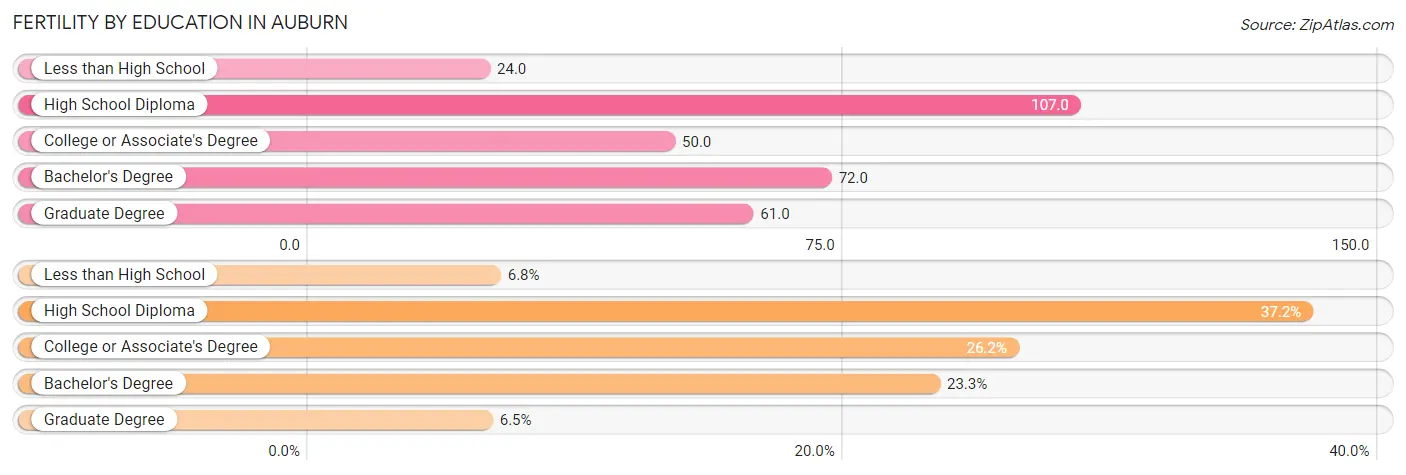
| Educational Attainment | Women with Births | Births / 1,000 Women |
| Less than High School | 90 (6.8%) | 24.0 |
| High School Diploma | 493 (37.2%) | 107.0 |
| College or Associate's Degree | 347 (26.2%) | 50.0 |
| Bachelor's Degree | 308 (23.3%) | 72.0 |
| Graduate Degree | 86 (6.5%) | 61.0 |
| Total | 1,324 (100.0%) | 63.0 |
Fertility by Education by Marriage Status in Auburn
25.2% of women with births in Auburn are unmarried. Women with the educational attainment of bachelor's degree are most likely to be married with 100.0% of them married at childbirth, while women with the educational attainment of less than high school are least likely to be married with 43.3% of them unmarried at childbirth.
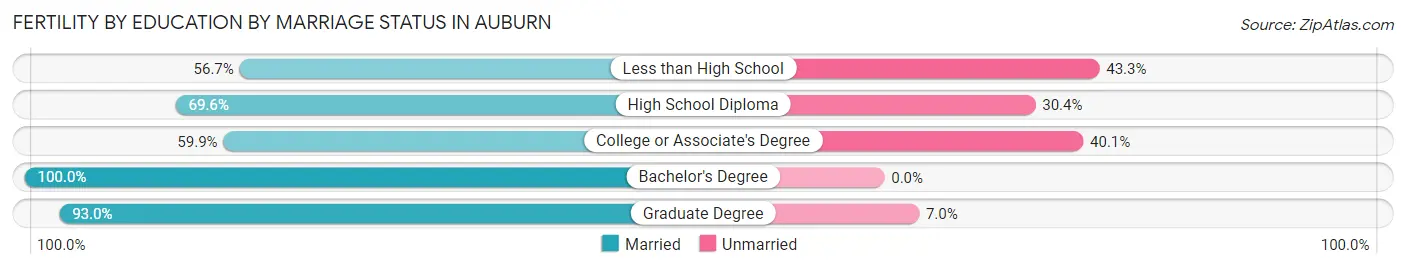
| Educational Attainment | Married | Unmarried |
| Less than High School | 51 (56.7%) | 39 (43.3%) |
| High School Diploma | 343 (69.6%) | 150 (30.4%) |
| College or Associate's Degree | 208 (59.9%) | 139 (40.1%) |
| Bachelor's Degree | 308 (100.0%) | 0 (0.0%) |
| Graduate Degree | 80 (93.0%) | 6 (7.0%) |
| Total | 990 (74.8%) | 334 (25.2%) |
Employment Characteristics in Auburn
Employment by Class of Employer in Auburn
Among the 43,215 employed individuals in Auburn, private company employees (30,632 | 70.9%), not-for-profit organizations (3,698 | 8.6%), and local government employees (3,025 | 7.0%) make up the most common classes of employment.
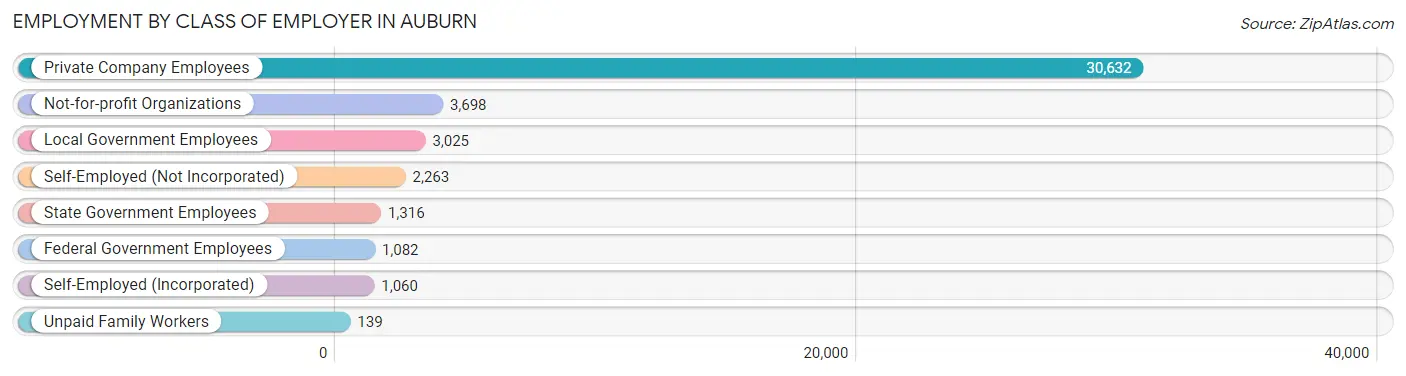
| Employer Class | # Employees | % Employees |
| Private Company Employees | 30,632 | 70.9% |
| Self-Employed (Incorporated) | 1,060 | 2.5% |
| Self-Employed (Not Incorporated) | 2,263 | 5.2% |
| Not-for-profit Organizations | 3,698 | 8.6% |
| Local Government Employees | 3,025 | 7.0% |
| State Government Employees | 1,316 | 3.0% |
| Federal Government Employees | 1,082 | 2.5% |
| Unpaid Family Workers | 139 | 0.3% |
| Total | 43,215 | 100.0% |
Employment Status by Age in Auburn
According to the labor force statistics for Auburn, out of the total population over 16 years of age (66,599), 69.2% or 46,087 individuals are in the labor force, with 4.7% or 2,166 of them unemployed. The age group with the highest labor force participation rate is 25 to 29 years, with 86.4% or 5,457 individuals in the labor force. Within the labor force, the 16 to 19 years age range has the highest percentage of unemployed individuals, with 10.9% or 190 of them being unemployed.
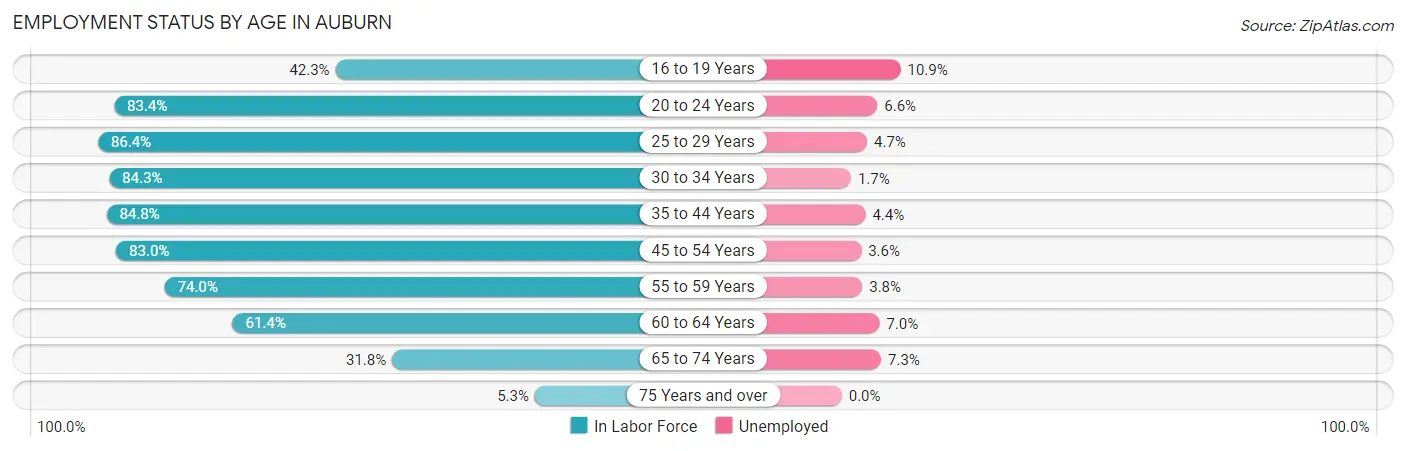
| Age Bracket | In Labor Force | Unemployed |
| 16 to 19 Years | 1,744 (42.3%) | 190 (10.9%) |
| 20 to 24 Years | 4,649 (83.4%) | 307 (6.6%) |
| 25 to 29 Years | 5,457 (86.4%) | 256 (4.7%) |
| 30 to 34 Years | 5,581 (84.3%) | 95 (1.7%) |
| 35 to 44 Years | 10,486 (84.8%) | 461 (4.4%) |
| 45 to 54 Years | 8,995 (83.0%) | 324 (3.6%) |
| 55 to 59 Years | 3,690 (74.0%) | 140 (3.8%) |
| 60 to 64 Years | 3,152 (61.4%) | 221 (7.0%) |
| 65 to 74 Years | 2,140 (31.8%) | 156 (7.3%) |
| 75 Years and over | 207 (5.3%) | 0 (0.0%) |
| Total | 46,087 (69.2%) | 2,166 (4.7%) |
Employment Status by Educational Attainment in Auburn
According to labor force statistics for Auburn, 80.8% of individuals (37,376) out of the total population between 25 and 64 years of age (46,258) are in the labor force, with 4.0% or 1,495 of them being unemployed. The group with the highest labor force participation rate are those with the educational attainment of bachelor's degree or higher, with 88.8% or 11,287 individuals in the labor force. Within the labor force, individuals with high school diploma education have the highest percentage of unemployment, with 5.5% or 563 of them being unemployed.
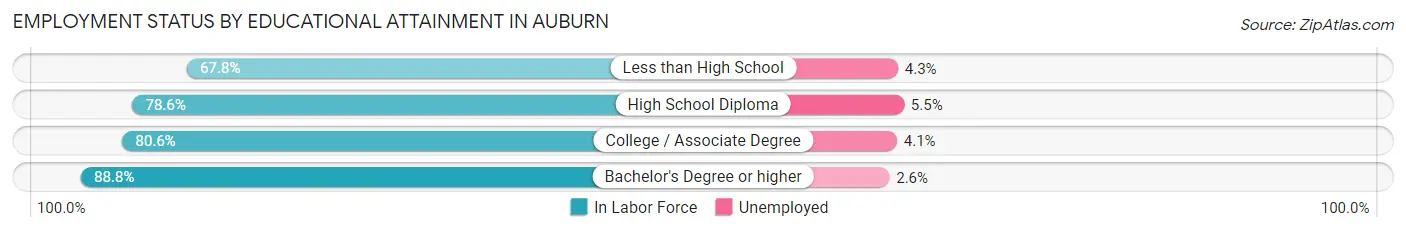
| Educational Attainment | In Labor Force | Unemployed |
| Less than High School | 3,675 (67.8%) | 233 (4.3%) |
| High School Diploma | 10,240 (78.6%) | 717 (5.5%) |
| College / Associate Degree | 12,170 (80.6%) | 619 (4.1%) |
| Bachelor's Degree or higher | 11,287 (88.8%) | 330 (2.6%) |
| Total | 37,376 (80.8%) | 1,850 (4.0%) |
Employment Occupations by Sex in Auburn
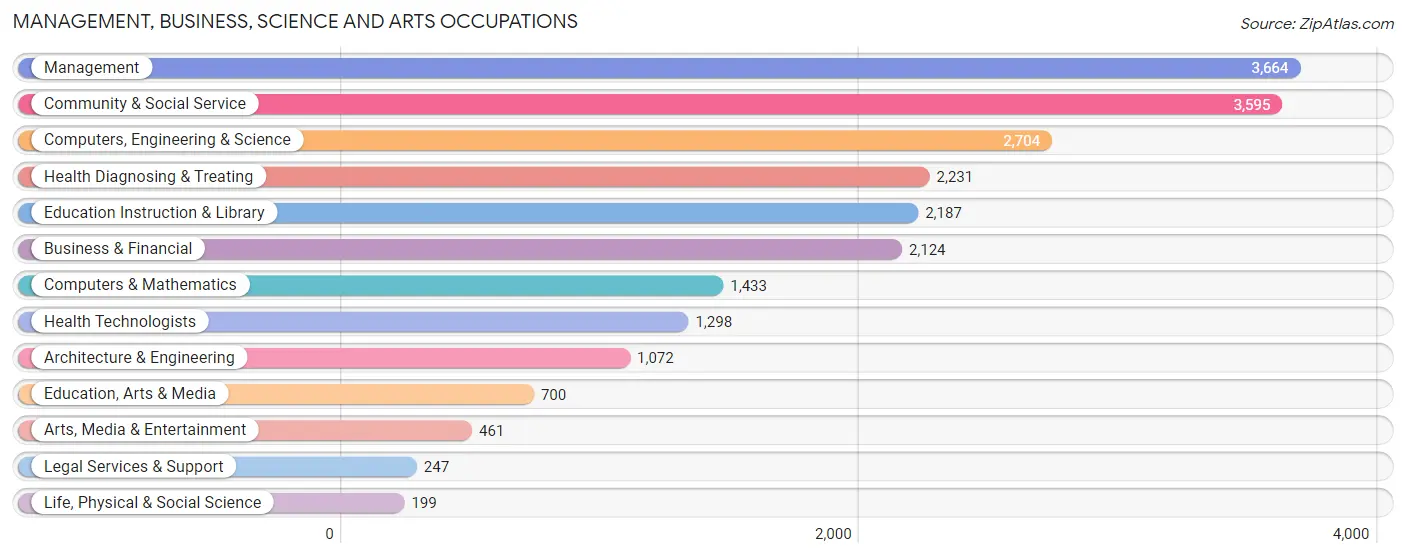
Management, Business, Science and Arts Occupations
The most common Management, Business, Science and Arts occupations in Auburn are Management (3,664 | 8.3%), Community & Social Service (3,595 | 8.2%), Computers, Engineering & Science (2,704 | 6.2%), Health Diagnosing & Treating (2,231 | 5.1%), and Education Instruction & Library (2,187 | 5.0%).
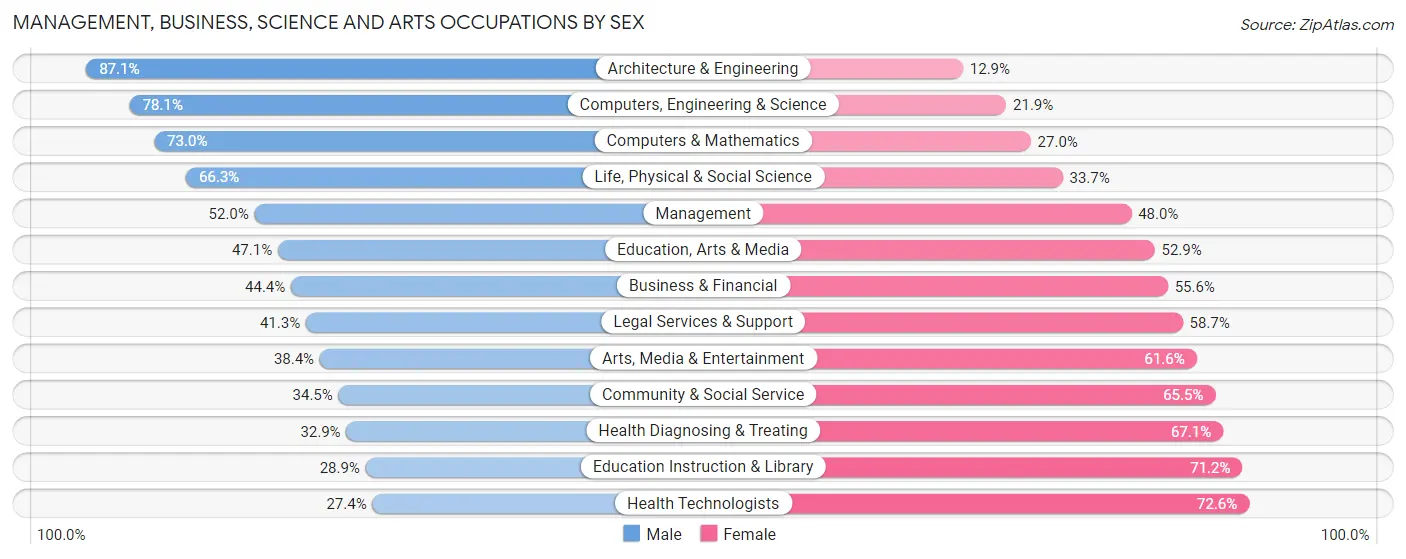
Management, Business, Science and Arts Occupations by Sex
Within the Management, Business, Science and Arts occupations in Auburn, the most male-oriented occupations are Architecture & Engineering (87.1%), Computers, Engineering & Science (78.1%), and Computers & Mathematics (73.0%), while the most female-oriented occupations are Health Technologists (72.6%), Education Instruction & Library (71.2%), and Health Diagnosing & Treating (67.1%).
| Occupation | Male | Female |
| Management | 1,906 (52.0%) | 1,758 (48.0%) |
| Business & Financial | 943 (44.4%) | 1,181 (55.6%) |
| Computers, Engineering & Science | 2,112 (78.1%) | 592 (21.9%) |
| Computers & Mathematics | 1,046 (73.0%) | 387 (27.0%) |
| Architecture & Engineering | 934 (87.1%) | 138 (12.9%) |
| Life, Physical & Social Science | 132 (66.3%) | 67 (33.7%) |
| Community & Social Service | 1,240 (34.5%) | 2,355 (65.5%) |
| Education, Arts & Media | 330 (47.1%) | 370 (52.9%) |
| Legal Services & Support | 102 (41.3%) | 145 (58.7%) |
| Education Instruction & Library | 631 (28.8%) | 1,556 (71.2%) |
| Arts, Media & Entertainment | 177 (38.4%) | 284 (61.6%) |
| Health Diagnosing & Treating | 733 (32.9%) | 1,498 (67.1%) |
| Health Technologists | 356 (27.4%) | 942 (72.6%) |
| Total (Category) | 6,934 (48.4%) | 7,384 (51.6%) |
| Total (Overall) | 23,607 (53.7%) | 20,309 (46.3%) |
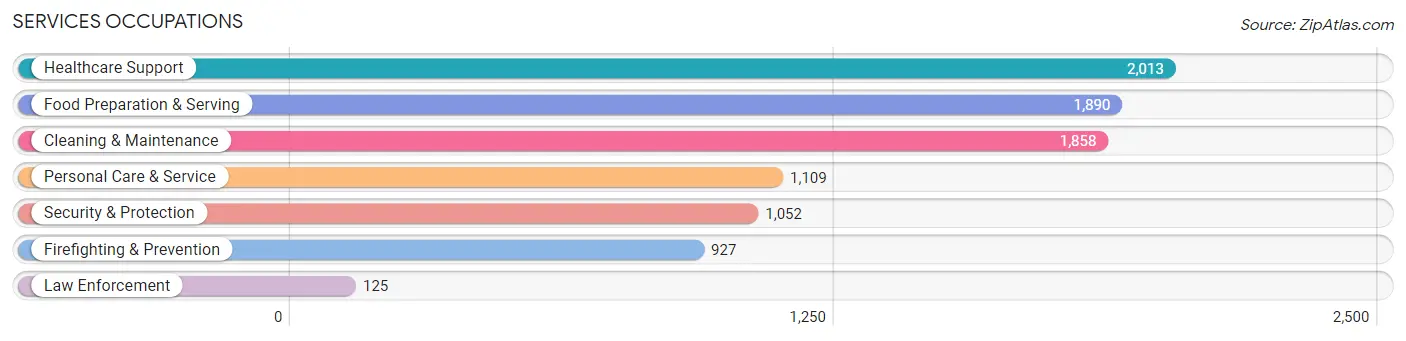
Services Occupations
The most common Services occupations in Auburn are Healthcare Support (2,013 | 4.6%), Food Preparation & Serving (1,890 | 4.3%), Cleaning & Maintenance (1,858 | 4.2%), Personal Care & Service (1,109 | 2.5%), and Security & Protection (1,052 | 2.4%).
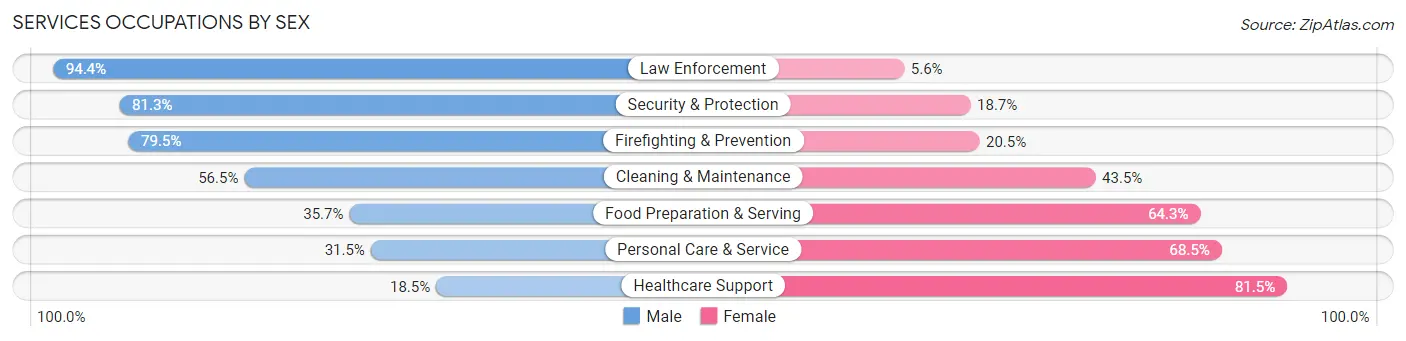
Services Occupations by Sex
Within the Services occupations in Auburn, the most male-oriented occupations are Law Enforcement (94.4%), Security & Protection (81.3%), and Firefighting & Prevention (79.5%), while the most female-oriented occupations are Healthcare Support (81.5%), Personal Care & Service (68.5%), and Food Preparation & Serving (64.3%).
| Occupation | Male | Female |
| Healthcare Support | 373 (18.5%) | 1,640 (81.5%) |
| Security & Protection | 855 (81.3%) | 197 (18.7%) |
| Firefighting & Prevention | 737 (79.5%) | 190 (20.5%) |
| Law Enforcement | 118 (94.4%) | 7 (5.6%) |
| Food Preparation & Serving | 675 (35.7%) | 1,215 (64.3%) |
| Cleaning & Maintenance | 1,050 (56.5%) | 808 (43.5%) |
| Personal Care & Service | 349 (31.5%) | 760 (68.5%) |
| Total (Category) | 3,302 (41.7%) | 4,620 (58.3%) |
| Total (Overall) | 23,607 (53.7%) | 20,309 (46.3%) |
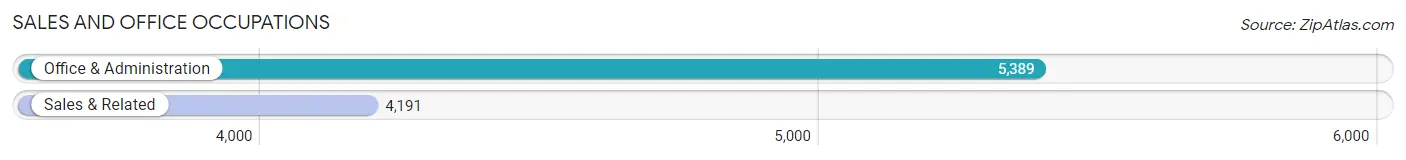
Sales and Office Occupations
The most common Sales and Office occupations in Auburn are Office & Administration (5,389 | 12.3%), and Sales & Related (4,191 | 9.5%).
Sales and Office Occupations by Sex
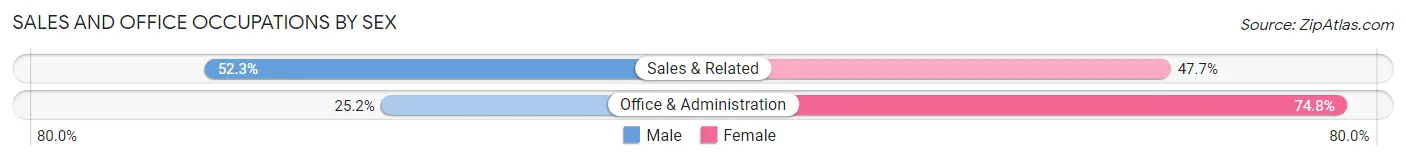
| Occupation | Male | Female |
| Sales & Related | 2,191 (52.3%) | 2,000 (47.7%) |
| Office & Administration | 1,360 (25.2%) | 4,029 (74.8%) |
| Total (Category) | 3,551 (37.1%) | 6,029 (62.9%) |
| Total (Overall) | 23,607 (53.7%) | 20,309 (46.3%) |
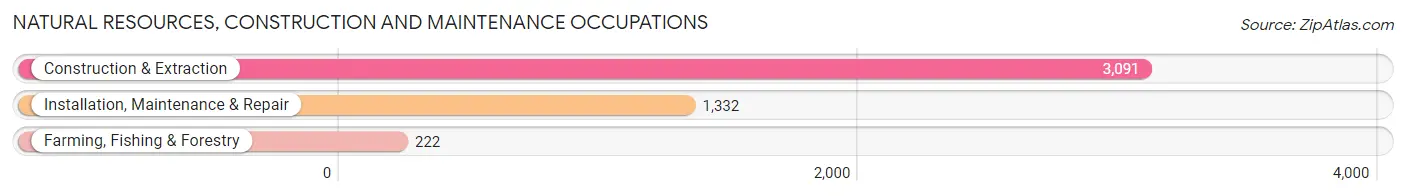
Natural Resources, Construction and Maintenance Occupations
The most common Natural Resources, Construction and Maintenance occupations in Auburn are Construction & Extraction (3,091 | 7.0%), Installation, Maintenance & Repair (1,332 | 3.0%), and Farming, Fishing & Forestry (222 | 0.5%).
Natural Resources, Construction and Maintenance Occupations by Sex
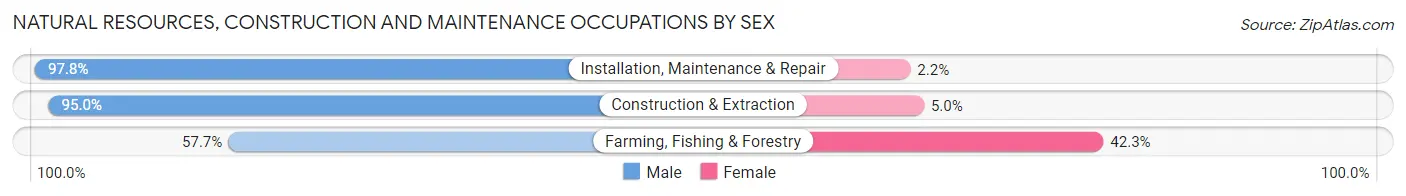
| Occupation | Male | Female |
| Farming, Fishing & Forestry | 128 (57.7%) | 94 (42.3%) |
| Construction & Extraction | 2,936 (95.0%) | 155 (5.0%) |
| Installation, Maintenance & Repair | 1,303 (97.8%) | 29 (2.2%) |
| Total (Category) | 4,367 (94.0%) | 278 (6.0%) |
| Total (Overall) | 23,607 (53.7%) | 20,309 (46.3%) |
Production, Transportation and Moving Occupations
The most common Production, Transportation and Moving occupations in Auburn are Material Moving (2,891 | 6.6%), Production (2,534 | 5.8%), and Transportation (2,026 | 4.6%).
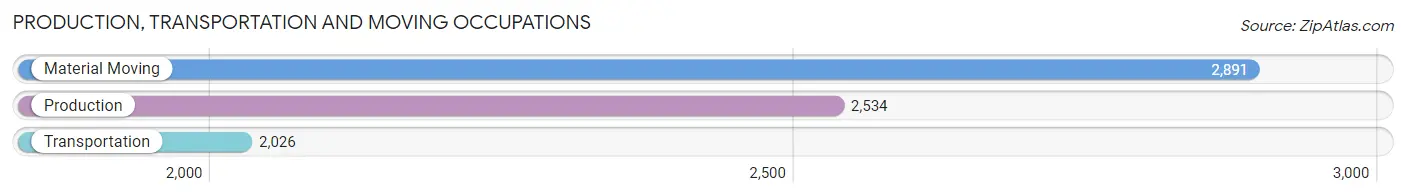
Production, Transportation and Moving Occupations by Sex
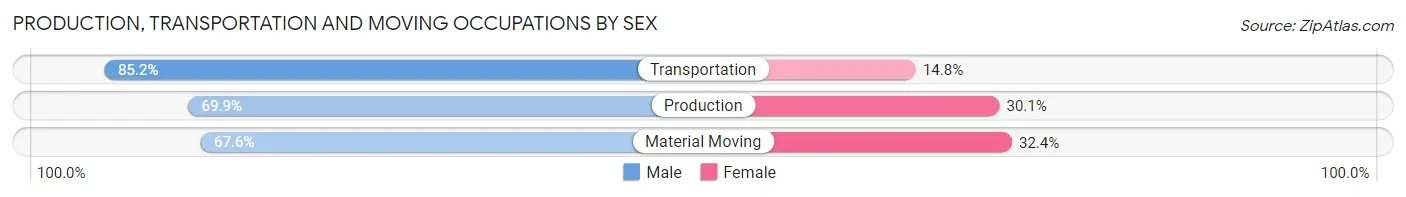
| Occupation | Male | Female |
| Production | 1,771 (69.9%) | 763 (30.1%) |
| Transportation | 1,727 (85.2%) | 299 (14.8%) |
| Material Moving | 1,955 (67.6%) | 936 (32.4%) |
| Total (Category) | 5,453 (73.2%) | 1,998 (26.8%) |
| Total (Overall) | 23,607 (53.7%) | 20,309 (46.3%) |
Employment Industries by Sex in Auburn
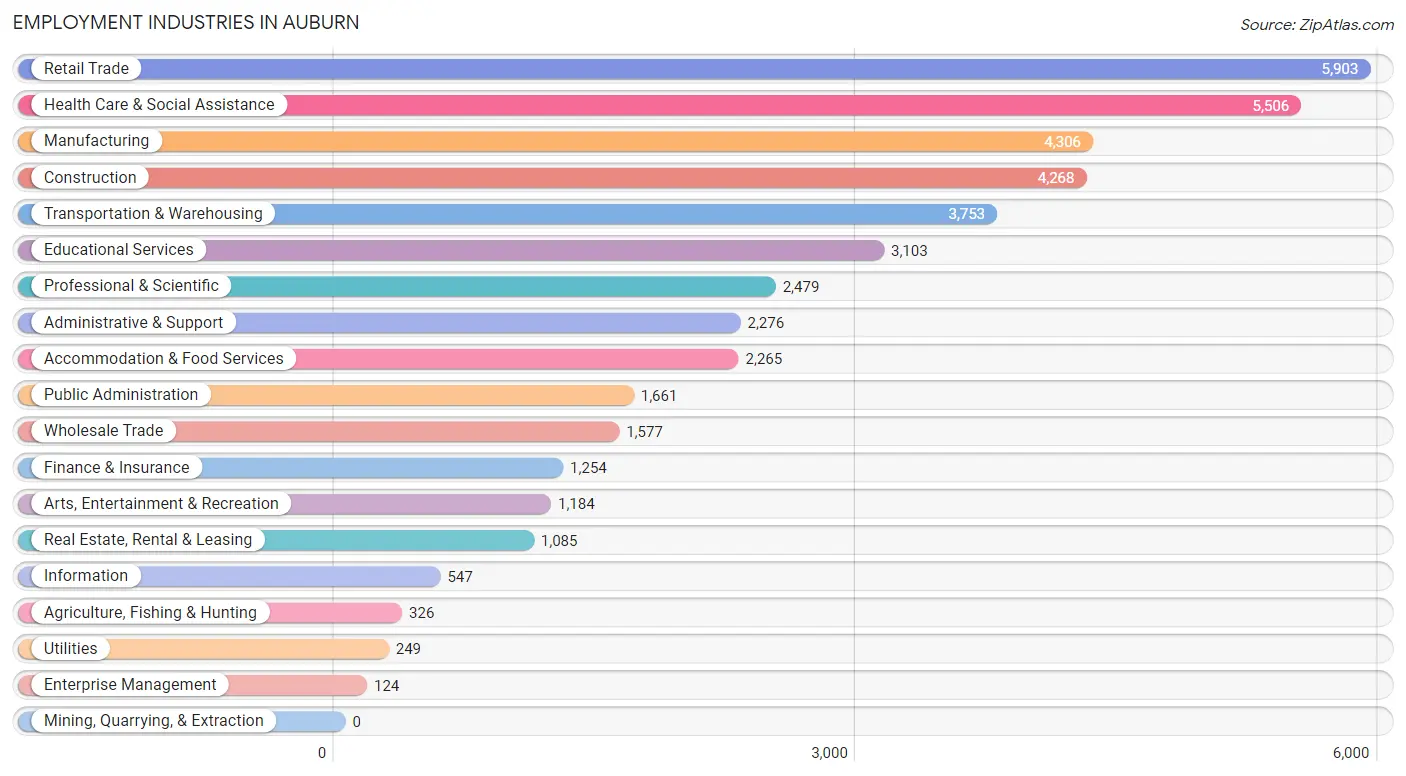
Employment Industries in Auburn
The major employment industries in Auburn include Retail Trade (5,903 | 13.4%), Health Care & Social Assistance (5,506 | 12.5%), Manufacturing (4,306 | 9.8%), Construction (4,268 | 9.7%), and Transportation & Warehousing (3,753 | 8.6%).
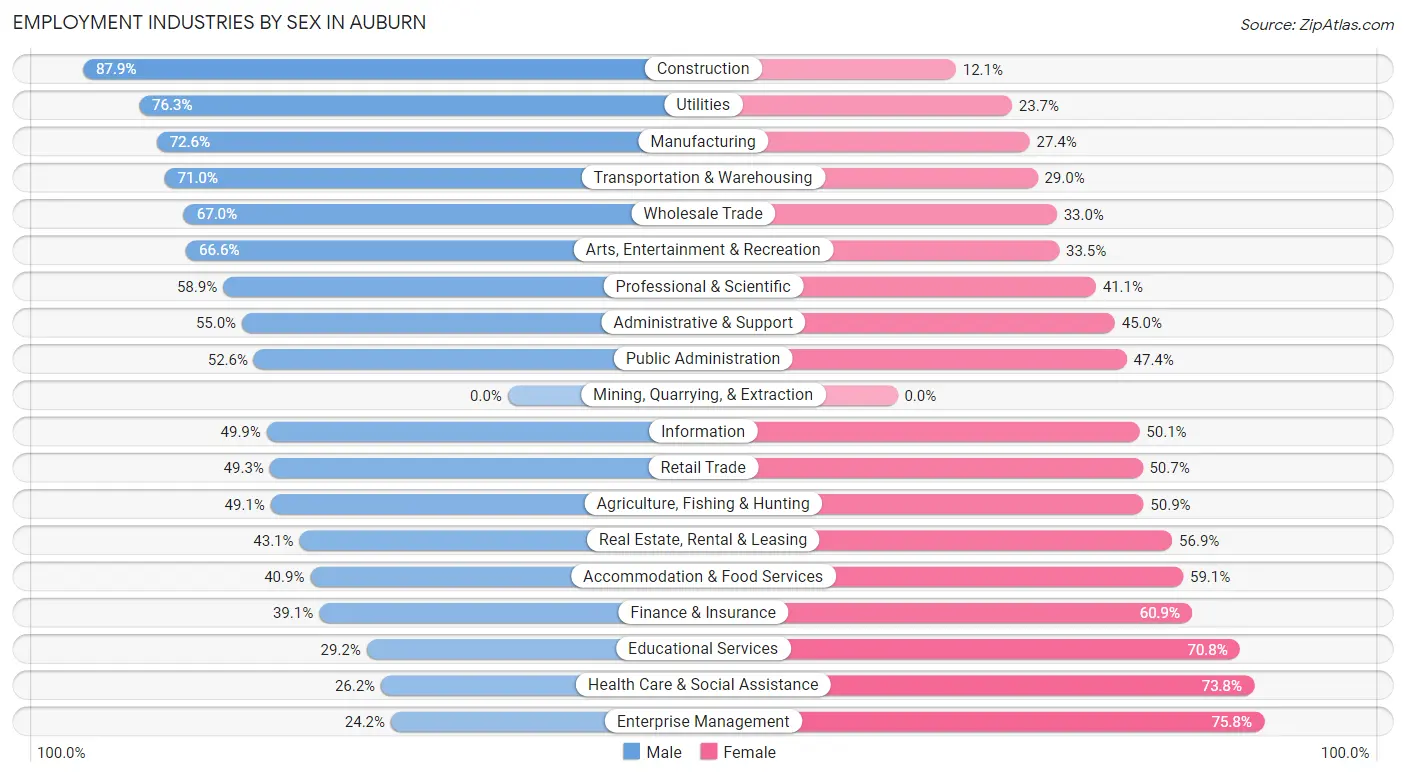
Employment Industries by Sex in Auburn
The Auburn industries that see more men than women are Construction (87.9%), Utilities (76.3%), and Manufacturing (72.6%), whereas the industries that tend to have a higher number of women are Enterprise Management (75.8%), Health Care & Social Assistance (73.8%), and Educational Services (70.8%).
| Industry | Male | Female |
| Agriculture, Fishing & Hunting | 160 (49.1%) | 166 (50.9%) |
| Mining, Quarrying, & Extraction | 0 (0.0%) | 0 (0.0%) |
| Construction | 3,752 (87.9%) | 516 (12.1%) |
| Manufacturing | 3,128 (72.6%) | 1,178 (27.4%) |
| Wholesale Trade | 1,057 (67.0%) | 520 (33.0%) |
| Retail Trade | 2,909 (49.3%) | 2,994 (50.7%) |
| Transportation & Warehousing | 2,665 (71.0%) | 1,088 (29.0%) |
| Utilities | 190 (76.3%) | 59 (23.7%) |
| Information | 273 (49.9%) | 274 (50.1%) |
| Finance & Insurance | 490 (39.1%) | 764 (60.9%) |
| Real Estate, Rental & Leasing | 468 (43.1%) | 617 (56.9%) |
| Professional & Scientific | 1,461 (58.9%) | 1,018 (41.1%) |
| Enterprise Management | 30 (24.2%) | 94 (75.8%) |
| Administrative & Support | 1,252 (55.0%) | 1,024 (45.0%) |
| Educational Services | 906 (29.2%) | 2,197 (70.8%) |
| Health Care & Social Assistance | 1,445 (26.2%) | 4,061 (73.8%) |
| Arts, Entertainment & Recreation | 788 (66.5%) | 396 (33.5%) |
| Accommodation & Food Services | 926 (40.9%) | 1,339 (59.1%) |
| Public Administration | 873 (52.6%) | 788 (47.4%) |
| Total | 23,607 (53.7%) | 20,309 (46.3%) |
Education in Auburn
School Enrollment in Auburn
The most common levels of schooling among the 20,542 students in Auburn are middle school (4,737 | 23.1%), elementary school (4,408 | 21.5%), and high school (4,337 | 21.1%).
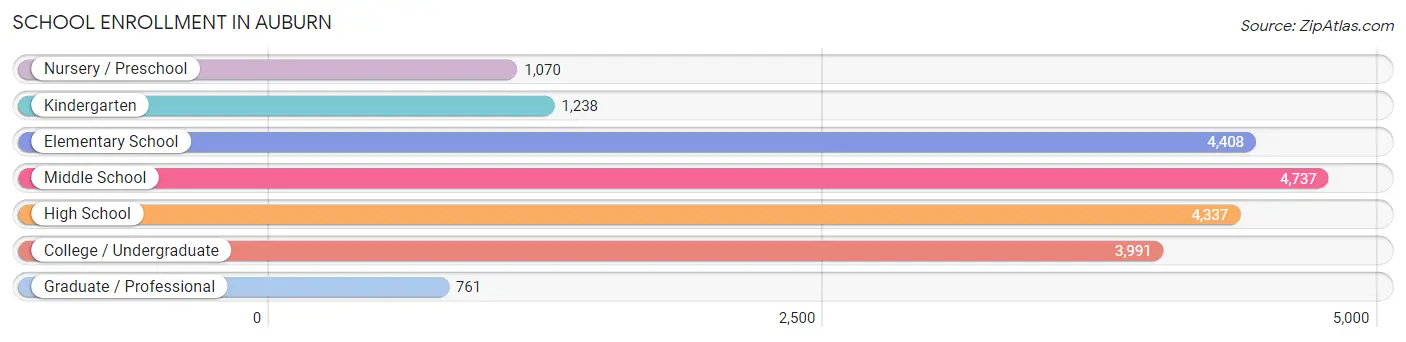
| School Level | # Students | % Students |
| Nursery / Preschool | 1,070 | 5.2% |
| Kindergarten | 1,238 | 6.0% |
| Elementary School | 4,408 | 21.5% |
| Middle School | 4,737 | 23.1% |
| High School | 4,337 | 21.1% |
| College / Undergraduate | 3,991 | 19.4% |
| Graduate / Professional | 761 | 3.7% |
| Total | 20,542 | 100.0% |
School Enrollment by Age by Funding Source in Auburn
Out of a total of 20,542 students who are enrolled in schools in Auburn, 2,136 (10.4%) attend a private institution, while the remaining 18,406 (89.6%) are enrolled in public schools. The age group of 3 to 4 year olds has the highest likelihood of being enrolled in private schools, with 296 (35.7% in the age bracket) enrolled. Conversely, the age group of 10 to 14 year olds has the lowest likelihood of being enrolled in a private school, with 5,333 (94.8% in the age bracket) attending a public institution.
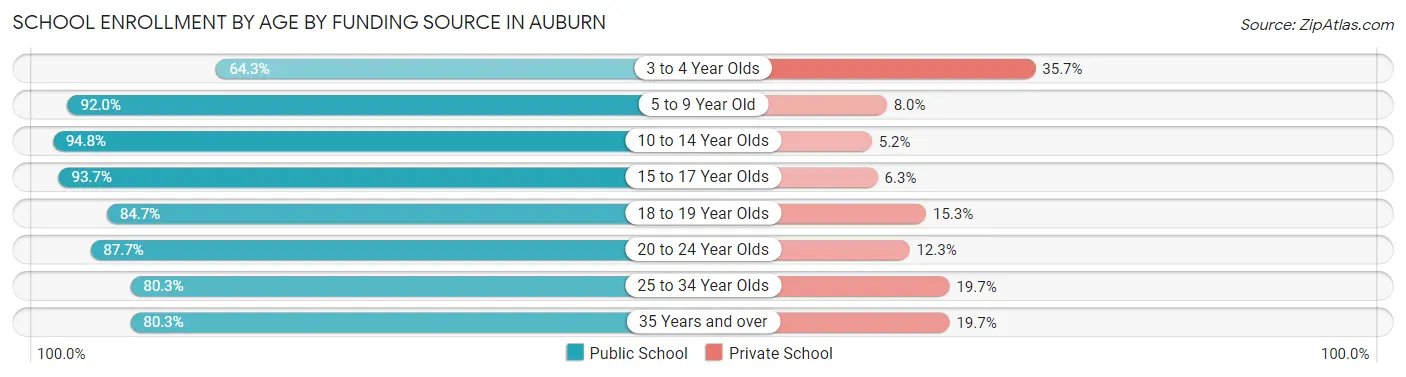
| Age Bracket | Public School | Private School |
| 3 to 4 Year Olds | 533 (64.3%) | 296 (35.7%) |
| 5 to 9 Year Old | 4,863 (92.0%) | 424 (8.0%) |
| 10 to 14 Year Olds | 5,333 (94.8%) | 295 (5.2%) |
| 15 to 17 Year Olds | 3,183 (93.7%) | 215 (6.3%) |
| 18 to 19 Year Olds | 1,076 (84.7%) | 195 (15.3%) |
| 20 to 24 Year Olds | 1,295 (87.7%) | 181 (12.3%) |
| 25 to 34 Year Olds | 1,063 (80.3%) | 261 (19.7%) |
| 35 Years and over | 1,067 (80.3%) | 262 (19.7%) |
| Total | 18,406 (89.6%) | 2,136 (10.4%) |
Educational Attainment by Field of Study in Auburn
Business (3,389 | 20.3%), science & technology (1,845 | 11.1%), education (1,602 | 9.6%), social sciences (1,480 | 8.9%), and engineering (1,427 | 8.6%) are the most common fields of study among 16,669 individuals in Auburn who have obtained a bachelor's degree or higher.
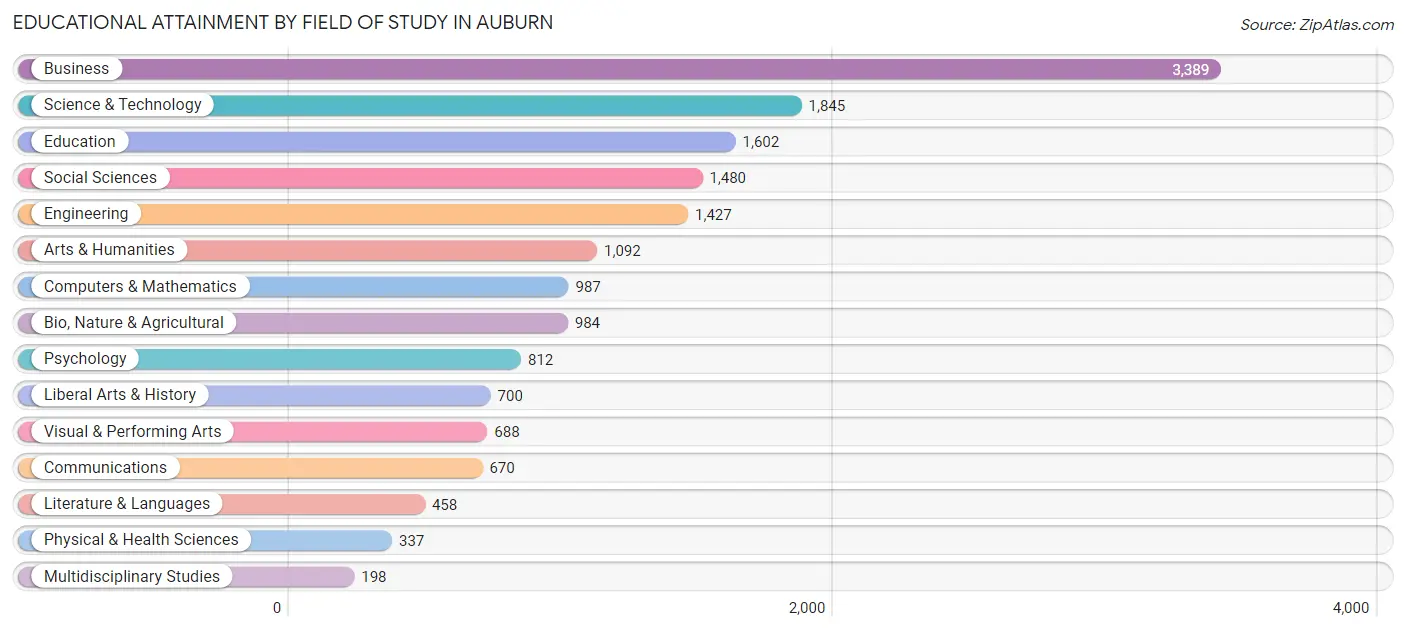
| Field of Study | # Graduates | % Graduates |
| Computers & Mathematics | 987 | 5.9% |
| Bio, Nature & Agricultural | 984 | 5.9% |
| Physical & Health Sciences | 337 | 2.0% |
| Psychology | 812 | 4.9% |
| Social Sciences | 1,480 | 8.9% |
| Engineering | 1,427 | 8.6% |
| Multidisciplinary Studies | 198 | 1.2% |
| Science & Technology | 1,845 | 11.1% |
| Business | 3,389 | 20.3% |
| Education | 1,602 | 9.6% |
| Literature & Languages | 458 | 2.8% |
| Liberal Arts & History | 700 | 4.2% |
| Visual & Performing Arts | 688 | 4.1% |
| Communications | 670 | 4.0% |
| Arts & Humanities | 1,092 | 6.6% |
| Total | 16,669 | 100.0% |
Transportation & Commute in Auburn
Vehicle Availability by Sex in Auburn
The most prevalent vehicle ownership categories in Auburn are males with 2 vehicles (9,858, accounting for 42.5%) and females with 2 vehicles (8,193, making up 49.3%).
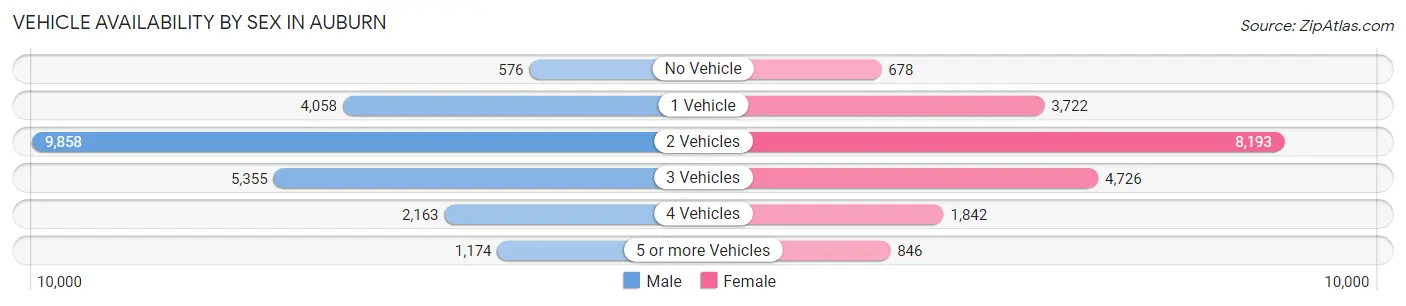
| Vehicles Available | Male | Female |
| No Vehicle | 576 (2.5%) | 678 (3.4%) |
| 1 Vehicle | 4,058 (17.5%) | 3,722 (18.6%) |
| 2 Vehicles | 9,858 (42.5%) | 8,193 (40.9%) |
| 3 Vehicles | 5,355 (23.1%) | 4,726 (23.6%) |
| 4 Vehicles | 2,163 (9.3%) | 1,842 (9.2%) |
| 5 or more Vehicles | 1,174 (5.1%) | 846 (4.2%) |
| Total | 23,184 (100.0%) | 20,007 (100.0%) |
Commute Time in Auburn
The most frequently occuring commute durations in Auburn are 30 to 34 minutes (6,008 commuters, 15.5%), 15 to 19 minutes (5,348 commuters, 13.8%), and 20 to 24 minutes (4,733 commuters, 12.2%).
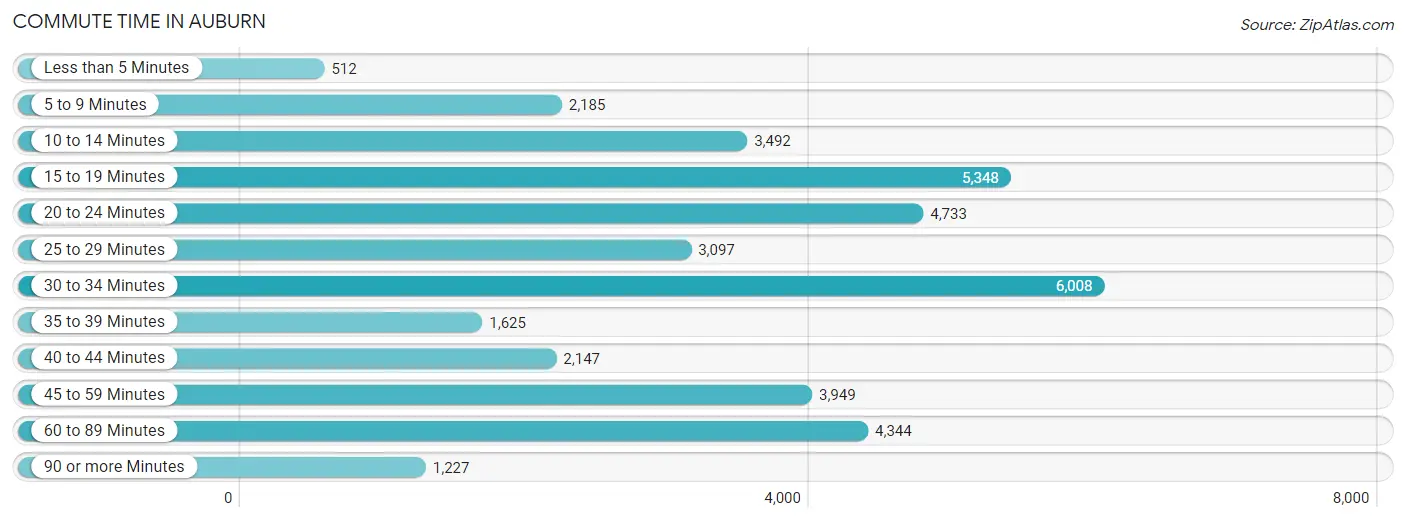
| Commute Time | # Commuters | % Commuters |
| Less than 5 Minutes | 512 | 1.3% |
| 5 to 9 Minutes | 2,185 | 5.7% |
| 10 to 14 Minutes | 3,492 | 9.0% |
| 15 to 19 Minutes | 5,348 | 13.8% |
| 20 to 24 Minutes | 4,733 | 12.2% |
| 25 to 29 Minutes | 3,097 | 8.0% |
| 30 to 34 Minutes | 6,008 | 15.5% |
| 35 to 39 Minutes | 1,625 | 4.2% |
| 40 to 44 Minutes | 2,147 | 5.6% |
| 45 to 59 Minutes | 3,949 | 10.2% |
| 60 to 89 Minutes | 4,344 | 11.2% |
| 90 or more Minutes | 1,227 | 3.2% |
Commute Time by Sex in Auburn
The most common commute times in Auburn are 30 to 34 minutes (3,631 commuters, 16.8%) for males and 15 to 19 minutes (2,713 commuters, 16.0%) for females.
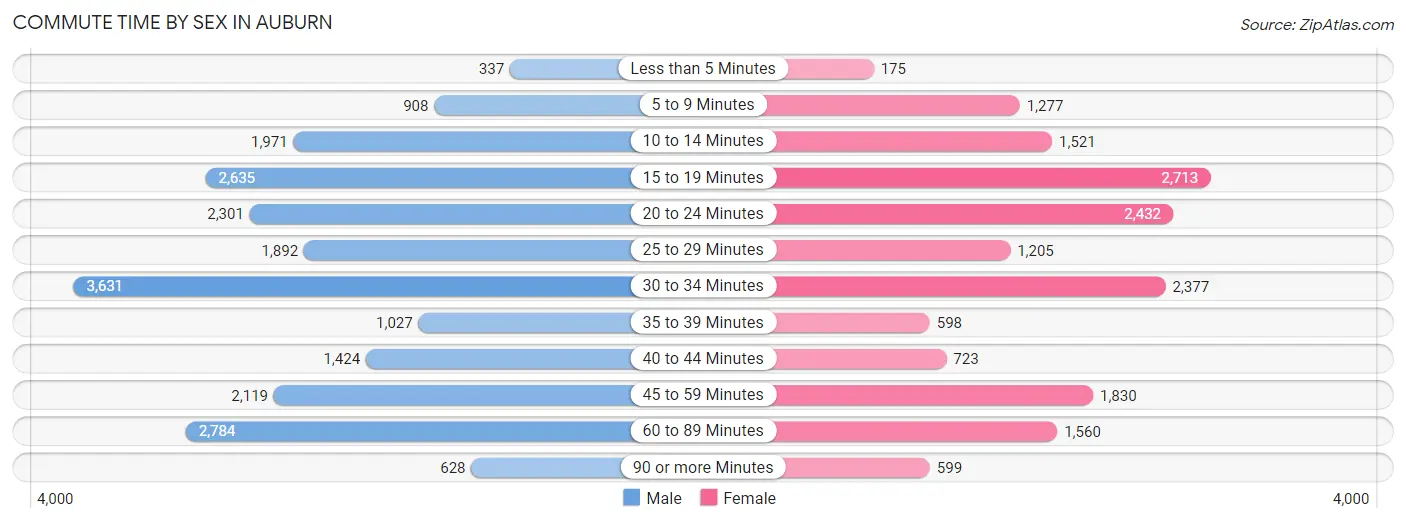
| Commute Time | Male | Female |
| Less than 5 Minutes | 337 (1.6%) | 175 (1.0%) |
| 5 to 9 Minutes | 908 (4.2%) | 1,277 (7.5%) |
| 10 to 14 Minutes | 1,971 (9.1%) | 1,521 (8.9%) |
| 15 to 19 Minutes | 2,635 (12.2%) | 2,713 (16.0%) |
| 20 to 24 Minutes | 2,301 (10.6%) | 2,432 (14.3%) |
| 25 to 29 Minutes | 1,892 (8.7%) | 1,205 (7.1%) |
| 30 to 34 Minutes | 3,631 (16.8%) | 2,377 (14.0%) |
| 35 to 39 Minutes | 1,027 (4.7%) | 598 (3.5%) |
| 40 to 44 Minutes | 1,424 (6.6%) | 723 (4.3%) |
| 45 to 59 Minutes | 2,119 (9.8%) | 1,830 (10.8%) |
| 60 to 89 Minutes | 2,784 (12.9%) | 1,560 (9.2%) |
| 90 or more Minutes | 628 (2.9%) | 599 (3.5%) |
Time of Departure to Work by Sex in Auburn
The most frequent times of departure to work in Auburn are 6:00 AM to 6:29 AM (2,946, 13.6%) for males and 7:00 AM to 7:29 AM (1,956, 11.5%) for females.
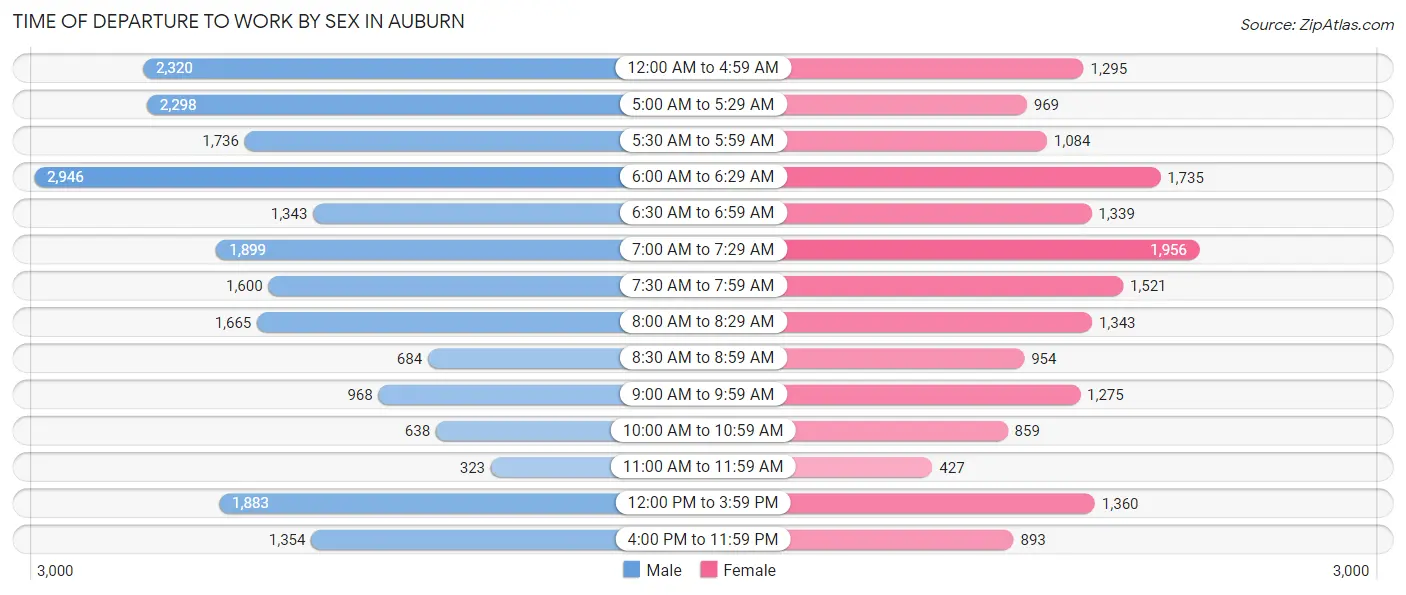
| Time of Departure | Male | Female |
| 12:00 AM to 4:59 AM | 2,320 (10.7%) | 1,295 (7.6%) |
| 5:00 AM to 5:29 AM | 2,298 (10.6%) | 969 (5.7%) |
| 5:30 AM to 5:59 AM | 1,736 (8.0%) | 1,084 (6.4%) |
| 6:00 AM to 6:29 AM | 2,946 (13.6%) | 1,735 (10.2%) |
| 6:30 AM to 6:59 AM | 1,343 (6.2%) | 1,339 (7.9%) |
| 7:00 AM to 7:29 AM | 1,899 (8.8%) | 1,956 (11.5%) |
| 7:30 AM to 7:59 AM | 1,600 (7.4%) | 1,521 (8.9%) |
| 8:00 AM to 8:29 AM | 1,665 (7.7%) | 1,343 (7.9%) |
| 8:30 AM to 8:59 AM | 684 (3.2%) | 954 (5.6%) |
| 9:00 AM to 9:59 AM | 968 (4.5%) | 1,275 (7.5%) |
| 10:00 AM to 10:59 AM | 638 (2.9%) | 859 (5.1%) |
| 11:00 AM to 11:59 AM | 323 (1.5%) | 427 (2.5%) |
| 12:00 PM to 3:59 PM | 1,883 (8.7%) | 1,360 (8.0%) |
| 4:00 PM to 11:59 PM | 1,354 (6.2%) | 893 (5.2%) |
| Total | 21,657 (100.0%) | 17,010 (100.0%) |
Housing Occupancy in Auburn
Occupancy by Ownership in Auburn
Of the total 30,987 dwellings in Auburn, owner-occupied units account for 18,760 (60.5%), while renter-occupied units make up 12,227 (39.5%).
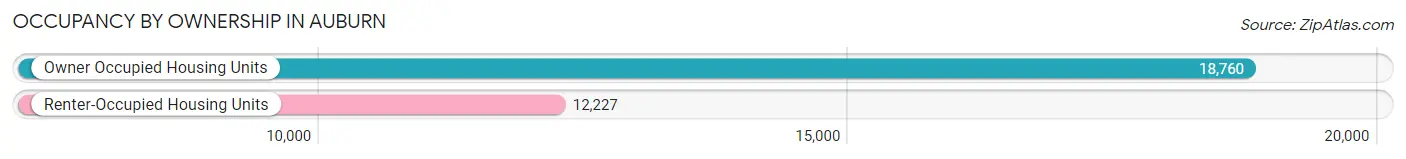
| Occupancy | # Housing Units | % Housing Units |
| Owner Occupied Housing Units | 18,760 | 60.5% |
| Renter-Occupied Housing Units | 12,227 | 39.5% |
| Total Occupied Housing Units | 30,987 | 100.0% |
Occupancy by Household Size in Auburn
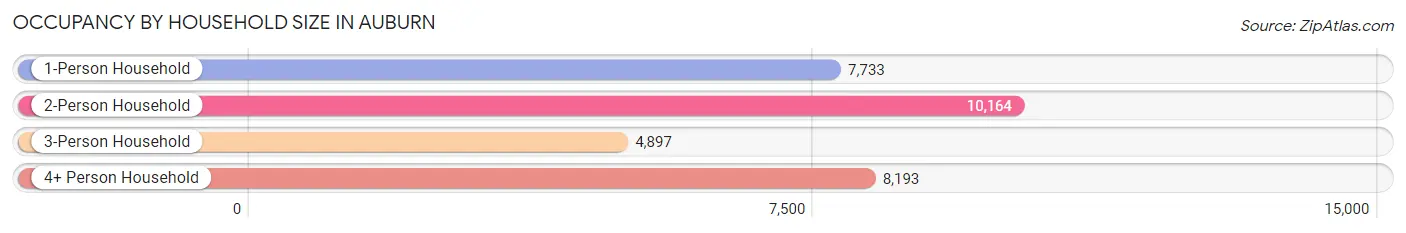
| Household Size | # Housing Units | % Housing Units |
| 1-Person Household | 7,733 | 25.0% |
| 2-Person Household | 10,164 | 32.8% |
| 3-Person Household | 4,897 | 15.8% |
| 4+ Person Household | 8,193 | 26.4% |
| Total Housing Units | 30,987 | 100.0% |
Occupancy by Ownership by Household Size in Auburn
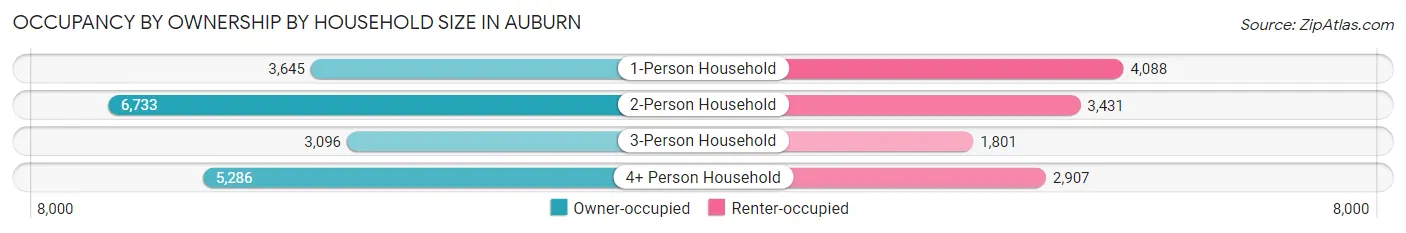
| Household Size | Owner-occupied | Renter-occupied |
| 1-Person Household | 3,645 (47.1%) | 4,088 (52.9%) |
| 2-Person Household | 6,733 (66.2%) | 3,431 (33.8%) |
| 3-Person Household | 3,096 (63.2%) | 1,801 (36.8%) |
| 4+ Person Household | 5,286 (64.5%) | 2,907 (35.5%) |
| Total Housing Units | 18,760 (60.5%) | 12,227 (39.5%) |
Occupancy by Educational Attainment in Auburn
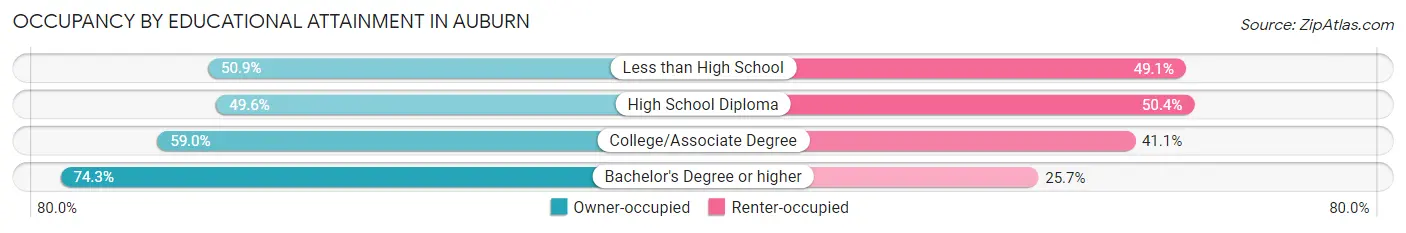
| Household Size | Owner-occupied | Renter-occupied |
| Less than High School | 1,234 (50.9%) | 1,191 (49.1%) |
| High School Diploma | 3,877 (49.6%) | 3,944 (50.4%) |
| College/Associate Degree | 6,762 (59.0%) | 4,709 (41.0%) |
| Bachelor's Degree or higher | 6,887 (74.3%) | 2,383 (25.7%) |
Occupancy by Age of Householder in Auburn
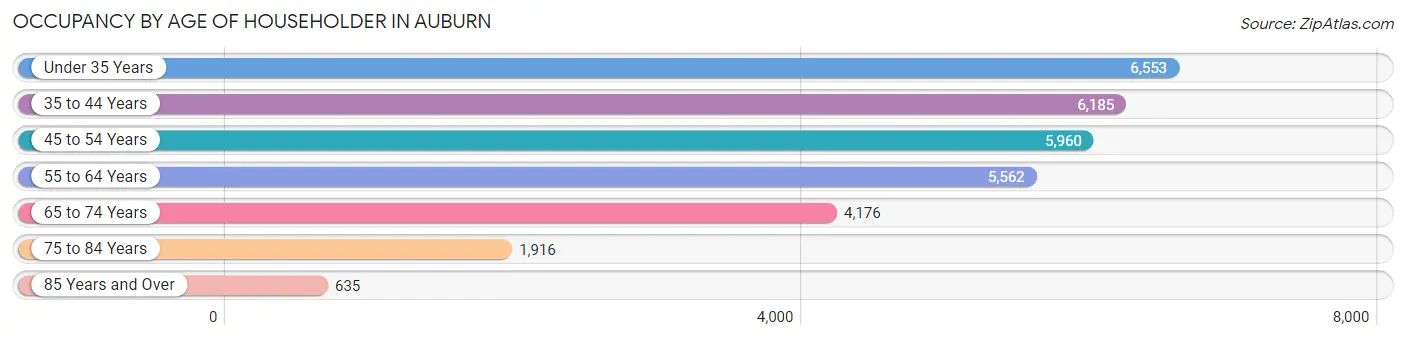
| Age Bracket | # Households | % Households |
| Under 35 Years | 6,553 | 21.1% |
| 35 to 44 Years | 6,185 | 20.0% |
| 45 to 54 Years | 5,960 | 19.2% |
| 55 to 64 Years | 5,562 | 17.9% |
| 65 to 74 Years | 4,176 | 13.5% |
| 75 to 84 Years | 1,916 | 6.2% |
| 85 Years and Over | 635 | 2.1% |
| Total | 30,987 | 100.0% |
Housing Finances in Auburn
Median Income by Occupancy in Auburn
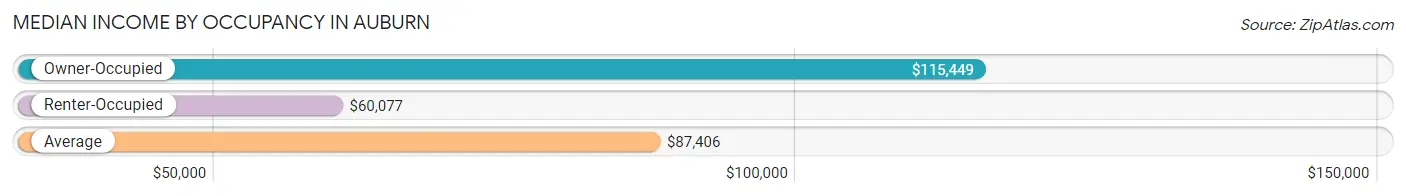
| Occupancy Type | # Households | Median Income |
| Owner-Occupied | 18,760 (60.5%) | $115,449 |
| Renter-Occupied | 12,227 (39.5%) | $60,077 |
| Average | 30,987 (100.0%) | $87,406 |
Occupancy by Householder Income Bracket in Auburn
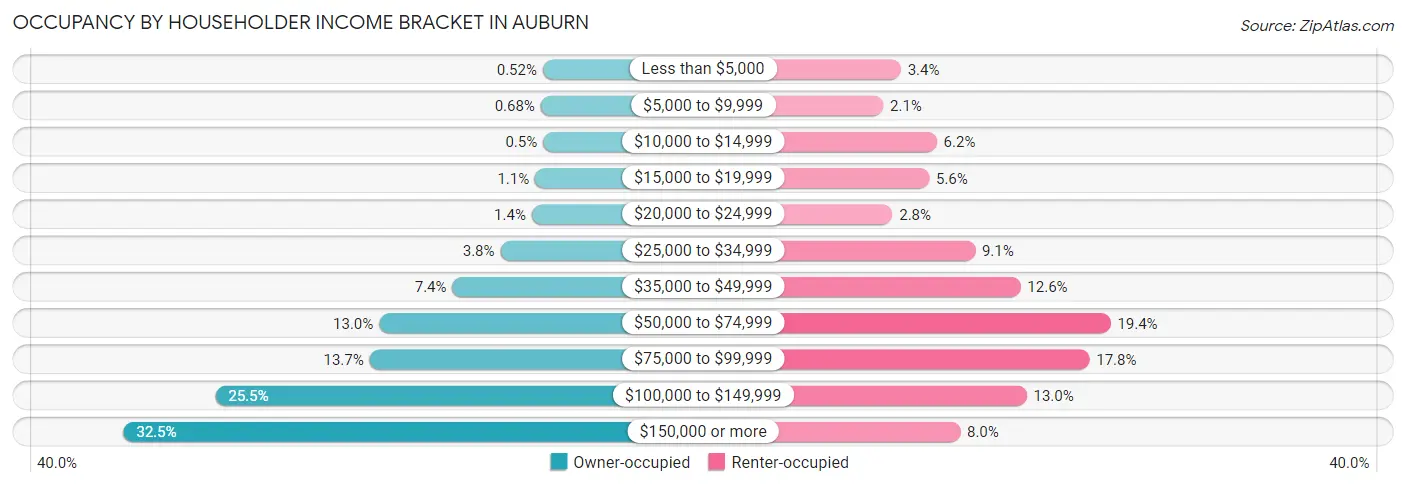
| Income Bracket | Owner-occupied | Renter-occupied |
| Less than $5,000 | 98 (0.5%) | 420 (3.4%) |
| $5,000 to $9,999 | 127 (0.7%) | 257 (2.1%) |
| $10,000 to $14,999 | 93 (0.5%) | 756 (6.2%) |
| $15,000 to $19,999 | 209 (1.1%) | 685 (5.6%) |
| $20,000 to $24,999 | 256 (1.4%) | 342 (2.8%) |
| $25,000 to $34,999 | 703 (3.7%) | 1,113 (9.1%) |
| $35,000 to $49,999 | 1,391 (7.4%) | 1,536 (12.6%) |
| $50,000 to $74,999 | 2,437 (13.0%) | 2,374 (19.4%) |
| $75,000 to $99,999 | 2,574 (13.7%) | 2,178 (17.8%) |
| $100,000 to $149,999 | 4,778 (25.5%) | 1,593 (13.0%) |
| $150,000 or more | 6,094 (32.5%) | 973 (8.0%) |
| Total | 18,760 (100.0%) | 12,227 (100.0%) |
Monthly Housing Cost Tiers in Auburn
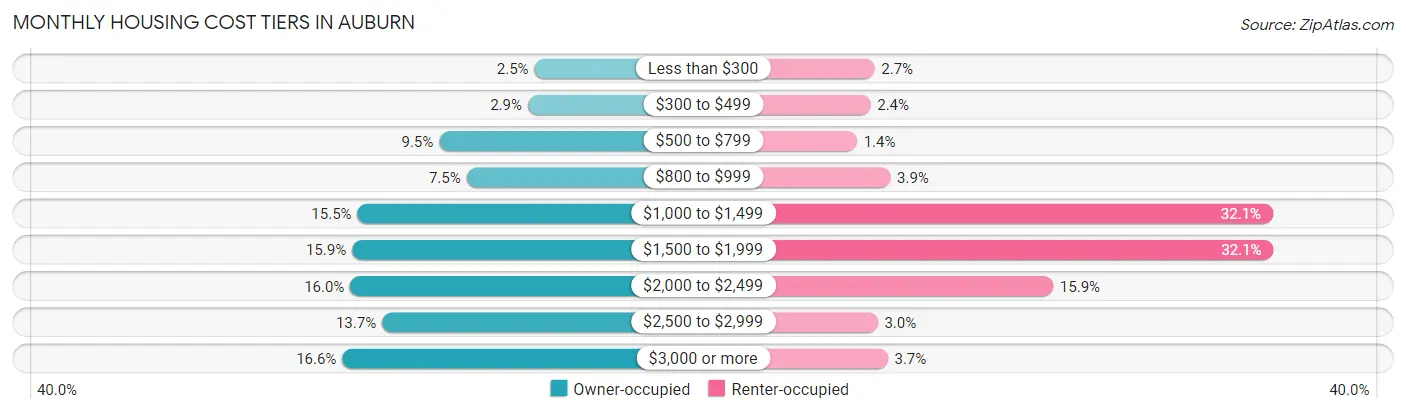
| Monthly Cost | Owner-occupied | Renter-occupied |
| Less than $300 | 460 (2.5%) | 333 (2.7%) |
| $300 to $499 | 552 (2.9%) | 296 (2.4%) |
| $500 to $799 | 1,777 (9.5%) | 174 (1.4%) |
| $800 to $999 | 1,397 (7.4%) | 475 (3.9%) |
| $1,000 to $1,499 | 2,906 (15.5%) | 3,921 (32.1%) |
| $1,500 to $1,999 | 2,981 (15.9%) | 3,926 (32.1%) |
| $2,000 to $2,499 | 3,005 (16.0%) | 1,941 (15.9%) |
| $2,500 to $2,999 | 2,566 (13.7%) | 361 (2.9%) |
| $3,000 or more | 3,116 (16.6%) | 451 (3.7%) |
| Total | 18,760 (100.0%) | 12,227 (100.0%) |
Physical Housing Characteristics in Auburn
Housing Structures in Auburn
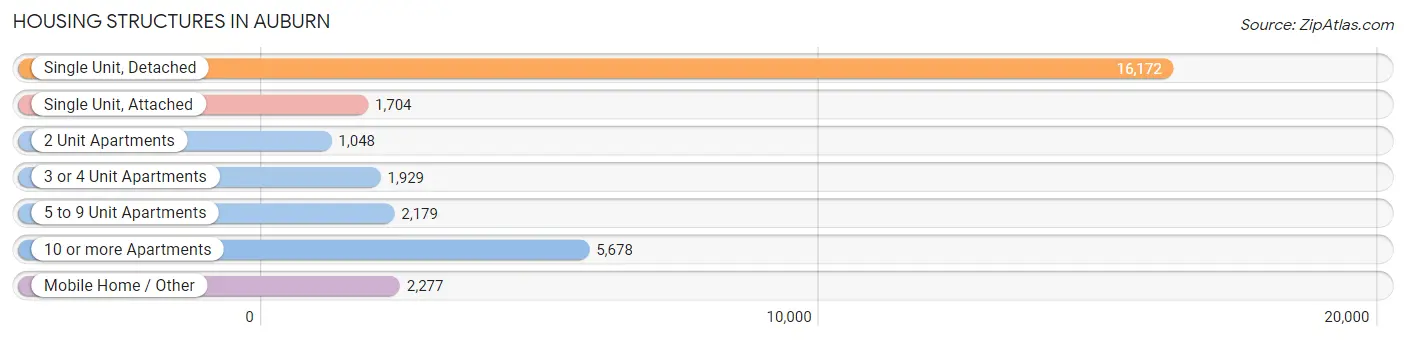
| Structure Type | # Housing Units | % Housing Units |
| Single Unit, Detached | 16,172 | 52.2% |
| Single Unit, Attached | 1,704 | 5.5% |
| 2 Unit Apartments | 1,048 | 3.4% |
| 3 or 4 Unit Apartments | 1,929 | 6.2% |
| 5 to 9 Unit Apartments | 2,179 | 7.0% |
| 10 or more Apartments | 5,678 | 18.3% |
| Mobile Home / Other | 2,277 | 7.3% |
| Total | 30,987 | 100.0% |
Housing Structures by Occupancy in Auburn
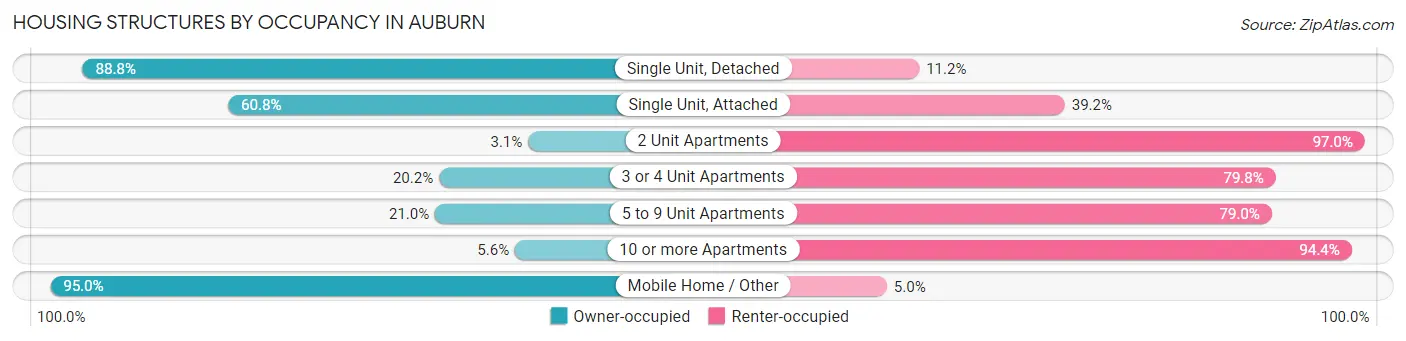
| Structure Type | Owner-occupied | Renter-occupied |
| Single Unit, Detached | 14,364 (88.8%) | 1,808 (11.2%) |
| Single Unit, Attached | 1,036 (60.8%) | 668 (39.2%) |
| 2 Unit Apartments | 32 (3.0%) | 1,016 (97.0%) |
| 3 or 4 Unit Apartments | 390 (20.2%) | 1,539 (79.8%) |
| 5 to 9 Unit Apartments | 457 (21.0%) | 1,722 (79.0%) |
| 10 or more Apartments | 317 (5.6%) | 5,361 (94.4%) |
| Mobile Home / Other | 2,164 (95.0%) | 113 (5.0%) |
| Total | 18,760 (60.5%) | 12,227 (39.5%) |
Housing Structures by Number of Rooms in Auburn
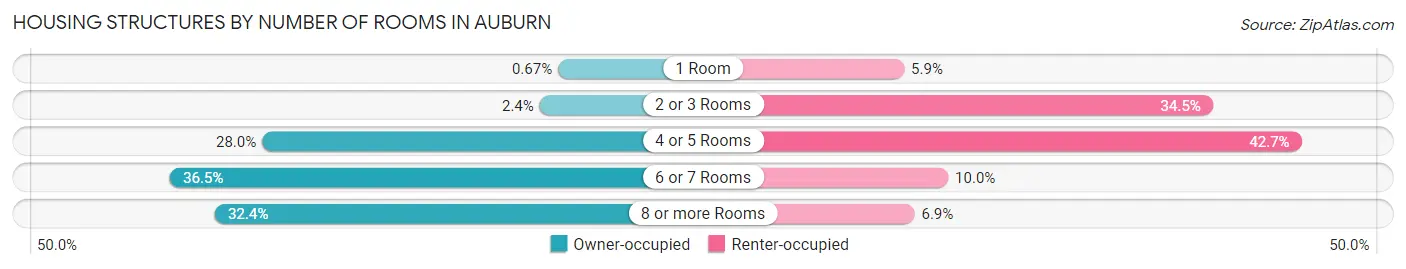
| Number of Rooms | Owner-occupied | Renter-occupied |
| 1 Room | 125 (0.7%) | 726 (5.9%) |
| 2 or 3 Rooms | 444 (2.4%) | 4,215 (34.5%) |
| 4 or 5 Rooms | 5,260 (28.0%) | 5,218 (42.7%) |
| 6 or 7 Rooms | 6,854 (36.5%) | 1,224 (10.0%) |
| 8 or more Rooms | 6,077 (32.4%) | 844 (6.9%) |
| Total | 18,760 (100.0%) | 12,227 (100.0%) |
Housing Structure by Heating Type in Auburn
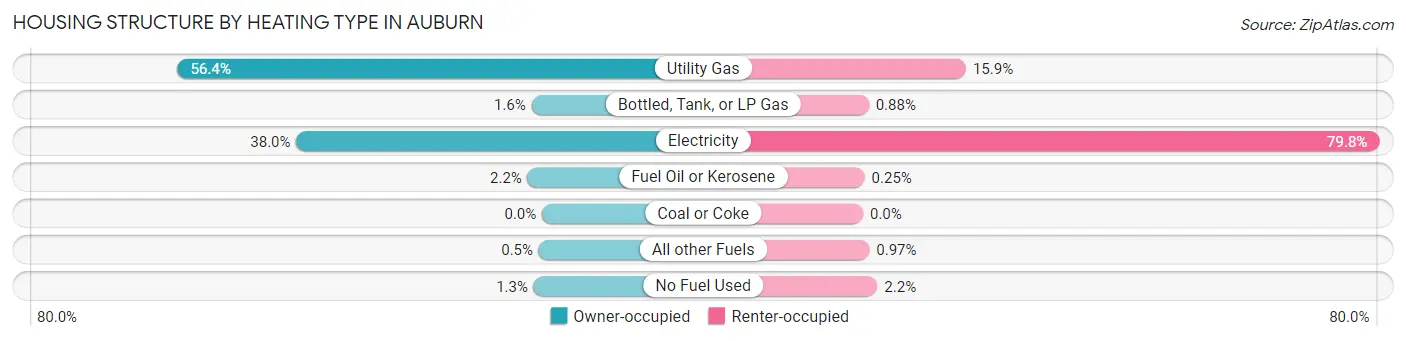
| Heating Type | Owner-occupied | Renter-occupied |
| Utility Gas | 10,574 (56.4%) | 1,945 (15.9%) |
| Bottled, Tank, or LP Gas | 306 (1.6%) | 107 (0.9%) |
| Electricity | 7,126 (38.0%) | 9,755 (79.8%) |
| Fuel Oil or Kerosene | 419 (2.2%) | 30 (0.3%) |
| Coal or Coke | 0 (0.0%) | 0 (0.0%) |
| All other Fuels | 94 (0.5%) | 118 (1.0%) |
| No Fuel Used | 241 (1.3%) | 272 (2.2%) |
| Total | 18,760 (100.0%) | 12,227 (100.0%) |
Household Vehicle Usage in Auburn
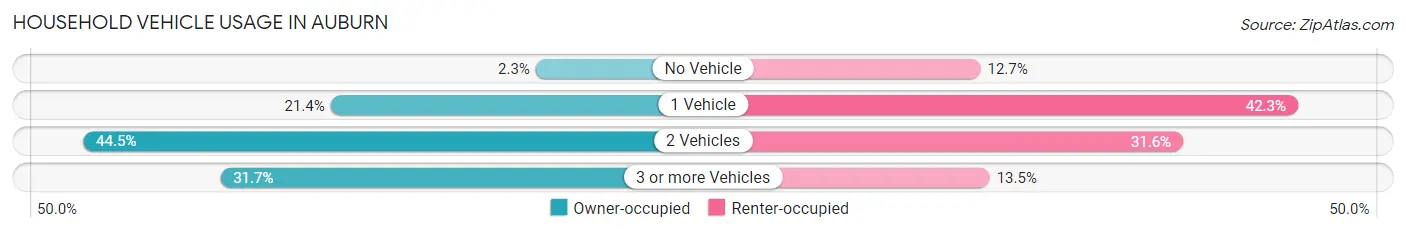
| Vehicles per Household | Owner-occupied | Renter-occupied |
| No Vehicle | 430 (2.3%) | 1,548 (12.7%) |
| 1 Vehicle | 4,022 (21.4%) | 5,168 (42.3%) |
| 2 Vehicles | 8,354 (44.5%) | 3,858 (31.6%) |
| 3 or more Vehicles | 5,954 (31.7%) | 1,653 (13.5%) |
| Total | 18,760 (100.0%) | 12,227 (100.0%) |
Real Estate & Mortgages in Auburn
Real Estate and Mortgage Overview in Auburn
| Characteristic | Without Mortgage | With Mortgage |
| Housing Units | 5,749 | 13,011 |
| Median Property Value | $380,500 | $479,300 |
| Median Household Income | $82,963 | $4,853 |
| Monthly Housing Costs | $846 | $3,101 |
| Real Estate Taxes | $4,049 | $714 |
Property Value by Mortgage Status in Auburn
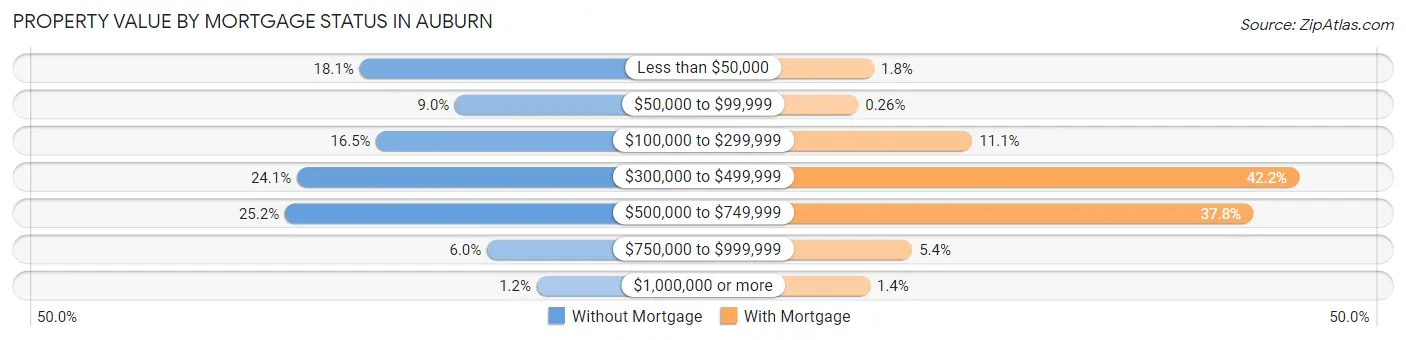
| Property Value | Without Mortgage | With Mortgage |
| Less than $50,000 | 1,040 (18.1%) | 230 (1.8%) |
| $50,000 to $99,999 | 517 (9.0%) | 34 (0.3%) |
| $100,000 to $299,999 | 948 (16.5%) | 1,448 (11.1%) |
| $300,000 to $499,999 | 1,383 (24.1%) | 5,493 (42.2%) |
| $500,000 to $749,999 | 1,449 (25.2%) | 4,924 (37.8%) |
| $750,000 to $999,999 | 342 (5.9%) | 702 (5.4%) |
| $1,000,000 or more | 70 (1.2%) | 180 (1.4%) |
| Total | 5,749 (100.0%) | 13,011 (100.0%) |
Household Income by Mortgage Status in Auburn
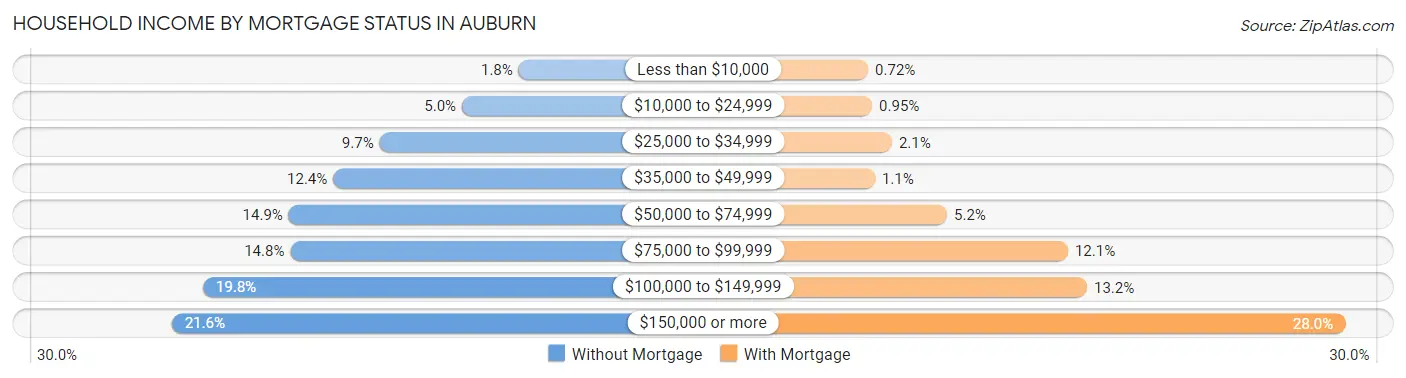
| Household Income | Without Mortgage | With Mortgage |
| Less than $10,000 | 102 (1.8%) | 94 (0.7%) |
| $10,000 to $24,999 | 288 (5.0%) | 123 (0.9%) |
| $25,000 to $34,999 | 559 (9.7%) | 270 (2.1%) |
| $35,000 to $49,999 | 711 (12.4%) | 144 (1.1%) |
| $50,000 to $74,999 | 857 (14.9%) | 680 (5.2%) |
| $75,000 to $99,999 | 852 (14.8%) | 1,580 (12.1%) |
| $100,000 to $149,999 | 1,139 (19.8%) | 1,722 (13.2%) |
| $150,000 or more | 1,241 (21.6%) | 3,639 (28.0%) |
| Total | 5,749 (100.0%) | 13,011 (100.0%) |
Property Value to Household Income Ratio in Auburn
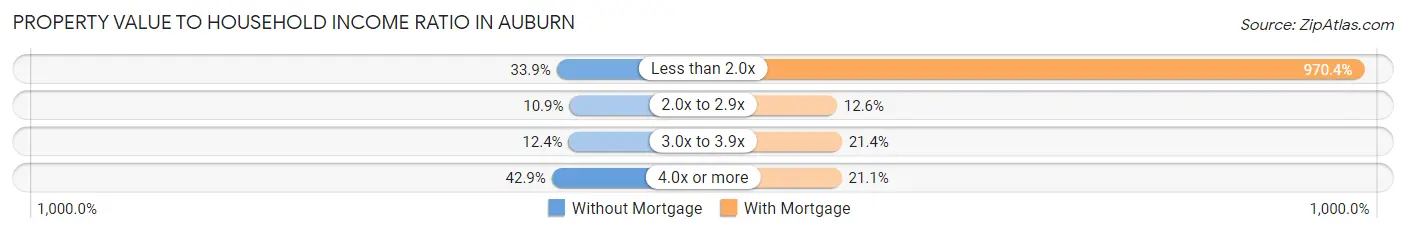
| Value-to-Income Ratio | Without Mortgage | With Mortgage |
| Less than 2.0x | 1,949 (33.9%) | 126,260 (970.4%) |
| 2.0x to 2.9x | 624 (10.8%) | 1,637 (12.6%) |
| 3.0x to 3.9x | 711 (12.4%) | 2,784 (21.4%) |
| 4.0x or more | 2,465 (42.9%) | 2,744 (21.1%) |
| Total | 5,749 (100.0%) | 13,011 (100.0%) |
Real Estate Taxes by Mortgage Status in Auburn
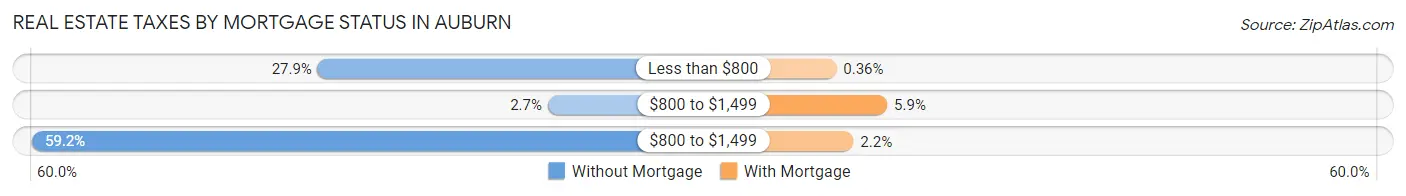
| Property Taxes | Without Mortgage | With Mortgage |
| Less than $800 | 1,603 (27.9%) | 47 (0.4%) |
| $800 to $1,499 | 153 (2.7%) | 771 (5.9%) |
| $800 to $1,499 | 3,403 (59.2%) | 290 (2.2%) |
| Total | 5,749 (100.0%) | 13,011 (100.0%) |
Health & Disability in Auburn
Health Insurance Coverage by Age in Auburn
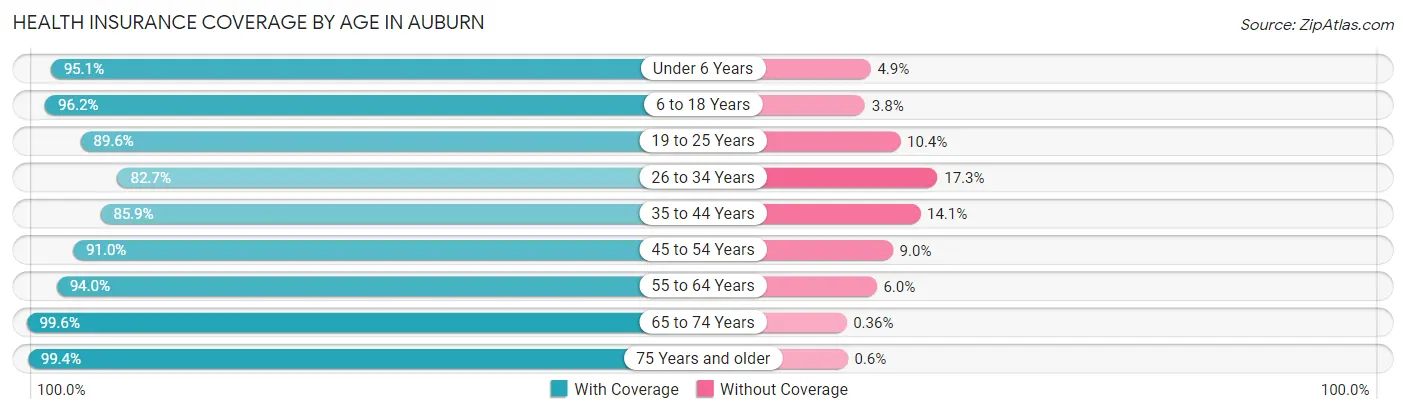
| Age Bracket | With Coverage | Without Coverage |
| Under 6 Years | 6,312 (95.1%) | 324 (4.9%) |
| 6 to 18 Years | 14,971 (96.2%) | 598 (3.8%) |
| 19 to 25 Years | 6,921 (89.6%) | 804 (10.4%) |
| 26 to 34 Years | 9,627 (82.7%) | 2,019 (17.3%) |
| 35 to 44 Years | 10,599 (85.9%) | 1,742 (14.1%) |
| 45 to 54 Years | 9,851 (91.0%) | 977 (9.0%) |
| 55 to 64 Years | 9,472 (94.0%) | 605 (6.0%) |
| 65 to 74 Years | 6,584 (99.6%) | 24 (0.4%) |
| 75 Years and older | 3,630 (99.4%) | 22 (0.6%) |
| Total | 77,967 (91.6%) | 7,115 (8.4%) |
Health Insurance Coverage by Citizenship Status in Auburn
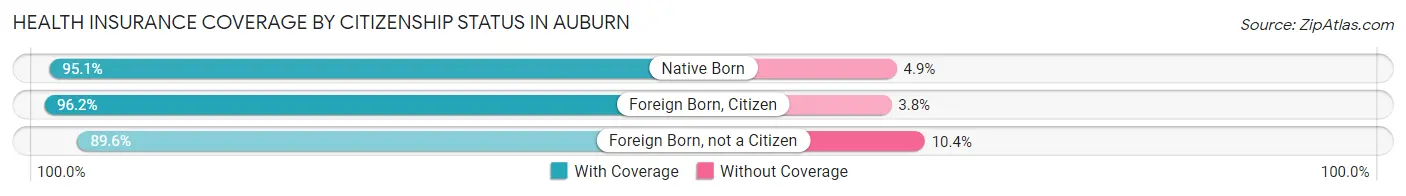
| Citizenship Status | With Coverage | Without Coverage |
| Native Born | 6,312 (95.1%) | 324 (4.9%) |
| Foreign Born, Citizen | 14,971 (96.2%) | 598 (3.8%) |
| Foreign Born, not a Citizen | 6,921 (89.6%) | 804 (10.4%) |
Health Insurance Coverage by Household Income in Auburn
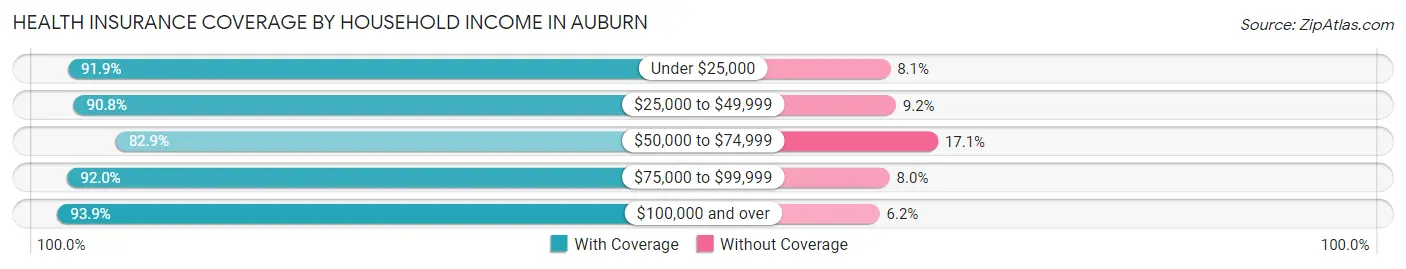
| Household Income | With Coverage | Without Coverage |
| Under $25,000 | 4,674 (91.9%) | 414 (8.1%) |
| $25,000 to $49,999 | 9,404 (90.8%) | 952 (9.2%) |
| $50,000 to $74,999 | 9,264 (82.9%) | 1,908 (17.1%) |
| $75,000 to $99,999 | 12,639 (92.0%) | 1,104 (8.0%) |
| $100,000 and over | 41,713 (93.9%) | 2,735 (6.1%) |
Public vs Private Health Insurance Coverage by Age in Auburn
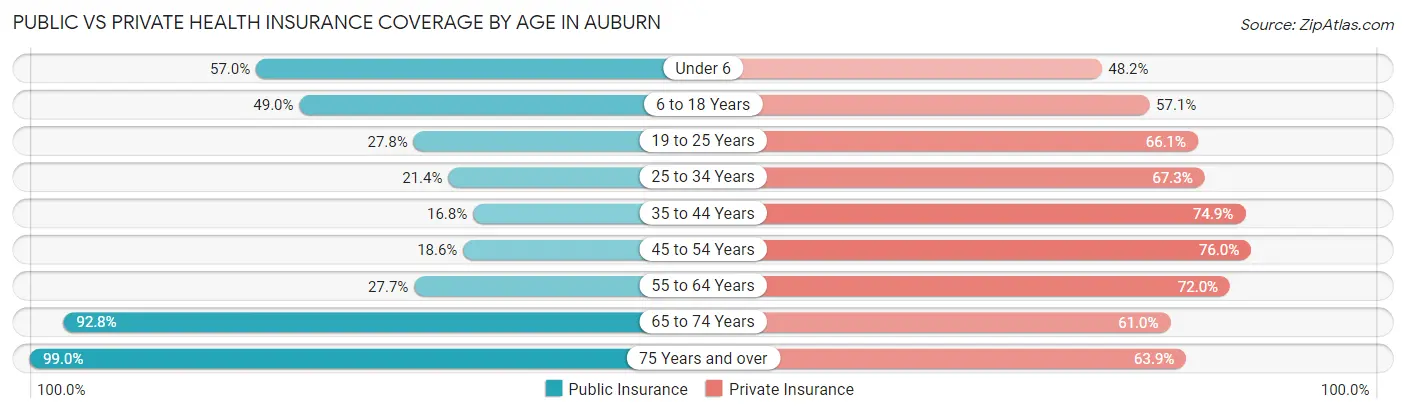
| Age Bracket | Public Insurance | Private Insurance |
| Under 6 | 3,785 (57.0%) | 3,197 (48.2%) |
| 6 to 18 Years | 7,629 (49.0%) | 8,882 (57.1%) |
| 19 to 25 Years | 2,148 (27.8%) | 5,105 (66.1%) |
| 25 to 34 Years | 2,488 (21.4%) | 7,840 (67.3%) |
| 35 to 44 Years | 2,070 (16.8%) | 9,239 (74.9%) |
| 45 to 54 Years | 2,013 (18.6%) | 8,225 (76.0%) |
| 55 to 64 Years | 2,790 (27.7%) | 7,259 (72.0%) |
| 65 to 74 Years | 6,132 (92.8%) | 4,029 (61.0%) |
| 75 Years and over | 3,615 (99.0%) | 2,334 (63.9%) |
| Total | 32,670 (38.4%) | 56,110 (65.9%) |
Disability Status by Sex by Age in Auburn
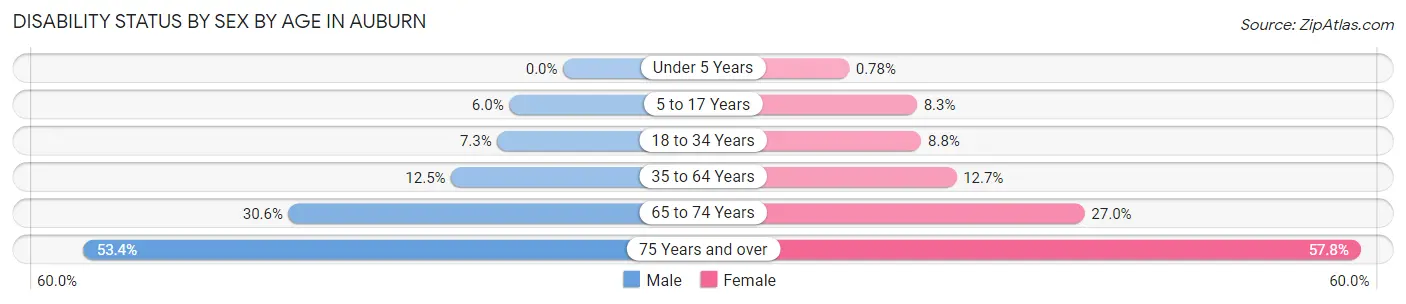
| Age Bracket | Male | Female |
| Under 5 Years | 0 (0.0%) | 23 (0.8%) |
| 5 to 17 Years | 495 (6.0%) | 623 (8.3%) |
| 18 to 34 Years | 768 (7.3%) | 864 (8.8%) |
| 35 to 64 Years | 2,090 (12.5%) | 2,099 (12.7%) |
| 65 to 74 Years | 956 (30.6%) | 941 (27.0%) |
| 75 Years and over | 857 (53.4%) | 1,183 (57.8%) |
Disability Class by Sex by Age in Auburn
Disability Class: Hearing Difficulty
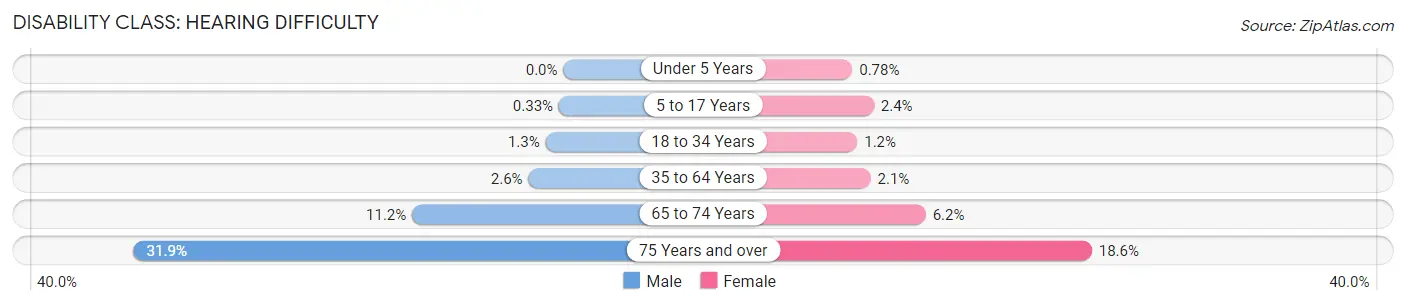
| Age Bracket | Male | Female |
| Under 5 Years | 0 (0.0%) | 23 (0.8%) |
| 5 to 17 Years | 27 (0.3%) | 178 (2.4%) |
| 18 to 34 Years | 138 (1.3%) | 113 (1.1%) |
| 35 to 64 Years | 435 (2.6%) | 353 (2.1%) |
| 65 to 74 Years | 351 (11.2%) | 217 (6.2%) |
| 75 Years and over | 512 (31.9%) | 380 (18.6%) |
Disability Class: Vision Difficulty
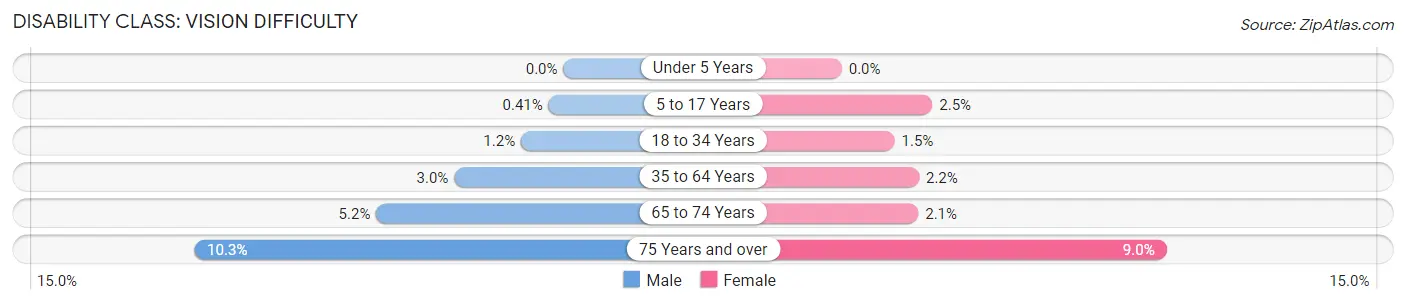
| Age Bracket | Male | Female |
| Under 5 Years | 0 (0.0%) | 0 (0.0%) |
| 5 to 17 Years | 34 (0.4%) | 188 (2.5%) |
| 18 to 34 Years | 124 (1.2%) | 144 (1.5%) |
| 35 to 64 Years | 509 (3.0%) | 354 (2.1%) |
| 65 to 74 Years | 163 (5.2%) | 74 (2.1%) |
| 75 Years and over | 165 (10.3%) | 185 (9.0%) |
Disability Class: Cognitive Difficulty
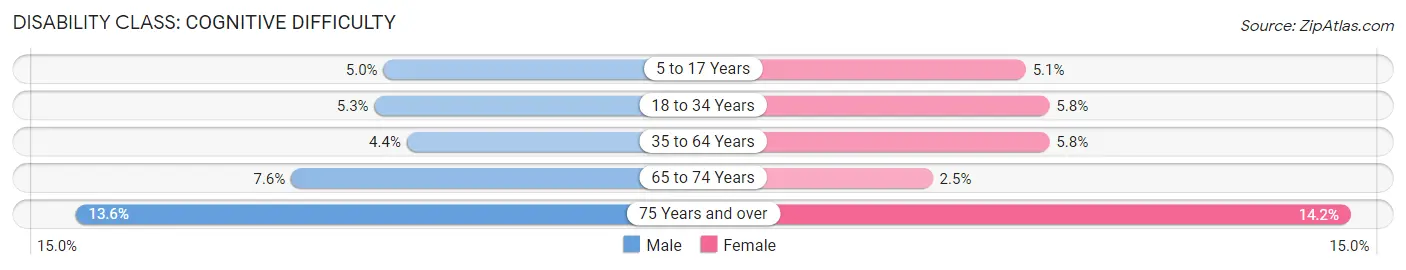
| Age Bracket | Male | Female |
| 5 to 17 Years | 413 (5.0%) | 382 (5.1%) |
| 18 to 34 Years | 551 (5.3%) | 566 (5.8%) |
| 35 to 64 Years | 731 (4.4%) | 952 (5.8%) |
| 65 to 74 Years | 237 (7.6%) | 88 (2.5%) |
| 75 Years and over | 218 (13.6%) | 290 (14.2%) |
Disability Class: Ambulatory Difficulty
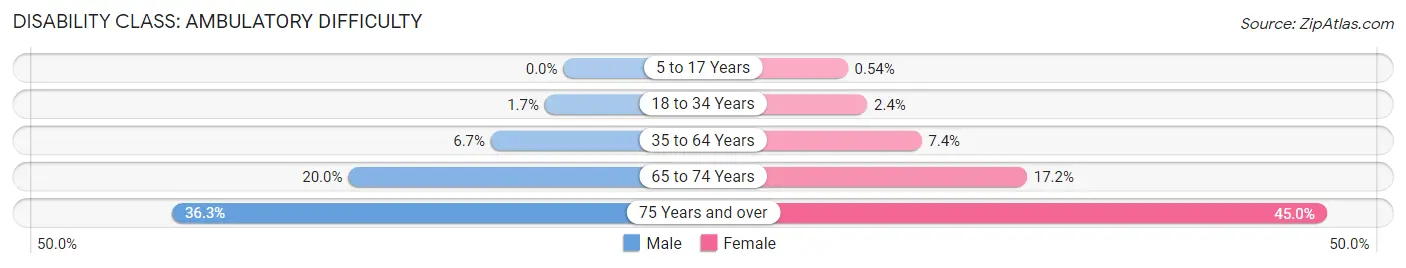
| Age Bracket | Male | Female |
| 5 to 17 Years | 0 (0.0%) | 40 (0.5%) |
| 18 to 34 Years | 180 (1.7%) | 230 (2.4%) |
| 35 to 64 Years | 1,129 (6.7%) | 1,216 (7.4%) |
| 65 to 74 Years | 624 (20.0%) | 598 (17.2%) |
| 75 Years and over | 583 (36.3%) | 921 (45.0%) |
Disability Class: Self-Care Difficulty
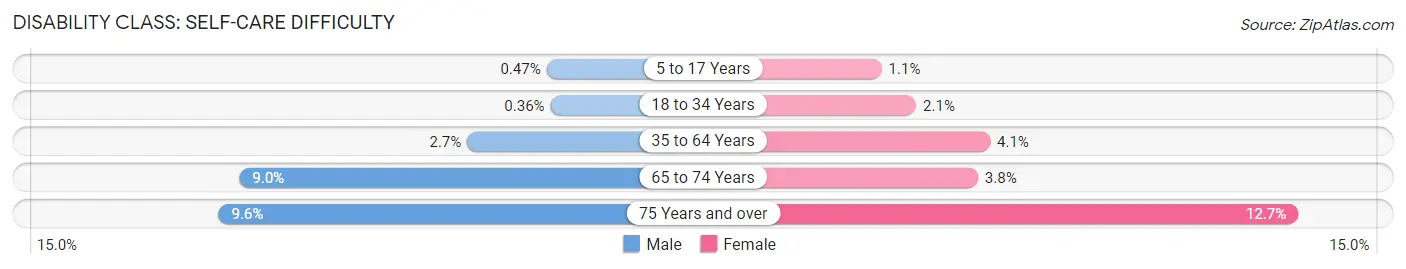
| Age Bracket | Male | Female |
| 5 to 17 Years | 39 (0.5%) | 83 (1.1%) |
| 18 to 34 Years | 38 (0.4%) | 203 (2.1%) |
| 35 to 64 Years | 450 (2.7%) | 680 (4.1%) |
| 65 to 74 Years | 282 (9.0%) | 132 (3.8%) |
| 75 Years and over | 154 (9.6%) | 260 (12.7%) |
Technology Access in Auburn
Computing Device Access in Auburn
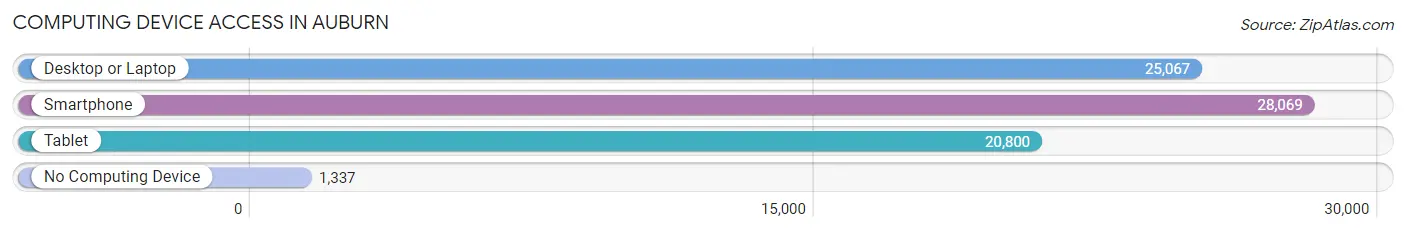
| Device Type | # Households | % Households |
| Desktop or Laptop | 25,067 | 80.9% |
| Smartphone | 28,069 | 90.6% |
| Tablet | 20,800 | 67.1% |
| No Computing Device | 1,337 | 4.3% |
| Total | 30,987 | 100.0% |
Internet Access in Auburn
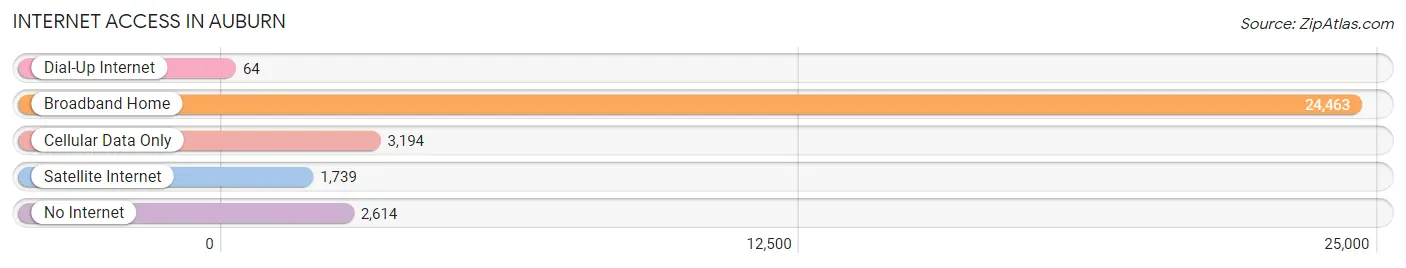
| Internet Type | # Households | % Households |
| Dial-Up Internet | 64 | 0.2% |
| Broadband Home | 24,463 | 78.9% |
| Cellular Data Only | 3,194 | 10.3% |
| Satellite Internet | 1,739 | 5.6% |
| No Internet | 2,614 | 8.4% |
| Total | 30,987 | 100.0% |
Auburn Summary
Auburn, Washington is a city located in King County, Washington, United States. The population was 70,180 at the 2010 census. Auburn is a suburb in the Seattle metropolitan area, currently ranked the fifteenth largest city in the state of Washington.
History
The area now known as Auburn was first settled in 1891 by a group of settlers from Auburn, Maine. The settlers named the area after their hometown and began to develop the area for farming. The first post office in Auburn was established in 1892.
In 1902, the Northern Pacific Railway built a line through the town, connecting it to other towns in the Puget Sound region. This allowed for the growth of the town and the development of the local economy.
In 1905, the town was officially incorporated as the City of Auburn. The city quickly grew and by 1910, the population had reached 1,500.
In the 1920s, the city experienced a period of rapid growth, with the population increasing to over 5,000 by 1930. This growth was largely due to the development of the local economy, which was driven by the timber and agricultural industries.
In the 1950s, the city experienced another period of growth, with the population increasing to over 10,000 by 1960. This growth was largely due to the development of the local economy, which was driven by the aerospace industry.
Geography
Auburn is located in King County, Washington, United States. The city is situated in the Green River Valley, between the Cascade Mountains to the east and the Olympic Mountains to the west. The city is located approximately 25 miles south of Seattle and 25 miles north of Tacoma.
The city has a total area of 24.2 square miles, of which 24.1 square miles is land and 0.1 square miles is water. The city is located at an elevation of 441 feet above sea level.
Economy
Auburn’s economy is largely driven by the aerospace industry, which is the largest employer in the city. Other major employers in the city include Boeing, Amazon, and the University of Washington.
The city also has a strong retail sector, with many shopping centers and malls located in the city. The city also has a strong tourism industry, with many attractions located in the city, such as the White River Valley Museum and the Auburn Golf Course.
Demographics
As of the 2010 census, the population of Auburn was 70,180. The racial makeup of the city was 68.2% White, 8.3% African American, 0.7% Native American, 8.2% Asian, 0.3% Pacific Islander, and 13.5% from other races. Hispanic or Latino of any race were 17.2% of the population.
The median income for a household in the city was $60,945, and the median income for a family was $71,945. The per capita income for the city was $27,945. About 8.2% of families and 11.2% of the population were below the poverty line, including 15.2% of those under age 18 and 6.2% of those age 65 or over.
Common Questions
What is Per Capita Income in Auburn?
Per Capita income in Auburn is $41,384.
What is the Median Family Income in Auburn?
Median Family Income in Auburn is $106,723.
What is the Median Household income in Auburn?
Median Household Income in Auburn is $87,406.
What is Income or Wage Gap in Auburn?
Income or Wage Gap in Auburn is 30.9%.
Women in Auburn earn 69.1 cents for every dollar earned by a man.
What is Family Income Deficit in Auburn?
Family Income Deficit in Auburn is $12,532.
Families that are below poverty line in Auburn earn $12,532 less on average than the poverty threshold level.
What is Inequality or Gini Index in Auburn?
Inequality or Gini Index in Auburn is 0.42.
What is the Total Population of Auburn?
Total Population of Auburn is 85,623.
What is the Total Male Population of Auburn?
Total Male Population of Auburn is 43,065.
What is the Total Female Population of Auburn?
Total Female Population of Auburn is 42,558.
What is the Ratio of Males per 100 Females in Auburn?
There are 101.19 Males per 100 Females in Auburn.
What is the Ratio of Females per 100 Males in Auburn?
There are 98.82 Females per 100 Males in Auburn.
What is the Median Population Age in Auburn?
Median Population Age in Auburn is 35.8 Years.
What is the Average Family Size in Auburn
Average Family Size in Auburn is 3.3 People.
What is the Average Household Size in Auburn
Average Household Size in Auburn is 2.7 People.
How Large is the Labor Force in Auburn?
There are 46,087 People in the Labor Forcein in Auburn.
What is the Percentage of People in the Labor Force in Auburn?
69.2% of People are in the Labor Force in Auburn.
What is the Unemployment Rate in Auburn?
Unemployment Rate in Auburn is 4.7%.