Rio Rancho, NM Map & Demographics
Rio Rancho Map
Rio Rancho Overview
$36,247
PER CAPITA INCOME
$86,077
AVG FAMILY INCOME
$78,978
AVG HOUSEHOLD INCOME
27.6%
WAGE / INCOME GAP [ % ]
72.4¢/ $1
WAGE / INCOME GAP [ $ ]
$9,308
FAMILY INCOME DEFICIT
0.38
INEQUALITY / GINI INDEX
104,351
TOTAL POPULATION
51,573
MALE POPULATION
52,778
FEMALE POPULATION
97.72
MALES / 100 FEMALES
102.34
FEMALES / 100 MALES
39.0
MEDIAN AGE
3.1
AVG FAMILY SIZE
2.7
AVG HOUSEHOLD SIZE
51,419
LABOR FORCE [ PEOPLE ]
62.4%
PERCENT IN LABOR FORCE
5.5%
UNEMPLOYMENT RATE
Rio Rancho Area Codes
Income in Rio Rancho
Income Overview in Rio Rancho
Per Capita Income in Rio Rancho is $36,247, while median incomes of families and households are $86,077 and $78,978 respectively.
| Characteristic | Number | Measure |
| Per Capita Income | 104,351 | $36,247 |
| Median Family Income | 28,206 | $86,077 |
| Mean Family Income | 28,206 | $105,859 |
| Median Household Income | 38,190 | $78,978 |
| Mean Household Income | 38,190 | $96,302 |
| Income Deficit | 28,206 | $9,308 |
| Wage / Income Gap (%) | 104,351 | 27.57% |
| Wage / Income Gap ($) | 104,351 | 72.43¢ per $1 |
| Gini / Inequality Index | 104,351 | 0.38 |
Earnings by Sex in Rio Rancho
Average Earnings in Rio Rancho are $42,690, $49,181 for men and $35,623 for women, a difference of 27.6%.
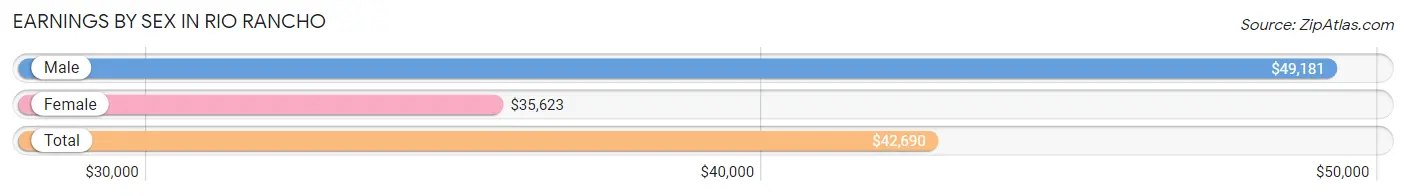
| Sex | Number | Average Earnings |
| Male | 27,937 (53.2%) | $49,181 |
| Female | 24,542 (46.8%) | $35,623 |
| Total | 52,479 (100.0%) | $42,690 |
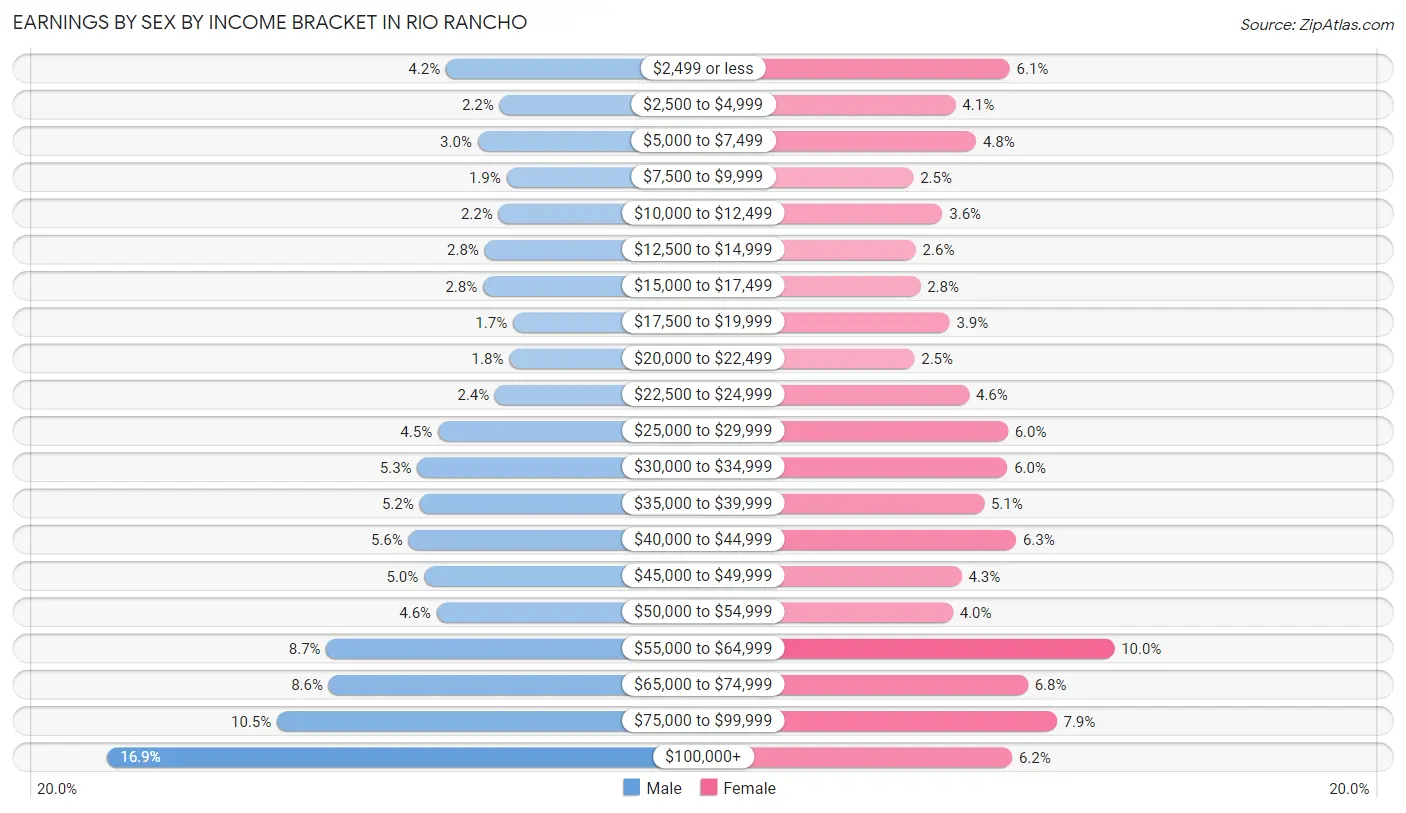
Earnings by Sex by Income Bracket in Rio Rancho
The most common earnings brackets in Rio Rancho are $100,000+ for men (4,721 | 16.9%) and $55,000 to $64,999 for women (2,460 | 10.0%).
| Income | Male | Female |
| $2,499 or less | 1,177 (4.2%) | 1,496 (6.1%) |
| $2,500 to $4,999 | 615 (2.2%) | 998 (4.1%) |
| $5,000 to $7,499 | 843 (3.0%) | 1,188 (4.8%) |
| $7,500 to $9,999 | 543 (1.9%) | 610 (2.5%) |
| $10,000 to $12,499 | 625 (2.2%) | 879 (3.6%) |
| $12,500 to $14,999 | 770 (2.8%) | 632 (2.6%) |
| $15,000 to $17,499 | 788 (2.8%) | 674 (2.8%) |
| $17,500 to $19,999 | 474 (1.7%) | 945 (3.8%) |
| $20,000 to $22,499 | 513 (1.8%) | 620 (2.5%) |
| $22,500 to $24,999 | 661 (2.4%) | 1,125 (4.6%) |
| $25,000 to $29,999 | 1,259 (4.5%) | 1,480 (6.0%) |
| $30,000 to $34,999 | 1,474 (5.3%) | 1,475 (6.0%) |
| $35,000 to $39,999 | 1,453 (5.2%) | 1,262 (5.1%) |
| $40,000 to $44,999 | 1,568 (5.6%) | 1,556 (6.3%) |
| $45,000 to $49,999 | 1,406 (5.0%) | 1,055 (4.3%) |
| $50,000 to $54,999 | 1,270 (4.5%) | 974 (4.0%) |
| $55,000 to $64,999 | 2,429 (8.7%) | 2,460 (10.0%) |
| $65,000 to $74,999 | 2,403 (8.6%) | 1,665 (6.8%) |
| $75,000 to $99,999 | 2,945 (10.5%) | 1,930 (7.9%) |
| $100,000+ | 4,721 (16.9%) | 1,518 (6.2%) |
| Total | 27,937 (100.0%) | 24,542 (100.0%) |
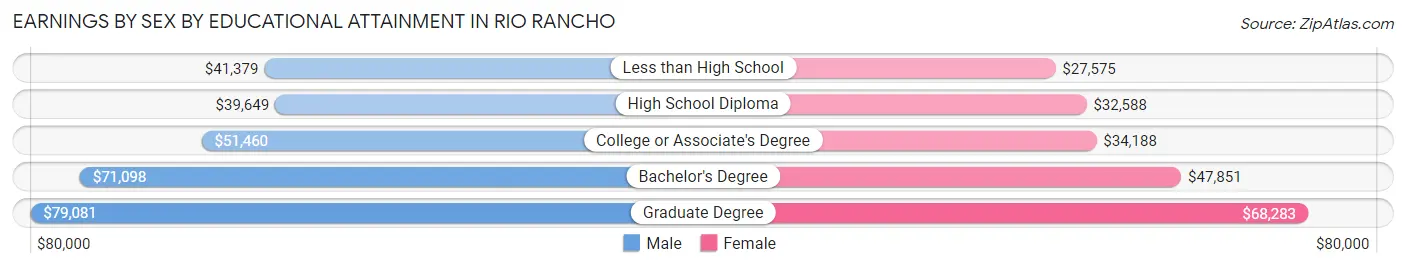
Earnings by Sex by Educational Attainment in Rio Rancho
Average earnings in Rio Rancho are $54,904 for men and $41,521 for women, a difference of 24.4%. Men with an educational attainment of graduate degree enjoy the highest average annual earnings of $79,081, while those with high school diploma education earn the least with $39,649. Women with an educational attainment of graduate degree earn the most with the average annual earnings of $68,283, while those with less than high school education have the smallest earnings of $27,575.
| Educational Attainment | Male Income | Female Income |
| Less than High School | $41,379 | $27,575 |
| High School Diploma | $39,649 | $32,588 |
| College or Associate's Degree | $51,460 | $34,188 |
| Bachelor's Degree | $71,098 | $47,851 |
| Graduate Degree | $79,081 | $68,283 |
| Total | $54,904 | $41,521 |
Family Income in Rio Rancho
Family Income Brackets in Rio Rancho
According to the Rio Rancho family income data, there are 6,516 families falling into the $100,000 to $149,999 income range, which is the most common income bracket and makes up 23.1% of all families. Conversely, the $10,000 to $14,999 income bracket is the least frequent group with only 423 families (1.5%) belonging to this category.
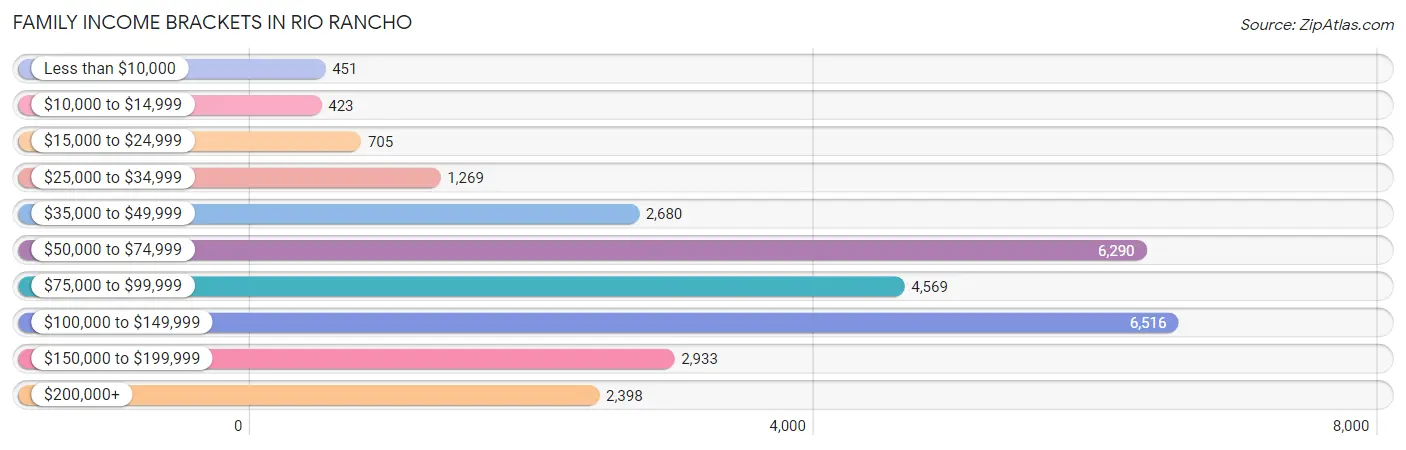
| Income Bracket | # Families | % Families |
| Less than $10,000 | 451 | 1.6% |
| $10,000 to $14,999 | 423 | 1.5% |
| $15,000 to $24,999 | 705 | 2.5% |
| $25,000 to $34,999 | 1,269 | 4.5% |
| $35,000 to $49,999 | 2,680 | 9.5% |
| $50,000 to $74,999 | 6,290 | 22.3% |
| $75,000 to $99,999 | 4,569 | 16.2% |
| $100,000 to $149,999 | 6,516 | 23.1% |
| $150,000 to $199,999 | 2,933 | 10.4% |
| $200,000+ | 2,398 | 8.5% |
Family Income by Famaliy Size in Rio Rancho
6-person families (861 | 3.0%) account for the highest median family income in Rio Rancho with $129,375 per family, while 2-person families (13,830 | 49.0%) have the highest median income of $35,536 per family member.
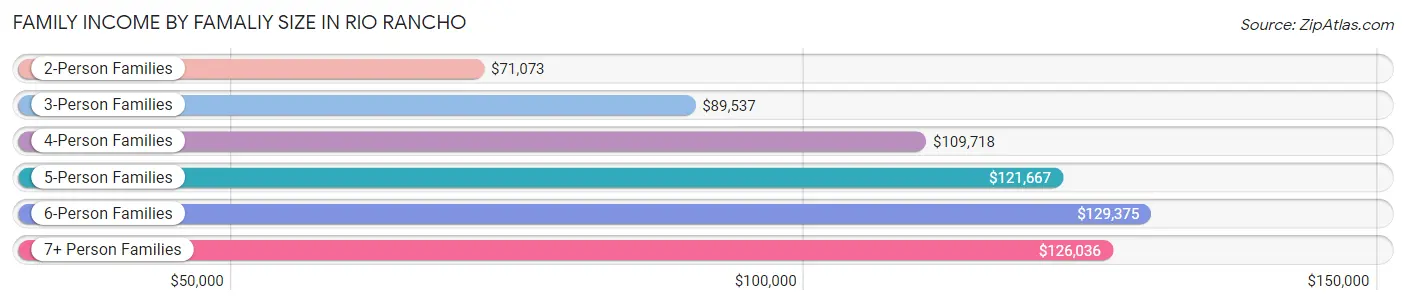
| Income Bracket | # Families | Median Income |
| 2-Person Families | 13,830 (49.0%) | $71,073 |
| 3-Person Families | 5,565 (19.7%) | $89,537 |
| 4-Person Families | 5,137 (18.2%) | $109,718 |
| 5-Person Families | 2,022 (7.2%) | $121,667 |
| 6-Person Families | 861 (3.0%) | $129,375 |
| 7+ Person Families | 791 (2.8%) | $126,036 |
| Total | 28,206 (100.0%) | $86,077 |
Family Income by Number of Earners in Rio Rancho
The median family income in Rio Rancho is $86,077, with families comprising 3+ earners (2,942) having the highest median family income of $134,673, while families with no earners (4,921) have the lowest median family income of $59,561, accounting for 10.4% and 17.4% of families, respectively.
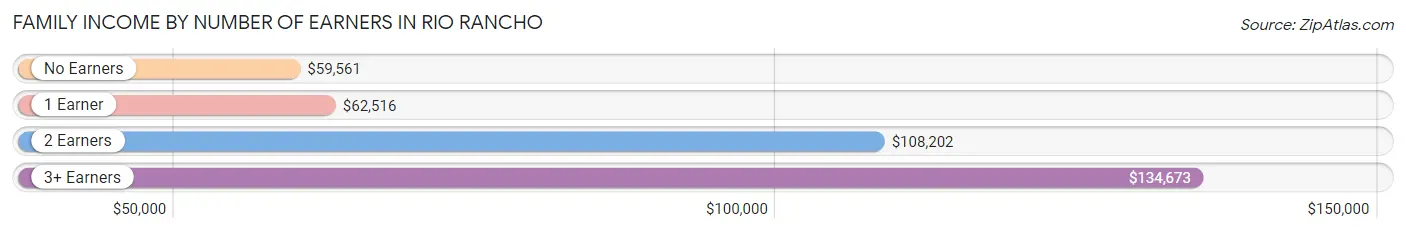
| Number of Earners | # Families | Median Income |
| No Earners | 4,921 (17.4%) | $59,561 |
| 1 Earner | 9,477 (33.6%) | $62,516 |
| 2 Earners | 10,866 (38.5%) | $108,202 |
| 3+ Earners | 2,942 (10.4%) | $134,673 |
| Total | 28,206 (100.0%) | $86,077 |
Household Income in Rio Rancho
Household Income Brackets in Rio Rancho
With 8,364 households falling in the category, the $50,000 to $74,999 income range is the most frequent in Rio Rancho, accounting for 21.9% of all households. In contrast, only 840 households (2.2%) fall into the $10,000 to $14,999 income bracket, making it the least populous group.
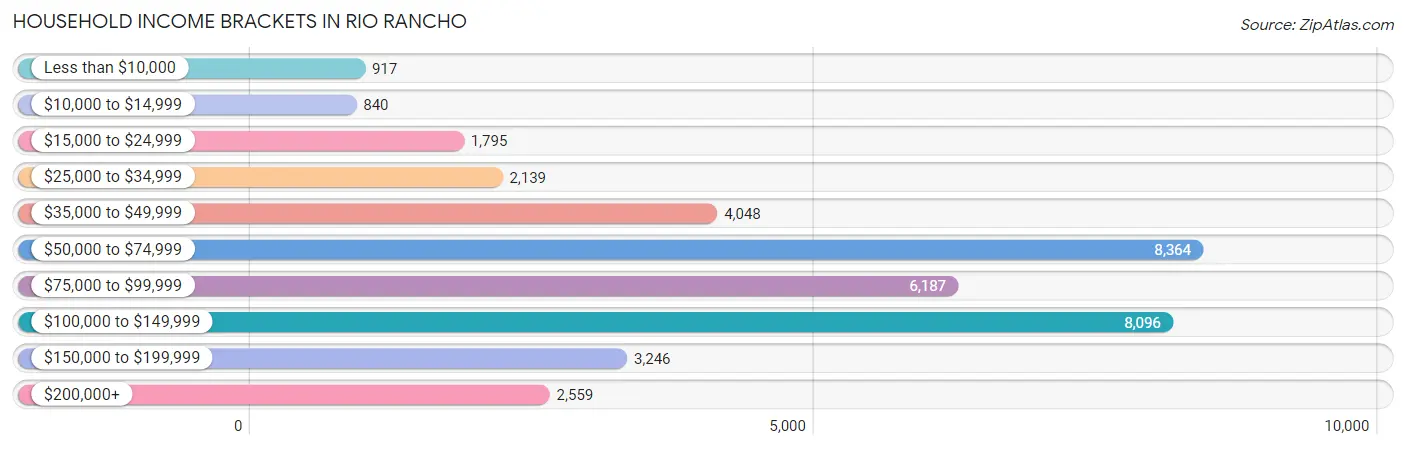
| Income Bracket | # Households | % Households |
| Less than $10,000 | 917 | 2.4% |
| $10,000 to $14,999 | 840 | 2.2% |
| $15,000 to $24,999 | 1,795 | 4.7% |
| $25,000 to $34,999 | 2,139 | 5.6% |
| $35,000 to $49,999 | 4,048 | 10.6% |
| $50,000 to $74,999 | 8,364 | 21.9% |
| $75,000 to $99,999 | 6,187 | 16.2% |
| $100,000 to $149,999 | 8,096 | 21.2% |
| $150,000 to $199,999 | 3,246 | 8.5% |
| $200,000+ | 2,559 | 6.7% |
Household Income by Householder Age in Rio Rancho
The median household income in Rio Rancho is $78,978, with the highest median household income of $94,753 found in the 45 to 64 years age bracket for the primary householder. A total of 14,293 households (37.4%) fall into this category. Meanwhile, the 15 to 24 years age bracket for the primary householder has the lowest median household income of $63,155, with 791 households (2.1%) in this group.
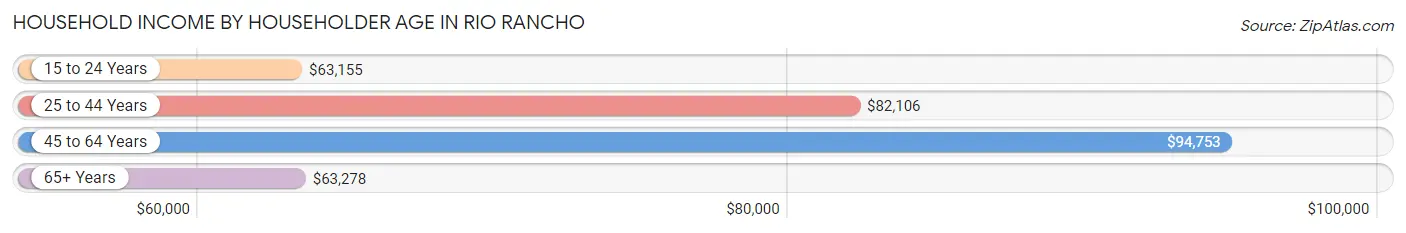
| Income Bracket | # Households | Median Income |
| 15 to 24 Years | 791 (2.1%) | $63,155 |
| 25 to 44 Years | 12,404 (32.5%) | $82,106 |
| 45 to 64 Years | 14,293 (37.4%) | $94,753 |
| 65+ Years | 10,702 (28.0%) | $63,278 |
| Total | 38,190 (100.0%) | $78,978 |
Poverty in Rio Rancho
Income Below Poverty by Sex and Age in Rio Rancho
With 5.4% poverty level for males and 8.7% for females among the residents of Rio Rancho, under 5 year old males and 18 to 24 year old females are the most vulnerable to poverty, with 260 males (10.1%) and 582 females (14.5%) in their respective age groups living below the poverty level.
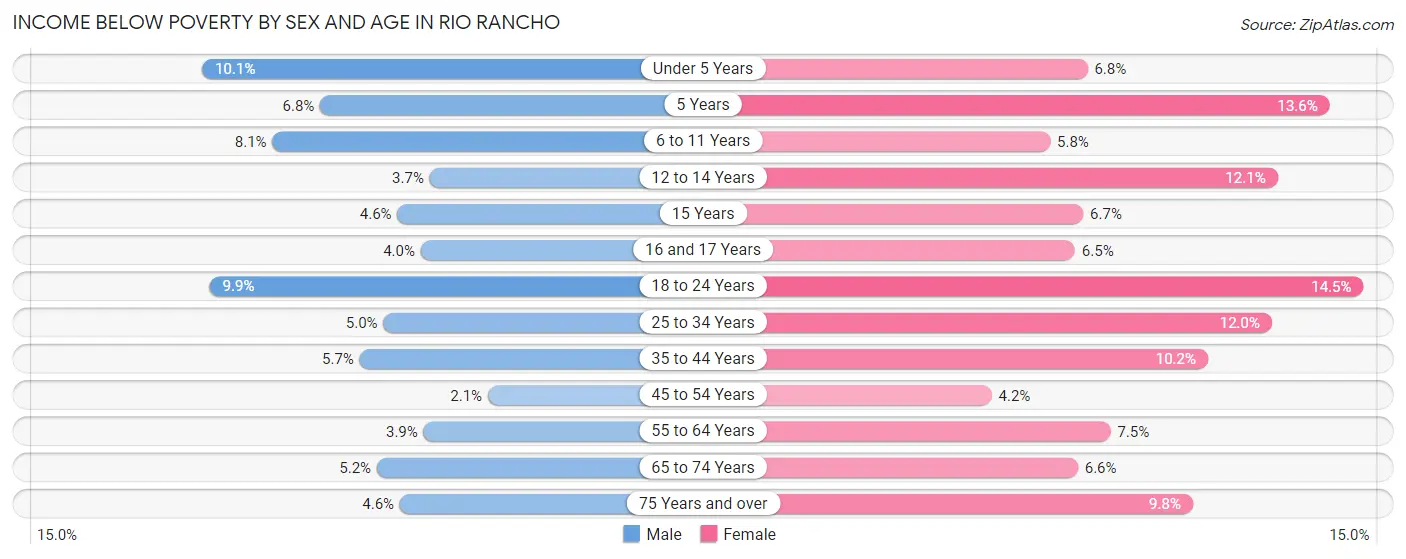
| Age Bracket | Male | Female |
| Under 5 Years | 260 (10.1%) | 173 (6.8%) |
| 5 Years | 32 (6.8%) | 85 (13.6%) |
| 6 to 11 Years | 362 (8.1%) | 215 (5.8%) |
| 12 to 14 Years | 92 (3.7%) | 350 (12.1%) |
| 15 Years | 51 (4.6%) | 39 (6.7%) |
| 16 and 17 Years | 66 (4.0%) | 103 (6.5%) |
| 18 to 24 Years | 435 (9.9%) | 582 (14.5%) |
| 25 to 34 Years | 328 (5.0%) | 783 (12.0%) |
| 35 to 44 Years | 395 (5.7%) | 728 (10.2%) |
| 45 to 54 Years | 137 (2.1%) | 260 (4.2%) |
| 55 to 64 Years | 232 (3.9%) | 537 (7.5%) |
| 65 to 74 Years | 283 (5.2%) | 381 (6.6%) |
| 75 Years and over | 120 (4.5%) | 339 (9.8%) |
| Total | 2,793 (5.4%) | 4,575 (8.7%) |
Income Above Poverty by Sex and Age in Rio Rancho
According to the poverty statistics in Rio Rancho, males aged 45 to 54 years and females aged 45 to 54 years are the age groups that are most secure financially, with 97.9% of males and 95.8% of females in these age groups living above the poverty line.
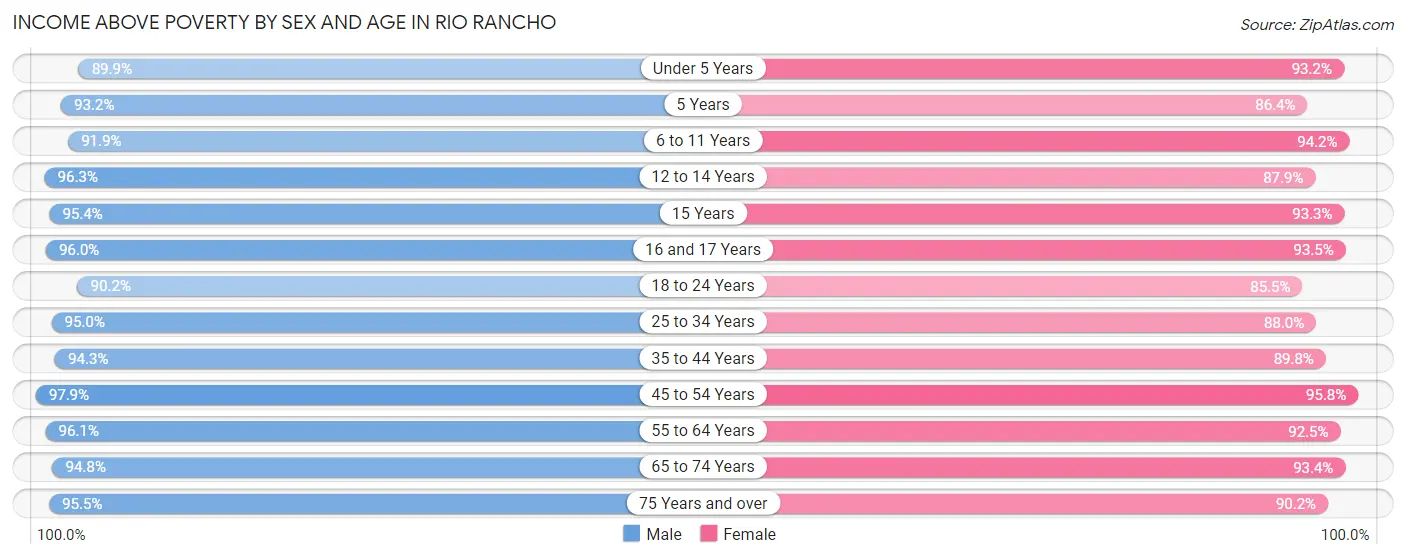
| Age Bracket | Male | Female |
| Under 5 Years | 2,324 (89.9%) | 2,356 (93.2%) |
| 5 Years | 441 (93.2%) | 541 (86.4%) |
| 6 to 11 Years | 4,108 (91.9%) | 3,491 (94.2%) |
| 12 to 14 Years | 2,381 (96.3%) | 2,535 (87.9%) |
| 15 Years | 1,052 (95.4%) | 541 (93.3%) |
| 16 and 17 Years | 1,598 (96.0%) | 1,485 (93.5%) |
| 18 to 24 Years | 3,983 (90.1%) | 3,425 (85.5%) |
| 25 to 34 Years | 6,221 (95.0%) | 5,759 (88.0%) |
| 35 to 44 Years | 6,566 (94.3%) | 6,416 (89.8%) |
| 45 to 54 Years | 6,398 (97.9%) | 5,980 (95.8%) |
| 55 to 64 Years | 5,735 (96.1%) | 6,638 (92.5%) |
| 65 to 74 Years | 5,166 (94.8%) | 5,422 (93.4%) |
| 75 Years and over | 2,520 (95.5%) | 3,132 (90.2%) |
| Total | 48,493 (94.6%) | 47,721 (91.2%) |
Income Below Poverty Among Married-Couple Families in Rio Rancho
The poverty statistics for married-couple families in Rio Rancho show that 2.3% or 479 of the total 21,187 families live below the poverty line. Families with 5 or more children have the highest poverty rate of 27.4%, comprising of 79 families. On the other hand, families with 1 or 2 children have the lowest poverty rate of 1.0%, which includes 67 families.
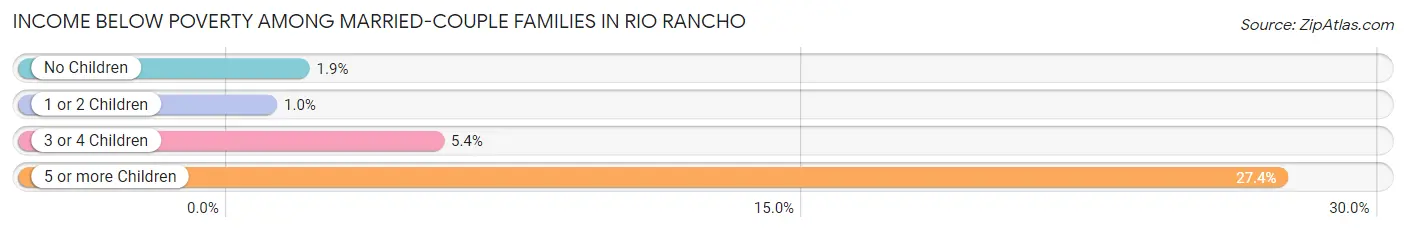
| Children | Above Poverty | Below Poverty |
| No Children | 12,282 (98.1%) | 234 (1.9%) |
| 1 or 2 Children | 6,476 (99.0%) | 67 (1.0%) |
| 3 or 4 Children | 1,741 (94.6%) | 99 (5.4%) |
| 5 or more Children | 209 (72.6%) | 79 (27.4%) |
| Total | 20,708 (97.7%) | 479 (2.3%) |
Income Below Poverty Among Single-Parent Households in Rio Rancho
According to the poverty data in Rio Rancho, 6.6% or 125 single-father households and 17.9% or 916 single-mother households are living below the poverty line. Among single-father households, those with 1 or 2 children have the highest poverty rate, with 85 households (9.5%) experiencing poverty. Likewise, among single-mother households, those with no children have the highest poverty rate, with 333 households (19.1%) falling below the poverty line.
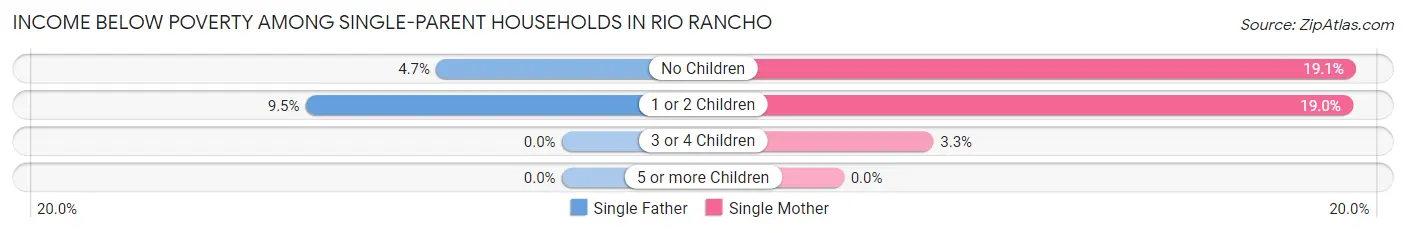
| Children | Single Father | Single Mother |
| No Children | 40 (4.7%) | 333 (19.1%) |
| 1 or 2 Children | 85 (9.5%) | 571 (19.0%) |
| 3 or 4 Children | 0 (0.0%) | 12 (3.3%) |
| 5 or more Children | 0 (0.0%) | 0 (0.0%) |
| Total | 125 (6.6%) | 916 (17.9%) |
Income Below Poverty Among Married-Couple vs Single-Parent Households in Rio Rancho
The poverty data for Rio Rancho shows that 479 of the married-couple family households (2.3%) and 1,041 of the single-parent households (14.8%) are living below the poverty level. Within the married-couple family households, those with 5 or more children have the highest poverty rate, with 79 households (27.4%) falling below the poverty line. Among the single-parent households, those with 1 or 2 children have the highest poverty rate, with 656 household (16.8%) living below poverty.
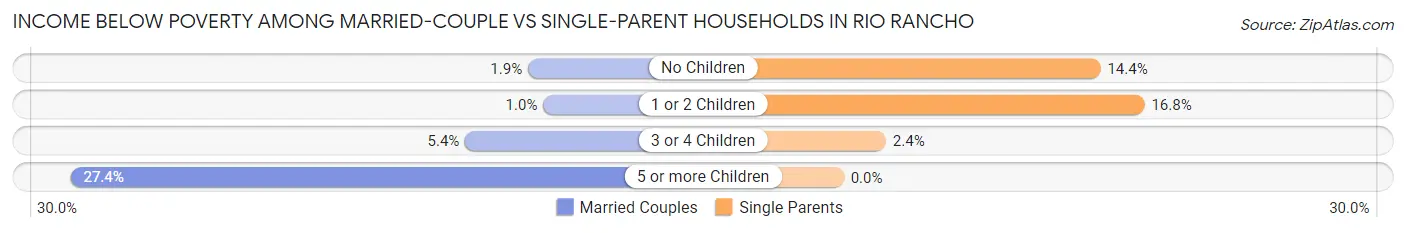
| Children | Married-Couple Families | Single-Parent Households |
| No Children | 234 (1.9%) | 373 (14.3%) |
| 1 or 2 Children | 67 (1.0%) | 656 (16.8%) |
| 3 or 4 Children | 99 (5.4%) | 12 (2.4%) |
| 5 or more Children | 79 (27.4%) | 0 (0.0%) |
| Total | 479 (2.3%) | 1,041 (14.8%) |
Race in Rio Rancho
The most populous races in Rio Rancho are White / Caucasian (69,922 | 67.0%), Hispanic or Latino (45,330 | 43.4%), and Two or more Races (17,406 | 16.7%).
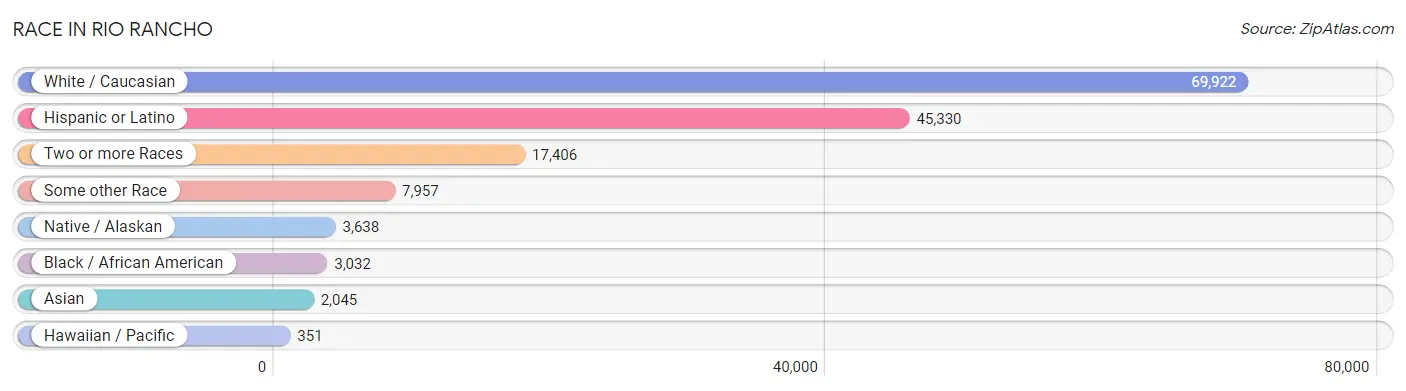
| Race | # Population | % Population |
| Asian | 2,045 | 2.0% |
| Black / African American | 3,032 | 2.9% |
| Hawaiian / Pacific | 351 | 0.3% |
| Hispanic or Latino | 45,330 | 43.4% |
| Native / Alaskan | 3,638 | 3.5% |
| White / Caucasian | 69,922 | 67.0% |
| Two or more Races | 17,406 | 16.7% |
| Some other Race | 7,957 | 7.6% |
| Total | 104,351 | 100.0% |
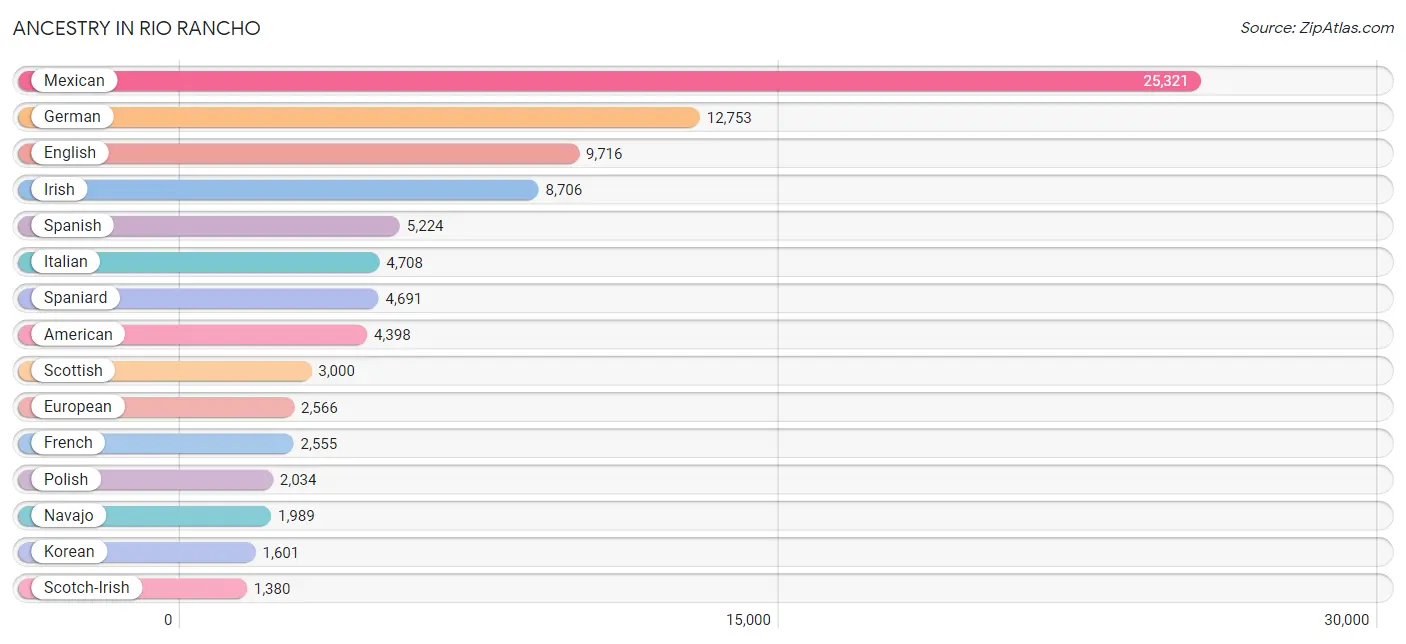
Ancestry in Rio Rancho
The most populous ancestries reported in Rio Rancho are Mexican (25,321 | 24.3%), German (12,753 | 12.2%), English (9,716 | 9.3%), Irish (8,706 | 8.3%), and Spanish (5,224 | 5.0%), together accounting for 59.2% of all Rio Rancho residents.
| Ancestry | # Population | % Population |
| Afghan | 79 | 0.1% |
| African | 193 | 0.2% |
| Alsatian | 10 | 0.0% |
| American | 4,398 | 4.2% |
| Apache | 92 | 0.1% |
| Arab | 497 | 0.5% |
| Argentinean | 9 | 0.0% |
| Armenian | 43 | 0.0% |
| Australian | 23 | 0.0% |
| Austrian | 73 | 0.1% |
| Bangladeshi | 44 | 0.0% |
| Basque | 1 | 0.0% |
| Belgian | 78 | 0.1% |
| Bhutanese | 435 | 0.4% |
| Blackfeet | 259 | 0.3% |
| British | 933 | 0.9% |
| Bulgarian | 10 | 0.0% |
| Burmese | 296 | 0.3% |
| Cajun | 5 | 0.0% |
| Cambodian | 31 | 0.0% |
| Canadian | 533 | 0.5% |
| Celtic | 207 | 0.2% |
| Central American | 664 | 0.6% |
| Central American Indian | 113 | 0.1% |
| Cherokee | 460 | 0.4% |
| Chilean | 83 | 0.1% |
| Chippewa | 251 | 0.2% |
| Choctaw | 114 | 0.1% |
| Colombian | 84 | 0.1% |
| Costa Rican | 54 | 0.1% |
| Creek | 78 | 0.1% |
| Croatian | 139 | 0.1% |
| Crow | 17 | 0.0% |
| Cuban | 349 | 0.3% |
| Czech | 136 | 0.1% |
| Czechoslovakian | 34 | 0.0% |
| Danish | 563 | 0.5% |
| Dominican | 62 | 0.1% |
| Dutch | 800 | 0.8% |
| Eastern European | 141 | 0.1% |
| Egyptian | 44 | 0.0% |
| English | 9,716 | 9.3% |
| European | 2,566 | 2.5% |
| Filipino | 13 | 0.0% |
| Finnish | 203 | 0.2% |
| French | 2,555 | 2.5% |
| French Canadian | 656 | 0.6% |
| German | 12,753 | 12.2% |
| Greek | 277 | 0.3% |
| Guamanian / Chamorro | 270 | 0.3% |
| Guatemalan | 167 | 0.2% |
| Haitian | 64 | 0.1% |
| Honduran | 79 | 0.1% |
| Hungarian | 236 | 0.2% |
| Indian (Asian) | 461 | 0.4% |
| Iranian | 27 | 0.0% |
| Iraqi | 47 | 0.1% |
| Irish | 8,706 | 8.3% |
| Iroquois | 11 | 0.0% |
| Italian | 4,708 | 4.5% |
| Jamaican | 66 | 0.1% |
| Korean | 1,601 | 1.5% |
| Laotian | 31 | 0.0% |
| Lebanese | 202 | 0.2% |
| Lithuanian | 126 | 0.1% |
| Menominee | 29 | 0.0% |
| Mexican | 25,321 | 24.3% |
| Mexican American Indian | 356 | 0.3% |
| Mongolian | 23 | 0.0% |
| Moroccan | 7 | 0.0% |
| Native Hawaiian | 249 | 0.2% |
| Navajo | 1,989 | 1.9% |
| Nicaraguan | 208 | 0.2% |
| Nigerian | 217 | 0.2% |
| Northern European | 143 | 0.1% |
| Norwegian | 945 | 0.9% |
| Osage | 7 | 0.0% |
| Pakistani | 98 | 0.1% |
| Panamanian | 40 | 0.0% |
| Pennsylvania German | 32 | 0.0% |
| Peruvian | 274 | 0.3% |
| Polish | 2,034 | 1.9% |
| Portuguese | 339 | 0.3% |
| Potawatomi | 1 | 0.0% |
| Pueblo | 1,252 | 1.2% |
| Puerto Rican | 1,272 | 1.2% |
| Romanian | 24 | 0.0% |
| Russian | 296 | 0.3% |
| Salvadoran | 116 | 0.1% |
| Samoan | 6 | 0.0% |
| Scandinavian | 513 | 0.5% |
| Scotch-Irish | 1,380 | 1.3% |
| Scottish | 3,000 | 2.9% |
| Seminole | 7 | 0.0% |
| Serbian | 12 | 0.0% |
| Sierra Leonean | 43 | 0.0% |
| Sioux | 94 | 0.1% |
| Slavic | 126 | 0.1% |
| Slovak | 66 | 0.1% |
| Slovene | 23 | 0.0% |
| South American | 495 | 0.5% |
| Spaniard | 4,691 | 4.5% |
| Spanish | 5,224 | 5.0% |
| Spanish American | 320 | 0.3% |
| Sri Lankan | 518 | 0.5% |
| Subsaharan African | 533 | 0.5% |
| Swedish | 1,053 | 1.0% |
| Swiss | 170 | 0.2% |
| Syrian | 207 | 0.2% |
| Thai | 222 | 0.2% |
| Trinidadian and Tobagonian | 34 | 0.0% |
| Turkish | 81 | 0.1% |
| Ukrainian | 295 | 0.3% |
| Venezuelan | 45 | 0.0% |
| Welsh | 733 | 0.7% |
| Yugoslavian | 42 | 0.0% | View All 116 Rows |
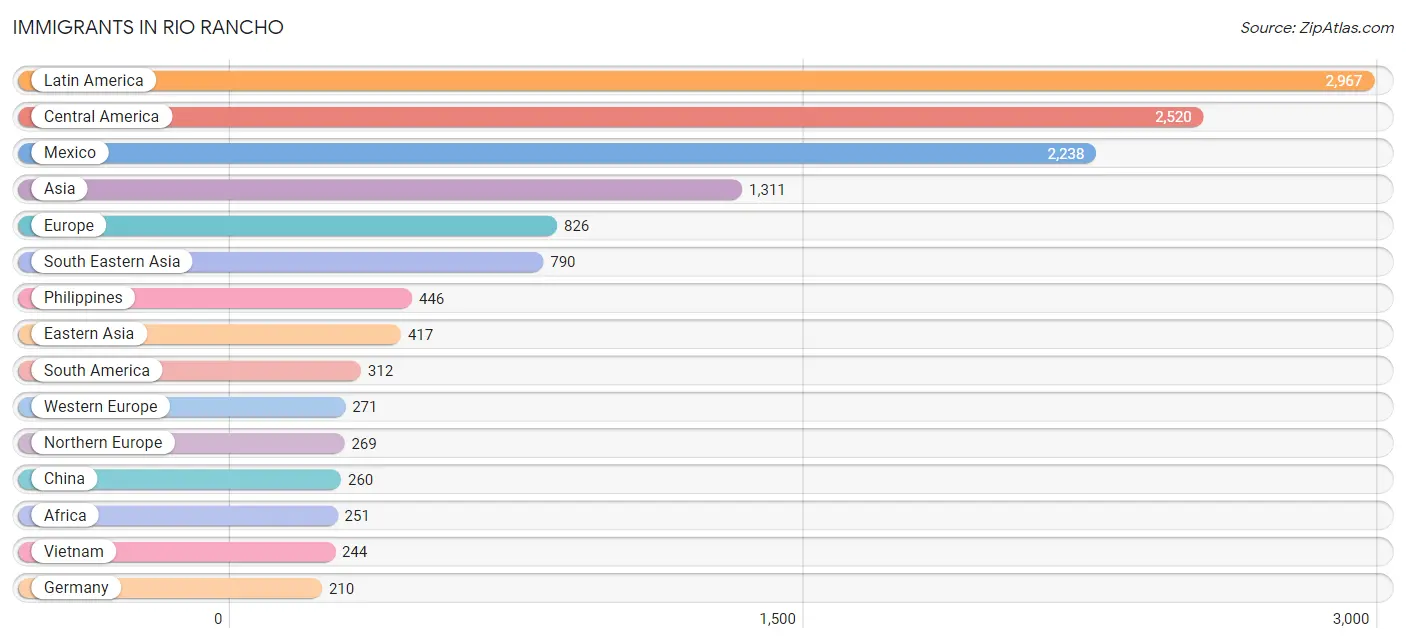
Immigrants in Rio Rancho
The most numerous immigrant groups reported in Rio Rancho came from Latin America (2,967 | 2.8%), Central America (2,520 | 2.4%), Mexico (2,238 | 2.1%), Asia (1,311 | 1.3%), and Europe (826 | 0.8%), together accounting for 9.4% of all Rio Rancho residents.
| Immigration Origin | # Population | % Population |
| Afghanistan | 4 | 0.0% |
| Africa | 251 | 0.2% |
| Argentina | 9 | 0.0% |
| Asia | 1,311 | 1.3% |
| Australia | 39 | 0.0% |
| Austria | 15 | 0.0% |
| Belgium | 17 | 0.0% |
| Bolivia | 50 | 0.1% |
| Bulgaria | 10 | 0.0% |
| Cameroon | 80 | 0.1% |
| Canada | 130 | 0.1% |
| Caribbean | 135 | 0.1% |
| Central America | 2,520 | 2.4% |
| Chile | 36 | 0.0% |
| China | 260 | 0.3% |
| Colombia | 45 | 0.0% |
| Cuba | 27 | 0.0% |
| Denmark | 21 | 0.0% |
| Dominican Republic | 62 | 0.1% |
| Eastern Africa | 38 | 0.0% |
| Eastern Asia | 417 | 0.4% |
| Eastern Europe | 71 | 0.1% |
| El Salvador | 14 | 0.0% |
| England | 112 | 0.1% |
| Europe | 826 | 0.8% |
| Germany | 210 | 0.2% |
| Greece | 144 | 0.1% |
| Guatemala | 26 | 0.0% |
| Haiti | 17 | 0.0% |
| Hungary | 8 | 0.0% |
| India | 34 | 0.0% |
| Indonesia | 13 | 0.0% |
| Ireland | 39 | 0.0% |
| Italy | 16 | 0.0% |
| Jamaica | 12 | 0.0% |
| Japan | 117 | 0.1% |
| Kenya | 38 | 0.0% |
| Korea | 40 | 0.0% |
| Laos | 10 | 0.0% |
| Latin America | 2,967 | 2.8% |
| Malaysia | 9 | 0.0% |
| Mexico | 2,238 | 2.1% |
| Middle Africa | 80 | 0.1% |
| Morocco | 14 | 0.0% |
| Netherlands | 25 | 0.0% |
| Nicaragua | 208 | 0.2% |
| Nigeria | 79 | 0.1% |
| Northern Africa | 14 | 0.0% |
| Northern Europe | 269 | 0.3% |
| Oceania | 39 | 0.0% |
| Panama | 34 | 0.0% |
| Peru | 143 | 0.1% |
| Philippines | 446 | 0.4% |
| Poland | 13 | 0.0% |
| Romania | 8 | 0.0% |
| Sierra Leone | 21 | 0.0% |
| South Africa | 19 | 0.0% |
| South America | 312 | 0.3% |
| South Central Asia | 52 | 0.1% |
| South Eastern Asia | 790 | 0.8% |
| Southern Europe | 205 | 0.2% |
| Spain | 45 | 0.0% |
| Sri Lanka | 14 | 0.0% |
| Sweden | 39 | 0.0% |
| Switzerland | 4 | 0.0% |
| Taiwan | 11 | 0.0% |
| Thailand | 68 | 0.1% |
| Trinidad and Tobago | 17 | 0.0% |
| Turkey | 52 | 0.1% |
| Ukraine | 13 | 0.0% |
| Venezuela | 29 | 0.0% |
| Vietnam | 244 | 0.2% |
| Western Africa | 100 | 0.1% |
| Western Asia | 52 | 0.1% |
| Western Europe | 271 | 0.3% | View All 75 Rows |
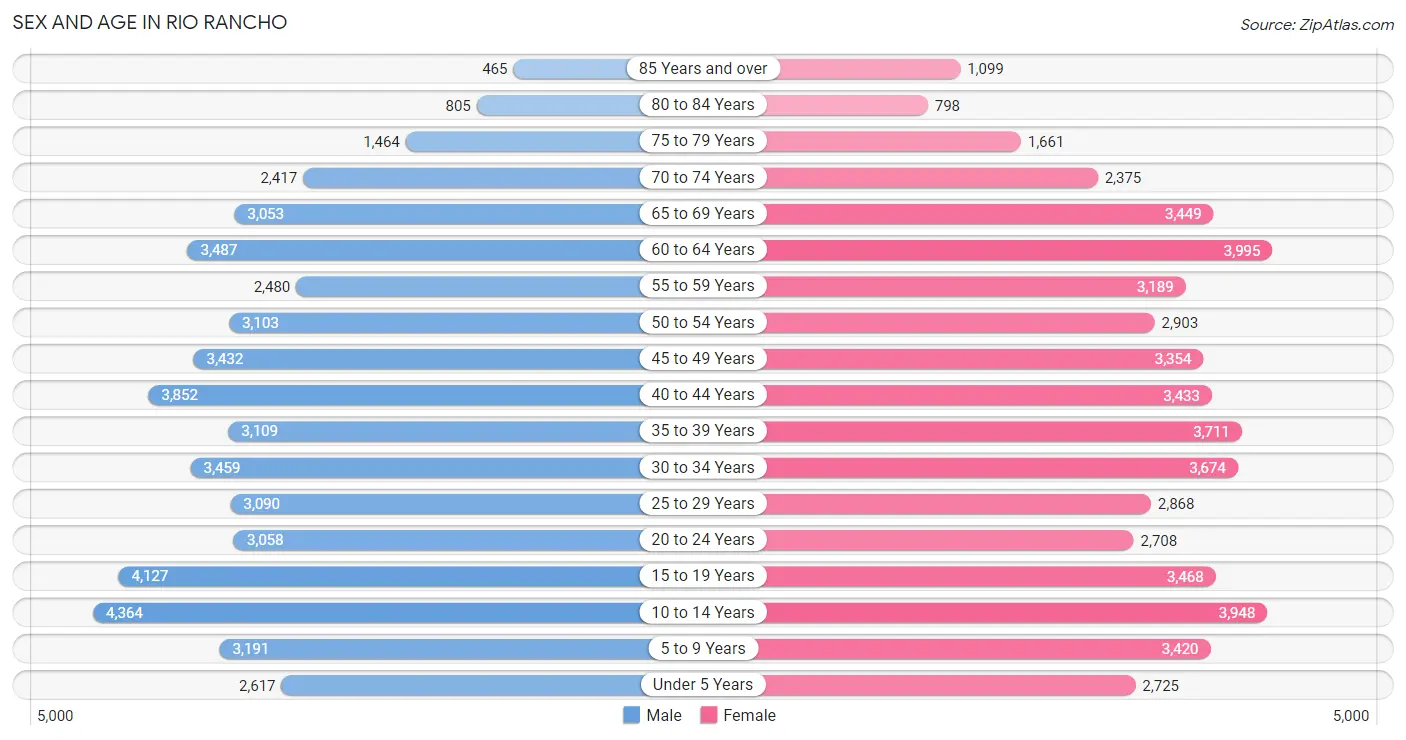
Sex and Age in Rio Rancho
Sex and Age in Rio Rancho
The most populous age groups in Rio Rancho are 10 to 14 Years (4,364 | 8.5%) for men and 60 to 64 Years (3,995 | 7.6%) for women.
| Age Bracket | Male | Female |
| Under 5 Years | 2,617 (5.1%) | 2,725 (5.2%) |
| 5 to 9 Years | 3,191 (6.2%) | 3,420 (6.5%) |
| 10 to 14 Years | 4,364 (8.5%) | 3,948 (7.5%) |
| 15 to 19 Years | 4,127 (8.0%) | 3,468 (6.6%) |
| 20 to 24 Years | 3,058 (5.9%) | 2,708 (5.1%) |
| 25 to 29 Years | 3,090 (6.0%) | 2,868 (5.4%) |
| 30 to 34 Years | 3,459 (6.7%) | 3,674 (7.0%) |
| 35 to 39 Years | 3,109 (6.0%) | 3,711 (7.0%) |
| 40 to 44 Years | 3,852 (7.5%) | 3,433 (6.5%) |
| 45 to 49 Years | 3,432 (6.7%) | 3,354 (6.4%) |
| 50 to 54 Years | 3,103 (6.0%) | 2,903 (5.5%) |
| 55 to 59 Years | 2,480 (4.8%) | 3,189 (6.0%) |
| 60 to 64 Years | 3,487 (6.8%) | 3,995 (7.6%) |
| 65 to 69 Years | 3,053 (5.9%) | 3,449 (6.5%) |
| 70 to 74 Years | 2,417 (4.7%) | 2,375 (4.5%) |
| 75 to 79 Years | 1,464 (2.8%) | 1,661 (3.2%) |
| 80 to 84 Years | 805 (1.6%) | 798 (1.5%) |
| 85 Years and over | 465 (0.9%) | 1,099 (2.1%) |
| Total | 51,573 (100.0%) | 52,778 (100.0%) |
Families and Households in Rio Rancho
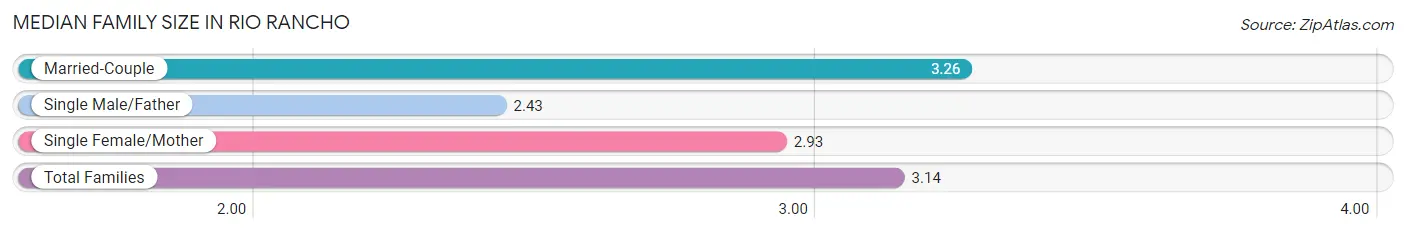
Median Family Size in Rio Rancho
The median family size in Rio Rancho is 3.14 persons per family, with married-couple families (21,187 | 75.1%) accounting for the largest median family size of 3.26 persons per family. On the other hand, single male/father families (1,895 | 6.7%) represent the smallest median family size with 2.43 persons per family.
| Family Type | # Families | Family Size |
| Married-Couple | 21,187 (75.1%) | 3.26 |
| Single Male/Father | 1,895 (6.7%) | 2.43 |
| Single Female/Mother | 5,124 (18.2%) | 2.93 |
| Total Families | 28,206 (100.0%) | 3.14 |
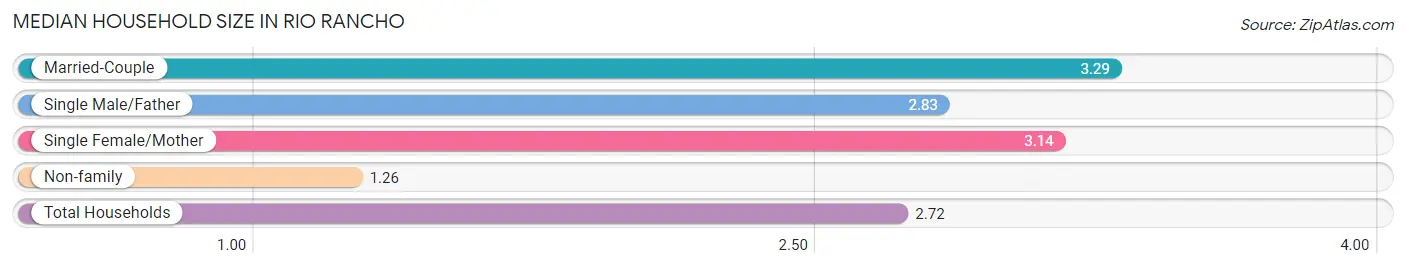
Median Household Size in Rio Rancho
The median household size in Rio Rancho is 2.72 persons per household, with married-couple households (21,187 | 55.5%) accounting for the largest median household size of 3.29 persons per household. non-family households (9,984 | 26.1%) represent the smallest median household size with 1.26 persons per household.
| Household Type | # Households | Household Size |
| Married-Couple | 21,187 (55.5%) | 3.29 |
| Single Male/Father | 1,895 (5.0%) | 2.83 |
| Single Female/Mother | 5,124 (13.4%) | 3.14 |
| Non-family | 9,984 (26.1%) | 1.26 |
| Total Households | 38,190 (100.0%) | 2.72 |
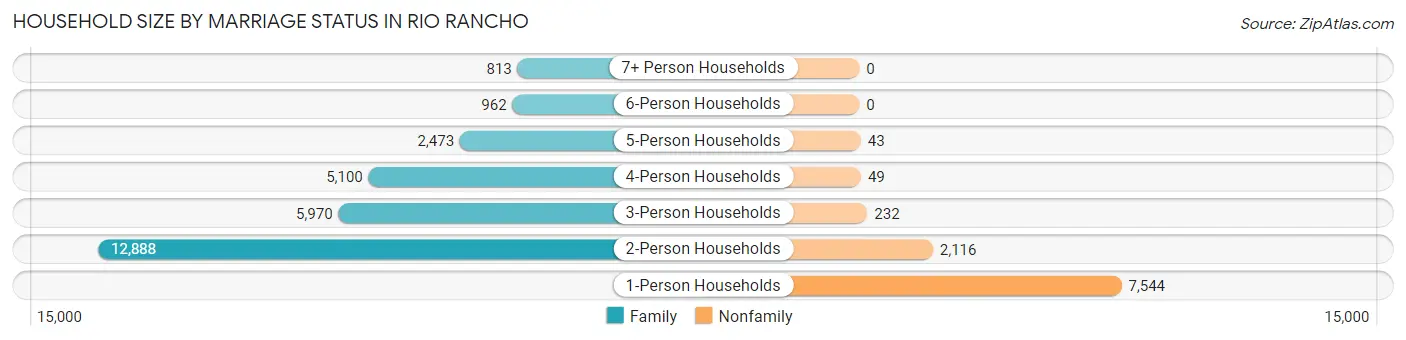
Household Size by Marriage Status in Rio Rancho
Out of a total of 38,190 households in Rio Rancho, 28,206 (73.9%) are family households, while 9,984 (26.1%) are nonfamily households. The most numerous type of family households are 2-person households, comprising 12,888, and the most common type of nonfamily households are 1-person households, comprising 7,544.
| Household Size | Family Households | Nonfamily Households |
| 1-Person Households | - | 7,544 (19.8%) |
| 2-Person Households | 12,888 (33.8%) | 2,116 (5.5%) |
| 3-Person Households | 5,970 (15.6%) | 232 (0.6%) |
| 4-Person Households | 5,100 (13.4%) | 49 (0.1%) |
| 5-Person Households | 2,473 (6.5%) | 43 (0.1%) |
| 6-Person Households | 962 (2.5%) | 0 (0.0%) |
| 7+ Person Households | 813 (2.1%) | 0 (0.0%) |
| Total | 28,206 (73.9%) | 9,984 (26.1%) |
Female Fertility in Rio Rancho
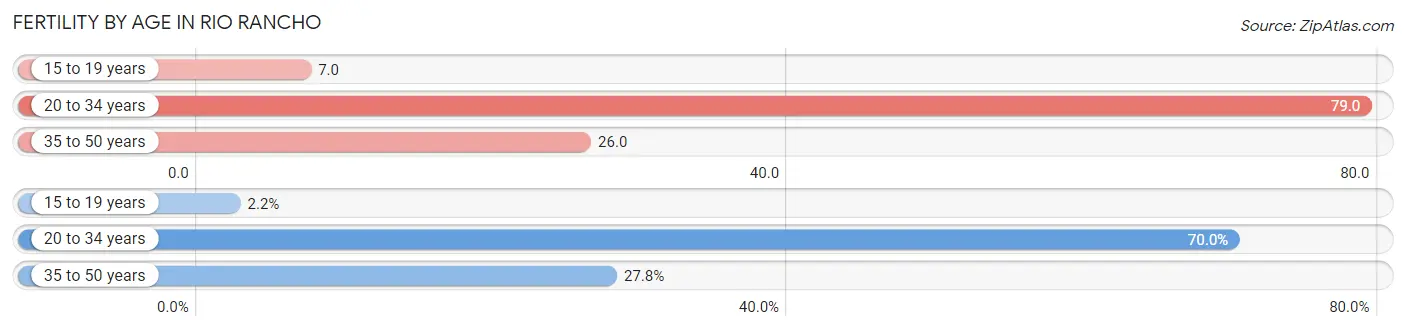
Fertility by Age in Rio Rancho
Average fertility rate in Rio Rancho is 44.0 births per 1,000 women. Women in the age bracket of 20 to 34 years have the highest fertility rate with 79.0 births per 1,000 women. Women in the age bracket of 20 to 34 years acount for 70.0% of all women with births.
| Age Bracket | Women with Births | Births / 1,000 Women |
| 15 to 19 years | 23 (2.2%) | 7.0 |
| 20 to 34 years | 729 (70.0%) | 79.0 |
| 35 to 50 years | 289 (27.8%) | 26.0 |
| Total | 1,041 (100.0%) | 44.0 |
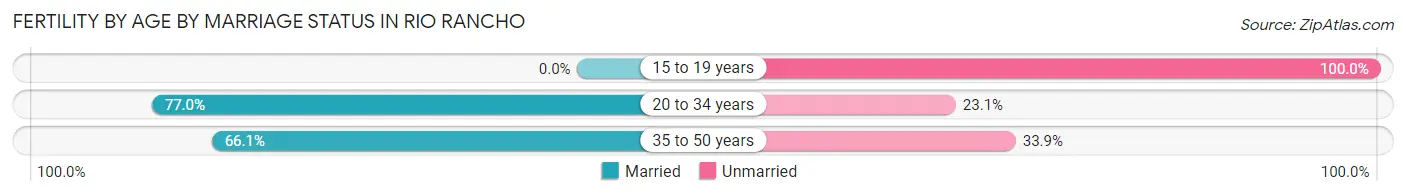
Fertility by Age by Marriage Status in Rio Rancho
72.2% of women with births (1,041) in Rio Rancho are married. The highest percentage of unmarried women with births falls into 15 to 19 years age bracket with 100.0% of them unmarried at the time of birth, while the lowest percentage of unmarried women with births belong to 20 to 34 years age bracket with 23.1% of them unmarried.
| Age Bracket | Married | Unmarried |
| 15 to 19 years | 0 (0.0%) | 23 (100.0%) |
| 20 to 34 years | 561 (76.9%) | 168 (23.1%) |
| 35 to 50 years | 191 (66.1%) | 98 (33.9%) |
| Total | 752 (72.2%) | 289 (27.8%) |
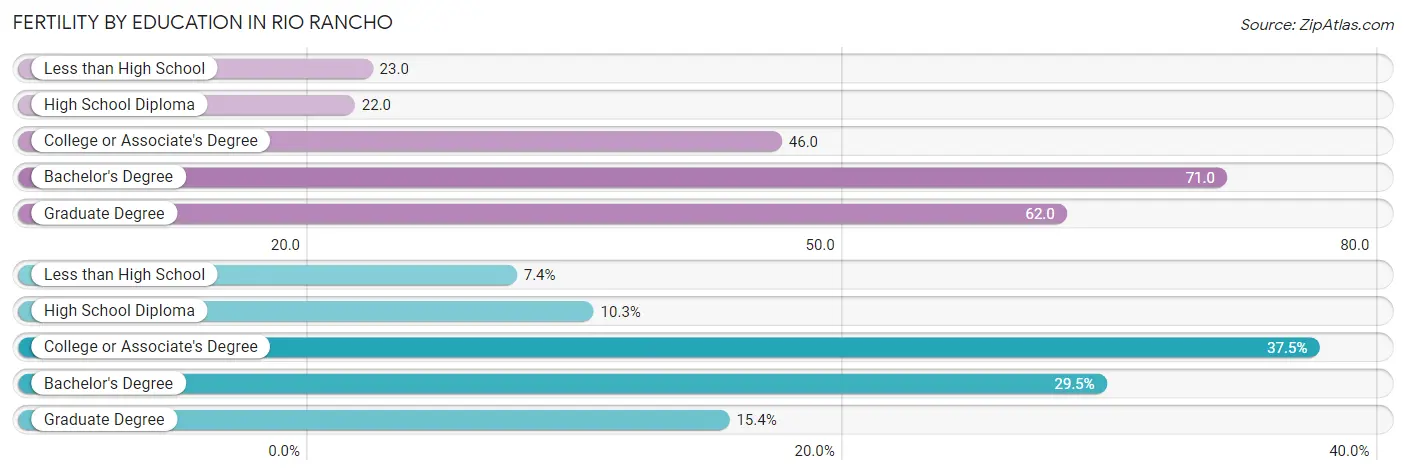
Fertility by Education in Rio Rancho
Average fertility rate in Rio Rancho is 44.0 births per 1,000 women. Women with the education attainment of bachelor's degree have the highest fertility rate of 71.0 births per 1,000 women, while women with the education attainment of high school diploma have the lowest fertility at 22.0 births per 1,000 women. Women with the education attainment of college or associate's degree represent 37.5% of all women with births.
| Educational Attainment | Women with Births | Births / 1,000 Women |
| Less than High School | 77 (7.4%) | 23.0 |
| High School Diploma | 107 (10.3%) | 22.0 |
| College or Associate's Degree | 390 (37.5%) | 46.0 |
| Bachelor's Degree | 307 (29.5%) | 71.0 |
| Graduate Degree | 160 (15.4%) | 62.0 |
| Total | 1,041 (100.0%) | 44.0 |
Fertility by Education by Marriage Status in Rio Rancho
27.8% of women with births in Rio Rancho are unmarried. Women with the educational attainment of bachelor's degree are most likely to be married with 93.2% of them married at childbirth, while women with the educational attainment of high school diploma are least likely to be married with 100.0% of them unmarried at childbirth.
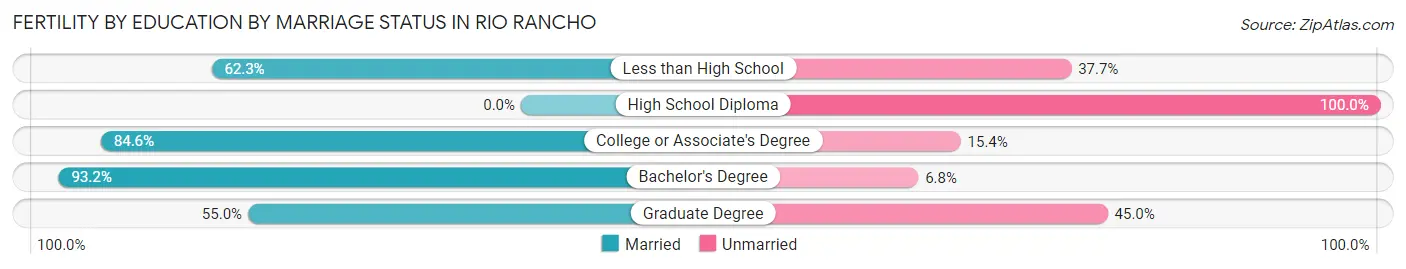
| Educational Attainment | Married | Unmarried |
| Less than High School | 48 (62.3%) | 29 (37.7%) |
| High School Diploma | 0 (0.0%) | 107 (100.0%) |
| College or Associate's Degree | 330 (84.6%) | 60 (15.4%) |
| Bachelor's Degree | 286 (93.2%) | 21 (6.8%) |
| Graduate Degree | 88 (55.0%) | 72 (45.0%) |
| Total | 752 (72.2%) | 289 (27.8%) |
Employment Characteristics in Rio Rancho
Employment by Class of Employer in Rio Rancho
Among the 47,981 employed individuals in Rio Rancho, private company employees (30,431 | 63.4%), local government employees (4,163 | 8.7%), and not-for-profit organizations (3,677 | 7.7%) make up the most common classes of employment.
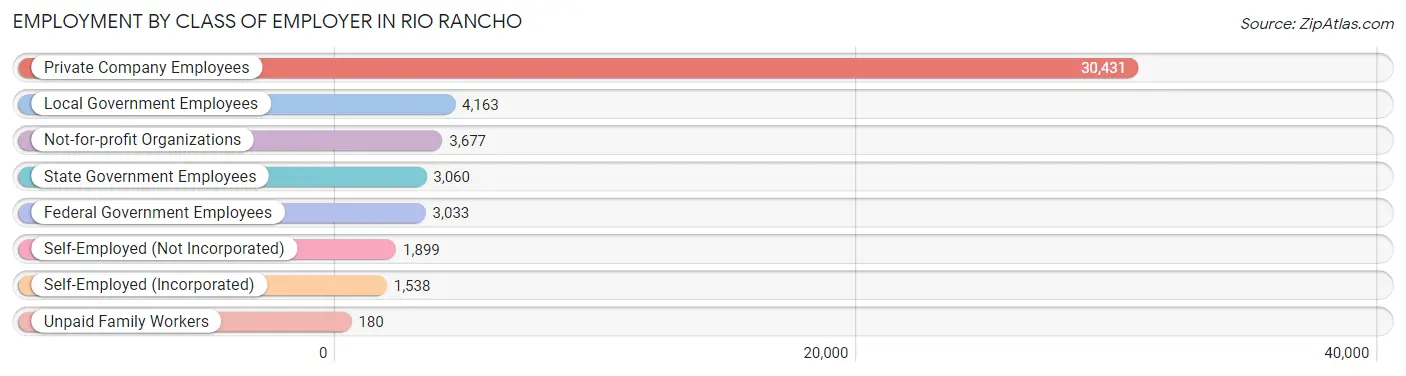
| Employer Class | # Employees | % Employees |
| Private Company Employees | 30,431 | 63.4% |
| Self-Employed (Incorporated) | 1,538 | 3.2% |
| Self-Employed (Not Incorporated) | 1,899 | 4.0% |
| Not-for-profit Organizations | 3,677 | 7.7% |
| Local Government Employees | 4,163 | 8.7% |
| State Government Employees | 3,060 | 6.4% |
| Federal Government Employees | 3,033 | 6.3% |
| Unpaid Family Workers | 180 | 0.4% |
| Total | 47,981 | 100.0% |
Employment Status by Age in Rio Rancho
According to the labor force statistics for Rio Rancho, out of the total population over 16 years of age (82,402), 62.4% or 51,419 individuals are in the labor force, with 5.5% or 2,828 of them unemployed. The age group with the highest labor force participation rate is 35 to 44 years, with 84.9% or 11,975 individuals in the labor force. Within the labor force, the 16 to 19 years age range has the highest percentage of unemployed individuals, with 15.3% or 395 of them being unemployed.
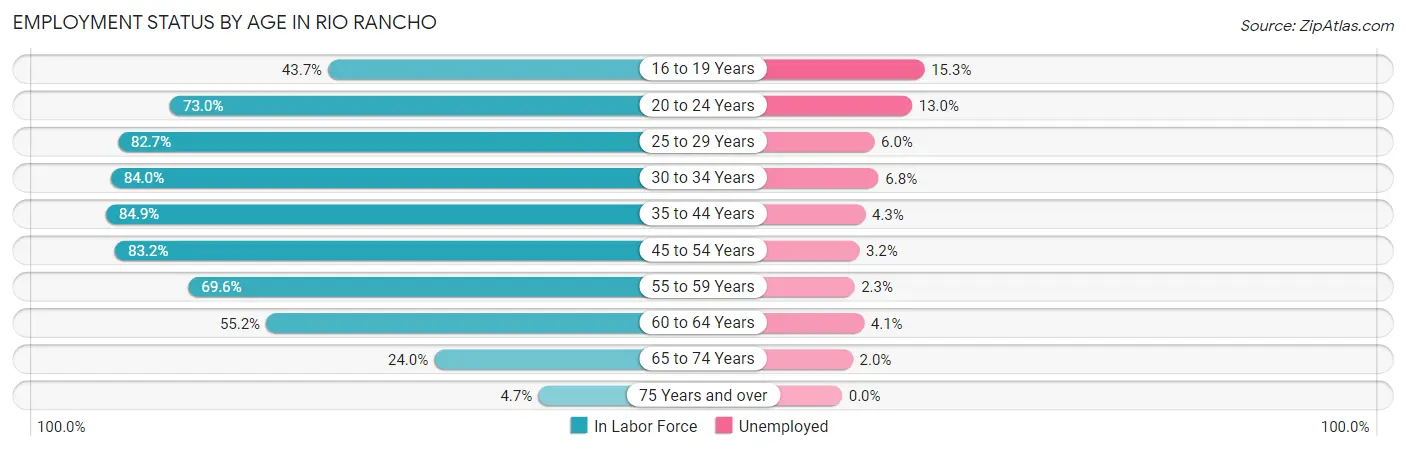
| Age Bracket | In Labor Force | Unemployed |
| 16 to 19 Years | 2,583 (43.7%) | 395 (15.3%) |
| 20 to 24 Years | 4,209 (73.0%) | 547 (13.0%) |
| 25 to 29 Years | 4,927 (82.7%) | 296 (6.0%) |
| 30 to 34 Years | 5,992 (84.0%) | 407 (6.8%) |
| 35 to 44 Years | 11,975 (84.9%) | 515 (4.3%) |
| 45 to 54 Years | 10,643 (83.2%) | 341 (3.2%) |
| 55 to 59 Years | 3,946 (69.6%) | 91 (2.3%) |
| 60 to 64 Years | 4,130 (55.2%) | 169 (4.1%) |
| 65 to 74 Years | 2,711 (24.0%) | 54 (2.0%) |
| 75 Years and over | 296 (4.7%) | 0 (0.0%) |
| Total | 51,419 (62.4%) | 2,828 (5.5%) |
Employment Status by Educational Attainment in Rio Rancho
According to labor force statistics for Rio Rancho, 78.3% of individuals (41,608) out of the total population between 25 and 64 years of age (53,139) are in the labor force, with 4.4% or 1,831 of them being unemployed. The group with the highest labor force participation rate are those with the educational attainment of bachelor's degree or higher, with 83.0% or 14,477 individuals in the labor force. Within the labor force, individuals with college / associate degree education have the highest percentage of unemployment, with 5.8% or 958 of them being unemployed.
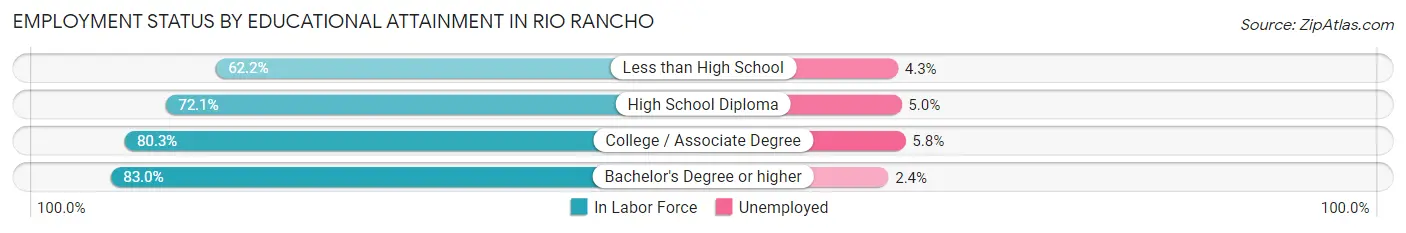
| Educational Attainment | In Labor Force | Unemployed |
| Less than High School | 1,776 (62.2%) | 123 (4.3%) |
| High School Diploma | 8,854 (72.1%) | 614 (5.0%) |
| College / Associate Degree | 16,511 (80.3%) | 1,193 (5.8%) |
| Bachelor's Degree or higher | 14,477 (83.0%) | 419 (2.4%) |
| Total | 41,608 (78.3%) | 2,338 (4.4%) |
Employment Occupations by Sex in Rio Rancho
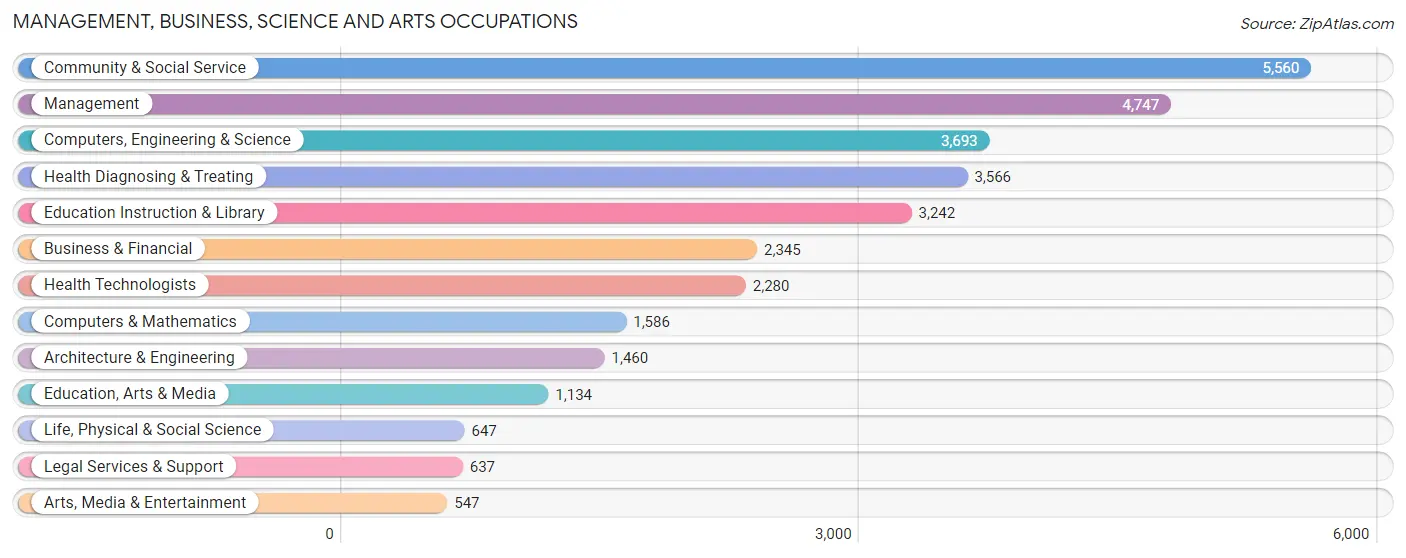
Management, Business, Science and Arts Occupations
The most common Management, Business, Science and Arts occupations in Rio Rancho are Community & Social Service (5,560 | 11.5%), Management (4,747 | 9.8%), Computers, Engineering & Science (3,693 | 7.6%), Health Diagnosing & Treating (3,566 | 7.4%), and Education Instruction & Library (3,242 | 6.7%).
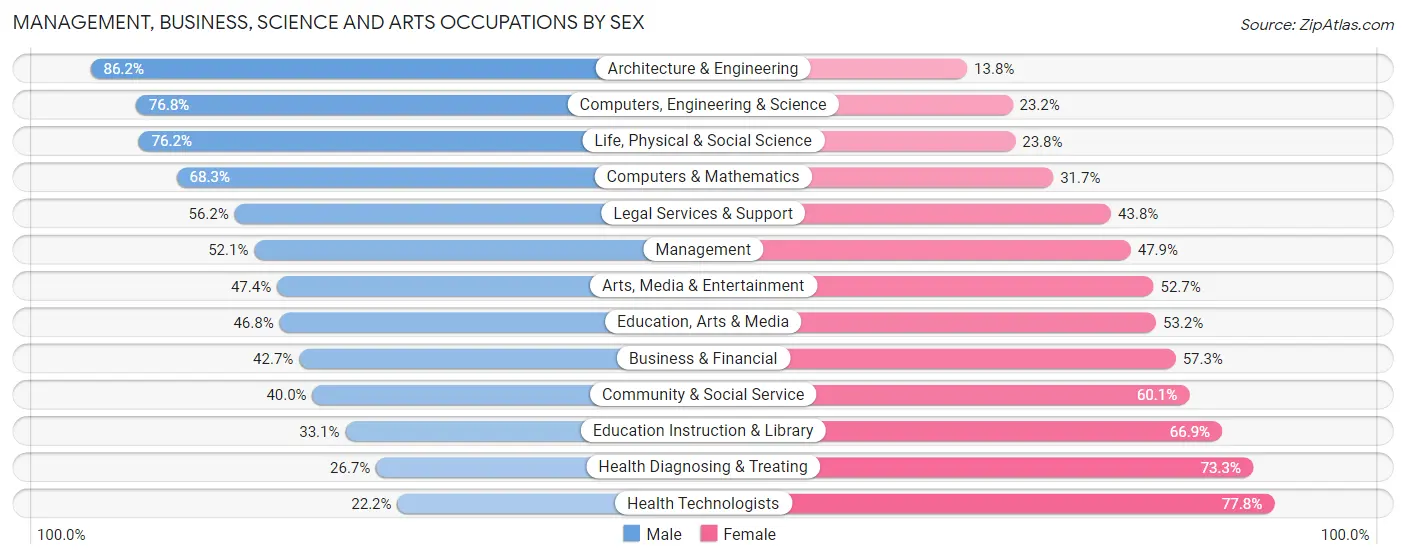
Management, Business, Science and Arts Occupations by Sex
Within the Management, Business, Science and Arts occupations in Rio Rancho, the most male-oriented occupations are Architecture & Engineering (86.2%), Computers, Engineering & Science (76.8%), and Life, Physical & Social Science (76.2%), while the most female-oriented occupations are Health Technologists (77.8%), Health Diagnosing & Treating (73.3%), and Education Instruction & Library (66.9%).
| Occupation | Male | Female |
| Management | 2,473 (52.1%) | 2,274 (47.9%) |
| Business & Financial | 1,002 (42.7%) | 1,343 (57.3%) |
| Computers, Engineering & Science | 2,835 (76.8%) | 858 (23.2%) |
| Computers & Mathematics | 1,083 (68.3%) | 503 (31.7%) |
| Architecture & Engineering | 1,259 (86.2%) | 201 (13.8%) |
| Life, Physical & Social Science | 493 (76.2%) | 154 (23.8%) |
| Community & Social Service | 2,221 (40.0%) | 3,339 (60.1%) |
| Education, Arts & Media | 531 (46.8%) | 603 (53.2%) |
| Legal Services & Support | 358 (56.2%) | 279 (43.8%) |
| Education Instruction & Library | 1,073 (33.1%) | 2,169 (66.9%) |
| Arts, Media & Entertainment | 259 (47.3%) | 288 (52.6%) |
| Health Diagnosing & Treating | 951 (26.7%) | 2,615 (73.3%) |
| Health Technologists | 507 (22.2%) | 1,773 (77.8%) |
| Total (Category) | 9,482 (47.6%) | 10,429 (52.4%) |
| Total (Overall) | 25,787 (53.3%) | 22,552 (46.7%) |
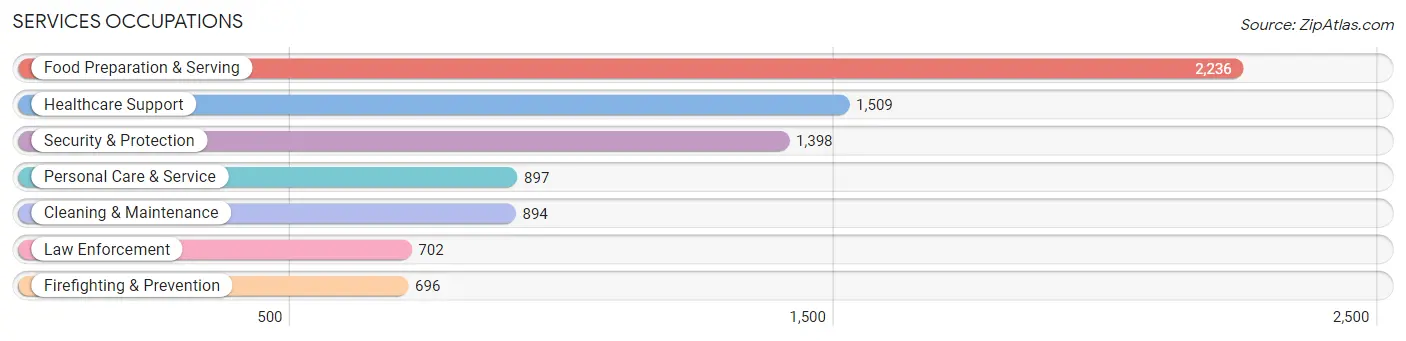
Services Occupations
The most common Services occupations in Rio Rancho are Food Preparation & Serving (2,236 | 4.6%), Healthcare Support (1,509 | 3.1%), Security & Protection (1,398 | 2.9%), Personal Care & Service (897 | 1.9%), and Cleaning & Maintenance (894 | 1.8%).
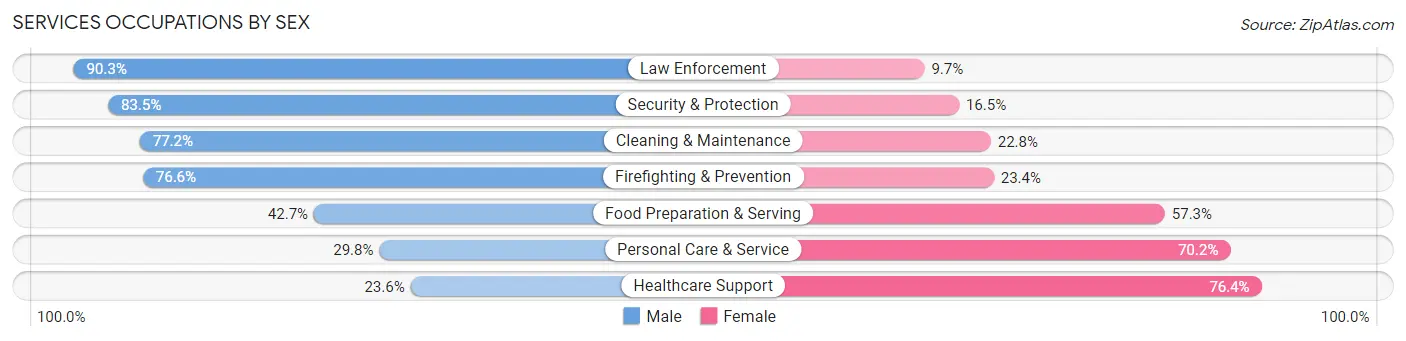
Services Occupations by Sex
Within the Services occupations in Rio Rancho, the most male-oriented occupations are Law Enforcement (90.3%), Security & Protection (83.5%), and Cleaning & Maintenance (77.2%), while the most female-oriented occupations are Healthcare Support (76.4%), Personal Care & Service (70.2%), and Food Preparation & Serving (57.3%).
| Occupation | Male | Female |
| Healthcare Support | 356 (23.6%) | 1,153 (76.4%) |
| Security & Protection | 1,167 (83.5%) | 231 (16.5%) |
| Firefighting & Prevention | 533 (76.6%) | 163 (23.4%) |
| Law Enforcement | 634 (90.3%) | 68 (9.7%) |
| Food Preparation & Serving | 955 (42.7%) | 1,281 (57.3%) |
| Cleaning & Maintenance | 690 (77.2%) | 204 (22.8%) |
| Personal Care & Service | 267 (29.8%) | 630 (70.2%) |
| Total (Category) | 3,435 (49.5%) | 3,499 (50.5%) |
| Total (Overall) | 25,787 (53.3%) | 22,552 (46.7%) |
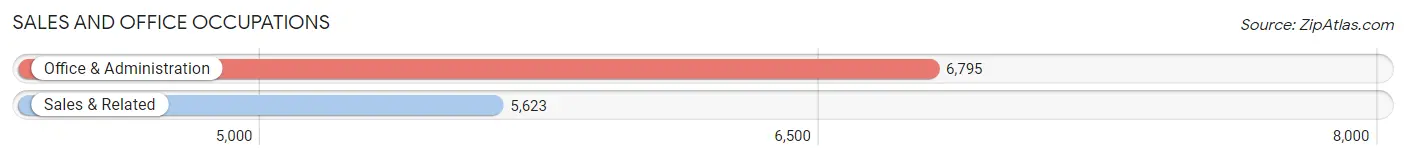
Sales and Office Occupations
The most common Sales and Office occupations in Rio Rancho are Office & Administration (6,795 | 14.1%), and Sales & Related (5,623 | 11.6%).
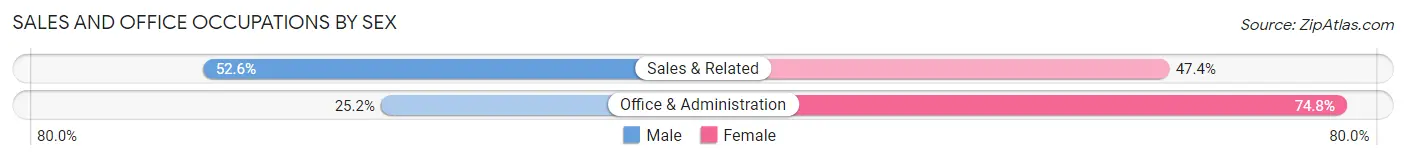
Sales and Office Occupations by Sex
| Occupation | Male | Female |
| Sales & Related | 2,957 (52.6%) | 2,666 (47.4%) |
| Office & Administration | 1,713 (25.2%) | 5,082 (74.8%) |
| Total (Category) | 4,670 (37.6%) | 7,748 (62.4%) |
| Total (Overall) | 25,787 (53.3%) | 22,552 (46.7%) |
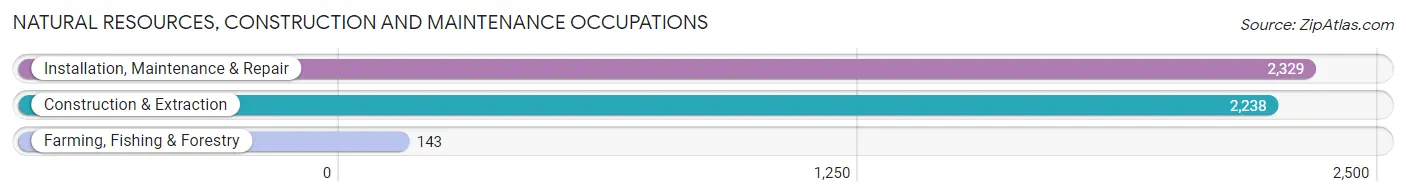
Natural Resources, Construction and Maintenance Occupations
The most common Natural Resources, Construction and Maintenance occupations in Rio Rancho are Installation, Maintenance & Repair (2,329 | 4.8%), Construction & Extraction (2,238 | 4.6%), and Farming, Fishing & Forestry (143 | 0.3%).
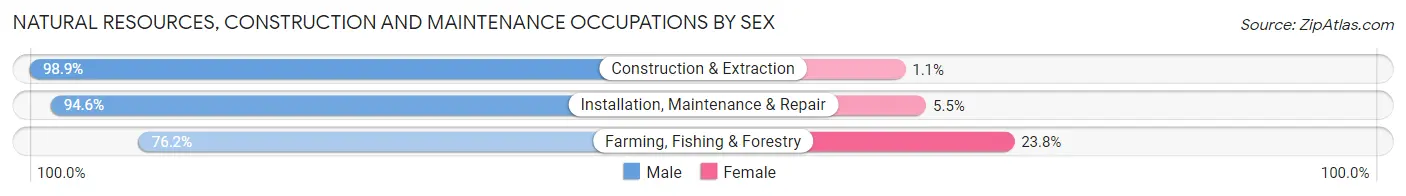
Natural Resources, Construction and Maintenance Occupations by Sex
| Occupation | Male | Female |
| Farming, Fishing & Forestry | 109 (76.2%) | 34 (23.8%) |
| Construction & Extraction | 2,213 (98.9%) | 25 (1.1%) |
| Installation, Maintenance & Repair | 2,202 (94.6%) | 127 (5.4%) |
| Total (Category) | 4,524 (96.1%) | 186 (4.0%) |
| Total (Overall) | 25,787 (53.3%) | 22,552 (46.7%) |
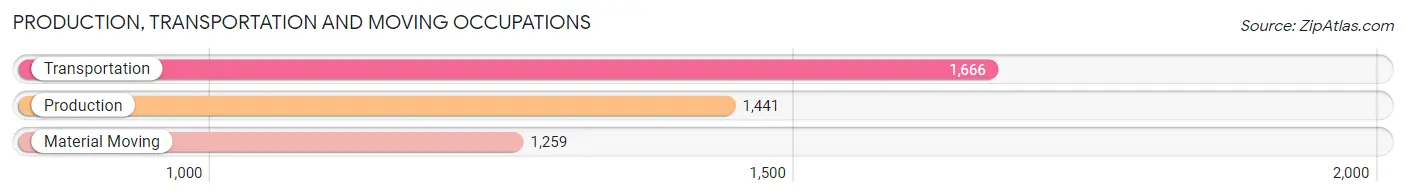
Production, Transportation and Moving Occupations
The most common Production, Transportation and Moving occupations in Rio Rancho are Transportation (1,666 | 3.5%), Production (1,441 | 3.0%), and Material Moving (1,259 | 2.6%).
Production, Transportation and Moving Occupations by Sex
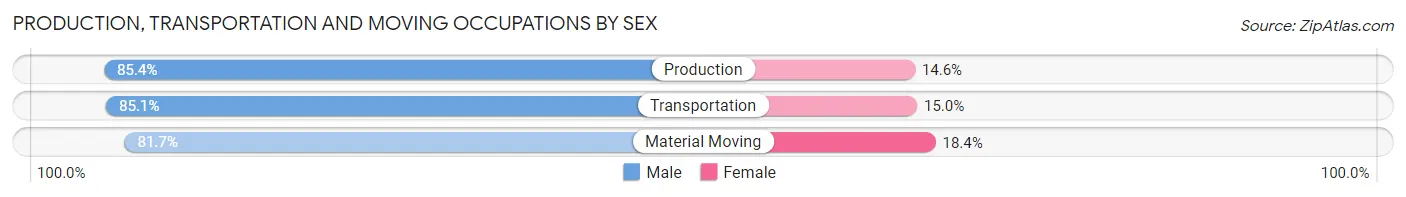
| Occupation | Male | Female |
| Production | 1,231 (85.4%) | 210 (14.6%) |
| Transportation | 1,417 (85.1%) | 249 (14.9%) |
| Material Moving | 1,028 (81.7%) | 231 (18.3%) |
| Total (Category) | 3,676 (84.2%) | 690 (15.8%) |
| Total (Overall) | 25,787 (53.3%) | 22,552 (46.7%) |
Employment Industries by Sex in Rio Rancho
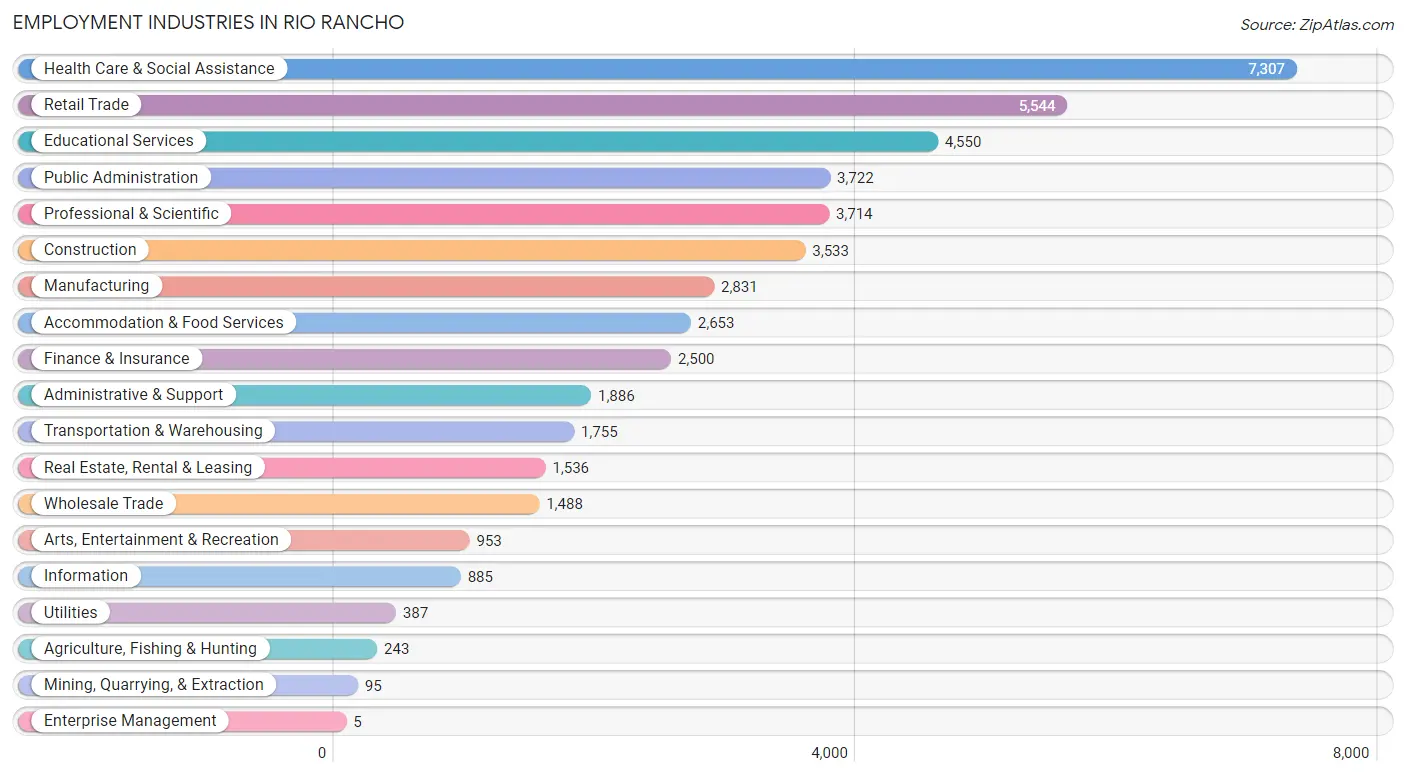
Employment Industries in Rio Rancho
The major employment industries in Rio Rancho include Health Care & Social Assistance (7,307 | 15.1%), Retail Trade (5,544 | 11.5%), Educational Services (4,550 | 9.4%), Public Administration (3,722 | 7.7%), and Professional & Scientific (3,714 | 7.7%).
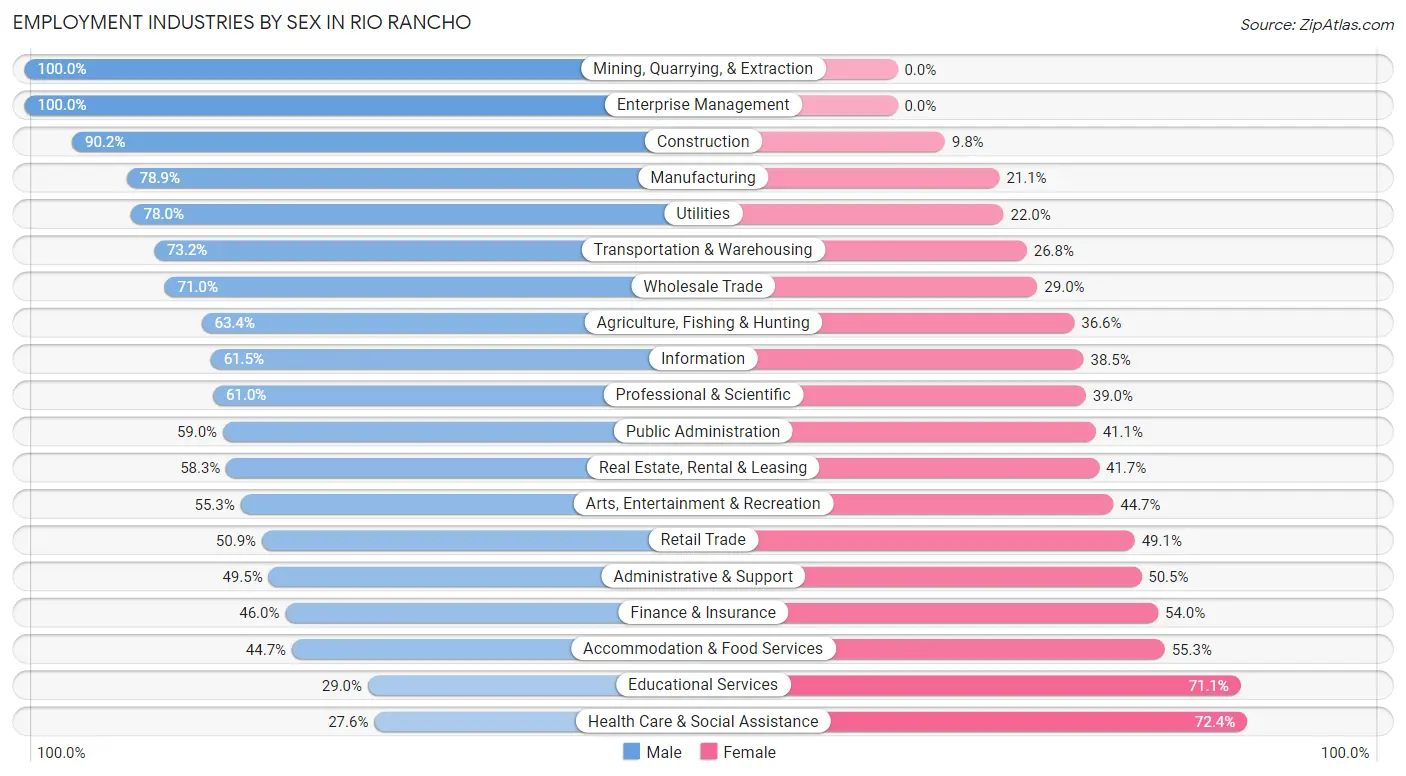
Employment Industries by Sex in Rio Rancho
The Rio Rancho industries that see more men than women are Mining, Quarrying, & Extraction (100.0%), Enterprise Management (100.0%), and Construction (90.2%), whereas the industries that tend to have a higher number of women are Health Care & Social Assistance (72.4%), Educational Services (71.1%), and Accommodation & Food Services (55.3%).
| Industry | Male | Female |
| Agriculture, Fishing & Hunting | 154 (63.4%) | 89 (36.6%) |
| Mining, Quarrying, & Extraction | 95 (100.0%) | 0 (0.0%) |
| Construction | 3,186 (90.2%) | 347 (9.8%) |
| Manufacturing | 2,233 (78.9%) | 598 (21.1%) |
| Wholesale Trade | 1,057 (71.0%) | 431 (29.0%) |
| Retail Trade | 2,821 (50.9%) | 2,723 (49.1%) |
| Transportation & Warehousing | 1,285 (73.2%) | 470 (26.8%) |
| Utilities | 302 (78.0%) | 85 (22.0%) |
| Information | 544 (61.5%) | 341 (38.5%) |
| Finance & Insurance | 1,151 (46.0%) | 1,349 (54.0%) |
| Real Estate, Rental & Leasing | 895 (58.3%) | 641 (41.7%) |
| Professional & Scientific | 2,266 (61.0%) | 1,448 (39.0%) |
| Enterprise Management | 5 (100.0%) | 0 (0.0%) |
| Administrative & Support | 934 (49.5%) | 952 (50.5%) |
| Educational Services | 1,317 (28.9%) | 3,233 (71.1%) |
| Health Care & Social Assistance | 2,019 (27.6%) | 5,288 (72.4%) |
| Arts, Entertainment & Recreation | 527 (55.3%) | 426 (44.7%) |
| Accommodation & Food Services | 1,185 (44.7%) | 1,468 (55.3%) |
| Public Administration | 2,194 (59.0%) | 1,528 (41.0%) |
| Total | 25,787 (53.3%) | 22,552 (46.7%) |
Education in Rio Rancho
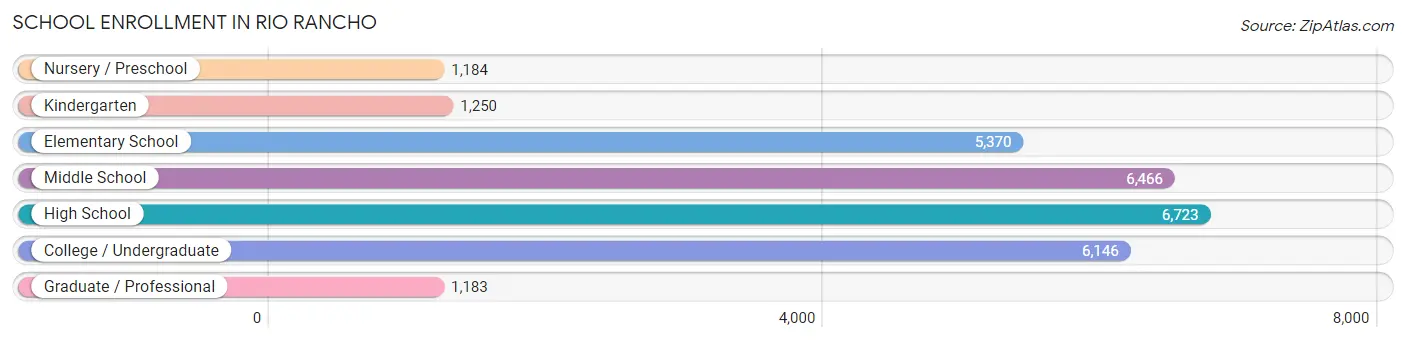
School Enrollment in Rio Rancho
The most common levels of schooling among the 28,322 students in Rio Rancho are high school (6,723 | 23.7%), middle school (6,466 | 22.8%), and college / undergraduate (6,146 | 21.7%).
| School Level | # Students | % Students |
| Nursery / Preschool | 1,184 | 4.2% |
| Kindergarten | 1,250 | 4.4% |
| Elementary School | 5,370 | 19.0% |
| Middle School | 6,466 | 22.8% |
| High School | 6,723 | 23.7% |
| College / Undergraduate | 6,146 | 21.7% |
| Graduate / Professional | 1,183 | 4.2% |
| Total | 28,322 | 100.0% |
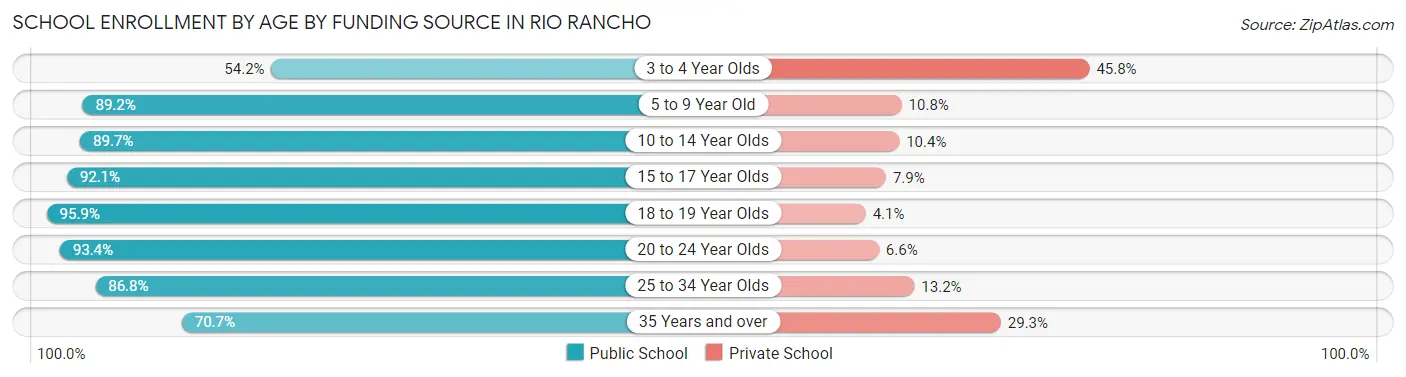
School Enrollment by Age by Funding Source in Rio Rancho
Out of a total of 28,322 students who are enrolled in schools in Rio Rancho, 3,427 (12.1%) attend a private institution, while the remaining 24,895 (87.9%) are enrolled in public schools. The age group of 3 to 4 year olds has the highest likelihood of being enrolled in private schools, with 380 (45.8% in the age bracket) enrolled. Conversely, the age group of 18 to 19 year olds has the lowest likelihood of being enrolled in a private school, with 1,635 (95.9% in the age bracket) attending a public institution.
| Age Bracket | Public School | Private School |
| 3 to 4 Year Olds | 450 (54.2%) | 380 (45.8%) |
| 5 to 9 Year Old | 5,561 (89.2%) | 673 (10.8%) |
| 10 to 14 Year Olds | 7,386 (89.6%) | 853 (10.3%) |
| 15 to 17 Year Olds | 4,464 (92.1%) | 382 (7.9%) |
| 18 to 19 Year Olds | 1,635 (95.9%) | 70 (4.1%) |
| 20 to 24 Year Olds | 2,393 (93.4%) | 168 (6.6%) |
| 25 to 34 Year Olds | 1,278 (86.8%) | 194 (13.2%) |
| 35 Years and over | 1,722 (70.7%) | 713 (29.3%) |
| Total | 24,895 (87.9%) | 3,427 (12.1%) |
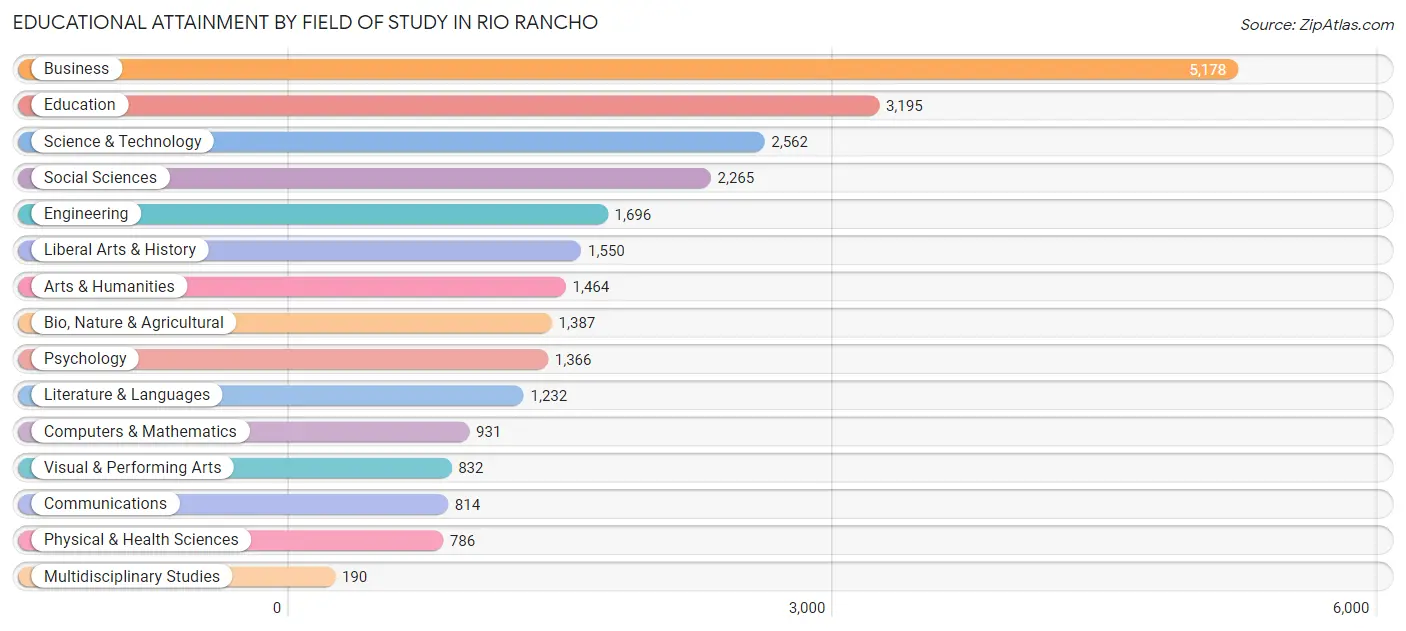
Educational Attainment by Field of Study in Rio Rancho
Business (5,178 | 20.3%), education (3,195 | 12.6%), science & technology (2,562 | 10.1%), social sciences (2,265 | 8.9%), and engineering (1,696 | 6.7%) are the most common fields of study among 25,448 individuals in Rio Rancho who have obtained a bachelor's degree or higher.
| Field of Study | # Graduates | % Graduates |
| Computers & Mathematics | 931 | 3.7% |
| Bio, Nature & Agricultural | 1,387 | 5.4% |
| Physical & Health Sciences | 786 | 3.1% |
| Psychology | 1,366 | 5.4% |
| Social Sciences | 2,265 | 8.9% |
| Engineering | 1,696 | 6.7% |
| Multidisciplinary Studies | 190 | 0.7% |
| Science & Technology | 2,562 | 10.1% |
| Business | 5,178 | 20.3% |
| Education | 3,195 | 12.6% |
| Literature & Languages | 1,232 | 4.8% |
| Liberal Arts & History | 1,550 | 6.1% |
| Visual & Performing Arts | 832 | 3.3% |
| Communications | 814 | 3.2% |
| Arts & Humanities | 1,464 | 5.8% |
| Total | 25,448 | 100.0% |
Transportation & Commute in Rio Rancho
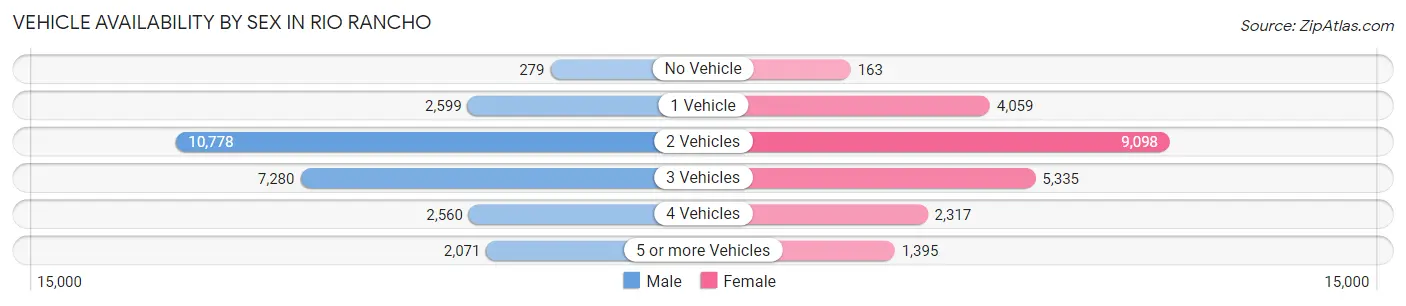
Vehicle Availability by Sex in Rio Rancho
The most prevalent vehicle ownership categories in Rio Rancho are males with 2 vehicles (10,778, accounting for 42.2%) and females with 2 vehicles (9,098, making up 48.2%).
| Vehicles Available | Male | Female |
| No Vehicle | 279 (1.1%) | 163 (0.7%) |
| 1 Vehicle | 2,599 (10.2%) | 4,059 (18.1%) |
| 2 Vehicles | 10,778 (42.2%) | 9,098 (40.7%) |
| 3 Vehicles | 7,280 (28.5%) | 5,335 (23.8%) |
| 4 Vehicles | 2,560 (10.0%) | 2,317 (10.4%) |
| 5 or more Vehicles | 2,071 (8.1%) | 1,395 (6.2%) |
| Total | 25,567 (100.0%) | 22,367 (100.0%) |
Commute Time in Rio Rancho
The most frequently occuring commute durations in Rio Rancho are 30 to 34 minutes (7,518 commuters, 17.8%), 20 to 24 minutes (5,546 commuters, 13.2%), and 45 to 59 minutes (5,076 commuters, 12.0%).
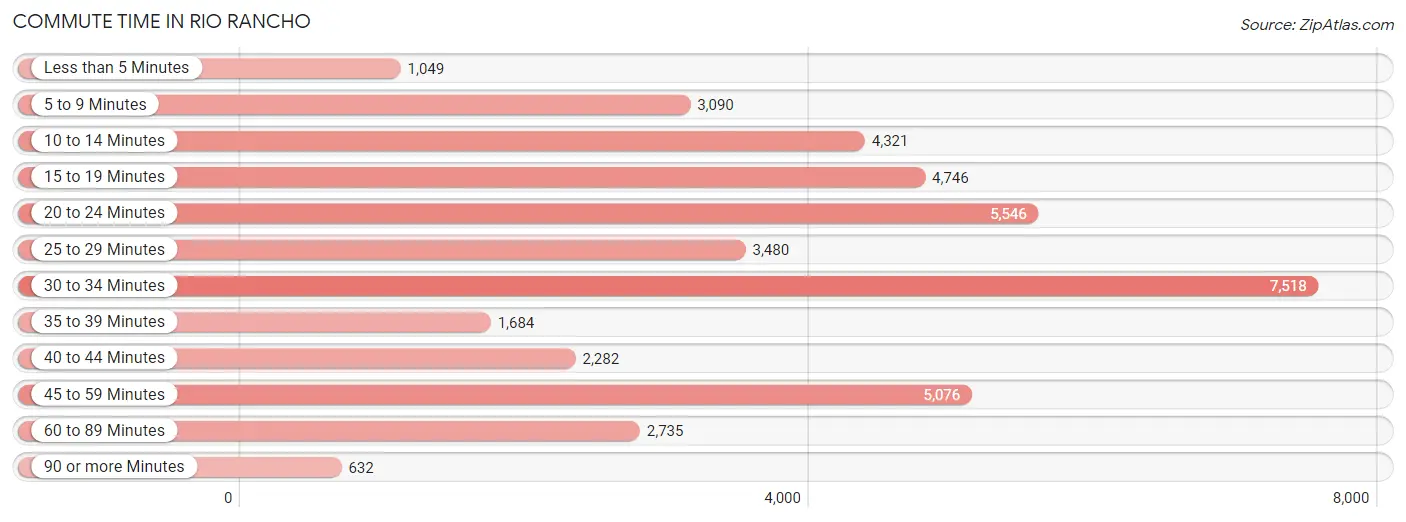
| Commute Time | # Commuters | % Commuters |
| Less than 5 Minutes | 1,049 | 2.5% |
| 5 to 9 Minutes | 3,090 | 7.3% |
| 10 to 14 Minutes | 4,321 | 10.2% |
| 15 to 19 Minutes | 4,746 | 11.3% |
| 20 to 24 Minutes | 5,546 | 13.2% |
| 25 to 29 Minutes | 3,480 | 8.3% |
| 30 to 34 Minutes | 7,518 | 17.8% |
| 35 to 39 Minutes | 1,684 | 4.0% |
| 40 to 44 Minutes | 2,282 | 5.4% |
| 45 to 59 Minutes | 5,076 | 12.0% |
| 60 to 89 Minutes | 2,735 | 6.5% |
| 90 or more Minutes | 632 | 1.5% |
Commute Time by Sex in Rio Rancho
The most common commute times in Rio Rancho are 30 to 34 minutes (4,115 commuters, 17.8%) for males and 30 to 34 minutes (3,403 commuters, 17.9%) for females.
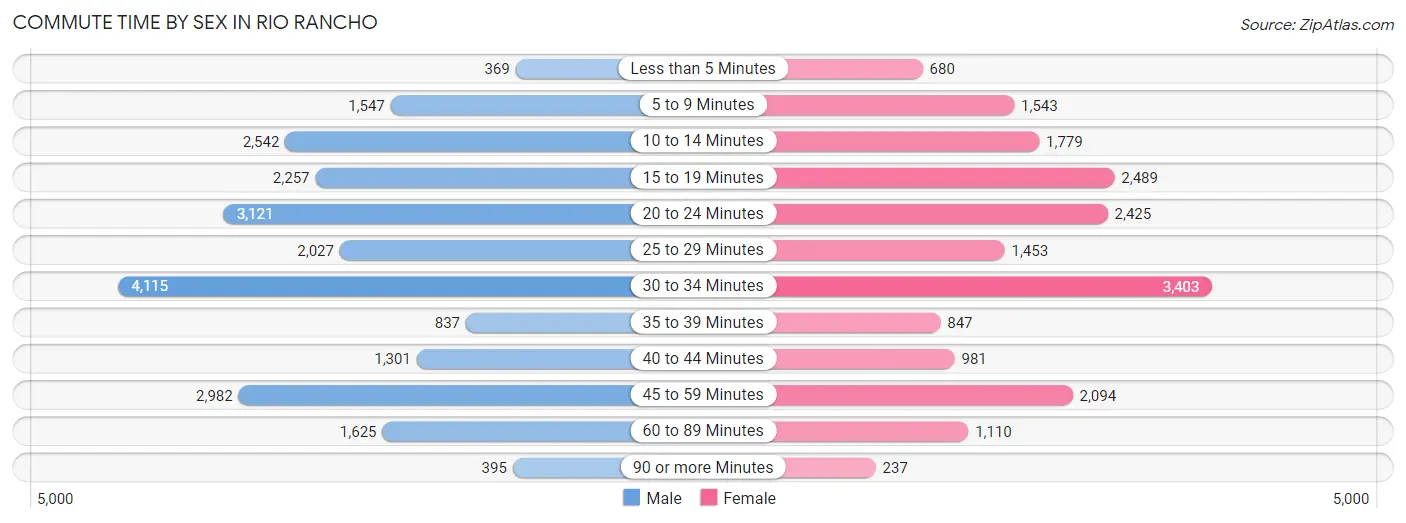
| Commute Time | Male | Female |
| Less than 5 Minutes | 369 (1.6%) | 680 (3.6%) |
| 5 to 9 Minutes | 1,547 (6.7%) | 1,543 (8.1%) |
| 10 to 14 Minutes | 2,542 (11.0%) | 1,779 (9.3%) |
| 15 to 19 Minutes | 2,257 (9.8%) | 2,489 (13.1%) |
| 20 to 24 Minutes | 3,121 (13.5%) | 2,425 (12.7%) |
| 25 to 29 Minutes | 2,027 (8.8%) | 1,453 (7.6%) |
| 30 to 34 Minutes | 4,115 (17.8%) | 3,403 (17.9%) |
| 35 to 39 Minutes | 837 (3.6%) | 847 (4.4%) |
| 40 to 44 Minutes | 1,301 (5.6%) | 981 (5.1%) |
| 45 to 59 Minutes | 2,982 (12.9%) | 2,094 (11.0%) |
| 60 to 89 Minutes | 1,625 (7.0%) | 1,110 (5.8%) |
| 90 or more Minutes | 395 (1.7%) | 237 (1.2%) |
Time of Departure to Work by Sex in Rio Rancho
The most frequent times of departure to work in Rio Rancho are 7:30 AM to 7:59 AM (3,185, 13.8%) for males and 7:00 AM to 7:29 AM (3,264, 17.1%) for females.
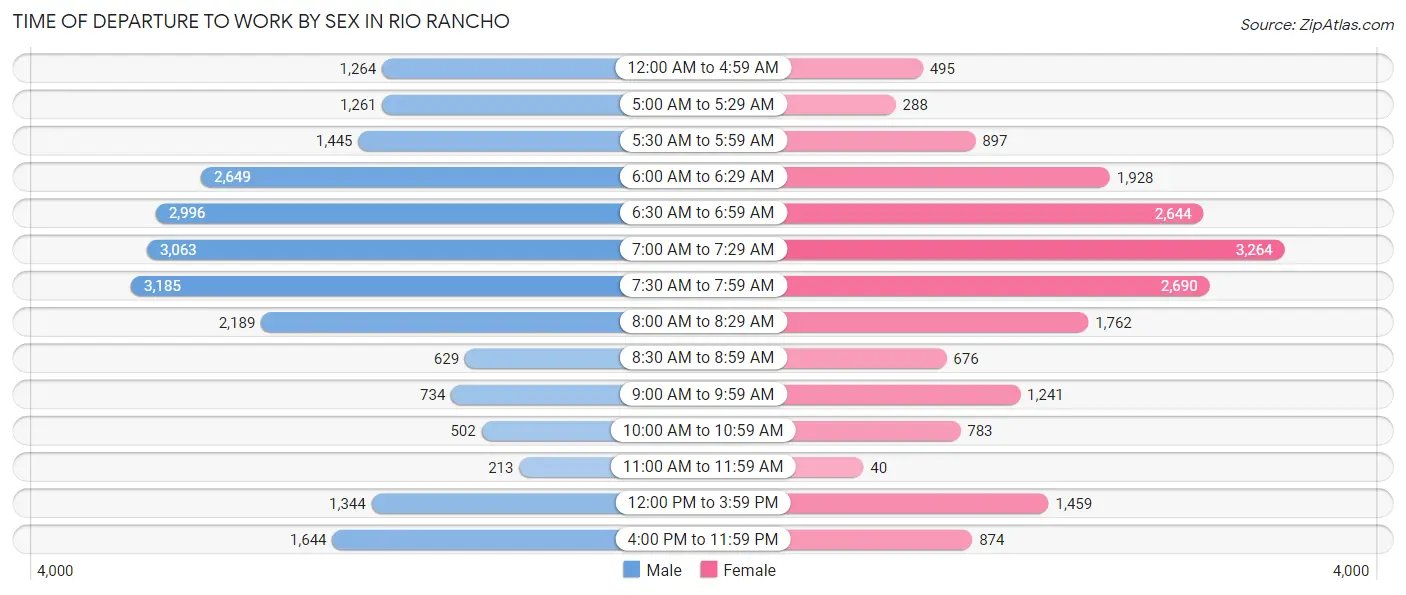
| Time of Departure | Male | Female |
| 12:00 AM to 4:59 AM | 1,264 (5.5%) | 495 (2.6%) |
| 5:00 AM to 5:29 AM | 1,261 (5.4%) | 288 (1.5%) |
| 5:30 AM to 5:59 AM | 1,445 (6.2%) | 897 (4.7%) |
| 6:00 AM to 6:29 AM | 2,649 (11.5%) | 1,928 (10.1%) |
| 6:30 AM to 6:59 AM | 2,996 (13.0%) | 2,644 (13.9%) |
| 7:00 AM to 7:29 AM | 3,063 (13.3%) | 3,264 (17.1%) |
| 7:30 AM to 7:59 AM | 3,185 (13.8%) | 2,690 (14.1%) |
| 8:00 AM to 8:29 AM | 2,189 (9.5%) | 1,762 (9.2%) |
| 8:30 AM to 8:59 AM | 629 (2.7%) | 676 (3.5%) |
| 9:00 AM to 9:59 AM | 734 (3.2%) | 1,241 (6.5%) |
| 10:00 AM to 10:59 AM | 502 (2.2%) | 783 (4.1%) |
| 11:00 AM to 11:59 AM | 213 (0.9%) | 40 (0.2%) |
| 12:00 PM to 3:59 PM | 1,344 (5.8%) | 1,459 (7.7%) |
| 4:00 PM to 11:59 PM | 1,644 (7.1%) | 874 (4.6%) |
| Total | 23,118 (100.0%) | 19,041 (100.0%) |
Housing Occupancy in Rio Rancho
Occupancy by Ownership in Rio Rancho
Of the total 38,190 dwellings in Rio Rancho, owner-occupied units account for 30,986 (81.1%), while renter-occupied units make up 7,204 (18.9%).
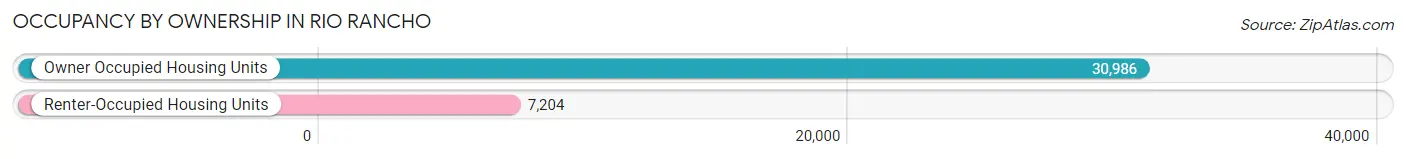
| Occupancy | # Housing Units | % Housing Units |
| Owner Occupied Housing Units | 30,986 | 81.1% |
| Renter-Occupied Housing Units | 7,204 | 18.9% |
| Total Occupied Housing Units | 38,190 | 100.0% |
Occupancy by Household Size in Rio Rancho
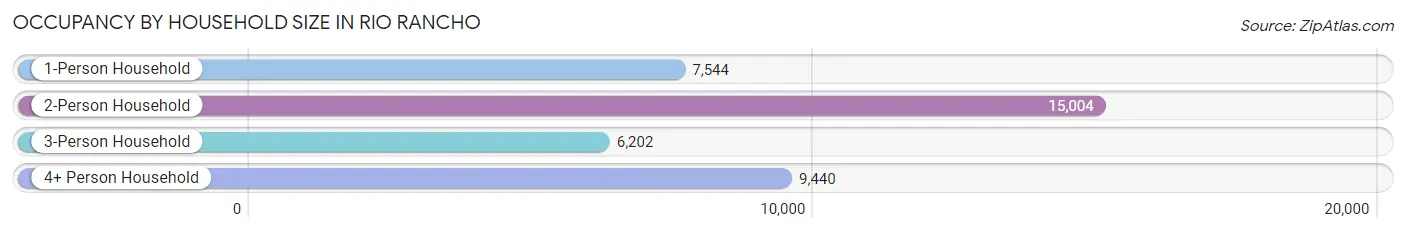
| Household Size | # Housing Units | % Housing Units |
| 1-Person Household | 7,544 | 19.8% |
| 2-Person Household | 15,004 | 39.3% |
| 3-Person Household | 6,202 | 16.2% |
| 4+ Person Household | 9,440 | 24.7% |
| Total Housing Units | 38,190 | 100.0% |
Occupancy by Ownership by Household Size in Rio Rancho
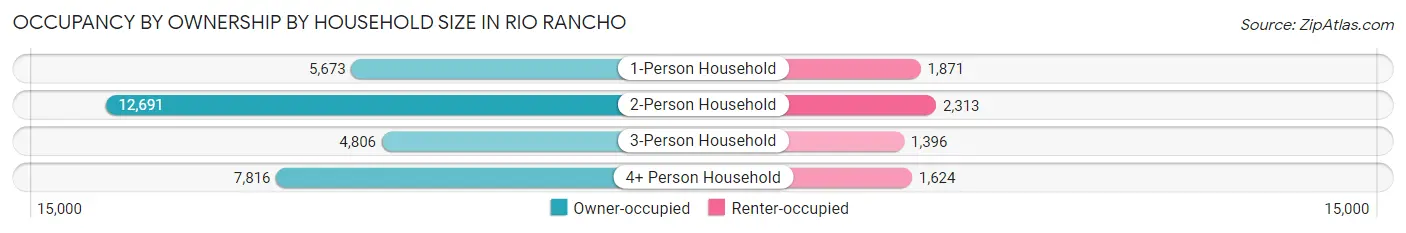
| Household Size | Owner-occupied | Renter-occupied |
| 1-Person Household | 5,673 (75.2%) | 1,871 (24.8%) |
| 2-Person Household | 12,691 (84.6%) | 2,313 (15.4%) |
| 3-Person Household | 4,806 (77.5%) | 1,396 (22.5%) |
| 4+ Person Household | 7,816 (82.8%) | 1,624 (17.2%) |
| Total Housing Units | 30,986 (81.1%) | 7,204 (18.9%) |
Occupancy by Educational Attainment in Rio Rancho
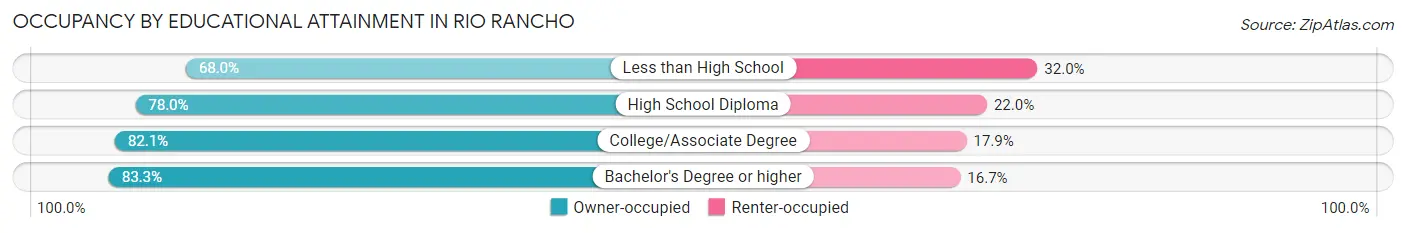
| Household Size | Owner-occupied | Renter-occupied |
| Less than High School | 1,166 (68.0%) | 548 (32.0%) |
| High School Diploma | 5,831 (78.0%) | 1,642 (22.0%) |
| College/Associate Degree | 11,631 (82.1%) | 2,537 (17.9%) |
| Bachelor's Degree or higher | 12,358 (83.3%) | 2,477 (16.7%) |
Occupancy by Age of Householder in Rio Rancho
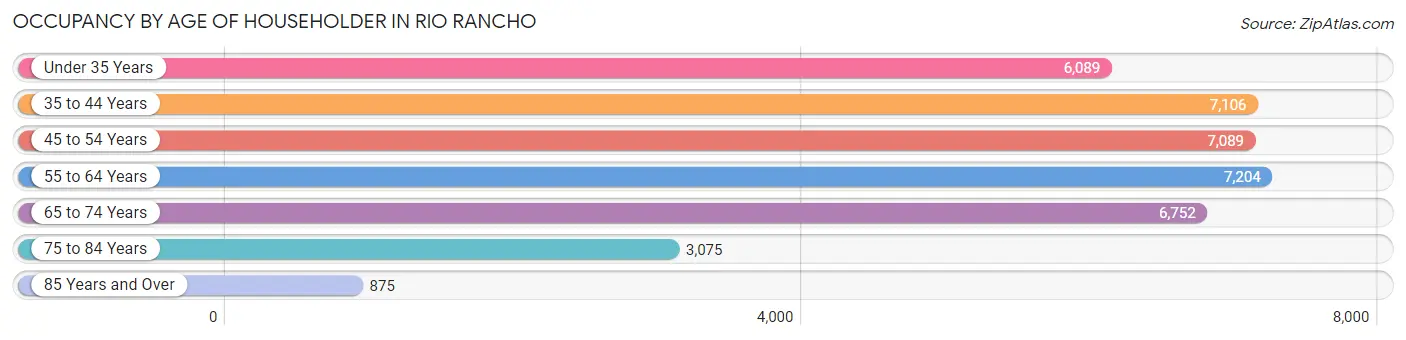
| Age Bracket | # Households | % Households |
| Under 35 Years | 6,089 | 15.9% |
| 35 to 44 Years | 7,106 | 18.6% |
| 45 to 54 Years | 7,089 | 18.6% |
| 55 to 64 Years | 7,204 | 18.9% |
| 65 to 74 Years | 6,752 | 17.7% |
| 75 to 84 Years | 3,075 | 8.1% |
| 85 Years and Over | 875 | 2.3% |
| Total | 38,190 | 100.0% |
Housing Finances in Rio Rancho
Median Income by Occupancy in Rio Rancho
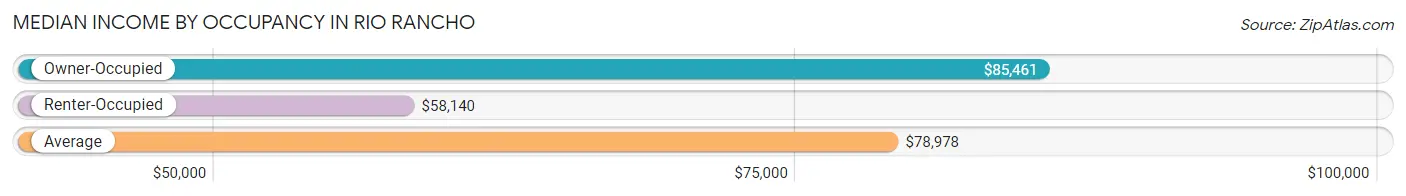
| Occupancy Type | # Households | Median Income |
| Owner-Occupied | 30,986 (81.1%) | $85,461 |
| Renter-Occupied | 7,204 (18.9%) | $58,140 |
| Average | 38,190 (100.0%) | $78,978 |
Occupancy by Householder Income Bracket in Rio Rancho
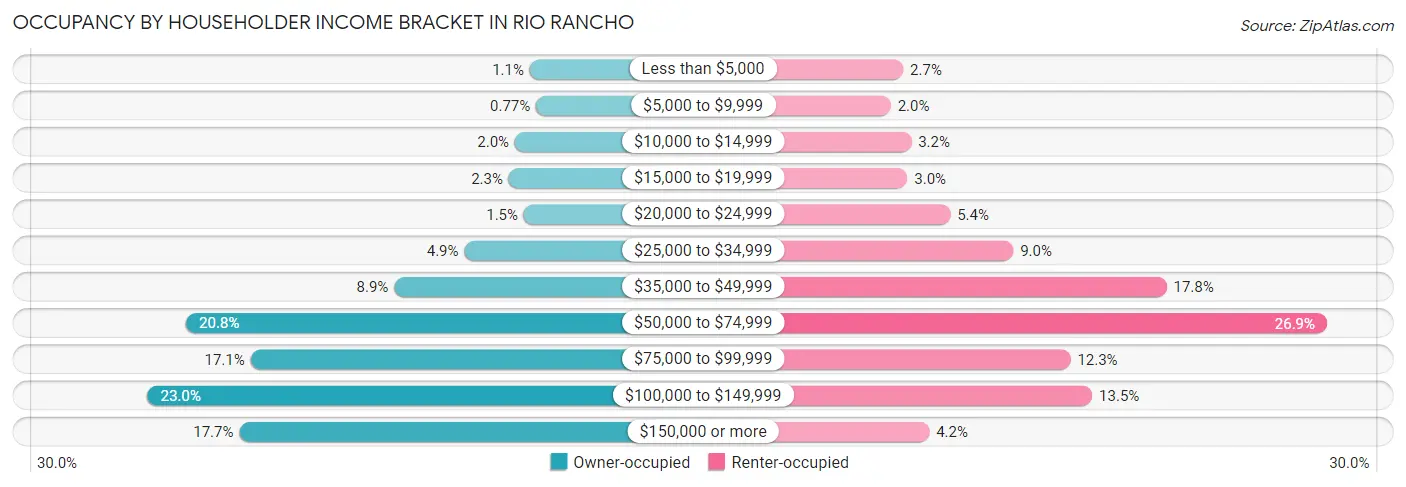
| Income Bracket | Owner-occupied | Renter-occupied |
| Less than $5,000 | 349 (1.1%) | 196 (2.7%) |
| $5,000 to $9,999 | 239 (0.8%) | 145 (2.0%) |
| $10,000 to $14,999 | 615 (2.0%) | 229 (3.2%) |
| $15,000 to $19,999 | 723 (2.3%) | 213 (3.0%) |
| $20,000 to $24,999 | 457 (1.5%) | 390 (5.4%) |
| $25,000 to $34,999 | 1,508 (4.9%) | 649 (9.0%) |
| $35,000 to $49,999 | 2,751 (8.9%) | 1,280 (17.8%) |
| $50,000 to $74,999 | 6,437 (20.8%) | 1,940 (26.9%) |
| $75,000 to $99,999 | 5,297 (17.1%) | 885 (12.3%) |
| $100,000 to $149,999 | 7,116 (23.0%) | 974 (13.5%) |
| $150,000 or more | 5,494 (17.7%) | 303 (4.2%) |
| Total | 30,986 (100.0%) | 7,204 (100.0%) |
Monthly Housing Cost Tiers in Rio Rancho
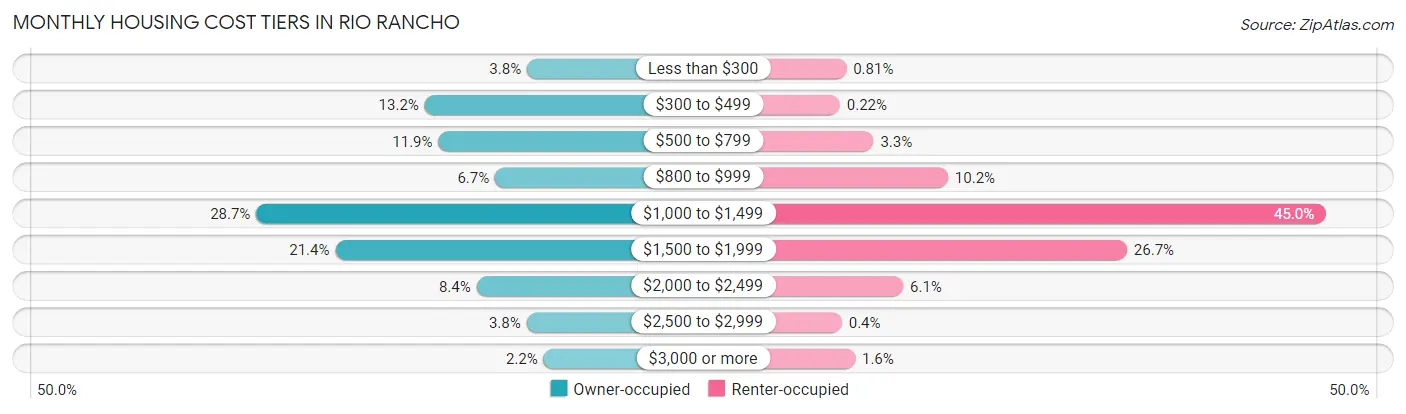
| Monthly Cost | Owner-occupied | Renter-occupied |
| Less than $300 | 1,163 (3.7%) | 58 (0.8%) |
| $300 to $499 | 4,081 (13.2%) | 16 (0.2%) |
| $500 to $799 | 3,690 (11.9%) | 239 (3.3%) |
| $800 to $999 | 2,072 (6.7%) | 733 (10.2%) |
| $1,000 to $1,499 | 8,888 (28.7%) | 3,240 (45.0%) |
| $1,500 to $1,999 | 6,630 (21.4%) | 1,920 (26.7%) |
| $2,000 to $2,499 | 2,599 (8.4%) | 436 (6.0%) |
| $2,500 to $2,999 | 1,175 (3.8%) | 29 (0.4%) |
| $3,000 or more | 688 (2.2%) | 117 (1.6%) |
| Total | 30,986 (100.0%) | 7,204 (100.0%) |
Physical Housing Characteristics in Rio Rancho
Housing Structures in Rio Rancho
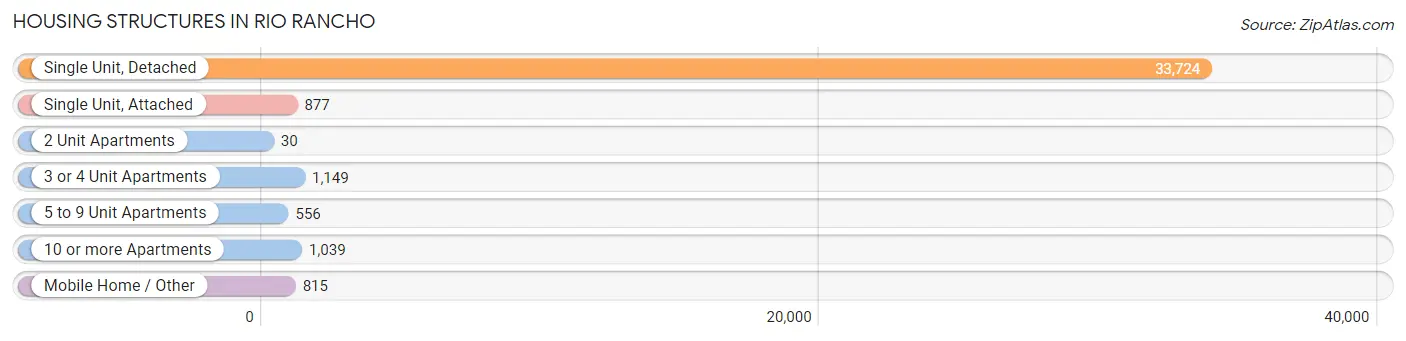
| Structure Type | # Housing Units | % Housing Units |
| Single Unit, Detached | 33,724 | 88.3% |
| Single Unit, Attached | 877 | 2.3% |
| 2 Unit Apartments | 30 | 0.1% |
| 3 or 4 Unit Apartments | 1,149 | 3.0% |
| 5 to 9 Unit Apartments | 556 | 1.5% |
| 10 or more Apartments | 1,039 | 2.7% |
| Mobile Home / Other | 815 | 2.1% |
| Total | 38,190 | 100.0% |
Housing Structures by Occupancy in Rio Rancho
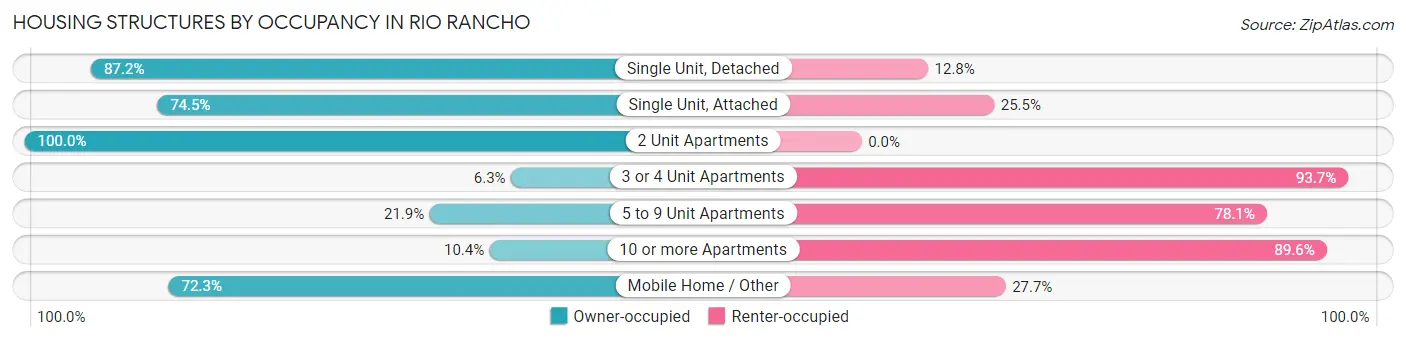
| Structure Type | Owner-occupied | Renter-occupied |
| Single Unit, Detached | 29,412 (87.2%) | 4,312 (12.8%) |
| Single Unit, Attached | 653 (74.5%) | 224 (25.5%) |
| 2 Unit Apartments | 30 (100.0%) | 0 (0.0%) |
| 3 or 4 Unit Apartments | 72 (6.3%) | 1,077 (93.7%) |
| 5 to 9 Unit Apartments | 122 (21.9%) | 434 (78.1%) |
| 10 or more Apartments | 108 (10.4%) | 931 (89.6%) |
| Mobile Home / Other | 589 (72.3%) | 226 (27.7%) |
| Total | 30,986 (81.1%) | 7,204 (18.9%) |
Housing Structures by Number of Rooms in Rio Rancho
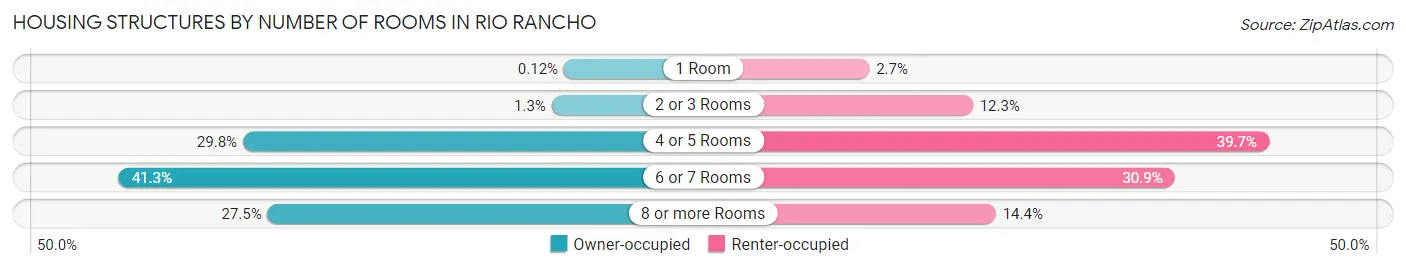
| Number of Rooms | Owner-occupied | Renter-occupied |
| 1 Room | 38 (0.1%) | 195 (2.7%) |
| 2 or 3 Rooms | 386 (1.3%) | 885 (12.3%) |
| 4 or 5 Rooms | 9,237 (29.8%) | 2,857 (39.7%) |
| 6 or 7 Rooms | 12,795 (41.3%) | 2,229 (30.9%) |
| 8 or more Rooms | 8,530 (27.5%) | 1,038 (14.4%) |
| Total | 30,986 (100.0%) | 7,204 (100.0%) |
Housing Structure by Heating Type in Rio Rancho
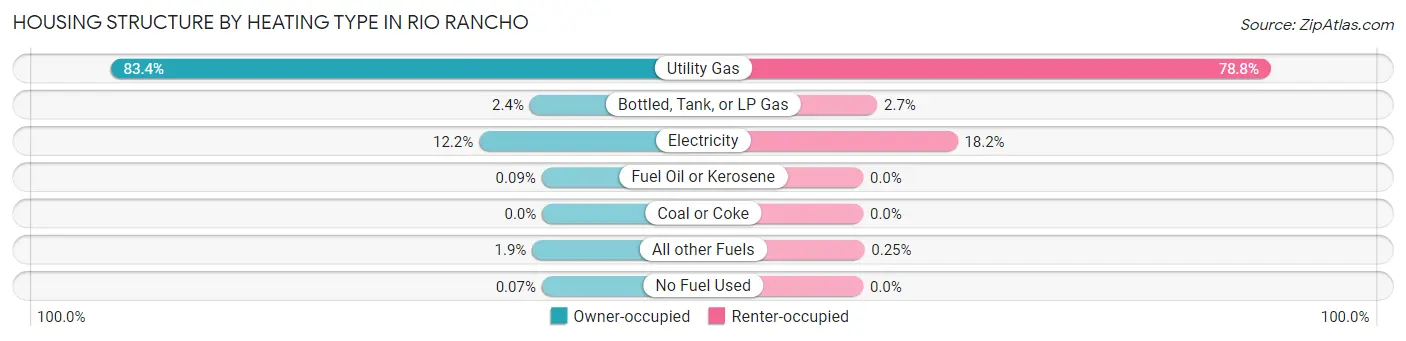
| Heating Type | Owner-occupied | Renter-occupied |
| Utility Gas | 25,829 (83.4%) | 5,676 (78.8%) |
| Bottled, Tank, or LP Gas | 740 (2.4%) | 196 (2.7%) |
| Electricity | 3,775 (12.2%) | 1,314 (18.2%) |
| Fuel Oil or Kerosene | 28 (0.1%) | 0 (0.0%) |
| Coal or Coke | 0 (0.0%) | 0 (0.0%) |
| All other Fuels | 593 (1.9%) | 18 (0.3%) |
| No Fuel Used | 21 (0.1%) | 0 (0.0%) |
| Total | 30,986 (100.0%) | 7,204 (100.0%) |
Household Vehicle Usage in Rio Rancho
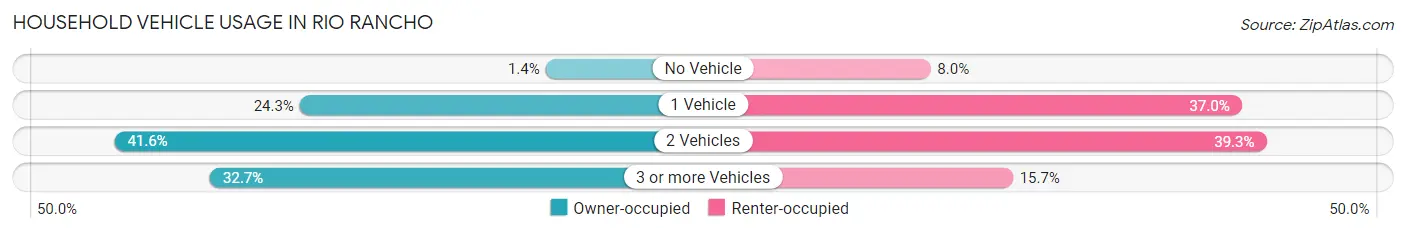
| Vehicles per Household | Owner-occupied | Renter-occupied |
| No Vehicle | 425 (1.4%) | 575 (8.0%) |
| 1 Vehicle | 7,535 (24.3%) | 2,668 (37.0%) |
| 2 Vehicles | 12,893 (41.6%) | 2,833 (39.3%) |
| 3 or more Vehicles | 10,133 (32.7%) | 1,128 (15.7%) |
| Total | 30,986 (100.0%) | 7,204 (100.0%) |
Real Estate & Mortgages in Rio Rancho
Real Estate and Mortgage Overview in Rio Rancho
| Characteristic | Without Mortgage | With Mortgage |
| Housing Units | 8,832 | 22,154 |
| Median Property Value | $236,300 | $250,300 |
| Median Household Income | $70,134 | $4,142 |
| Monthly Housing Costs | $475 | $664 |
| Real Estate Taxes | $1,881 | $907 |
Property Value by Mortgage Status in Rio Rancho
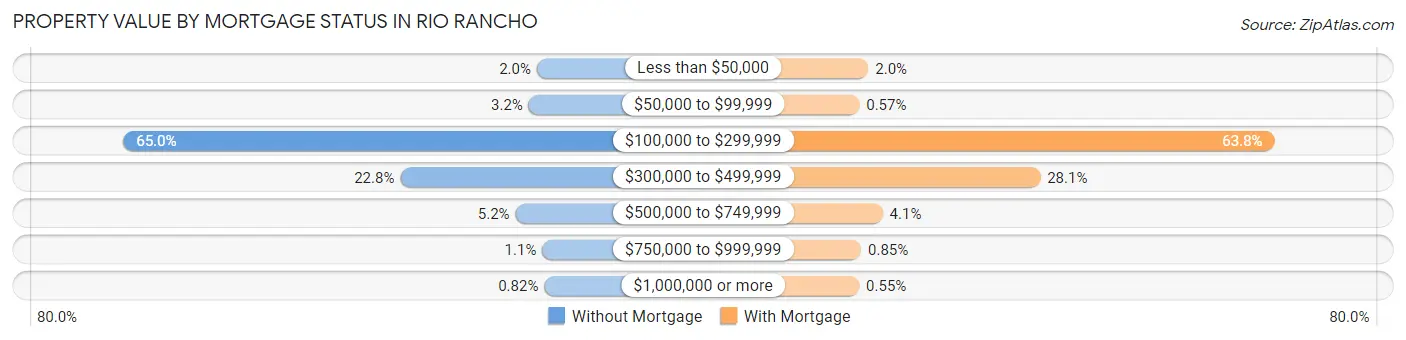
| Property Value | Without Mortgage | With Mortgage |
| Less than $50,000 | 172 (1.9%) | 432 (1.9%) |
| $50,000 to $99,999 | 282 (3.2%) | 127 (0.6%) |
| $100,000 to $299,999 | 5,737 (65.0%) | 14,138 (63.8%) |
| $300,000 to $499,999 | 2,010 (22.8%) | 6,234 (28.1%) |
| $500,000 to $749,999 | 460 (5.2%) | 914 (4.1%) |
| $750,000 to $999,999 | 99 (1.1%) | 188 (0.9%) |
| $1,000,000 or more | 72 (0.8%) | 121 (0.5%) |
| Total | 8,832 (100.0%) | 22,154 (100.0%) |
Household Income by Mortgage Status in Rio Rancho
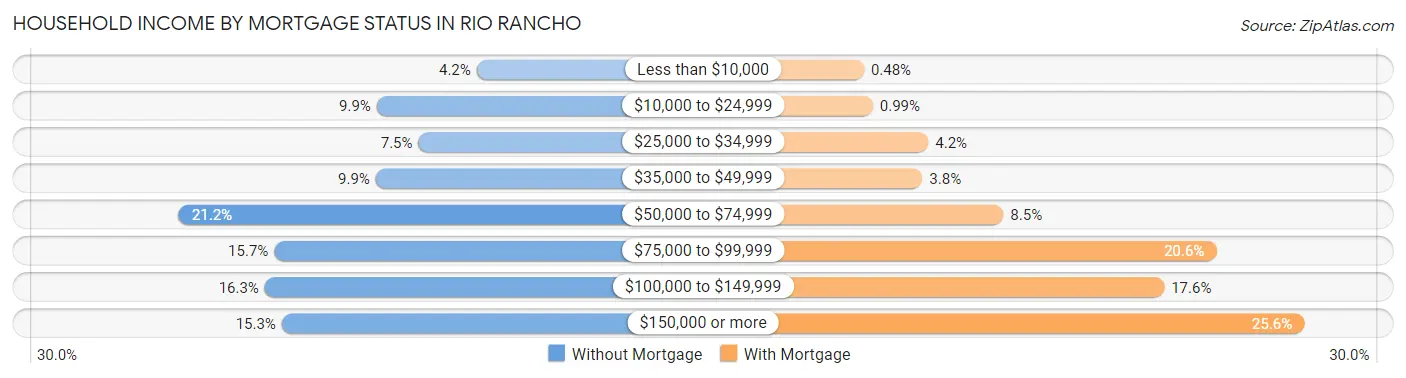
| Household Income | Without Mortgage | With Mortgage |
| Less than $10,000 | 368 (4.2%) | 106 (0.5%) |
| $10,000 to $24,999 | 873 (9.9%) | 220 (1.0%) |
| $25,000 to $34,999 | 662 (7.5%) | 922 (4.2%) |
| $35,000 to $49,999 | 878 (9.9%) | 846 (3.8%) |
| $50,000 to $74,999 | 1,871 (21.2%) | 1,873 (8.5%) |
| $75,000 to $99,999 | 1,390 (15.7%) | 4,566 (20.6%) |
| $100,000 to $149,999 | 1,438 (16.3%) | 3,907 (17.6%) |
| $150,000 or more | 1,352 (15.3%) | 5,678 (25.6%) |
| Total | 8,832 (100.0%) | 22,154 (100.0%) |
Property Value to Household Income Ratio in Rio Rancho
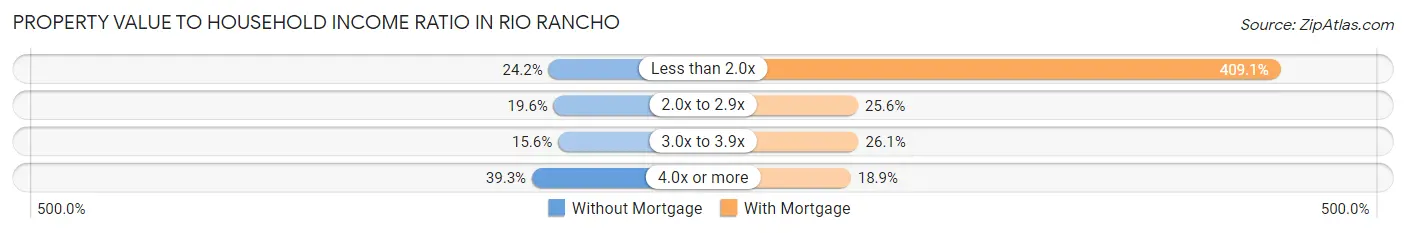
| Value-to-Income Ratio | Without Mortgage | With Mortgage |
| Less than 2.0x | 2,138 (24.2%) | 90,632 (409.1%) |
| 2.0x to 2.9x | 1,730 (19.6%) | 5,665 (25.6%) |
| 3.0x to 3.9x | 1,380 (15.6%) | 5,774 (26.1%) |
| 4.0x or more | 3,474 (39.3%) | 4,194 (18.9%) |
| Total | 8,832 (100.0%) | 22,154 (100.0%) |
Real Estate Taxes by Mortgage Status in Rio Rancho
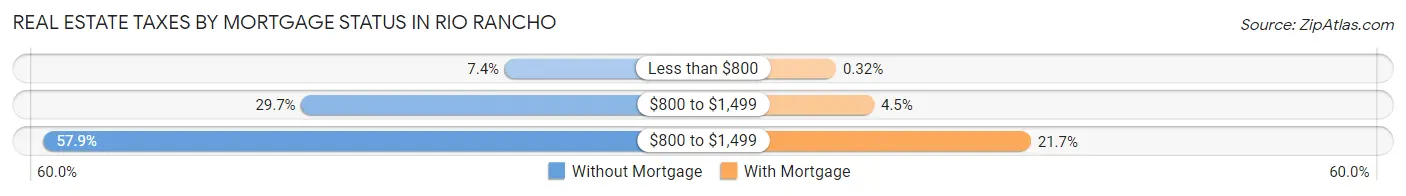
| Property Taxes | Without Mortgage | With Mortgage |
| Less than $800 | 650 (7.4%) | 71 (0.3%) |
| $800 to $1,499 | 2,620 (29.7%) | 995 (4.5%) |
| $800 to $1,499 | 5,115 (57.9%) | 4,801 (21.7%) |
| Total | 8,832 (100.0%) | 22,154 (100.0%) |
Health & Disability in Rio Rancho
Health Insurance Coverage by Age in Rio Rancho
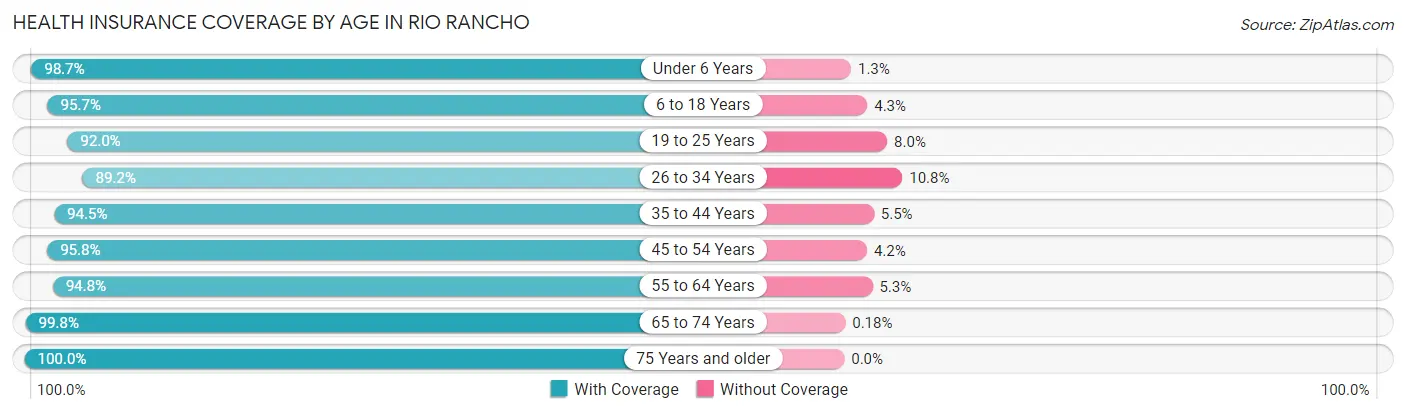
| Age Bracket | With Coverage | Without Coverage |
| Under 6 Years | 6,421 (98.7%) | 82 (1.3%) |
| 6 to 18 Years | 18,871 (95.7%) | 846 (4.3%) |
| 19 to 25 Years | 7,607 (92.0%) | 661 (8.0%) |
| 26 to 34 Years | 10,696 (89.2%) | 1,298 (10.8%) |
| 35 to 44 Years | 13,313 (94.5%) | 777 (5.5%) |
| 45 to 54 Years | 12,224 (95.8%) | 540 (4.2%) |
| 55 to 64 Years | 12,452 (94.8%) | 690 (5.2%) |
| 65 to 74 Years | 11,232 (99.8%) | 20 (0.2%) |
| 75 Years and older | 6,111 (100.0%) | 0 (0.0%) |
| Total | 98,927 (95.3%) | 4,914 (4.7%) |
Health Insurance Coverage by Citizenship Status in Rio Rancho
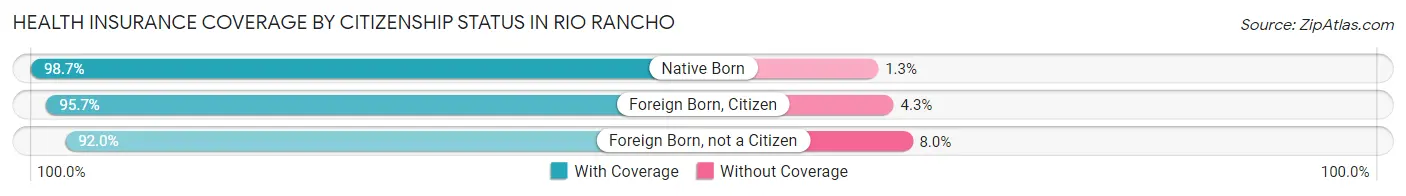
| Citizenship Status | With Coverage | Without Coverage |
| Native Born | 6,421 (98.7%) | 82 (1.3%) |
| Foreign Born, Citizen | 18,871 (95.7%) | 846 (4.3%) |
| Foreign Born, not a Citizen | 7,607 (92.0%) | 661 (8.0%) |
Health Insurance Coverage by Household Income in Rio Rancho
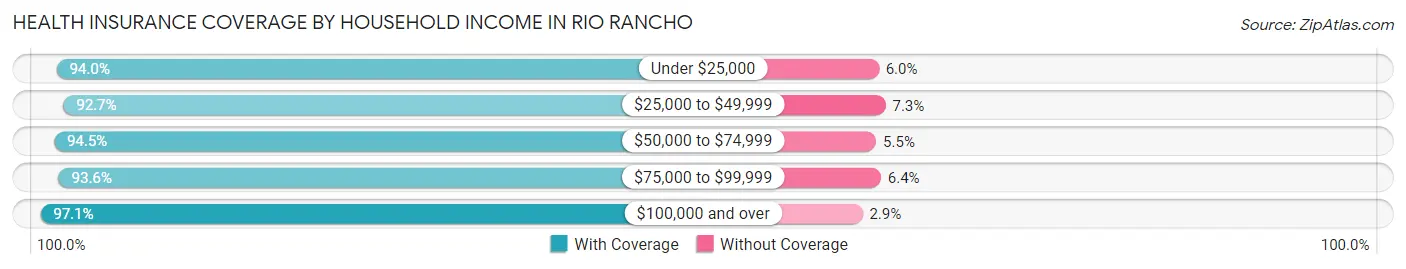
| Household Income | With Coverage | Without Coverage |
| Under $25,000 | 5,726 (94.0%) | 364 (6.0%) |
| $25,000 to $49,999 | 12,760 (92.7%) | 999 (7.3%) |
| $50,000 to $74,999 | 17,801 (94.5%) | 1,036 (5.5%) |
| $75,000 to $99,999 | 16,124 (93.6%) | 1,098 (6.4%) |
| $100,000 and over | 46,240 (97.1%) | 1,400 (2.9%) |
Public vs Private Health Insurance Coverage by Age in Rio Rancho
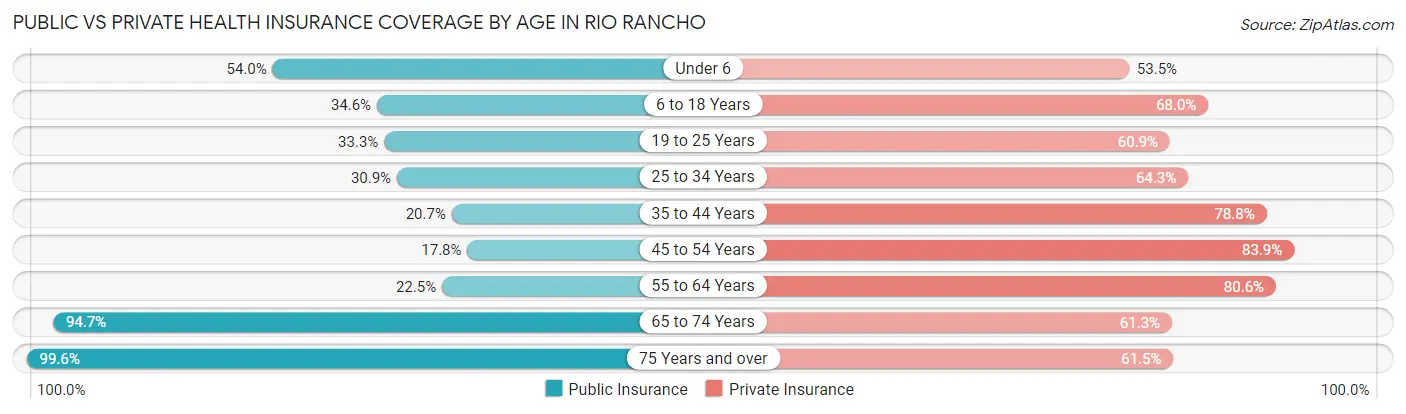
| Age Bracket | Public Insurance | Private Insurance |
| Under 6 | 3,510 (54.0%) | 3,478 (53.5%) |
| 6 to 18 Years | 6,822 (34.6%) | 13,408 (68.0%) |
| 19 to 25 Years | 2,750 (33.3%) | 5,035 (60.9%) |
| 25 to 34 Years | 3,705 (30.9%) | 7,708 (64.3%) |
| 35 to 44 Years | 2,920 (20.7%) | 11,106 (78.8%) |
| 45 to 54 Years | 2,274 (17.8%) | 10,713 (83.9%) |
| 55 to 64 Years | 2,961 (22.5%) | 10,588 (80.6%) |
| 65 to 74 Years | 10,659 (94.7%) | 6,894 (61.3%) |
| 75 Years and over | 6,089 (99.6%) | 3,761 (61.5%) |
| Total | 41,690 (40.2%) | 72,691 (70.0%) |
Disability Status by Sex by Age in Rio Rancho
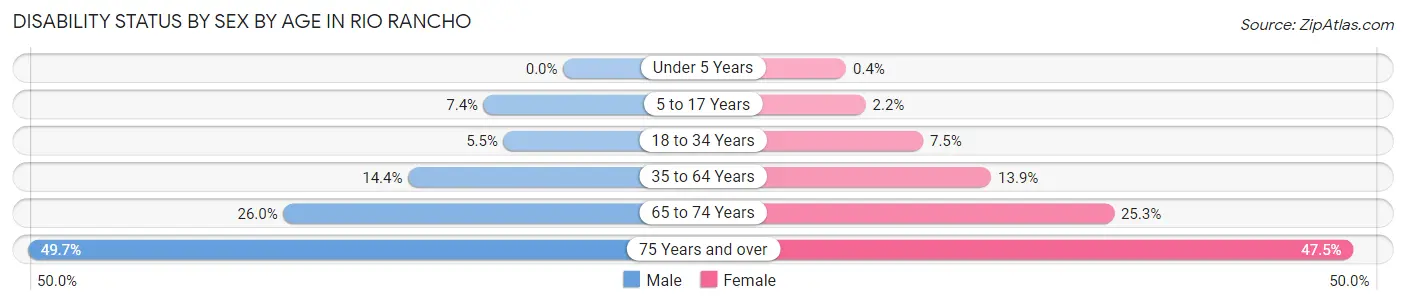
| Age Bracket | Male | Female |
| Under 5 Years | 0 (0.0%) | 11 (0.4%) |
| 5 to 17 Years | 761 (7.4%) | 211 (2.2%) |
| 18 to 34 Years | 599 (5.5%) | 788 (7.5%) |
| 35 to 64 Years | 2,797 (14.4%) | 2,849 (13.9%) |
| 65 to 74 Years | 1,415 (26.0%) | 1,466 (25.3%) |
| 75 Years and over | 1,312 (49.7%) | 1,648 (47.5%) |
Disability Class by Sex by Age in Rio Rancho
Disability Class: Hearing Difficulty
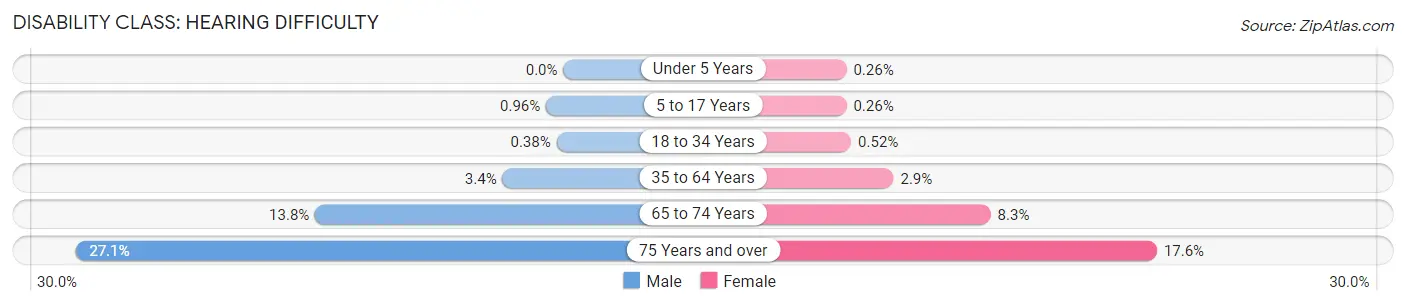
| Age Bracket | Male | Female |
| Under 5 Years | 0 (0.0%) | 7 (0.3%) |
| 5 to 17 Years | 99 (1.0%) | 25 (0.3%) |
| 18 to 34 Years | 41 (0.4%) | 54 (0.5%) |
| 35 to 64 Years | 659 (3.4%) | 593 (2.9%) |
| 65 to 74 Years | 753 (13.8%) | 481 (8.3%) |
| 75 Years and over | 716 (27.1%) | 609 (17.5%) |
Disability Class: Vision Difficulty
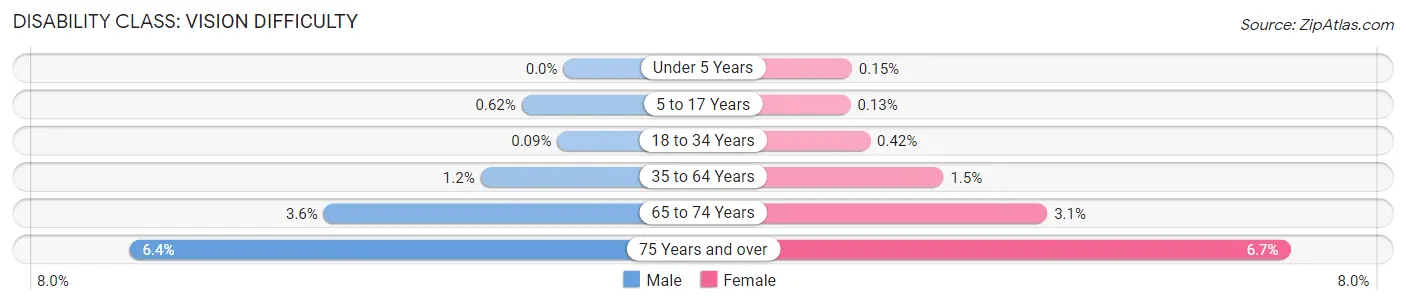
| Age Bracket | Male | Female |
| Under 5 Years | 0 (0.0%) | 4 (0.2%) |
| 5 to 17 Years | 64 (0.6%) | 12 (0.1%) |
| 18 to 34 Years | 10 (0.1%) | 44 (0.4%) |
| 35 to 64 Years | 240 (1.2%) | 311 (1.5%) |
| 65 to 74 Years | 194 (3.6%) | 177 (3.0%) |
| 75 Years and over | 170 (6.4%) | 231 (6.7%) |
Disability Class: Cognitive Difficulty
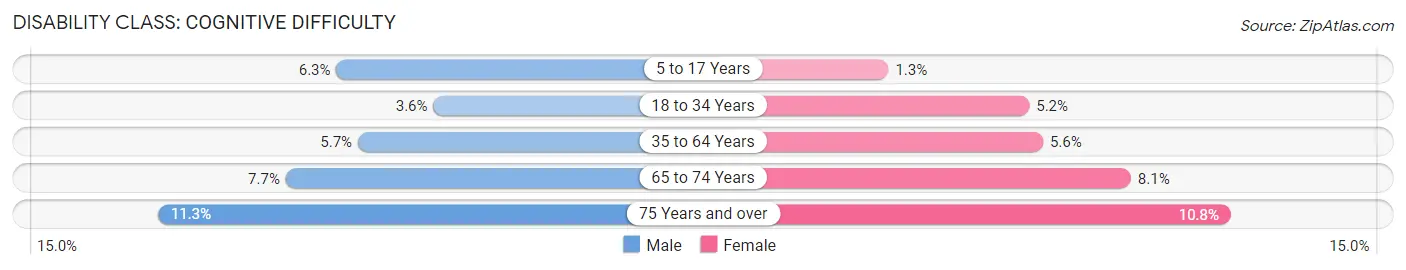
| Age Bracket | Male | Female |
| 5 to 17 Years | 652 (6.3%) | 124 (1.3%) |
| 18 to 34 Years | 392 (3.6%) | 545 (5.2%) |
| 35 to 64 Years | 1,111 (5.7%) | 1,151 (5.6%) |
| 65 to 74 Years | 421 (7.7%) | 467 (8.1%) |
| 75 Years and over | 298 (11.3%) | 376 (10.8%) |
Disability Class: Ambulatory Difficulty
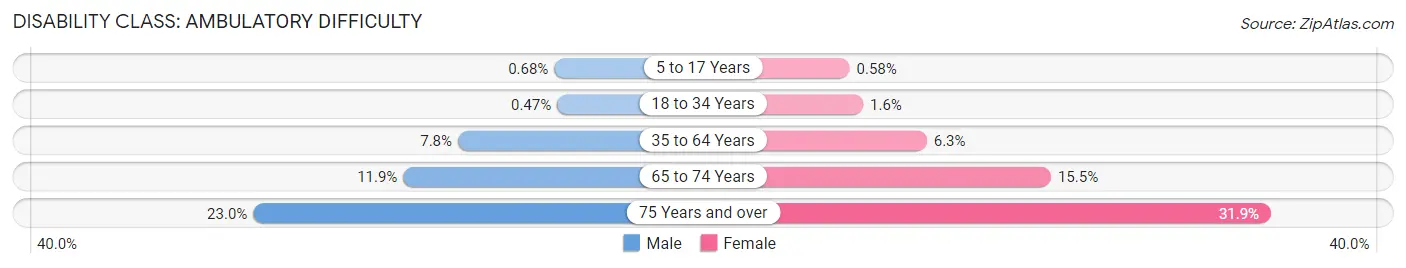
| Age Bracket | Male | Female |
| 5 to 17 Years | 70 (0.7%) | 55 (0.6%) |
| 18 to 34 Years | 51 (0.5%) | 165 (1.6%) |
| 35 to 64 Years | 1,522 (7.8%) | 1,297 (6.3%) |
| 65 to 74 Years | 648 (11.9%) | 901 (15.5%) |
| 75 Years and over | 608 (23.0%) | 1,106 (31.9%) |
Disability Class: Self-Care Difficulty
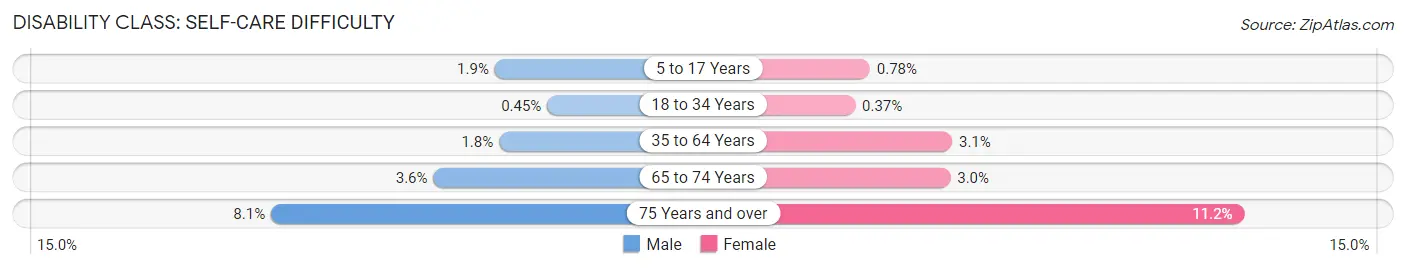
| Age Bracket | Male | Female |
| 5 to 17 Years | 197 (1.9%) | 74 (0.8%) |
| 18 to 34 Years | 49 (0.4%) | 39 (0.4%) |
| 35 to 64 Years | 347 (1.8%) | 631 (3.1%) |
| 65 to 74 Years | 197 (3.6%) | 175 (3.0%) |
| 75 Years and over | 215 (8.1%) | 389 (11.2%) |
Technology Access in Rio Rancho
Computing Device Access in Rio Rancho
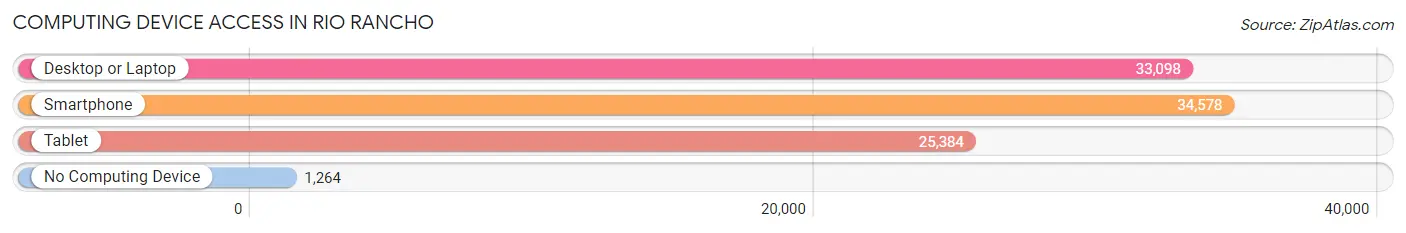
| Device Type | # Households | % Households |
| Desktop or Laptop | 33,098 | 86.7% |
| Smartphone | 34,578 | 90.5% |
| Tablet | 25,384 | 66.5% |
| No Computing Device | 1,264 | 3.3% |
| Total | 38,190 | 100.0% |
Internet Access in Rio Rancho
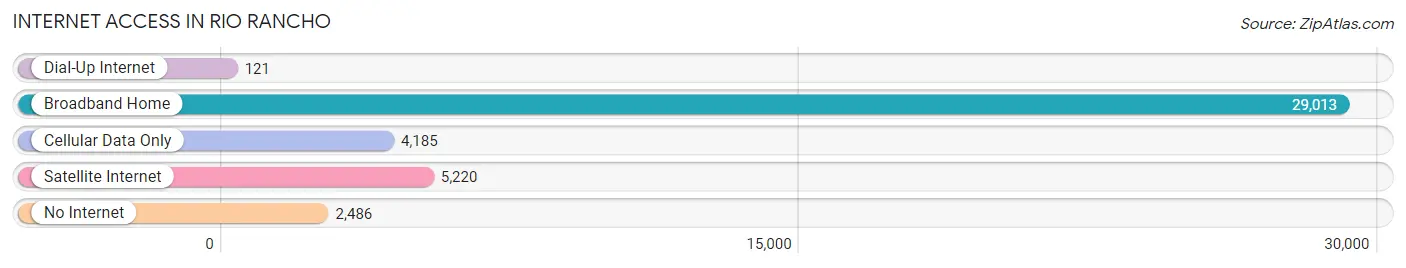
| Internet Type | # Households | % Households |
| Dial-Up Internet | 121 | 0.3% |
| Broadband Home | 29,013 | 76.0% |
| Cellular Data Only | 4,185 | 11.0% |
| Satellite Internet | 5,220 | 13.7% |
| No Internet | 2,486 | 6.5% |
| Total | 38,190 | 100.0% |
Rio Rancho Summary
Rio Rancho is a city located in Sandoval County, New Mexico, United States. It is the largest city and economic hub of the Albuquerque metropolitan area. As of the 2010 census, the city had a population of 87,521, making it the third-largest city in New Mexico. It is the fastest-growing city in the state, with a population growth rate of over 20% since 2000.
History
Rio Rancho was founded in 1961 by real estate developer Samuel Stamm. He purchased a large tract of land in the area and began to develop it as a planned community. The city was incorporated in 1981 and has since grown rapidly.
Geography
Rio Rancho is located in the Rio Grande Valley, in the northern part of Sandoval County. It is bordered by the city of Albuquerque to the east and the city of Bernalillo to the south. The city covers an area of approximately 94 square miles and is situated at an elevation of 5,400 feet.
The city is located in the Rio Grande Valley, which is a major agricultural region. The Rio Grande River runs through the city, providing irrigation for the area's farms and ranches. The city is also home to several parks and recreational areas, including the Rio Rancho Sports Complex, the Rio Rancho Aquatic Center, and the Rio Rancho Nature Center.
Economy
Rio Rancho is the economic hub of the Albuquerque metropolitan area. The city is home to several major employers, including Intel, Presbyterian Healthcare Services, and the University of New Mexico. The city also has a thriving retail sector, with several shopping centers and malls.
The city's economy is also supported by its tourism industry. The city is home to several attractions, including the Rio Grande Zoo, the New Mexico Museum of Natural History and Science, and the Sandia Peak Tramway.
Demographics
As of the 2010 census, the city had a population of 87,521. The racial makeup of the city was 73.3% White, 2.2% African American, 1.2% Native American, 1.7% Asian, 0.1% Pacific Islander, 17.7% from other races, and 4.0% from two or more races. Hispanic or Latino of any race were 44.3% of the population.
The median income for a household in the city was $50,945, and the median income for a family was $60,945. The per capita income for the city was $25,945. About 11.2% of families and 14.3% of the population were below the poverty line, including 19.2% of those under age 18 and 8.2% of those age 65 or over.
Conclusion
Rio Rancho is a rapidly growing city located in Sandoval County, New Mexico. It is the largest city and economic hub of the Albuquerque metropolitan area. The city was founded in 1961 and has since grown rapidly, with a population growth rate of over 20% since 2000. The city is home to several major employers, including Intel, Presbyterian Healthcare Services, and the University of New Mexico. The city also has a thriving tourism industry, with several attractions, including the Rio Grande Zoo, the New Mexico Museum of Natural History and Science, and the Sandia Peak Tramway. As of the 2010 census, the city had a population of 87,521, with a median household income of $50,945.
Common Questions
What is Per Capita Income in Rio Rancho?
Per Capita income in Rio Rancho is $36,247.
What is the Median Family Income in Rio Rancho?
Median Family Income in Rio Rancho is $86,077.
What is the Median Household income in Rio Rancho?
Median Household Income in Rio Rancho is $78,978.
What is Income or Wage Gap in Rio Rancho?
Income or Wage Gap in Rio Rancho is 27.6%.
Women in Rio Rancho earn 72.4 cents for every dollar earned by a man.
What is Family Income Deficit in Rio Rancho?
Family Income Deficit in Rio Rancho is $9,308.
Families that are below poverty line in Rio Rancho earn $9,308 less on average than the poverty threshold level.
What is Inequality or Gini Index in Rio Rancho?
Inequality or Gini Index in Rio Rancho is 0.38.
What is the Total Population of Rio Rancho?
Total Population of Rio Rancho is 104,351.
What is the Total Male Population of Rio Rancho?
Total Male Population of Rio Rancho is 51,573.
What is the Total Female Population of Rio Rancho?
Total Female Population of Rio Rancho is 52,778.
What is the Ratio of Males per 100 Females in Rio Rancho?
There are 97.72 Males per 100 Females in Rio Rancho.
What is the Ratio of Females per 100 Males in Rio Rancho?
There are 102.34 Females per 100 Males in Rio Rancho.
What is the Median Population Age in Rio Rancho?
Median Population Age in Rio Rancho is 39.0 Years.
What is the Average Family Size in Rio Rancho
Average Family Size in Rio Rancho is 3.1 People.
What is the Average Household Size in Rio Rancho
Average Household Size in Rio Rancho is 2.7 People.
How Large is the Labor Force in Rio Rancho?
There are 51,419 People in the Labor Forcein in Rio Rancho.
What is the Percentage of People in the Labor Force in Rio Rancho?
62.4% of People are in the Labor Force in Rio Rancho.
What is the Unemployment Rate in Rio Rancho?
Unemployment Rate in Rio Rancho is 5.5%.