Lac Du Flambeau, WI Map & Demographics
Lac Du Flambeau Map
Lac Du Flambeau Overview
$18,396
PER CAPITA INCOME
$41,750
AVG FAMILY INCOME
$29,375
AVG HOUSEHOLD INCOME
14.9%
WAGE / INCOME GAP [ % ]
85.1¢/ $1
WAGE / INCOME GAP [ $ ]
0.47
INEQUALITY / GINI INDEX
1,755
TOTAL POPULATION
921
MALE POPULATION
834
FEMALE POPULATION
110.43
MALES / 100 FEMALES
90.55
FEMALES / 100 MALES
29.1
MEDIAN AGE
3.5
AVG FAMILY SIZE
2.5
AVG HOUSEHOLD SIZE
770
LABOR FORCE [ PEOPLE ]
66.3%
PERCENT IN LABOR FORCE
10.8%
UNEMPLOYMENT RATE
Lac Du Flambeau Zip Codes
Lac Du Flambeau Area Codes
Income in Lac Du Flambeau
Income Overview in Lac Du Flambeau
Per Capita Income in Lac Du Flambeau is $18,396, while median incomes of families and households are $41,750 and $29,375 respectively.
| Characteristic | Number | Measure |
| Per Capita Income | 1,755 | $18,396 |
| Median Family Income | 356 | $41,750 |
| Mean Family Income | 356 | $54,128 |
| Median Household Income | 704 | $29,375 |
| Mean Household Income | 704 | $45,099 |
| Income Deficit | 356 | $0 |
| Wage / Income Gap (%) | 1,755 | 14.93% |
| Wage / Income Gap ($) | 1,755 | 85.07¢ per $1 |
| Gini / Inequality Index | 1,755 | 0.47 |
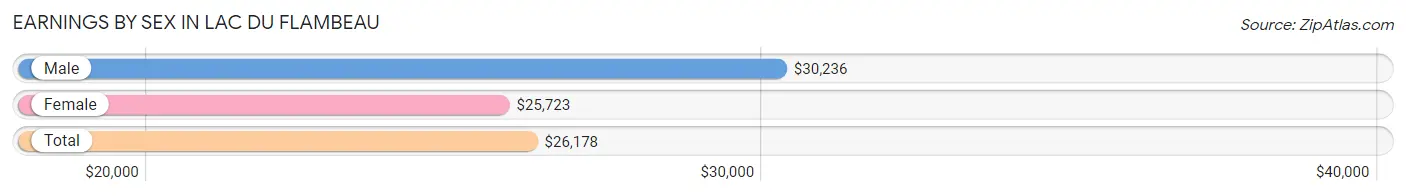
Earnings by Sex in Lac Du Flambeau
Average Earnings in Lac Du Flambeau are $26,178, $30,236 for men and $25,723 for women, a difference of 14.9%.
| Sex | Number | Average Earnings |
| Male | 395 (51.4%) | $30,236 |
| Female | 374 (48.6%) | $25,723 |
| Total | 769 (100.0%) | $26,178 |
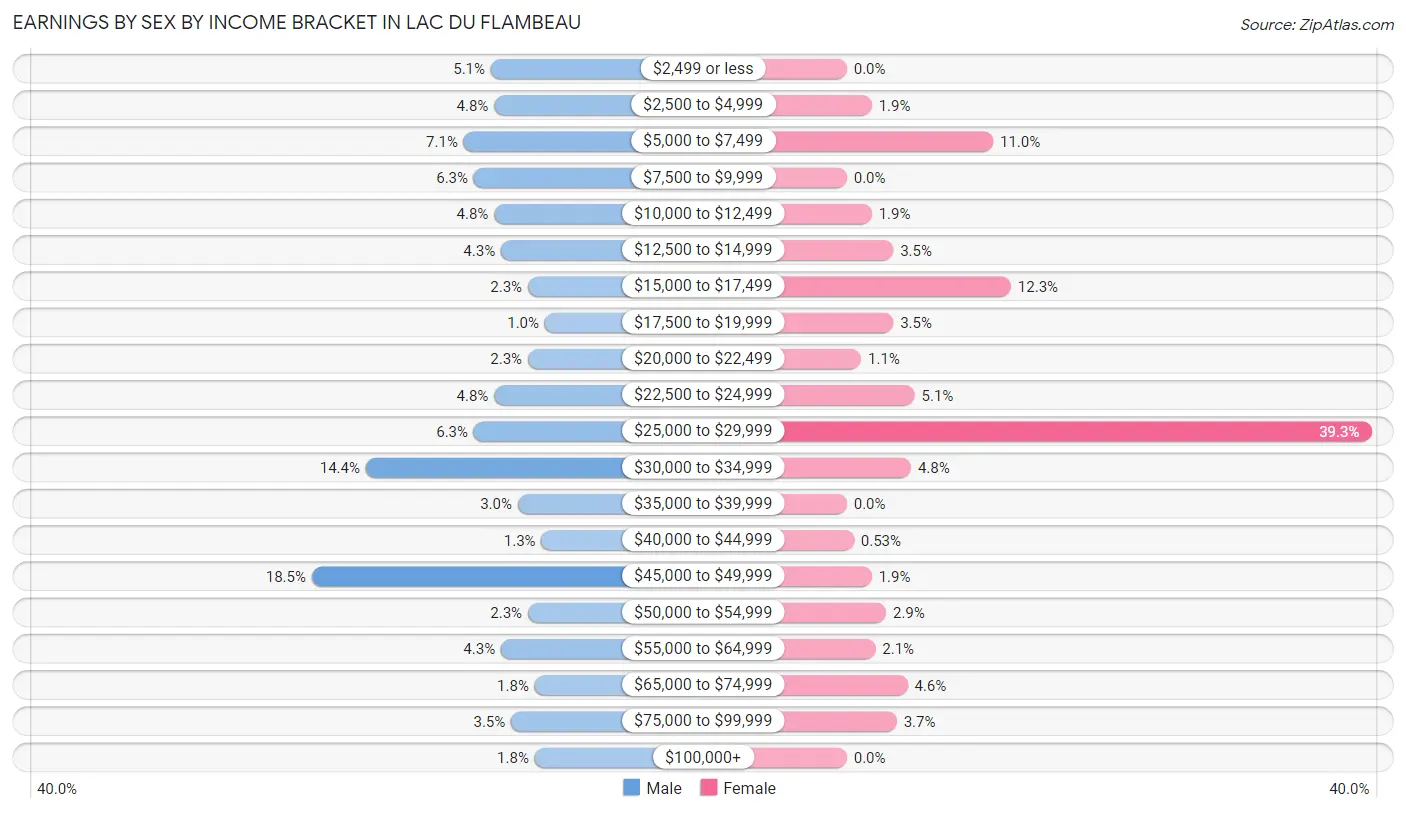
Earnings by Sex by Income Bracket in Lac Du Flambeau
The most common earnings brackets in Lac Du Flambeau are $45,000 to $49,999 for men (73 | 18.5%) and $25,000 to $29,999 for women (147 | 39.3%).
| Income | Male | Female |
| $2,499 or less | 20 (5.1%) | 0 (0.0%) |
| $2,500 to $4,999 | 19 (4.8%) | 7 (1.9%) |
| $5,000 to $7,499 | 28 (7.1%) | 41 (11.0%) |
| $7,500 to $9,999 | 25 (6.3%) | 0 (0.0%) |
| $10,000 to $12,499 | 19 (4.8%) | 7 (1.9%) |
| $12,500 to $14,999 | 17 (4.3%) | 13 (3.5%) |
| $15,000 to $17,499 | 9 (2.3%) | 46 (12.3%) |
| $17,500 to $19,999 | 4 (1.0%) | 13 (3.5%) |
| $20,000 to $22,499 | 9 (2.3%) | 4 (1.1%) |
| $22,500 to $24,999 | 19 (4.8%) | 19 (5.1%) |
| $25,000 to $29,999 | 25 (6.3%) | 147 (39.3%) |
| $30,000 to $34,999 | 57 (14.4%) | 18 (4.8%) |
| $35,000 to $39,999 | 12 (3.0%) | 0 (0.0%) |
| $40,000 to $44,999 | 5 (1.3%) | 2 (0.5%) |
| $45,000 to $49,999 | 73 (18.5%) | 7 (1.9%) |
| $50,000 to $54,999 | 9 (2.3%) | 11 (2.9%) |
| $55,000 to $64,999 | 17 (4.3%) | 8 (2.1%) |
| $65,000 to $74,999 | 7 (1.8%) | 17 (4.5%) |
| $75,000 to $99,999 | 14 (3.5%) | 14 (3.7%) |
| $100,000+ | 7 (1.8%) | 0 (0.0%) |
| Total | 395 (100.0%) | 374 (100.0%) |
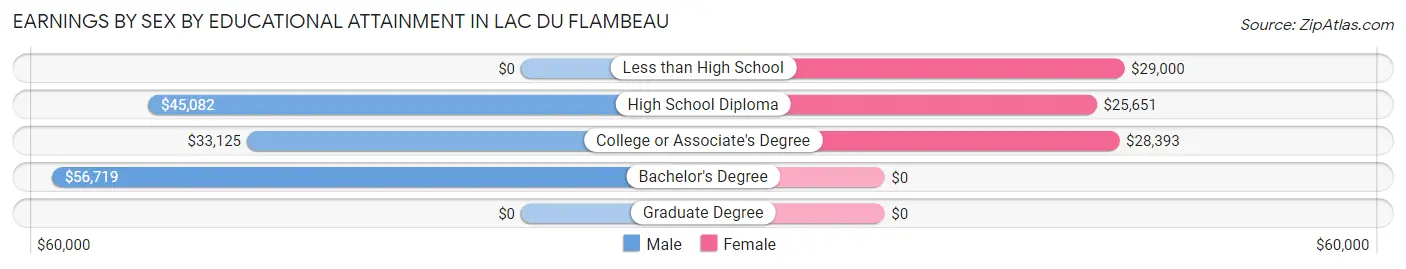
Earnings by Sex by Educational Attainment in Lac Du Flambeau
Average earnings in Lac Du Flambeau are $33,813 for men and $25,791 for women, a difference of 23.7%. Men with an educational attainment of bachelor's degree enjoy the highest average annual earnings of $56,719, while those with college or associate's degree education earn the least with $33,125. Women with an educational attainment of less than high school earn the most with the average annual earnings of $29,000, while those with high school diploma education have the smallest earnings of $25,651.
| Educational Attainment | Male Income | Female Income |
| Less than High School | - | - |
| High School Diploma | $45,082 | $25,651 |
| College or Associate's Degree | $33,125 | $28,393 |
| Bachelor's Degree | $56,719 | $0 |
| Graduate Degree | - | - |
| Total | $33,813 | $25,791 |
Family Income in Lac Du Flambeau
Family Income Brackets in Lac Du Flambeau
According to the Lac Du Flambeau family income data, there are 96 families falling into the $50,000 to $74,999 income range, which is the most common income bracket and makes up 27.0% of all families. Conversely, the $150,000 to $199,999 income bracket is the least frequent group with only 2 families (0.6%) belonging to this category.
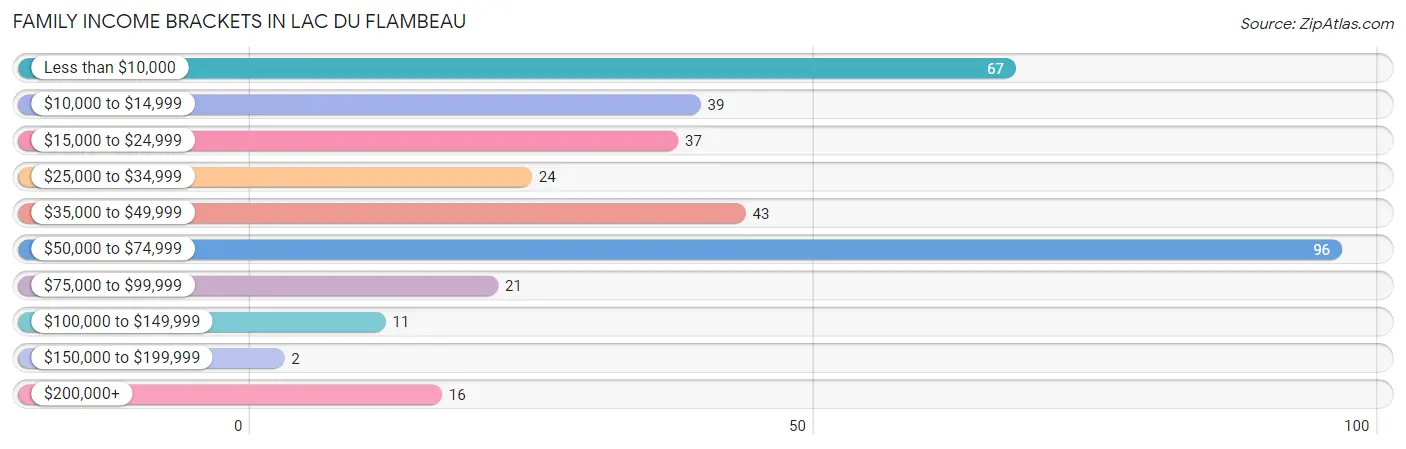
| Income Bracket | # Families | % Families |
| Less than $10,000 | 67 | 18.8% |
| $10,000 to $14,999 | 39 | 11.0% |
| $15,000 to $24,999 | 37 | 10.4% |
| $25,000 to $34,999 | 24 | 6.7% |
| $35,000 to $49,999 | 43 | 12.1% |
| $50,000 to $74,999 | 96 | 27.0% |
| $75,000 to $99,999 | 21 | 5.9% |
| $100,000 to $149,999 | 11 | 3.1% |
| $150,000 to $199,999 | 2 | 0.6% |
| $200,000+ | 16 | 4.5% |
Family Income by Famaliy Size in Lac Du Flambeau
2-person families (237 | 66.6%) account for the highest median family income in Lac Du Flambeau with $43,125 per family, while 2-person families (237 | 66.6%) have the highest median income of $21,562 per family member.
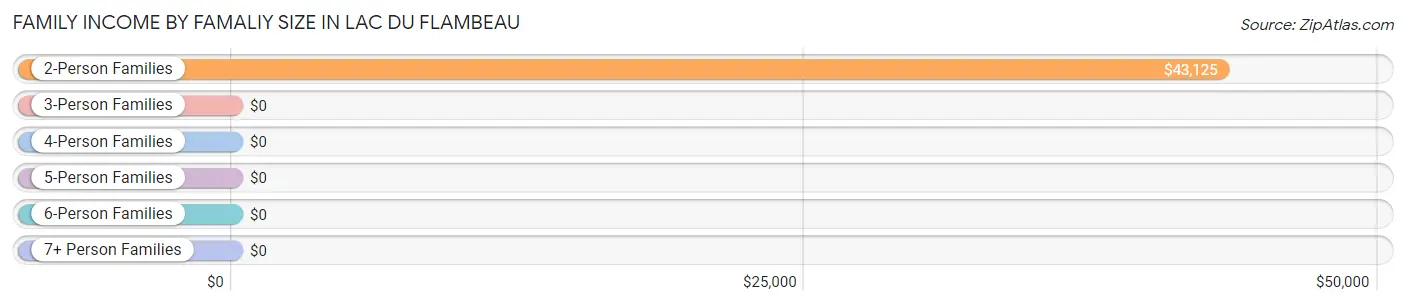
| Income Bracket | # Families | Median Income |
| 2-Person Families | 237 (66.6%) | $43,125 |
| 3-Person Families | 93 (26.1%) | $0 |
| 4-Person Families | 13 (3.6%) | $0 |
| 5-Person Families | 9 (2.5%) | $0 |
| 6-Person Families | 0 (0.0%) | $0 |
| 7+ Person Families | 4 (1.1%) | $0 |
| Total | 356 (100.0%) | $41,750 |
Family Income by Number of Earners in Lac Du Flambeau
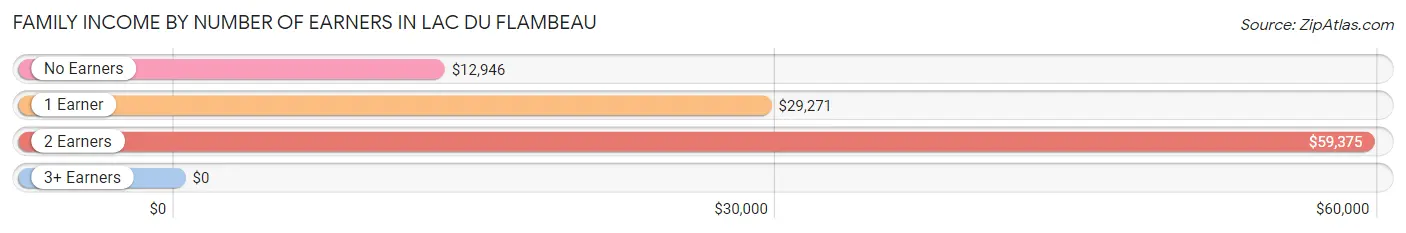
| Number of Earners | # Families | Median Income |
| No Earners | 96 (27.0%) | $12,946 |
| 1 Earner | 137 (38.5%) | $29,271 |
| 2 Earners | 114 (32.0%) | $59,375 |
| 3+ Earners | 9 (2.5%) | $0 |
| Total | 356 (100.0%) | $41,750 |
Household Income in Lac Du Flambeau
Household Income Brackets in Lac Du Flambeau
With 162 households falling in the category, the $25,000 to $34,999 income range is the most frequent in Lac Du Flambeau, accounting for 23.0% of all households. In contrast, only 2 households (0.3%) fall into the $150,000 to $199,999 income bracket, making it the least populous group.
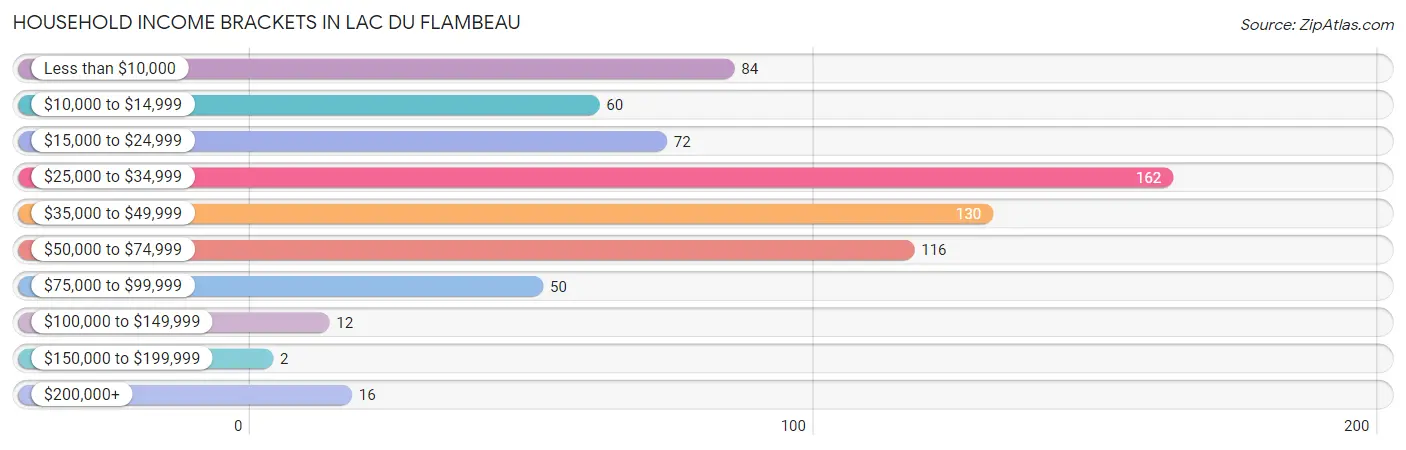
| Income Bracket | # Households | % Households |
| Less than $10,000 | 84 | 11.9% |
| $10,000 to $14,999 | 60 | 8.5% |
| $15,000 to $24,999 | 72 | 10.2% |
| $25,000 to $34,999 | 162 | 23.0% |
| $35,000 to $49,999 | 130 | 18.5% |
| $50,000 to $74,999 | 116 | 16.5% |
| $75,000 to $99,999 | 50 | 7.1% |
| $100,000 to $149,999 | 12 | 1.7% |
| $150,000 to $199,999 | 2 | 0.3% |
| $200,000+ | 16 | 2.3% |
Household Income by Householder Age in Lac Du Flambeau
The median household income in Lac Du Flambeau is $29,375, with the highest median household income of $48,153 found in the 45 to 64 years age bracket for the primary householder. A total of 235 households (33.4%) fall into this category. Meanwhile, the 15 to 24 years age bracket for the primary householder has the lowest median household income of $0, with 11 households (1.6%) in this group.
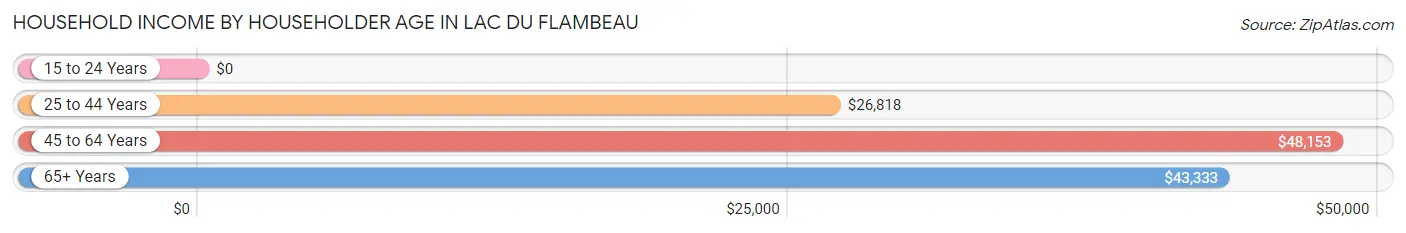
| Income Bracket | # Households | Median Income |
| 15 to 24 Years | 11 (1.6%) | $0 |
| 25 to 44 Years | 352 (50.0%) | $26,818 |
| 45 to 64 Years | 235 (33.4%) | $48,153 |
| 65+ Years | 106 (15.1%) | $43,333 |
| Total | 704 (100.0%) | $29,375 |
Poverty in Lac Du Flambeau
Income Below Poverty by Sex and Age in Lac Du Flambeau
With 47.3% poverty level for males and 21.6% for females among the residents of Lac Du Flambeau, 12 to 14 year old males and under 5 year old females are the most vulnerable to poverty, with 108 males (100.0%) and 42 females (79.2%) in their respective age groups living below the poverty level.
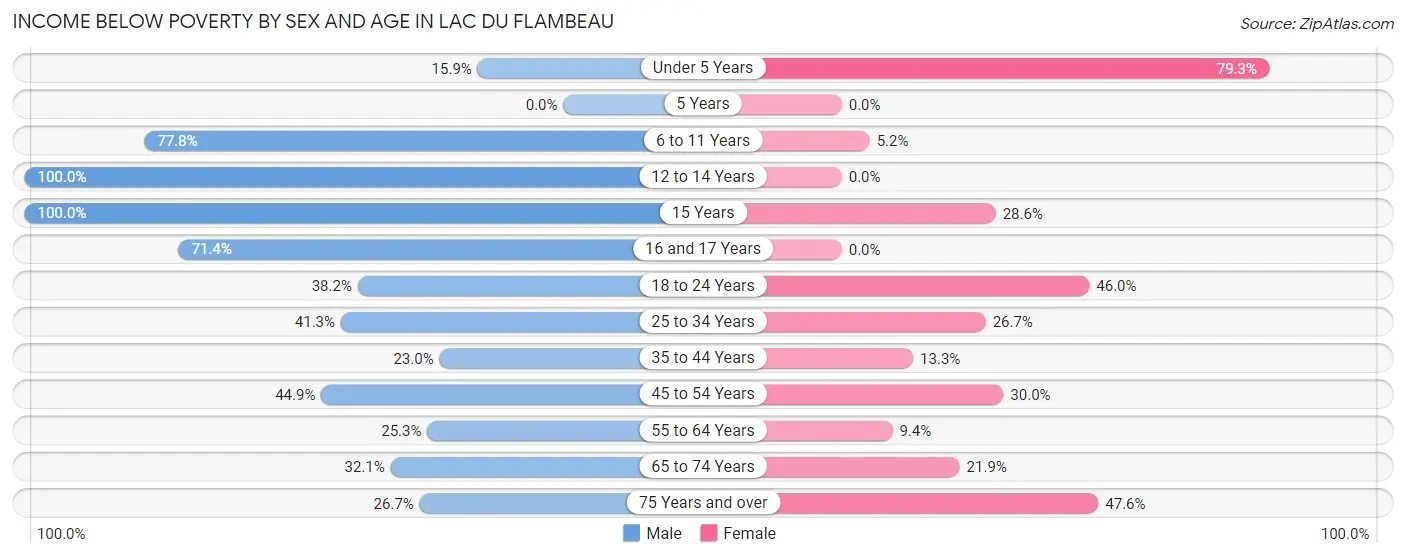
| Age Bracket | Male | Female |
| Under 5 Years | 14 (15.9%) | 42 (79.2%) |
| 5 Years | 0 (0.0%) | 0 (0.0%) |
| 6 to 11 Years | 56 (77.8%) | 7 (5.2%) |
| 12 to 14 Years | 108 (100.0%) | 0 (0.0%) |
| 15 Years | 40 (100.0%) | 4 (28.6%) |
| 16 and 17 Years | 20 (71.4%) | 0 (0.0%) |
| 18 to 24 Years | 29 (38.2%) | 17 (46.0%) |
| 25 to 34 Years | 57 (41.3%) | 39 (26.7%) |
| 35 to 44 Years | 20 (23.0%) | 22 (13.3%) |
| 45 to 54 Years | 40 (44.9%) | 12 (30.0%) |
| 55 to 64 Years | 24 (25.3%) | 8 (9.4%) |
| 65 to 74 Years | 17 (32.1%) | 14 (21.9%) |
| 75 Years and over | 8 (26.7%) | 10 (47.6%) |
| Total | 433 (47.3%) | 175 (21.6%) |
Income Above Poverty by Sex and Age in Lac Du Flambeau
According to the poverty statistics in Lac Du Flambeau, males aged 5 years and females aged 12 to 14 years are the age groups that are most secure financially, with 100.0% of males and 100.0% of females in these age groups living above the poverty line.
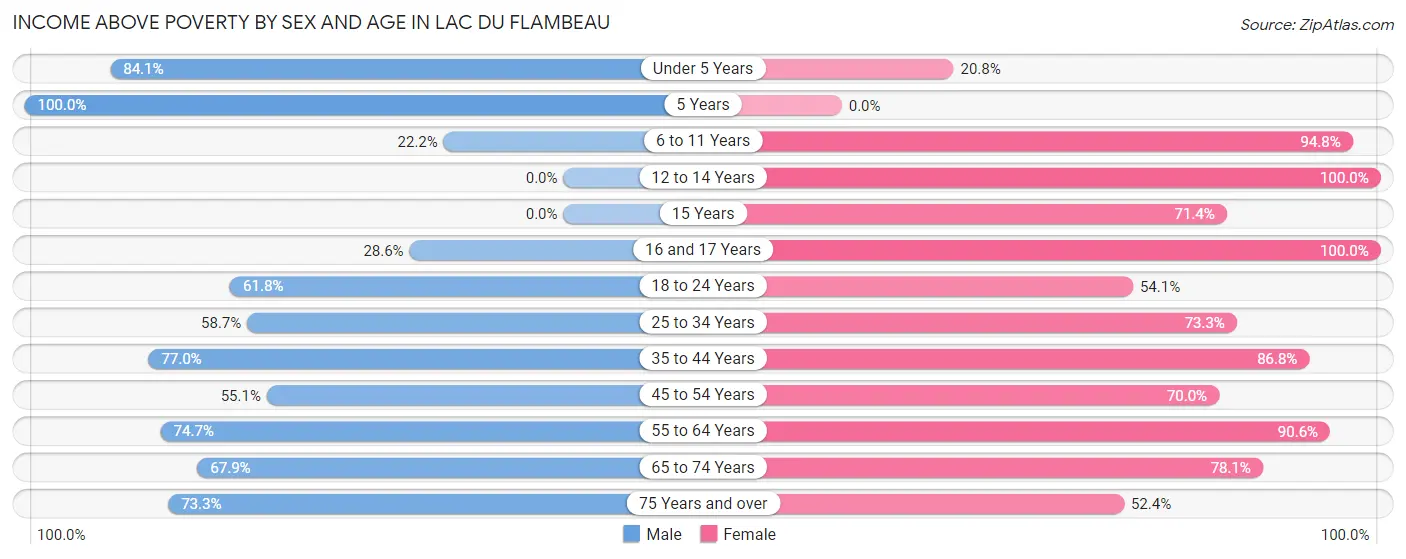
| Age Bracket | Male | Female |
| Under 5 Years | 74 (84.1%) | 11 (20.7%) |
| 5 Years | 11 (100.0%) | 0 (0.0%) |
| 6 to 11 Years | 16 (22.2%) | 128 (94.8%) |
| 12 to 14 Years | 0 (0.0%) | 43 (100.0%) |
| 15 Years | 0 (0.0%) | 10 (71.4%) |
| 16 and 17 Years | 8 (28.6%) | 7 (100.0%) |
| 18 to 24 Years | 47 (61.8%) | 20 (54.0%) |
| 25 to 34 Years | 81 (58.7%) | 107 (73.3%) |
| 35 to 44 Years | 67 (77.0%) | 144 (86.8%) |
| 45 to 54 Years | 49 (55.1%) | 28 (70.0%) |
| 55 to 64 Years | 71 (74.7%) | 77 (90.6%) |
| 65 to 74 Years | 36 (67.9%) | 50 (78.1%) |
| 75 Years and over | 22 (73.3%) | 11 (52.4%) |
| Total | 482 (52.7%) | 636 (78.4%) |
Income Below Poverty Among Married-Couple Families in Lac Du Flambeau
The poverty statistics for married-couple families in Lac Du Flambeau show that 4.3% or 5 of the total 117 families live below the poverty line. Families with no children have the highest poverty rate of 5.9%, comprising of 5 families. On the other hand, families with 1 or 2 children have the lowest poverty rate of 0.0%, which includes 0 families.
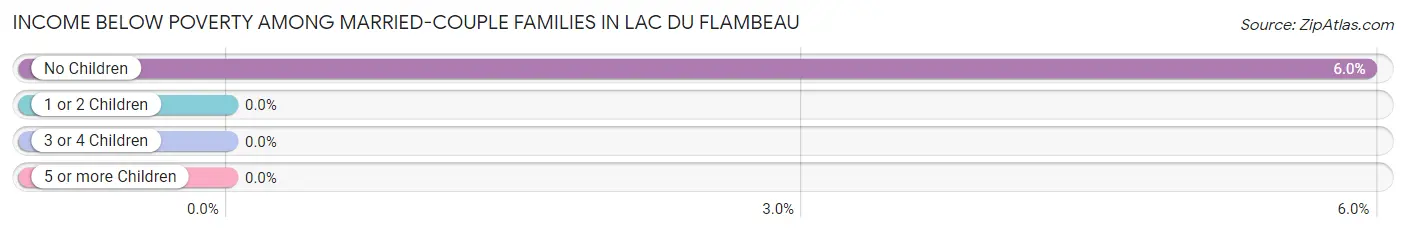
| Children | Above Poverty | Below Poverty |
| No Children | 79 (94.1%) | 5 (5.9%) |
| 1 or 2 Children | 20 (100.0%) | 0 (0.0%) |
| 3 or 4 Children | 13 (100.0%) | 0 (0.0%) |
| 5 or more Children | 0 (0.0%) | 0 (0.0%) |
| Total | 112 (95.7%) | 5 (4.3%) |
Income Below Poverty Among Single-Parent Households in Lac Du Flambeau
According to the poverty data in Lac Du Flambeau, 53.7% or 66 single-father households and 50.9% or 59 single-mother households are living below the poverty line. Among single-father households, those with 3 or 4 children have the highest poverty rate, with 6 households (100.0%) experiencing poverty. Likewise, among single-mother households, those with 1 or 2 children have the highest poverty rate, with 51 households (63.0%) falling below the poverty line.
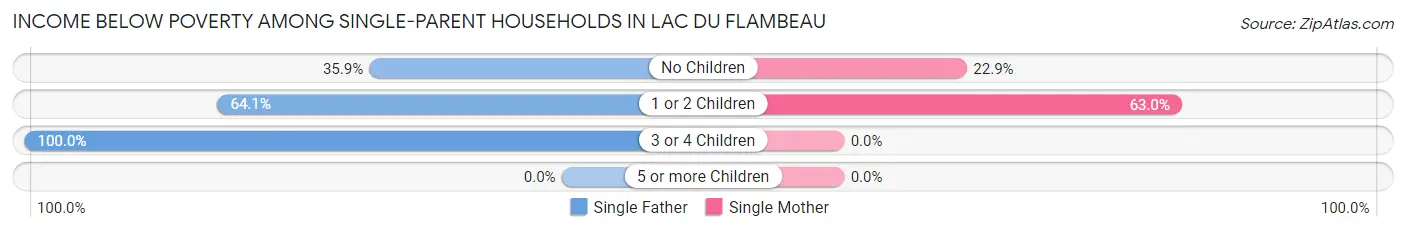
| Children | Single Father | Single Mother |
| No Children | 19 (35.8%) | 8 (22.9%) |
| 1 or 2 Children | 41 (64.1%) | 51 (63.0%) |
| 3 or 4 Children | 6 (100.0%) | 0 (0.0%) |
| 5 or more Children | 0 (0.0%) | 0 (0.0%) |
| Total | 66 (53.7%) | 59 (50.9%) |
Income Below Poverty Among Married-Couple vs Single-Parent Households in Lac Du Flambeau
The poverty data for Lac Du Flambeau shows that 5 of the married-couple family households (4.3%) and 125 of the single-parent households (52.3%) are living below the poverty level. Within the married-couple family households, those with no children have the highest poverty rate, with 5 households (5.9%) falling below the poverty line. Among the single-parent households, those with 3 or 4 children have the highest poverty rate, with 6 household (100.0%) living below poverty.
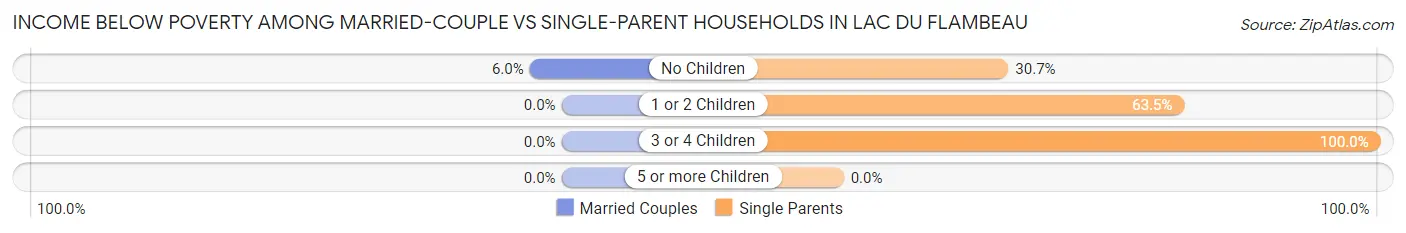
| Children | Married-Couple Families | Single-Parent Households |
| No Children | 5 (5.9%) | 27 (30.7%) |
| 1 or 2 Children | 0 (0.0%) | 92 (63.4%) |
| 3 or 4 Children | 0 (0.0%) | 6 (100.0%) |
| 5 or more Children | 0 (0.0%) | 0 (0.0%) |
| Total | 5 (4.3%) | 125 (52.3%) |
Race in Lac Du Flambeau
The most populous races in Lac Du Flambeau are Native / Alaskan (1,538 | 87.6%), White / Caucasian (133 | 7.6%), and Hispanic or Latino (73 | 4.2%).
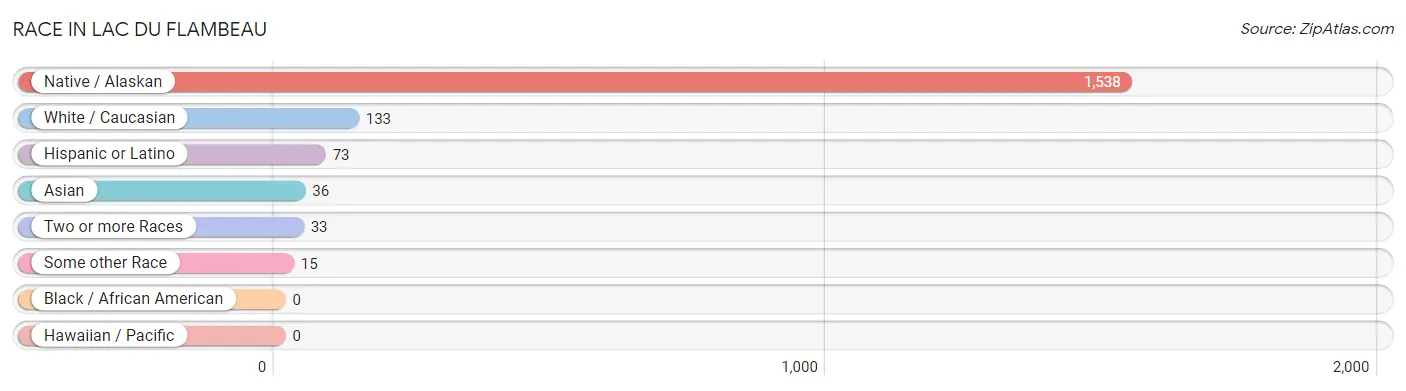
| Race | # Population | % Population |
| Asian | 36 | 2.1% |
| Black / African American | 0 | 0.0% |
| Hawaiian / Pacific | 0 | 0.0% |
| Hispanic or Latino | 73 | 4.2% |
| Native / Alaskan | 1,538 | 87.6% |
| White / Caucasian | 133 | 7.6% |
| Two or more Races | 33 | 1.9% |
| Some other Race | 15 | 0.9% |
| Total | 1,755 | 100.0% |
Ancestry in Lac Du Flambeau
The most populous ancestries reported in Lac Du Flambeau are Chippewa (1,361 | 77.5%), Menominee (60 | 3.4%), Iroquois (57 | 3.3%), Blackfeet (43 | 2.5%), and Puerto Rican (41 | 2.3%), together accounting for 89.0% of all Lac Du Flambeau residents.
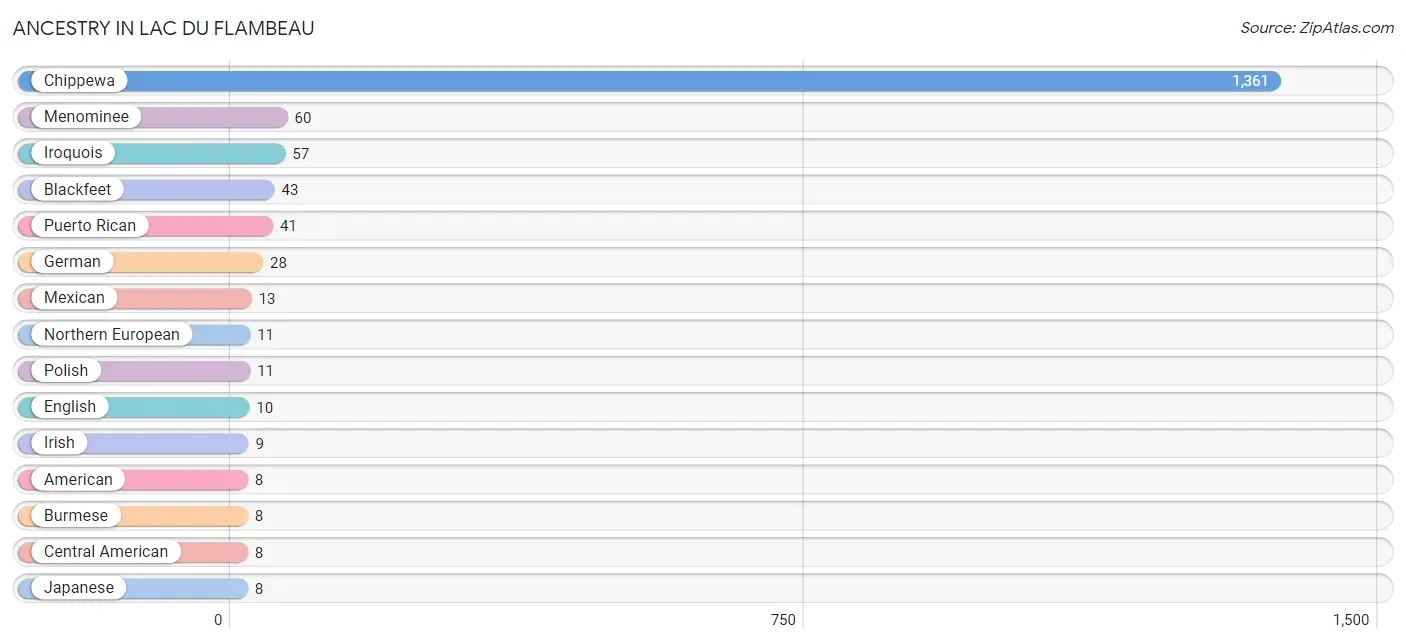
| Ancestry | # Population | % Population |
| American | 8 | 0.5% |
| Belgian | 5 | 0.3% |
| Blackfeet | 43 | 2.5% |
| Burmese | 8 | 0.5% |
| Central American | 8 | 0.5% |
| Chippewa | 1,361 | 77.5% |
| Czech | 5 | 0.3% |
| Eastern European | 4 | 0.2% |
| English | 10 | 0.6% |
| French | 7 | 0.4% |
| French Canadian | 3 | 0.2% |
| German | 28 | 1.6% |
| Irish | 9 | 0.5% |
| Iroquois | 57 | 3.3% |
| Italian | 4 | 0.2% |
| Japanese | 8 | 0.5% |
| Menominee | 60 | 3.4% |
| Mexican | 13 | 0.7% |
| Northern European | 11 | 0.6% |
| Norwegian | 5 | 0.3% |
| Ottawa | 3 | 0.2% |
| Polish | 11 | 0.6% |
| Potawatomi | 4 | 0.2% |
| Puerto Rican | 41 | 2.3% |
| Salvadoran | 8 | 0.5% |
| Spaniard | 3 | 0.2% |
| Swedish | 5 | 0.3% | View All 27 Rows |
Immigrants in Lac Du Flambeau
The most numerous immigrant groups reported in Lac Du Flambeau came from Canada (11 | 0.6%), Central America (8 | 0.5%), El Salvador (8 | 0.5%), and Latin America (8 | 0.5%), together accounting for 2.0% of all Lac Du Flambeau residents.

| Immigration Origin | # Population | % Population |
| Canada | 11 | 0.6% |
| Central America | 8 | 0.5% |
| El Salvador | 8 | 0.5% |
| Latin America | 8 | 0.5% | View All 4 Rows |
Sex and Age in Lac Du Flambeau
Sex and Age in Lac Du Flambeau
The most populous age groups in Lac Du Flambeau are 10 to 14 Years (125 | 13.6%) for men and 40 to 44 Years (154 | 18.5%) for women.
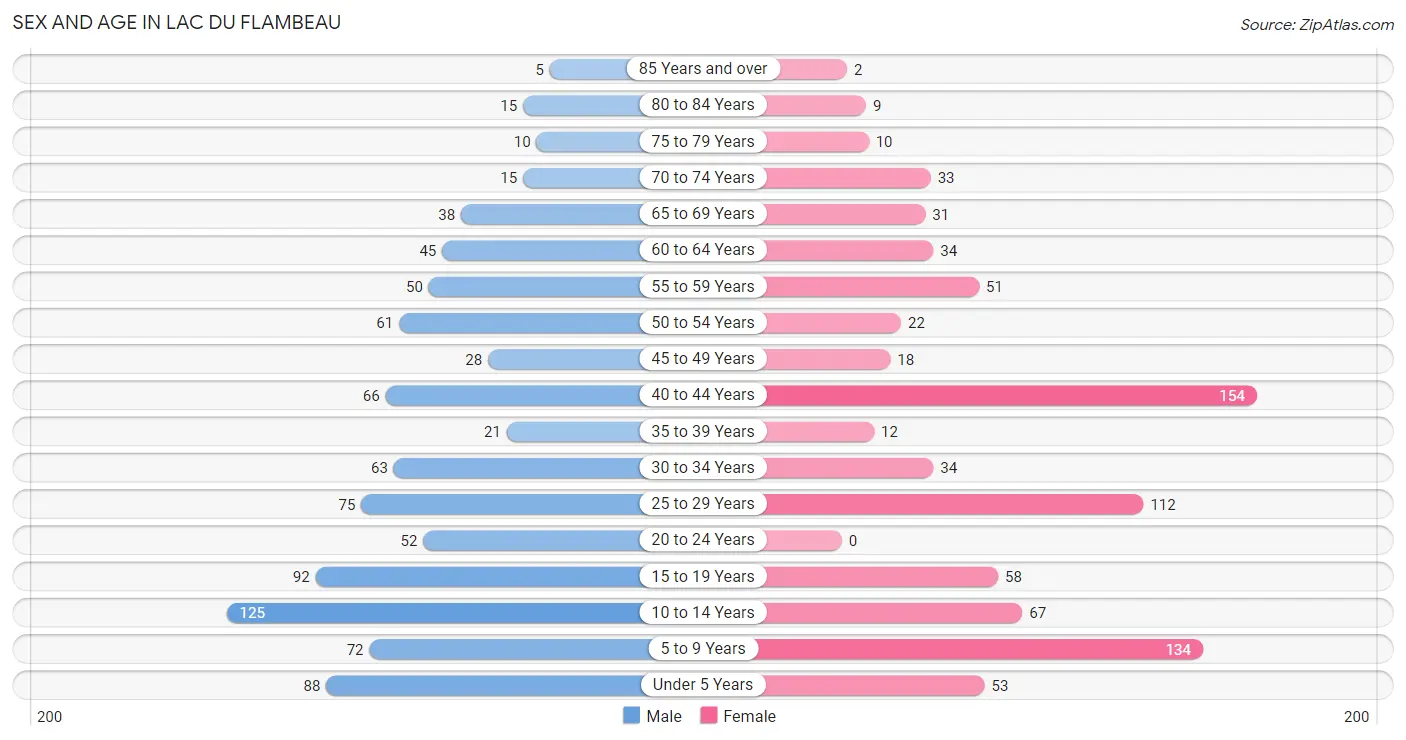
| Age Bracket | Male | Female |
| Under 5 Years | 88 (9.6%) | 53 (6.4%) |
| 5 to 9 Years | 72 (7.8%) | 134 (16.1%) |
| 10 to 14 Years | 125 (13.6%) | 67 (8.0%) |
| 15 to 19 Years | 92 (10.0%) | 58 (7.0%) |
| 20 to 24 Years | 52 (5.7%) | 0 (0.0%) |
| 25 to 29 Years | 75 (8.1%) | 112 (13.4%) |
| 30 to 34 Years | 63 (6.8%) | 34 (4.1%) |
| 35 to 39 Years | 21 (2.3%) | 12 (1.4%) |
| 40 to 44 Years | 66 (7.2%) | 154 (18.5%) |
| 45 to 49 Years | 28 (3.0%) | 18 (2.2%) |
| 50 to 54 Years | 61 (6.6%) | 22 (2.6%) |
| 55 to 59 Years | 50 (5.4%) | 51 (6.1%) |
| 60 to 64 Years | 45 (4.9%) | 34 (4.1%) |
| 65 to 69 Years | 38 (4.1%) | 31 (3.7%) |
| 70 to 74 Years | 15 (1.6%) | 33 (4.0%) |
| 75 to 79 Years | 10 (1.1%) | 10 (1.2%) |
| 80 to 84 Years | 15 (1.6%) | 9 (1.1%) |
| 85 Years and over | 5 (0.5%) | 2 (0.2%) |
| Total | 921 (100.0%) | 834 (100.0%) |
Families and Households in Lac Du Flambeau
Median Family Size in Lac Du Flambeau
The median family size in Lac Du Flambeau is 3.51 persons per family, with single female/mother families (116 | 32.6%) accounting for the largest median family size of 4.05 persons per family. On the other hand, single male/father families (123 | 34.5%) represent the smallest median family size with 3.10 persons per family.
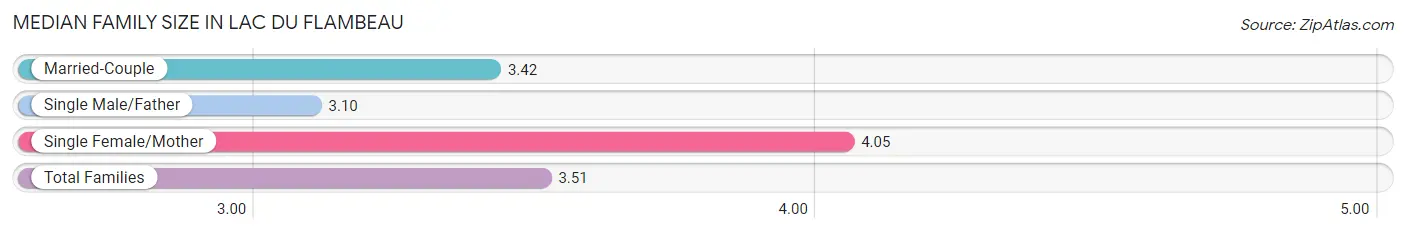
| Family Type | # Families | Family Size |
| Married-Couple | 117 (32.9%) | 3.42 |
| Single Male/Father | 123 (34.5%) | 3.10 |
| Single Female/Mother | 116 (32.6%) | 4.05 |
| Total Families | 356 (100.0%) | 3.51 |
Median Household Size in Lac Du Flambeau
The median household size in Lac Du Flambeau is 2.47 persons per household, with single female/mother households (116 | 16.5%) accounting for the largest median household size of 4.58 persons per household. non-family households (348 | 49.4%) represent the smallest median household size with 1.15 persons per household.
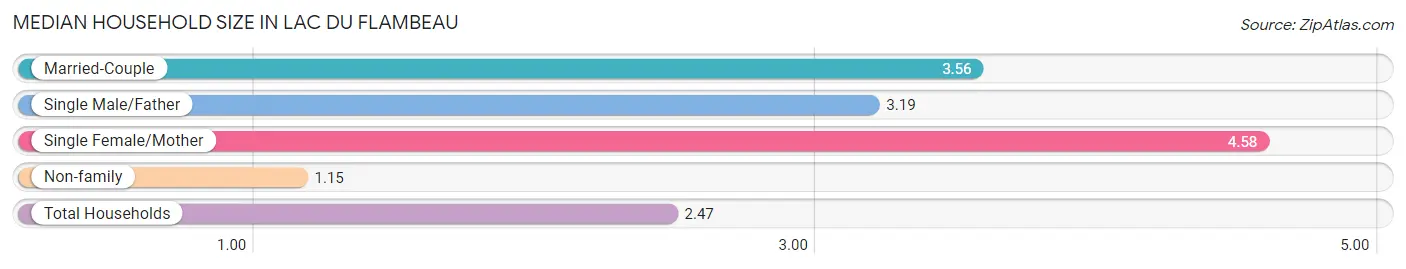
| Household Type | # Households | Household Size |
| Married-Couple | 117 (16.6%) | 3.56 |
| Single Male/Father | 123 (17.5%) | 3.19 |
| Single Female/Mother | 116 (16.5%) | 4.58 |
| Non-family | 348 (49.4%) | 1.15 |
| Total Households | 704 (100.0%) | 2.47 |
Household Size by Marriage Status in Lac Du Flambeau
Out of a total of 704 households in Lac Du Flambeau, 356 (50.6%) are family households, while 348 (49.4%) are nonfamily households. The most numerous type of family households are 2-person households, comprising 208, and the most common type of nonfamily households are 1-person households, comprising 308.
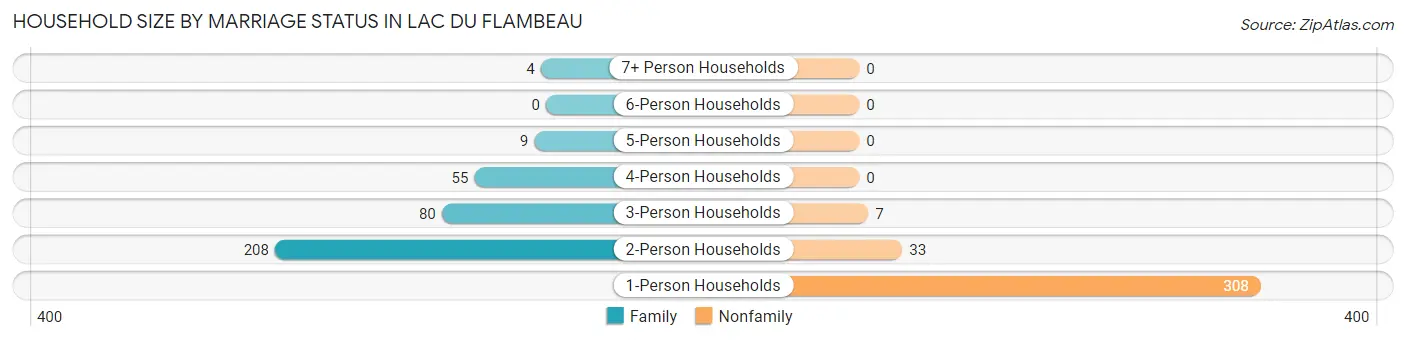
| Household Size | Family Households | Nonfamily Households |
| 1-Person Households | - | 308 (43.8%) |
| 2-Person Households | 208 (29.5%) | 33 (4.7%) |
| 3-Person Households | 80 (11.4%) | 7 (1.0%) |
| 4-Person Households | 55 (7.8%) | 0 (0.0%) |
| 5-Person Households | 9 (1.3%) | 0 (0.0%) |
| 6-Person Households | 0 (0.0%) | 0 (0.0%) |
| 7+ Person Households | 4 (0.6%) | 0 (0.0%) |
| Total | 356 (50.6%) | 348 (49.4%) |
Female Fertility in Lac Du Flambeau
Fertility by Age in Lac Du Flambeau
Average fertility rate in Lac Du Flambeau is 112.0 births per 1,000 women. Women in the age bracket of 20 to 34 years have the highest fertility rate with 301.0 births per 1,000 women. Women in the age bracket of 20 to 34 years acount for 100.0% of all women with births.
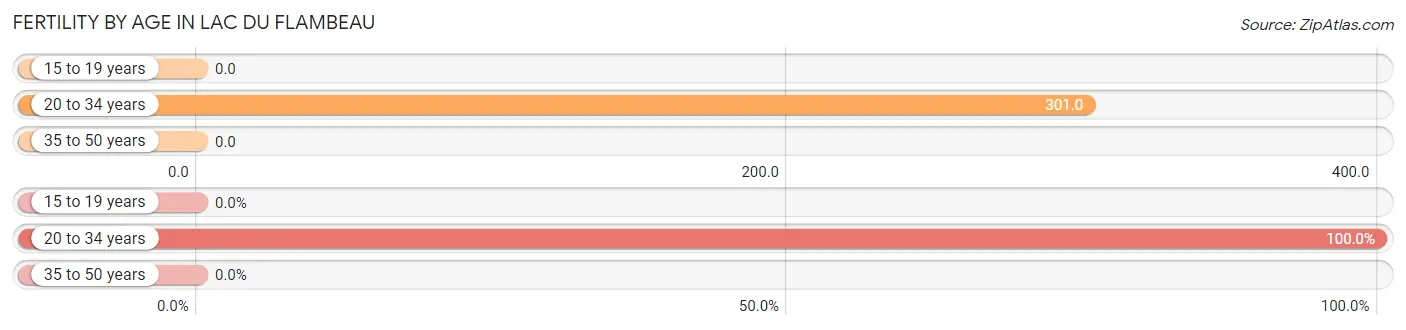
| Age Bracket | Women with Births | Births / 1,000 Women |
| 15 to 19 years | 0 (0.0%) | 0.0 |
| 20 to 34 years | 44 (100.0%) | 301.0 |
| 35 to 50 years | 0 (0.0%) | 0.0 |
| Total | 44 (100.0%) | 112.0 |
Fertility by Age by Marriage Status in Lac Du Flambeau
20.5% of women with births (44) in Lac Du Flambeau are married. The highest percentage of unmarried women with births falls into 20 to 34 years age bracket with 79.5% of them unmarried at the time of birth, while the lowest percentage of unmarried women with births belong to 20 to 34 years age bracket with 79.5% of them unmarried.
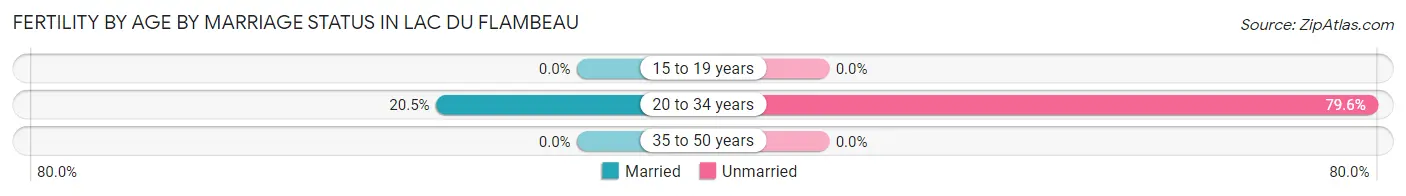
| Age Bracket | Married | Unmarried |
| 15 to 19 years | 0 (0.0%) | 0 (0.0%) |
| 20 to 34 years | 9 (20.4%) | 35 (79.5%) |
| 35 to 50 years | 0 (0.0%) | 0 (0.0%) |
| Total | 9 (20.4%) | 35 (79.5%) |
Fertility by Education in Lac Du Flambeau
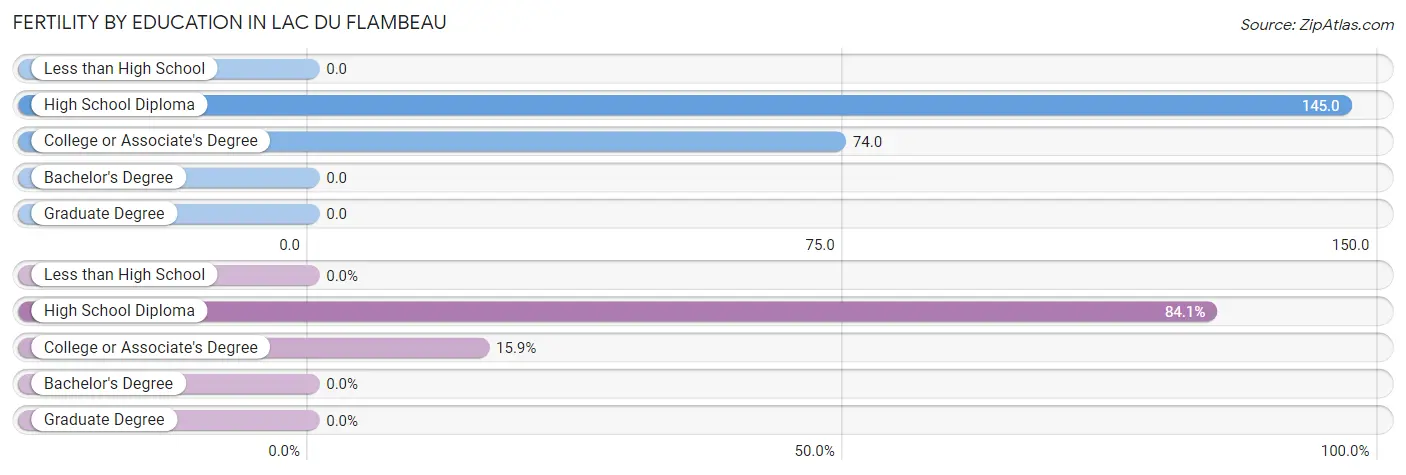
| Educational Attainment | Women with Births | Births / 1,000 Women |
| Less than High School | 0 (0.0%) | 0.0 |
| High School Diploma | 37 (84.1%) | 145.0 |
| College or Associate's Degree | 7 (15.9%) | 74.0 |
| Bachelor's Degree | 0 (0.0%) | 0.0 |
| Graduate Degree | 0 (0.0%) | 0.0 |
| Total | 44 (100.0%) | 112.0 |
Fertility by Education by Marriage Status in Lac Du Flambeau
79.5% of women with births in Lac Du Flambeau are unmarried. Women with the educational attainment of high school diploma are most likely to be married with 24.3% of them married at childbirth, while women with the educational attainment of college or associate's degree are least likely to be married with 100.0% of them unmarried at childbirth.
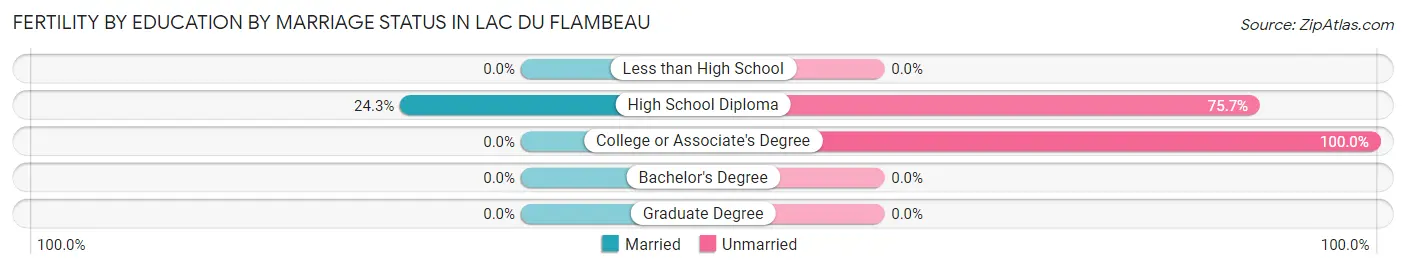
| Educational Attainment | Married | Unmarried |
| Less than High School | 0 (0.0%) | 0 (0.0%) |
| High School Diploma | 9 (24.3%) | 28 (75.7%) |
| College or Associate's Degree | 0 (0.0%) | 7 (100.0%) |
| Bachelor's Degree | 0 (0.0%) | 0 (0.0%) |
| Graduate Degree | 0 (0.0%) | 0 (0.0%) |
| Total | 9 (20.4%) | 35 (79.5%) |
Employment Characteristics in Lac Du Flambeau
Employment by Class of Employer in Lac Du Flambeau
Among the 687 employed individuals in Lac Du Flambeau, local government employees (311 | 45.3%), private company employees (132 | 19.2%), and state government employees (121 | 17.6%) make up the most common classes of employment.
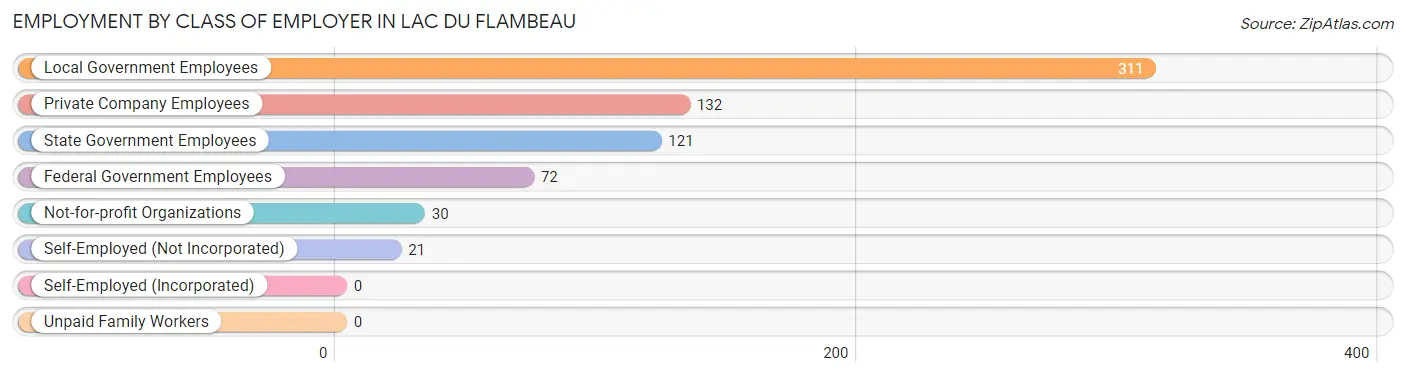
| Employer Class | # Employees | % Employees |
| Private Company Employees | 132 | 19.2% |
| Self-Employed (Incorporated) | 0 | 0.0% |
| Self-Employed (Not Incorporated) | 21 | 3.1% |
| Not-for-profit Organizations | 30 | 4.4% |
| Local Government Employees | 311 | 45.3% |
| State Government Employees | 121 | 17.6% |
| Federal Government Employees | 72 | 10.5% |
| Unpaid Family Workers | 0 | 0.0% |
| Total | 687 | 100.0% |
Employment Status by Age in Lac Du Flambeau
According to the labor force statistics for Lac Du Flambeau, out of the total population over 16 years of age (1,162), 66.3% or 770 individuals are in the labor force, with 10.8% or 83 of them unemployed. The age group with the highest labor force participation rate is 35 to 44 years, with 89.3% or 226 individuals in the labor force. Within the labor force, the 16 to 19 years age range has the highest percentage of unemployed individuals, with 61.5% or 32 of them being unemployed.
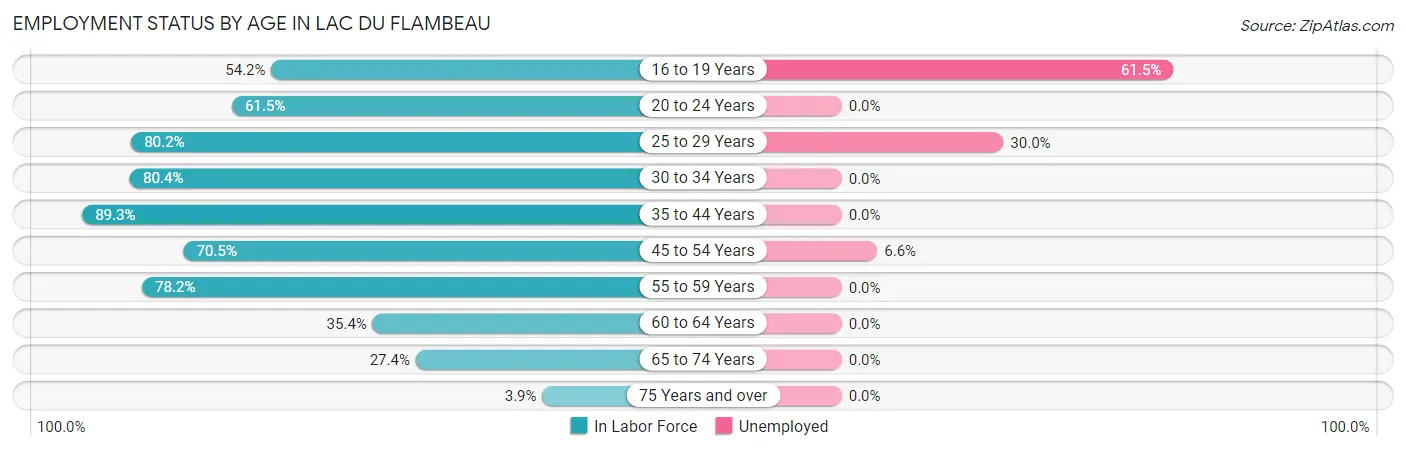
| Age Bracket | In Labor Force | Unemployed |
| 16 to 19 Years | 52 (54.2%) | 32 (61.5%) |
| 20 to 24 Years | 32 (61.5%) | 0 (0.0%) |
| 25 to 29 Years | 150 (80.2%) | 45 (30.0%) |
| 30 to 34 Years | 78 (80.4%) | 0 (0.0%) |
| 35 to 44 Years | 226 (89.3%) | 0 (0.0%) |
| 45 to 54 Years | 91 (70.5%) | 6 (6.6%) |
| 55 to 59 Years | 79 (78.2%) | 0 (0.0%) |
| 60 to 64 Years | 28 (35.4%) | 0 (0.0%) |
| 65 to 74 Years | 32 (27.4%) | 0 (0.0%) |
| 75 Years and over | 2 (3.9%) | 0 (0.0%) |
| Total | 770 (66.3%) | 83 (10.8%) |
Employment Status by Educational Attainment in Lac Du Flambeau
According to labor force statistics for Lac Du Flambeau, 77.1% of individuals (652) out of the total population between 25 and 64 years of age (846) are in the labor force, with 7.8% or 51 of them being unemployed. The group with the highest labor force participation rate are those with the educational attainment of bachelor's degree or higher, with 93.7% or 89 individuals in the labor force. Within the labor force, individuals with high school diploma education have the highest percentage of unemployment, with 9.5% or 35 of them being unemployed.
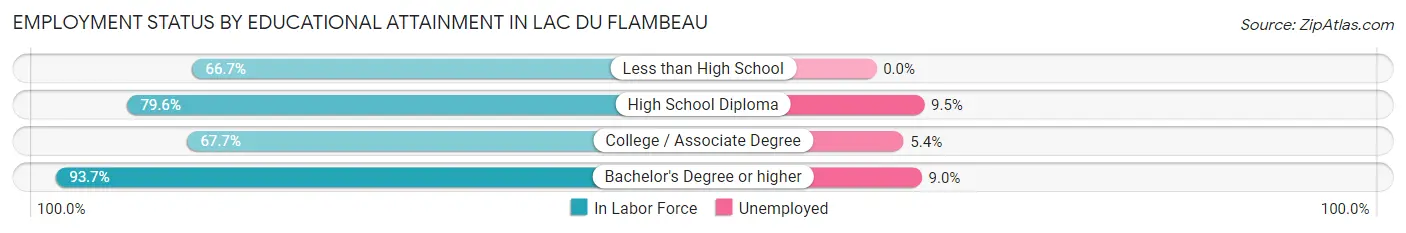
| Educational Attainment | In Labor Force | Unemployed |
| Less than High School | 44 (66.7%) | 0 (0.0%) |
| High School Diploma | 370 (79.6%) | 44 (9.5%) |
| College / Associate Degree | 149 (67.7%) | 12 (5.4%) |
| Bachelor's Degree or higher | 89 (93.7%) | 9 (9.0%) |
| Total | 652 (77.1%) | 66 (7.8%) |
Employment Occupations by Sex in Lac Du Flambeau
Management, Business, Science and Arts Occupations
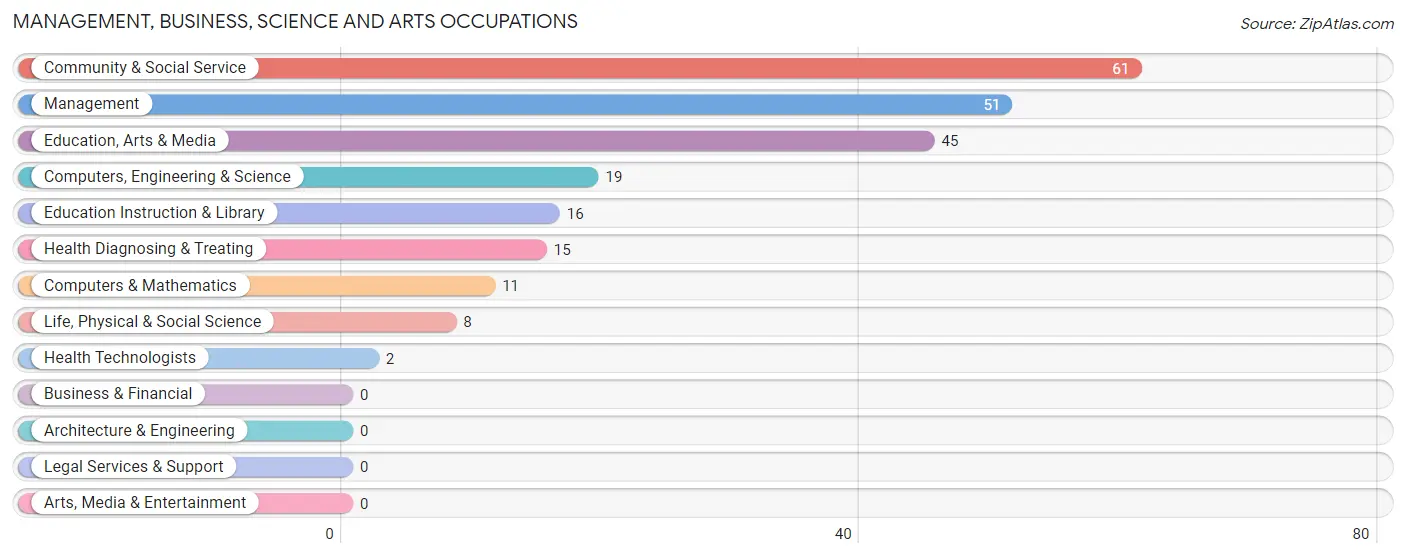
The most common Management, Business, Science and Arts occupations in Lac Du Flambeau are Community & Social Service (61 | 8.9%), Management (51 | 7.4%), Education, Arts & Media (45 | 6.6%), Computers, Engineering & Science (19 | 2.8%), and Education Instruction & Library (16 | 2.3%).
Management, Business, Science and Arts Occupations by Sex
Within the Management, Business, Science and Arts occupations in Lac Du Flambeau, the most male-oriented occupations are Computers, Engineering & Science (100.0%), Computers & Mathematics (100.0%), and Life, Physical & Social Science (100.0%), while the most female-oriented occupations are Education Instruction & Library (100.0%), Community & Social Service (98.4%), and Education, Arts & Media (97.8%).
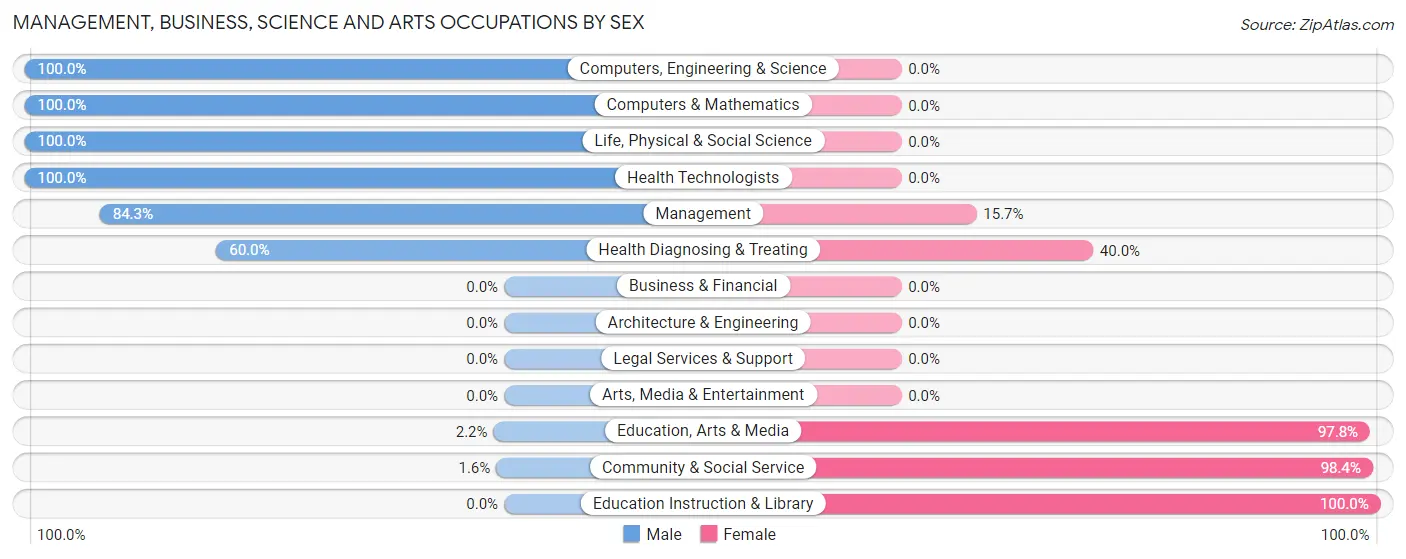
| Occupation | Male | Female |
| Management | 43 (84.3%) | 8 (15.7%) |
| Business & Financial | 0 (0.0%) | 0 (0.0%) |
| Computers, Engineering & Science | 19 (100.0%) | 0 (0.0%) |
| Computers & Mathematics | 11 (100.0%) | 0 (0.0%) |
| Architecture & Engineering | 0 (0.0%) | 0 (0.0%) |
| Life, Physical & Social Science | 8 (100.0%) | 0 (0.0%) |
| Community & Social Service | 1 (1.6%) | 60 (98.4%) |
| Education, Arts & Media | 1 (2.2%) | 44 (97.8%) |
| Legal Services & Support | 0 (0.0%) | 0 (0.0%) |
| Education Instruction & Library | 0 (0.0%) | 16 (100.0%) |
| Arts, Media & Entertainment | 0 (0.0%) | 0 (0.0%) |
| Health Diagnosing & Treating | 9 (60.0%) | 6 (40.0%) |
| Health Technologists | 2 (100.0%) | 0 (0.0%) |
| Total (Category) | 72 (49.3%) | 74 (50.7%) |
| Total (Overall) | 334 (48.6%) | 353 (51.4%) |
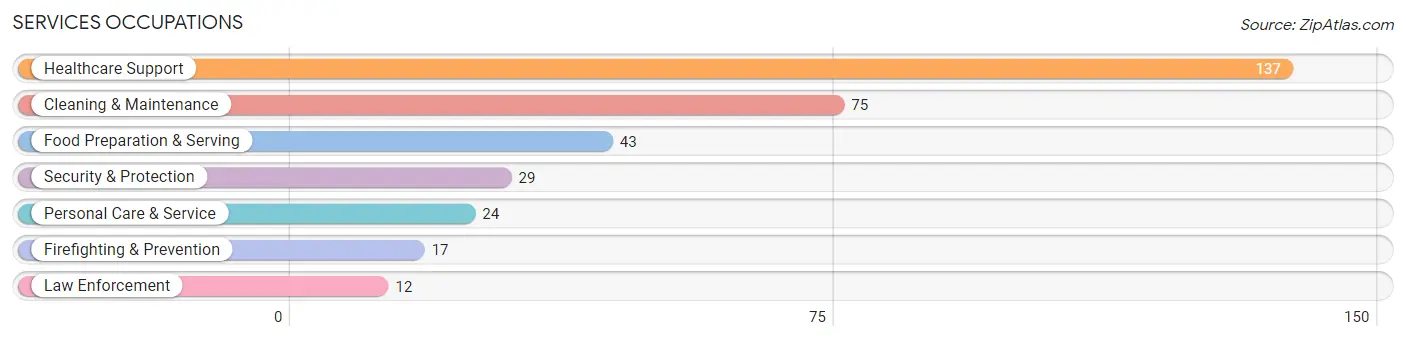
Services Occupations
The most common Services occupations in Lac Du Flambeau are Healthcare Support (137 | 19.9%), Cleaning & Maintenance (75 | 10.9%), Food Preparation & Serving (43 | 6.3%), Security & Protection (29 | 4.2%), and Personal Care & Service (24 | 3.5%).
Services Occupations by Sex
Within the Services occupations in Lac Du Flambeau, the most male-oriented occupations are Firefighting & Prevention (100.0%), Security & Protection (86.2%), and Cleaning & Maintenance (73.3%), while the most female-oriented occupations are Healthcare Support (96.4%), Personal Care & Service (70.8%), and Law Enforcement (33.3%).
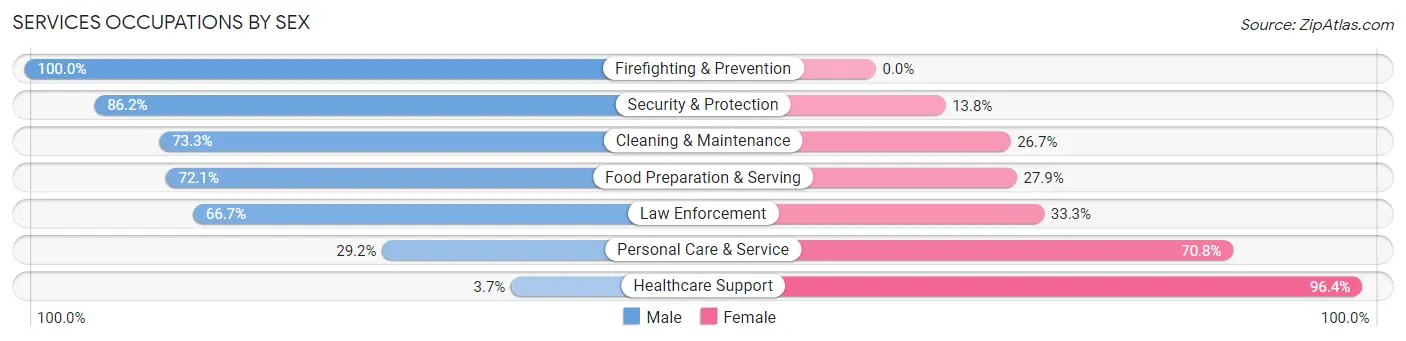
| Occupation | Male | Female |
| Healthcare Support | 5 (3.6%) | 132 (96.4%) |
| Security & Protection | 25 (86.2%) | 4 (13.8%) |
| Firefighting & Prevention | 17 (100.0%) | 0 (0.0%) |
| Law Enforcement | 8 (66.7%) | 4 (33.3%) |
| Food Preparation & Serving | 31 (72.1%) | 12 (27.9%) |
| Cleaning & Maintenance | 55 (73.3%) | 20 (26.7%) |
| Personal Care & Service | 7 (29.2%) | 17 (70.8%) |
| Total (Category) | 123 (39.9%) | 185 (60.1%) |
| Total (Overall) | 334 (48.6%) | 353 (51.4%) |
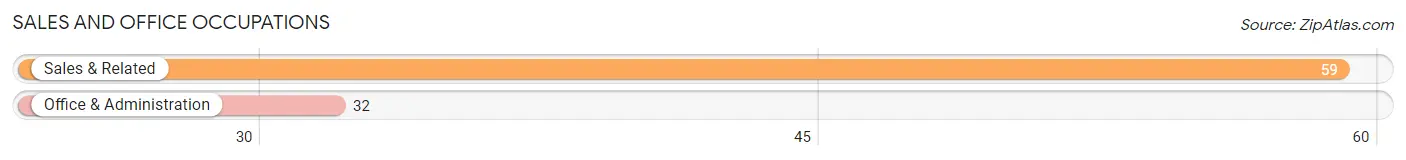
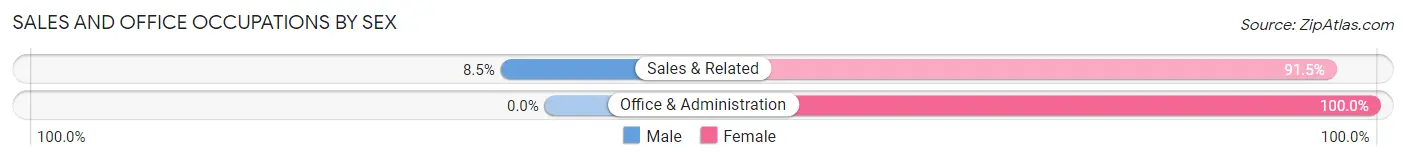
Sales and Office Occupations
The most common Sales and Office occupations in Lac Du Flambeau are Sales & Related (59 | 8.6%), and Office & Administration (32 | 4.7%).
Sales and Office Occupations by Sex
| Occupation | Male | Female |
| Sales & Related | 5 (8.5%) | 54 (91.5%) |
| Office & Administration | 0 (0.0%) | 32 (100.0%) |
| Total (Category) | 5 (5.5%) | 86 (94.5%) |
| Total (Overall) | 334 (48.6%) | 353 (51.4%) |
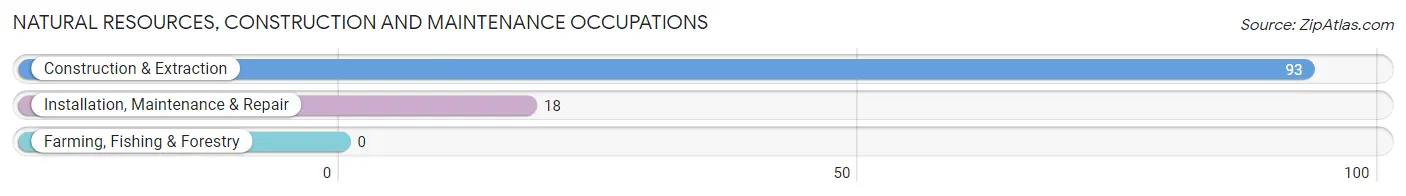
Natural Resources, Construction and Maintenance Occupations
The most common Natural Resources, Construction and Maintenance occupations in Lac Du Flambeau are Construction & Extraction (93 | 13.5%), and Installation, Maintenance & Repair (18 | 2.6%).
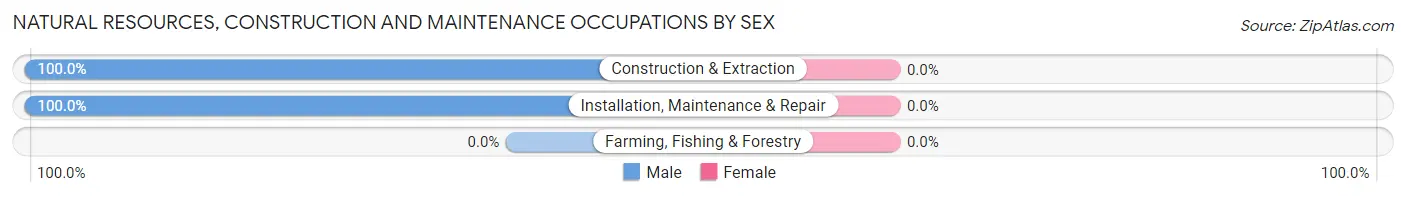
Natural Resources, Construction and Maintenance Occupations by Sex
| Occupation | Male | Female |
| Farming, Fishing & Forestry | 0 (0.0%) | 0 (0.0%) |
| Construction & Extraction | 93 (100.0%) | 0 (0.0%) |
| Installation, Maintenance & Repair | 18 (100.0%) | 0 (0.0%) |
| Total (Category) | 111 (100.0%) | 0 (0.0%) |
| Total (Overall) | 334 (48.6%) | 353 (51.4%) |
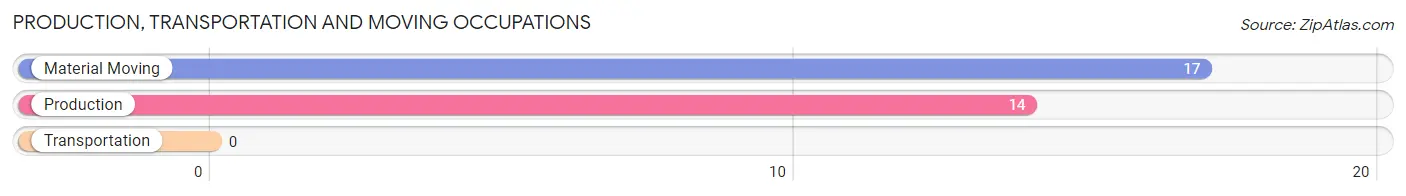
Production, Transportation and Moving Occupations
The most common Production, Transportation and Moving occupations in Lac Du Flambeau are Material Moving (17 | 2.5%), and Production (14 | 2.0%).
Production, Transportation and Moving Occupations by Sex
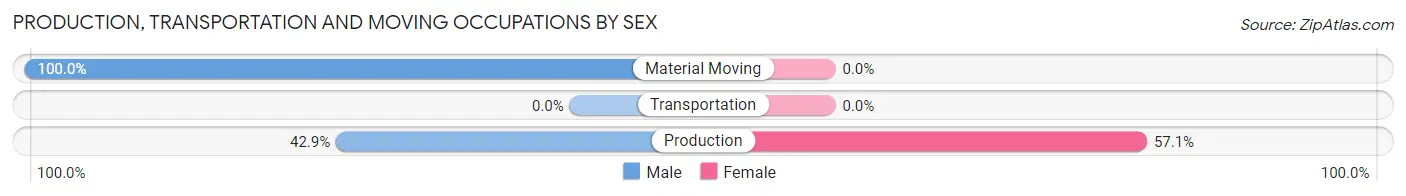
| Occupation | Male | Female |
| Production | 6 (42.9%) | 8 (57.1%) |
| Transportation | 0 (0.0%) | 0 (0.0%) |
| Material Moving | 17 (100.0%) | 0 (0.0%) |
| Total (Category) | 23 (74.2%) | 8 (25.8%) |
| Total (Overall) | 334 (48.6%) | 353 (51.4%) |
Employment Industries by Sex in Lac Du Flambeau
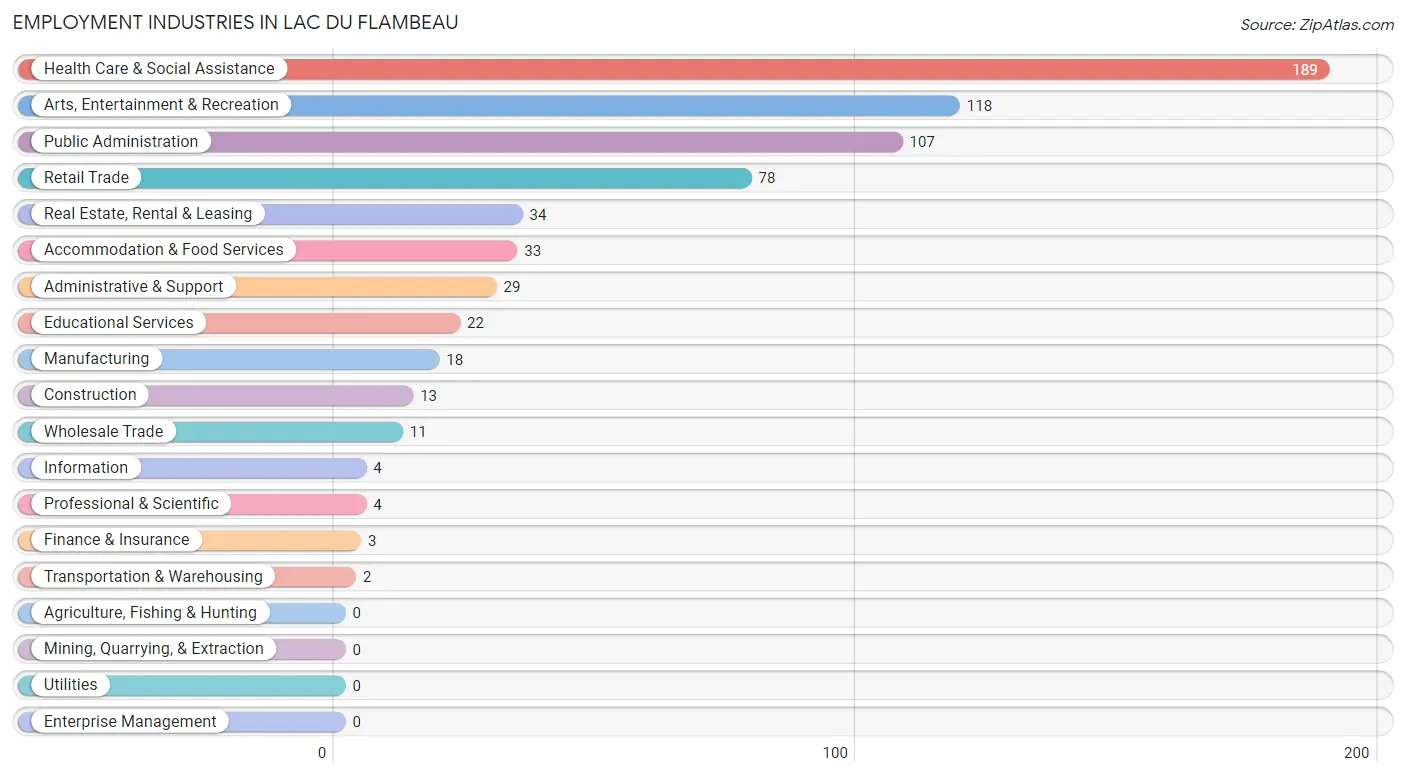
Employment Industries in Lac Du Flambeau
The major employment industries in Lac Du Flambeau include Health Care & Social Assistance (189 | 27.5%), Arts, Entertainment & Recreation (118 | 17.2%), Public Administration (107 | 15.6%), Retail Trade (78 | 11.4%), and Real Estate, Rental & Leasing (34 | 5.0%).
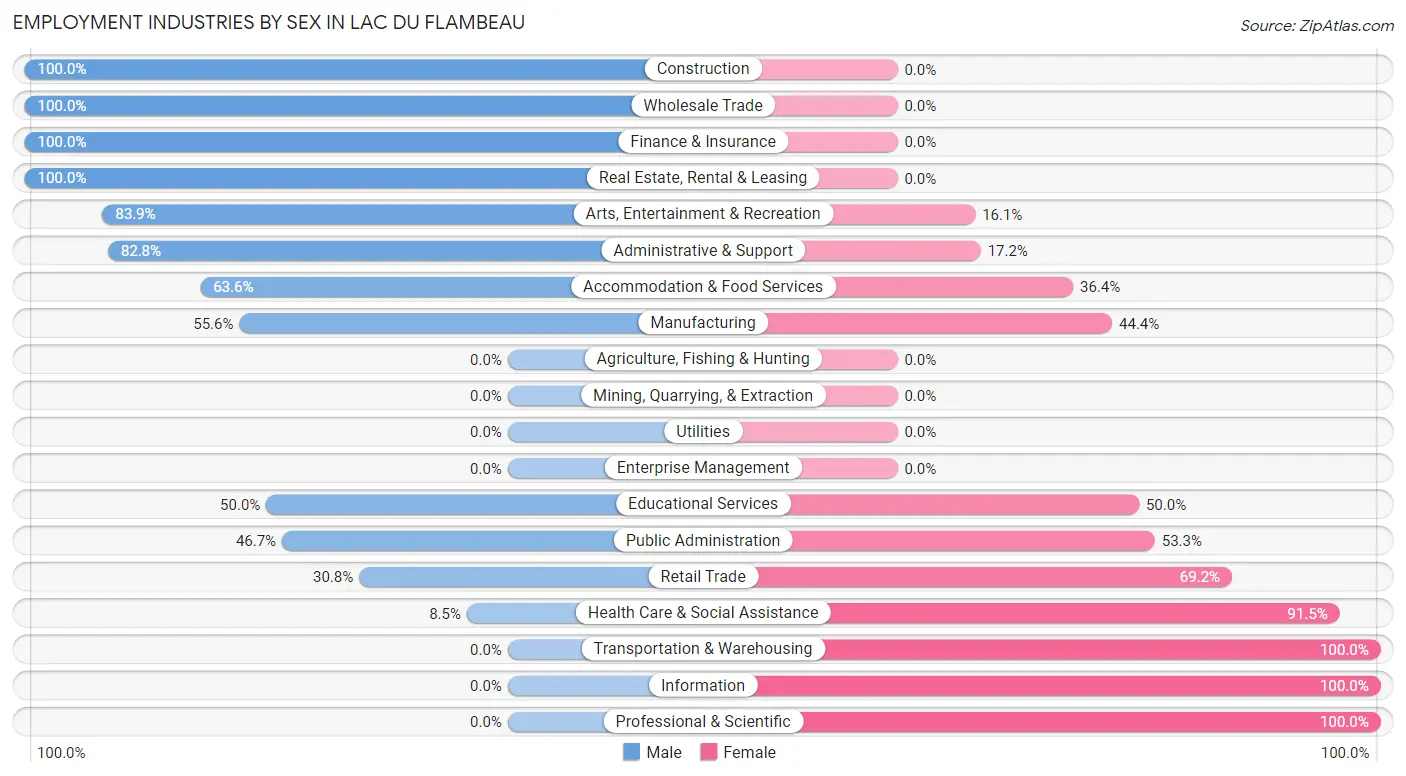
Employment Industries by Sex in Lac Du Flambeau
The Lac Du Flambeau industries that see more men than women are Construction (100.0%), Wholesale Trade (100.0%), and Finance & Insurance (100.0%), whereas the industries that tend to have a higher number of women are Transportation & Warehousing (100.0%), Information (100.0%), and Professional & Scientific (100.0%).
| Industry | Male | Female |
| Agriculture, Fishing & Hunting | 0 (0.0%) | 0 (0.0%) |
| Mining, Quarrying, & Extraction | 0 (0.0%) | 0 (0.0%) |
| Construction | 13 (100.0%) | 0 (0.0%) |
| Manufacturing | 10 (55.6%) | 8 (44.4%) |
| Wholesale Trade | 11 (100.0%) | 0 (0.0%) |
| Retail Trade | 24 (30.8%) | 54 (69.2%) |
| Transportation & Warehousing | 0 (0.0%) | 2 (100.0%) |
| Utilities | 0 (0.0%) | 0 (0.0%) |
| Information | 0 (0.0%) | 4 (100.0%) |
| Finance & Insurance | 3 (100.0%) | 0 (0.0%) |
| Real Estate, Rental & Leasing | 34 (100.0%) | 0 (0.0%) |
| Professional & Scientific | 0 (0.0%) | 4 (100.0%) |
| Enterprise Management | 0 (0.0%) | 0 (0.0%) |
| Administrative & Support | 24 (82.8%) | 5 (17.2%) |
| Educational Services | 11 (50.0%) | 11 (50.0%) |
| Health Care & Social Assistance | 16 (8.5%) | 173 (91.5%) |
| Arts, Entertainment & Recreation | 99 (83.9%) | 19 (16.1%) |
| Accommodation & Food Services | 21 (63.6%) | 12 (36.4%) |
| Public Administration | 50 (46.7%) | 57 (53.3%) |
| Total | 334 (48.6%) | 353 (51.4%) |
Education in Lac Du Flambeau
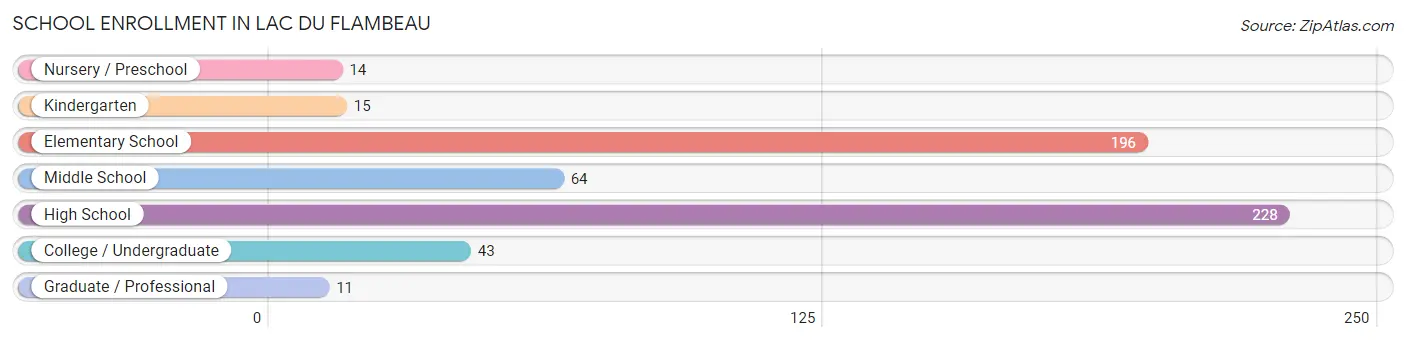
School Enrollment in Lac Du Flambeau
The most common levels of schooling among the 571 students in Lac Du Flambeau are high school (228 | 39.9%), elementary school (196 | 34.3%), and middle school (64 | 11.2%).
| School Level | # Students | % Students |
| Nursery / Preschool | 14 | 2.5% |
| Kindergarten | 15 | 2.6% |
| Elementary School | 196 | 34.3% |
| Middle School | 64 | 11.2% |
| High School | 228 | 39.9% |
| College / Undergraduate | 43 | 7.5% |
| Graduate / Professional | 11 | 1.9% |
| Total | 571 | 100.0% |
School Enrollment by Age by Funding Source in Lac Du Flambeau
Out of a total of 571 students who are enrolled in schools in Lac Du Flambeau, 7 (1.2%) attend a private institution, while the remaining 564 (98.8%) are enrolled in public schools. The age group of 35 years and over has the highest likelihood of being enrolled in private schools, with 7 (46.7% in the age bracket) enrolled. Conversely, the age group of 3 to 4 year olds has the lowest likelihood of being enrolled in a private school, with 14 (100.0% in the age bracket) attending a public institution.
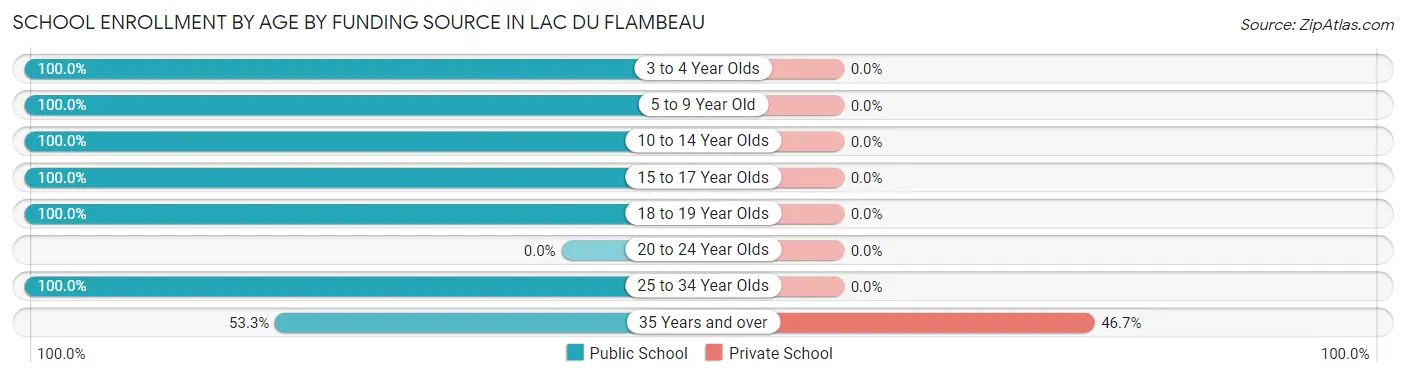
| Age Bracket | Public School | Private School |
| 3 to 4 Year Olds | 14 (100.0%) | 0 (0.0%) |
| 5 to 9 Year Old | 200 (100.0%) | 0 (0.0%) |
| 10 to 14 Year Olds | 192 (100.0%) | 0 (0.0%) |
| 15 to 17 Year Olds | 89 (100.0%) | 0 (0.0%) |
| 18 to 19 Year Olds | 39 (100.0%) | 0 (0.0%) |
| 20 to 24 Year Olds | 0 (0.0%) | 0 (0.0%) |
| 25 to 34 Year Olds | 22 (100.0%) | 0 (0.0%) |
| 35 Years and over | 8 (53.3%) | 7 (46.7%) |
| Total | 564 (98.8%) | 7 (1.2%) |
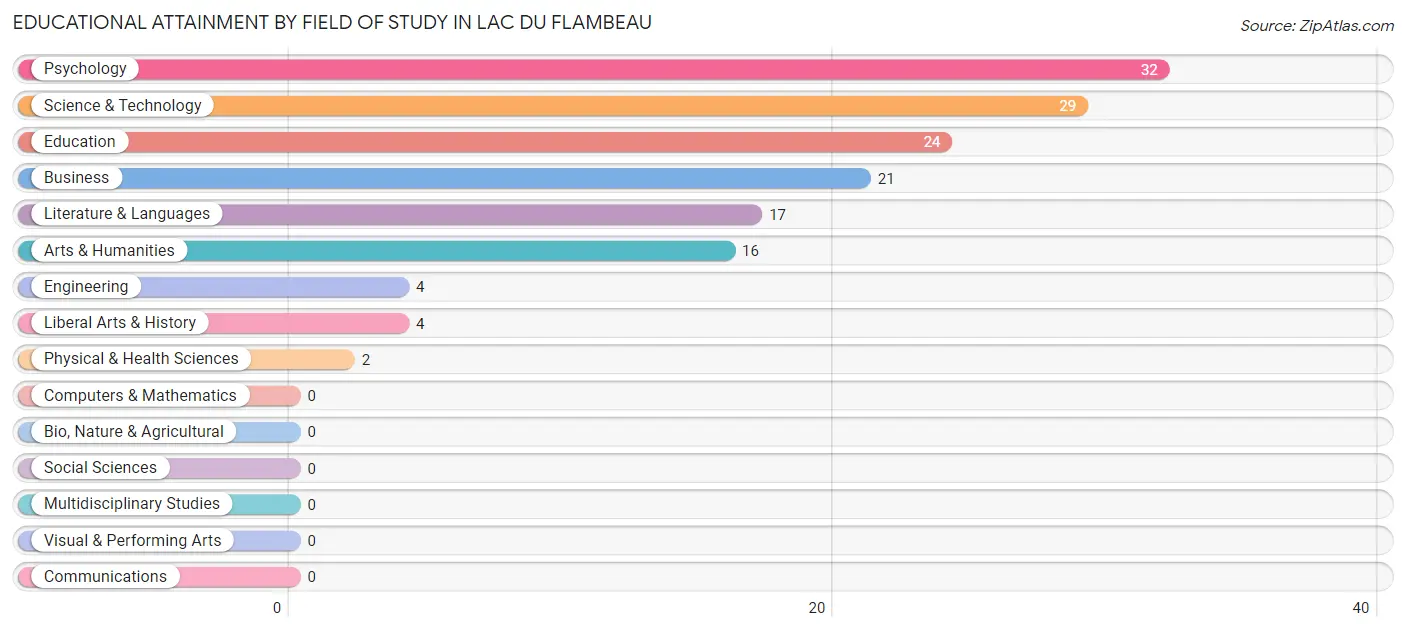
Educational Attainment by Field of Study in Lac Du Flambeau
Psychology (32 | 21.5%), science & technology (29 | 19.5%), education (24 | 16.1%), business (21 | 14.1%), and literature & languages (17 | 11.4%) are the most common fields of study among 149 individuals in Lac Du Flambeau who have obtained a bachelor's degree or higher.
| Field of Study | # Graduates | % Graduates |
| Computers & Mathematics | 0 | 0.0% |
| Bio, Nature & Agricultural | 0 | 0.0% |
| Physical & Health Sciences | 2 | 1.3% |
| Psychology | 32 | 21.5% |
| Social Sciences | 0 | 0.0% |
| Engineering | 4 | 2.7% |
| Multidisciplinary Studies | 0 | 0.0% |
| Science & Technology | 29 | 19.5% |
| Business | 21 | 14.1% |
| Education | 24 | 16.1% |
| Literature & Languages | 17 | 11.4% |
| Liberal Arts & History | 4 | 2.7% |
| Visual & Performing Arts | 0 | 0.0% |
| Communications | 0 | 0.0% |
| Arts & Humanities | 16 | 10.7% |
| Total | 149 | 100.0% |
Transportation & Commute in Lac Du Flambeau
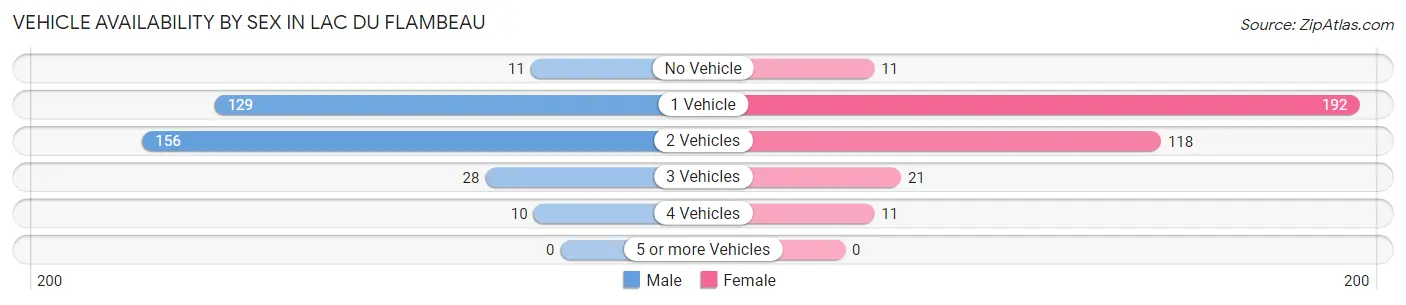
Vehicle Availability by Sex in Lac Du Flambeau
The most prevalent vehicle ownership categories in Lac Du Flambeau are males with 2 vehicles (156, accounting for 46.7%) and females with 2 vehicles (118, making up 44.2%).
| Vehicles Available | Male | Female |
| No Vehicle | 11 (3.3%) | 11 (3.1%) |
| 1 Vehicle | 129 (38.6%) | 192 (54.4%) |
| 2 Vehicles | 156 (46.7%) | 118 (33.4%) |
| 3 Vehicles | 28 (8.4%) | 21 (5.9%) |
| 4 Vehicles | 10 (3.0%) | 11 (3.1%) |
| 5 or more Vehicles | 0 (0.0%) | 0 (0.0%) |
| Total | 334 (100.0%) | 353 (100.0%) |
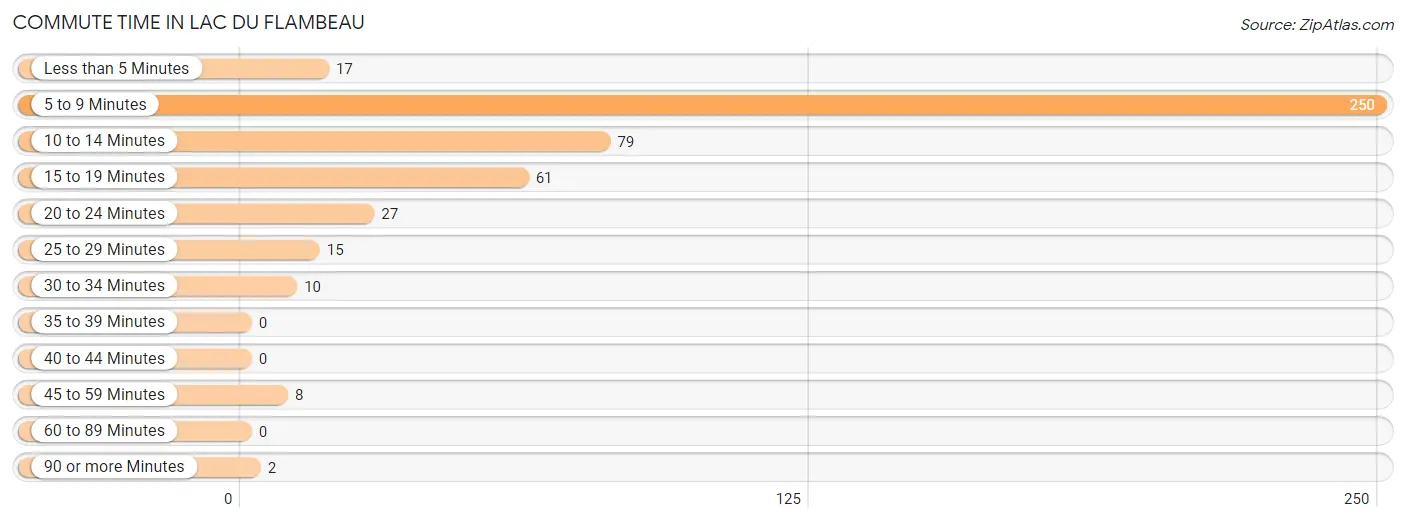
Commute Time in Lac Du Flambeau
The most frequently occuring commute durations in Lac Du Flambeau are 5 to 9 minutes (250 commuters, 53.3%), 10 to 14 minutes (79 commuters, 16.8%), and 15 to 19 minutes (61 commuters, 13.0%).
| Commute Time | # Commuters | % Commuters |
| Less than 5 Minutes | 17 | 3.6% |
| 5 to 9 Minutes | 250 | 53.3% |
| 10 to 14 Minutes | 79 | 16.8% |
| 15 to 19 Minutes | 61 | 13.0% |
| 20 to 24 Minutes | 27 | 5.8% |
| 25 to 29 Minutes | 15 | 3.2% |
| 30 to 34 Minutes | 10 | 2.1% |
| 35 to 39 Minutes | 0 | 0.0% |
| 40 to 44 Minutes | 0 | 0.0% |
| 45 to 59 Minutes | 8 | 1.7% |
| 60 to 89 Minutes | 0 | 0.0% |
| 90 or more Minutes | 2 | 0.4% |
Commute Time by Sex in Lac Du Flambeau
The most common commute times in Lac Du Flambeau are 5 to 9 minutes (140 commuters, 53.8%) for males and 5 to 9 minutes (110 commuters, 52.6%) for females.
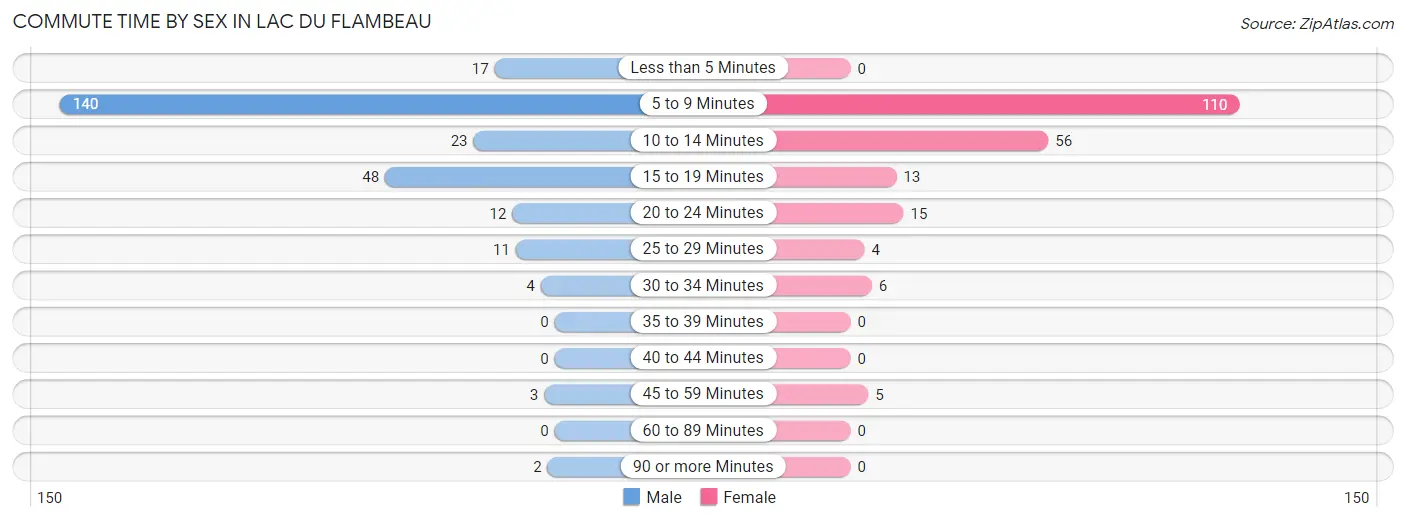
| Commute Time | Male | Female |
| Less than 5 Minutes | 17 (6.5%) | 0 (0.0%) |
| 5 to 9 Minutes | 140 (53.8%) | 110 (52.6%) |
| 10 to 14 Minutes | 23 (8.8%) | 56 (26.8%) |
| 15 to 19 Minutes | 48 (18.5%) | 13 (6.2%) |
| 20 to 24 Minutes | 12 (4.6%) | 15 (7.2%) |
| 25 to 29 Minutes | 11 (4.2%) | 4 (1.9%) |
| 30 to 34 Minutes | 4 (1.5%) | 6 (2.9%) |
| 35 to 39 Minutes | 0 (0.0%) | 0 (0.0%) |
| 40 to 44 Minutes | 0 (0.0%) | 0 (0.0%) |
| 45 to 59 Minutes | 3 (1.1%) | 5 (2.4%) |
| 60 to 89 Minutes | 0 (0.0%) | 0 (0.0%) |
| 90 or more Minutes | 2 (0.8%) | 0 (0.0%) |
Time of Departure to Work by Sex in Lac Du Flambeau
The most frequent times of departure to work in Lac Du Flambeau are 8:00 AM to 8:29 AM (51, 19.6%) for males and 5:30 AM to 5:59 AM (43, 20.6%) for females.
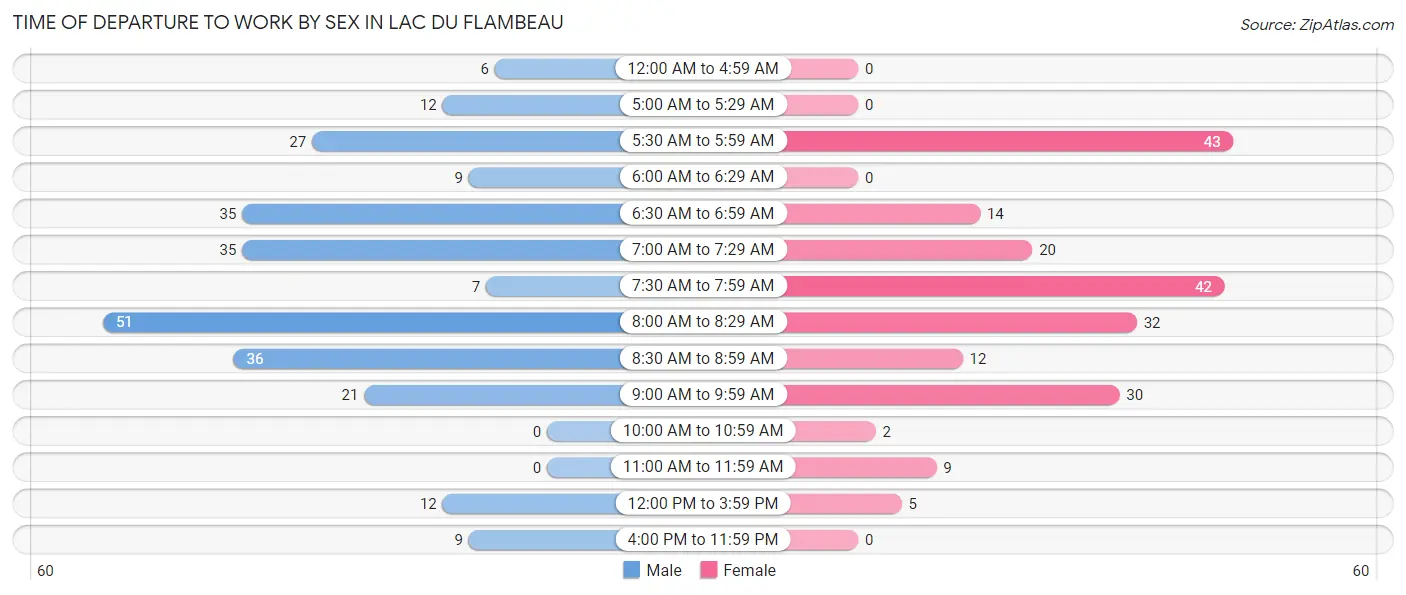
| Time of Departure | Male | Female |
| 12:00 AM to 4:59 AM | 6 (2.3%) | 0 (0.0%) |
| 5:00 AM to 5:29 AM | 12 (4.6%) | 0 (0.0%) |
| 5:30 AM to 5:59 AM | 27 (10.4%) | 43 (20.6%) |
| 6:00 AM to 6:29 AM | 9 (3.5%) | 0 (0.0%) |
| 6:30 AM to 6:59 AM | 35 (13.5%) | 14 (6.7%) |
| 7:00 AM to 7:29 AM | 35 (13.5%) | 20 (9.6%) |
| 7:30 AM to 7:59 AM | 7 (2.7%) | 42 (20.1%) |
| 8:00 AM to 8:29 AM | 51 (19.6%) | 32 (15.3%) |
| 8:30 AM to 8:59 AM | 36 (13.9%) | 12 (5.7%) |
| 9:00 AM to 9:59 AM | 21 (8.1%) | 30 (14.3%) |
| 10:00 AM to 10:59 AM | 0 (0.0%) | 2 (1.0%) |
| 11:00 AM to 11:59 AM | 0 (0.0%) | 9 (4.3%) |
| 12:00 PM to 3:59 PM | 12 (4.6%) | 5 (2.4%) |
| 4:00 PM to 11:59 PM | 9 (3.5%) | 0 (0.0%) |
| Total | 260 (100.0%) | 209 (100.0%) |
Housing Occupancy in Lac Du Flambeau
Occupancy by Ownership in Lac Du Flambeau
Of the total 704 dwellings in Lac Du Flambeau, owner-occupied units account for 345 (49.0%), while renter-occupied units make up 359 (51.0%).
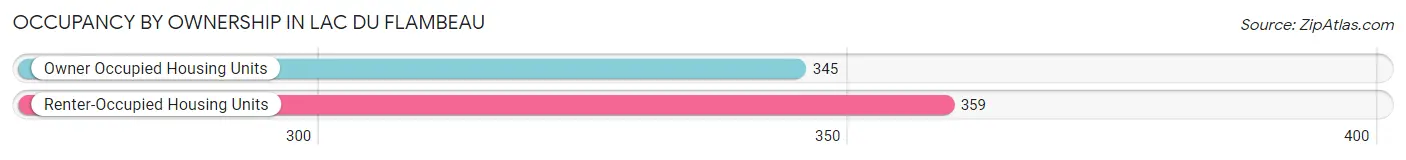
| Occupancy | # Housing Units | % Housing Units |
| Owner Occupied Housing Units | 345 | 49.0% |
| Renter-Occupied Housing Units | 359 | 51.0% |
| Total Occupied Housing Units | 704 | 100.0% |
Occupancy by Household Size in Lac Du Flambeau
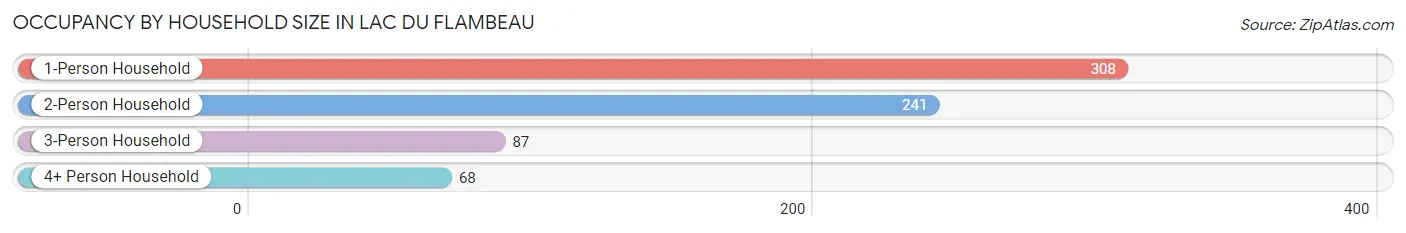
| Household Size | # Housing Units | % Housing Units |
| 1-Person Household | 308 | 43.8% |
| 2-Person Household | 241 | 34.2% |
| 3-Person Household | 87 | 12.4% |
| 4+ Person Household | 68 | 9.7% |
| Total Housing Units | 704 | 100.0% |
Occupancy by Ownership by Household Size in Lac Du Flambeau
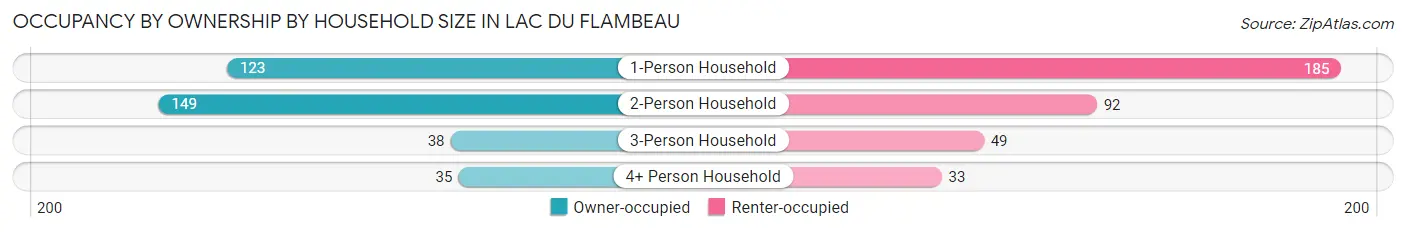
| Household Size | Owner-occupied | Renter-occupied |
| 1-Person Household | 123 (39.9%) | 185 (60.1%) |
| 2-Person Household | 149 (61.8%) | 92 (38.2%) |
| 3-Person Household | 38 (43.7%) | 49 (56.3%) |
| 4+ Person Household | 35 (51.5%) | 33 (48.5%) |
| Total Housing Units | 345 (49.0%) | 359 (51.0%) |
Occupancy by Educational Attainment in Lac Du Flambeau
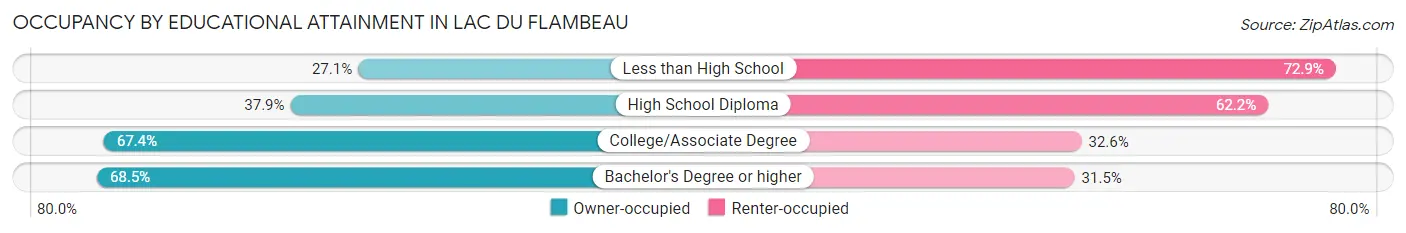
| Household Size | Owner-occupied | Renter-occupied |
| Less than High School | 16 (27.1%) | 43 (72.9%) |
| High School Diploma | 137 (37.9%) | 225 (62.2%) |
| College/Associate Degree | 118 (67.4%) | 57 (32.6%) |
| Bachelor's Degree or higher | 74 (68.5%) | 34 (31.5%) |
Occupancy by Age of Householder in Lac Du Flambeau
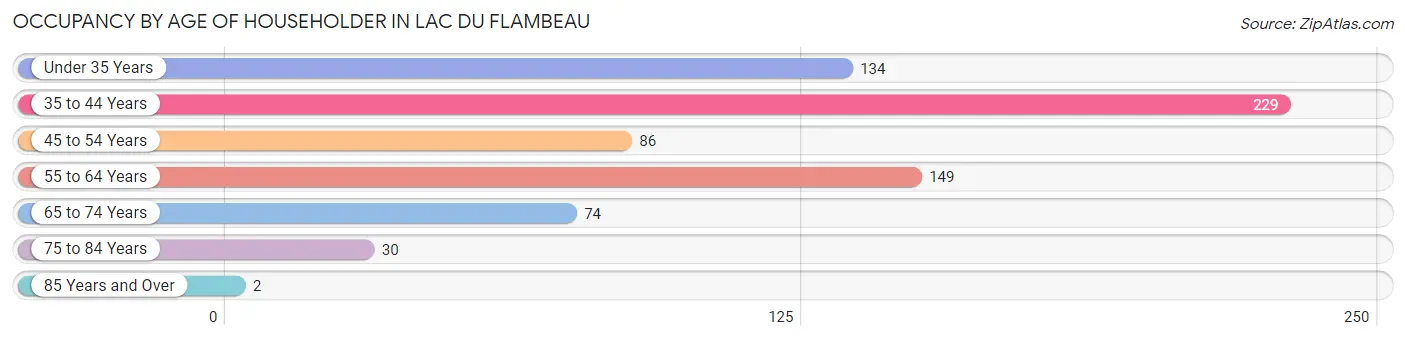
| Age Bracket | # Households | % Households |
| Under 35 Years | 134 | 19.0% |
| 35 to 44 Years | 229 | 32.5% |
| 45 to 54 Years | 86 | 12.2% |
| 55 to 64 Years | 149 | 21.2% |
| 65 to 74 Years | 74 | 10.5% |
| 75 to 84 Years | 30 | 4.3% |
| 85 Years and Over | 2 | 0.3% |
| Total | 704 | 100.0% |
Housing Finances in Lac Du Flambeau
Median Income by Occupancy in Lac Du Flambeau
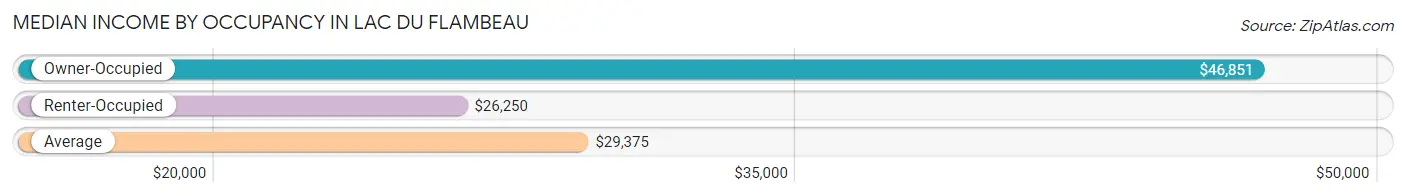
| Occupancy Type | # Households | Median Income |
| Owner-Occupied | 345 (49.0%) | $46,851 |
| Renter-Occupied | 359 (51.0%) | $26,250 |
| Average | 704 (100.0%) | $29,375 |
Occupancy by Householder Income Bracket in Lac Du Flambeau
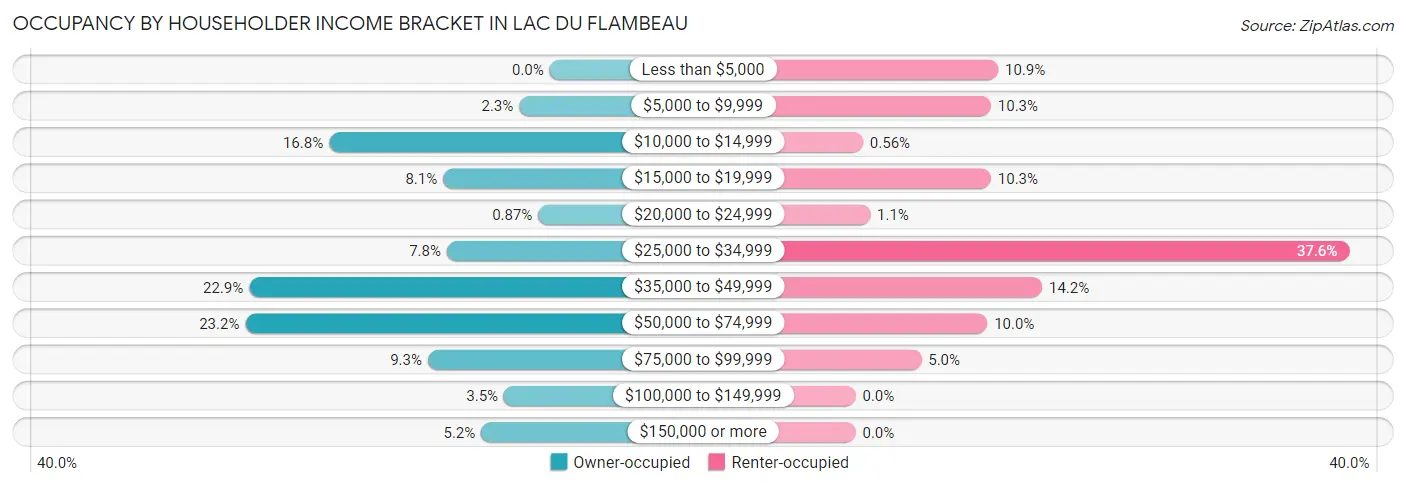
| Income Bracket | Owner-occupied | Renter-occupied |
| Less than $5,000 | 0 (0.0%) | 39 (10.9%) |
| $5,000 to $9,999 | 8 (2.3%) | 37 (10.3%) |
| $10,000 to $14,999 | 58 (16.8%) | 2 (0.6%) |
| $15,000 to $19,999 | 28 (8.1%) | 37 (10.3%) |
| $20,000 to $24,999 | 3 (0.9%) | 4 (1.1%) |
| $25,000 to $34,999 | 27 (7.8%) | 135 (37.6%) |
| $35,000 to $49,999 | 79 (22.9%) | 51 (14.2%) |
| $50,000 to $74,999 | 80 (23.2%) | 36 (10.0%) |
| $75,000 to $99,999 | 32 (9.3%) | 18 (5.0%) |
| $100,000 to $149,999 | 12 (3.5%) | 0 (0.0%) |
| $150,000 or more | 18 (5.2%) | 0 (0.0%) |
| Total | 345 (100.0%) | 359 (100.0%) |
Monthly Housing Cost Tiers in Lac Du Flambeau
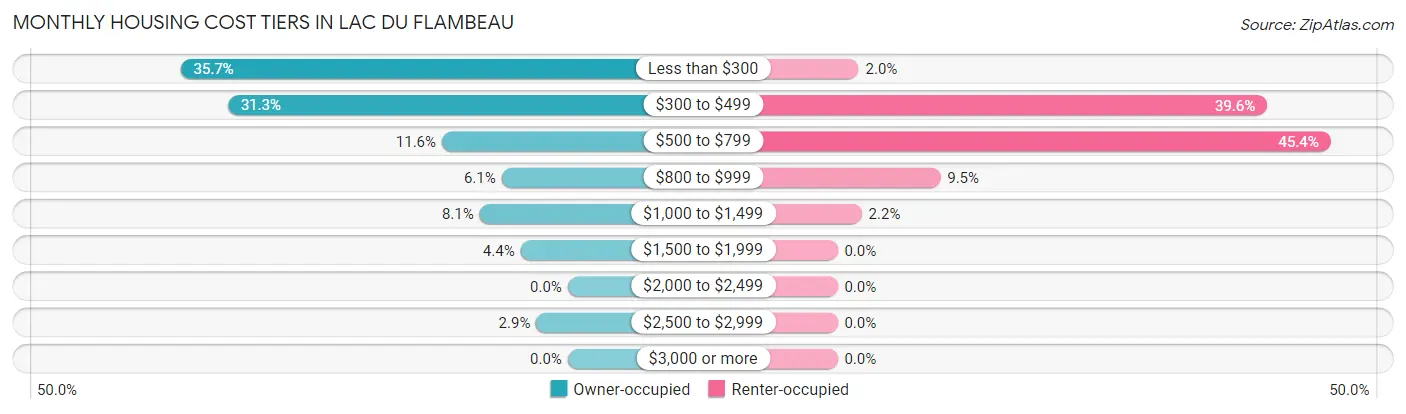
| Monthly Cost | Owner-occupied | Renter-occupied |
| Less than $300 | 123 (35.6%) | 7 (1.9%) |
| $300 to $499 | 108 (31.3%) | 142 (39.6%) |
| $500 to $799 | 40 (11.6%) | 163 (45.4%) |
| $800 to $999 | 21 (6.1%) | 34 (9.5%) |
| $1,000 to $1,499 | 28 (8.1%) | 8 (2.2%) |
| $1,500 to $1,999 | 15 (4.3%) | 0 (0.0%) |
| $2,000 to $2,499 | 0 (0.0%) | 0 (0.0%) |
| $2,500 to $2,999 | 10 (2.9%) | 0 (0.0%) |
| $3,000 or more | 0 (0.0%) | 0 (0.0%) |
| Total | 345 (100.0%) | 359 (100.0%) |
Physical Housing Characteristics in Lac Du Flambeau
Housing Structures in Lac Du Flambeau
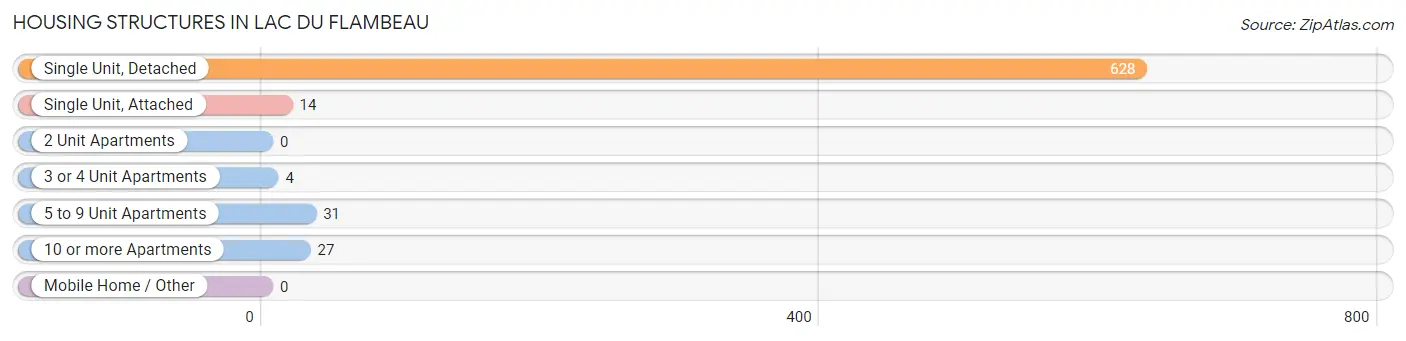
| Structure Type | # Housing Units | % Housing Units |
| Single Unit, Detached | 628 | 89.2% |
| Single Unit, Attached | 14 | 2.0% |
| 2 Unit Apartments | 0 | 0.0% |
| 3 or 4 Unit Apartments | 4 | 0.6% |
| 5 to 9 Unit Apartments | 31 | 4.4% |
| 10 or more Apartments | 27 | 3.8% |
| Mobile Home / Other | 0 | 0.0% |
| Total | 704 | 100.0% |
Housing Structures by Occupancy in Lac Du Flambeau
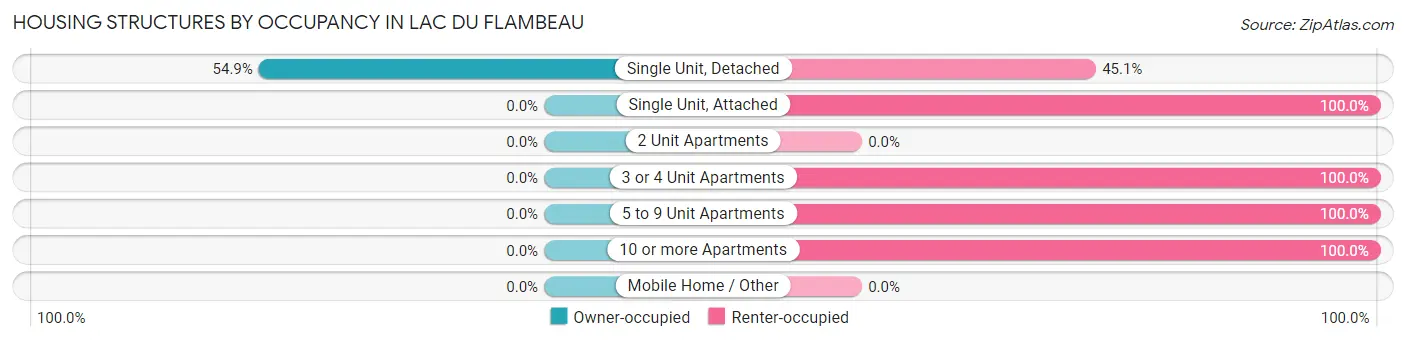
| Structure Type | Owner-occupied | Renter-occupied |
| Single Unit, Detached | 345 (54.9%) | 283 (45.1%) |
| Single Unit, Attached | 0 (0.0%) | 14 (100.0%) |
| 2 Unit Apartments | 0 (0.0%) | 0 (0.0%) |
| 3 or 4 Unit Apartments | 0 (0.0%) | 4 (100.0%) |
| 5 to 9 Unit Apartments | 0 (0.0%) | 31 (100.0%) |
| 10 or more Apartments | 0 (0.0%) | 27 (100.0%) |
| Mobile Home / Other | 0 (0.0%) | 0 (0.0%) |
| Total | 345 (49.0%) | 359 (51.0%) |
Housing Structures by Number of Rooms in Lac Du Flambeau
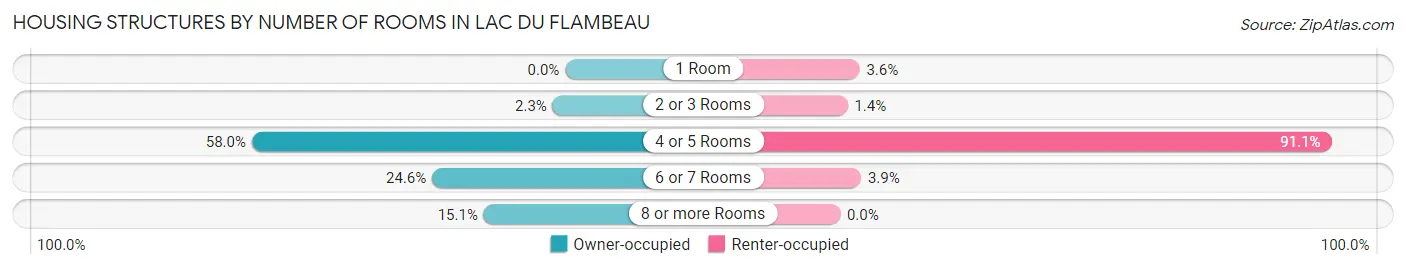
| Number of Rooms | Owner-occupied | Renter-occupied |
| 1 Room | 0 (0.0%) | 13 (3.6%) |
| 2 or 3 Rooms | 8 (2.3%) | 5 (1.4%) |
| 4 or 5 Rooms | 200 (58.0%) | 327 (91.1%) |
| 6 or 7 Rooms | 85 (24.6%) | 14 (3.9%) |
| 8 or more Rooms | 52 (15.1%) | 0 (0.0%) |
| Total | 345 (100.0%) | 359 (100.0%) |
Housing Structure by Heating Type in Lac Du Flambeau
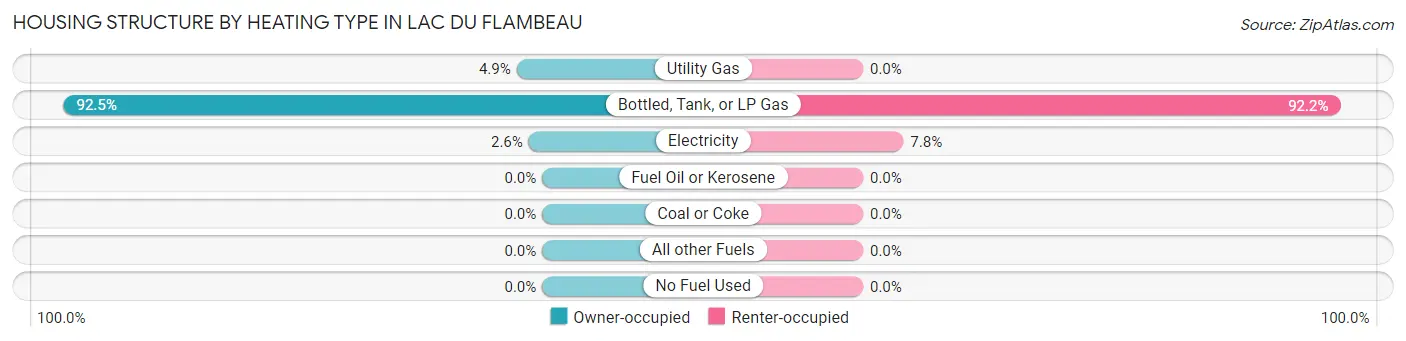
| Heating Type | Owner-occupied | Renter-occupied |
| Utility Gas | 17 (4.9%) | 0 (0.0%) |
| Bottled, Tank, or LP Gas | 319 (92.5%) | 331 (92.2%) |
| Electricity | 9 (2.6%) | 28 (7.8%) |
| Fuel Oil or Kerosene | 0 (0.0%) | 0 (0.0%) |
| Coal or Coke | 0 (0.0%) | 0 (0.0%) |
| All other Fuels | 0 (0.0%) | 0 (0.0%) |
| No Fuel Used | 0 (0.0%) | 0 (0.0%) |
| Total | 345 (100.0%) | 359 (100.0%) |
Household Vehicle Usage in Lac Du Flambeau
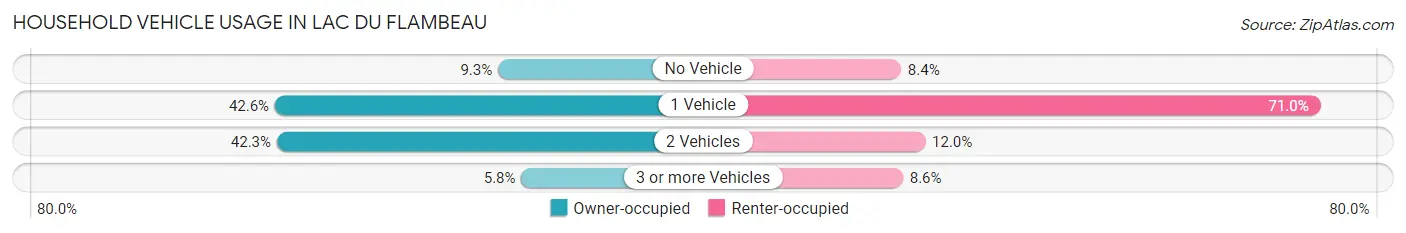
| Vehicles per Household | Owner-occupied | Renter-occupied |
| No Vehicle | 32 (9.3%) | 30 (8.4%) |
| 1 Vehicle | 147 (42.6%) | 255 (71.0%) |
| 2 Vehicles | 146 (42.3%) | 43 (12.0%) |
| 3 or more Vehicles | 20 (5.8%) | 31 (8.6%) |
| Total | 345 (100.0%) | 359 (100.0%) |
Real Estate & Mortgages in Lac Du Flambeau
Real Estate and Mortgage Overview in Lac Du Flambeau
| Characteristic | Without Mortgage | With Mortgage |
| Housing Units | 276 | 69 |
| Median Property Value | $86,400 | $201,800 |
| Median Household Income | $46,276 | $0 |
| Monthly Housing Costs | $330 | $0 |
| Real Estate Taxes | $3,500 | $41 |
Property Value by Mortgage Status in Lac Du Flambeau
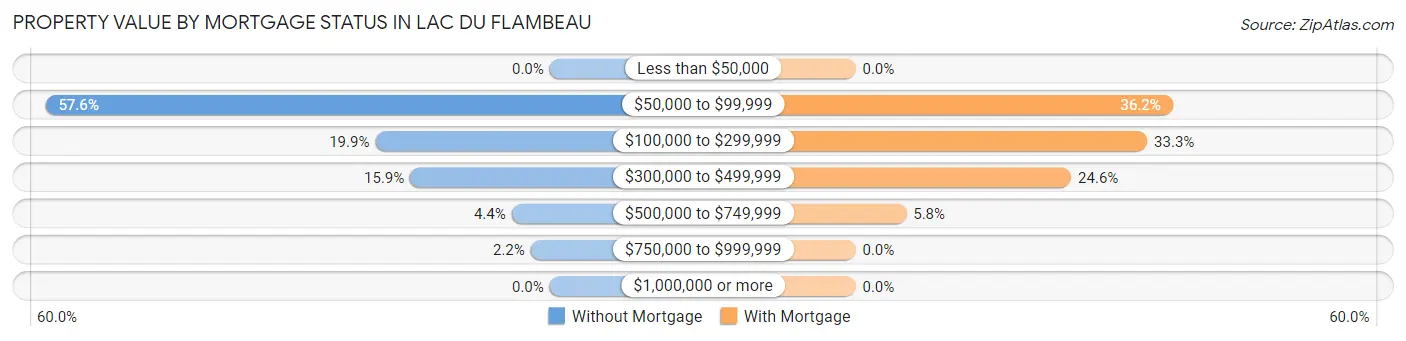
| Property Value | Without Mortgage | With Mortgage |
| Less than $50,000 | 0 (0.0%) | 0 (0.0%) |
| $50,000 to $99,999 | 159 (57.6%) | 25 (36.2%) |
| $100,000 to $299,999 | 55 (19.9%) | 23 (33.3%) |
| $300,000 to $499,999 | 44 (15.9%) | 17 (24.6%) |
| $500,000 to $749,999 | 12 (4.3%) | 4 (5.8%) |
| $750,000 to $999,999 | 6 (2.2%) | 0 (0.0%) |
| $1,000,000 or more | 0 (0.0%) | 0 (0.0%) |
| Total | 276 (100.0%) | 69 (100.0%) |
Household Income by Mortgage Status in Lac Du Flambeau
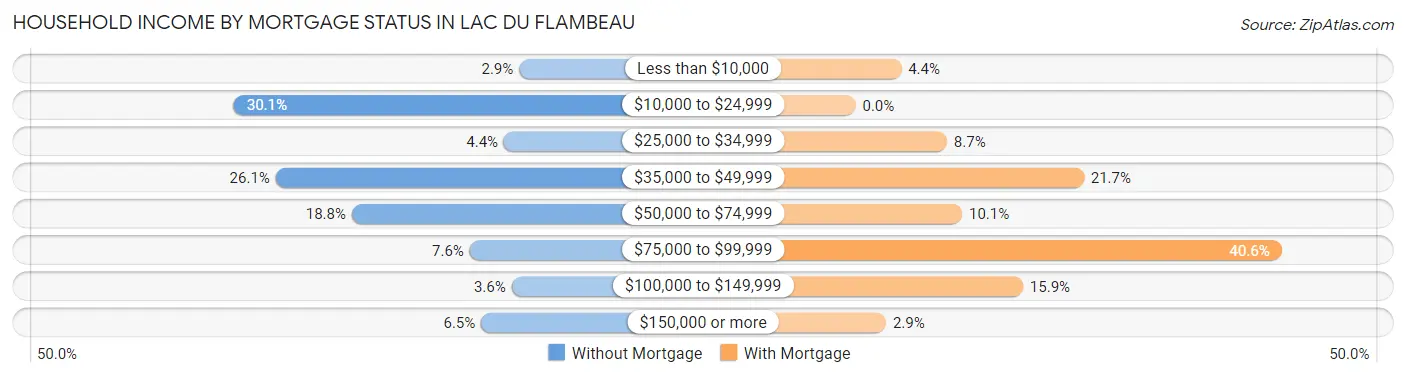
| Household Income | Without Mortgage | With Mortgage |
| Less than $10,000 | 8 (2.9%) | 3 (4.3%) |
| $10,000 to $24,999 | 83 (30.1%) | 0 (0.0%) |
| $25,000 to $34,999 | 12 (4.3%) | 6 (8.7%) |
| $35,000 to $49,999 | 72 (26.1%) | 15 (21.7%) |
| $50,000 to $74,999 | 52 (18.8%) | 7 (10.1%) |
| $75,000 to $99,999 | 21 (7.6%) | 28 (40.6%) |
| $100,000 to $149,999 | 10 (3.6%) | 11 (15.9%) |
| $150,000 or more | 18 (6.5%) | 2 (2.9%) |
| Total | 276 (100.0%) | 69 (100.0%) |
Property Value to Household Income Ratio in Lac Du Flambeau
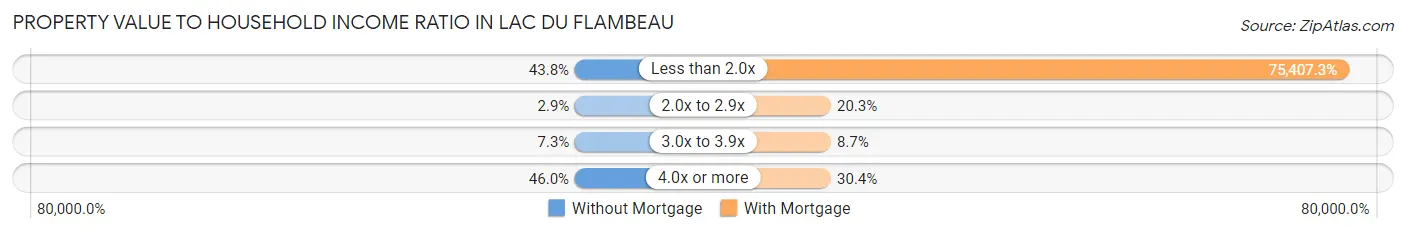
| Value-to-Income Ratio | Without Mortgage | With Mortgage |
| Less than 2.0x | 121 (43.8%) | 52,031 (75,407.2%) |
| 2.0x to 2.9x | 8 (2.9%) | 14 (20.3%) |
| 3.0x to 3.9x | 20 (7.2%) | 6 (8.7%) |
| 4.0x or more | 127 (46.0%) | 21 (30.4%) |
| Total | 276 (100.0%) | 69 (100.0%) |
Real Estate Taxes by Mortgage Status in Lac Du Flambeau
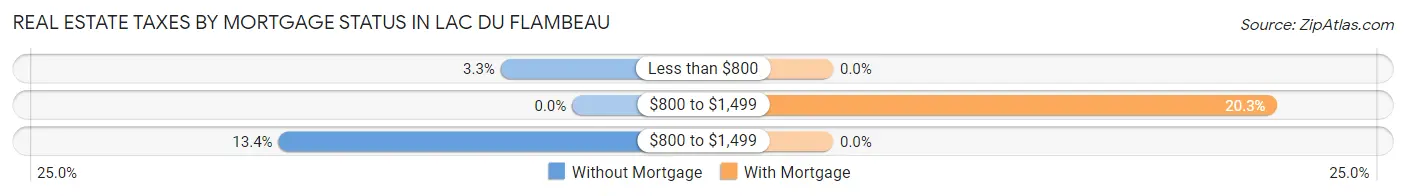
| Property Taxes | Without Mortgage | With Mortgage |
| Less than $800 | 9 (3.3%) | 0 (0.0%) |
| $800 to $1,499 | 0 (0.0%) | 14 (20.3%) |
| $800 to $1,499 | 37 (13.4%) | 0 (0.0%) |
| Total | 276 (100.0%) | 69 (100.0%) |
Health & Disability in Lac Du Flambeau
Health Insurance Coverage by Age in Lac Du Flambeau
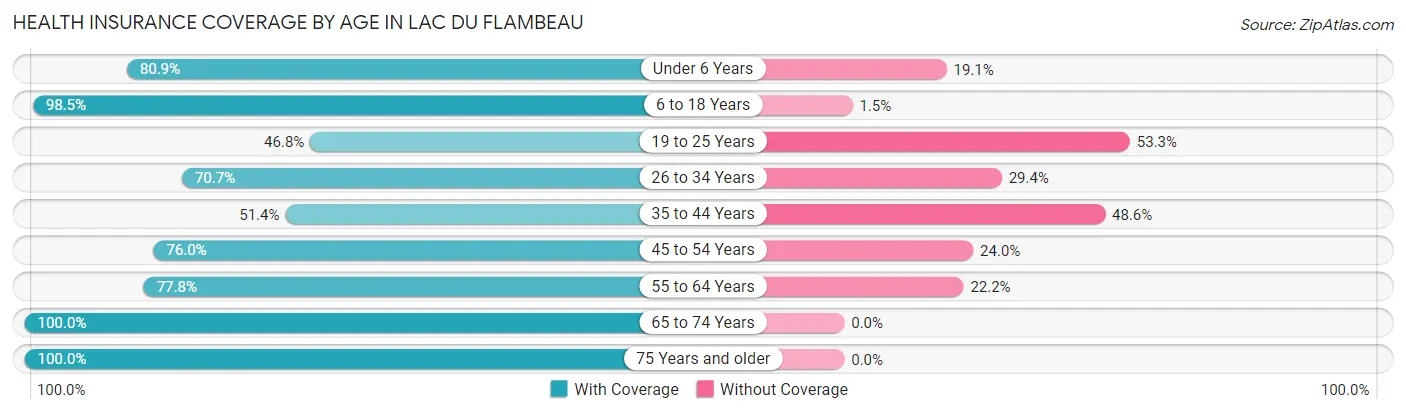
| Age Bracket | With Coverage | Without Coverage |
| Under 6 Years | 123 (80.9%) | 29 (19.1%) |
| 6 to 18 Years | 512 (98.5%) | 8 (1.5%) |
| 19 to 25 Years | 36 (46.8%) | 41 (53.2%) |
| 26 to 34 Years | 195 (70.7%) | 81 (29.3%) |
| 35 to 44 Years | 130 (51.4%) | 123 (48.6%) |
| 45 to 54 Years | 98 (76.0%) | 31 (24.0%) |
| 55 to 64 Years | 140 (77.8%) | 40 (22.2%) |
| 65 to 74 Years | 117 (100.0%) | 0 (0.0%) |
| 75 Years and older | 51 (100.0%) | 0 (0.0%) |
| Total | 1,402 (79.9%) | 353 (20.1%) |
Health Insurance Coverage by Citizenship Status in Lac Du Flambeau
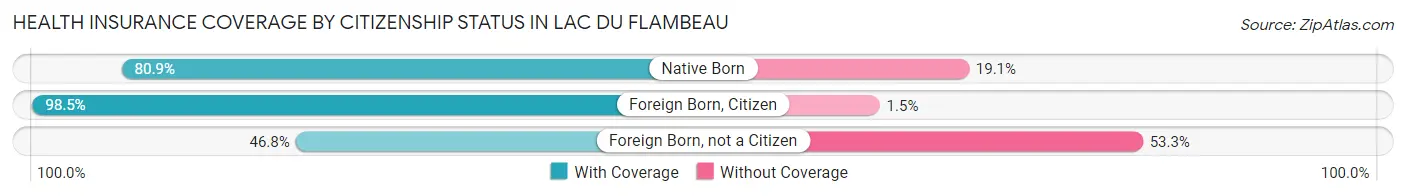
| Citizenship Status | With Coverage | Without Coverage |
| Native Born | 123 (80.9%) | 29 (19.1%) |
| Foreign Born, Citizen | 512 (98.5%) | 8 (1.5%) |
| Foreign Born, not a Citizen | 36 (46.8%) | 41 (53.2%) |
Health Insurance Coverage by Household Income in Lac Du Flambeau
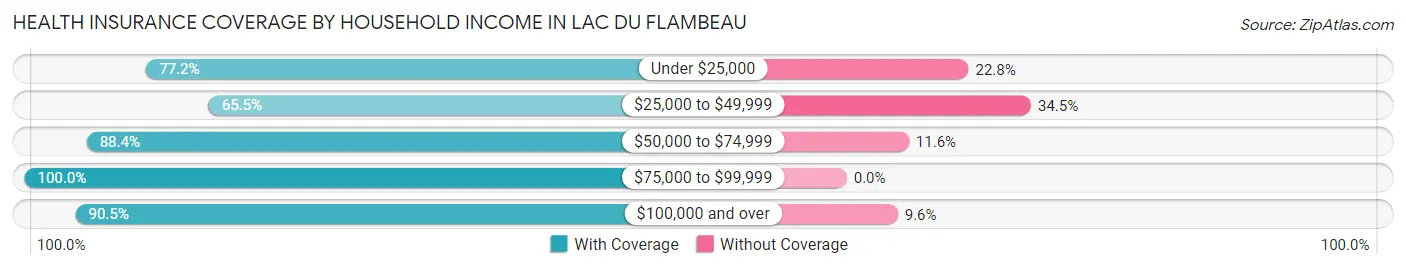
| Household Income | With Coverage | Without Coverage |
| Under $25,000 | 406 (77.2%) | 120 (22.8%) |
| $25,000 to $49,999 | 313 (65.5%) | 165 (34.5%) |
| $50,000 to $74,999 | 387 (88.4%) | 51 (11.6%) |
| $75,000 to $99,999 | 120 (100.0%) | 0 (0.0%) |
| $100,000 and over | 161 (90.4%) | 17 (9.6%) |
Public vs Private Health Insurance Coverage by Age in Lac Du Flambeau
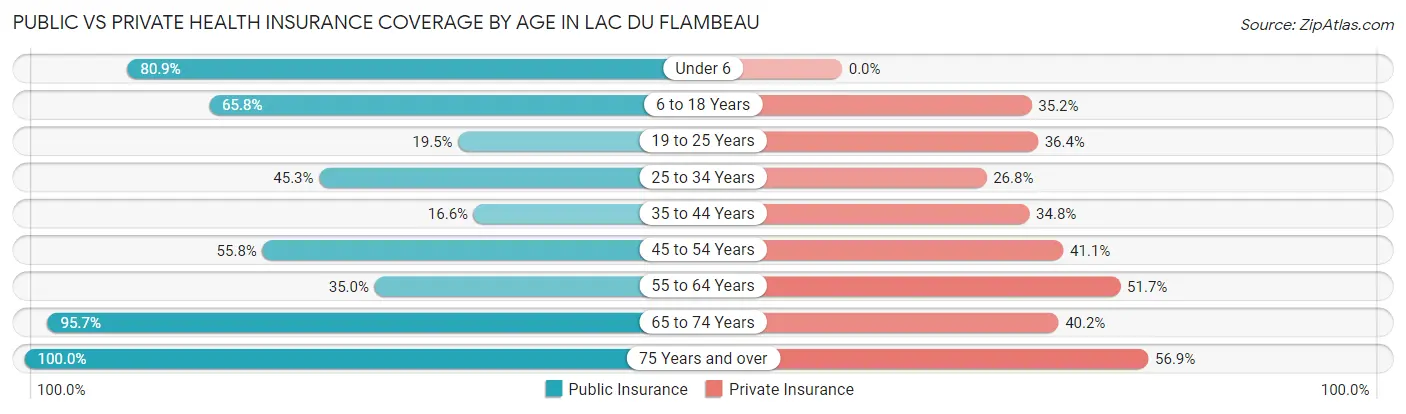
| Age Bracket | Public Insurance | Private Insurance |
| Under 6 | 123 (80.9%) | 0 (0.0%) |
| 6 to 18 Years | 342 (65.8%) | 183 (35.2%) |
| 19 to 25 Years | 15 (19.5%) | 28 (36.4%) |
| 25 to 34 Years | 125 (45.3%) | 74 (26.8%) |
| 35 to 44 Years | 42 (16.6%) | 88 (34.8%) |
| 45 to 54 Years | 72 (55.8%) | 53 (41.1%) |
| 55 to 64 Years | 63 (35.0%) | 93 (51.7%) |
| 65 to 74 Years | 112 (95.7%) | 47 (40.2%) |
| 75 Years and over | 51 (100.0%) | 29 (56.9%) |
| Total | 945 (53.8%) | 595 (33.9%) |
Disability Status by Sex by Age in Lac Du Flambeau
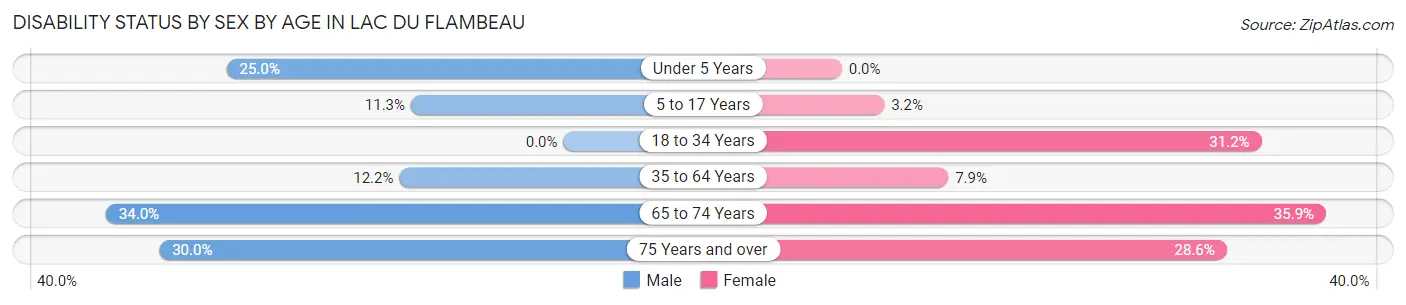
| Age Bracket | Male | Female |
| Under 5 Years | 22 (25.0%) | 0 (0.0%) |
| 5 to 17 Years | 30 (11.3%) | 7 (3.2%) |
| 18 to 34 Years | 0 (0.0%) | 57 (31.1%) |
| 35 to 64 Years | 33 (12.2%) | 23 (7.9%) |
| 65 to 74 Years | 18 (34.0%) | 23 (35.9%) |
| 75 Years and over | 9 (30.0%) | 6 (28.6%) |
Disability Class by Sex by Age in Lac Du Flambeau
Disability Class: Hearing Difficulty
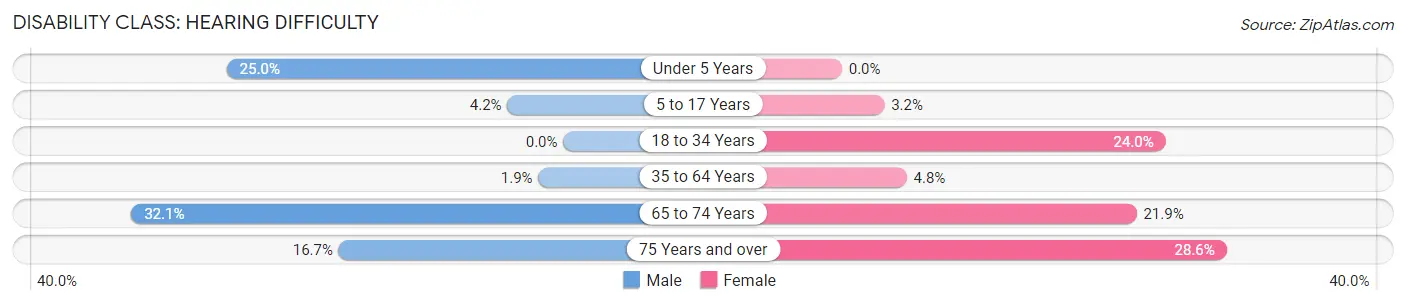
| Age Bracket | Male | Female |
| Under 5 Years | 22 (25.0%) | 0 (0.0%) |
| 5 to 17 Years | 11 (4.2%) | 7 (3.2%) |
| 18 to 34 Years | 0 (0.0%) | 44 (24.0%) |
| 35 to 64 Years | 5 (1.8%) | 14 (4.8%) |
| 65 to 74 Years | 17 (32.1%) | 14 (21.9%) |
| 75 Years and over | 5 (16.7%) | 6 (28.6%) |
Disability Class: Vision Difficulty
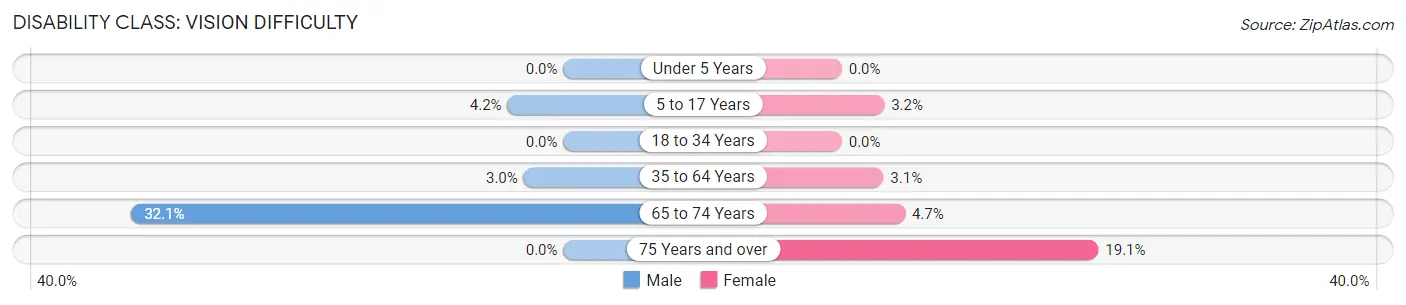
| Age Bracket | Male | Female |
| Under 5 Years | 0 (0.0%) | 0 (0.0%) |
| 5 to 17 Years | 11 (4.2%) | 7 (3.2%) |
| 18 to 34 Years | 0 (0.0%) | 0 (0.0%) |
| 35 to 64 Years | 8 (2.9%) | 9 (3.1%) |
| 65 to 74 Years | 17 (32.1%) | 3 (4.7%) |
| 75 Years and over | 0 (0.0%) | 4 (19.1%) |
Disability Class: Cognitive Difficulty
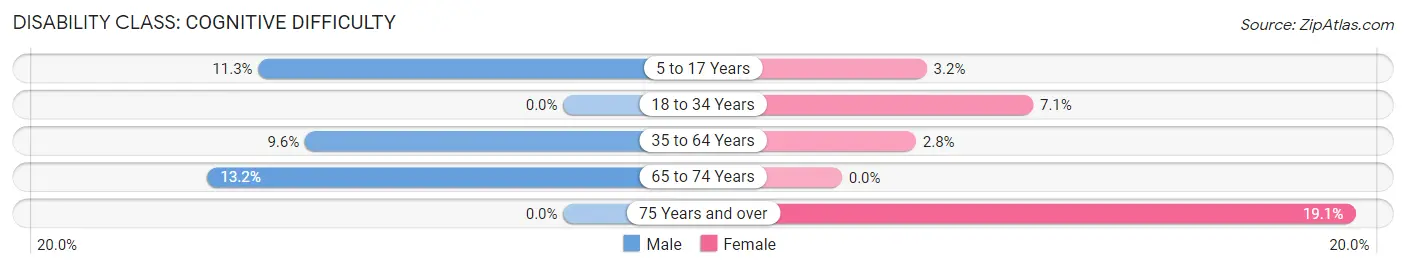
| Age Bracket | Male | Female |
| 5 to 17 Years | 30 (11.3%) | 7 (3.2%) |
| 18 to 34 Years | 0 (0.0%) | 13 (7.1%) |
| 35 to 64 Years | 26 (9.6%) | 8 (2.8%) |
| 65 to 74 Years | 7 (13.2%) | 0 (0.0%) |
| 75 Years and over | 0 (0.0%) | 4 (19.1%) |
Disability Class: Ambulatory Difficulty
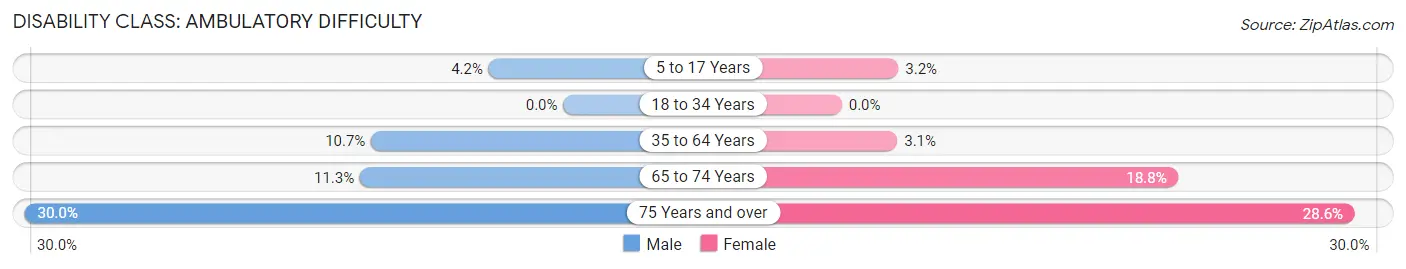
| Age Bracket | Male | Female |
| 5 to 17 Years | 11 (4.2%) | 7 (3.2%) |
| 18 to 34 Years | 0 (0.0%) | 0 (0.0%) |
| 35 to 64 Years | 29 (10.7%) | 9 (3.1%) |
| 65 to 74 Years | 6 (11.3%) | 12 (18.8%) |
| 75 Years and over | 9 (30.0%) | 6 (28.6%) |
Disability Class: Self-Care Difficulty
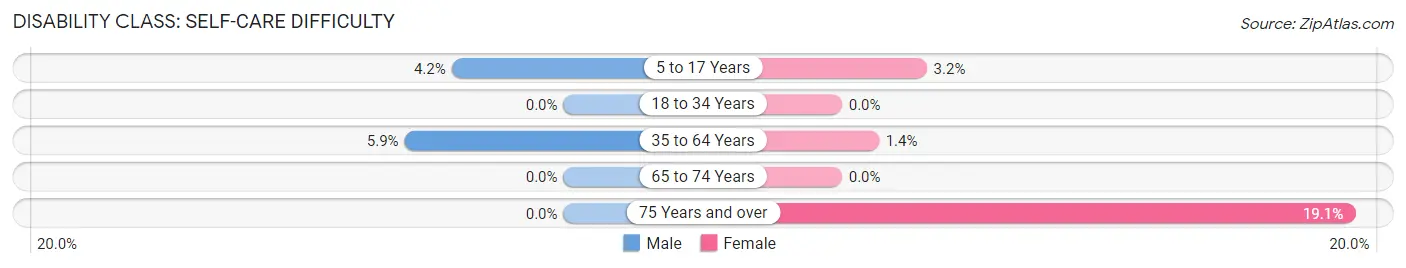
| Age Bracket | Male | Female |
| 5 to 17 Years | 11 (4.2%) | 7 (3.2%) |
| 18 to 34 Years | 0 (0.0%) | 0 (0.0%) |
| 35 to 64 Years | 16 (5.9%) | 4 (1.4%) |
| 65 to 74 Years | 0 (0.0%) | 0 (0.0%) |
| 75 Years and over | 0 (0.0%) | 4 (19.1%) |
Technology Access in Lac Du Flambeau
Computing Device Access in Lac Du Flambeau
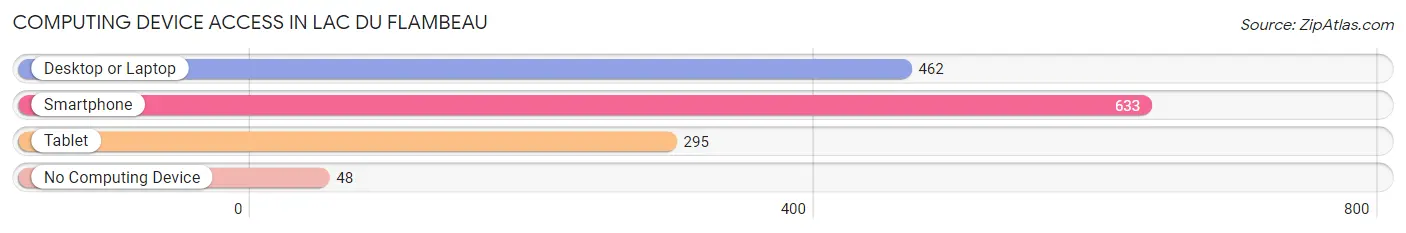
| Device Type | # Households | % Households |
| Desktop or Laptop | 462 | 65.6% |
| Smartphone | 633 | 89.9% |
| Tablet | 295 | 41.9% |
| No Computing Device | 48 | 6.8% |
| Total | 704 | 100.0% |
Internet Access in Lac Du Flambeau
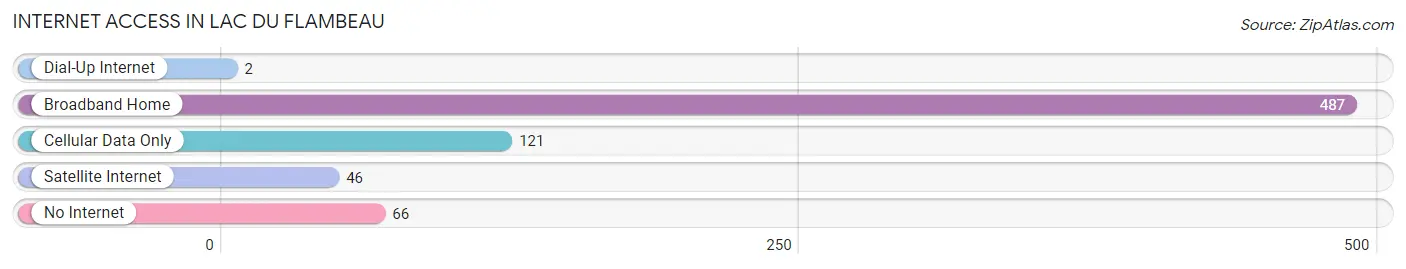
| Internet Type | # Households | % Households |
| Dial-Up Internet | 2 | 0.3% |
| Broadband Home | 487 | 69.2% |
| Cellular Data Only | 121 | 17.2% |
| Satellite Internet | 46 | 6.5% |
| No Internet | 66 | 9.4% |
| Total | 704 | 100.0% |
Lac Du Flambeau Summary
Lac Du Flambeau is a small town located in Vilas County, Wisconsin. It is situated on the shores of Lake of the Torches, a large lake in the northern part of the state. The town is home to the Lac du Flambeau Band of Lake Superior Chippewa Indians, a federally recognized tribe. The population of the town was 1,622 at the 2010 census.
History
The Lac du Flambeau area has been inhabited by Native Americans for centuries. The Lac du Flambeau Band of Lake Superior Chippewa Indians is a federally recognized tribe that has lived in the area since the late 1700s. The tribe is descended from the Ojibwe people, who were originally from the Great Lakes region. The tribe has a long history of fishing, hunting, and gathering in the area.
The town of Lac du Flambeau was founded in 1854 by French-Canadian fur traders. The town was named after the lake, which was named for the torches used by the Ojibwe people to light their way while fishing. The town was incorporated in 1891 and has remained a small, rural community ever since.
Geography
Lac du Flambeau is located in northern Wisconsin, in Vilas County. The town is situated on the shores of Lake of the Torches, a large lake in the northern part of the state. The lake is approximately 8,000 acres in size and is a popular destination for fishing, boating, and other recreational activities. The town is surrounded by forests and lakes, making it a popular destination for outdoor enthusiasts.
The town is located approximately 30 miles north of the city of Minocqua and approximately 40 miles south of the city of Ironwood, Michigan. The nearest major airport is in Rhinelander, Wisconsin, which is approximately 40 miles away.
Economy
The economy of Lac du Flambeau is largely based on tourism and the service industry. The town is a popular destination for outdoor recreation, such as fishing, boating, and camping. The town is also home to the Lac du Flambeau Band of Lake Superior Chippewa Indians, which operates a casino and resort in the area. The casino and resort are a major source of employment and revenue for the town.
The town is also home to several small businesses, including restaurants, retail stores, and other services. The town is also home to a number of manufacturing companies, including a paper mill and a wood products company.
Demographics
As of the 2010 census, the population of Lac du Flambeau was 1,622. The racial makeup of the town was 94.3% White, 0.7% African American, 2.2% Native American, 0.2% Asian, 0.1% Pacific Islander, 0.7% from other races, and 1.9% from two or more races. Hispanic or Latino of any race were 1.9% of the population.
The median household income in the town was $31,250, and the median family income was $37,500. The per capita income for the town was $17,845. About 16.2% of families and 19.2% of the population were below the poverty line, including 28.3% of those under age 18 and 8.3% of those age 65 or over.
Common Questions
What is Per Capita Income in Lac Du Flambeau?
Per Capita income in Lac Du Flambeau is $18,396.
What is the Median Family Income in Lac Du Flambeau?
Median Family Income in Lac Du Flambeau is $41,750.
What is the Median Household income in Lac Du Flambeau?
Median Household Income in Lac Du Flambeau is $29,375.
What is Income or Wage Gap in Lac Du Flambeau?
Income or Wage Gap in Lac Du Flambeau is 14.9%.
Women in Lac Du Flambeau earn 85.1 cents for every dollar earned by a man.
What is Inequality or Gini Index in Lac Du Flambeau?
Inequality or Gini Index in Lac Du Flambeau is 0.47.
What is the Total Population of Lac Du Flambeau?
Total Population of Lac Du Flambeau is 1,755.
What is the Total Male Population of Lac Du Flambeau?
Total Male Population of Lac Du Flambeau is 921.
What is the Total Female Population of Lac Du Flambeau?
Total Female Population of Lac Du Flambeau is 834.
What is the Ratio of Males per 100 Females in Lac Du Flambeau?
There are 110.43 Males per 100 Females in Lac Du Flambeau.
What is the Ratio of Females per 100 Males in Lac Du Flambeau?
There are 90.55 Females per 100 Males in Lac Du Flambeau.
What is the Median Population Age in Lac Du Flambeau?
Median Population Age in Lac Du Flambeau is 29.1 Years.
What is the Average Family Size in Lac Du Flambeau
Average Family Size in Lac Du Flambeau is 3.5 People.
What is the Average Household Size in Lac Du Flambeau
Average Household Size in Lac Du Flambeau is 2.5 People.
How Large is the Labor Force in Lac Du Flambeau?
There are 770 People in the Labor Forcein in Lac Du Flambeau.
What is the Percentage of People in the Labor Force in Lac Du Flambeau?
66.3% of People are in the Labor Force in Lac Du Flambeau.
What is the Unemployment Rate in Lac Du Flambeau?
Unemployment Rate in Lac Du Flambeau is 10.8%.