Hayward, WI Map & Demographics
Hayward Map
Hayward Overview
$27,700
PER CAPITA INCOME
$53,516
AVG FAMILY INCOME
$39,422
AVG HOUSEHOLD INCOME
35.1%
WAGE / INCOME GAP [ % ]
64.9¢/ $1
WAGE / INCOME GAP [ $ ]
0.44
INEQUALITY / GINI INDEX
2,526
TOTAL POPULATION
1,302
MALE POPULATION
1,224
FEMALE POPULATION
106.37
MALES / 100 FEMALES
94.01
FEMALES / 100 MALES
38.7
MEDIAN AGE
2.8
AVG FAMILY SIZE
2.0
AVG HOUSEHOLD SIZE
1,222
LABOR FORCE [ PEOPLE ]
61.7%
PERCENT IN LABOR FORCE
5.4%
UNEMPLOYMENT RATE
Hayward Zip Codes
Hayward Area Codes
Income in Hayward
Income Overview in Hayward
Per Capita Income in Hayward is $27,700, while median incomes of families and households are $53,516 and $39,422 respectively.
| Characteristic | Number | Measure |
| Per Capita Income | 2,526 | $27,700 |
| Median Family Income | 575 | $53,516 |
| Mean Family Income | 575 | $75,185 |
| Median Household Income | 1,183 | $39,422 |
| Mean Household Income | 1,183 | $58,101 |
| Income Deficit | 575 | $0 |
| Wage / Income Gap (%) | 2,526 | 35.08% |
| Wage / Income Gap ($) | 2,526 | 64.92¢ per $1 |
| Gini / Inequality Index | 2,526 | 0.44 |
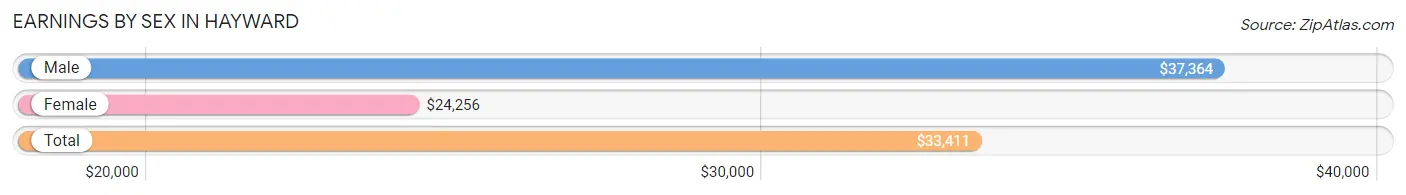
Earnings by Sex in Hayward
Average Earnings in Hayward are $33,411, $37,364 for men and $24,256 for women, a difference of 35.1%.
| Sex | Number | Average Earnings |
| Male | 762 (58.7%) | $37,364 |
| Female | 537 (41.3%) | $24,256 |
| Total | 1,299 (100.0%) | $33,411 |
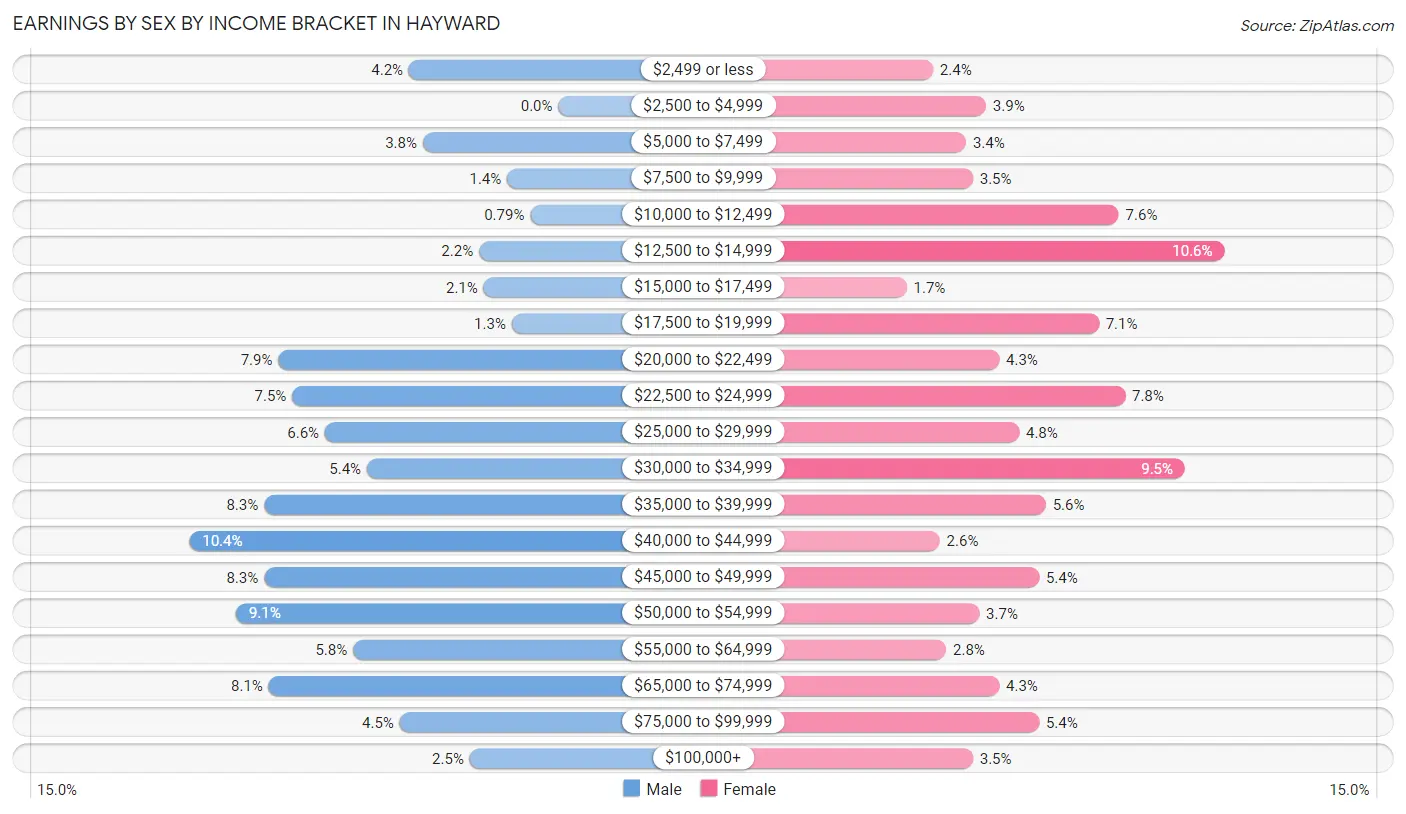
Earnings by Sex by Income Bracket in Hayward
The most common earnings brackets in Hayward are $40,000 to $44,999 for men (79 | 10.4%) and $12,500 to $14,999 for women (57 | 10.6%).
| Income | Male | Female |
| $2,499 or less | 32 (4.2%) | 13 (2.4%) |
| $2,500 to $4,999 | 0 (0.0%) | 21 (3.9%) |
| $5,000 to $7,499 | 29 (3.8%) | 18 (3.4%) |
| $7,500 to $9,999 | 11 (1.4%) | 19 (3.5%) |
| $10,000 to $12,499 | 6 (0.8%) | 41 (7.6%) |
| $12,500 to $14,999 | 17 (2.2%) | 57 (10.6%) |
| $15,000 to $17,499 | 16 (2.1%) | 9 (1.7%) |
| $17,500 to $19,999 | 10 (1.3%) | 38 (7.1%) |
| $20,000 to $22,499 | 60 (7.9%) | 23 (4.3%) |
| $22,500 to $24,999 | 57 (7.5%) | 42 (7.8%) |
| $25,000 to $29,999 | 50 (6.6%) | 26 (4.8%) |
| $30,000 to $34,999 | 41 (5.4%) | 51 (9.5%) |
| $35,000 to $39,999 | 63 (8.3%) | 30 (5.6%) |
| $40,000 to $44,999 | 79 (10.4%) | 14 (2.6%) |
| $45,000 to $49,999 | 63 (8.3%) | 29 (5.4%) |
| $50,000 to $54,999 | 69 (9.1%) | 20 (3.7%) |
| $55,000 to $64,999 | 44 (5.8%) | 15 (2.8%) |
| $65,000 to $74,999 | 62 (8.1%) | 23 (4.3%) |
| $75,000 to $99,999 | 34 (4.5%) | 29 (5.4%) |
| $100,000+ | 19 (2.5%) | 19 (3.5%) |
| Total | 762 (100.0%) | 537 (100.0%) |
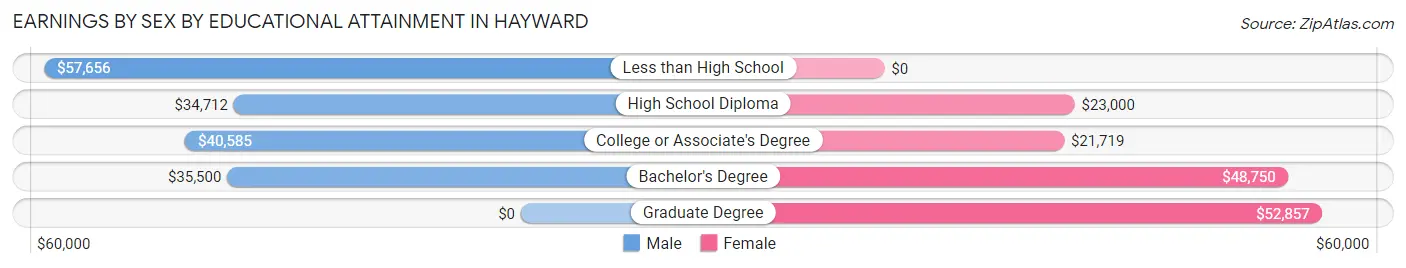
Earnings by Sex by Educational Attainment in Hayward
Average earnings in Hayward are $40,139 for men and $26,375 for women, a difference of 34.3%. Men with an educational attainment of less than high school enjoy the highest average annual earnings of $57,656, while those with high school diploma education earn the least with $34,712. Women with an educational attainment of graduate degree earn the most with the average annual earnings of $52,857, while those with college or associate's degree education have the smallest earnings of $21,719.
| Educational Attainment | Male Income | Female Income |
| Less than High School | $57,656 | $0 |
| High School Diploma | $34,712 | $23,000 |
| College or Associate's Degree | $40,585 | $21,719 |
| Bachelor's Degree | $35,500 | $48,750 |
| Graduate Degree | - | - |
| Total | $40,139 | $26,375 |
Family Income in Hayward
Family Income Brackets in Hayward
According to the Hayward family income data, there are 105 families falling into the $50,000 to $74,999 income range, which is the most common income bracket and makes up 18.3% of all families. Conversely, the less than $10,000 income bracket is the least frequent group with only 13 families (2.3%) belonging to this category.
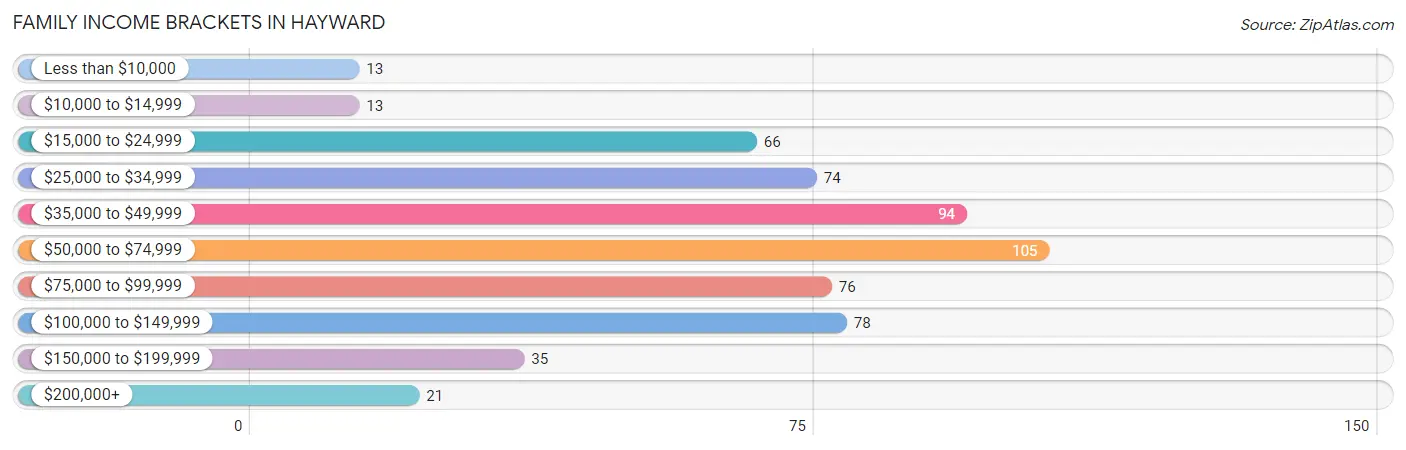
| Income Bracket | # Families | % Families |
| Less than $10,000 | 13 | 2.3% |
| $10,000 to $14,999 | 13 | 2.3% |
| $15,000 to $24,999 | 66 | 11.5% |
| $25,000 to $34,999 | 74 | 12.9% |
| $35,000 to $49,999 | 94 | 16.3% |
| $50,000 to $74,999 | 105 | 18.3% |
| $75,000 to $99,999 | 76 | 13.2% |
| $100,000 to $149,999 | 78 | 13.6% |
| $150,000 to $199,999 | 35 | 6.1% |
| $200,000+ | 21 | 3.7% |
Family Income by Famaliy Size in Hayward
2-person families (299 | 52.0%) account for the highest median family income in Hayward with $73,194 per family, while 2-person families (299 | 52.0%) have the highest median income of $36,597 per family member.
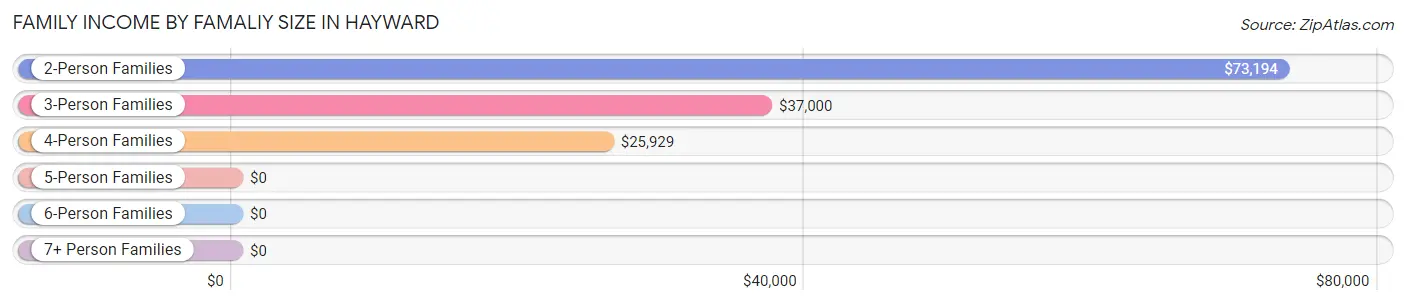
| Income Bracket | # Families | Median Income |
| 2-Person Families | 299 (52.0%) | $73,194 |
| 3-Person Families | 106 (18.4%) | $37,000 |
| 4-Person Families | 106 (18.4%) | $25,929 |
| 5-Person Families | 46 (8.0%) | $0 |
| 6-Person Families | 18 (3.1%) | $0 |
| 7+ Person Families | 0 (0.0%) | $0 |
| Total | 575 (100.0%) | $53,516 |
Family Income by Number of Earners in Hayward
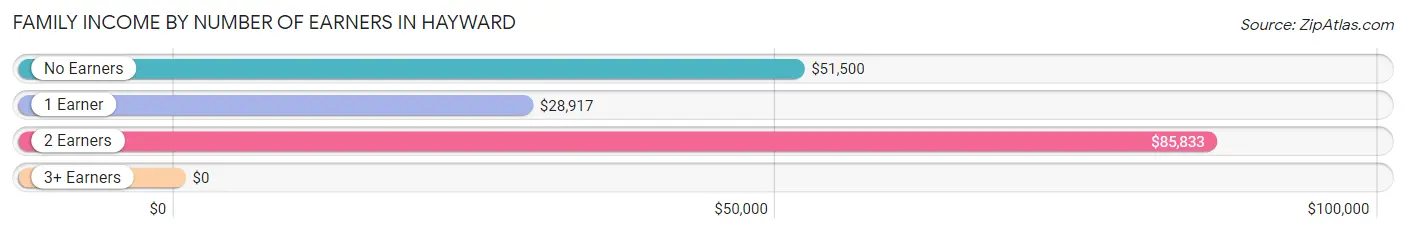
| Number of Earners | # Families | Median Income |
| No Earners | 54 (9.4%) | $51,500 |
| 1 Earner | 238 (41.4%) | $28,917 |
| 2 Earners | 252 (43.8%) | $85,833 |
| 3+ Earners | 31 (5.4%) | $0 |
| Total | 575 (100.0%) | $53,516 |
Household Income in Hayward
Household Income Brackets in Hayward
With 203 households falling in the category, the $50,000 to $74,999 income range is the most frequent in Hayward, accounting for 17.2% of all households. In contrast, only 21 households (1.8%) fall into the $200,000+ income bracket, making it the least populous group.
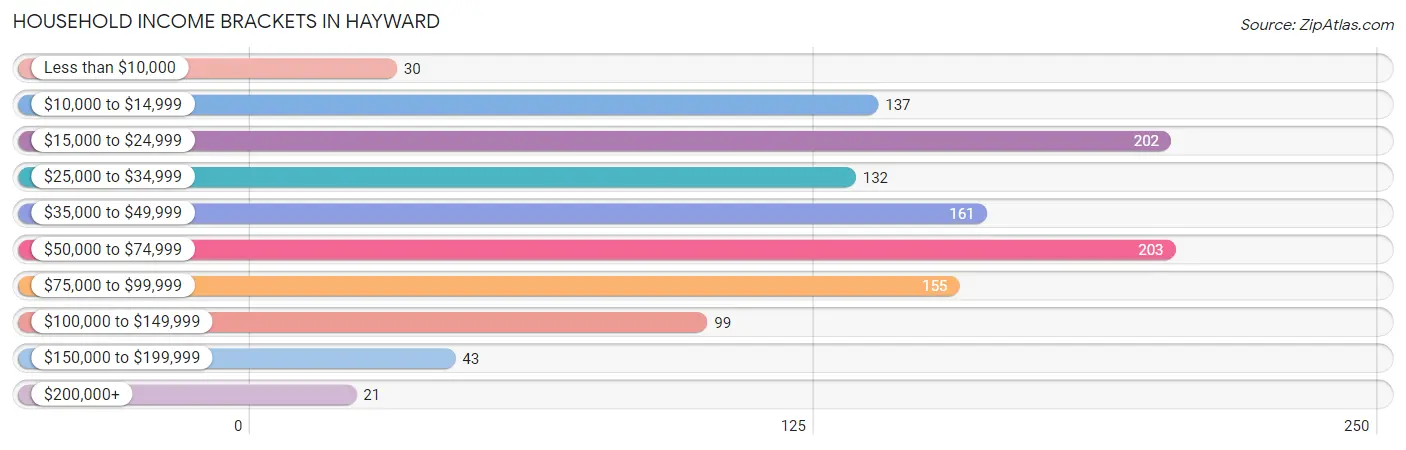
| Income Bracket | # Households | % Households |
| Less than $10,000 | 30 | 2.5% |
| $10,000 to $14,999 | 137 | 11.6% |
| $15,000 to $24,999 | 202 | 17.1% |
| $25,000 to $34,999 | 132 | 11.2% |
| $35,000 to $49,999 | 161 | 13.6% |
| $50,000 to $74,999 | 203 | 17.2% |
| $75,000 to $99,999 | 155 | 13.1% |
| $100,000 to $149,999 | 99 | 8.4% |
| $150,000 to $199,999 | 43 | 3.6% |
| $200,000+ | 21 | 1.8% |
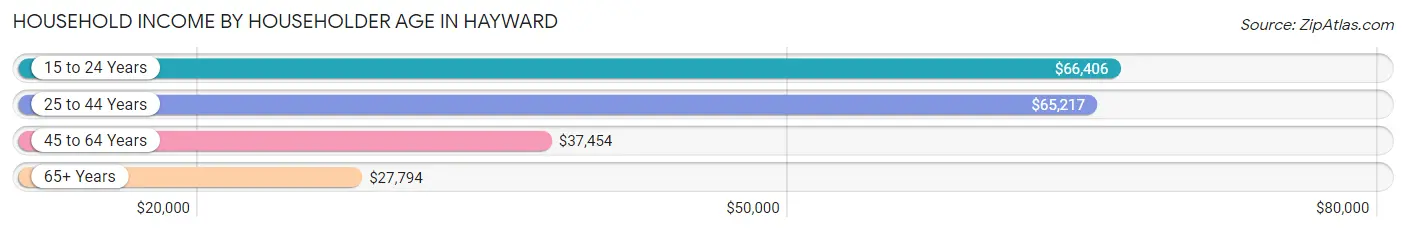
Household Income by Householder Age in Hayward
The median household income in Hayward is $39,422, with the highest median household income of $66,406 found in the 15 to 24 years age bracket for the primary householder. A total of 52 households (4.4%) fall into this category. Meanwhile, the 65+ years age bracket for the primary householder has the lowest median household income of $27,794, with 354 households (29.9%) in this group.
| Income Bracket | # Households | Median Income |
| 15 to 24 Years | 52 (4.4%) | $66,406 |
| 25 to 44 Years | 400 (33.8%) | $65,217 |
| 45 to 64 Years | 377 (31.9%) | $37,454 |
| 65+ Years | 354 (29.9%) | $27,794 |
| Total | 1,183 (100.0%) | $39,422 |
Poverty in Hayward
Income Below Poverty by Sex and Age in Hayward
With 19.0% poverty level for males and 22.9% for females among the residents of Hayward, 6 to 11 year old males and 6 to 11 year old females are the most vulnerable to poverty, with 53 males (80.3%) and 73 females (47.1%) in their respective age groups living below the poverty level.
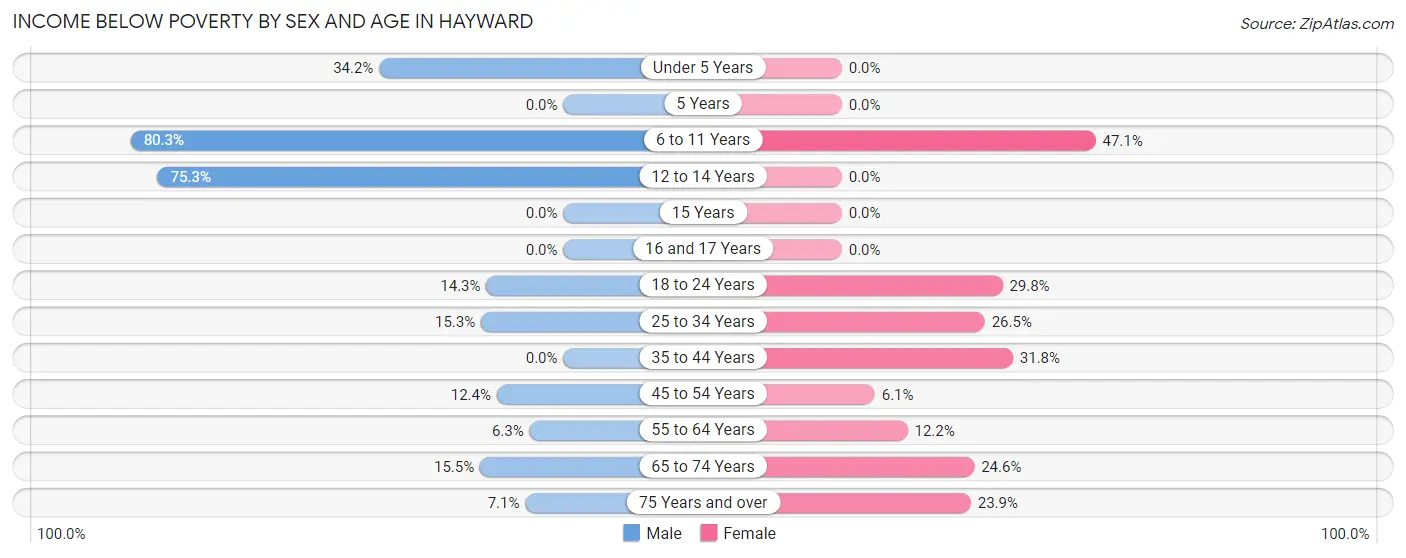
| Age Bracket | Male | Female |
| Under 5 Years | 27 (34.2%) | 0 (0.0%) |
| 5 Years | 0 (0.0%) | 0 (0.0%) |
| 6 to 11 Years | 53 (80.3%) | 73 (47.1%) |
| 12 to 14 Years | 61 (75.3%) | 0 (0.0%) |
| 15 Years | 0 (0.0%) | 0 (0.0%) |
| 16 and 17 Years | 0 (0.0%) | 0 (0.0%) |
| 18 to 24 Years | 8 (14.3%) | 17 (29.8%) |
| 25 to 34 Years | 35 (15.3%) | 39 (26.5%) |
| 35 to 44 Years | 0 (0.0%) | 40 (31.8%) |
| 45 to 54 Years | 10 (12.3%) | 6 (6.1%) |
| 55 to 64 Years | 15 (6.3%) | 25 (12.2%) |
| 65 to 74 Years | 15 (15.5%) | 29 (24.6%) |
| 75 Years and over | 6 (7.1%) | 34 (23.9%) |
| Total | 230 (19.0%) | 263 (22.9%) |
Income Above Poverty by Sex and Age in Hayward
According to the poverty statistics in Hayward, males aged 5 years and females aged under 5 years are the age groups that are most secure financially, with 100.0% of males and 100.0% of females in these age groups living above the poverty line.
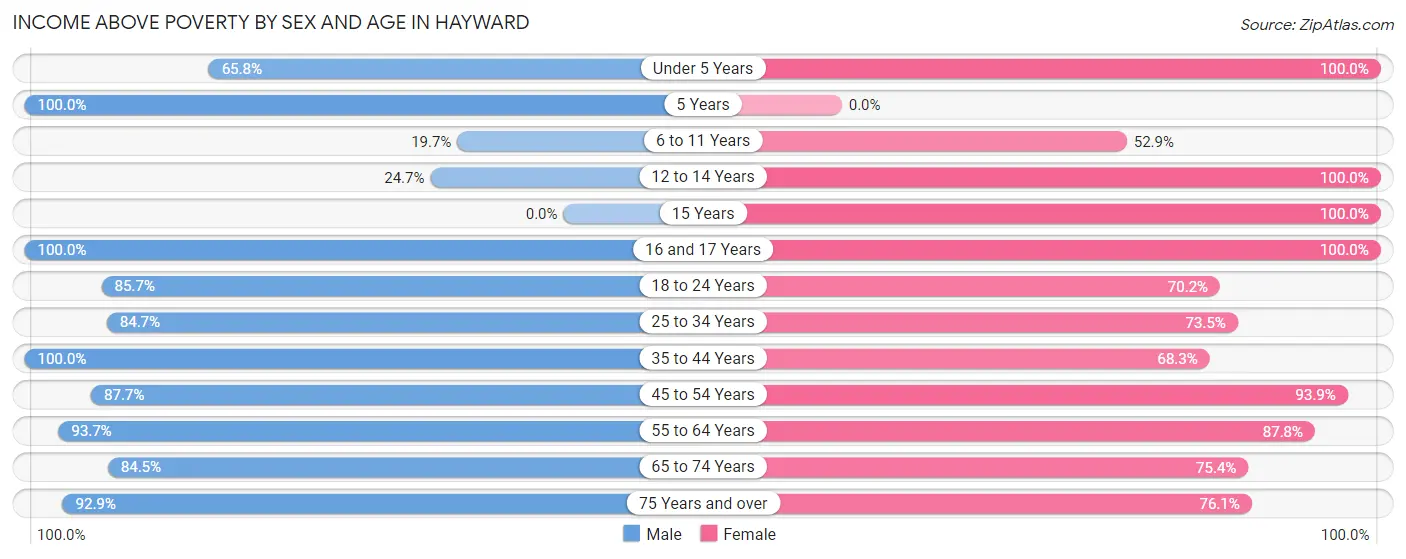
| Age Bracket | Male | Female |
| Under 5 Years | 52 (65.8%) | 69 (100.0%) |
| 5 Years | 23 (100.0%) | 0 (0.0%) |
| 6 to 11 Years | 13 (19.7%) | 82 (52.9%) |
| 12 to 14 Years | 20 (24.7%) | 9 (100.0%) |
| 15 Years | 0 (0.0%) | 15 (100.0%) |
| 16 and 17 Years | 30 (100.0%) | 7 (100.0%) |
| 18 to 24 Years | 48 (85.7%) | 40 (70.2%) |
| 25 to 34 Years | 194 (84.7%) | 108 (73.5%) |
| 35 to 44 Years | 147 (100.0%) | 86 (68.2%) |
| 45 to 54 Years | 71 (87.6%) | 92 (93.9%) |
| 55 to 64 Years | 224 (93.7%) | 180 (87.8%) |
| 65 to 74 Years | 82 (84.5%) | 89 (75.4%) |
| 75 Years and over | 79 (92.9%) | 108 (76.1%) |
| Total | 983 (81.0%) | 885 (77.1%) |
Income Below Poverty Among Married-Couple Families in Hayward
The poverty statistics for married-couple families in Hayward show that 2.8% or 10 of the total 364 families live below the poverty line. Families with no children have the highest poverty rate of 3.8%, comprising of 10 families. On the other hand, families with 1 or 2 children have the lowest poverty rate of 0.0%, which includes 0 families.
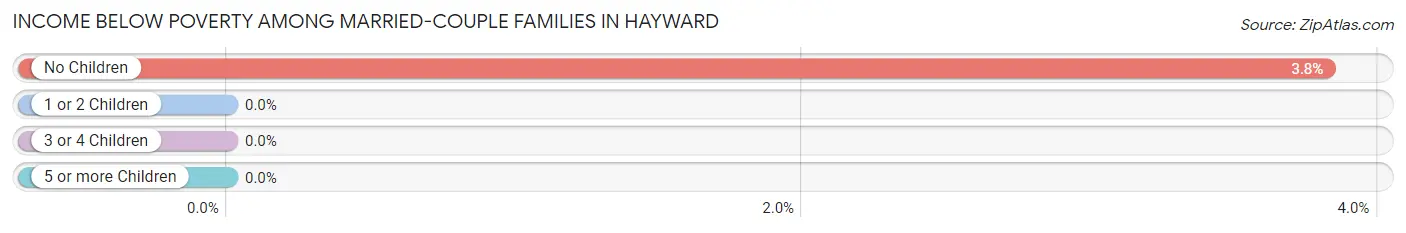
| Children | Above Poverty | Below Poverty |
| No Children | 252 (96.2%) | 10 (3.8%) |
| 1 or 2 Children | 56 (100.0%) | 0 (0.0%) |
| 3 or 4 Children | 46 (100.0%) | 0 (0.0%) |
| 5 or more Children | 0 (0.0%) | 0 (0.0%) |
| Total | 354 (97.3%) | 10 (2.8%) |
Income Below Poverty Among Single-Parent Households in Hayward
According to the poverty data in Hayward, 45.7% or 42 single-father households and 39.5% or 47 single-mother households are living below the poverty line. Among single-father households, those with 3 or 4 children have the highest poverty rate, with 35 households (100.0%) experiencing poverty. Likewise, among single-mother households, those with 3 or 4 children have the highest poverty rate, with 32 households (76.2%) falling below the poverty line.
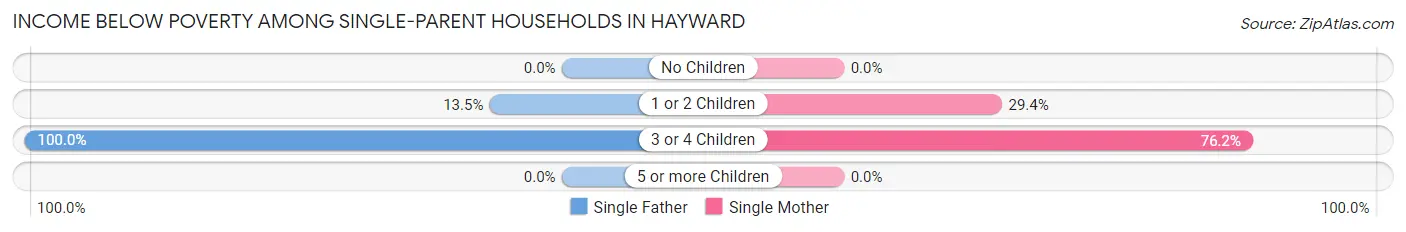
| Children | Single Father | Single Mother |
| No Children | 0 (0.0%) | 0 (0.0%) |
| 1 or 2 Children | 7 (13.5%) | 15 (29.4%) |
| 3 or 4 Children | 35 (100.0%) | 32 (76.2%) |
| 5 or more Children | 0 (0.0%) | 0 (0.0%) |
| Total | 42 (45.7%) | 47 (39.5%) |
Income Below Poverty Among Married-Couple vs Single-Parent Households in Hayward
The poverty data for Hayward shows that 10 of the married-couple family households (2.8%) and 89 of the single-parent households (42.2%) are living below the poverty level. Within the married-couple family households, those with no children have the highest poverty rate, with 10 households (3.8%) falling below the poverty line. Among the single-parent households, those with 3 or 4 children have the highest poverty rate, with 67 household (87.0%) living below poverty.
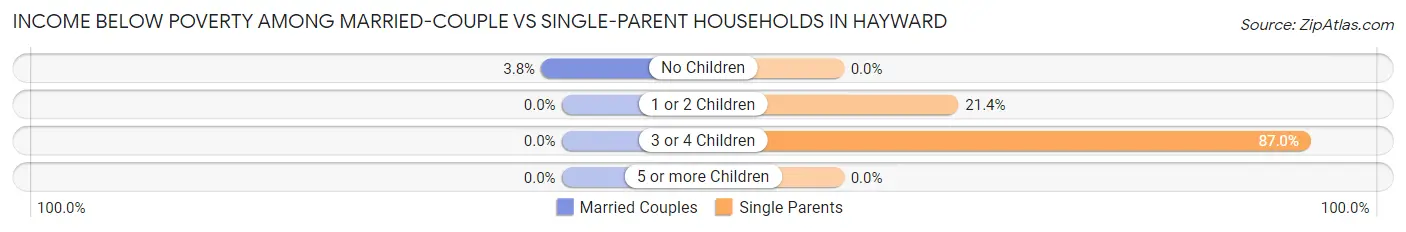
| Children | Married-Couple Families | Single-Parent Households |
| No Children | 10 (3.8%) | 0 (0.0%) |
| 1 or 2 Children | 0 (0.0%) | 22 (21.4%) |
| 3 or 4 Children | 0 (0.0%) | 67 (87.0%) |
| 5 or more Children | 0 (0.0%) | 0 (0.0%) |
| Total | 10 (2.8%) | 89 (42.2%) |
Race in Hayward
The most populous races in Hayward are White / Caucasian (2,133 | 84.4%), Native / Alaskan (248 | 9.8%), and Hispanic or Latino (93 | 3.7%).
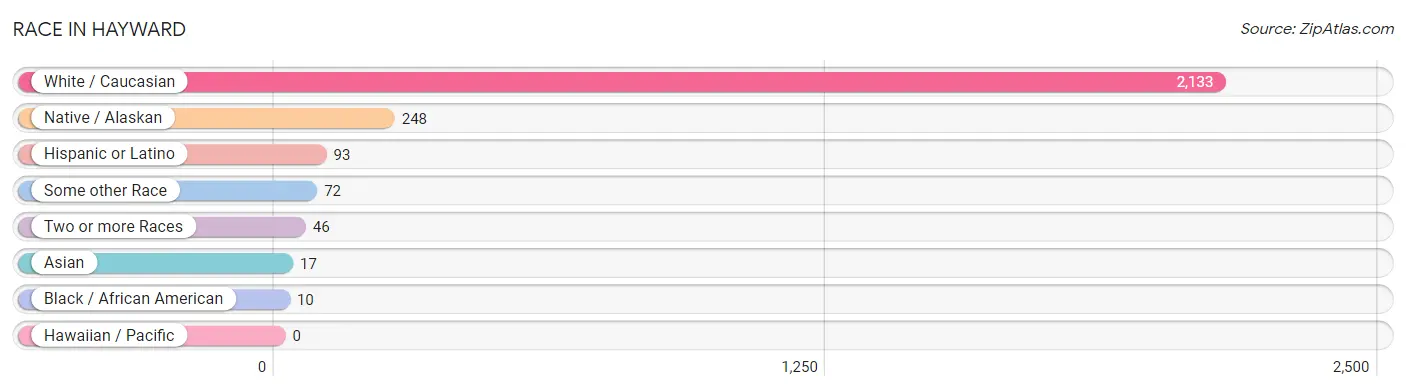
| Race | # Population | % Population |
| Asian | 17 | 0.7% |
| Black / African American | 10 | 0.4% |
| Hawaiian / Pacific | 0 | 0.0% |
| Hispanic or Latino | 93 | 3.7% |
| Native / Alaskan | 248 | 9.8% |
| White / Caucasian | 2,133 | 84.4% |
| Two or more Races | 46 | 1.8% |
| Some other Race | 72 | 2.9% |
| Total | 2,526 | 100.0% |
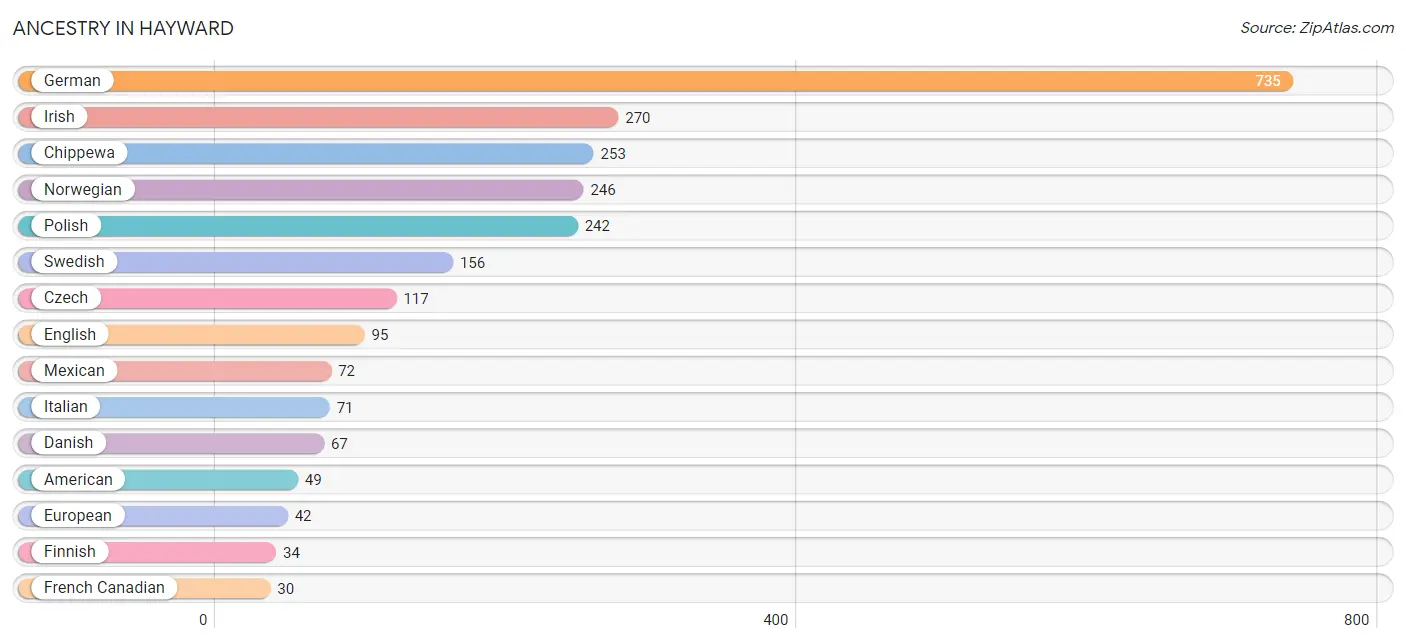
Ancestry in Hayward
The most populous ancestries reported in Hayward are German (735 | 29.1%), Irish (270 | 10.7%), Chippewa (253 | 10.0%), Norwegian (246 | 9.7%), and Polish (242 | 9.6%), together accounting for 69.1% of all Hayward residents.
| Ancestry | # Population | % Population |
| American | 49 | 1.9% |
| Argentinean | 12 | 0.5% |
| Cherokee | 10 | 0.4% |
| Chippewa | 253 | 10.0% |
| Croatian | 6 | 0.2% |
| Czech | 117 | 4.6% |
| Czechoslovakian | 16 | 0.6% |
| Danish | 67 | 2.6% |
| Delaware | 1 | 0.0% |
| Dutch | 15 | 0.6% |
| English | 95 | 3.8% |
| European | 42 | 1.7% |
| Finnish | 34 | 1.3% |
| French | 21 | 0.8% |
| French Canadian | 30 | 1.2% |
| German | 735 | 29.1% |
| Greek | 27 | 1.1% |
| Hungarian | 10 | 0.4% |
| Irish | 270 | 10.7% |
| Iroquois | 1 | 0.0% |
| Italian | 71 | 2.8% |
| Korean | 5 | 0.2% |
| Mexican | 72 | 2.9% |
| Norwegian | 246 | 9.7% |
| Polish | 242 | 9.6% |
| Puerto Rican | 3 | 0.1% |
| Russian | 17 | 0.7% |
| Scandinavian | 16 | 0.6% |
| Scotch-Irish | 17 | 0.7% |
| Scottish | 16 | 0.6% |
| South American | 12 | 0.5% |
| Swedish | 156 | 6.2% |
| Swiss | 29 | 1.1% |
| Thai | 12 | 0.5% |
| Ukrainian | 5 | 0.2% |
| Welsh | 10 | 0.4% | View All 36 Rows |
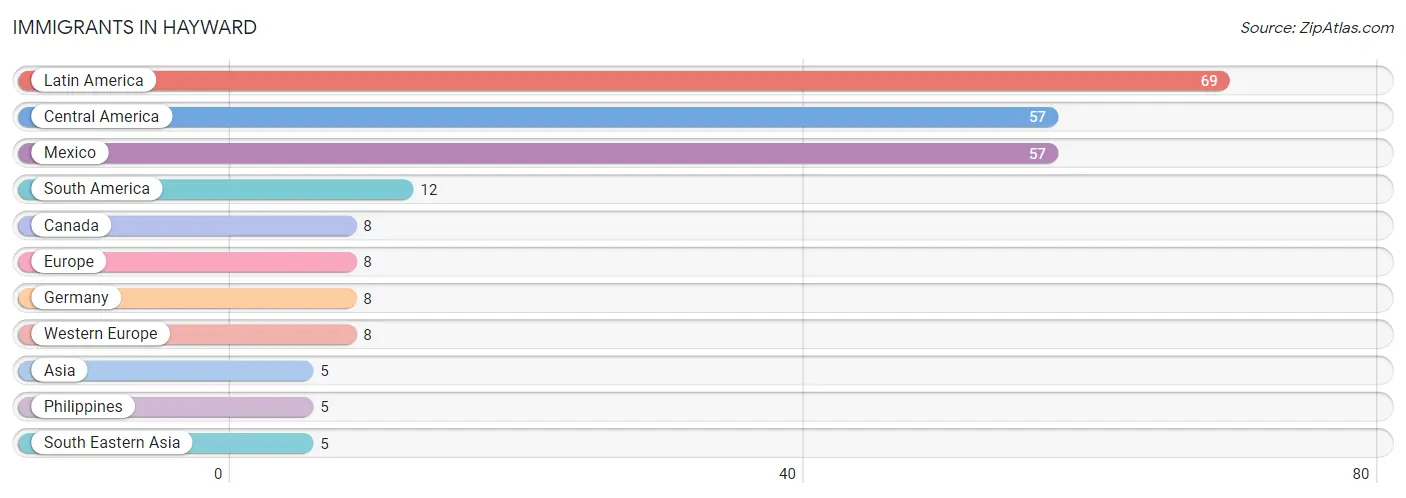
Immigrants in Hayward
The most numerous immigrant groups reported in Hayward came from Latin America (69 | 2.7%), Central America (57 | 2.3%), Mexico (57 | 2.3%), South America (12 | 0.5%), and Canada (8 | 0.3%), together accounting for 8.0% of all Hayward residents.
| Immigration Origin | # Population | % Population |
| Asia | 5 | 0.2% |
| Canada | 8 | 0.3% |
| Central America | 57 | 2.3% |
| Europe | 8 | 0.3% |
| Germany | 8 | 0.3% |
| Latin America | 69 | 2.7% |
| Mexico | 57 | 2.3% |
| Philippines | 5 | 0.2% |
| South America | 12 | 0.5% |
| South Eastern Asia | 5 | 0.2% |
| Western Europe | 8 | 0.3% | View All 11 Rows |
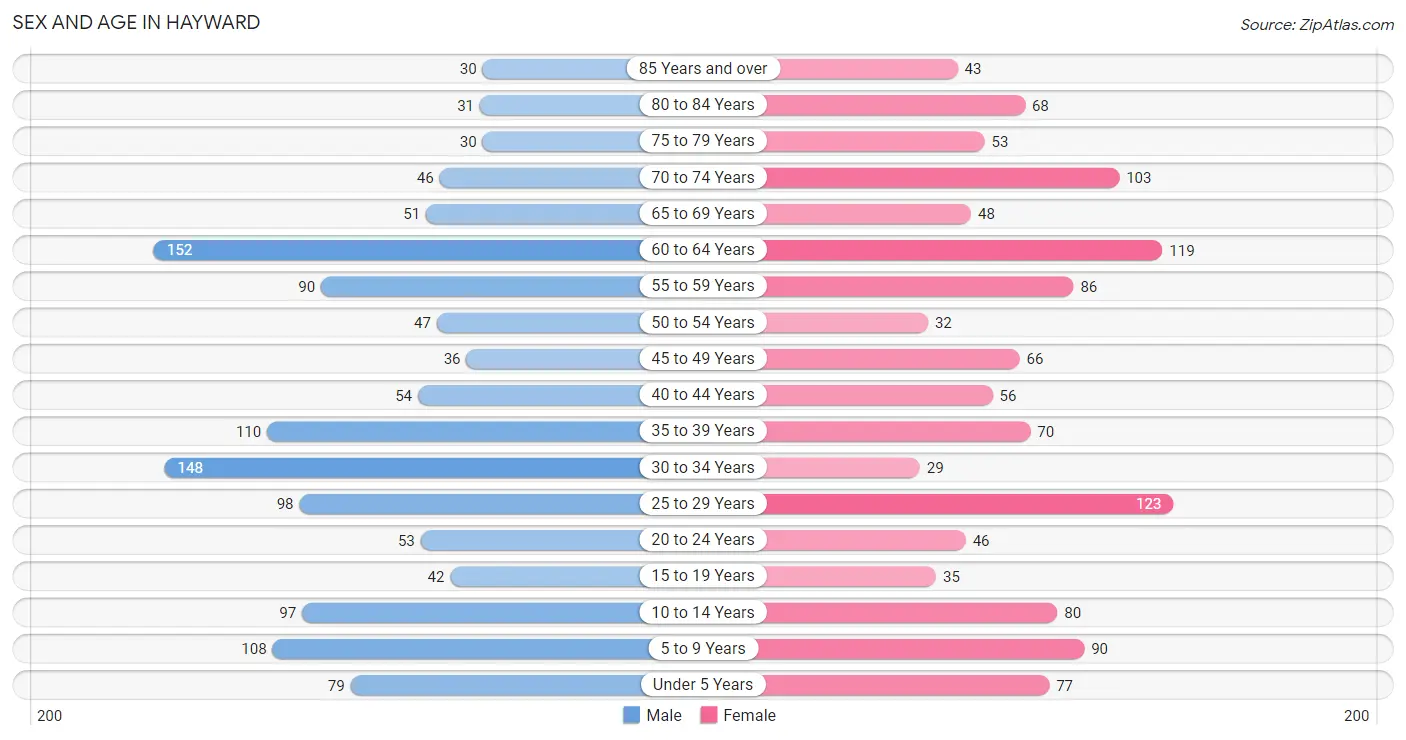
Sex and Age in Hayward
Sex and Age in Hayward
The most populous age groups in Hayward are 60 to 64 Years (152 | 11.7%) for men and 25 to 29 Years (123 | 10.1%) for women.
| Age Bracket | Male | Female |
| Under 5 Years | 79 (6.1%) | 77 (6.3%) |
| 5 to 9 Years | 108 (8.3%) | 90 (7.3%) |
| 10 to 14 Years | 97 (7.4%) | 80 (6.5%) |
| 15 to 19 Years | 42 (3.2%) | 35 (2.9%) |
| 20 to 24 Years | 53 (4.1%) | 46 (3.8%) |
| 25 to 29 Years | 98 (7.5%) | 123 (10.1%) |
| 30 to 34 Years | 148 (11.4%) | 29 (2.4%) |
| 35 to 39 Years | 110 (8.5%) | 70 (5.7%) |
| 40 to 44 Years | 54 (4.2%) | 56 (4.6%) |
| 45 to 49 Years | 36 (2.8%) | 66 (5.4%) |
| 50 to 54 Years | 47 (3.6%) | 32 (2.6%) |
| 55 to 59 Years | 90 (6.9%) | 86 (7.0%) |
| 60 to 64 Years | 152 (11.7%) | 119 (9.7%) |
| 65 to 69 Years | 51 (3.9%) | 48 (3.9%) |
| 70 to 74 Years | 46 (3.5%) | 103 (8.4%) |
| 75 to 79 Years | 30 (2.3%) | 53 (4.3%) |
| 80 to 84 Years | 31 (2.4%) | 68 (5.6%) |
| 85 Years and over | 30 (2.3%) | 43 (3.5%) |
| Total | 1,302 (100.0%) | 1,224 (100.0%) |
Families and Households in Hayward
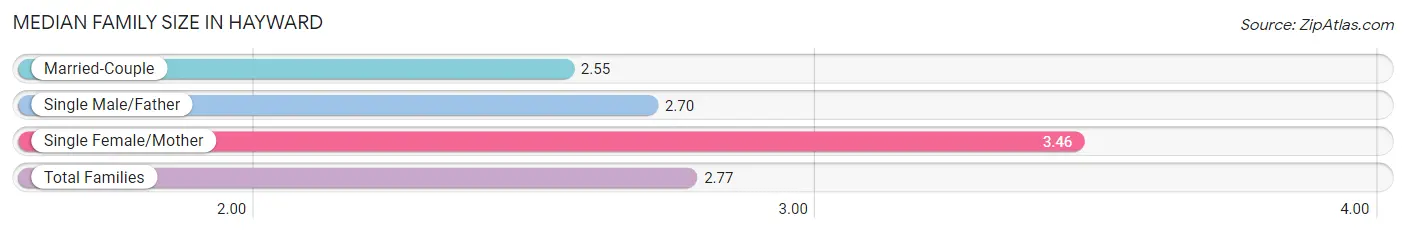
Median Family Size in Hayward
The median family size in Hayward is 2.77 persons per family, with single female/mother families (119 | 20.7%) accounting for the largest median family size of 3.46 persons per family. On the other hand, married-couple families (364 | 63.3%) represent the smallest median family size with 2.55 persons per family.
| Family Type | # Families | Family Size |
| Married-Couple | 364 (63.3%) | 2.55 |
| Single Male/Father | 92 (16.0%) | 2.70 |
| Single Female/Mother | 119 (20.7%) | 3.46 |
| Total Families | 575 (100.0%) | 2.77 |
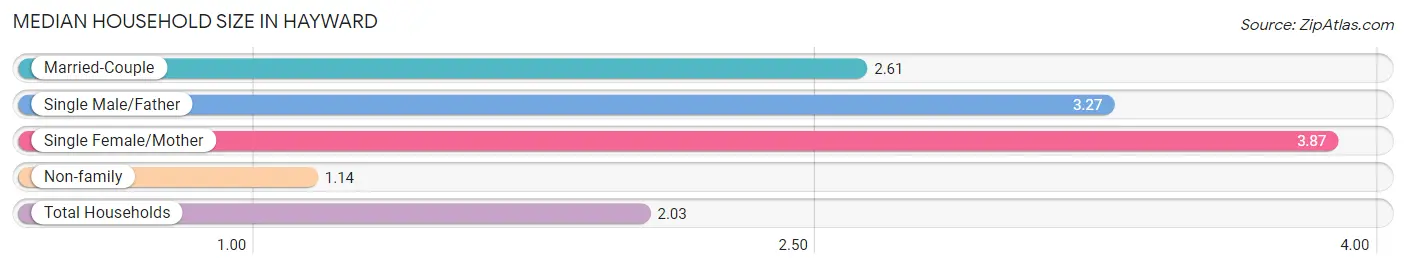
Median Household Size in Hayward
The median household size in Hayward is 2.03 persons per household, with single female/mother households (119 | 10.1%) accounting for the largest median household size of 3.87 persons per household. non-family households (608 | 51.4%) represent the smallest median household size with 1.14 persons per household.
| Household Type | # Households | Household Size |
| Married-Couple | 364 (30.8%) | 2.61 |
| Single Male/Father | 92 (7.8%) | 3.27 |
| Single Female/Mother | 119 (10.1%) | 3.87 |
| Non-family | 608 (51.4%) | 1.14 |
| Total Households | 1,183 (100.0%) | 2.03 |
Household Size by Marriage Status in Hayward
Out of a total of 1,183 households in Hayward, 575 (48.6%) are family households, while 608 (51.4%) are nonfamily households. The most numerous type of family households are 2-person households, comprising 260, and the most common type of nonfamily households are 1-person households, comprising 492.
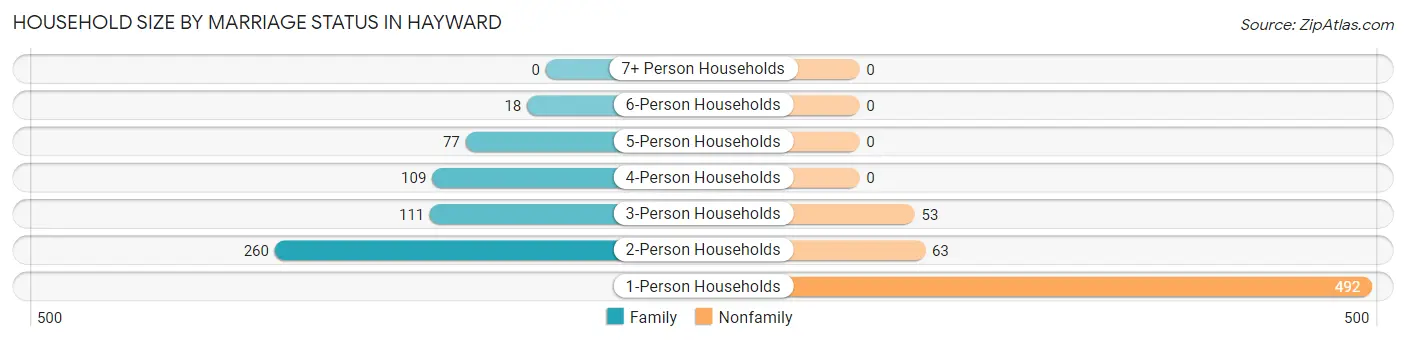
| Household Size | Family Households | Nonfamily Households |
| 1-Person Households | - | 492 (41.6%) |
| 2-Person Households | 260 (22.0%) | 63 (5.3%) |
| 3-Person Households | 111 (9.4%) | 53 (4.5%) |
| 4-Person Households | 109 (9.2%) | 0 (0.0%) |
| 5-Person Households | 77 (6.5%) | 0 (0.0%) |
| 6-Person Households | 18 (1.5%) | 0 (0.0%) |
| 7+ Person Households | 0 (0.0%) | 0 (0.0%) |
| Total | 575 (48.6%) | 608 (51.4%) |
Female Fertility in Hayward
Fertility by Age in Hayward
Average fertility rate in Hayward is 96.0 births per 1,000 women. Women in the age bracket of 20 to 34 years have the highest fertility rate with 172.0 births per 1,000 women. Women in the age bracket of 20 to 34 years acount for 82.9% of all women with births.
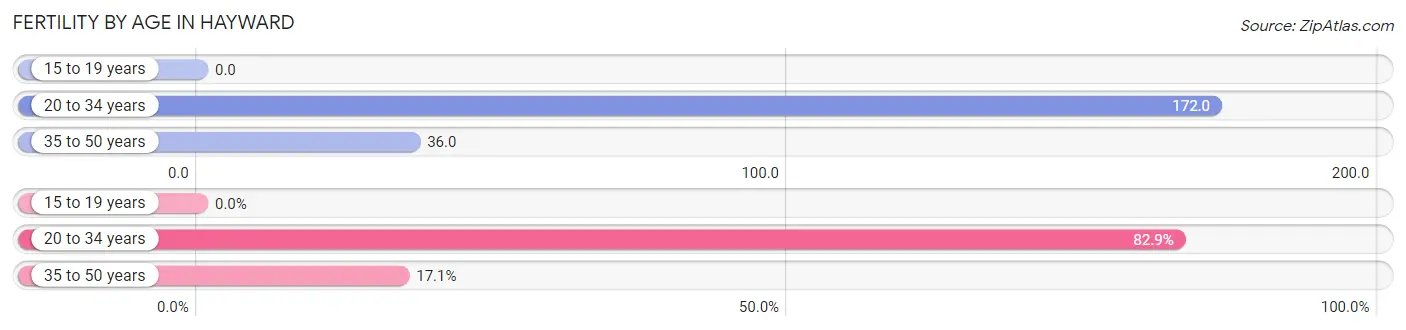
| Age Bracket | Women with Births | Births / 1,000 Women |
| 15 to 19 years | 0 (0.0%) | 0.0 |
| 20 to 34 years | 34 (82.9%) | 172.0 |
| 35 to 50 years | 7 (17.1%) | 36.0 |
| Total | 41 (100.0%) | 96.0 |
Fertility by Age by Marriage Status in Hayward
78.0% of women with births (41) in Hayward are married. The highest percentage of unmarried women with births falls into 20 to 34 years age bracket with 26.5% of them unmarried at the time of birth, while the lowest percentage of unmarried women with births belong to 35 to 50 years age bracket with 0.0% of them unmarried.
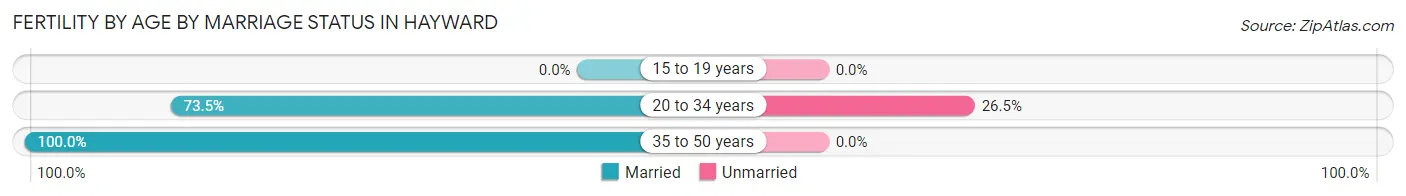
| Age Bracket | Married | Unmarried |
| 15 to 19 years | 0 (0.0%) | 0 (0.0%) |
| 20 to 34 years | 25 (73.5%) | 9 (26.5%) |
| 35 to 50 years | 7 (100.0%) | 0 (0.0%) |
| Total | 32 (78.0%) | 9 (22.0%) |
Fertility by Education in Hayward
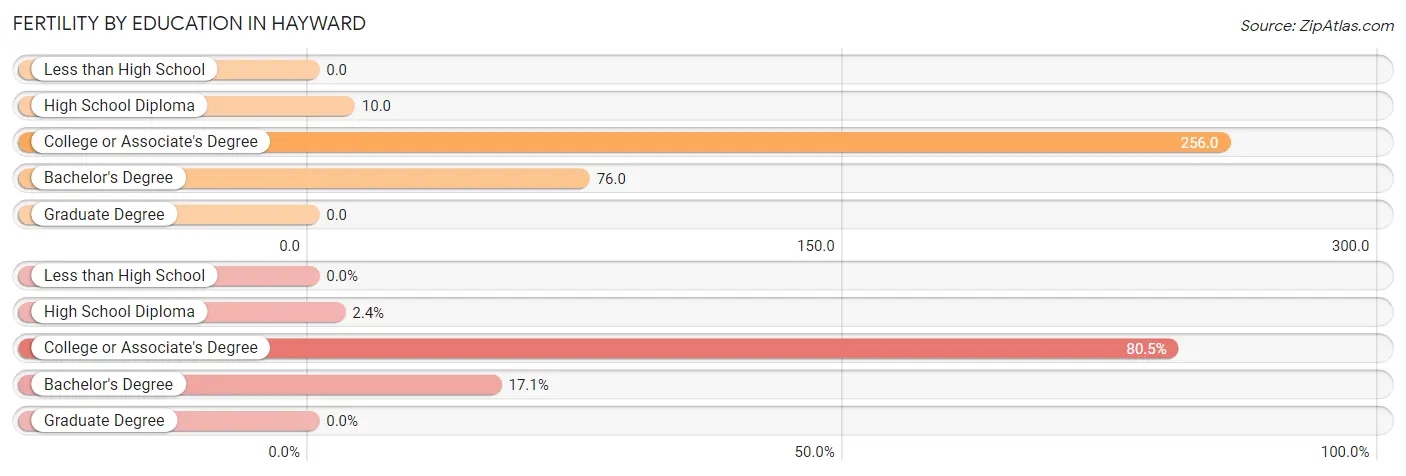
| Educational Attainment | Women with Births | Births / 1,000 Women |
| Less than High School | 0 (0.0%) | 0.0 |
| High School Diploma | 1 (2.4%) | 10.0 |
| College or Associate's Degree | 33 (80.5%) | 256.0 |
| Bachelor's Degree | 7 (17.1%) | 76.0 |
| Graduate Degree | 0 (0.0%) | 0.0 |
| Total | 41 (100.0%) | 96.0 |
Fertility by Education by Marriage Status in Hayward
22.0% of women with births in Hayward are unmarried. Women with the educational attainment of bachelor's degree are most likely to be married with 100.0% of them married at childbirth, while women with the educational attainment of high school diploma are least likely to be married with 100.0% of them unmarried at childbirth.
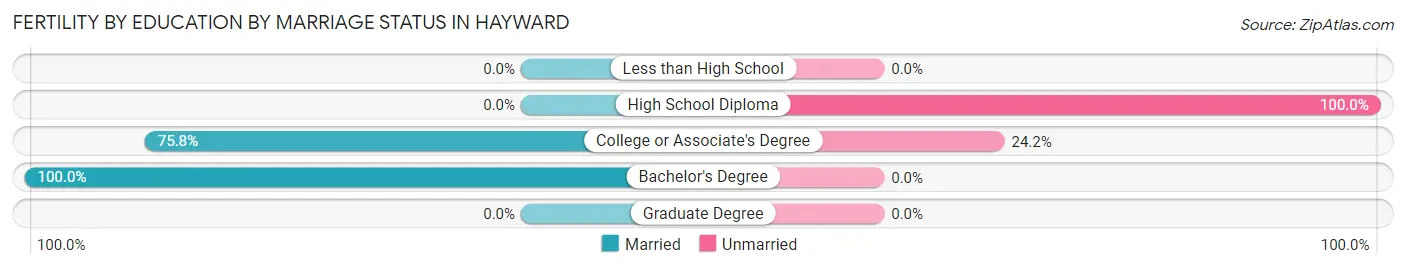
| Educational Attainment | Married | Unmarried |
| Less than High School | 0 (0.0%) | 0 (0.0%) |
| High School Diploma | 0 (0.0%) | 1 (100.0%) |
| College or Associate's Degree | 25 (75.8%) | 8 (24.2%) |
| Bachelor's Degree | 7 (100.0%) | 0 (0.0%) |
| Graduate Degree | 0 (0.0%) | 0 (0.0%) |
| Total | 32 (78.0%) | 9 (22.0%) |
Employment Characteristics in Hayward
Employment by Class of Employer in Hayward
Among the 1,135 employed individuals in Hayward, private company employees (634 | 55.9%), local government employees (111 | 9.8%), and self-employed (incorporated) (110 | 9.7%) make up the most common classes of employment.
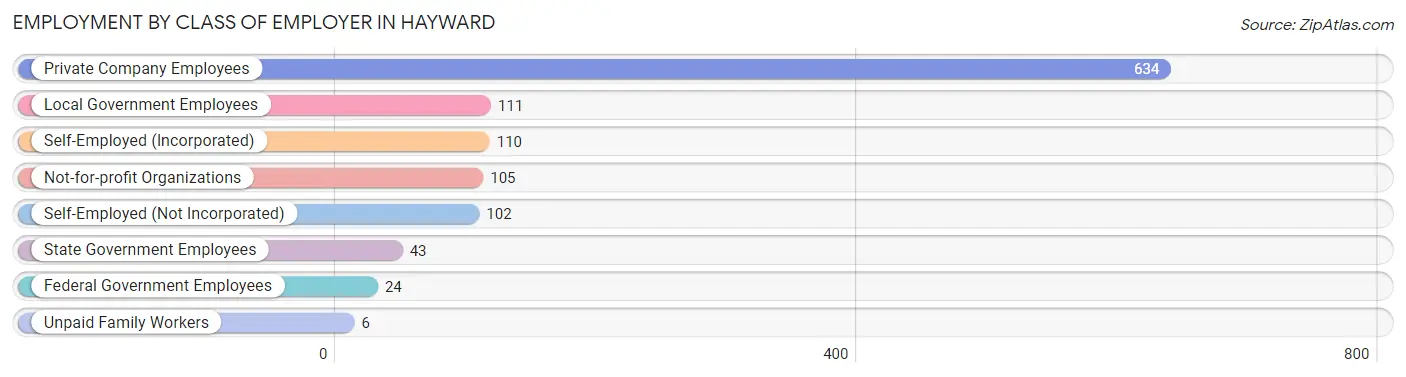
| Employer Class | # Employees | % Employees |
| Private Company Employees | 634 | 55.9% |
| Self-Employed (Incorporated) | 110 | 9.7% |
| Self-Employed (Not Incorporated) | 102 | 9.0% |
| Not-for-profit Organizations | 105 | 9.2% |
| Local Government Employees | 111 | 9.8% |
| State Government Employees | 43 | 3.8% |
| Federal Government Employees | 24 | 2.1% |
| Unpaid Family Workers | 6 | 0.5% |
| Total | 1,135 | 100.0% |
Employment Status by Age in Hayward
According to the labor force statistics for Hayward, out of the total population over 16 years of age (1,980), 61.7% or 1,222 individuals are in the labor force, with 5.4% or 66 of them unemployed. The age group with the highest labor force participation rate is 30 to 34 years, with 91.0% or 161 individuals in the labor force. Within the labor force, the 16 to 19 years age range has the highest percentage of unemployed individuals, with 24.5% or 12 of them being unemployed.
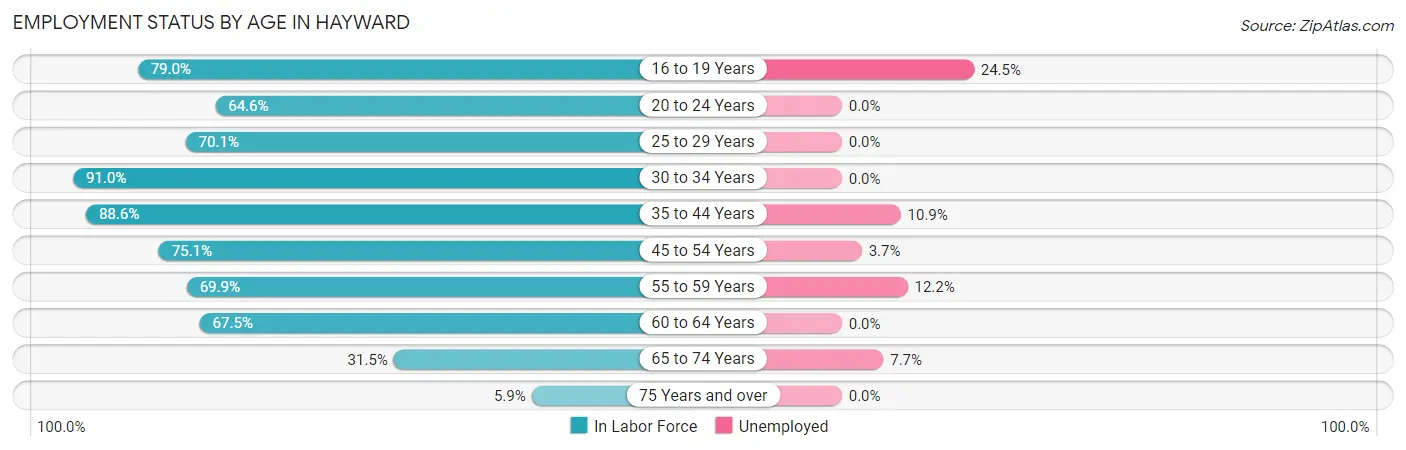
| Age Bracket | In Labor Force | Unemployed |
| 16 to 19 Years | 49 (79.0%) | 12 (24.5%) |
| 20 to 24 Years | 64 (64.6%) | 0 (0.0%) |
| 25 to 29 Years | 155 (70.1%) | 0 (0.0%) |
| 30 to 34 Years | 161 (91.0%) | 0 (0.0%) |
| 35 to 44 Years | 257 (88.6%) | 28 (10.9%) |
| 45 to 54 Years | 136 (75.1%) | 5 (3.7%) |
| 55 to 59 Years | 123 (69.9%) | 15 (12.2%) |
| 60 to 64 Years | 183 (67.5%) | 0 (0.0%) |
| 65 to 74 Years | 78 (31.5%) | 6 (7.7%) |
| 75 Years and over | 15 (5.9%) | 0 (0.0%) |
| Total | 1,222 (61.7%) | 66 (5.4%) |
Employment Status by Educational Attainment in Hayward
According to labor force statistics for Hayward, 77.1% of individuals (1,015) out of the total population between 25 and 64 years of age (1,316) are in the labor force, with 4.7% or 48 of them being unemployed. The group with the highest labor force participation rate are those with the educational attainment of college / associate degree, with 90.1% or 375 individuals in the labor force. Within the labor force, individuals with high school diploma education have the highest percentage of unemployment, with 11.5% or 40 of them being unemployed.
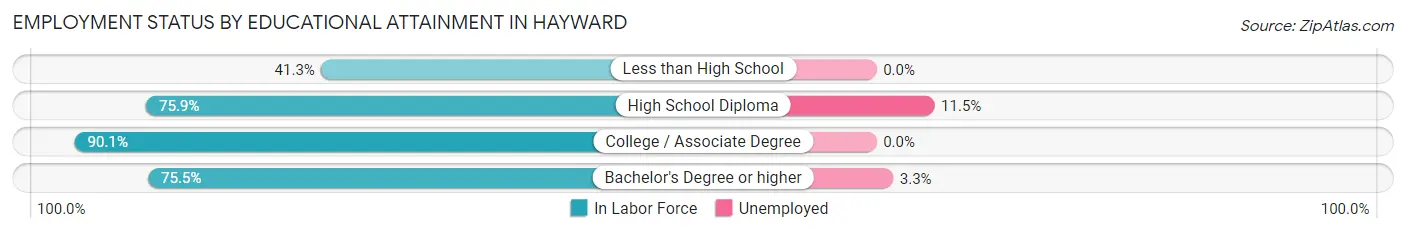
| Educational Attainment | In Labor Force | Unemployed |
| Less than High School | 50 (41.3%) | 0 (0.0%) |
| High School Diploma | 347 (75.9%) | 53 (11.5%) |
| College / Associate Degree | 375 (90.1%) | 0 (0.0%) |
| Bachelor's Degree or higher | 243 (75.5%) | 11 (3.3%) |
| Total | 1,015 (77.1%) | 62 (4.7%) |
Employment Occupations by Sex in Hayward
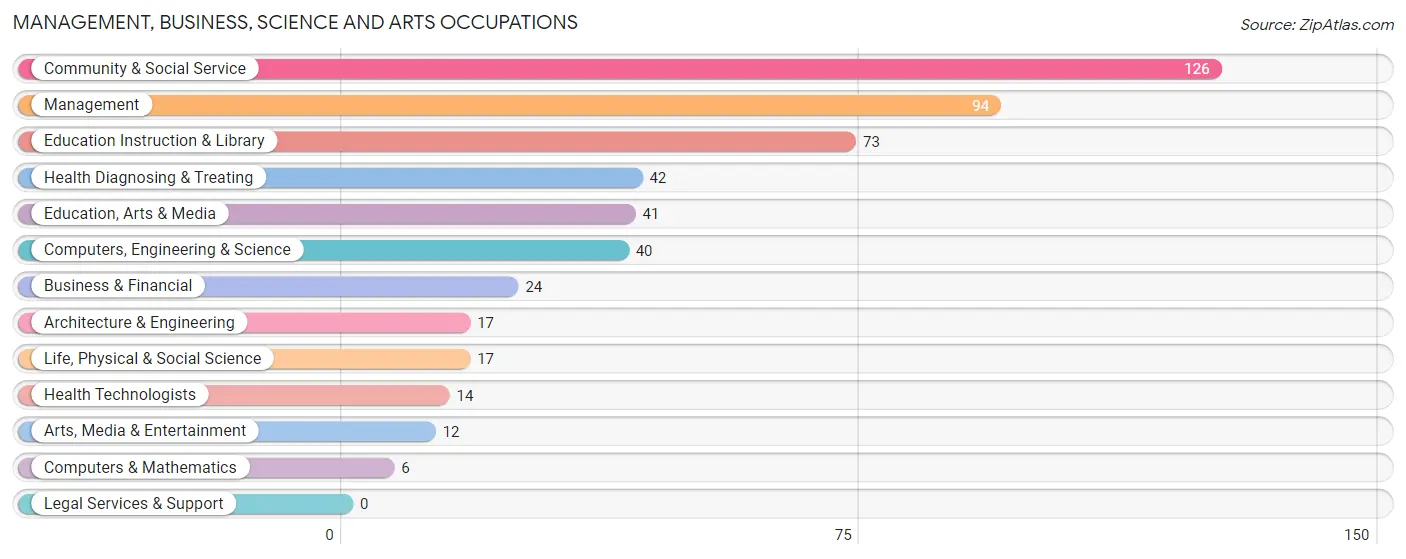
Management, Business, Science and Arts Occupations
The most common Management, Business, Science and Arts occupations in Hayward are Community & Social Service (126 | 10.9%), Management (94 | 8.1%), Education Instruction & Library (73 | 6.3%), Health Diagnosing & Treating (42 | 3.6%), and Education, Arts & Media (41 | 3.5%).
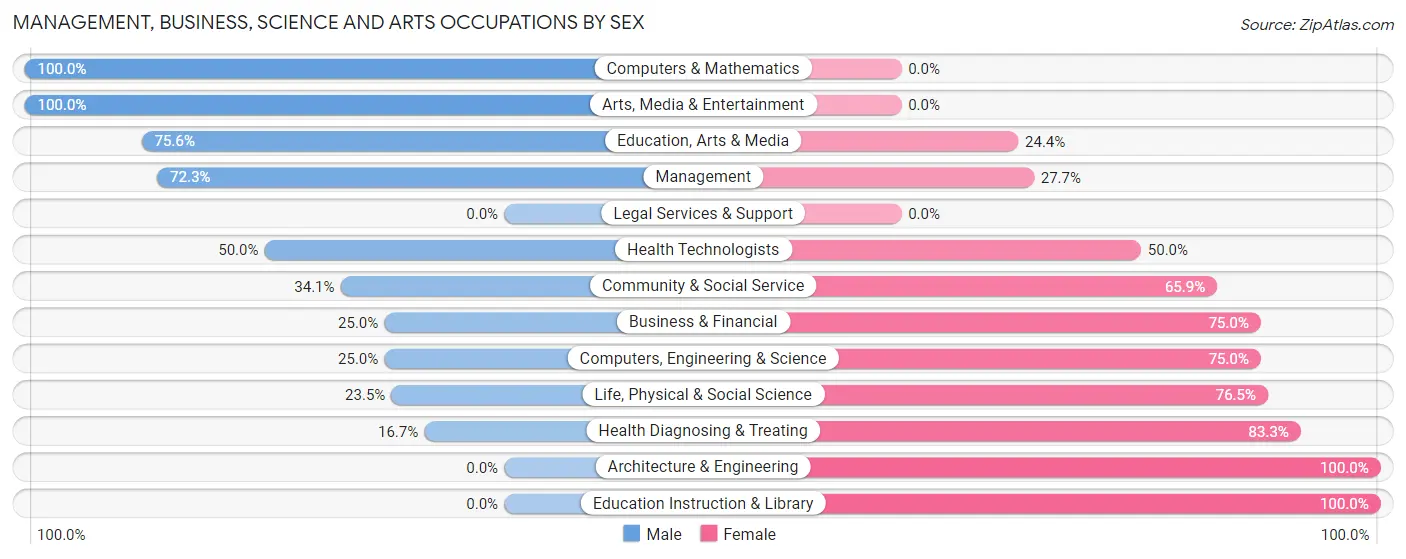
Management, Business, Science and Arts Occupations by Sex
Within the Management, Business, Science and Arts occupations in Hayward, the most male-oriented occupations are Computers & Mathematics (100.0%), Arts, Media & Entertainment (100.0%), and Education, Arts & Media (75.6%), while the most female-oriented occupations are Architecture & Engineering (100.0%), Education Instruction & Library (100.0%), and Health Diagnosing & Treating (83.3%).
| Occupation | Male | Female |
| Management | 68 (72.3%) | 26 (27.7%) |
| Business & Financial | 6 (25.0%) | 18 (75.0%) |
| Computers, Engineering & Science | 10 (25.0%) | 30 (75.0%) |
| Computers & Mathematics | 6 (100.0%) | 0 (0.0%) |
| Architecture & Engineering | 0 (0.0%) | 17 (100.0%) |
| Life, Physical & Social Science | 4 (23.5%) | 13 (76.5%) |
| Community & Social Service | 43 (34.1%) | 83 (65.9%) |
| Education, Arts & Media | 31 (75.6%) | 10 (24.4%) |
| Legal Services & Support | 0 (0.0%) | 0 (0.0%) |
| Education Instruction & Library | 0 (0.0%) | 73 (100.0%) |
| Arts, Media & Entertainment | 12 (100.0%) | 0 (0.0%) |
| Health Diagnosing & Treating | 7 (16.7%) | 35 (83.3%) |
| Health Technologists | 7 (50.0%) | 7 (50.0%) |
| Total (Category) | 134 (41.1%) | 192 (58.9%) |
| Total (Overall) | 664 (57.5%) | 491 (42.5%) |
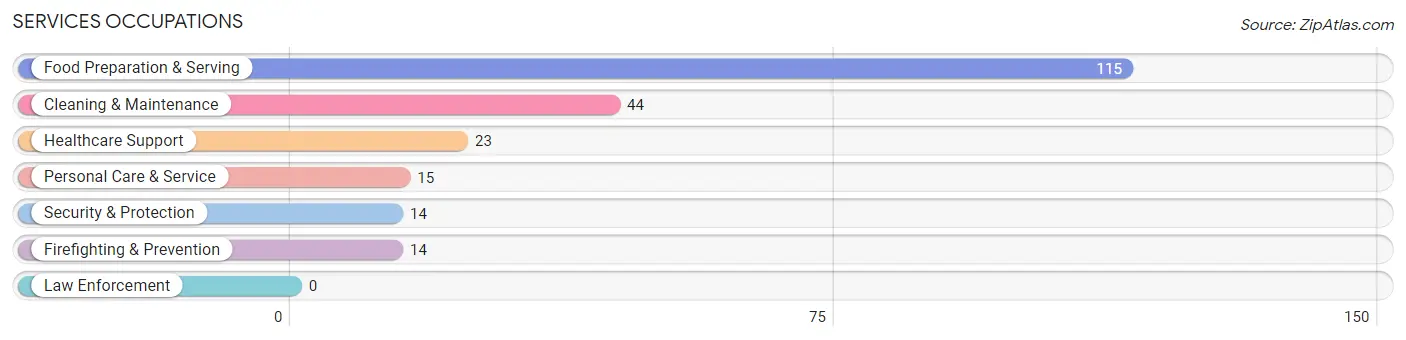
Services Occupations
The most common Services occupations in Hayward are Food Preparation & Serving (115 | 10.0%), Cleaning & Maintenance (44 | 3.8%), Healthcare Support (23 | 2.0%), Personal Care & Service (15 | 1.3%), and Security & Protection (14 | 1.2%).
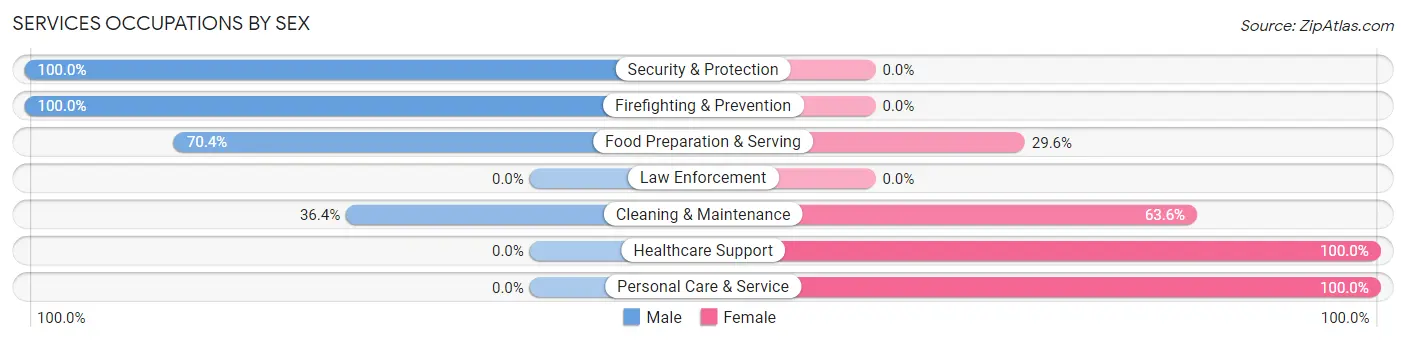
Services Occupations by Sex
Within the Services occupations in Hayward, the most male-oriented occupations are Security & Protection (100.0%), Firefighting & Prevention (100.0%), and Food Preparation & Serving (70.4%), while the most female-oriented occupations are Healthcare Support (100.0%), Personal Care & Service (100.0%), and Cleaning & Maintenance (63.6%).
| Occupation | Male | Female |
| Healthcare Support | 0 (0.0%) | 23 (100.0%) |
| Security & Protection | 14 (100.0%) | 0 (0.0%) |
| Firefighting & Prevention | 14 (100.0%) | 0 (0.0%) |
| Law Enforcement | 0 (0.0%) | 0 (0.0%) |
| Food Preparation & Serving | 81 (70.4%) | 34 (29.6%) |
| Cleaning & Maintenance | 16 (36.4%) | 28 (63.6%) |
| Personal Care & Service | 0 (0.0%) | 15 (100.0%) |
| Total (Category) | 111 (52.6%) | 100 (47.4%) |
| Total (Overall) | 664 (57.5%) | 491 (42.5%) |
Sales and Office Occupations
The most common Sales and Office occupations in Hayward are Office & Administration (127 | 11.0%), and Sales & Related (118 | 10.2%).
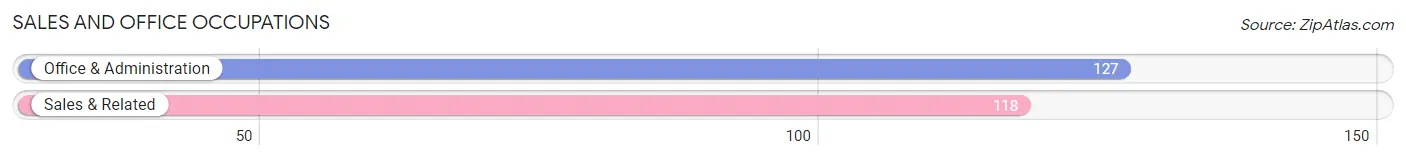
Sales and Office Occupations by Sex
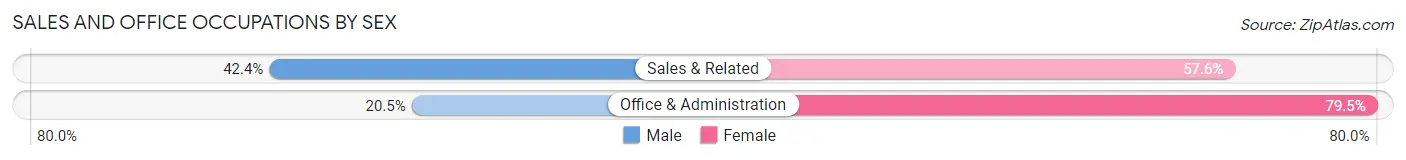
| Occupation | Male | Female |
| Sales & Related | 50 (42.4%) | 68 (57.6%) |
| Office & Administration | 26 (20.5%) | 101 (79.5%) |
| Total (Category) | 76 (31.0%) | 169 (69.0%) |
| Total (Overall) | 664 (57.5%) | 491 (42.5%) |
Natural Resources, Construction and Maintenance Occupations
The most common Natural Resources, Construction and Maintenance occupations in Hayward are Construction & Extraction (47 | 4.1%), Installation, Maintenance & Repair (34 | 2.9%), and Farming, Fishing & Forestry (26 | 2.2%).
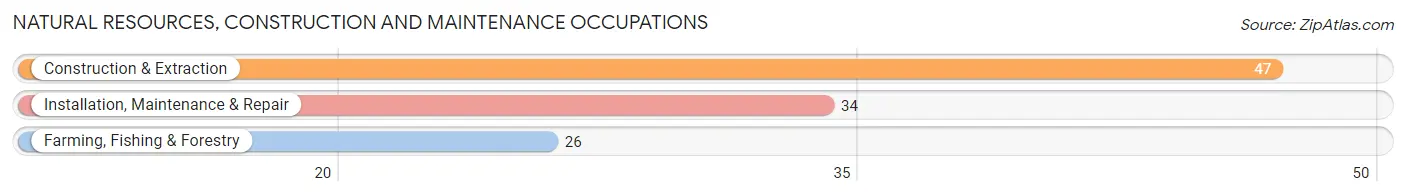
Natural Resources, Construction and Maintenance Occupations by Sex
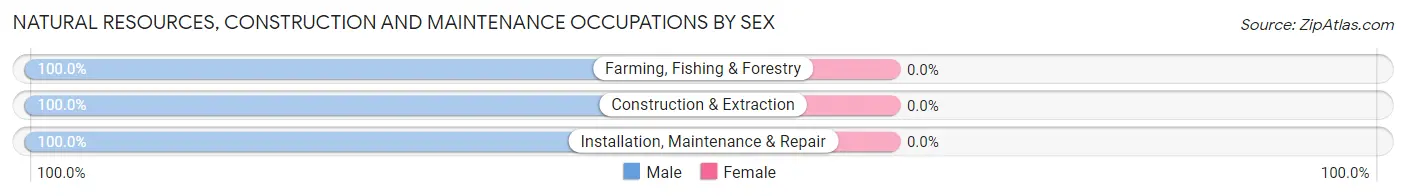
| Occupation | Male | Female |
| Farming, Fishing & Forestry | 26 (100.0%) | 0 (0.0%) |
| Construction & Extraction | 47 (100.0%) | 0 (0.0%) |
| Installation, Maintenance & Repair | 34 (100.0%) | 0 (0.0%) |
| Total (Category) | 107 (100.0%) | 0 (0.0%) |
| Total (Overall) | 664 (57.5%) | 491 (42.5%) |
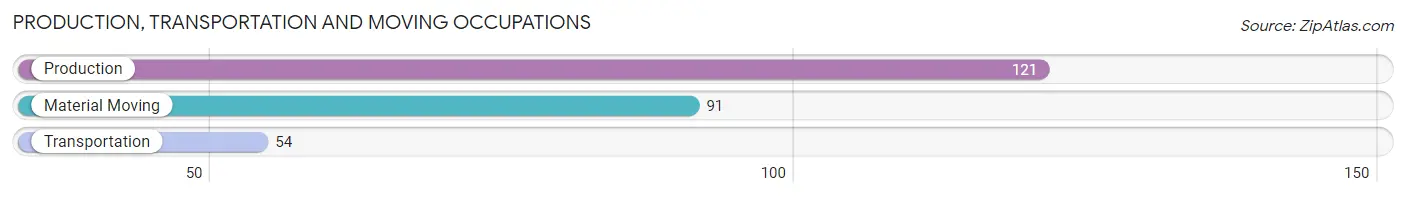
Production, Transportation and Moving Occupations
The most common Production, Transportation and Moving occupations in Hayward are Production (121 | 10.5%), Material Moving (91 | 7.9%), and Transportation (54 | 4.7%).
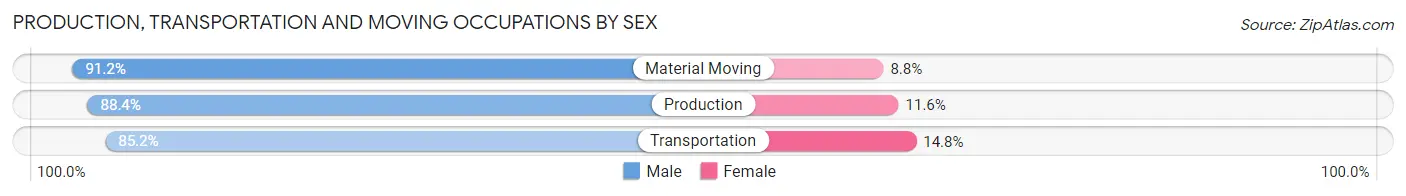
Production, Transportation and Moving Occupations by Sex
| Occupation | Male | Female |
| Production | 107 (88.4%) | 14 (11.6%) |
| Transportation | 46 (85.2%) | 8 (14.8%) |
| Material Moving | 83 (91.2%) | 8 (8.8%) |
| Total (Category) | 236 (88.7%) | 30 (11.3%) |
| Total (Overall) | 664 (57.5%) | 491 (42.5%) |
Employment Industries by Sex in Hayward
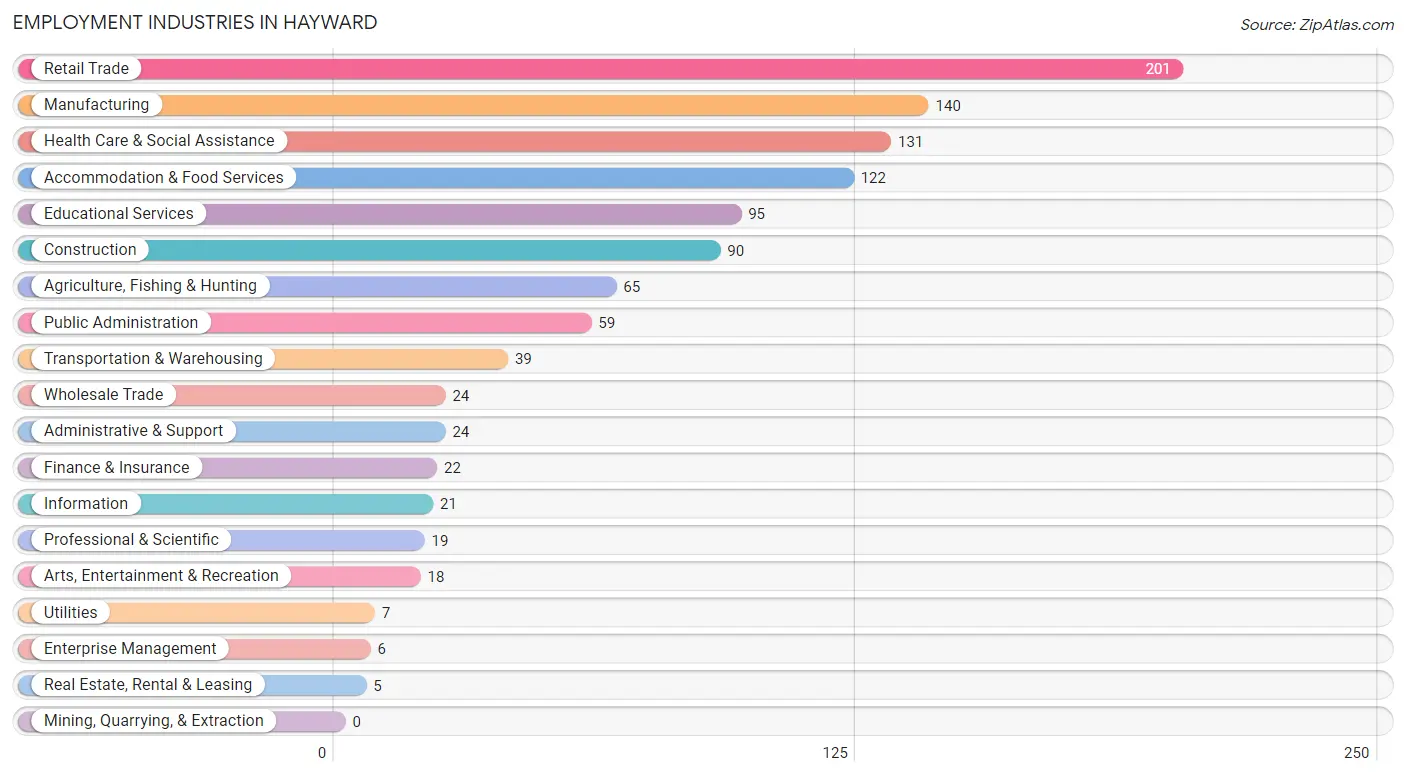
Employment Industries in Hayward
The major employment industries in Hayward include Retail Trade (201 | 17.4%), Manufacturing (140 | 12.1%), Health Care & Social Assistance (131 | 11.3%), Accommodation & Food Services (122 | 10.6%), and Educational Services (95 | 8.2%).
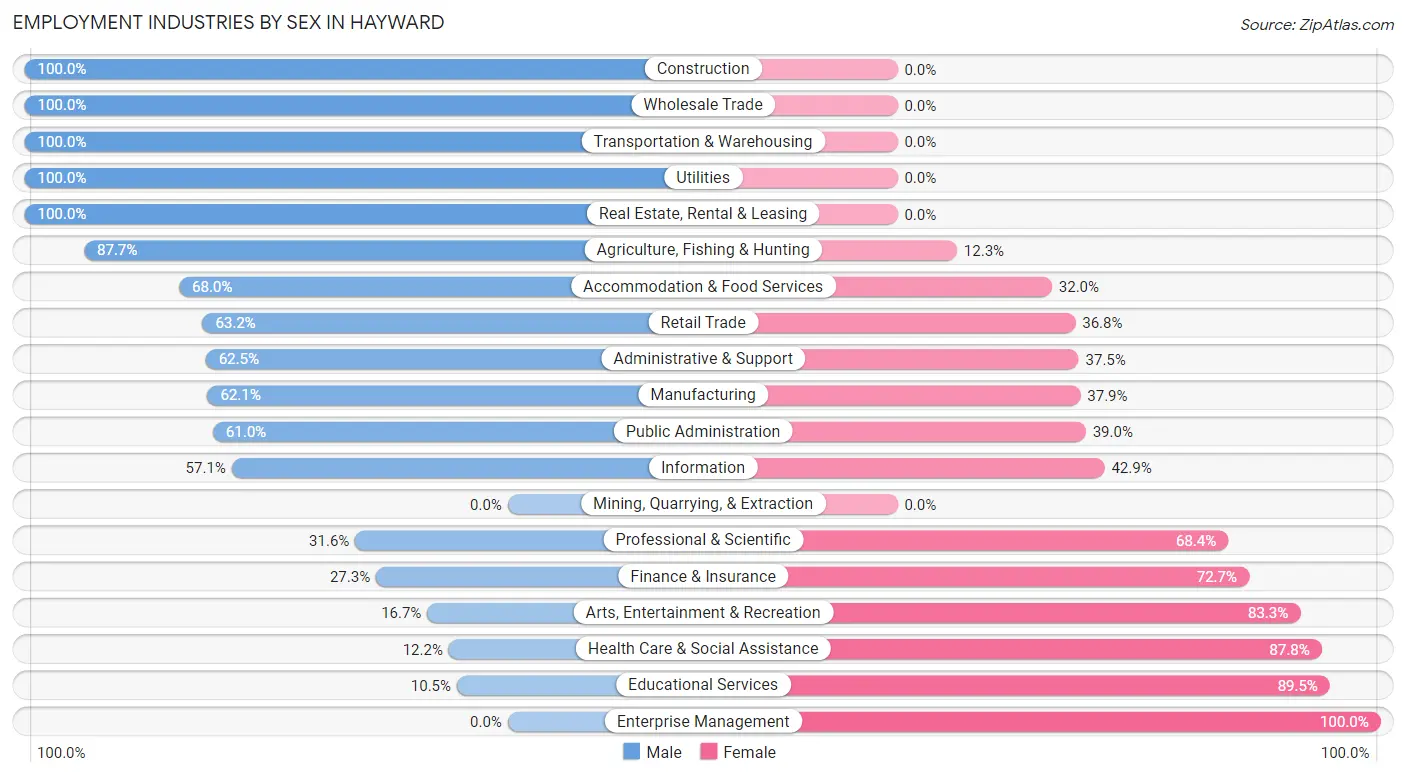
Employment Industries by Sex in Hayward
The Hayward industries that see more men than women are Construction (100.0%), Wholesale Trade (100.0%), and Transportation & Warehousing (100.0%), whereas the industries that tend to have a higher number of women are Enterprise Management (100.0%), Educational Services (89.5%), and Health Care & Social Assistance (87.8%).
| Industry | Male | Female |
| Agriculture, Fishing & Hunting | 57 (87.7%) | 8 (12.3%) |
| Mining, Quarrying, & Extraction | 0 (0.0%) | 0 (0.0%) |
| Construction | 90 (100.0%) | 0 (0.0%) |
| Manufacturing | 87 (62.1%) | 53 (37.9%) |
| Wholesale Trade | 24 (100.0%) | 0 (0.0%) |
| Retail Trade | 127 (63.2%) | 74 (36.8%) |
| Transportation & Warehousing | 39 (100.0%) | 0 (0.0%) |
| Utilities | 7 (100.0%) | 0 (0.0%) |
| Information | 12 (57.1%) | 9 (42.9%) |
| Finance & Insurance | 6 (27.3%) | 16 (72.7%) |
| Real Estate, Rental & Leasing | 5 (100.0%) | 0 (0.0%) |
| Professional & Scientific | 6 (31.6%) | 13 (68.4%) |
| Enterprise Management | 0 (0.0%) | 6 (100.0%) |
| Administrative & Support | 15 (62.5%) | 9 (37.5%) |
| Educational Services | 10 (10.5%) | 85 (89.5%) |
| Health Care & Social Assistance | 16 (12.2%) | 115 (87.8%) |
| Arts, Entertainment & Recreation | 3 (16.7%) | 15 (83.3%) |
| Accommodation & Food Services | 83 (68.0%) | 39 (32.0%) |
| Public Administration | 36 (61.0%) | 23 (39.0%) |
| Total | 664 (57.5%) | 491 (42.5%) |
Education in Hayward
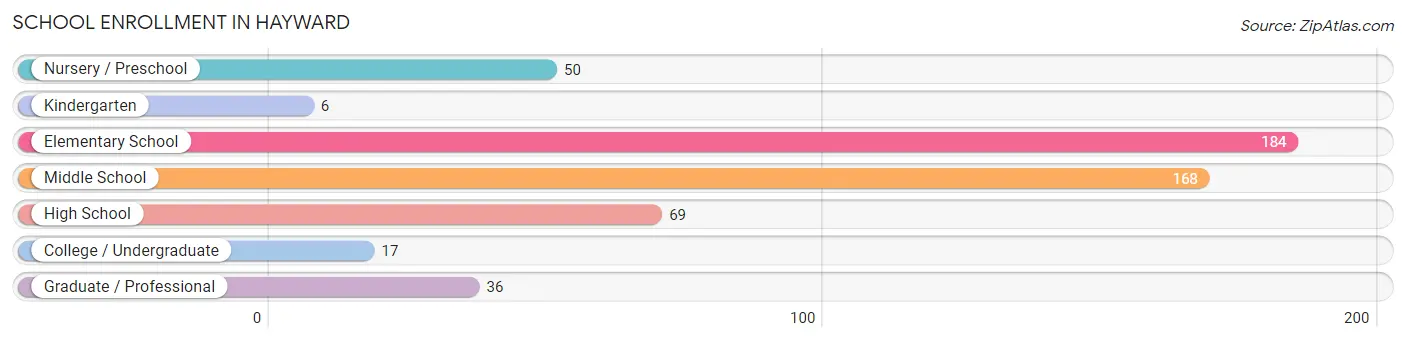
School Enrollment in Hayward
The most common levels of schooling among the 530 students in Hayward are elementary school (184 | 34.7%), middle school (168 | 31.7%), and high school (69 | 13.0%).
| School Level | # Students | % Students |
| Nursery / Preschool | 50 | 9.4% |
| Kindergarten | 6 | 1.1% |
| Elementary School | 184 | 34.7% |
| Middle School | 168 | 31.7% |
| High School | 69 | 13.0% |
| College / Undergraduate | 17 | 3.2% |
| Graduate / Professional | 36 | 6.8% |
| Total | 530 | 100.0% |
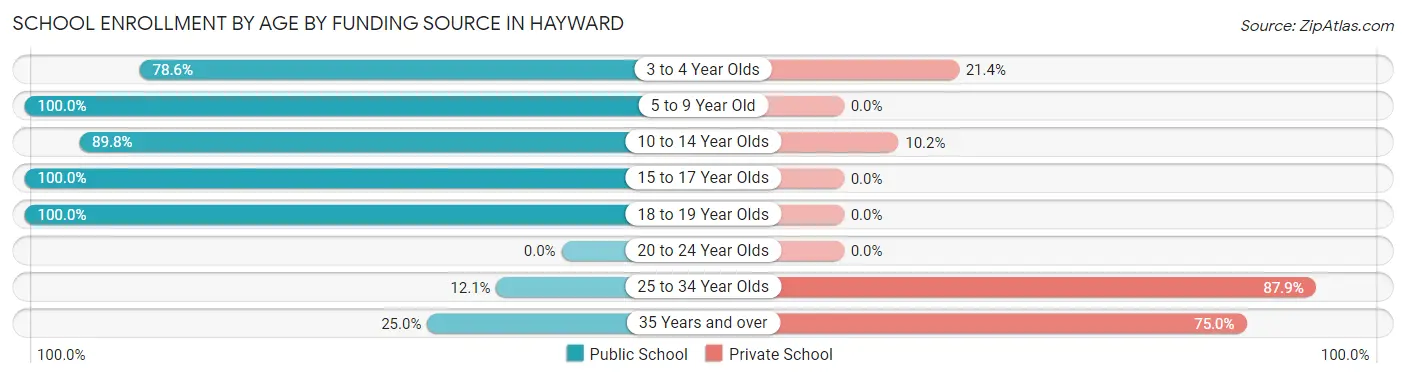
School Enrollment by Age by Funding Source in Hayward
Out of a total of 530 students who are enrolled in schools in Hayward, 77 (14.5%) attend a private institution, while the remaining 453 (85.5%) are enrolled in public schools. The age group of 25 to 34 year olds has the highest likelihood of being enrolled in private schools, with 29 (87.9% in the age bracket) enrolled. Conversely, the age group of 5 to 9 year old has the lowest likelihood of being enrolled in a private school, with 175 (100.0% in the age bracket) attending a public institution.
| Age Bracket | Public School | Private School |
| 3 to 4 Year Olds | 44 (78.6%) | 12 (21.4%) |
| 5 to 9 Year Old | 175 (100.0%) | 0 (0.0%) |
| 10 to 14 Year Olds | 159 (89.8%) | 18 (10.2%) |
| 15 to 17 Year Olds | 52 (100.0%) | 0 (0.0%) |
| 18 to 19 Year Olds | 13 (100.0%) | 0 (0.0%) |
| 20 to 24 Year Olds | 0 (0.0%) | 0 (0.0%) |
| 25 to 34 Year Olds | 4 (12.1%) | 29 (87.9%) |
| 35 Years and over | 6 (25.0%) | 18 (75.0%) |
| Total | 453 (85.5%) | 77 (14.5%) |
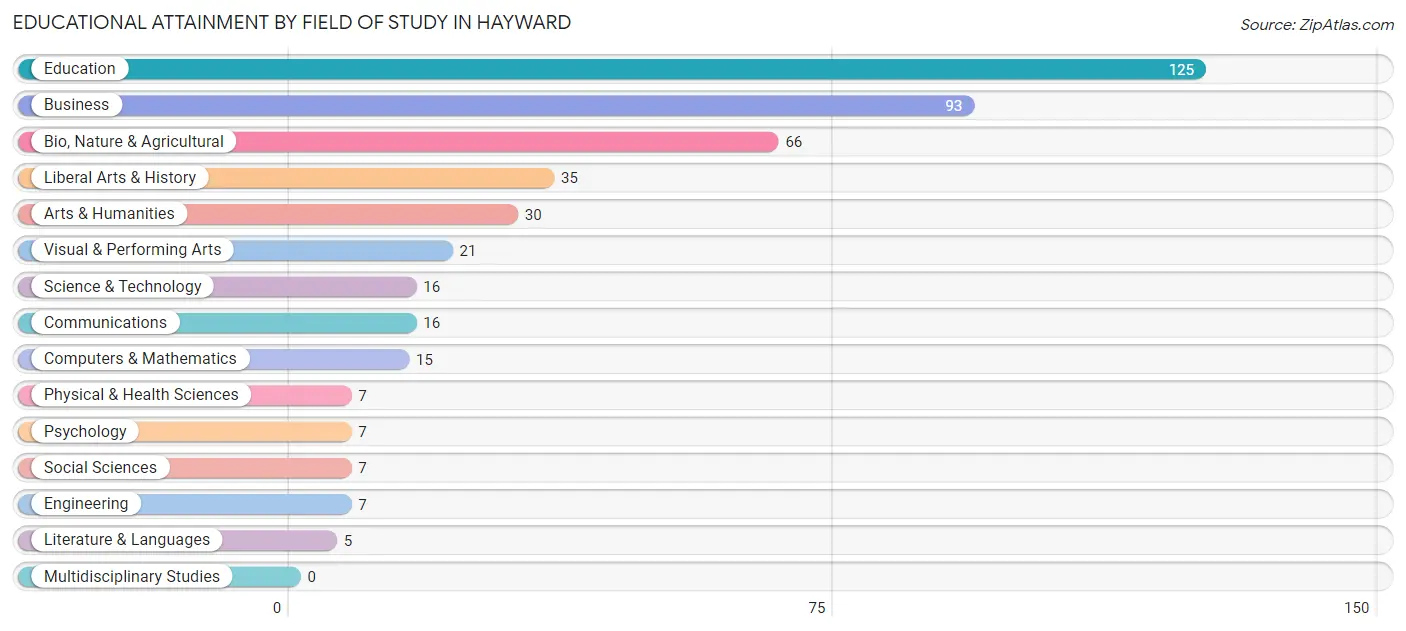
Educational Attainment by Field of Study in Hayward
Education (125 | 27.8%), business (93 | 20.7%), bio, nature & agricultural (66 | 14.7%), liberal arts & history (35 | 7.8%), and arts & humanities (30 | 6.7%) are the most common fields of study among 450 individuals in Hayward who have obtained a bachelor's degree or higher.
| Field of Study | # Graduates | % Graduates |
| Computers & Mathematics | 15 | 3.3% |
| Bio, Nature & Agricultural | 66 | 14.7% |
| Physical & Health Sciences | 7 | 1.6% |
| Psychology | 7 | 1.6% |
| Social Sciences | 7 | 1.6% |
| Engineering | 7 | 1.6% |
| Multidisciplinary Studies | 0 | 0.0% |
| Science & Technology | 16 | 3.6% |
| Business | 93 | 20.7% |
| Education | 125 | 27.8% |
| Literature & Languages | 5 | 1.1% |
| Liberal Arts & History | 35 | 7.8% |
| Visual & Performing Arts | 21 | 4.7% |
| Communications | 16 | 3.6% |
| Arts & Humanities | 30 | 6.7% |
| Total | 450 | 100.0% |
Transportation & Commute in Hayward
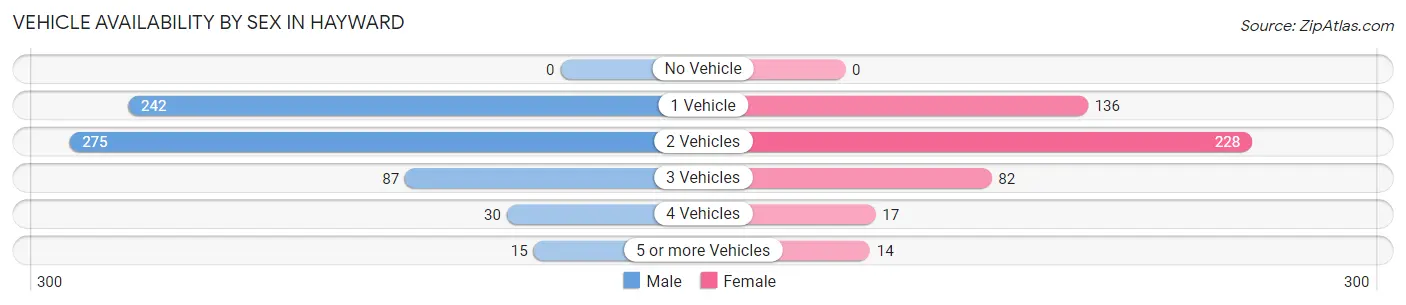
Vehicle Availability by Sex in Hayward
The most prevalent vehicle ownership categories in Hayward are males with 2 vehicles (275, accounting for 42.4%) and females with 2 vehicles (228, making up 57.7%).
| Vehicles Available | Male | Female |
| No Vehicle | 0 (0.0%) | 0 (0.0%) |
| 1 Vehicle | 242 (37.3%) | 136 (28.5%) |
| 2 Vehicles | 275 (42.4%) | 228 (47.8%) |
| 3 Vehicles | 87 (13.4%) | 82 (17.2%) |
| 4 Vehicles | 30 (4.6%) | 17 (3.6%) |
| 5 or more Vehicles | 15 (2.3%) | 14 (2.9%) |
| Total | 649 (100.0%) | 477 (100.0%) |
Commute Time in Hayward
The most frequently occuring commute durations in Hayward are 5 to 9 minutes (273 commuters, 26.2%), 10 to 14 minutes (245 commuters, 23.5%), and less than 5 minutes (202 commuters, 19.4%).
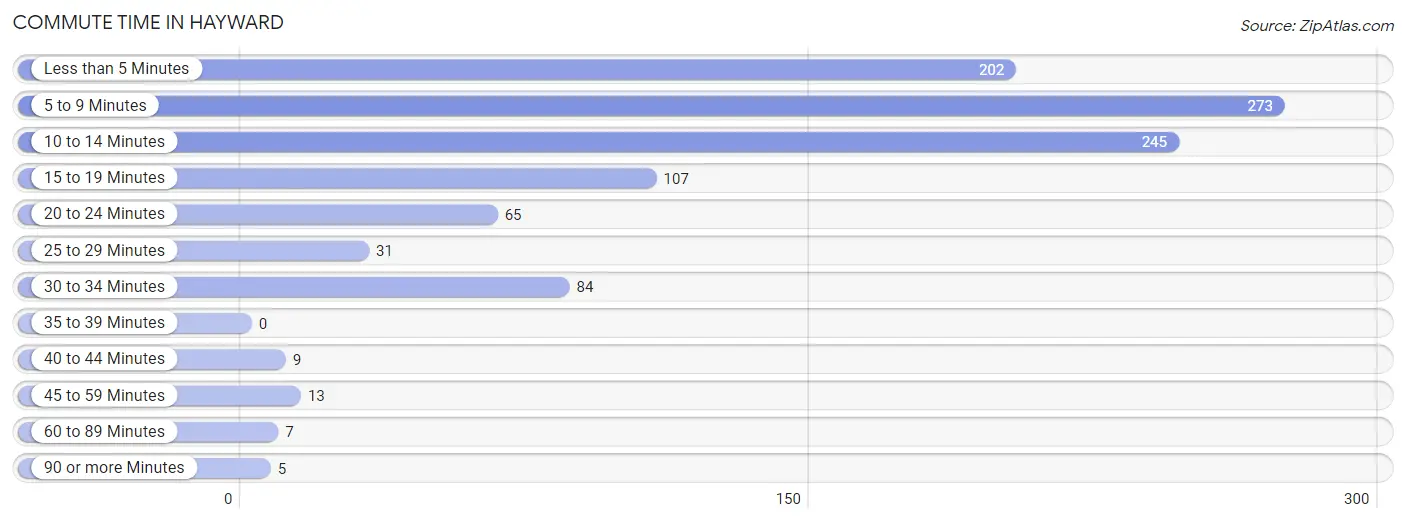
| Commute Time | # Commuters | % Commuters |
| Less than 5 Minutes | 202 | 19.4% |
| 5 to 9 Minutes | 273 | 26.2% |
| 10 to 14 Minutes | 245 | 23.5% |
| 15 to 19 Minutes | 107 | 10.3% |
| 20 to 24 Minutes | 65 | 6.2% |
| 25 to 29 Minutes | 31 | 3.0% |
| 30 to 34 Minutes | 84 | 8.1% |
| 35 to 39 Minutes | 0 | 0.0% |
| 40 to 44 Minutes | 9 | 0.9% |
| 45 to 59 Minutes | 13 | 1.3% |
| 60 to 89 Minutes | 7 | 0.7% |
| 90 or more Minutes | 5 | 0.5% |
Commute Time by Sex in Hayward
The most common commute times in Hayward are less than 5 minutes (131 commuters, 21.7%) for males and 5 to 9 minutes (158 commuters, 36.1%) for females.
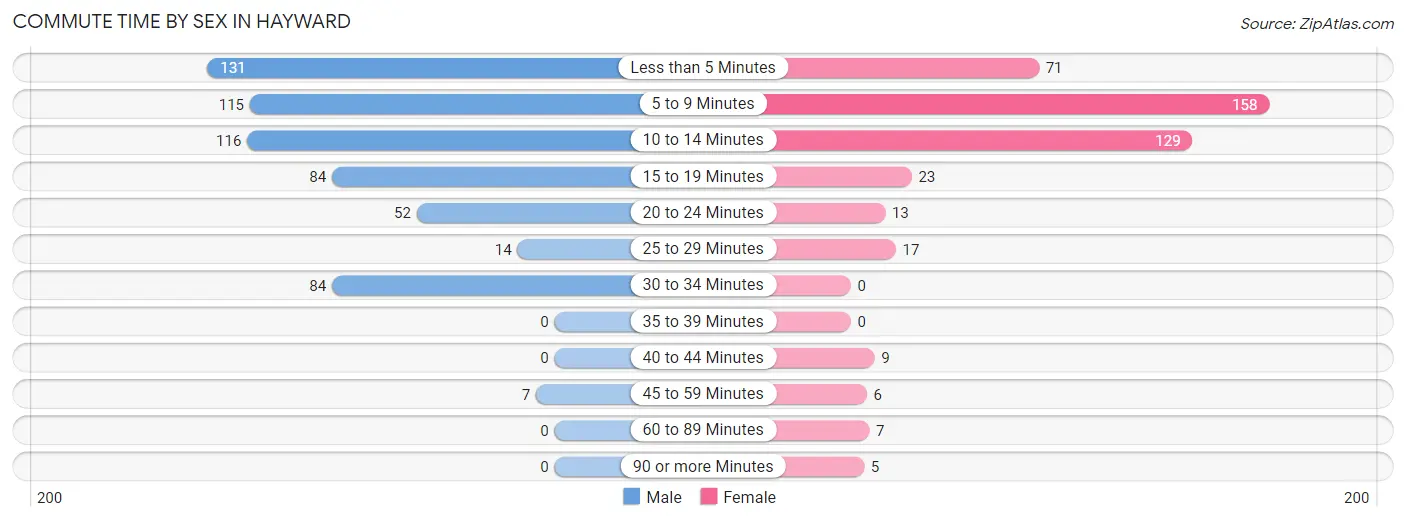
| Commute Time | Male | Female |
| Less than 5 Minutes | 131 (21.7%) | 71 (16.2%) |
| 5 to 9 Minutes | 115 (19.1%) | 158 (36.1%) |
| 10 to 14 Minutes | 116 (19.2%) | 129 (29.4%) |
| 15 to 19 Minutes | 84 (13.9%) | 23 (5.2%) |
| 20 to 24 Minutes | 52 (8.6%) | 13 (3.0%) |
| 25 to 29 Minutes | 14 (2.3%) | 17 (3.9%) |
| 30 to 34 Minutes | 84 (13.9%) | 0 (0.0%) |
| 35 to 39 Minutes | 0 (0.0%) | 0 (0.0%) |
| 40 to 44 Minutes | 0 (0.0%) | 9 (2.1%) |
| 45 to 59 Minutes | 7 (1.2%) | 6 (1.4%) |
| 60 to 89 Minutes | 0 (0.0%) | 7 (1.6%) |
| 90 or more Minutes | 0 (0.0%) | 5 (1.1%) |
Time of Departure to Work by Sex in Hayward
The most frequent times of departure to work in Hayward are 7:30 AM to 7:59 AM (119, 19.7%) for males and 7:30 AM to 7:59 AM (109, 24.9%) for females.
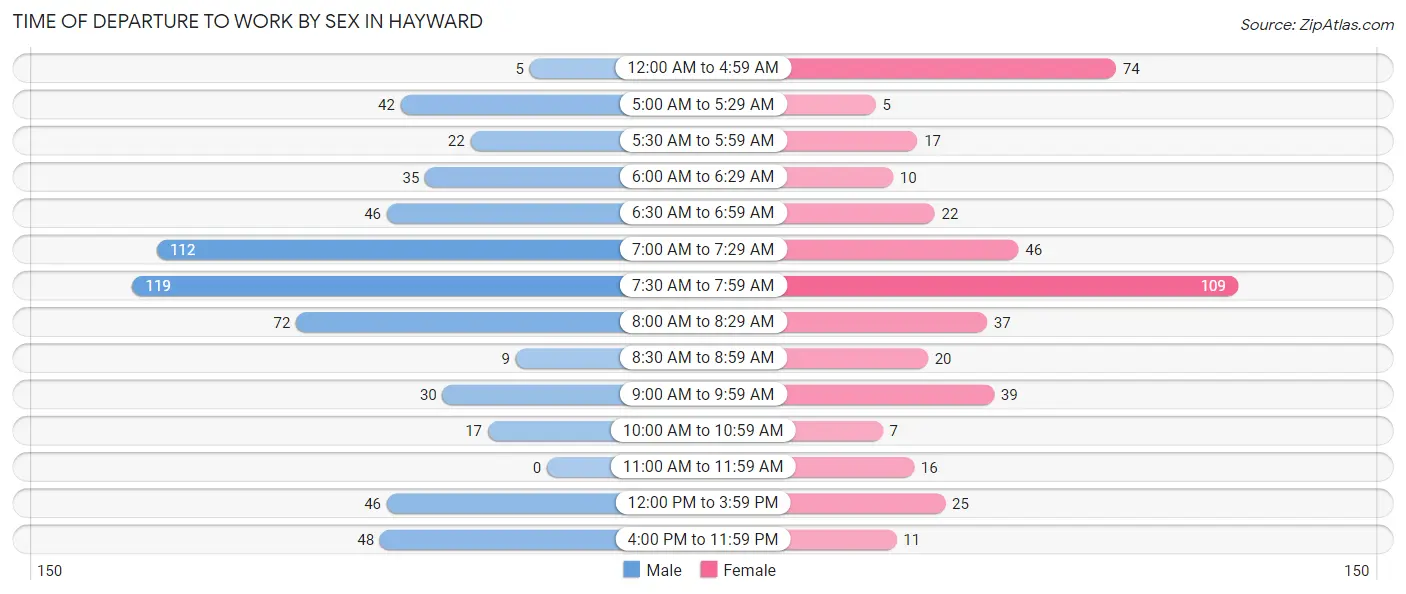
| Time of Departure | Male | Female |
| 12:00 AM to 4:59 AM | 5 (0.8%) | 74 (16.9%) |
| 5:00 AM to 5:29 AM | 42 (7.0%) | 5 (1.1%) |
| 5:30 AM to 5:59 AM | 22 (3.6%) | 17 (3.9%) |
| 6:00 AM to 6:29 AM | 35 (5.8%) | 10 (2.3%) |
| 6:30 AM to 6:59 AM | 46 (7.6%) | 22 (5.0%) |
| 7:00 AM to 7:29 AM | 112 (18.6%) | 46 (10.5%) |
| 7:30 AM to 7:59 AM | 119 (19.7%) | 109 (24.9%) |
| 8:00 AM to 8:29 AM | 72 (11.9%) | 37 (8.5%) |
| 8:30 AM to 8:59 AM | 9 (1.5%) | 20 (4.6%) |
| 9:00 AM to 9:59 AM | 30 (5.0%) | 39 (8.9%) |
| 10:00 AM to 10:59 AM | 17 (2.8%) | 7 (1.6%) |
| 11:00 AM to 11:59 AM | 0 (0.0%) | 16 (3.6%) |
| 12:00 PM to 3:59 PM | 46 (7.6%) | 25 (5.7%) |
| 4:00 PM to 11:59 PM | 48 (8.0%) | 11 (2.5%) |
| Total | 603 (100.0%) | 438 (100.0%) |
Housing Occupancy in Hayward
Occupancy by Ownership in Hayward
Of the total 1,183 dwellings in Hayward, owner-occupied units account for 614 (51.9%), while renter-occupied units make up 569 (48.1%).
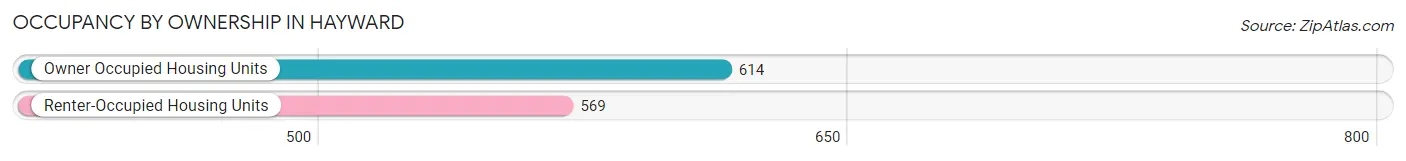
| Occupancy | # Housing Units | % Housing Units |
| Owner Occupied Housing Units | 614 | 51.9% |
| Renter-Occupied Housing Units | 569 | 48.1% |
| Total Occupied Housing Units | 1,183 | 100.0% |
Occupancy by Household Size in Hayward
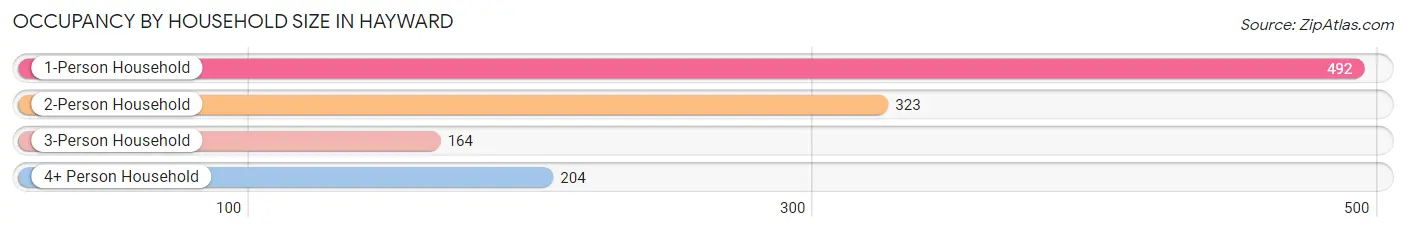
| Household Size | # Housing Units | % Housing Units |
| 1-Person Household | 492 | 41.6% |
| 2-Person Household | 323 | 27.3% |
| 3-Person Household | 164 | 13.9% |
| 4+ Person Household | 204 | 17.2% |
| Total Housing Units | 1,183 | 100.0% |
Occupancy by Ownership by Household Size in Hayward
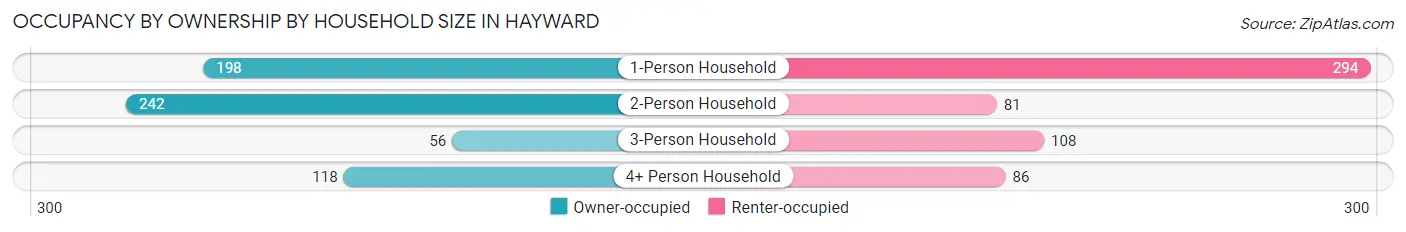
| Household Size | Owner-occupied | Renter-occupied |
| 1-Person Household | 198 (40.2%) | 294 (59.8%) |
| 2-Person Household | 242 (74.9%) | 81 (25.1%) |
| 3-Person Household | 56 (34.2%) | 108 (65.8%) |
| 4+ Person Household | 118 (57.8%) | 86 (42.2%) |
| Total Housing Units | 614 (51.9%) | 569 (48.1%) |
Occupancy by Educational Attainment in Hayward
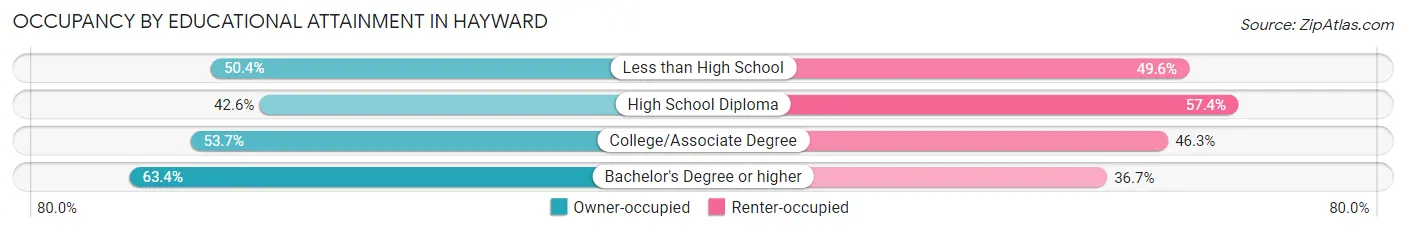
| Household Size | Owner-occupied | Renter-occupied |
| Less than High School | 61 (50.4%) | 60 (49.6%) |
| High School Diploma | 171 (42.6%) | 230 (57.4%) |
| College/Associate Degree | 204 (53.7%) | 176 (46.3%) |
| Bachelor's Degree or higher | 178 (63.3%) | 103 (36.6%) |
Occupancy by Age of Householder in Hayward
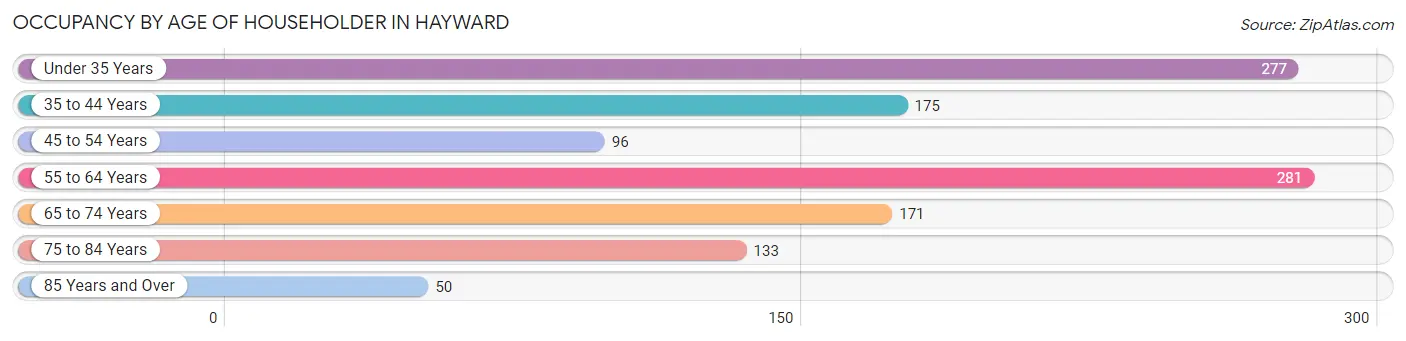
| Age Bracket | # Households | % Households |
| Under 35 Years | 277 | 23.4% |
| 35 to 44 Years | 175 | 14.8% |
| 45 to 54 Years | 96 | 8.1% |
| 55 to 64 Years | 281 | 23.7% |
| 65 to 74 Years | 171 | 14.4% |
| 75 to 84 Years | 133 | 11.2% |
| 85 Years and Over | 50 | 4.2% |
| Total | 1,183 | 100.0% |
Housing Finances in Hayward
Median Income by Occupancy in Hayward
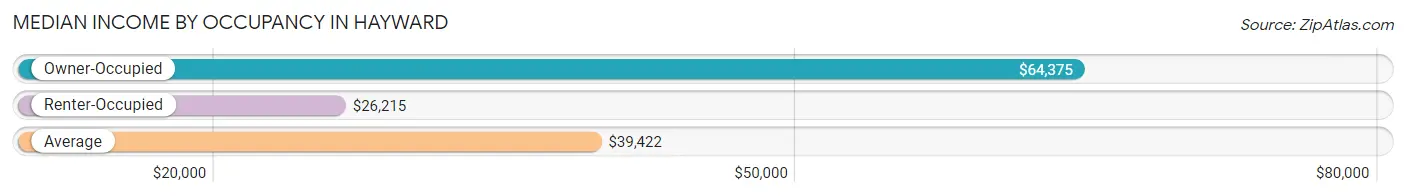
| Occupancy Type | # Households | Median Income |
| Owner-Occupied | 614 (51.9%) | $64,375 |
| Renter-Occupied | 569 (48.1%) | $26,215 |
| Average | 1,183 (100.0%) | $39,422 |
Occupancy by Householder Income Bracket in Hayward
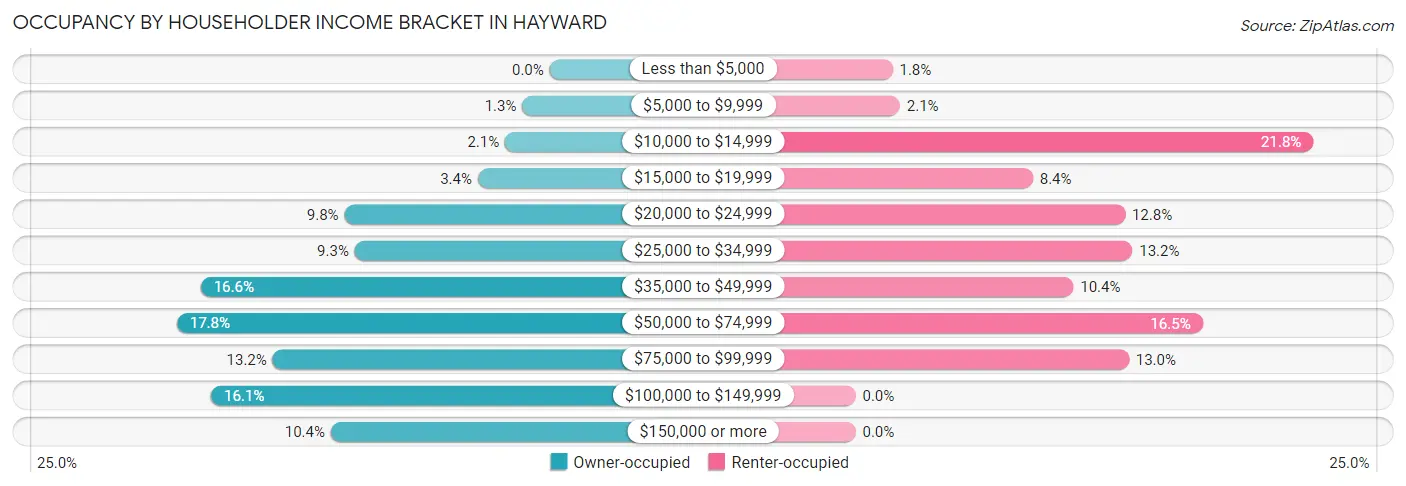
| Income Bracket | Owner-occupied | Renter-occupied |
| Less than $5,000 | 0 (0.0%) | 10 (1.8%) |
| $5,000 to $9,999 | 8 (1.3%) | 12 (2.1%) |
| $10,000 to $14,999 | 13 (2.1%) | 124 (21.8%) |
| $15,000 to $19,999 | 21 (3.4%) | 48 (8.4%) |
| $20,000 to $24,999 | 60 (9.8%) | 73 (12.8%) |
| $25,000 to $34,999 | 57 (9.3%) | 75 (13.2%) |
| $35,000 to $49,999 | 102 (16.6%) | 59 (10.4%) |
| $50,000 to $74,999 | 109 (17.7%) | 94 (16.5%) |
| $75,000 to $99,999 | 81 (13.2%) | 74 (13.0%) |
| $100,000 to $149,999 | 99 (16.1%) | 0 (0.0%) |
| $150,000 or more | 64 (10.4%) | 0 (0.0%) |
| Total | 614 (100.0%) | 569 (100.0%) |
Monthly Housing Cost Tiers in Hayward
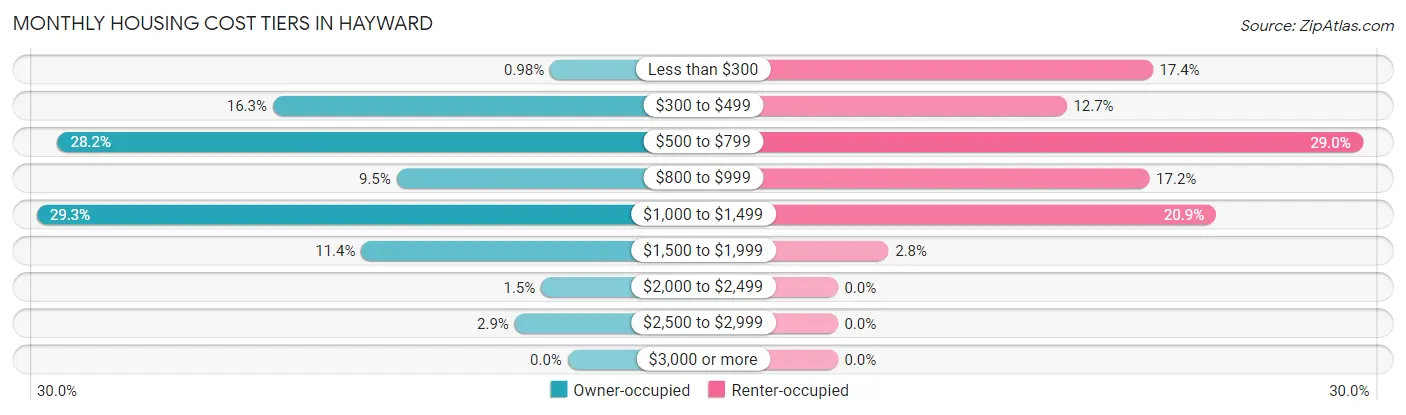
| Monthly Cost | Owner-occupied | Renter-occupied |
| Less than $300 | 6 (1.0%) | 99 (17.4%) |
| $300 to $499 | 100 (16.3%) | 72 (12.7%) |
| $500 to $799 | 173 (28.2%) | 165 (29.0%) |
| $800 to $999 | 58 (9.5%) | 98 (17.2%) |
| $1,000 to $1,499 | 180 (29.3%) | 119 (20.9%) |
| $1,500 to $1,999 | 70 (11.4%) | 16 (2.8%) |
| $2,000 to $2,499 | 9 (1.5%) | 0 (0.0%) |
| $2,500 to $2,999 | 18 (2.9%) | 0 (0.0%) |
| $3,000 or more | 0 (0.0%) | 0 (0.0%) |
| Total | 614 (100.0%) | 569 (100.0%) |
Physical Housing Characteristics in Hayward
Housing Structures in Hayward
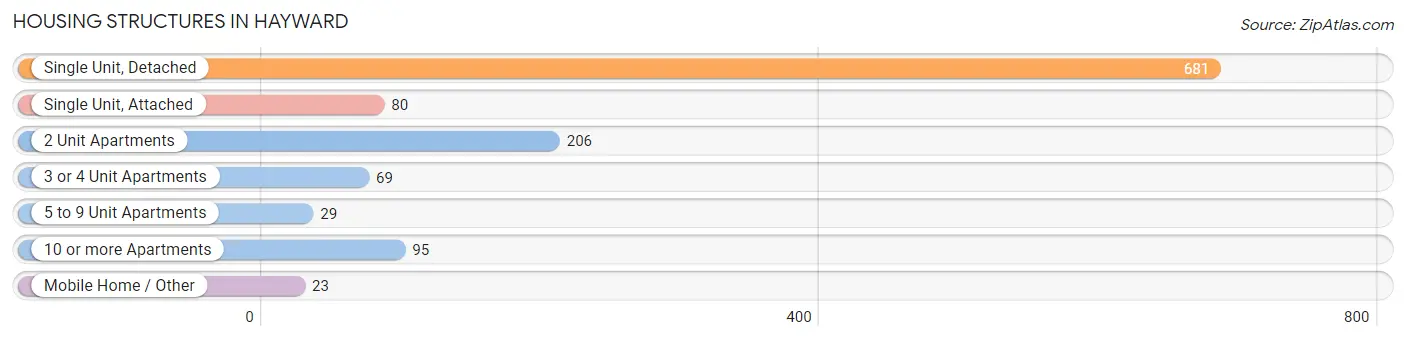
| Structure Type | # Housing Units | % Housing Units |
| Single Unit, Detached | 681 | 57.6% |
| Single Unit, Attached | 80 | 6.8% |
| 2 Unit Apartments | 206 | 17.4% |
| 3 or 4 Unit Apartments | 69 | 5.8% |
| 5 to 9 Unit Apartments | 29 | 2.5% |
| 10 or more Apartments | 95 | 8.0% |
| Mobile Home / Other | 23 | 1.9% |
| Total | 1,183 | 100.0% |
Housing Structures by Occupancy in Hayward
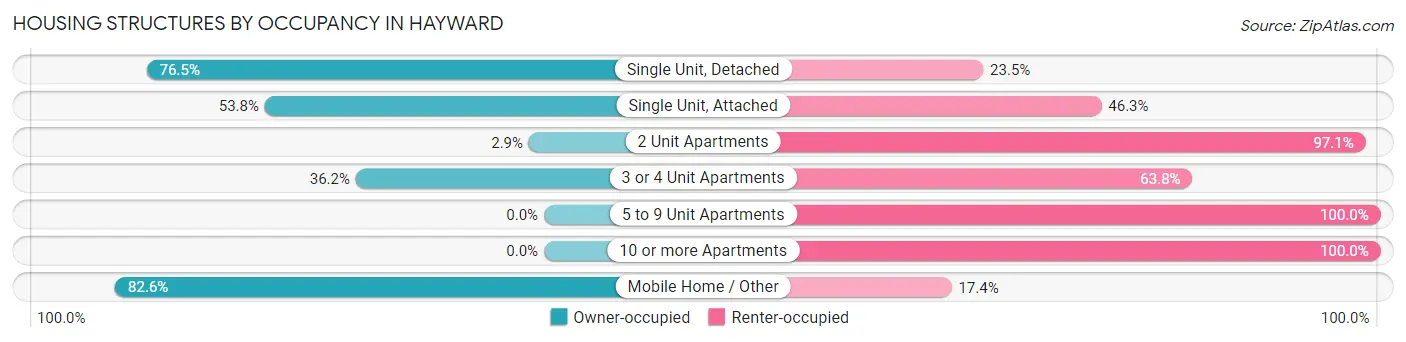
| Structure Type | Owner-occupied | Renter-occupied |
| Single Unit, Detached | 521 (76.5%) | 160 (23.5%) |
| Single Unit, Attached | 43 (53.7%) | 37 (46.3%) |
| 2 Unit Apartments | 6 (2.9%) | 200 (97.1%) |
| 3 or 4 Unit Apartments | 25 (36.2%) | 44 (63.8%) |
| 5 to 9 Unit Apartments | 0 (0.0%) | 29 (100.0%) |
| 10 or more Apartments | 0 (0.0%) | 95 (100.0%) |
| Mobile Home / Other | 19 (82.6%) | 4 (17.4%) |
| Total | 614 (51.9%) | 569 (48.1%) |
Housing Structures by Number of Rooms in Hayward
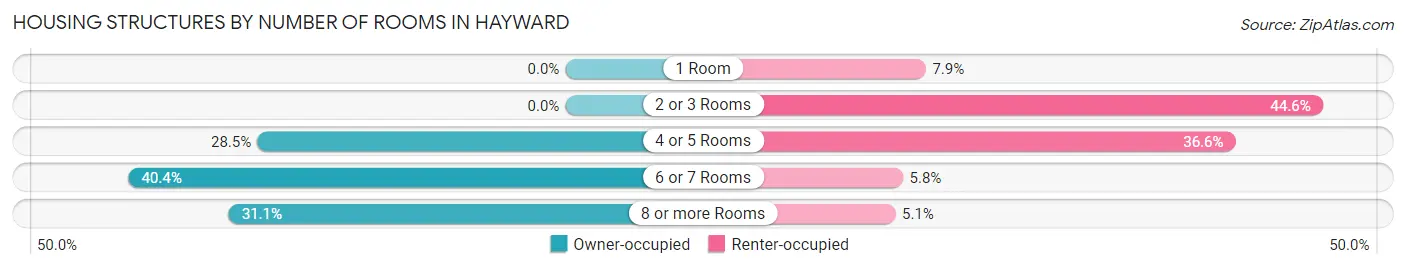
| Number of Rooms | Owner-occupied | Renter-occupied |
| 1 Room | 0 (0.0%) | 45 (7.9%) |
| 2 or 3 Rooms | 0 (0.0%) | 254 (44.6%) |
| 4 or 5 Rooms | 175 (28.5%) | 208 (36.6%) |
| 6 or 7 Rooms | 248 (40.4%) | 33 (5.8%) |
| 8 or more Rooms | 191 (31.1%) | 29 (5.1%) |
| Total | 614 (100.0%) | 569 (100.0%) |
Housing Structure by Heating Type in Hayward
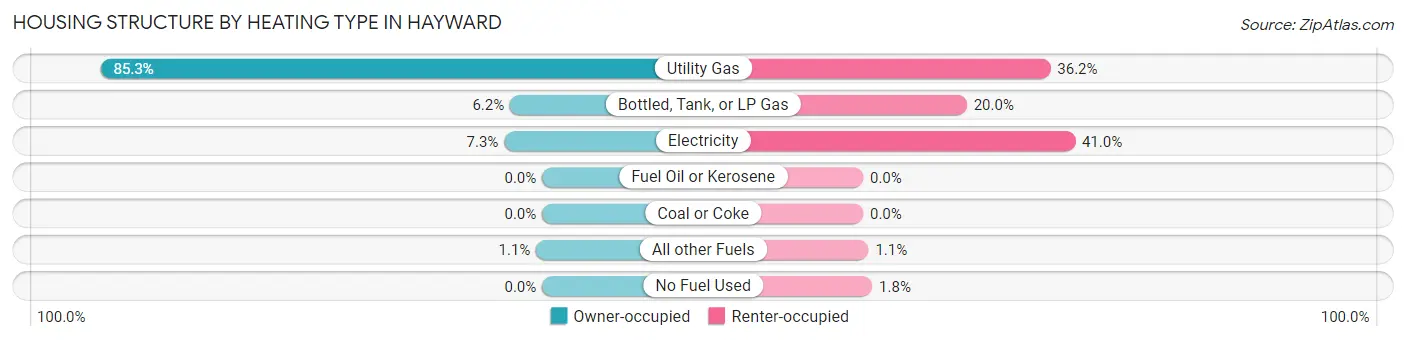
| Heating Type | Owner-occupied | Renter-occupied |
| Utility Gas | 524 (85.3%) | 206 (36.2%) |
| Bottled, Tank, or LP Gas | 38 (6.2%) | 114 (20.0%) |
| Electricity | 45 (7.3%) | 233 (40.9%) |
| Fuel Oil or Kerosene | 0 (0.0%) | 0 (0.0%) |
| Coal or Coke | 0 (0.0%) | 0 (0.0%) |
| All other Fuels | 7 (1.1%) | 6 (1.1%) |
| No Fuel Used | 0 (0.0%) | 10 (1.8%) |
| Total | 614 (100.0%) | 569 (100.0%) |
Household Vehicle Usage in Hayward
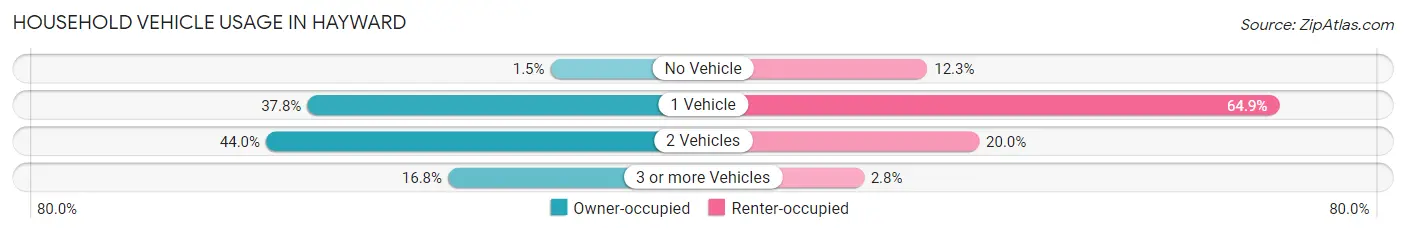
| Vehicles per Household | Owner-occupied | Renter-occupied |
| No Vehicle | 9 (1.5%) | 70 (12.3%) |
| 1 Vehicle | 232 (37.8%) | 369 (64.8%) |
| 2 Vehicles | 270 (44.0%) | 114 (20.0%) |
| 3 or more Vehicles | 103 (16.8%) | 16 (2.8%) |
| Total | 614 (100.0%) | 569 (100.0%) |
Real Estate & Mortgages in Hayward
Real Estate and Mortgage Overview in Hayward
| Characteristic | Without Mortgage | With Mortgage |
| Housing Units | 242 | 372 |
| Median Property Value | $182,600 | $168,000 |
| Median Household Income | $48,571 | $37 |
| Monthly Housing Costs | $526 | $0 |
| Real Estate Taxes | $2,488 | $8 |
Property Value by Mortgage Status in Hayward
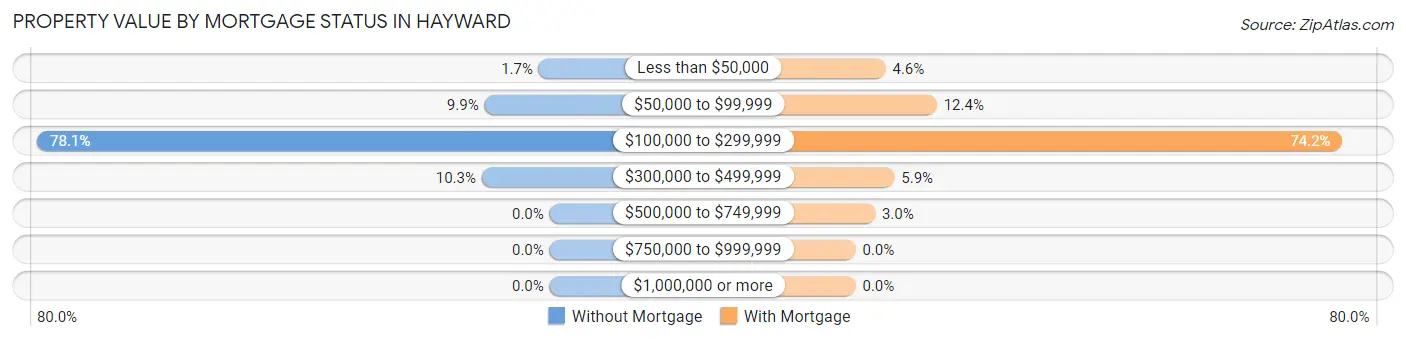
| Property Value | Without Mortgage | With Mortgage |
| Less than $50,000 | 4 (1.7%) | 17 (4.6%) |
| $50,000 to $99,999 | 24 (9.9%) | 46 (12.4%) |
| $100,000 to $299,999 | 189 (78.1%) | 276 (74.2%) |
| $300,000 to $499,999 | 25 (10.3%) | 22 (5.9%) |
| $500,000 to $749,999 | 0 (0.0%) | 11 (3.0%) |
| $750,000 to $999,999 | 0 (0.0%) | 0 (0.0%) |
| $1,000,000 or more | 0 (0.0%) | 0 (0.0%) |
| Total | 242 (100.0%) | 372 (100.0%) |
Household Income by Mortgage Status in Hayward
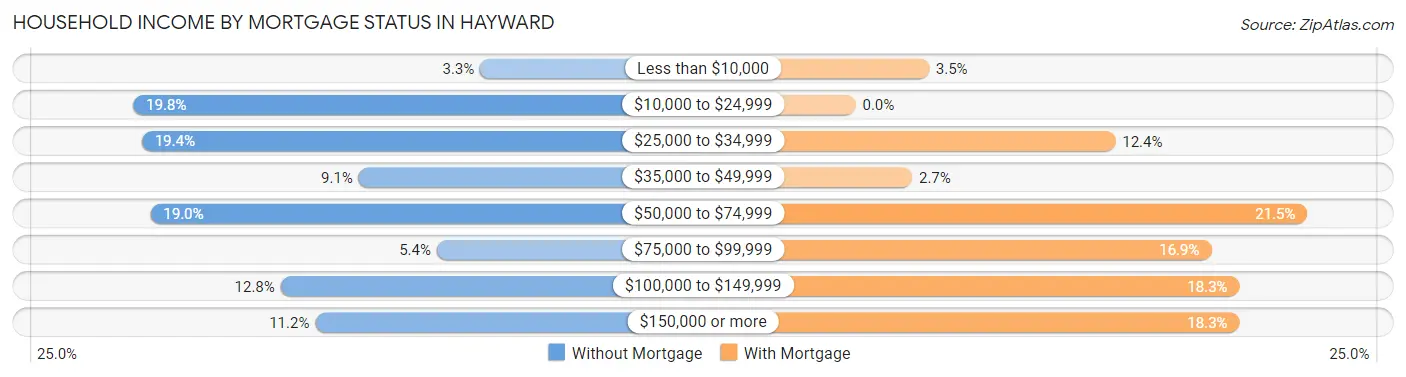
| Household Income | Without Mortgage | With Mortgage |
| Less than $10,000 | 8 (3.3%) | 13 (3.5%) |
| $10,000 to $24,999 | 48 (19.8%) | 0 (0.0%) |
| $25,000 to $34,999 | 47 (19.4%) | 46 (12.4%) |
| $35,000 to $49,999 | 22 (9.1%) | 10 (2.7%) |
| $50,000 to $74,999 | 46 (19.0%) | 80 (21.5%) |
| $75,000 to $99,999 | 13 (5.4%) | 63 (16.9%) |
| $100,000 to $149,999 | 31 (12.8%) | 68 (18.3%) |
| $150,000 or more | 27 (11.2%) | 68 (18.3%) |
| Total | 242 (100.0%) | 372 (100.0%) |
Property Value to Household Income Ratio in Hayward
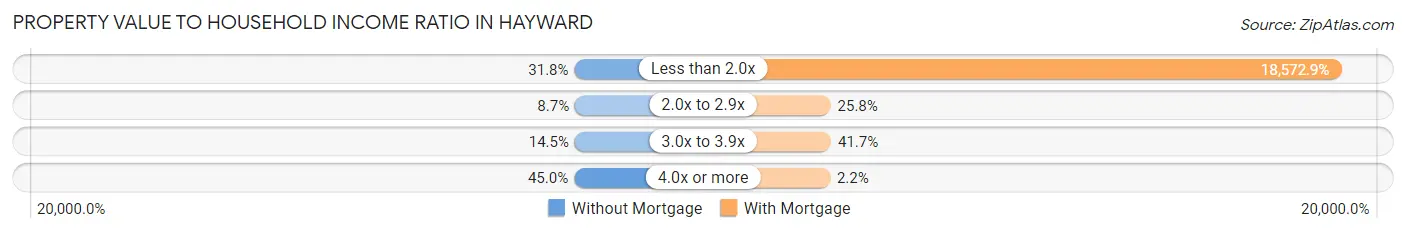
| Value-to-Income Ratio | Without Mortgage | With Mortgage |
| Less than 2.0x | 77 (31.8%) | 69,091 (18,572.8%) |
| 2.0x to 2.9x | 21 (8.7%) | 96 (25.8%) |
| 3.0x to 3.9x | 35 (14.5%) | 155 (41.7%) |
| 4.0x or more | 109 (45.0%) | 8 (2.1%) |
| Total | 242 (100.0%) | 372 (100.0%) |
Real Estate Taxes by Mortgage Status in Hayward
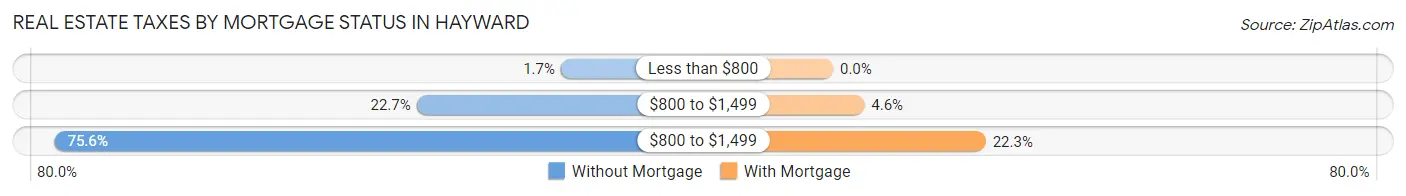
| Property Taxes | Without Mortgage | With Mortgage |
| Less than $800 | 4 (1.7%) | 0 (0.0%) |
| $800 to $1,499 | 55 (22.7%) | 17 (4.6%) |
| $800 to $1,499 | 183 (75.6%) | 83 (22.3%) |
| Total | 242 (100.0%) | 372 (100.0%) |
Health & Disability in Hayward
Health Insurance Coverage by Age in Hayward
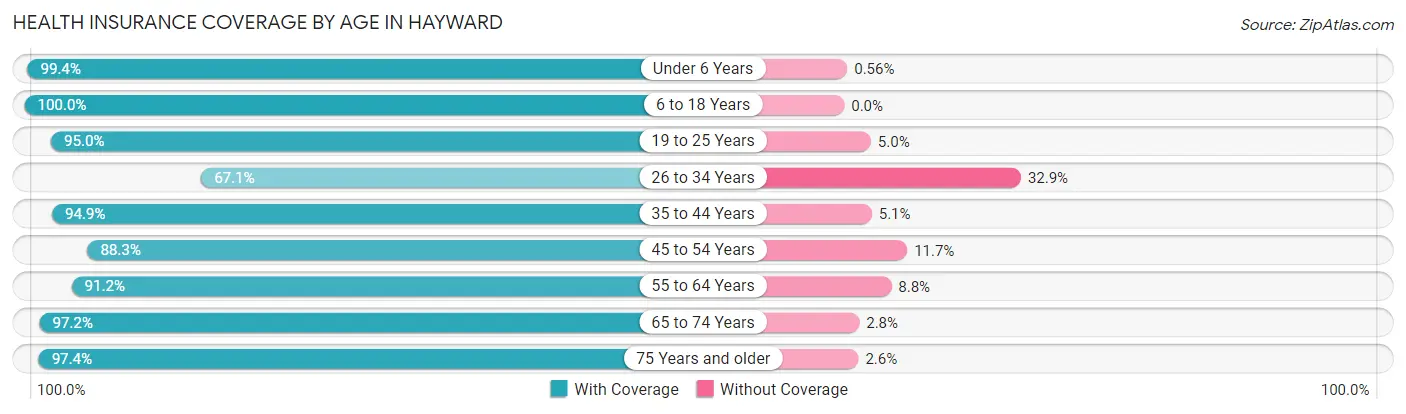
| Age Bracket | With Coverage | Without Coverage |
| Under 6 Years | 178 (99.4%) | 1 (0.6%) |
| 6 to 18 Years | 429 (100.0%) | 0 (0.0%) |
| 19 to 25 Years | 115 (95.0%) | 6 (5.0%) |
| 26 to 34 Years | 230 (67.1%) | 113 (32.9%) |
| 35 to 44 Years | 259 (94.9%) | 14 (5.1%) |
| 45 to 54 Years | 158 (88.3%) | 21 (11.7%) |
| 55 to 64 Years | 405 (91.2%) | 39 (8.8%) |
| 65 to 74 Years | 209 (97.2%) | 6 (2.8%) |
| 75 Years and older | 221 (97.4%) | 6 (2.6%) |
| Total | 2,204 (91.4%) | 206 (8.6%) |
Health Insurance Coverage by Citizenship Status in Hayward
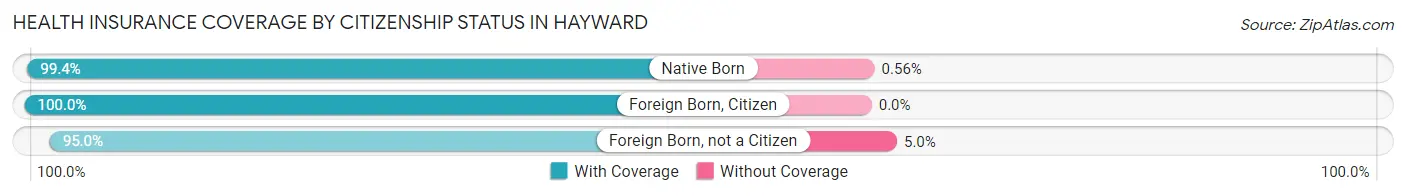
| Citizenship Status | With Coverage | Without Coverage |
| Native Born | 178 (99.4%) | 1 (0.6%) |
| Foreign Born, Citizen | 429 (100.0%) | 0 (0.0%) |
| Foreign Born, not a Citizen | 115 (95.0%) | 6 (5.0%) |
Health Insurance Coverage by Household Income in Hayward
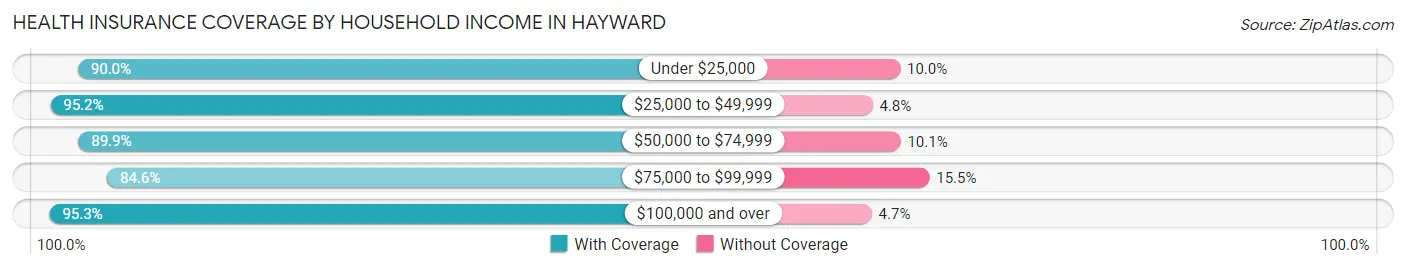
| Household Income | With Coverage | Without Coverage |
| Under $25,000 | 460 (90.0%) | 51 (10.0%) |
| $25,000 to $49,999 | 573 (95.2%) | 29 (4.8%) |
| $50,000 to $74,999 | 483 (89.9%) | 54 (10.1%) |
| $75,000 to $99,999 | 290 (84.6%) | 53 (15.4%) |
| $100,000 and over | 389 (95.3%) | 19 (4.7%) |
Public vs Private Health Insurance Coverage by Age in Hayward
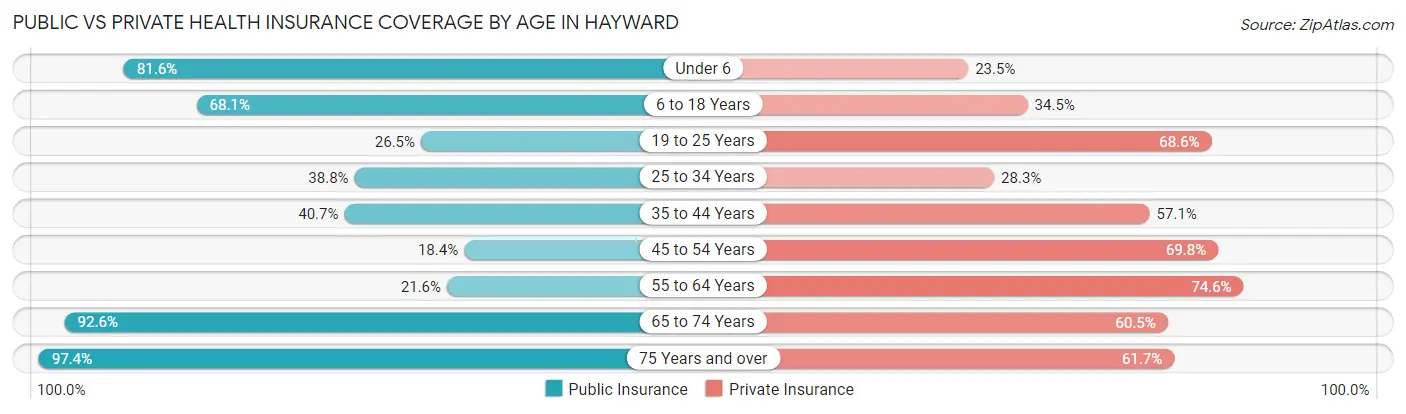
| Age Bracket | Public Insurance | Private Insurance |
| Under 6 | 146 (81.6%) | 42 (23.5%) |
| 6 to 18 Years | 292 (68.1%) | 148 (34.5%) |
| 19 to 25 Years | 32 (26.5%) | 83 (68.6%) |
| 25 to 34 Years | 133 (38.8%) | 97 (28.3%) |
| 35 to 44 Years | 111 (40.7%) | 156 (57.1%) |
| 45 to 54 Years | 33 (18.4%) | 125 (69.8%) |
| 55 to 64 Years | 96 (21.6%) | 331 (74.6%) |
| 65 to 74 Years | 199 (92.6%) | 130 (60.5%) |
| 75 Years and over | 221 (97.4%) | 140 (61.7%) |
| Total | 1,263 (52.4%) | 1,252 (51.9%) |
Disability Status by Sex by Age in Hayward
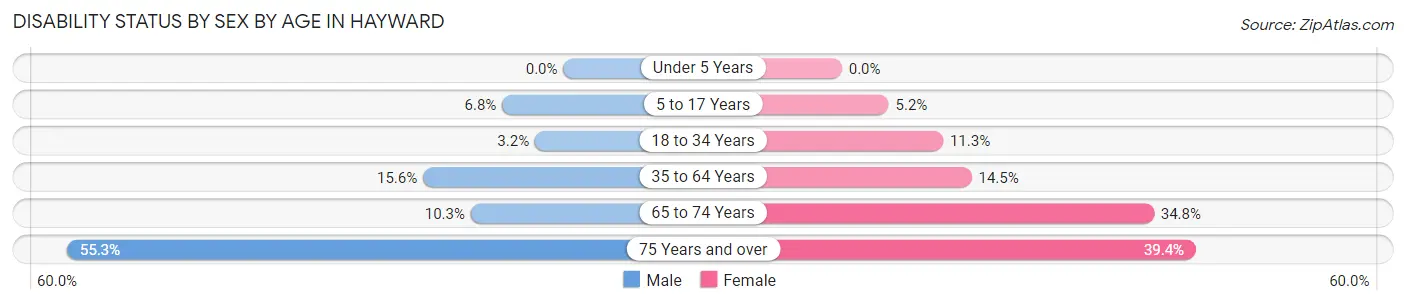
| Age Bracket | Male | Female |
| Under 5 Years | 0 (0.0%) | 0 (0.0%) |
| 5 to 17 Years | 16 (6.8%) | 10 (5.2%) |
| 18 to 34 Years | 9 (3.2%) | 23 (11.3%) |
| 35 to 64 Years | 73 (15.6%) | 62 (14.4%) |
| 65 to 74 Years | 10 (10.3%) | 41 (34.7%) |
| 75 Years and over | 47 (55.3%) | 56 (39.4%) |
Disability Class by Sex by Age in Hayward
Disability Class: Hearing Difficulty
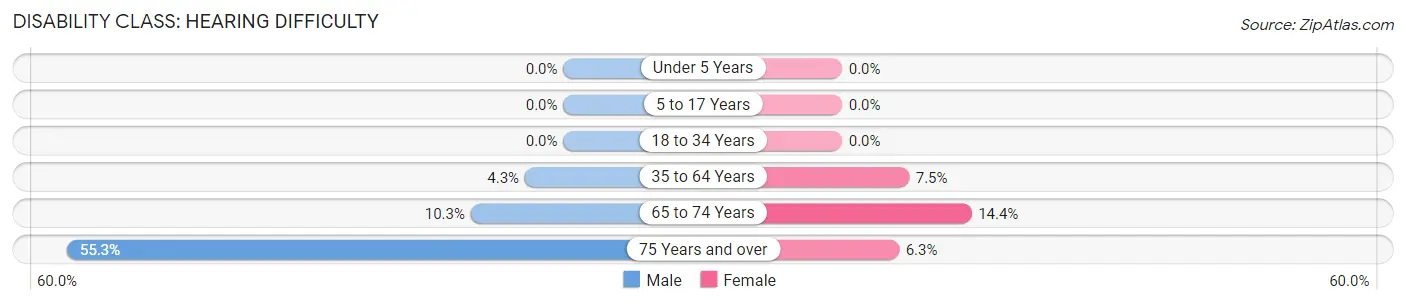
| Age Bracket | Male | Female |
| Under 5 Years | 0 (0.0%) | 0 (0.0%) |
| 5 to 17 Years | 0 (0.0%) | 0 (0.0%) |
| 18 to 34 Years | 0 (0.0%) | 0 (0.0%) |
| 35 to 64 Years | 20 (4.3%) | 32 (7.5%) |
| 65 to 74 Years | 10 (10.3%) | 17 (14.4%) |
| 75 Years and over | 47 (55.3%) | 9 (6.3%) |
Disability Class: Vision Difficulty
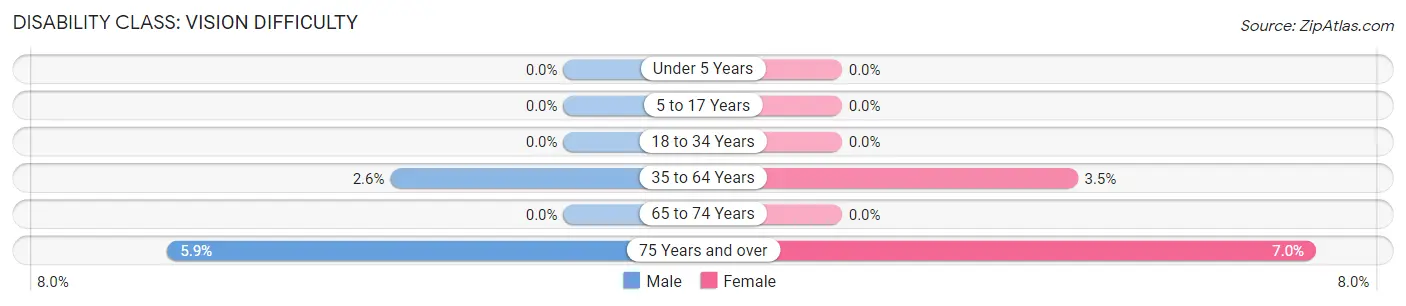
| Age Bracket | Male | Female |
| Under 5 Years | 0 (0.0%) | 0 (0.0%) |
| 5 to 17 Years | 0 (0.0%) | 0 (0.0%) |
| 18 to 34 Years | 0 (0.0%) | 0 (0.0%) |
| 35 to 64 Years | 12 (2.6%) | 15 (3.5%) |
| 65 to 74 Years | 0 (0.0%) | 0 (0.0%) |
| 75 Years and over | 5 (5.9%) | 10 (7.0%) |
Disability Class: Cognitive Difficulty
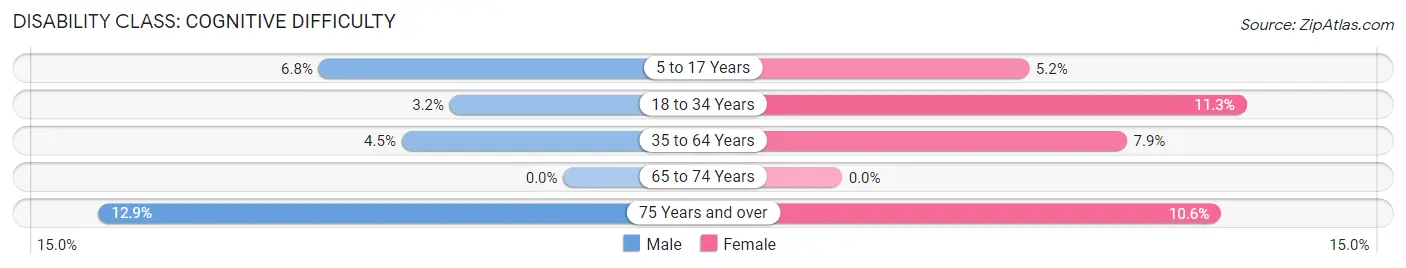
| Age Bracket | Male | Female |
| 5 to 17 Years | 16 (6.8%) | 10 (5.2%) |
| 18 to 34 Years | 9 (3.2%) | 23 (11.3%) |
| 35 to 64 Years | 21 (4.5%) | 34 (7.9%) |
| 65 to 74 Years | 0 (0.0%) | 0 (0.0%) |
| 75 Years and over | 11 (12.9%) | 15 (10.6%) |
Disability Class: Ambulatory Difficulty
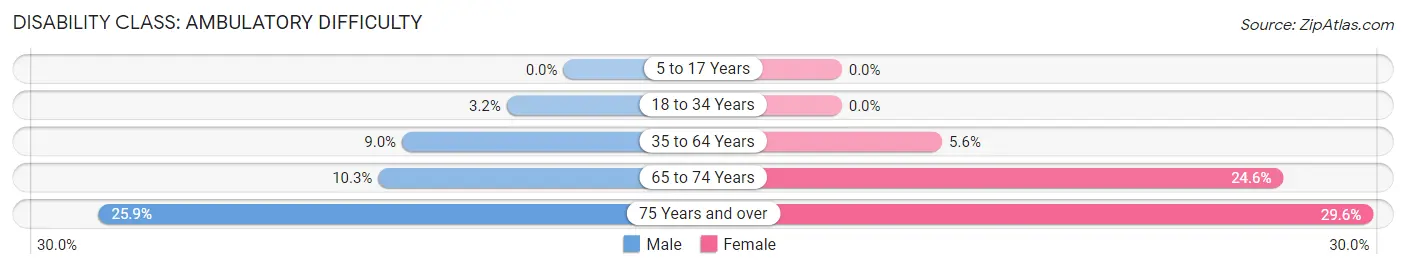
| Age Bracket | Male | Female |
| 5 to 17 Years | 0 (0.0%) | 0 (0.0%) |
| 18 to 34 Years | 9 (3.2%) | 0 (0.0%) |
| 35 to 64 Years | 42 (9.0%) | 24 (5.6%) |
| 65 to 74 Years | 10 (10.3%) | 29 (24.6%) |
| 75 Years and over | 22 (25.9%) | 42 (29.6%) |
Disability Class: Self-Care Difficulty
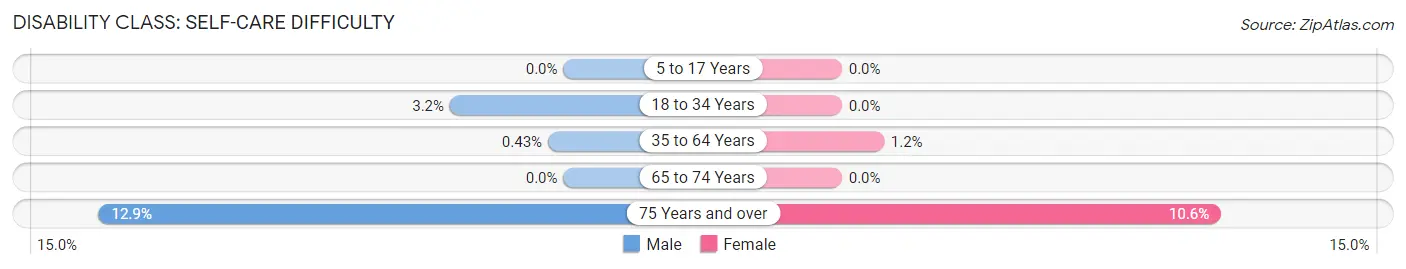
| Age Bracket | Male | Female |
| 5 to 17 Years | 0 (0.0%) | 0 (0.0%) |
| 18 to 34 Years | 9 (3.2%) | 0 (0.0%) |
| 35 to 64 Years | 2 (0.4%) | 5 (1.2%) |
| 65 to 74 Years | 0 (0.0%) | 0 (0.0%) |
| 75 Years and over | 11 (12.9%) | 15 (10.6%) |
Technology Access in Hayward
Computing Device Access in Hayward
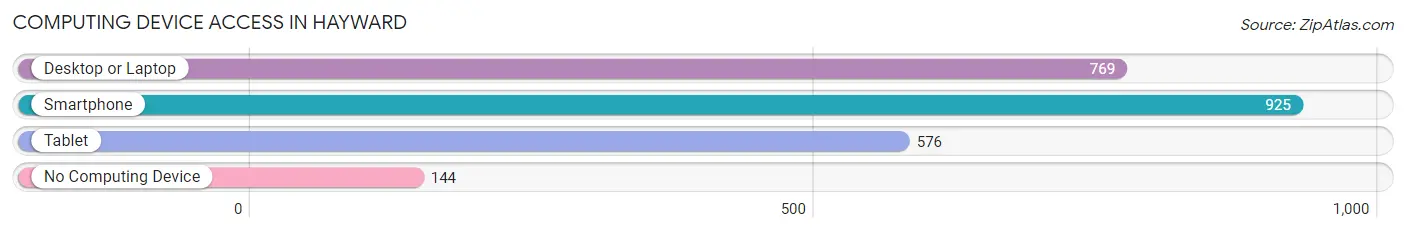
| Device Type | # Households | % Households |
| Desktop or Laptop | 769 | 65.0% |
| Smartphone | 925 | 78.2% |
| Tablet | 576 | 48.7% |
| No Computing Device | 144 | 12.2% |
| Total | 1,183 | 100.0% |
Internet Access in Hayward
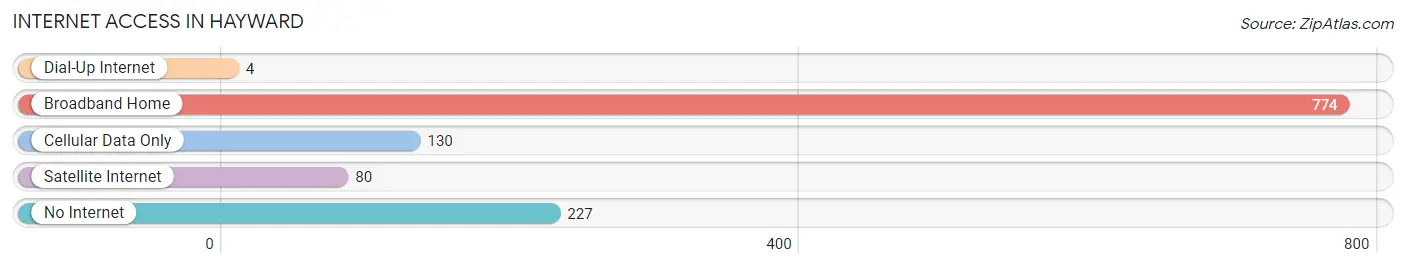
| Internet Type | # Households | % Households |
| Dial-Up Internet | 4 | 0.3% |
| Broadband Home | 774 | 65.4% |
| Cellular Data Only | 130 | 11.0% |
| Satellite Internet | 80 | 6.8% |
| No Internet | 227 | 19.2% |
| Total | 1,183 | 100.0% |
Hayward Summary
Hayward, Wisconsin is a small city located in Sawyer County in the northwestern part of the state. It is situated on the shores of the Chippewa Flowage, a large lake that is part of the Chippewa River system. The city is home to a population of 2,000 people and is the county seat of Sawyer County.
History
The area that is now Hayward was first settled in the late 1800s by lumberjacks and farmers. The city was officially incorporated in 1891 and was named after the first postmaster, William Hayward. The city quickly grew as a logging and lumbering center, and by the early 1900s, it had become a major tourist destination. The city was also home to a number of resorts and hotels, as well as a number of businesses related to the lumber industry.
In the 1950s, the city began to transition away from its reliance on the lumber industry and began to focus more on tourism. The city was home to a number of resorts and hotels, as well as a number of businesses related to the tourism industry. The city also began to attract a number of retirees, who were drawn to the area for its natural beauty and recreational opportunities.
Geography
Hayward is located in Sawyer County in the northwestern part of Wisconsin. It is situated on the shores of the Chippewa Flowage, a large lake that is part of the Chippewa River system. The city is surrounded by a number of smaller lakes, including Lac Courte Oreilles, Round Lake, and Teal Lake. The city is also located near the Chequamegon-Nicolet National Forest, which provides a number of recreational opportunities for residents and visitors.
The city has a total area of 4.2 square miles, all of which is land. The city has a humid continental climate, with cold winters and warm summers. The average annual temperature is around 40 degrees Fahrenheit, with an average high of around 70 degrees in the summer and an average low of around 20 degrees in the winter.
Economy
The economy of Hayward is largely based on tourism and the service industry. The city is home to a number of resorts and hotels, as well as a number of businesses related to the tourism industry. The city is also home to a number of retail stores, restaurants, and other businesses. The city is also home to a number of manufacturing companies, including a paper mill and a wood products plant.
The city is also home to a number of educational institutions, including the University of Wisconsin-Superior, the University of Wisconsin-Stout, and the Wisconsin Indianhead Technical College. The city is also home to a number of healthcare facilities, including a hospital and a number of clinics.
Demographics
As of the 2010 census, the population of Hayward was 2,000 people. The racial makeup of the city was 95.2% White, 0.7% African American, 0.7% Native American, 0.7% Asian, 0.3% from other races, and 2.1% from two or more races. The median household income was $37,500, and the median family income was $45,000. The per capita income was $20,000.
The city is home to a number of religious institutions, including a number of churches, a synagogue, and a mosque. The city is also home to a number of cultural institutions, including a museum, a theater, and a library. The city is also home to a number of parks and recreational facilities, including a golf course, a ski hill, and a number of hiking trails.
Common Questions
What is Per Capita Income in Hayward?
Per Capita income in Hayward is $27,700.
What is the Median Family Income in Hayward?
Median Family Income in Hayward is $53,516.
What is the Median Household income in Hayward?
Median Household Income in Hayward is $39,422.
What is Income or Wage Gap in Hayward?
Income or Wage Gap in Hayward is 35.1%.
Women in Hayward earn 64.9 cents for every dollar earned by a man.
What is Inequality or Gini Index in Hayward?
Inequality or Gini Index in Hayward is 0.44.
What is the Total Population of Hayward?
Total Population of Hayward is 2,526.
What is the Total Male Population of Hayward?
Total Male Population of Hayward is 1,302.
What is the Total Female Population of Hayward?
Total Female Population of Hayward is 1,224.
What is the Ratio of Males per 100 Females in Hayward?
There are 106.37 Males per 100 Females in Hayward.
What is the Ratio of Females per 100 Males in Hayward?
There are 94.01 Females per 100 Males in Hayward.
What is the Median Population Age in Hayward?
Median Population Age in Hayward is 38.7 Years.
What is the Average Family Size in Hayward
Average Family Size in Hayward is 2.8 People.
What is the Average Household Size in Hayward
Average Household Size in Hayward is 2.0 People.
How Large is the Labor Force in Hayward?
There are 1,222 People in the Labor Forcein in Hayward.
What is the Percentage of People in the Labor Force in Hayward?
61.7% of People are in the Labor Force in Hayward.
What is the Unemployment Rate in Hayward?
Unemployment Rate in Hayward is 5.4%.