Hemet, CA Map & Demographics
Hemet Map
Hemet Overview
$26,043
PER CAPITA INCOME
$58,768
AVG FAMILY INCOME
$49,901
AVG HOUSEHOLD INCOME
31.8%
WAGE / INCOME GAP [ % ]
68.2¢/ $1
WAGE / INCOME GAP [ $ ]
$10,852
FAMILY INCOME DEFICIT
0.46
INEQUALITY / GINI INDEX
89,651
TOTAL POPULATION
43,793
MALE POPULATION
45,858
FEMALE POPULATION
95.50
MALES / 100 FEMALES
104.72
FEMALES / 100 MALES
39.0
MEDIAN AGE
3.5
AVG FAMILY SIZE
2.9
AVG HOUSEHOLD SIZE
34,908
LABOR FORCE [ PEOPLE ]
49.4%
PERCENT IN LABOR FORCE
9.5%
UNEMPLOYMENT RATE
Income in Hemet
Income Overview in Hemet
Per Capita Income in Hemet is $26,043, while median incomes of families and households are $58,768 and $49,901 respectively.
| Characteristic | Number | Measure |
| Per Capita Income | 89,651 | $26,043 |
| Median Family Income | 20,999 | $58,768 |
| Mean Family Income | 20,999 | $79,782 |
| Median Household Income | 30,963 | $49,901 |
| Mean Household Income | 30,963 | $70,999 |
| Income Deficit | 20,999 | $10,852 |
| Wage / Income Gap (%) | 89,651 | 31.83% |
| Wage / Income Gap ($) | 89,651 | 68.17¢ per $1 |
| Gini / Inequality Index | 89,651 | 0.46 |
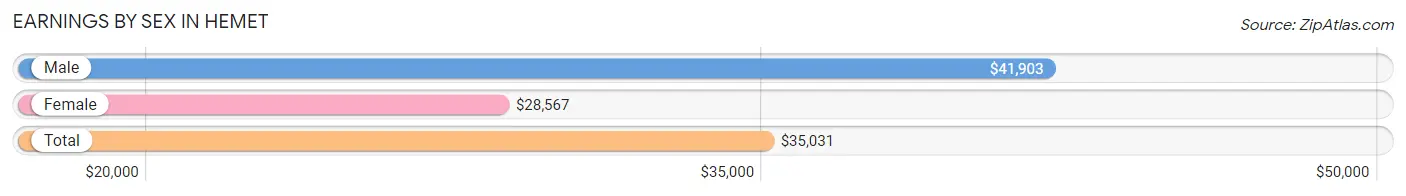
Earnings by Sex in Hemet
Average Earnings in Hemet are $35,031, $41,903 for men and $28,567 for women, a difference of 31.8%.
| Sex | Number | Average Earnings |
| Male | 18,808 (54.5%) | $41,903 |
| Female | 15,676 (45.5%) | $28,567 |
| Total | 34,484 (100.0%) | $35,031 |
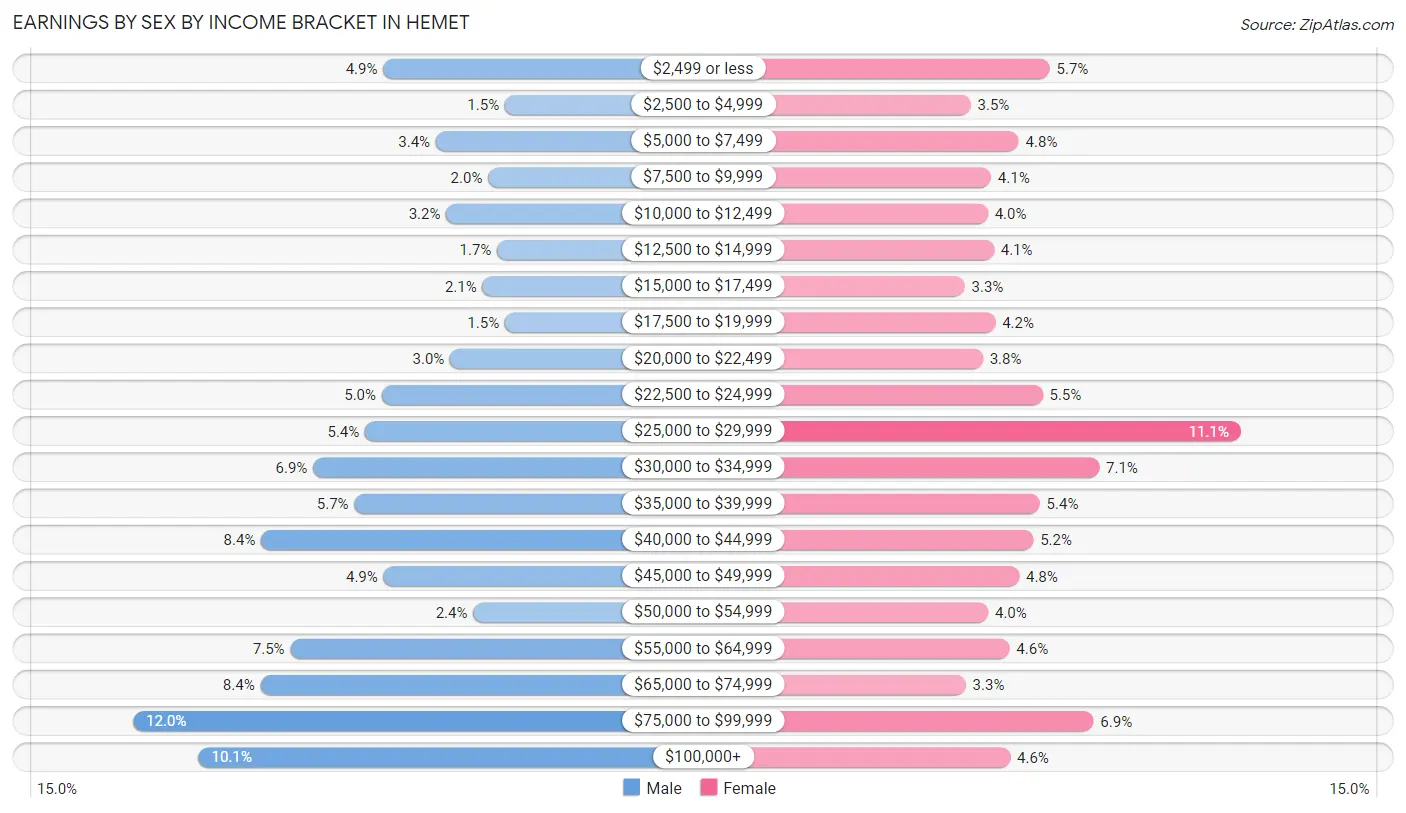
Earnings by Sex by Income Bracket in Hemet
The most common earnings brackets in Hemet are $75,000 to $99,999 for men (2,248 | 11.9%) and $25,000 to $29,999 for women (1,735 | 11.1%).
| Income | Male | Female |
| $2,499 or less | 925 (4.9%) | 894 (5.7%) |
| $2,500 to $4,999 | 282 (1.5%) | 546 (3.5%) |
| $5,000 to $7,499 | 647 (3.4%) | 757 (4.8%) |
| $7,500 to $9,999 | 371 (2.0%) | 635 (4.1%) |
| $10,000 to $12,499 | 593 (3.2%) | 621 (4.0%) |
| $12,500 to $14,999 | 324 (1.7%) | 648 (4.1%) |
| $15,000 to $17,499 | 401 (2.1%) | 519 (3.3%) |
| $17,500 to $19,999 | 283 (1.5%) | 653 (4.2%) |
| $20,000 to $22,499 | 571 (3.0%) | 599 (3.8%) |
| $22,500 to $24,999 | 933 (5.0%) | 862 (5.5%) |
| $25,000 to $29,999 | 1,022 (5.4%) | 1,735 (11.1%) |
| $30,000 to $34,999 | 1,296 (6.9%) | 1,111 (7.1%) |
| $35,000 to $39,999 | 1,077 (5.7%) | 849 (5.4%) |
| $40,000 to $44,999 | 1,570 (8.4%) | 821 (5.2%) |
| $45,000 to $49,999 | 923 (4.9%) | 759 (4.8%) |
| $50,000 to $54,999 | 450 (2.4%) | 623 (4.0%) |
| $55,000 to $64,999 | 1,417 (7.5%) | 716 (4.6%) |
| $65,000 to $74,999 | 1,574 (8.4%) | 523 (3.3%) |
| $75,000 to $99,999 | 2,248 (11.9%) | 1,086 (6.9%) |
| $100,000+ | 1,901 (10.1%) | 719 (4.6%) |
| Total | 18,808 (100.0%) | 15,676 (100.0%) |
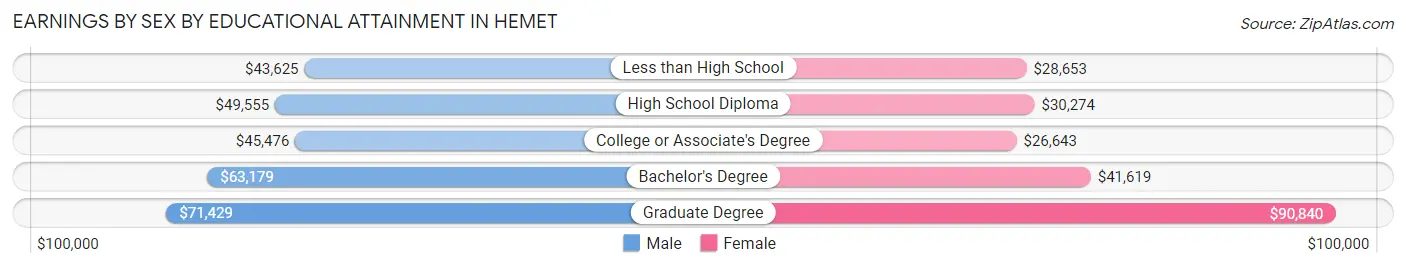
Earnings by Sex by Educational Attainment in Hemet
Average earnings in Hemet are $46,533 for men and $30,805 for women, a difference of 33.8%. Men with an educational attainment of graduate degree enjoy the highest average annual earnings of $71,429, while those with less than high school education earn the least with $43,625. Women with an educational attainment of graduate degree earn the most with the average annual earnings of $90,840, while those with college or associate's degree education have the smallest earnings of $26,643.
| Educational Attainment | Male Income | Female Income |
| Less than High School | $43,625 | $28,653 |
| High School Diploma | $49,555 | $30,274 |
| College or Associate's Degree | $45,476 | $26,643 |
| Bachelor's Degree | $63,179 | $41,619 |
| Graduate Degree | $71,429 | $90,840 |
| Total | $46,533 | $30,805 |
Family Income in Hemet
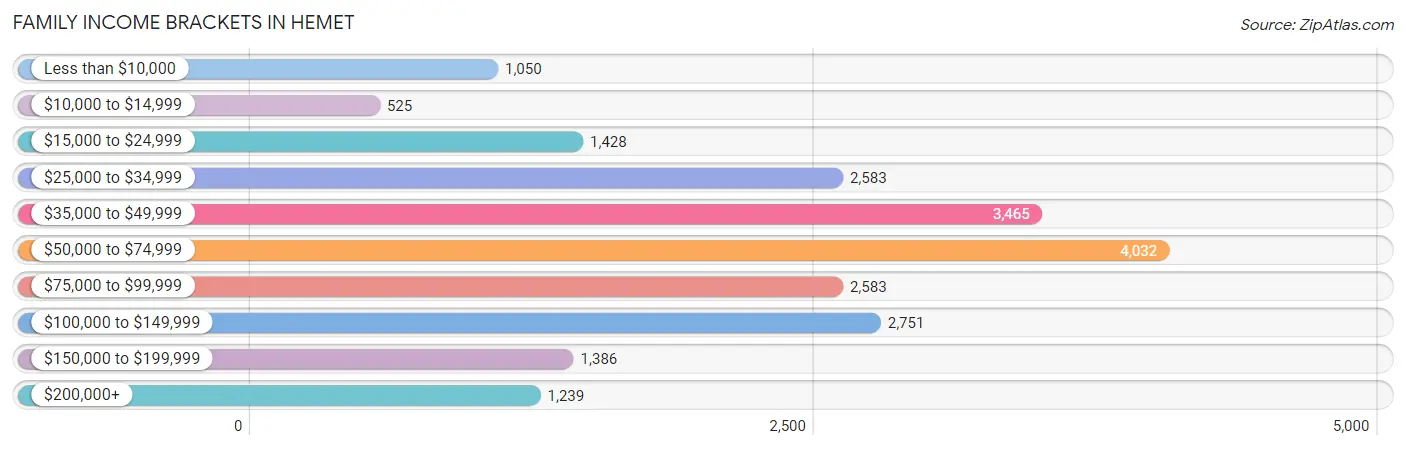
Family Income Brackets in Hemet
According to the Hemet family income data, there are 4,032 families falling into the $50,000 to $74,999 income range, which is the most common income bracket and makes up 19.2% of all families. Conversely, the $10,000 to $14,999 income bracket is the least frequent group with only 525 families (2.5%) belonging to this category.
| Income Bracket | # Families | % Families |
| Less than $10,000 | 1,050 | 5.0% |
| $10,000 to $14,999 | 525 | 2.5% |
| $15,000 to $24,999 | 1,428 | 6.8% |
| $25,000 to $34,999 | 2,583 | 12.3% |
| $35,000 to $49,999 | 3,465 | 16.5% |
| $50,000 to $74,999 | 4,032 | 19.2% |
| $75,000 to $99,999 | 2,583 | 12.3% |
| $100,000 to $149,999 | 2,751 | 13.1% |
| $150,000 to $199,999 | 1,386 | 6.6% |
| $200,000+ | 1,239 | 5.9% |
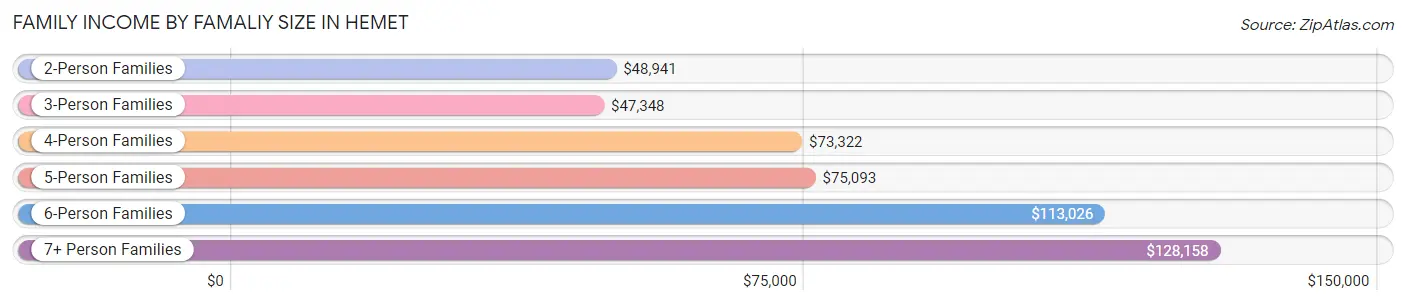
Family Income by Famaliy Size in Hemet
7+ person families (1,132 | 5.4%) account for the highest median family income in Hemet with $128,158 per family, while 2-person families (9,502 | 45.3%) have the highest median income of $24,470 per family member.
| Income Bracket | # Families | Median Income |
| 2-Person Families | 9,502 (45.3%) | $48,941 |
| 3-Person Families | 3,444 (16.4%) | $47,348 |
| 4-Person Families | 3,893 (18.5%) | $73,322 |
| 5-Person Families | 1,920 (9.1%) | $75,093 |
| 6-Person Families | 1,108 (5.3%) | $113,026 |
| 7+ Person Families | 1,132 (5.4%) | $128,158 |
| Total | 20,999 (100.0%) | $58,768 |
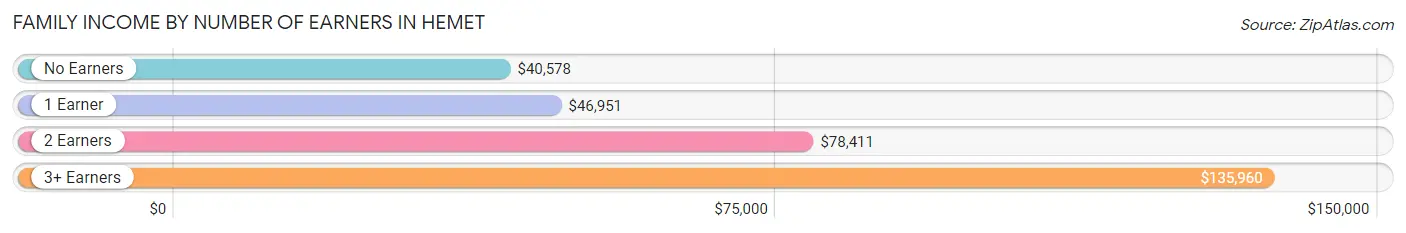
Family Income by Number of Earners in Hemet
The median family income in Hemet is $58,768, with families comprising 3+ earners (2,171) having the highest median family income of $135,960, while families with no earners (6,151) have the lowest median family income of $40,578, accounting for 10.3% and 29.3% of families, respectively.
| Number of Earners | # Families | Median Income |
| No Earners | 6,151 (29.3%) | $40,578 |
| 1 Earner | 6,741 (32.1%) | $46,951 |
| 2 Earners | 5,936 (28.3%) | $78,411 |
| 3+ Earners | 2,171 (10.3%) | $135,960 |
| Total | 20,999 (100.0%) | $58,768 |
Household Income in Hemet
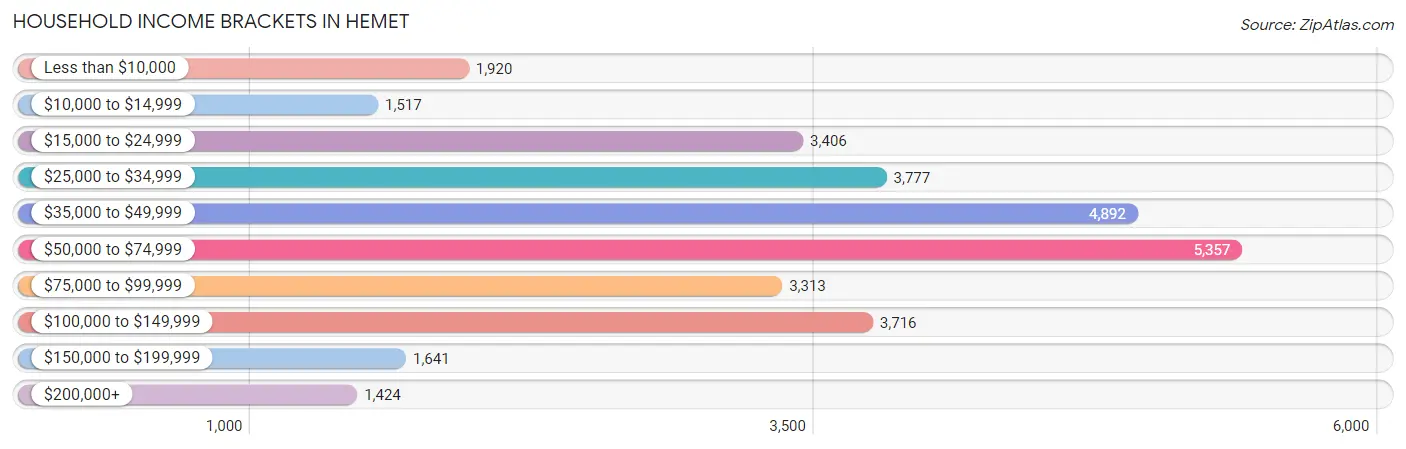
Household Income Brackets in Hemet
With 5,357 households falling in the category, the $50,000 to $74,999 income range is the most frequent in Hemet, accounting for 17.3% of all households. In contrast, only 1,424 households (4.6%) fall into the $200,000+ income bracket, making it the least populous group.
| Income Bracket | # Households | % Households |
| Less than $10,000 | 1,920 | 6.2% |
| $10,000 to $14,999 | 1,517 | 4.9% |
| $15,000 to $24,999 | 3,406 | 11.0% |
| $25,000 to $34,999 | 3,777 | 12.2% |
| $35,000 to $49,999 | 4,892 | 15.8% |
| $50,000 to $74,999 | 5,357 | 17.3% |
| $75,000 to $99,999 | 3,313 | 10.7% |
| $100,000 to $149,999 | 3,716 | 12.0% |
| $150,000 to $199,999 | 1,641 | 5.3% |
| $200,000+ | 1,424 | 4.6% |
Household Income by Householder Age in Hemet
The median household income in Hemet is $49,901, with the highest median household income of $67,729 found in the 25 to 44 years age bracket for the primary householder. A total of 9,231 households (29.8%) fall into this category. Meanwhile, the 65+ years age bracket for the primary householder has the lowest median household income of $37,008, with 11,837 households (38.2%) in this group.
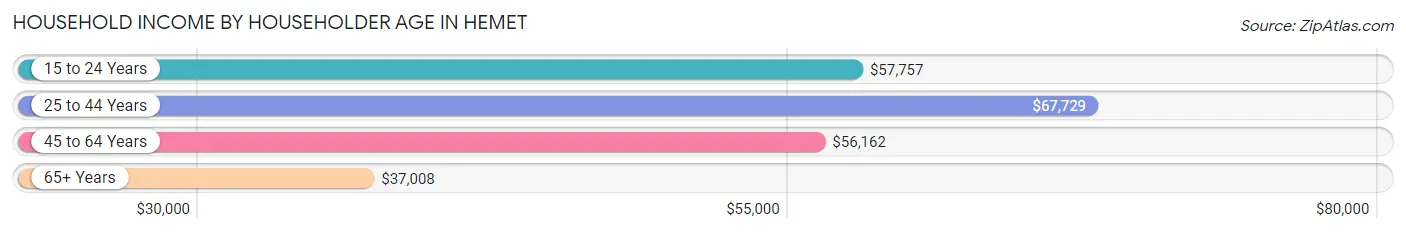
| Income Bracket | # Households | Median Income |
| 15 to 24 Years | 539 (1.7%) | $57,757 |
| 25 to 44 Years | 9,231 (29.8%) | $67,729 |
| 45 to 64 Years | 9,356 (30.2%) | $56,162 |
| 65+ Years | 11,837 (38.2%) | $37,008 |
| Total | 30,963 (100.0%) | $49,901 |
Poverty in Hemet
Income Below Poverty by Sex and Age in Hemet
With 15.6% poverty level for males and 19.0% for females among the residents of Hemet, 15 year old males and under 5 year old females are the most vulnerable to poverty, with 246 males (27.9%) and 771 females (29.7%) in their respective age groups living below the poverty level.
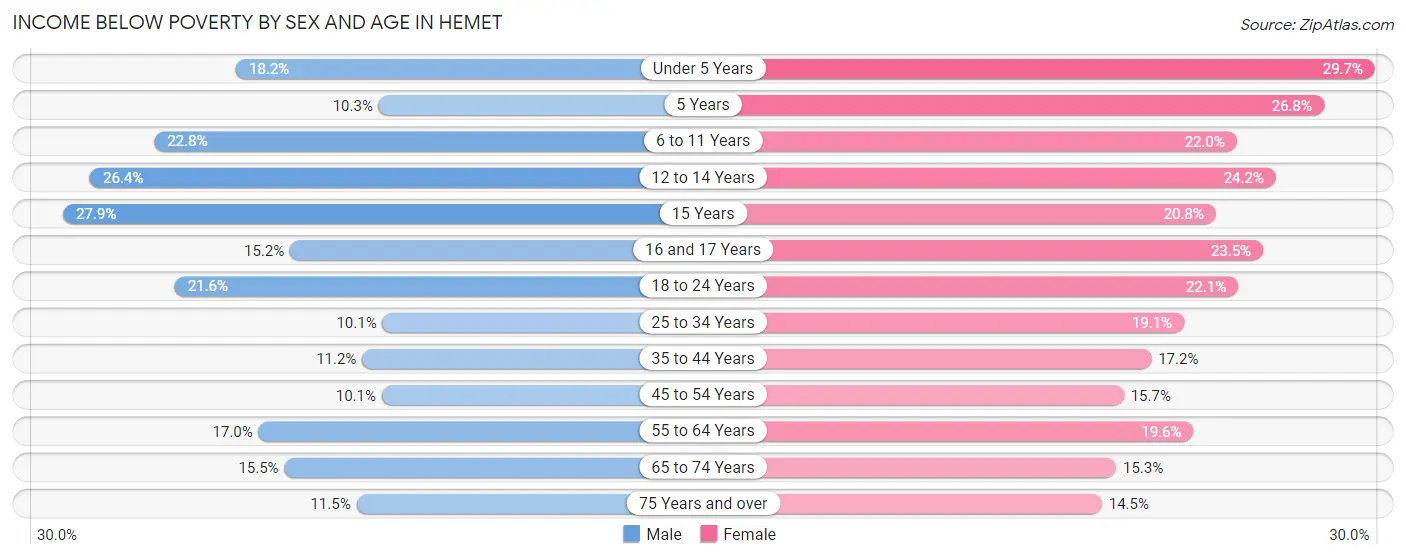
| Age Bracket | Male | Female |
| Under 5 Years | 458 (18.2%) | 771 (29.7%) |
| 5 Years | 65 (10.3%) | 113 (26.8%) |
| 6 to 11 Years | 881 (22.8%) | 801 (22.0%) |
| 12 to 14 Years | 538 (26.4%) | 359 (24.2%) |
| 15 Years | 246 (27.9%) | 97 (20.8%) |
| 16 and 17 Years | 200 (15.2%) | 302 (23.4%) |
| 18 to 24 Years | 850 (21.6%) | 720 (22.1%) |
| 25 to 34 Years | 580 (10.1%) | 1,113 (19.1%) |
| 35 to 44 Years | 533 (11.2%) | 942 (17.2%) |
| 45 to 54 Years | 441 (10.1%) | 662 (15.7%) |
| 55 to 64 Years | 812 (17.0%) | 1,076 (19.6%) |
| 65 to 74 Years | 760 (15.5%) | 824 (15.3%) |
| 75 Years and over | 428 (11.5%) | 801 (14.5%) |
| Total | 6,792 (15.6%) | 8,581 (19.0%) |
Income Above Poverty by Sex and Age in Hemet
According to the poverty statistics in Hemet, males aged 25 to 34 years and females aged 75 years and over are the age groups that are most secure financially, with 89.9% of males and 85.5% of females in these age groups living above the poverty line.
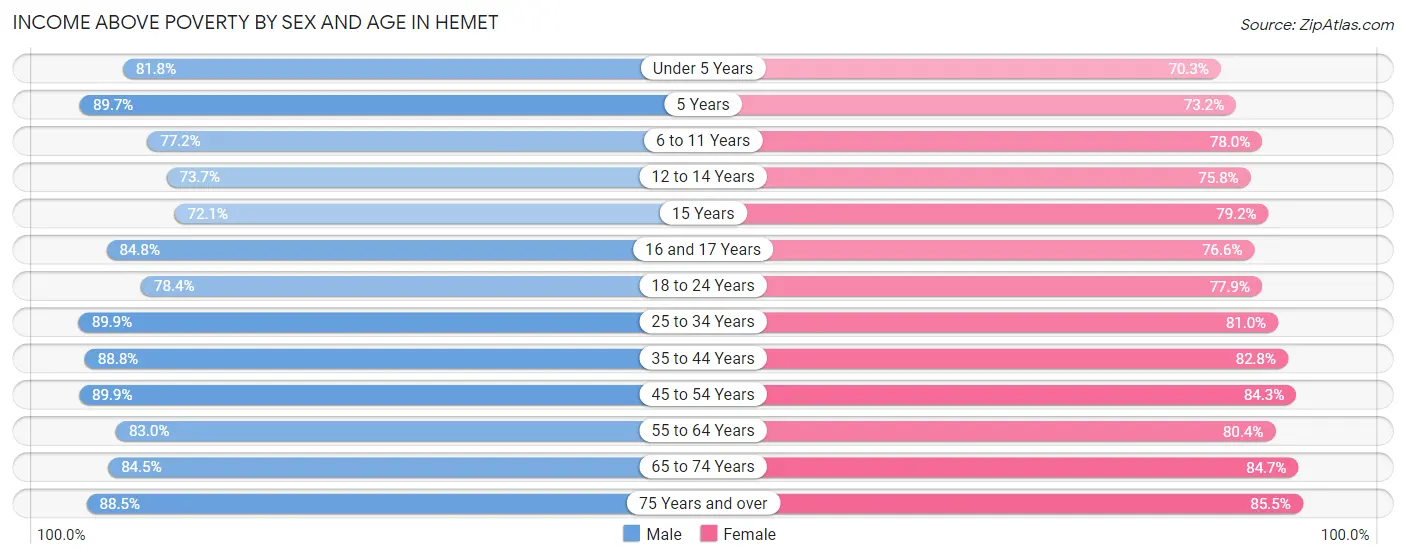
| Age Bracket | Male | Female |
| Under 5 Years | 2,055 (81.8%) | 1,827 (70.3%) |
| 5 Years | 567 (89.7%) | 308 (73.2%) |
| 6 to 11 Years | 2,986 (77.2%) | 2,841 (78.0%) |
| 12 to 14 Years | 1,504 (73.7%) | 1,127 (75.8%) |
| 15 Years | 637 (72.1%) | 369 (79.2%) |
| 16 and 17 Years | 1,114 (84.8%) | 986 (76.5%) |
| 18 to 24 Years | 3,078 (78.4%) | 2,544 (77.9%) |
| 25 to 34 Years | 5,178 (89.9%) | 4,728 (80.9%) |
| 35 to 44 Years | 4,226 (88.8%) | 4,524 (82.8%) |
| 45 to 54 Years | 3,921 (89.9%) | 3,555 (84.3%) |
| 55 to 64 Years | 3,973 (83.0%) | 4,422 (80.4%) |
| 65 to 74 Years | 4,133 (84.5%) | 4,571 (84.7%) |
| 75 Years and over | 3,288 (88.5%) | 4,732 (85.5%) |
| Total | 36,660 (84.4%) | 36,534 (81.0%) |
Income Below Poverty Among Married-Couple Families in Hemet
The poverty statistics for married-couple families in Hemet show that 8.6% or 1,178 of the total 13,728 families live below the poverty line. Families with 5 or more children have the highest poverty rate of 23.8%, comprising of 25 families. On the other hand, families with 1 or 2 children have the lowest poverty rate of 7.1%, which includes 315 families.
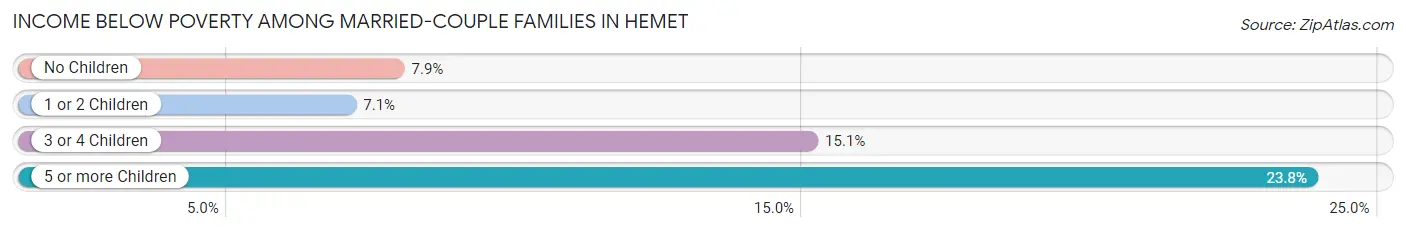
| Children | Above Poverty | Below Poverty |
| No Children | 6,979 (92.1%) | 599 (7.9%) |
| 1 or 2 Children | 4,147 (92.9%) | 315 (7.1%) |
| 3 or 4 Children | 1,344 (84.9%) | 239 (15.1%) |
| 5 or more Children | 80 (76.2%) | 25 (23.8%) |
| Total | 12,550 (91.4%) | 1,178 (8.6%) |
Income Below Poverty Among Single-Parent Households in Hemet
According to the poverty data in Hemet, 18.9% or 407 single-father households and 28.6% or 1,462 single-mother households are living below the poverty line. Among single-father households, those with 3 or 4 children have the highest poverty rate, with 83 households (37.7%) experiencing poverty. Likewise, among single-mother households, those with 3 or 4 children have the highest poverty rate, with 448 households (70.6%) falling below the poverty line.
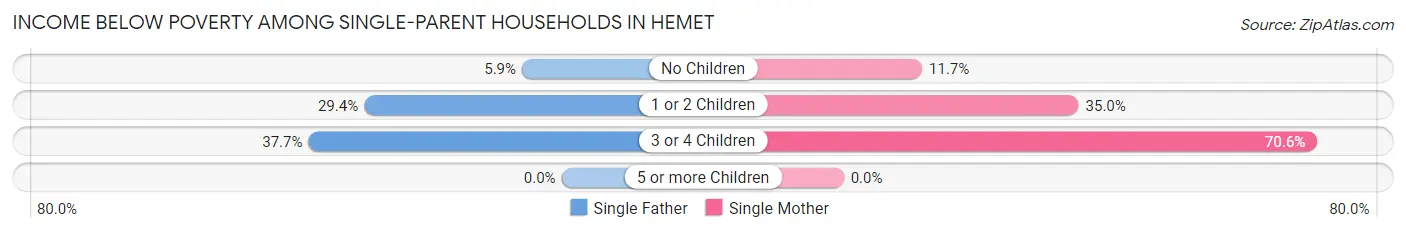
| Children | Single Father | Single Mother |
| No Children | 60 (5.9%) | 277 (11.7%) |
| 1 or 2 Children | 264 (29.4%) | 737 (35.0%) |
| 3 or 4 Children | 83 (37.7%) | 448 (70.6%) |
| 5 or more Children | 0 (0.0%) | 0 (0.0%) |
| Total | 407 (18.9%) | 1,462 (28.6%) |
Income Below Poverty Among Married-Couple vs Single-Parent Households in Hemet
The poverty data for Hemet shows that 1,178 of the married-couple family households (8.6%) and 1,869 of the single-parent households (25.7%) are living below the poverty level. Within the married-couple family households, those with 5 or more children have the highest poverty rate, with 25 households (23.8%) falling below the poverty line. Among the single-parent households, those with 3 or 4 children have the highest poverty rate, with 531 household (62.1%) living below poverty.
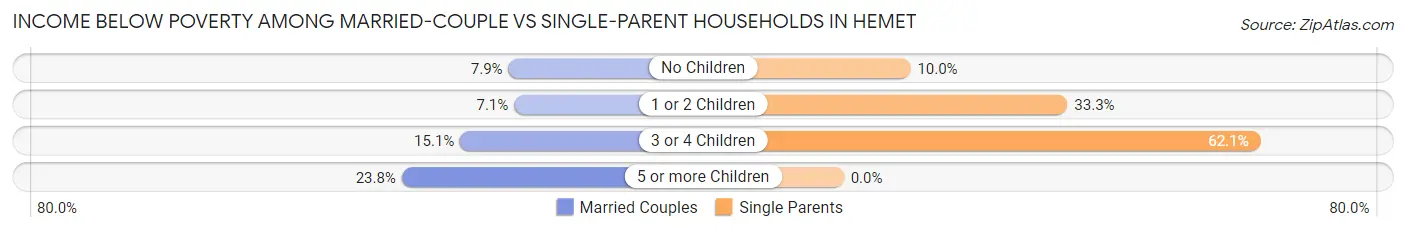
| Children | Married-Couple Families | Single-Parent Households |
| No Children | 599 (7.9%) | 337 (10.0%) |
| 1 or 2 Children | 315 (7.1%) | 1,001 (33.3%) |
| 3 or 4 Children | 239 (15.1%) | 531 (62.1%) |
| 5 or more Children | 25 (23.8%) | 0 (0.0%) |
| Total | 1,178 (8.6%) | 1,869 (25.7%) |
Race in Hemet
The most populous races in Hemet are White / Caucasian (50,898 | 56.8%), Hispanic or Latino (43,902 | 49.0%), and Some other Race (15,503 | 17.3%).
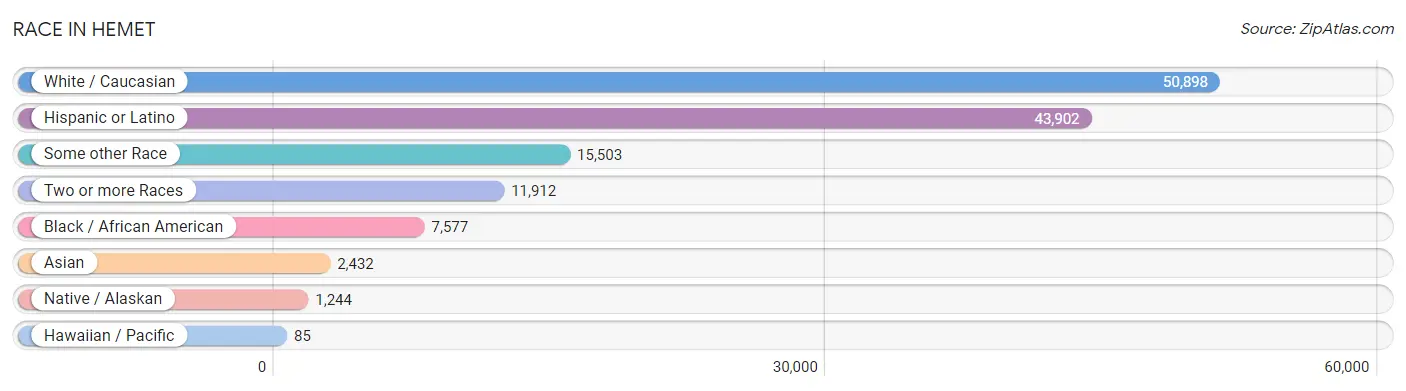
| Race | # Population | % Population |
| Asian | 2,432 | 2.7% |
| Black / African American | 7,577 | 8.5% |
| Hawaiian / Pacific | 85 | 0.1% |
| Hispanic or Latino | 43,902 | 49.0% |
| Native / Alaskan | 1,244 | 1.4% |
| White / Caucasian | 50,898 | 56.8% |
| Two or more Races | 11,912 | 13.3% |
| Some other Race | 15,503 | 17.3% |
| Total | 89,651 | 100.0% |
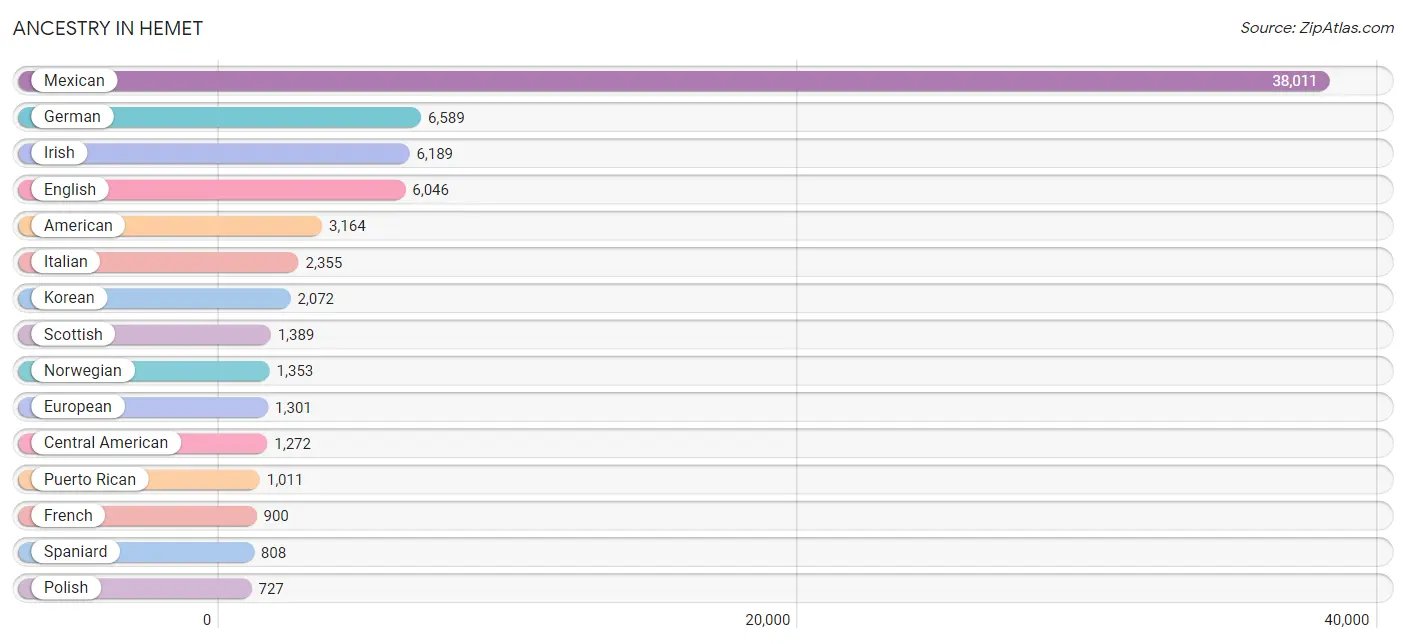
Ancestry in Hemet
The most populous ancestries reported in Hemet are Mexican (38,011 | 42.4%), German (6,589 | 7.3%), Irish (6,189 | 6.9%), English (6,046 | 6.7%), and American (3,164 | 3.5%), together accounting for 66.9% of all Hemet residents.
| Ancestry | # Population | % Population |
| Afghan | 5 | 0.0% |
| African | 246 | 0.3% |
| American | 3,164 | 3.5% |
| Apache | 224 | 0.3% |
| Arab | 345 | 0.4% |
| Argentinean | 32 | 0.0% |
| Armenian | 55 | 0.1% |
| Australian | 13 | 0.0% |
| Austrian | 51 | 0.1% |
| Basque | 35 | 0.0% |
| Belgian | 8 | 0.0% |
| Belizean | 39 | 0.0% |
| Bhutanese | 553 | 0.6% |
| Blackfeet | 108 | 0.1% |
| Bolivian | 49 | 0.1% |
| Brazilian | 65 | 0.1% |
| British | 357 | 0.4% |
| British West Indian | 23 | 0.0% |
| Bulgarian | 19 | 0.0% |
| Burmese | 167 | 0.2% |
| Canadian | 148 | 0.2% |
| Celtic | 14 | 0.0% |
| Central American | 1,272 | 1.4% |
| Cherokee | 372 | 0.4% |
| Cheyenne | 65 | 0.1% |
| Chickasaw | 11 | 0.0% |
| Chilean | 56 | 0.1% |
| Chippewa | 443 | 0.5% |
| Choctaw | 64 | 0.1% |
| Colombian | 268 | 0.3% |
| Comanche | 40 | 0.0% |
| Costa Rican | 41 | 0.1% |
| Cree | 5 | 0.0% |
| Cuban | 277 | 0.3% |
| Czech | 147 | 0.2% |
| Czechoslovakian | 176 | 0.2% |
| Danish | 361 | 0.4% |
| Delaware | 39 | 0.0% |
| Dominican | 107 | 0.1% |
| Dutch | 646 | 0.7% |
| Eastern European | 189 | 0.2% |
| Ecuadorian | 59 | 0.1% |
| Egyptian | 220 | 0.3% |
| English | 6,046 | 6.7% |
| Ethiopian | 14 | 0.0% |
| European | 1,301 | 1.5% |
| Filipino | 35 | 0.0% |
| Finnish | 143 | 0.2% |
| French | 900 | 1.0% |
| French Canadian | 262 | 0.3% |
| German | 6,589 | 7.3% |
| Greek | 64 | 0.1% |
| Guatemalan | 236 | 0.3% |
| Honduran | 149 | 0.2% |
| Hungarian | 326 | 0.4% |
| Indian (Asian) | 187 | 0.2% |
| Iranian | 27 | 0.0% |
| Iraqi | 12 | 0.0% |
| Irish | 6,189 | 6.9% |
| Italian | 2,355 | 2.6% |
| Japanese | 119 | 0.1% |
| Korean | 2,072 | 2.3% |
| Laotian | 195 | 0.2% |
| Latvian | 22 | 0.0% |
| Lebanese | 61 | 0.1% |
| Liberian | 85 | 0.1% |
| Lithuanian | 25 | 0.0% |
| Malaysian | 9 | 0.0% |
| Mexican | 38,011 | 42.4% |
| Mexican American Indian | 160 | 0.2% |
| Native Hawaiian | 56 | 0.1% |
| Navajo | 75 | 0.1% |
| Nicaraguan | 23 | 0.0% |
| Nigerian | 10 | 0.0% |
| Northern European | 131 | 0.2% |
| Norwegian | 1,353 | 1.5% |
| Pakistani | 166 | 0.2% |
| Palestinian | 45 | 0.1% |
| Panamanian | 177 | 0.2% |
| Pennsylvania German | 126 | 0.1% |
| Peruvian | 181 | 0.2% |
| Polish | 727 | 0.8% |
| Portuguese | 266 | 0.3% |
| Potawatomi | 4 | 0.0% |
| Puerto Rican | 1,011 | 1.1% |
| Romanian | 209 | 0.2% |
| Russian | 309 | 0.3% |
| Salvadoran | 541 | 0.6% |
| Samoan | 69 | 0.1% |
| Scandinavian | 173 | 0.2% |
| Scotch-Irish | 545 | 0.6% |
| Scottish | 1,389 | 1.5% |
| Senegalese | 17 | 0.0% |
| Serbian | 59 | 0.1% |
| Sioux | 21 | 0.0% |
| Slavic | 8 | 0.0% |
| Slovak | 13 | 0.0% |
| South American | 645 | 0.7% |
| Spaniard | 808 | 0.9% |
| Spanish | 455 | 0.5% |
| Spanish American | 18 | 0.0% |
| Spanish American Indian | 19 | 0.0% |
| Sri Lankan | 85 | 0.1% |
| Subsaharan African | 372 | 0.4% |
| Swedish | 662 | 0.7% |
| Swiss | 153 | 0.2% |
| Thai | 356 | 0.4% |
| Tohono O'Odham | 140 | 0.2% |
| Turkish | 15 | 0.0% |
| Ukrainian | 132 | 0.2% |
| Welsh | 533 | 0.6% |
| Yaqui | 127 | 0.1% |
| Yugoslavian | 17 | 0.0% | View All 113 Rows |
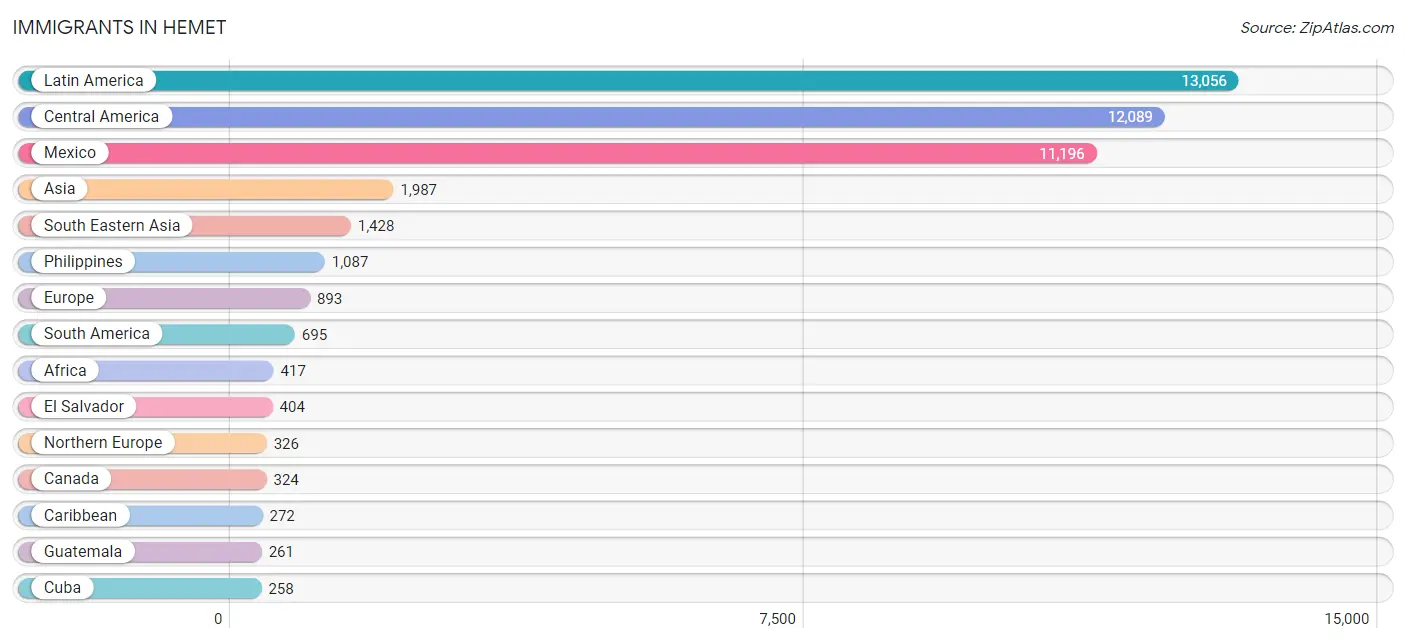
Immigrants in Hemet
The most numerous immigrant groups reported in Hemet came from Latin America (13,056 | 14.6%), Central America (12,089 | 13.5%), Mexico (11,196 | 12.5%), Asia (1,987 | 2.2%), and South Eastern Asia (1,428 | 1.6%), together accounting for 44.3% of all Hemet residents.
| Immigration Origin | # Population | % Population |
| Afghanistan | 5 | 0.0% |
| Africa | 417 | 0.5% |
| Argentina | 32 | 0.0% |
| Asia | 1,987 | 2.2% |
| Australia | 41 | 0.1% |
| Austria | 6 | 0.0% |
| Azores | 10 | 0.0% |
| Belgium | 7 | 0.0% |
| Belize | 43 | 0.1% |
| Bolivia | 26 | 0.0% |
| Brazil | 146 | 0.2% |
| Bulgaria | 19 | 0.0% |
| Cambodia | 97 | 0.1% |
| Canada | 324 | 0.4% |
| Caribbean | 272 | 0.3% |
| Central America | 12,089 | 13.5% |
| Chile | 42 | 0.1% |
| China | 75 | 0.1% |
| Colombia | 232 | 0.3% |
| Costa Rica | 6 | 0.0% |
| Cuba | 258 | 0.3% |
| Czechoslovakia | 14 | 0.0% |
| Denmark | 20 | 0.0% |
| Eastern Africa | 32 | 0.0% |
| Eastern Asia | 234 | 0.3% |
| Eastern Europe | 233 | 0.3% |
| Ecuador | 9 | 0.0% |
| Egypt | 147 | 0.2% |
| El Salvador | 404 | 0.4% |
| England | 248 | 0.3% |
| Ethiopia | 14 | 0.0% |
| Europe | 893 | 1.0% |
| France | 13 | 0.0% |
| Germany | 203 | 0.2% |
| Ghana | 41 | 0.1% |
| Greece | 14 | 0.0% |
| Guatemala | 261 | 0.3% |
| Honduras | 12 | 0.0% |
| Hungary | 34 | 0.0% |
| India | 168 | 0.2% |
| Indonesia | 96 | 0.1% |
| Iran | 27 | 0.0% |
| Israel | 8 | 0.0% |
| Italy | 48 | 0.1% |
| Japan | 52 | 0.1% |
| Korea | 107 | 0.1% |
| Latin America | 13,056 | 14.6% |
| Lebanon | 13 | 0.0% |
| Liberia | 85 | 0.1% |
| Mexico | 11,196 | 12.5% |
| Netherlands | 29 | 0.0% |
| Nicaragua | 25 | 0.0% |
| Nigeria | 92 | 0.1% |
| North Macedonia | 7 | 0.0% |
| Northern Africa | 147 | 0.2% |
| Northern Europe | 326 | 0.4% |
| Norway | 18 | 0.0% |
| Oceania | 41 | 0.1% |
| Pakistan | 10 | 0.0% |
| Panama | 97 | 0.1% |
| Peru | 208 | 0.2% |
| Philippines | 1,087 | 1.2% |
| Poland | 54 | 0.1% |
| Portugal | 10 | 0.0% |
| Romania | 4 | 0.0% |
| Scotland | 36 | 0.0% |
| Serbia | 59 | 0.1% |
| South America | 695 | 0.8% |
| South Central Asia | 210 | 0.2% |
| South Eastern Asia | 1,428 | 1.6% |
| Southern Europe | 76 | 0.1% |
| Spain | 4 | 0.0% |
| Taiwan | 35 | 0.0% |
| Thailand | 62 | 0.1% |
| Turkey | 7 | 0.0% |
| Uganda | 18 | 0.0% |
| Ukraine | 34 | 0.0% |
| Vietnam | 86 | 0.1% |
| Western Africa | 218 | 0.2% |
| Western Asia | 54 | 0.1% |
| Western Europe | 258 | 0.3% | View All 81 Rows |
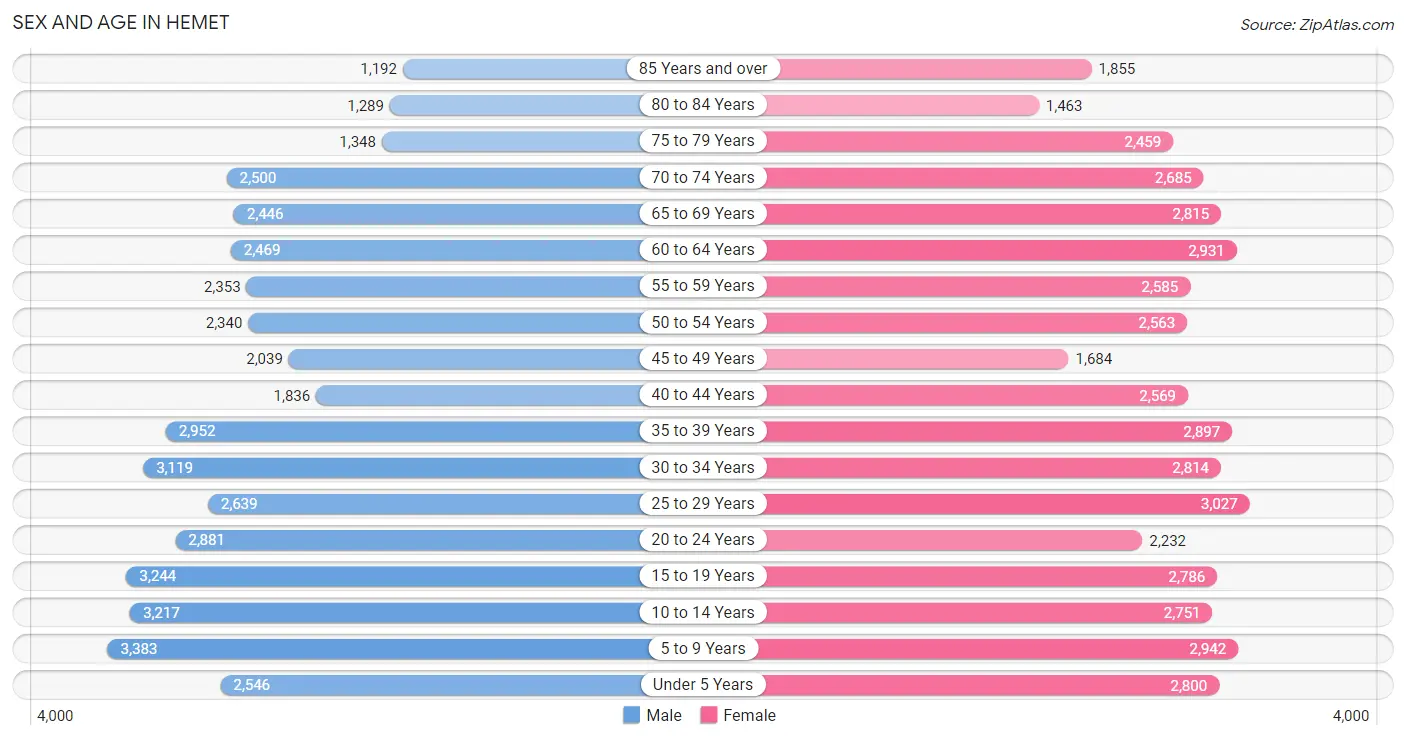
Sex and Age in Hemet
Sex and Age in Hemet
The most populous age groups in Hemet are 5 to 9 Years (3,383 | 7.7%) for men and 25 to 29 Years (3,027 | 6.6%) for women.
| Age Bracket | Male | Female |
| Under 5 Years | 2,546 (5.8%) | 2,800 (6.1%) |
| 5 to 9 Years | 3,383 (7.7%) | 2,942 (6.4%) |
| 10 to 14 Years | 3,217 (7.3%) | 2,751 (6.0%) |
| 15 to 19 Years | 3,244 (7.4%) | 2,786 (6.1%) |
| 20 to 24 Years | 2,881 (6.6%) | 2,232 (4.9%) |
| 25 to 29 Years | 2,639 (6.0%) | 3,027 (6.6%) |
| 30 to 34 Years | 3,119 (7.1%) | 2,814 (6.1%) |
| 35 to 39 Years | 2,952 (6.7%) | 2,897 (6.3%) |
| 40 to 44 Years | 1,836 (4.2%) | 2,569 (5.6%) |
| 45 to 49 Years | 2,039 (4.7%) | 1,684 (3.7%) |
| 50 to 54 Years | 2,340 (5.3%) | 2,563 (5.6%) |
| 55 to 59 Years | 2,353 (5.4%) | 2,585 (5.6%) |
| 60 to 64 Years | 2,469 (5.6%) | 2,931 (6.4%) |
| 65 to 69 Years | 2,446 (5.6%) | 2,815 (6.1%) |
| 70 to 74 Years | 2,500 (5.7%) | 2,685 (5.9%) |
| 75 to 79 Years | 1,348 (3.1%) | 2,459 (5.4%) |
| 80 to 84 Years | 1,289 (2.9%) | 1,463 (3.2%) |
| 85 Years and over | 1,192 (2.7%) | 1,855 (4.1%) |
| Total | 43,793 (100.0%) | 45,858 (100.0%) |
Families and Households in Hemet
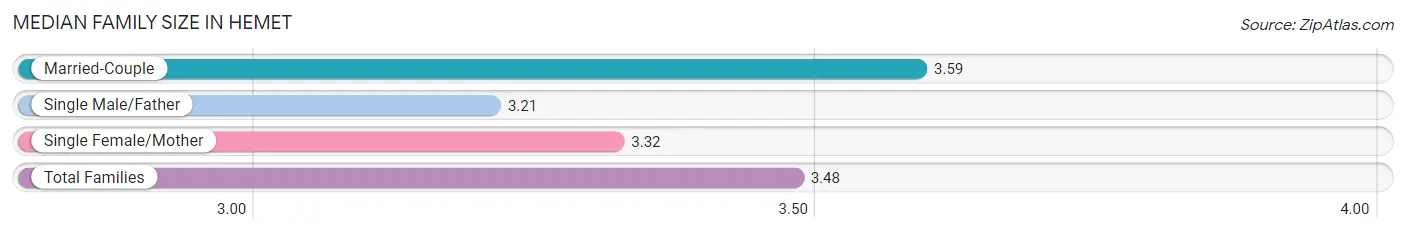
Median Family Size in Hemet
The median family size in Hemet is 3.48 persons per family, with married-couple families (13,728 | 65.4%) accounting for the largest median family size of 3.59 persons per family. On the other hand, single male/father families (2,155 | 10.3%) represent the smallest median family size with 3.21 persons per family.
| Family Type | # Families | Family Size |
| Married-Couple | 13,728 (65.4%) | 3.59 |
| Single Male/Father | 2,155 (10.3%) | 3.21 |
| Single Female/Mother | 5,116 (24.4%) | 3.32 |
| Total Families | 20,999 (100.0%) | 3.48 |
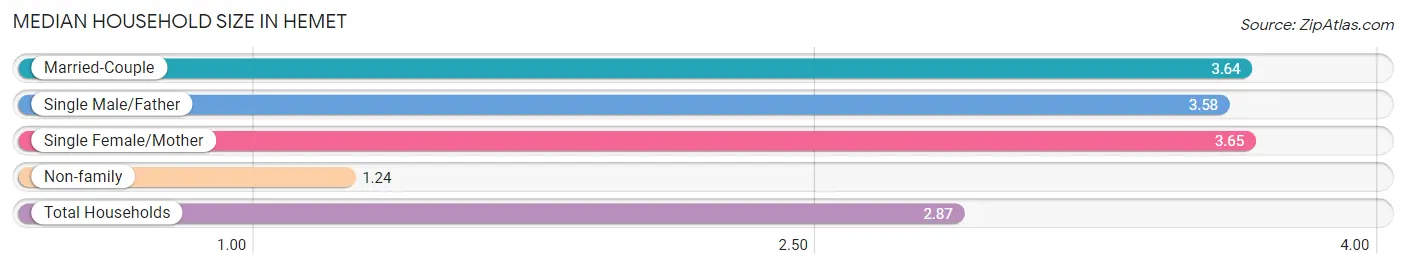
Median Household Size in Hemet
The median household size in Hemet is 2.87 persons per household, with single female/mother households (5,116 | 16.5%) accounting for the largest median household size of 3.65 persons per household. non-family households (9,964 | 32.2%) represent the smallest median household size with 1.24 persons per household.
| Household Type | # Households | Household Size |
| Married-Couple | 13,728 (44.3%) | 3.64 |
| Single Male/Father | 2,155 (7.0%) | 3.58 |
| Single Female/Mother | 5,116 (16.5%) | 3.65 |
| Non-family | 9,964 (32.2%) | 1.24 |
| Total Households | 30,963 (100.0%) | 2.87 |
Household Size by Marriage Status in Hemet
Out of a total of 30,963 households in Hemet, 20,999 (67.8%) are family households, while 9,964 (32.2%) are nonfamily households. The most numerous type of family households are 2-person households, comprising 8,700, and the most common type of nonfamily households are 1-person households, comprising 8,058.
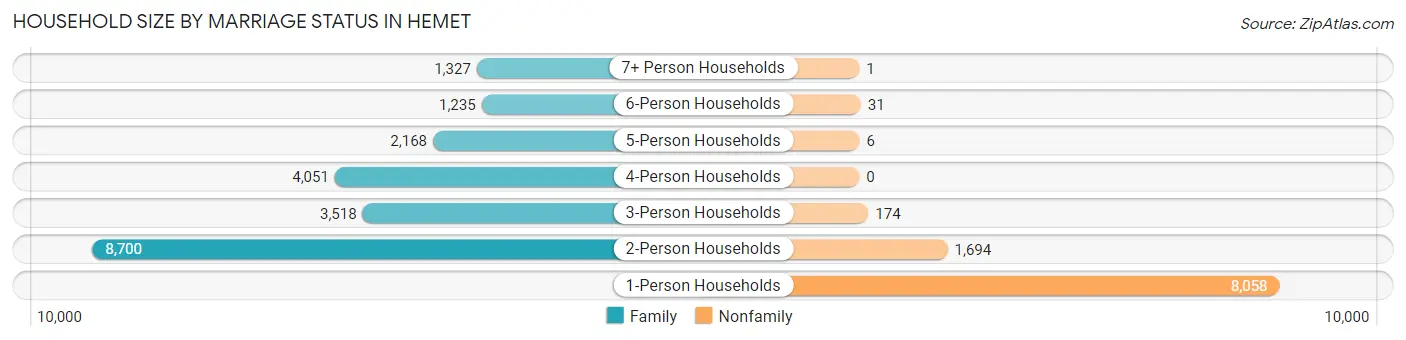
| Household Size | Family Households | Nonfamily Households |
| 1-Person Households | - | 8,058 (26.0%) |
| 2-Person Households | 8,700 (28.1%) | 1,694 (5.5%) |
| 3-Person Households | 3,518 (11.4%) | 174 (0.6%) |
| 4-Person Households | 4,051 (13.1%) | 0 (0.0%) |
| 5-Person Households | 2,168 (7.0%) | 6 (0.0%) |
| 6-Person Households | 1,235 (4.0%) | 31 (0.1%) |
| 7+ Person Households | 1,327 (4.3%) | 1 (0.0%) |
| Total | 20,999 (67.8%) | 9,964 (32.2%) |
Female Fertility in Hemet
Fertility by Age in Hemet
Average fertility rate in Hemet is 55.0 births per 1,000 women. Women in the age bracket of 20 to 34 years have the highest fertility rate with 89.0 births per 1,000 women. Women in the age bracket of 20 to 34 years acount for 70.8% of all women with births.
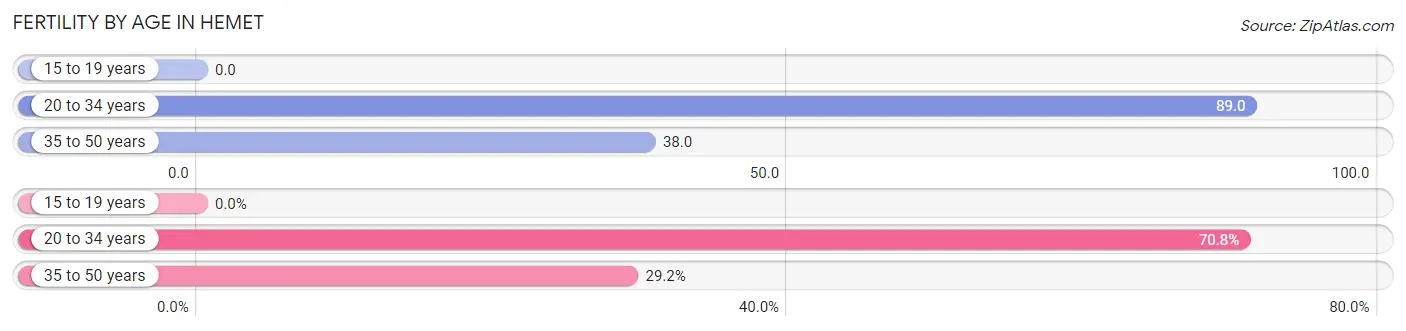
| Age Bracket | Women with Births | Births / 1,000 Women |
| 15 to 19 years | 0 (0.0%) | 0.0 |
| 20 to 34 years | 722 (70.8%) | 89.0 |
| 35 to 50 years | 298 (29.2%) | 38.0 |
| Total | 1,020 (100.0%) | 55.0 |
Fertility by Age by Marriage Status in Hemet
55.4% of women with births (1,020) in Hemet are married. The highest percentage of unmarried women with births falls into 20 to 34 years age bracket with 45.6% of them unmarried at the time of birth, while the lowest percentage of unmarried women with births belong to 35 to 50 years age bracket with 42.3% of them unmarried.
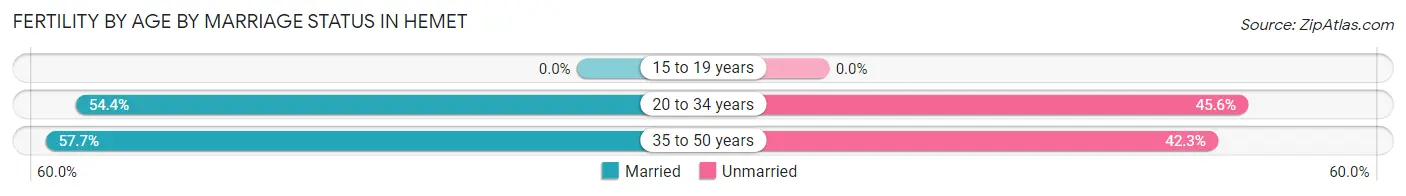
| Age Bracket | Married | Unmarried |
| 15 to 19 years | 0 (0.0%) | 0 (0.0%) |
| 20 to 34 years | 393 (54.4%) | 329 (45.6%) |
| 35 to 50 years | 172 (57.7%) | 126 (42.3%) |
| Total | 565 (55.4%) | 455 (44.6%) |
Fertility by Education in Hemet
Average fertility rate in Hemet is 55.0 births per 1,000 women. Women with the education attainment of graduate degree have the highest fertility rate of 193.0 births per 1,000 women, while women with the education attainment of less than high school have the lowest fertility at 14.0 births per 1,000 women. Women with the education attainment of college or associate's degree represent 37.4% of all women with births.
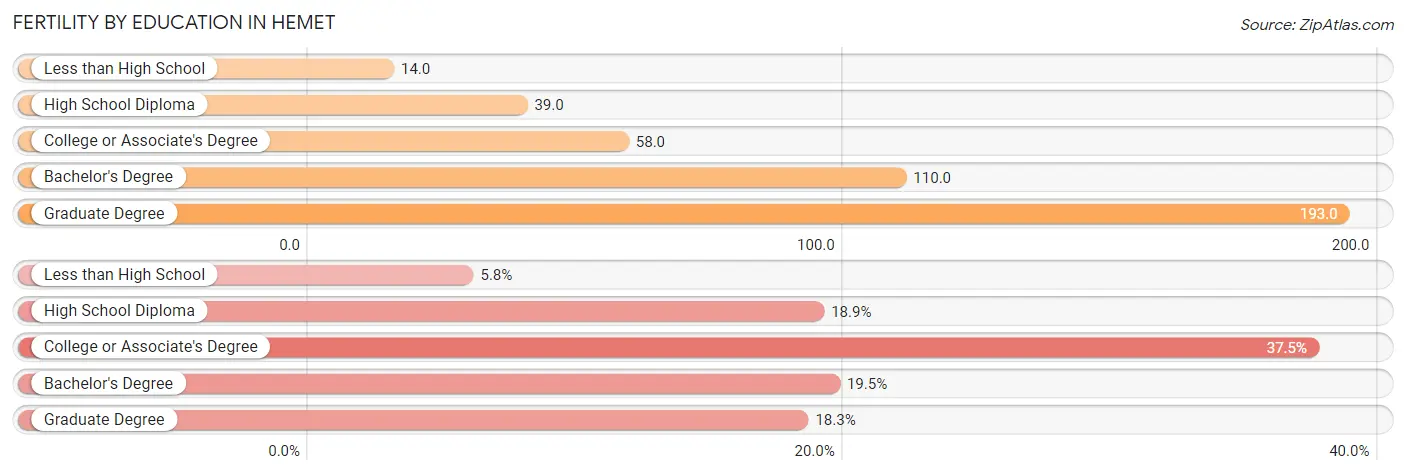
| Educational Attainment | Women with Births | Births / 1,000 Women |
| Less than High School | 59 (5.8%) | 14.0 |
| High School Diploma | 193 (18.9%) | 39.0 |
| College or Associate's Degree | 382 (37.4%) | 58.0 |
| Bachelor's Degree | 199 (19.5%) | 110.0 |
| Graduate Degree | 187 (18.3%) | 193.0 |
| Total | 1,020 (100.0%) | 55.0 |
Fertility by Education by Marriage Status in Hemet
44.6% of women with births in Hemet are unmarried. Women with the educational attainment of graduate degree are most likely to be married with 100.0% of them married at childbirth, while women with the educational attainment of high school diploma are least likely to be married with 72.5% of them unmarried at childbirth.
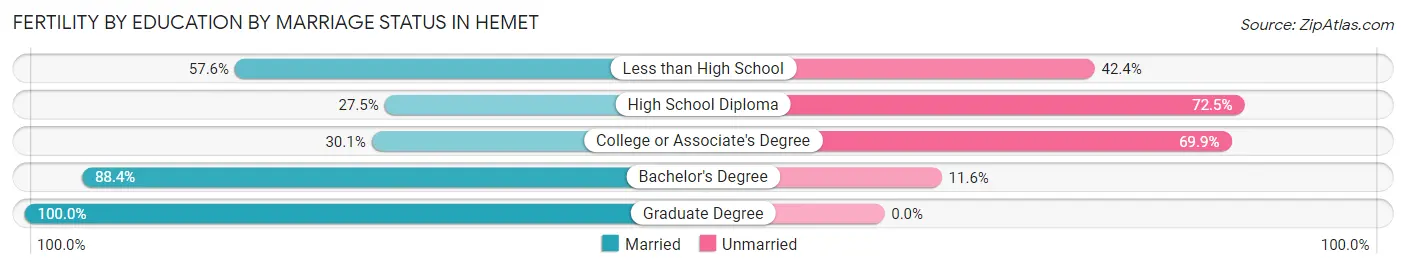
| Educational Attainment | Married | Unmarried |
| Less than High School | 34 (57.6%) | 25 (42.4%) |
| High School Diploma | 53 (27.5%) | 140 (72.5%) |
| College or Associate's Degree | 115 (30.1%) | 267 (69.9%) |
| Bachelor's Degree | 176 (88.4%) | 23 (11.6%) |
| Graduate Degree | 187 (100.0%) | 0 (0.0%) |
| Total | 565 (55.4%) | 455 (44.6%) |
Employment Characteristics in Hemet
Employment by Class of Employer in Hemet
Among the 30,471 employed individuals in Hemet, private company employees (21,563 | 70.8%), local government employees (2,524 | 8.3%), and not-for-profit organizations (1,790 | 5.9%) make up the most common classes of employment.
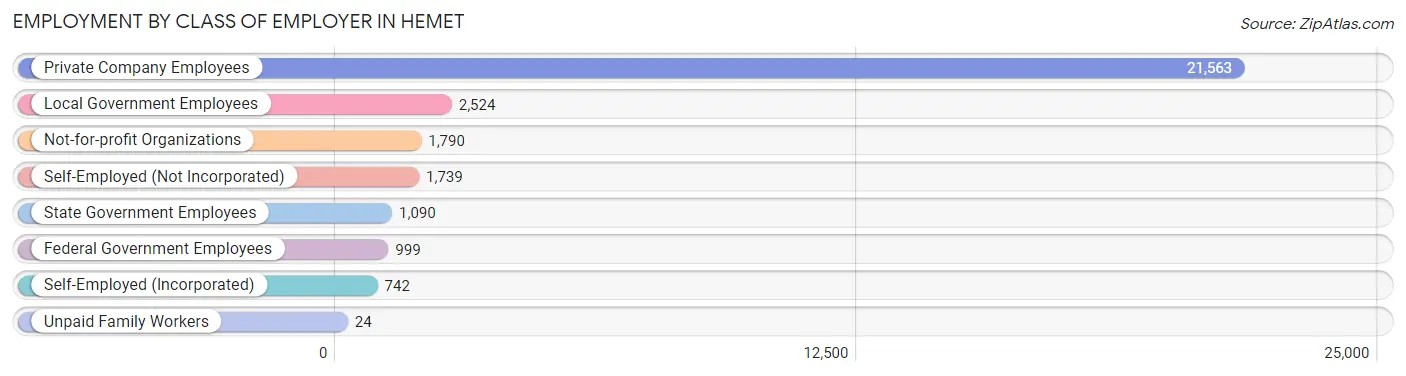
| Employer Class | # Employees | % Employees |
| Private Company Employees | 21,563 | 70.8% |
| Self-Employed (Incorporated) | 742 | 2.4% |
| Self-Employed (Not Incorporated) | 1,739 | 5.7% |
| Not-for-profit Organizations | 1,790 | 5.9% |
| Local Government Employees | 2,524 | 8.3% |
| State Government Employees | 1,090 | 3.6% |
| Federal Government Employees | 999 | 3.3% |
| Unpaid Family Workers | 24 | 0.1% |
| Total | 30,471 | 100.0% |
Employment Status by Age in Hemet
According to the labor force statistics for Hemet, out of the total population over 16 years of age (70,663), 49.4% or 34,908 individuals are in the labor force, with 9.5% or 3,316 of them unemployed. The age group with the highest labor force participation rate is 30 to 34 years, with 81.5% or 4,835 individuals in the labor force. Within the labor force, the 16 to 19 years age range has the highest percentage of unemployed individuals, with 22.8% or 257 of them being unemployed.
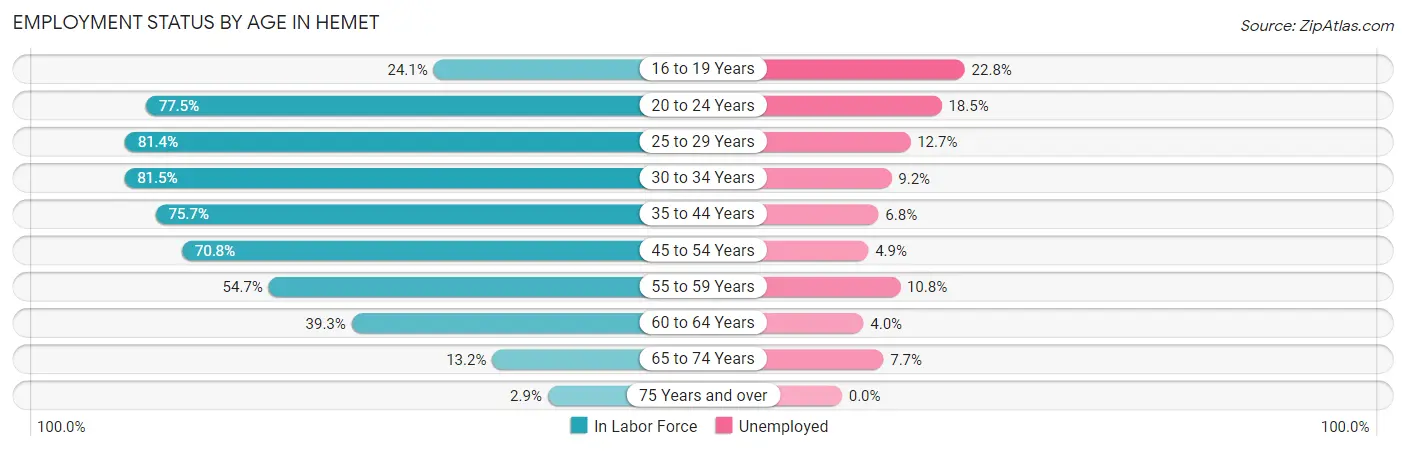
| Age Bracket | In Labor Force | Unemployed |
| 16 to 19 Years | 1,128 (24.1%) | 257 (22.8%) |
| 20 to 24 Years | 3,963 (77.5%) | 733 (18.5%) |
| 25 to 29 Years | 4,612 (81.4%) | 586 (12.7%) |
| 30 to 34 Years | 4,835 (81.5%) | 445 (9.2%) |
| 35 to 44 Years | 7,762 (75.7%) | 528 (6.8%) |
| 45 to 54 Years | 6,107 (70.8%) | 299 (4.9%) |
| 55 to 59 Years | 2,701 (54.7%) | 292 (10.8%) |
| 60 to 64 Years | 2,122 (39.3%) | 85 (4.0%) |
| 65 to 74 Years | 1,379 (13.2%) | 106 (7.7%) |
| 75 Years and over | 279 (2.9%) | 0 (0.0%) |
| Total | 34,908 (49.4%) | 3,316 (9.5%) |
Employment Status by Educational Attainment in Hemet
According to labor force statistics for Hemet, 68.9% of individuals (28,123) out of the total population between 25 and 64 years of age (40,817) are in the labor force, with 7.9% or 2,222 of them being unemployed. The group with the highest labor force participation rate are those with the educational attainment of bachelor's degree or higher, with 75.6% or 3,760 individuals in the labor force. Within the labor force, individuals with less than high school education have the highest percentage of unemployment, with 11.9% or 543 of them being unemployed.
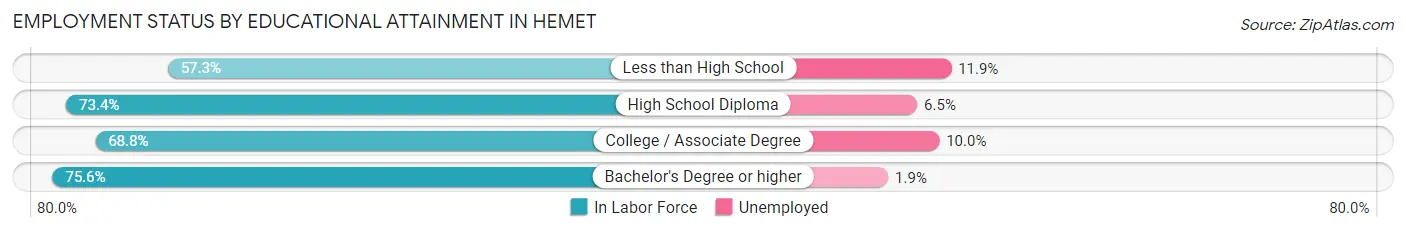
| Educational Attainment | In Labor Force | Unemployed |
| Less than High School | 4,560 (57.3%) | 947 (11.9%) |
| High School Diploma | 10,285 (73.4%) | 911 (6.5%) |
| College / Associate Degree | 9,545 (68.8%) | 1,387 (10.0%) |
| Bachelor's Degree or higher | 3,760 (75.6%) | 94 (1.9%) |
| Total | 28,123 (68.9%) | 3,225 (7.9%) |
Employment Occupations by Sex in Hemet
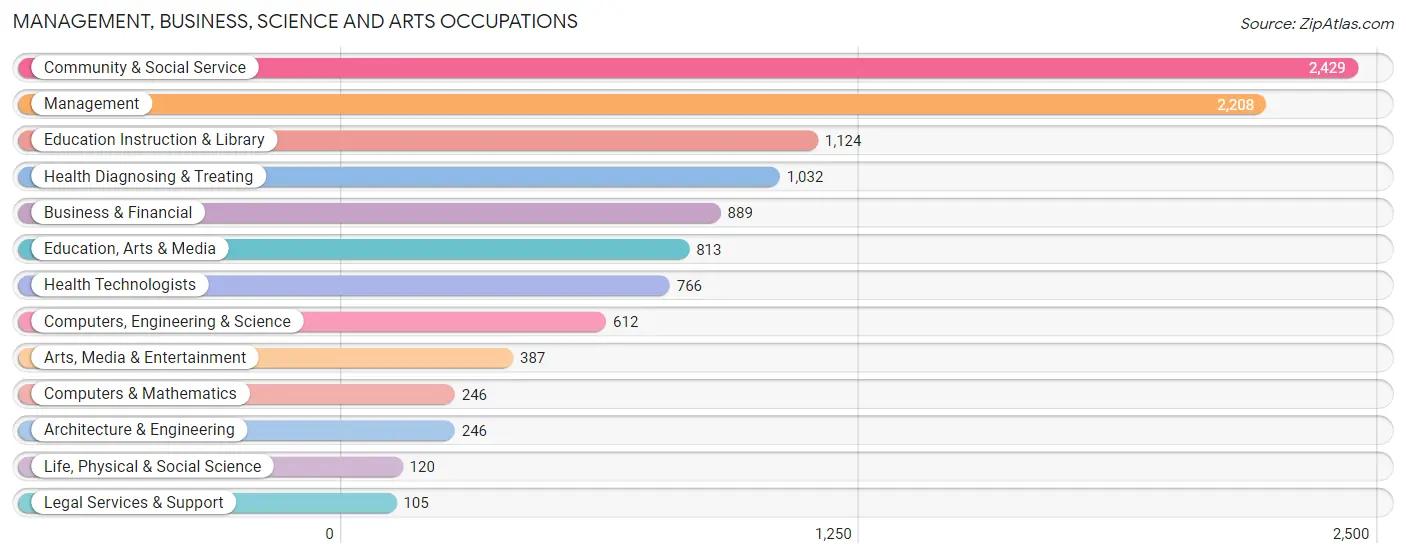
Management, Business, Science and Arts Occupations
The most common Management, Business, Science and Arts occupations in Hemet are Community & Social Service (2,429 | 7.7%), Management (2,208 | 7.0%), Education Instruction & Library (1,124 | 3.6%), Health Diagnosing & Treating (1,032 | 3.3%), and Business & Financial (889 | 2.8%).
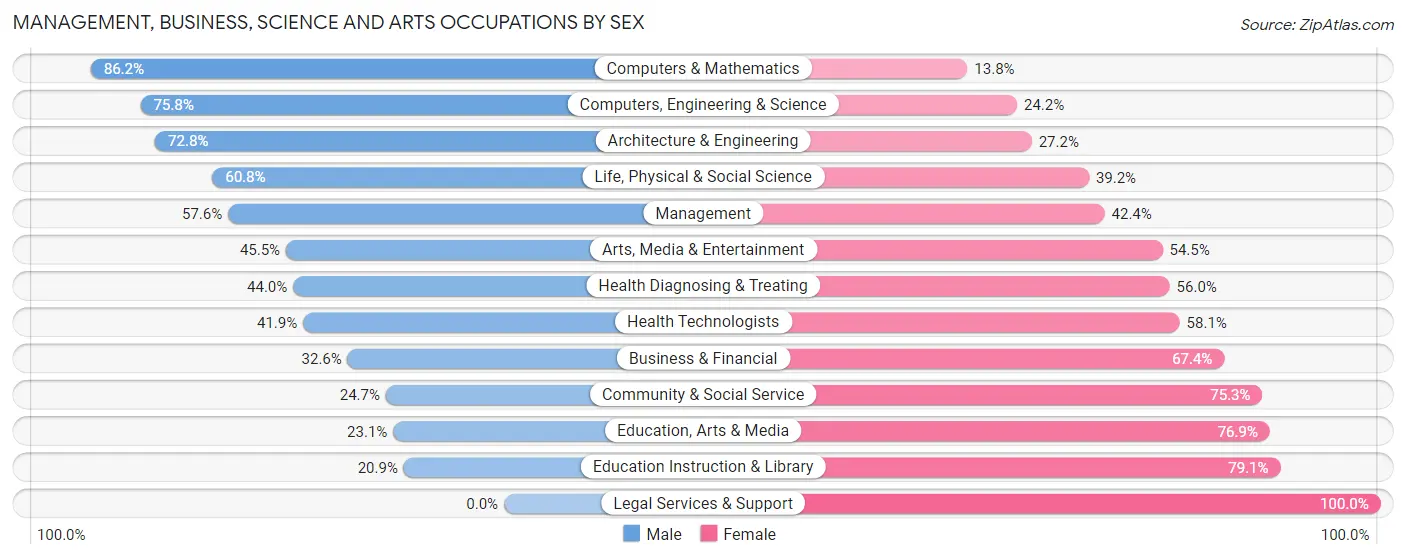
Management, Business, Science and Arts Occupations by Sex
Within the Management, Business, Science and Arts occupations in Hemet, the most male-oriented occupations are Computers & Mathematics (86.2%), Computers, Engineering & Science (75.8%), and Architecture & Engineering (72.8%), while the most female-oriented occupations are Legal Services & Support (100.0%), Education Instruction & Library (79.1%), and Education, Arts & Media (76.9%).
| Occupation | Male | Female |
| Management | 1,271 (57.6%) | 937 (42.4%) |
| Business & Financial | 290 (32.6%) | 599 (67.4%) |
| Computers, Engineering & Science | 464 (75.8%) | 148 (24.2%) |
| Computers & Mathematics | 212 (86.2%) | 34 (13.8%) |
| Architecture & Engineering | 179 (72.8%) | 67 (27.2%) |
| Life, Physical & Social Science | 73 (60.8%) | 47 (39.2%) |
| Community & Social Service | 599 (24.7%) | 1,830 (75.3%) |
| Education, Arts & Media | 188 (23.1%) | 625 (76.9%) |
| Legal Services & Support | 0 (0.0%) | 105 (100.0%) |
| Education Instruction & Library | 235 (20.9%) | 889 (79.1%) |
| Arts, Media & Entertainment | 176 (45.5%) | 211 (54.5%) |
| Health Diagnosing & Treating | 454 (44.0%) | 578 (56.0%) |
| Health Technologists | 321 (41.9%) | 445 (58.1%) |
| Total (Category) | 3,078 (42.9%) | 4,092 (57.1%) |
| Total (Overall) | 16,995 (54.1%) | 14,435 (45.9%) |
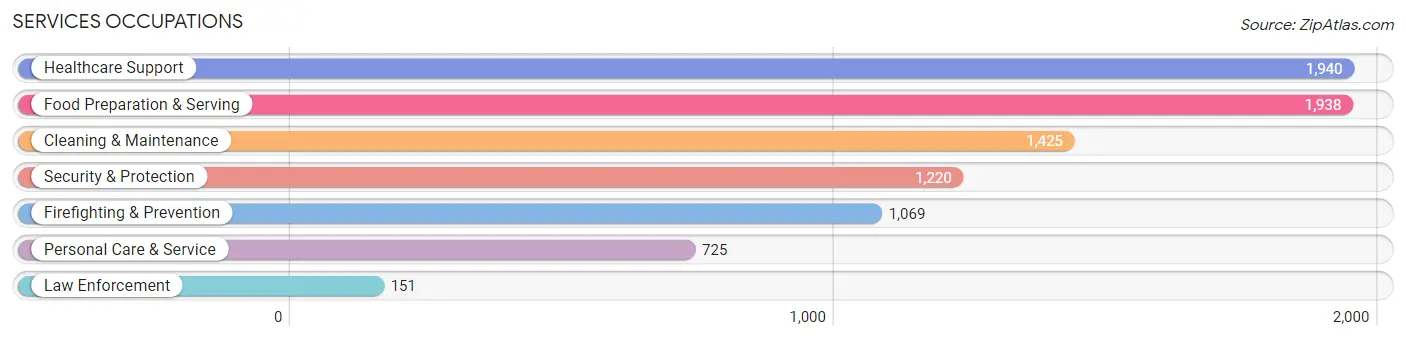
Services Occupations
The most common Services occupations in Hemet are Healthcare Support (1,940 | 6.2%), Food Preparation & Serving (1,938 | 6.2%), Cleaning & Maintenance (1,425 | 4.5%), Security & Protection (1,220 | 3.9%), and Firefighting & Prevention (1,069 | 3.4%).
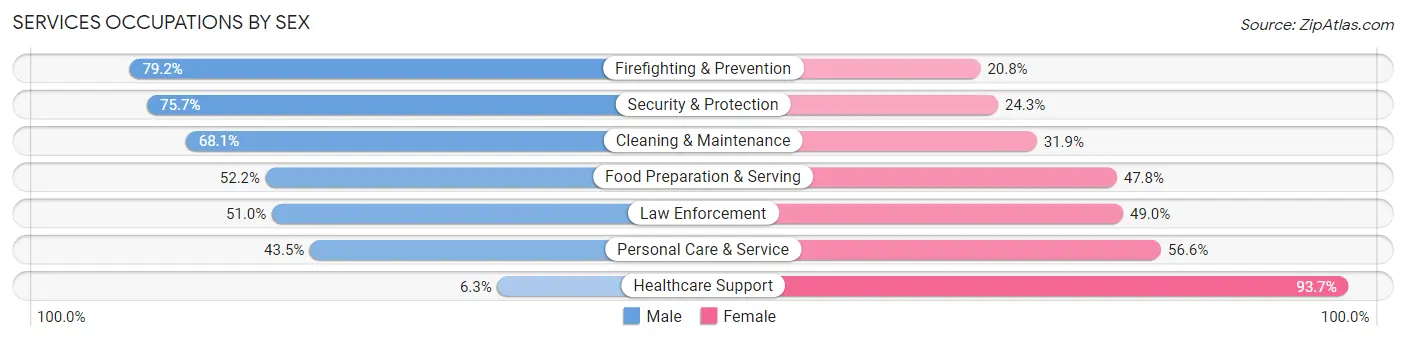
Services Occupations by Sex
Within the Services occupations in Hemet, the most male-oriented occupations are Firefighting & Prevention (79.2%), Security & Protection (75.7%), and Cleaning & Maintenance (68.1%), while the most female-oriented occupations are Healthcare Support (93.7%), Personal Care & Service (56.6%), and Law Enforcement (49.0%).
| Occupation | Male | Female |
| Healthcare Support | 123 (6.3%) | 1,817 (93.7%) |
| Security & Protection | 924 (75.7%) | 296 (24.3%) |
| Firefighting & Prevention | 847 (79.2%) | 222 (20.8%) |
| Law Enforcement | 77 (51.0%) | 74 (49.0%) |
| Food Preparation & Serving | 1,012 (52.2%) | 926 (47.8%) |
| Cleaning & Maintenance | 970 (68.1%) | 455 (31.9%) |
| Personal Care & Service | 315 (43.4%) | 410 (56.6%) |
| Total (Category) | 3,344 (46.1%) | 3,904 (53.9%) |
| Total (Overall) | 16,995 (54.1%) | 14,435 (45.9%) |
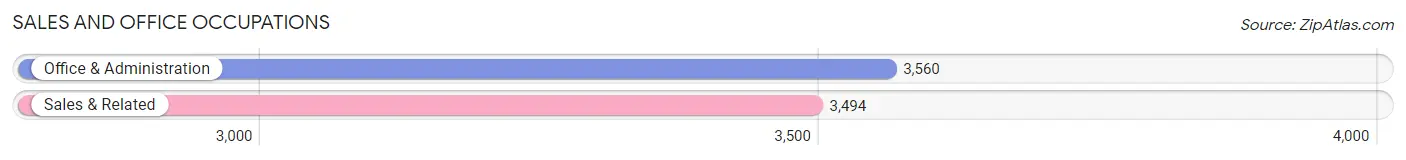
Sales and Office Occupations
The most common Sales and Office occupations in Hemet are Office & Administration (3,560 | 11.3%), and Sales & Related (3,494 | 11.1%).
Sales and Office Occupations by Sex
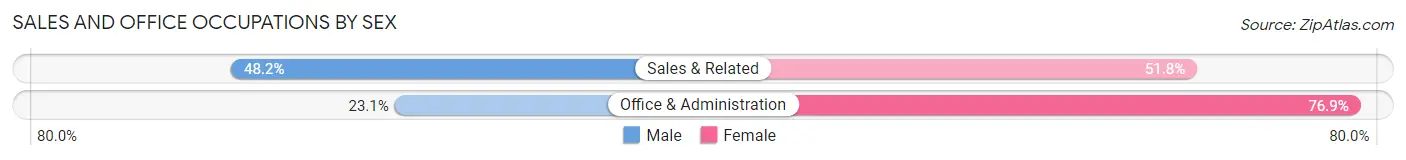
| Occupation | Male | Female |
| Sales & Related | 1,685 (48.2%) | 1,809 (51.8%) |
| Office & Administration | 822 (23.1%) | 2,738 (76.9%) |
| Total (Category) | 2,507 (35.5%) | 4,547 (64.5%) |
| Total (Overall) | 16,995 (54.1%) | 14,435 (45.9%) |
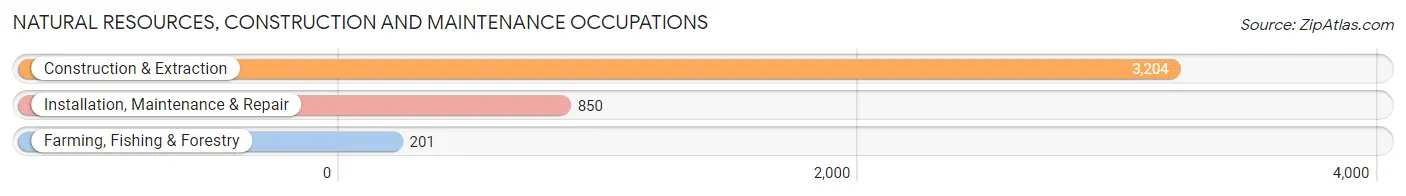
Natural Resources, Construction and Maintenance Occupations
The most common Natural Resources, Construction and Maintenance occupations in Hemet are Construction & Extraction (3,204 | 10.2%), Installation, Maintenance & Repair (850 | 2.7%), and Farming, Fishing & Forestry (201 | 0.6%).
Natural Resources, Construction and Maintenance Occupations by Sex
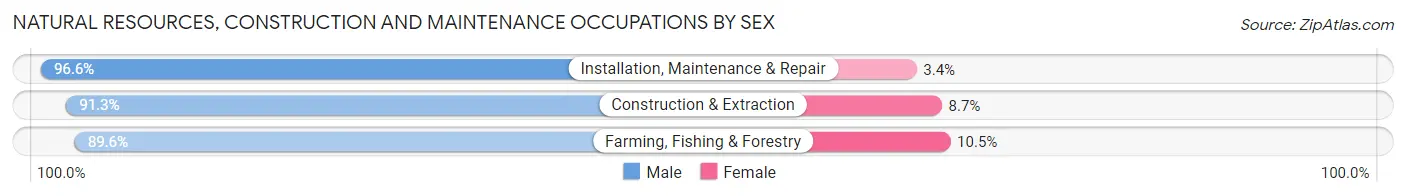
| Occupation | Male | Female |
| Farming, Fishing & Forestry | 180 (89.5%) | 21 (10.4%) |
| Construction & Extraction | 2,926 (91.3%) | 278 (8.7%) |
| Installation, Maintenance & Repair | 821 (96.6%) | 29 (3.4%) |
| Total (Category) | 3,927 (92.3%) | 328 (7.7%) |
| Total (Overall) | 16,995 (54.1%) | 14,435 (45.9%) |
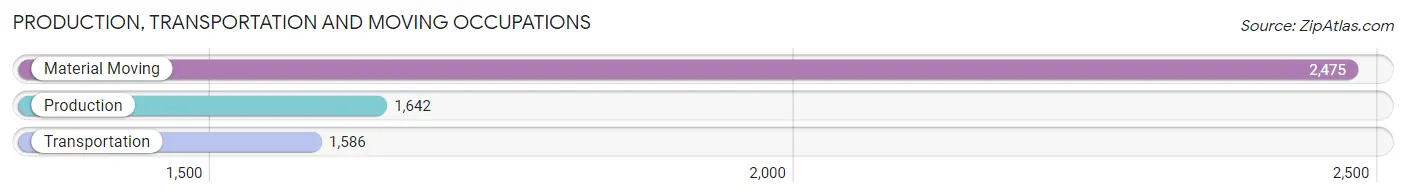
Production, Transportation and Moving Occupations
The most common Production, Transportation and Moving occupations in Hemet are Material Moving (2,475 | 7.9%), Production (1,642 | 5.2%), and Transportation (1,586 | 5.1%).
Production, Transportation and Moving Occupations by Sex
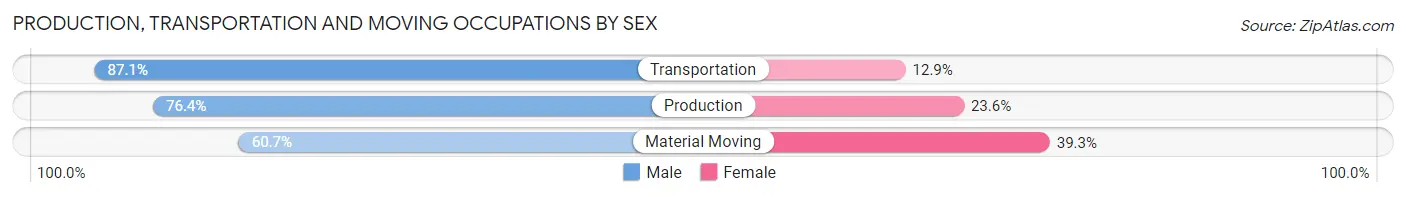
| Occupation | Male | Female |
| Production | 1,255 (76.4%) | 387 (23.6%) |
| Transportation | 1,382 (87.1%) | 204 (12.9%) |
| Material Moving | 1,502 (60.7%) | 973 (39.3%) |
| Total (Category) | 4,139 (72.6%) | 1,564 (27.4%) |
| Total (Overall) | 16,995 (54.1%) | 14,435 (45.9%) |
Employment Industries by Sex in Hemet
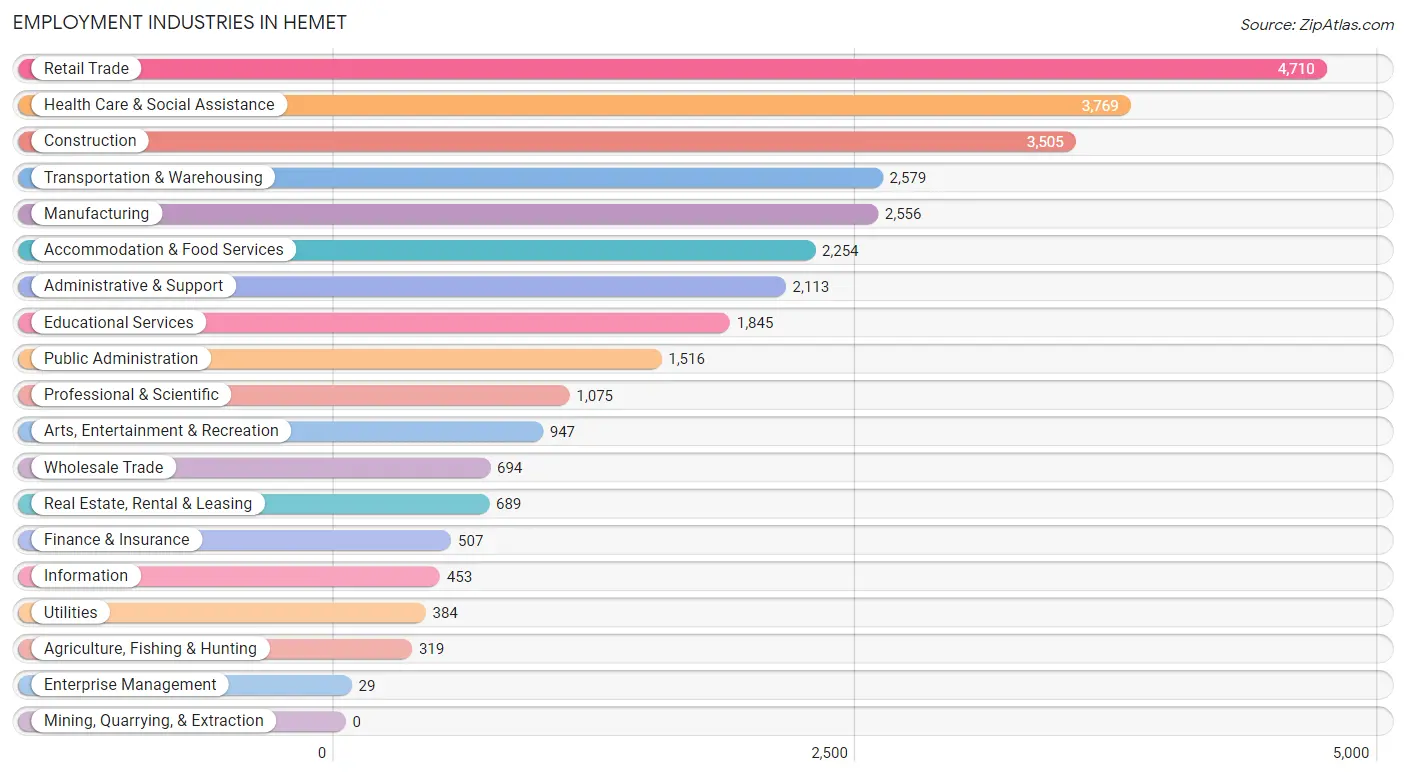
Employment Industries in Hemet
The major employment industries in Hemet include Retail Trade (4,710 | 15.0%), Health Care & Social Assistance (3,769 | 12.0%), Construction (3,505 | 11.2%), Transportation & Warehousing (2,579 | 8.2%), and Manufacturing (2,556 | 8.1%).
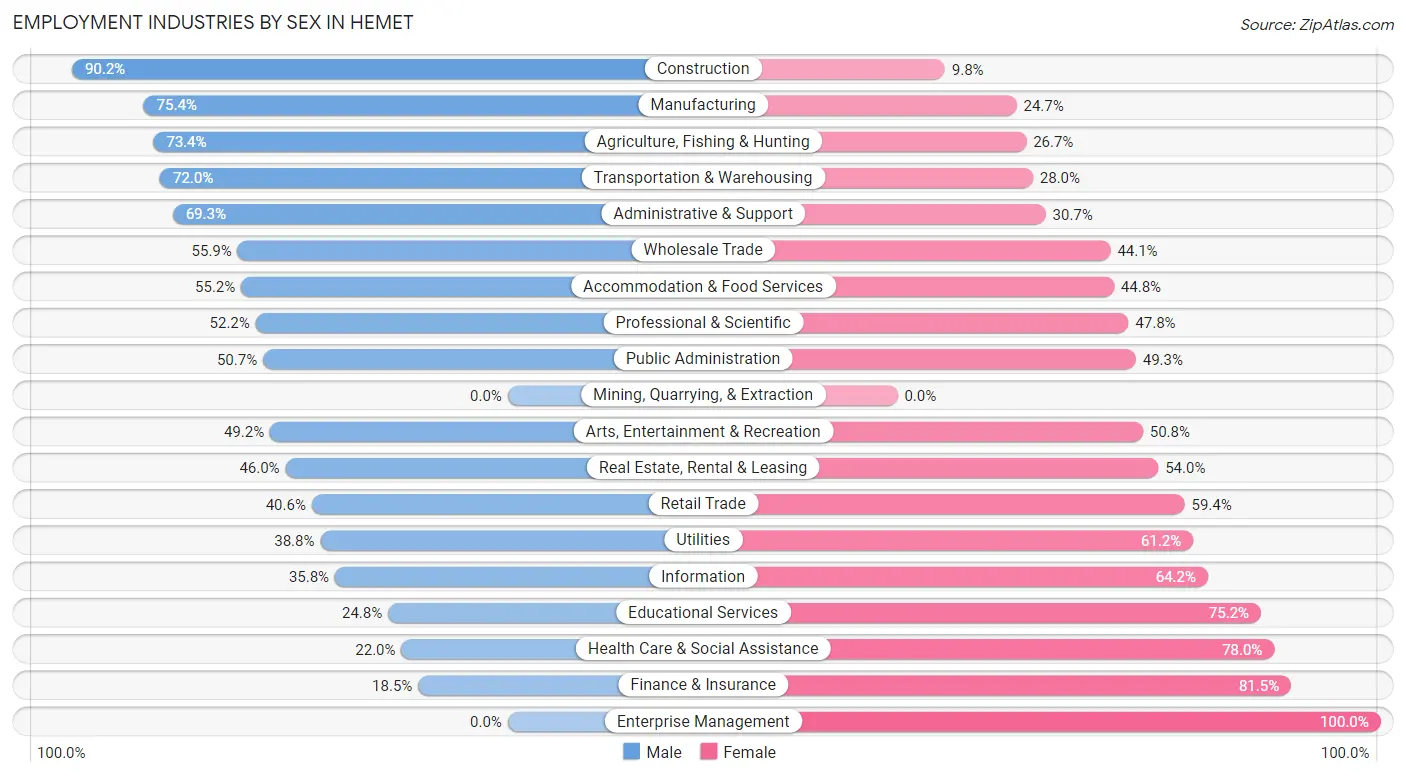
Employment Industries by Sex in Hemet
The Hemet industries that see more men than women are Construction (90.2%), Manufacturing (75.3%), and Agriculture, Fishing & Hunting (73.4%), whereas the industries that tend to have a higher number of women are Enterprise Management (100.0%), Finance & Insurance (81.5%), and Health Care & Social Assistance (78.0%).
| Industry | Male | Female |
| Agriculture, Fishing & Hunting | 234 (73.4%) | 85 (26.7%) |
| Mining, Quarrying, & Extraction | 0 (0.0%) | 0 (0.0%) |
| Construction | 3,161 (90.2%) | 344 (9.8%) |
| Manufacturing | 1,926 (75.3%) | 630 (24.6%) |
| Wholesale Trade | 388 (55.9%) | 306 (44.1%) |
| Retail Trade | 1,911 (40.6%) | 2,799 (59.4%) |
| Transportation & Warehousing | 1,856 (72.0%) | 723 (28.0%) |
| Utilities | 149 (38.8%) | 235 (61.2%) |
| Information | 162 (35.8%) | 291 (64.2%) |
| Finance & Insurance | 94 (18.5%) | 413 (81.5%) |
| Real Estate, Rental & Leasing | 317 (46.0%) | 372 (54.0%) |
| Professional & Scientific | 561 (52.2%) | 514 (47.8%) |
| Enterprise Management | 0 (0.0%) | 29 (100.0%) |
| Administrative & Support | 1,465 (69.3%) | 648 (30.7%) |
| Educational Services | 457 (24.8%) | 1,388 (75.2%) |
| Health Care & Social Assistance | 830 (22.0%) | 2,939 (78.0%) |
| Arts, Entertainment & Recreation | 466 (49.2%) | 481 (50.8%) |
| Accommodation & Food Services | 1,244 (55.2%) | 1,010 (44.8%) |
| Public Administration | 768 (50.7%) | 748 (49.3%) |
| Total | 16,995 (54.1%) | 14,435 (45.9%) |
Education in Hemet
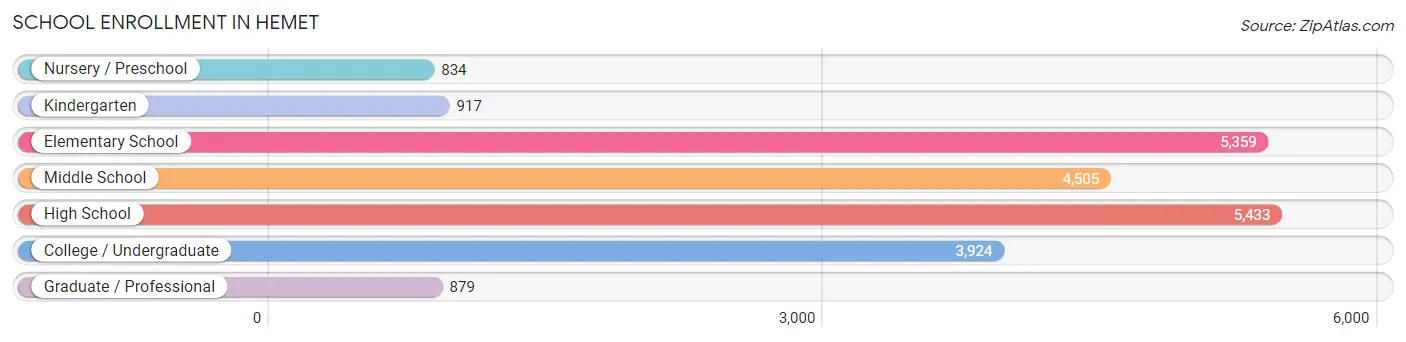
School Enrollment in Hemet
The most common levels of schooling among the 21,851 students in Hemet are high school (5,433 | 24.9%), elementary school (5,359 | 24.5%), and middle school (4,505 | 20.6%).
| School Level | # Students | % Students |
| Nursery / Preschool | 834 | 3.8% |
| Kindergarten | 917 | 4.2% |
| Elementary School | 5,359 | 24.5% |
| Middle School | 4,505 | 20.6% |
| High School | 5,433 | 24.9% |
| College / Undergraduate | 3,924 | 18.0% |
| Graduate / Professional | 879 | 4.0% |
| Total | 21,851 | 100.0% |
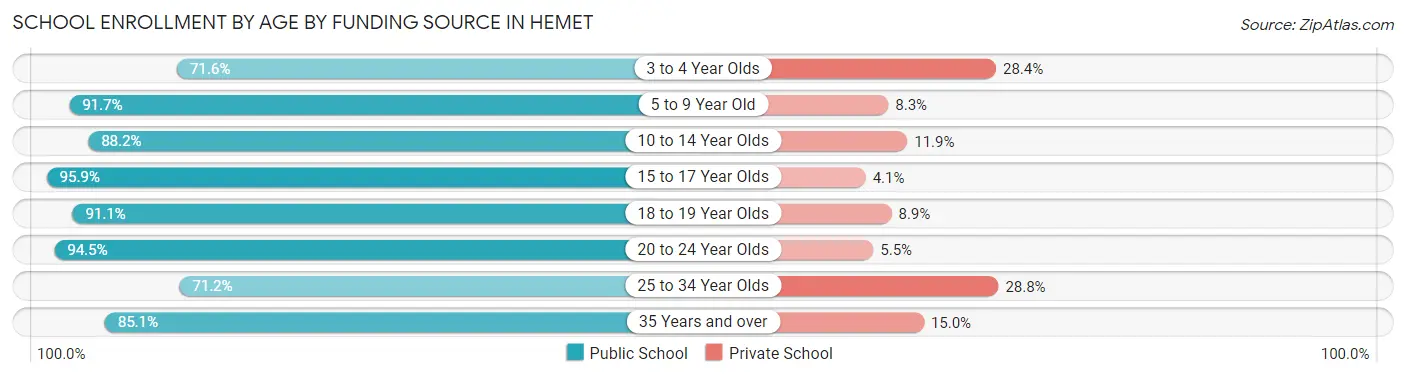
School Enrollment by Age by Funding Source in Hemet
Out of a total of 21,851 students who are enrolled in schools in Hemet, 2,404 (11.0%) attend a private institution, while the remaining 19,447 (89.0%) are enrolled in public schools. The age group of 25 to 34 year olds has the highest likelihood of being enrolled in private schools, with 508 (28.8% in the age bracket) enrolled. Conversely, the age group of 15 to 17 year olds has the lowest likelihood of being enrolled in a private school, with 3,708 (95.9% in the age bracket) attending a public institution.
| Age Bracket | Public School | Private School |
| 3 to 4 Year Olds | 449 (71.6%) | 178 (28.4%) |
| 5 to 9 Year Old | 5,425 (91.7%) | 492 (8.3%) |
| 10 to 14 Year Olds | 5,237 (88.1%) | 704 (11.8%) |
| 15 to 17 Year Olds | 3,708 (95.9%) | 159 (4.1%) |
| 18 to 19 Year Olds | 1,246 (91.1%) | 122 (8.9%) |
| 20 to 24 Year Olds | 1,195 (94.5%) | 70 (5.5%) |
| 25 to 34 Year Olds | 1,254 (71.2%) | 508 (28.8%) |
| 35 Years and over | 939 (85.1%) | 165 (14.9%) |
| Total | 19,447 (89.0%) | 2,404 (11.0%) |
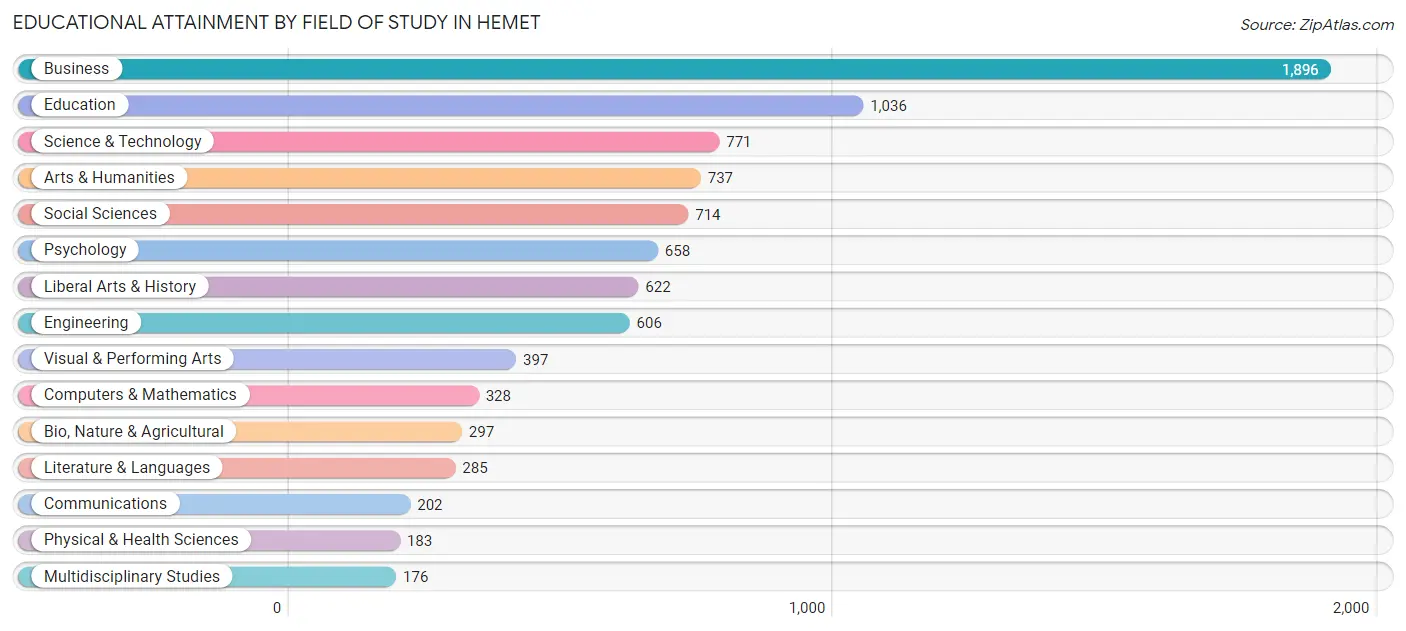
Educational Attainment by Field of Study in Hemet
Business (1,896 | 21.3%), education (1,036 | 11.6%), science & technology (771 | 8.7%), arts & humanities (737 | 8.3%), and social sciences (714 | 8.0%) are the most common fields of study among 8,908 individuals in Hemet who have obtained a bachelor's degree or higher.
| Field of Study | # Graduates | % Graduates |
| Computers & Mathematics | 328 | 3.7% |
| Bio, Nature & Agricultural | 297 | 3.3% |
| Physical & Health Sciences | 183 | 2.1% |
| Psychology | 658 | 7.4% |
| Social Sciences | 714 | 8.0% |
| Engineering | 606 | 6.8% |
| Multidisciplinary Studies | 176 | 2.0% |
| Science & Technology | 771 | 8.7% |
| Business | 1,896 | 21.3% |
| Education | 1,036 | 11.6% |
| Literature & Languages | 285 | 3.2% |
| Liberal Arts & History | 622 | 7.0% |
| Visual & Performing Arts | 397 | 4.5% |
| Communications | 202 | 2.3% |
| Arts & Humanities | 737 | 8.3% |
| Total | 8,908 | 100.0% |
Transportation & Commute in Hemet
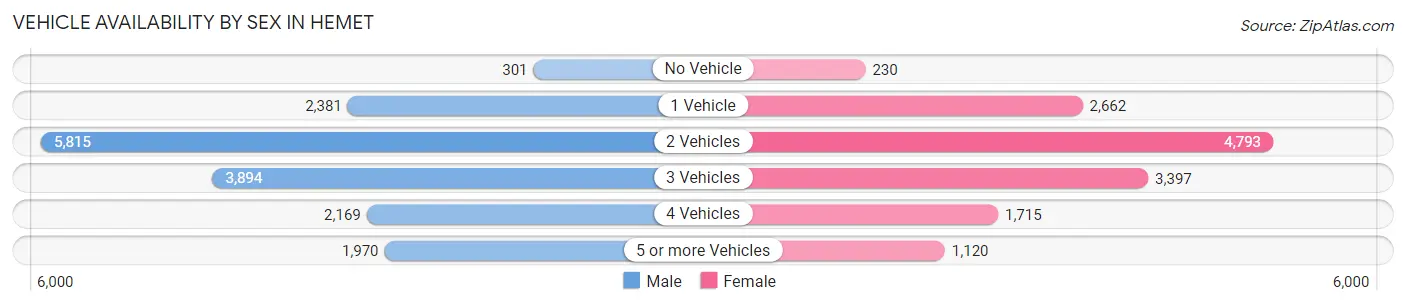
Vehicle Availability by Sex in Hemet
The most prevalent vehicle ownership categories in Hemet are males with 2 vehicles (5,815, accounting for 35.2%) and females with 2 vehicles (4,793, making up 41.8%).
| Vehicles Available | Male | Female |
| No Vehicle | 301 (1.8%) | 230 (1.7%) |
| 1 Vehicle | 2,381 (14.4%) | 2,662 (19.1%) |
| 2 Vehicles | 5,815 (35.2%) | 4,793 (34.4%) |
| 3 Vehicles | 3,894 (23.6%) | 3,397 (24.4%) |
| 4 Vehicles | 2,169 (13.1%) | 1,715 (12.3%) |
| 5 or more Vehicles | 1,970 (11.9%) | 1,120 (8.1%) |
| Total | 16,530 (100.0%) | 13,917 (100.0%) |
Commute Time in Hemet
The most frequently occuring commute durations in Hemet are 10 to 14 minutes (4,595 commuters, 16.3%), 30 to 34 minutes (4,277 commuters, 15.2%), and 45 to 59 minutes (3,577 commuters, 12.7%).
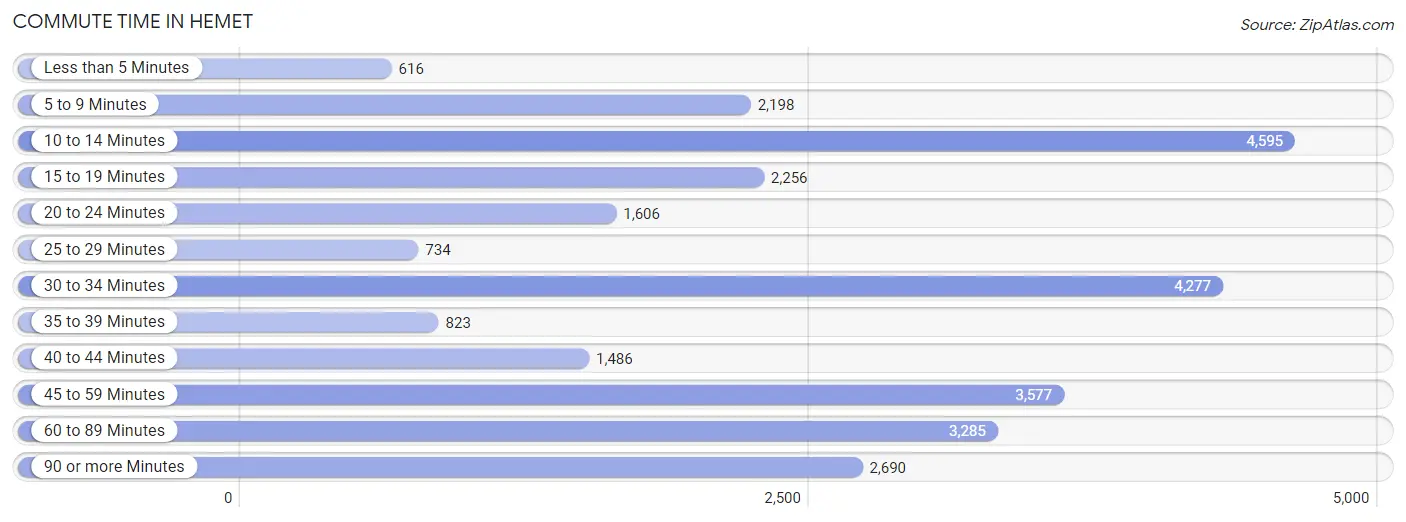
| Commute Time | # Commuters | % Commuters |
| Less than 5 Minutes | 616 | 2.2% |
| 5 to 9 Minutes | 2,198 | 7.8% |
| 10 to 14 Minutes | 4,595 | 16.3% |
| 15 to 19 Minutes | 2,256 | 8.0% |
| 20 to 24 Minutes | 1,606 | 5.7% |
| 25 to 29 Minutes | 734 | 2.6% |
| 30 to 34 Minutes | 4,277 | 15.2% |
| 35 to 39 Minutes | 823 | 2.9% |
| 40 to 44 Minutes | 1,486 | 5.3% |
| 45 to 59 Minutes | 3,577 | 12.7% |
| 60 to 89 Minutes | 3,285 | 11.7% |
| 90 or more Minutes | 2,690 | 9.6% |
Commute Time by Sex in Hemet
The most common commute times in Hemet are 30 to 34 minutes (2,485 commuters, 16.1%) for males and 10 to 14 minutes (2,484 commuters, 19.5%) for females.
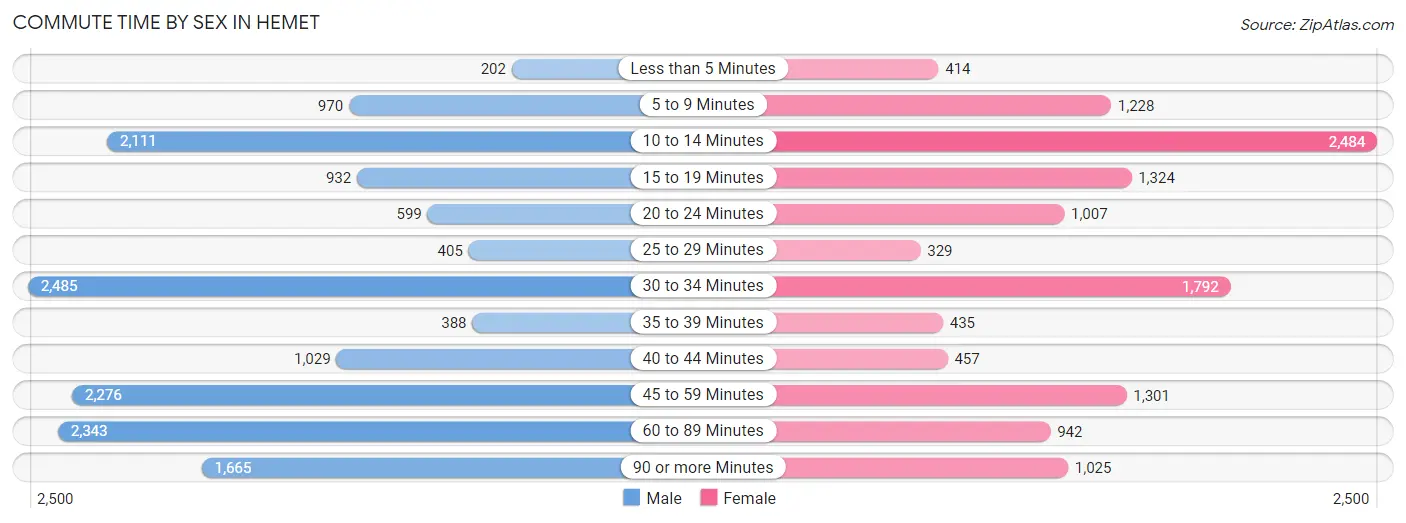
| Commute Time | Male | Female |
| Less than 5 Minutes | 202 (1.3%) | 414 (3.3%) |
| 5 to 9 Minutes | 970 (6.3%) | 1,228 (9.6%) |
| 10 to 14 Minutes | 2,111 (13.7%) | 2,484 (19.5%) |
| 15 to 19 Minutes | 932 (6.0%) | 1,324 (10.4%) |
| 20 to 24 Minutes | 599 (3.9%) | 1,007 (7.9%) |
| 25 to 29 Minutes | 405 (2.6%) | 329 (2.6%) |
| 30 to 34 Minutes | 2,485 (16.1%) | 1,792 (14.1%) |
| 35 to 39 Minutes | 388 (2.5%) | 435 (3.4%) |
| 40 to 44 Minutes | 1,029 (6.7%) | 457 (3.6%) |
| 45 to 59 Minutes | 2,276 (14.8%) | 1,301 (10.2%) |
| 60 to 89 Minutes | 2,343 (15.2%) | 942 (7.4%) |
| 90 or more Minutes | 1,665 (10.8%) | 1,025 (8.1%) |
Time of Departure to Work by Sex in Hemet
The most frequent times of departure to work in Hemet are 12:00 AM to 4:59 AM (3,144, 20.4%) for males and 4:00 PM to 11:59 PM (1,537, 12.1%) for females.
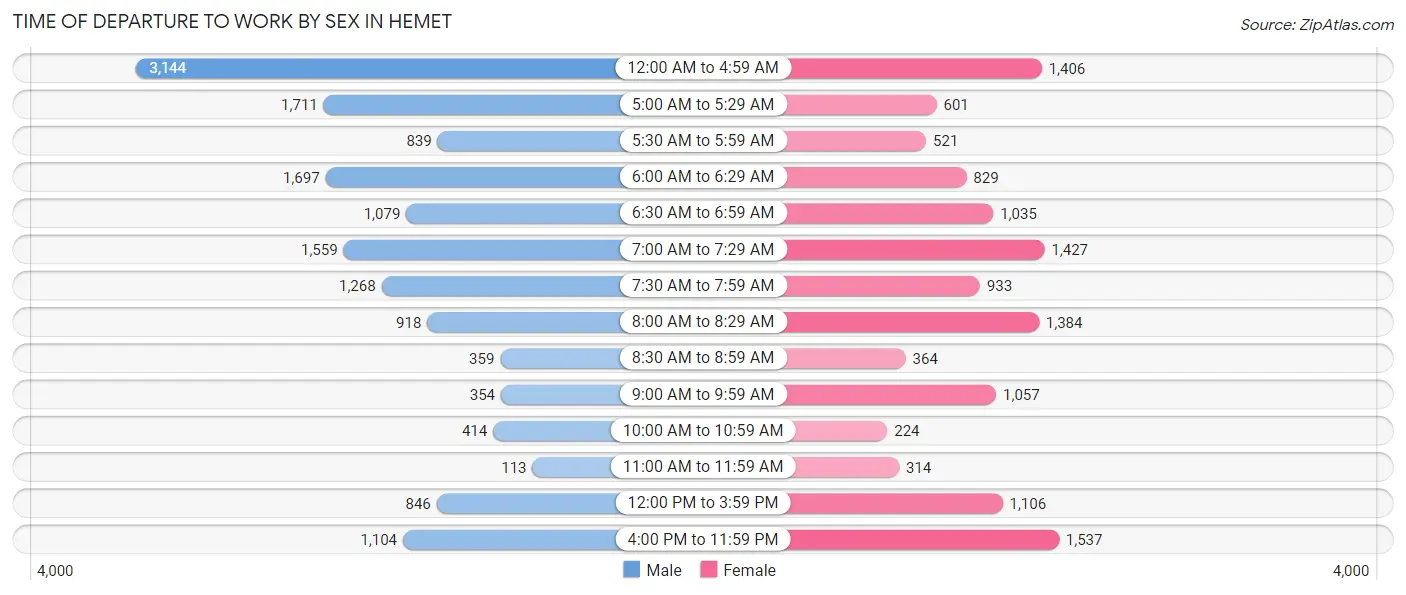
| Time of Departure | Male | Female |
| 12:00 AM to 4:59 AM | 3,144 (20.4%) | 1,406 (11.0%) |
| 5:00 AM to 5:29 AM | 1,711 (11.1%) | 601 (4.7%) |
| 5:30 AM to 5:59 AM | 839 (5.4%) | 521 (4.1%) |
| 6:00 AM to 6:29 AM | 1,697 (11.0%) | 829 (6.5%) |
| 6:30 AM to 6:59 AM | 1,079 (7.0%) | 1,035 (8.1%) |
| 7:00 AM to 7:29 AM | 1,559 (10.1%) | 1,427 (11.2%) |
| 7:30 AM to 7:59 AM | 1,268 (8.2%) | 933 (7.3%) |
| 8:00 AM to 8:29 AM | 918 (6.0%) | 1,384 (10.9%) |
| 8:30 AM to 8:59 AM | 359 (2.3%) | 364 (2.9%) |
| 9:00 AM to 9:59 AM | 354 (2.3%) | 1,057 (8.3%) |
| 10:00 AM to 10:59 AM | 414 (2.7%) | 224 (1.8%) |
| 11:00 AM to 11:59 AM | 113 (0.7%) | 314 (2.5%) |
| 12:00 PM to 3:59 PM | 846 (5.5%) | 1,106 (8.7%) |
| 4:00 PM to 11:59 PM | 1,104 (7.2%) | 1,537 (12.1%) |
| Total | 15,405 (100.0%) | 12,738 (100.0%) |
Housing Occupancy in Hemet
Occupancy by Ownership in Hemet
Of the total 30,963 dwellings in Hemet, owner-occupied units account for 18,903 (61.1%), while renter-occupied units make up 12,060 (39.0%).
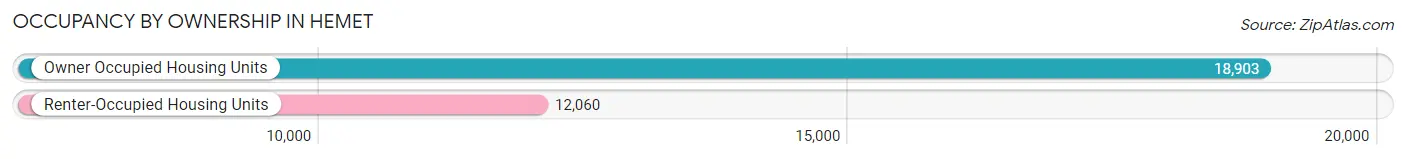
| Occupancy | # Housing Units | % Housing Units |
| Owner Occupied Housing Units | 18,903 | 61.1% |
| Renter-Occupied Housing Units | 12,060 | 39.0% |
| Total Occupied Housing Units | 30,963 | 100.0% |
Occupancy by Household Size in Hemet
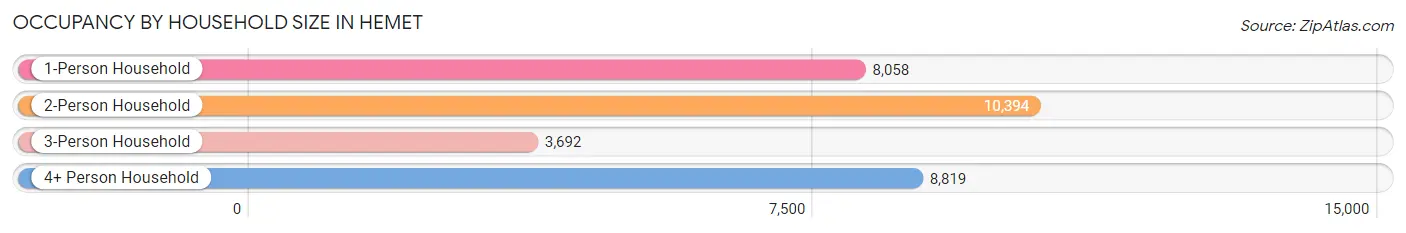
| Household Size | # Housing Units | % Housing Units |
| 1-Person Household | 8,058 | 26.0% |
| 2-Person Household | 10,394 | 33.6% |
| 3-Person Household | 3,692 | 11.9% |
| 4+ Person Household | 8,819 | 28.5% |
| Total Housing Units | 30,963 | 100.0% |
Occupancy by Ownership by Household Size in Hemet
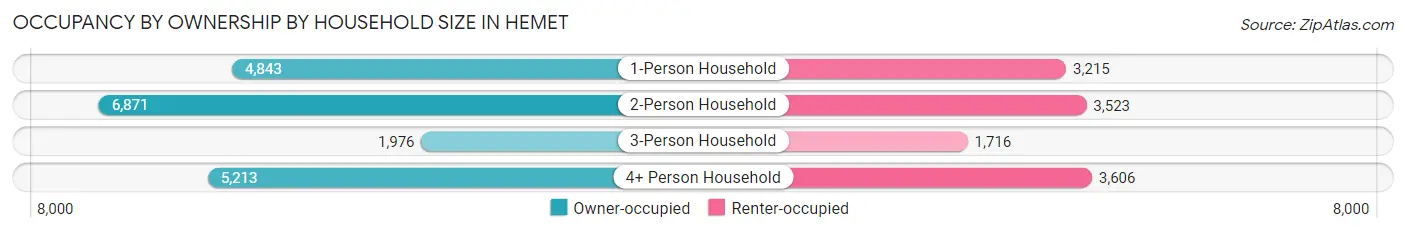
| Household Size | Owner-occupied | Renter-occupied |
| 1-Person Household | 4,843 (60.1%) | 3,215 (39.9%) |
| 2-Person Household | 6,871 (66.1%) | 3,523 (33.9%) |
| 3-Person Household | 1,976 (53.5%) | 1,716 (46.5%) |
| 4+ Person Household | 5,213 (59.1%) | 3,606 (40.9%) |
| Total Housing Units | 18,903 (61.1%) | 12,060 (39.0%) |
Occupancy by Educational Attainment in Hemet
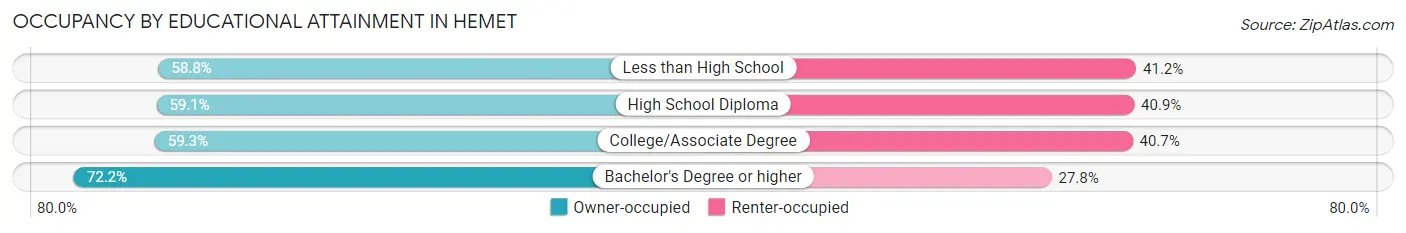
| Household Size | Owner-occupied | Renter-occupied |
| Less than High School | 3,250 (58.8%) | 2,280 (41.2%) |
| High School Diploma | 5,315 (59.1%) | 3,682 (40.9%) |
| College/Associate Degree | 7,048 (59.3%) | 4,830 (40.7%) |
| Bachelor's Degree or higher | 3,290 (72.2%) | 1,268 (27.8%) |
Occupancy by Age of Householder in Hemet
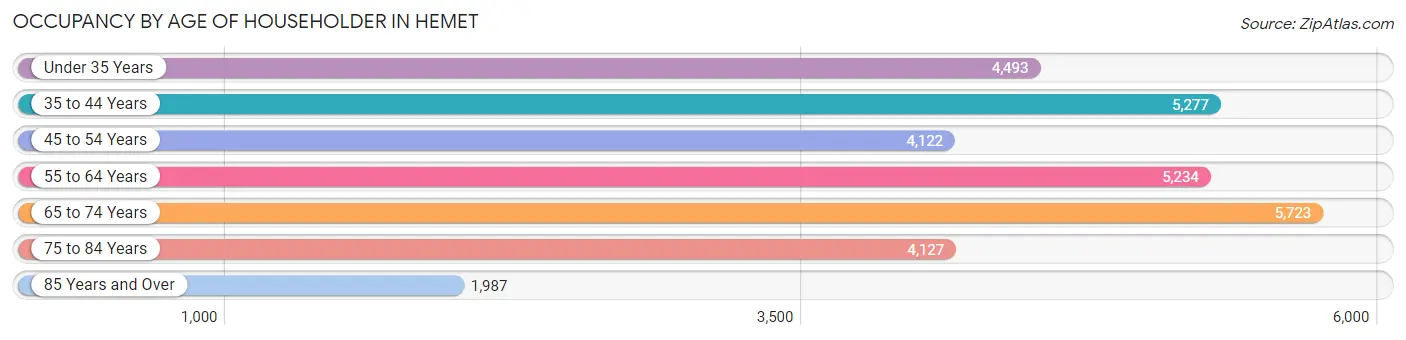
| Age Bracket | # Households | % Households |
| Under 35 Years | 4,493 | 14.5% |
| 35 to 44 Years | 5,277 | 17.0% |
| 45 to 54 Years | 4,122 | 13.3% |
| 55 to 64 Years | 5,234 | 16.9% |
| 65 to 74 Years | 5,723 | 18.5% |
| 75 to 84 Years | 4,127 | 13.3% |
| 85 Years and Over | 1,987 | 6.4% |
| Total | 30,963 | 100.0% |
Housing Finances in Hemet
Median Income by Occupancy in Hemet
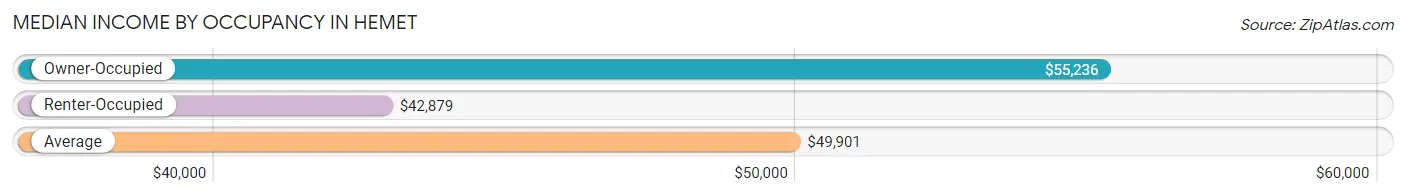
| Occupancy Type | # Households | Median Income |
| Owner-Occupied | 18,903 (61.1%) | $55,236 |
| Renter-Occupied | 12,060 (39.0%) | $42,879 |
| Average | 30,963 (100.0%) | $49,901 |
Occupancy by Householder Income Bracket in Hemet
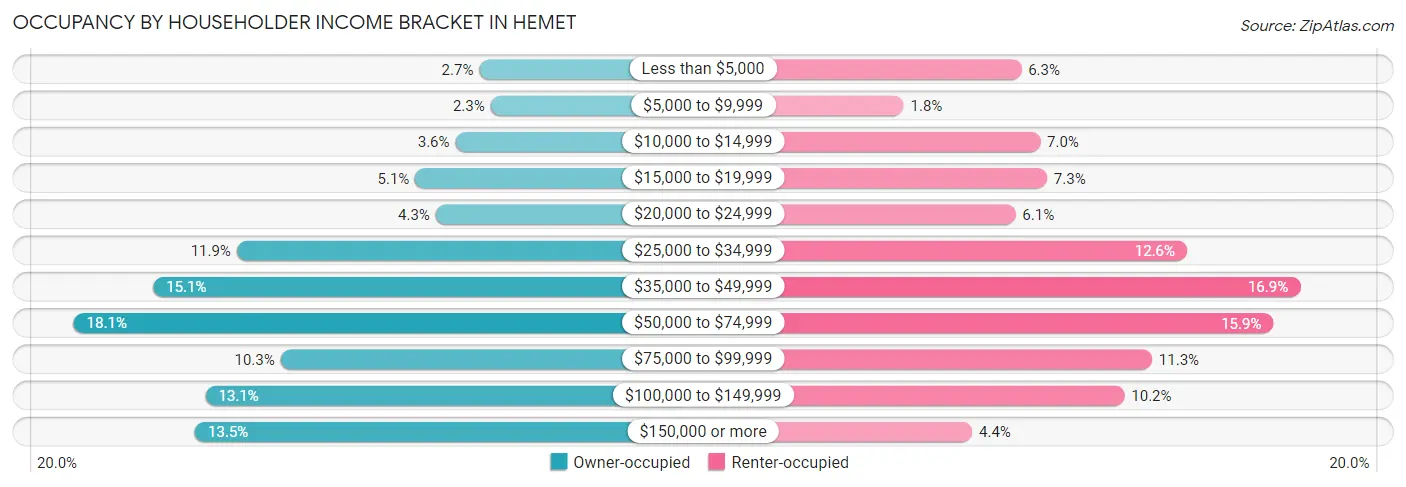
| Income Bracket | Owner-occupied | Renter-occupied |
| Less than $5,000 | 506 (2.7%) | 761 (6.3%) |
| $5,000 to $9,999 | 425 (2.2%) | 221 (1.8%) |
| $10,000 to $14,999 | 679 (3.6%) | 848 (7.0%) |
| $15,000 to $19,999 | 967 (5.1%) | 879 (7.3%) |
| $20,000 to $24,999 | 821 (4.3%) | 735 (6.1%) |
| $25,000 to $34,999 | 2,254 (11.9%) | 1,522 (12.6%) |
| $35,000 to $49,999 | 2,855 (15.1%) | 2,042 (16.9%) |
| $50,000 to $74,999 | 3,427 (18.1%) | 1,919 (15.9%) |
| $75,000 to $99,999 | 1,937 (10.2%) | 1,362 (11.3%) |
| $100,000 to $149,999 | 2,479 (13.1%) | 1,235 (10.2%) |
| $150,000 or more | 2,553 (13.5%) | 536 (4.4%) |
| Total | 18,903 (100.0%) | 12,060 (100.0%) |
Monthly Housing Cost Tiers in Hemet
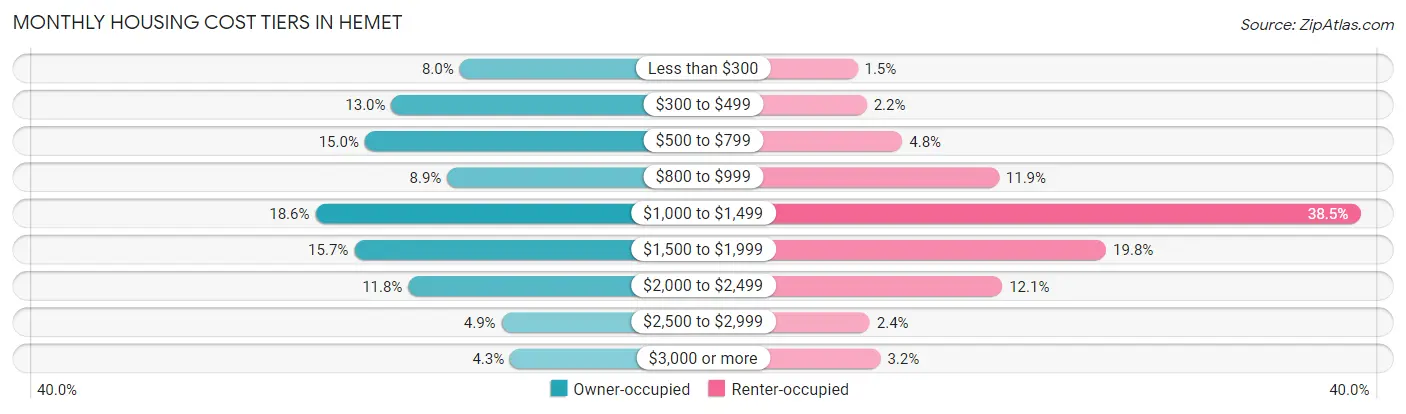
| Monthly Cost | Owner-occupied | Renter-occupied |
| Less than $300 | 1,507 (8.0%) | 178 (1.5%) |
| $300 to $499 | 2,456 (13.0%) | 260 (2.2%) |
| $500 to $799 | 2,826 (14.9%) | 577 (4.8%) |
| $800 to $999 | 1,679 (8.9%) | 1,434 (11.9%) |
| $1,000 to $1,499 | 3,514 (18.6%) | 4,642 (38.5%) |
| $1,500 to $1,999 | 2,973 (15.7%) | 2,387 (19.8%) |
| $2,000 to $2,499 | 2,222 (11.7%) | 1,464 (12.1%) |
| $2,500 to $2,999 | 923 (4.9%) | 288 (2.4%) |
| $3,000 or more | 803 (4.3%) | 382 (3.2%) |
| Total | 18,903 (100.0%) | 12,060 (100.0%) |
Physical Housing Characteristics in Hemet
Housing Structures in Hemet
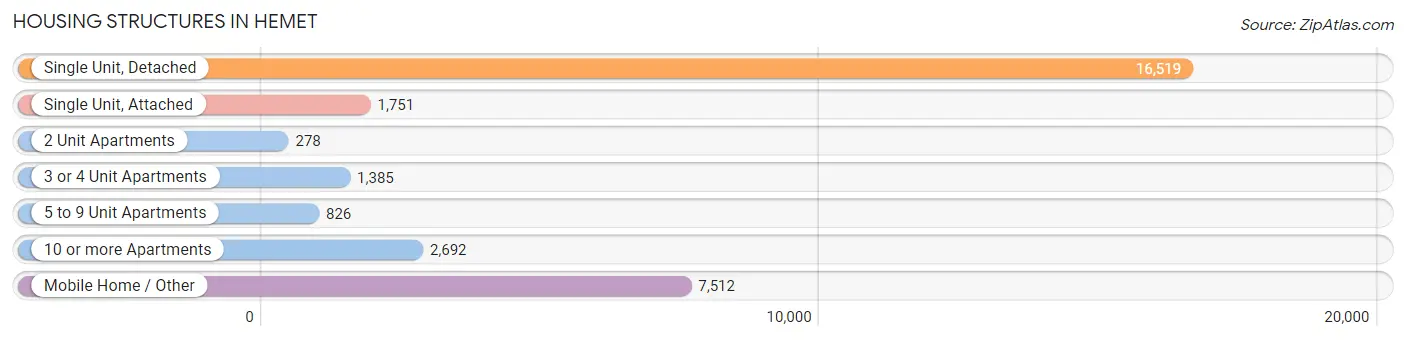
| Structure Type | # Housing Units | % Housing Units |
| Single Unit, Detached | 16,519 | 53.3% |
| Single Unit, Attached | 1,751 | 5.7% |
| 2 Unit Apartments | 278 | 0.9% |
| 3 or 4 Unit Apartments | 1,385 | 4.5% |
| 5 to 9 Unit Apartments | 826 | 2.7% |
| 10 or more Apartments | 2,692 | 8.7% |
| Mobile Home / Other | 7,512 | 24.3% |
| Total | 30,963 | 100.0% |
Housing Structures by Occupancy in Hemet
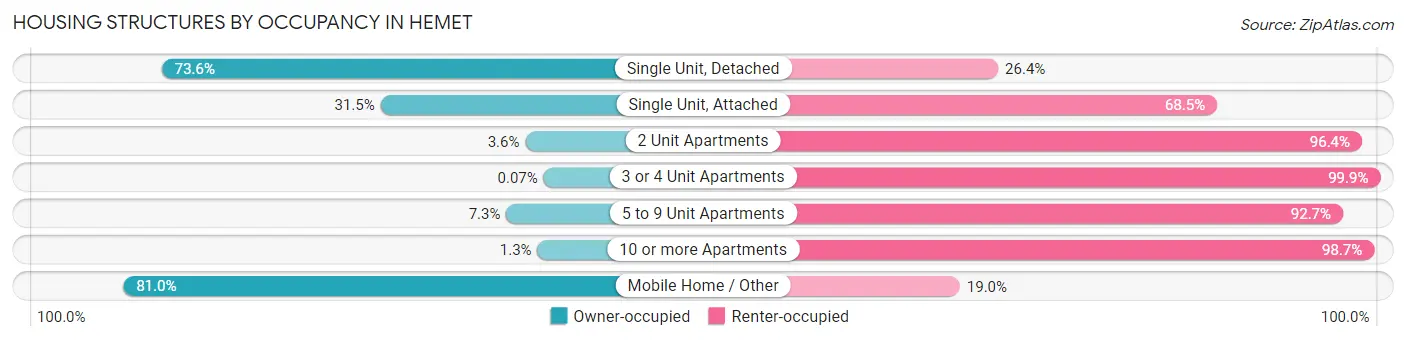
| Structure Type | Owner-occupied | Renter-occupied |
| Single Unit, Detached | 12,162 (73.6%) | 4,357 (26.4%) |
| Single Unit, Attached | 551 (31.5%) | 1,200 (68.5%) |
| 2 Unit Apartments | 10 (3.6%) | 268 (96.4%) |
| 3 or 4 Unit Apartments | 1 (0.1%) | 1,384 (99.9%) |
| 5 to 9 Unit Apartments | 60 (7.3%) | 766 (92.7%) |
| 10 or more Apartments | 34 (1.3%) | 2,658 (98.7%) |
| Mobile Home / Other | 6,085 (81.0%) | 1,427 (19.0%) |
| Total | 18,903 (61.1%) | 12,060 (39.0%) |
Housing Structures by Number of Rooms in Hemet
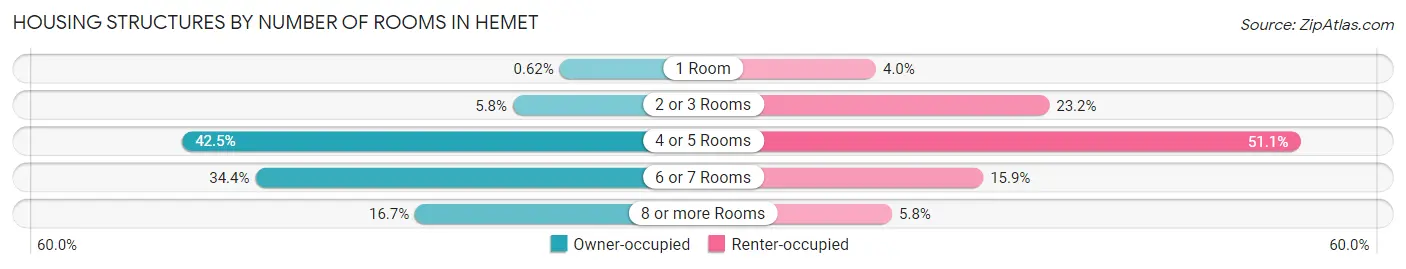
| Number of Rooms | Owner-occupied | Renter-occupied |
| 1 Room | 117 (0.6%) | 484 (4.0%) |
| 2 or 3 Rooms | 1,099 (5.8%) | 2,803 (23.2%) |
| 4 or 5 Rooms | 8,034 (42.5%) | 6,158 (51.1%) |
| 6 or 7 Rooms | 6,502 (34.4%) | 1,917 (15.9%) |
| 8 or more Rooms | 3,151 (16.7%) | 698 (5.8%) |
| Total | 18,903 (100.0%) | 12,060 (100.0%) |
Housing Structure by Heating Type in Hemet
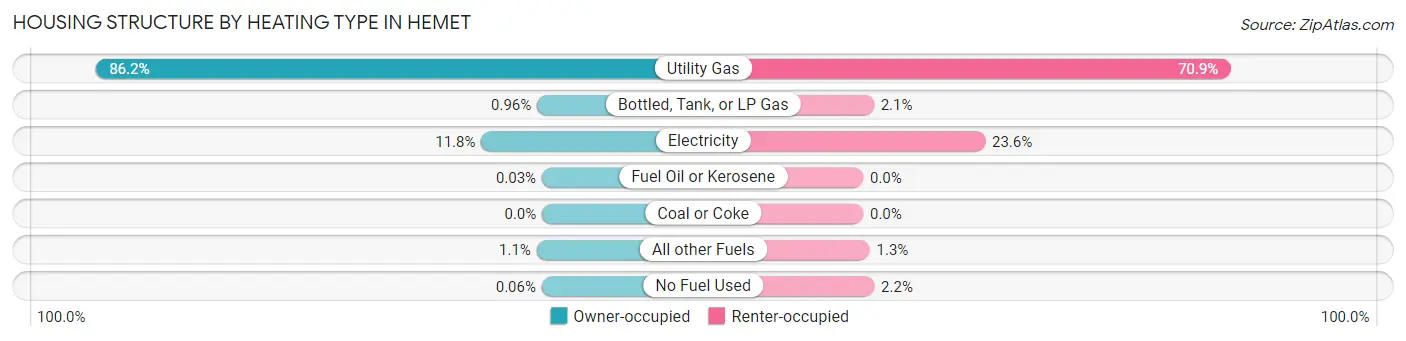
| Heating Type | Owner-occupied | Renter-occupied |
| Utility Gas | 16,284 (86.2%) | 8,555 (70.9%) |
| Bottled, Tank, or LP Gas | 181 (1.0%) | 249 (2.1%) |
| Electricity | 2,222 (11.7%) | 2,844 (23.6%) |
| Fuel Oil or Kerosene | 6 (0.0%) | 0 (0.0%) |
| Coal or Coke | 0 (0.0%) | 0 (0.0%) |
| All other Fuels | 199 (1.1%) | 153 (1.3%) |
| No Fuel Used | 11 (0.1%) | 259 (2.1%) |
| Total | 18,903 (100.0%) | 12,060 (100.0%) |
Household Vehicle Usage in Hemet
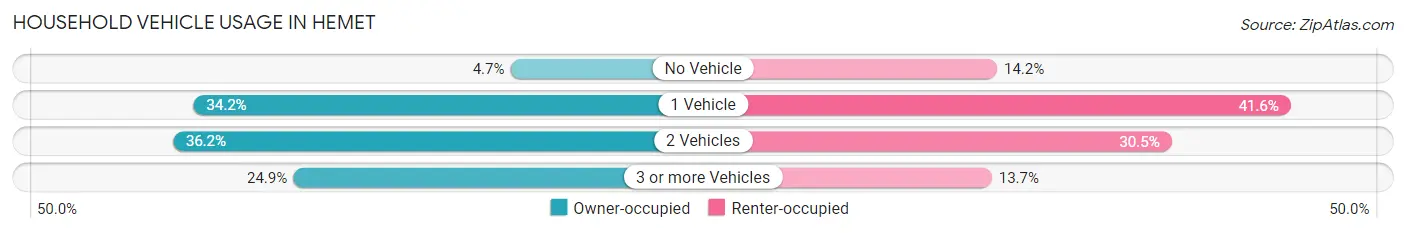
| Vehicles per Household | Owner-occupied | Renter-occupied |
| No Vehicle | 881 (4.7%) | 1,712 (14.2%) |
| 1 Vehicle | 6,472 (34.2%) | 5,018 (41.6%) |
| 2 Vehicles | 6,836 (36.2%) | 3,676 (30.5%) |
| 3 or more Vehicles | 4,714 (24.9%) | 1,654 (13.7%) |
| Total | 18,903 (100.0%) | 12,060 (100.0%) |
Real Estate & Mortgages in Hemet
Real Estate and Mortgage Overview in Hemet
| Characteristic | Without Mortgage | With Mortgage |
| Housing Units | 8,484 | 10,419 |
| Median Property Value | $110,700 | $334,700 |
| Median Household Income | $40,871 | $2,038 |
| Monthly Housing Costs | $541 | $787 |
| Real Estate Taxes | $1,075 | $537 |
Property Value by Mortgage Status in Hemet
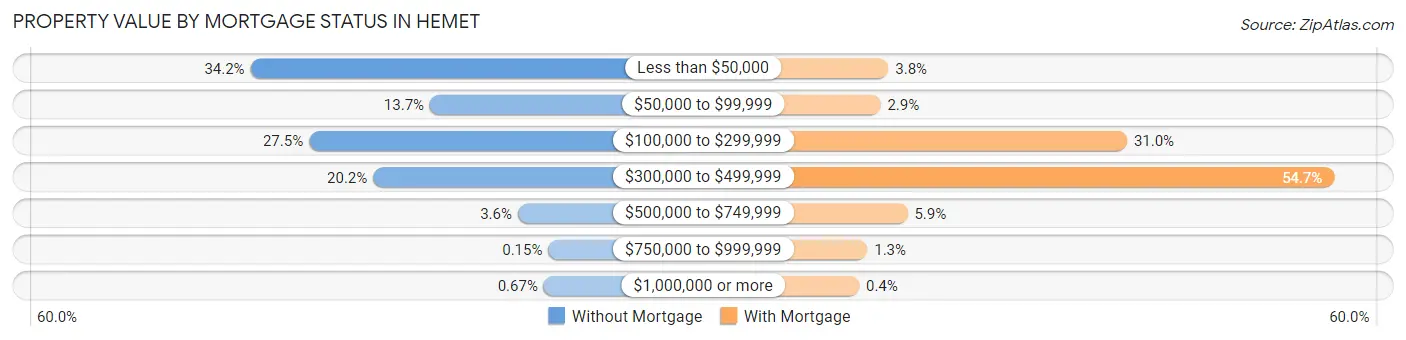
| Property Value | Without Mortgage | With Mortgage |
| Less than $50,000 | 2,901 (34.2%) | 391 (3.7%) |
| $50,000 to $99,999 | 1,161 (13.7%) | 297 (2.9%) |
| $100,000 to $299,999 | 2,333 (27.5%) | 3,232 (31.0%) |
| $300,000 to $499,999 | 1,711 (20.2%) | 5,699 (54.7%) |
| $500,000 to $749,999 | 308 (3.6%) | 618 (5.9%) |
| $750,000 to $999,999 | 13 (0.2%) | 140 (1.3%) |
| $1,000,000 or more | 57 (0.7%) | 42 (0.4%) |
| Total | 8,484 (100.0%) | 10,419 (100.0%) |
Household Income by Mortgage Status in Hemet
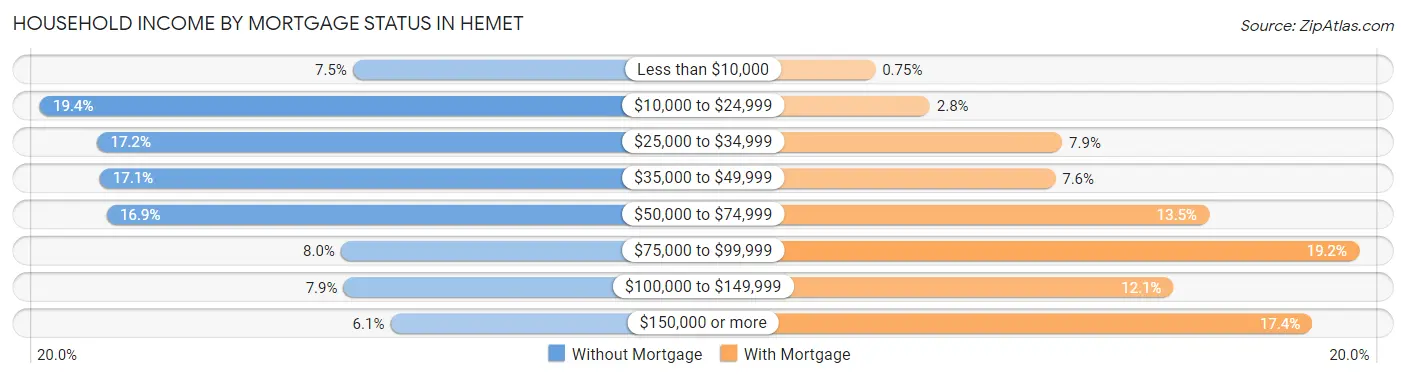
| Household Income | Without Mortgage | With Mortgage |
| Less than $10,000 | 636 (7.5%) | 78 (0.7%) |
| $10,000 to $24,999 | 1,647 (19.4%) | 295 (2.8%) |
| $25,000 to $34,999 | 1,461 (17.2%) | 820 (7.9%) |
| $35,000 to $49,999 | 1,453 (17.1%) | 793 (7.6%) |
| $50,000 to $74,999 | 1,430 (16.9%) | 1,402 (13.5%) |
| $75,000 to $99,999 | 675 (8.0%) | 1,997 (19.2%) |
| $100,000 to $149,999 | 667 (7.9%) | 1,262 (12.1%) |
| $150,000 or more | 515 (6.1%) | 1,812 (17.4%) |
| Total | 8,484 (100.0%) | 10,419 (100.0%) |
Property Value to Household Income Ratio in Hemet
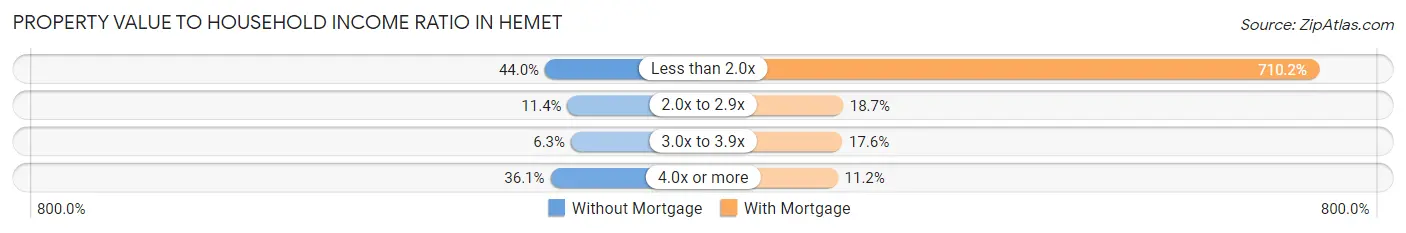
| Value-to-Income Ratio | Without Mortgage | With Mortgage |
| Less than 2.0x | 3,734 (44.0%) | 73,997 (710.2%) |
| 2.0x to 2.9x | 965 (11.4%) | 1,953 (18.7%) |
| 3.0x to 3.9x | 537 (6.3%) | 1,833 (17.6%) |
| 4.0x or more | 3,065 (36.1%) | 1,164 (11.2%) |
| Total | 8,484 (100.0%) | 10,419 (100.0%) |
Real Estate Taxes by Mortgage Status in Hemet
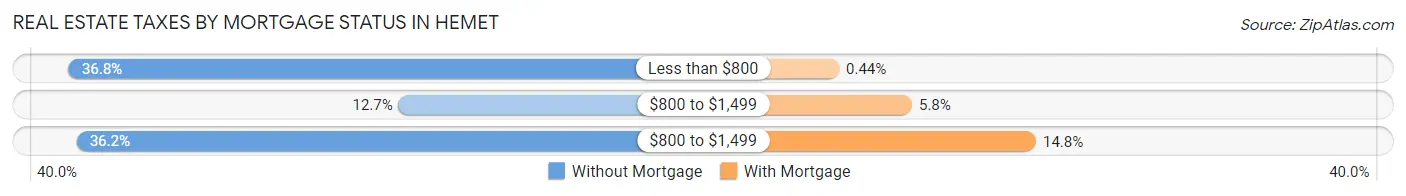
| Property Taxes | Without Mortgage | With Mortgage |
| Less than $800 | 3,119 (36.8%) | 46 (0.4%) |
| $800 to $1,499 | 1,076 (12.7%) | 601 (5.8%) |
| $800 to $1,499 | 3,070 (36.2%) | 1,545 (14.8%) |
| Total | 8,484 (100.0%) | 10,419 (100.0%) |
Health & Disability in Hemet
Health Insurance Coverage by Age in Hemet
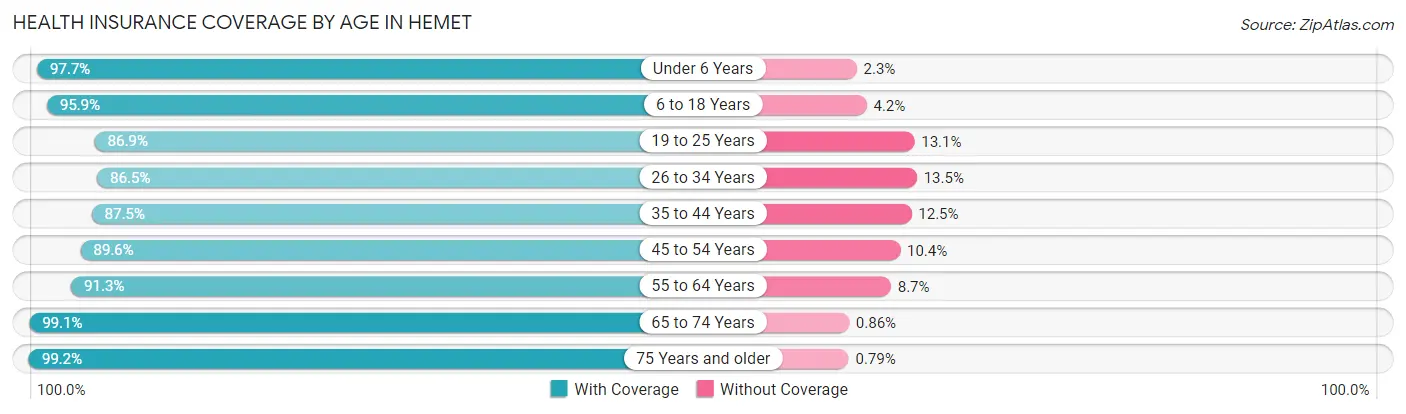
| Age Bracket | With Coverage | Without Coverage |
| Under 6 Years | 6,287 (97.7%) | 148 (2.3%) |
| 6 to 18 Years | 15,657 (95.9%) | 678 (4.2%) |
| 19 to 25 Years | 6,189 (86.9%) | 930 (13.1%) |
| 26 to 34 Years | 8,998 (86.5%) | 1,405 (13.5%) |
| 35 to 44 Years | 8,929 (87.5%) | 1,275 (12.5%) |
| 45 to 54 Years | 7,670 (89.6%) | 890 (10.4%) |
| 55 to 64 Years | 9,391 (91.3%) | 892 (8.7%) |
| 65 to 74 Years | 10,200 (99.1%) | 88 (0.9%) |
| 75 Years and older | 9,176 (99.2%) | 73 (0.8%) |
| Total | 82,497 (92.8%) | 6,379 (7.2%) |
Health Insurance Coverage by Citizenship Status in Hemet
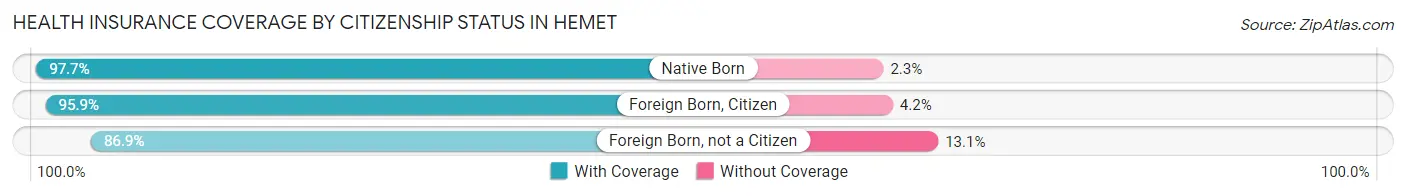
| Citizenship Status | With Coverage | Without Coverage |
| Native Born | 6,287 (97.7%) | 148 (2.3%) |
| Foreign Born, Citizen | 15,657 (95.9%) | 678 (4.2%) |
| Foreign Born, not a Citizen | 6,189 (86.9%) | 930 (13.1%) |
Health Insurance Coverage by Household Income in Hemet
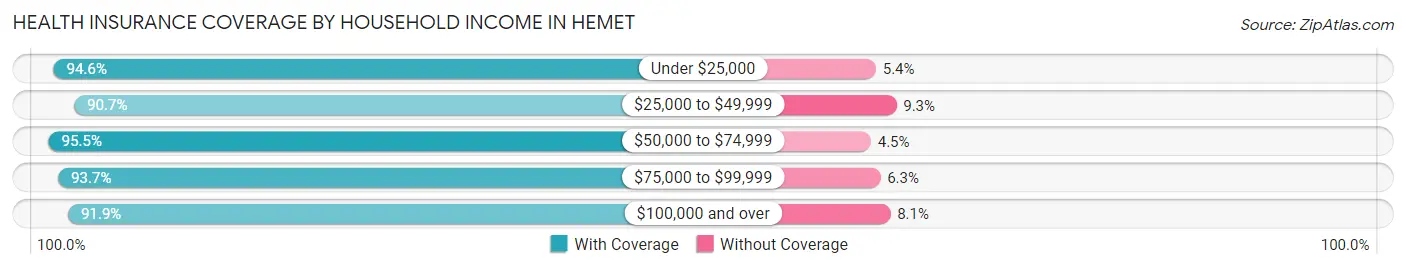
| Household Income | With Coverage | Without Coverage |
| Under $25,000 | 11,714 (94.6%) | 672 (5.4%) |
| $25,000 to $49,999 | 19,801 (90.7%) | 2,022 (9.3%) |
| $50,000 to $74,999 | 14,166 (95.5%) | 666 (4.5%) |
| $75,000 to $99,999 | 10,045 (93.7%) | 671 (6.3%) |
| $100,000 and over | 26,532 (91.9%) | 2,347 (8.1%) |
Public vs Private Health Insurance Coverage by Age in Hemet
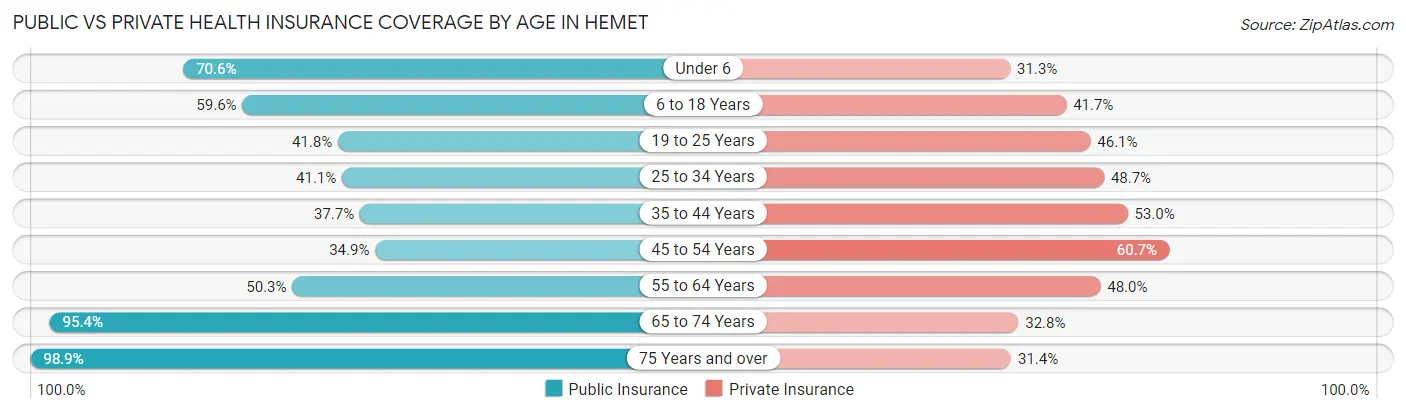
| Age Bracket | Public Insurance | Private Insurance |
| Under 6 | 4,540 (70.6%) | 2,011 (31.2%) |
| 6 to 18 Years | 9,731 (59.6%) | 6,804 (41.6%) |
| 19 to 25 Years | 2,977 (41.8%) | 3,285 (46.1%) |
| 25 to 34 Years | 4,272 (41.1%) | 5,062 (48.7%) |
| 35 to 44 Years | 3,850 (37.7%) | 5,411 (53.0%) |
| 45 to 54 Years | 2,989 (34.9%) | 5,196 (60.7%) |
| 55 to 64 Years | 5,172 (50.3%) | 4,934 (48.0%) |
| 65 to 74 Years | 9,810 (95.4%) | 3,370 (32.8%) |
| 75 Years and over | 9,151 (98.9%) | 2,905 (31.4%) |
| Total | 52,492 (59.1%) | 38,978 (43.9%) |
Disability Status by Sex by Age in Hemet
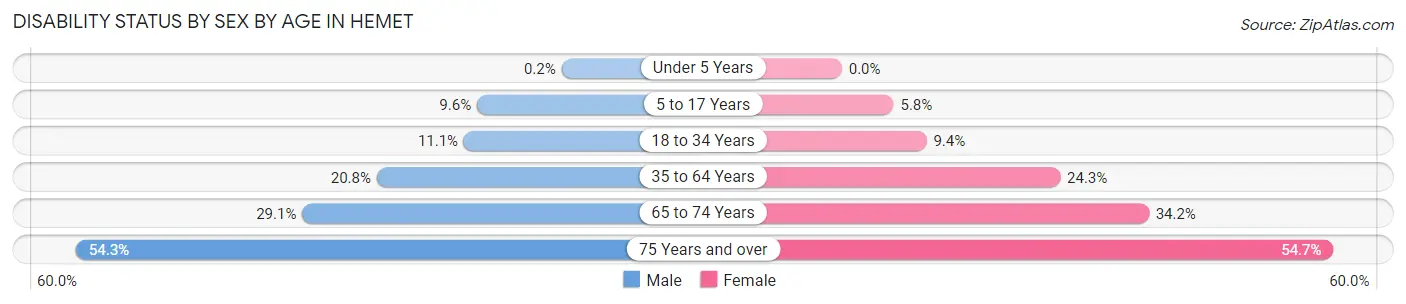
| Age Bracket | Male | Female |
| Under 5 Years | 5 (0.2%) | 0 (0.0%) |
| 5 to 17 Years | 846 (9.6%) | 429 (5.8%) |
| 18 to 34 Years | 1,062 (11.1%) | 859 (9.4%) |
| 35 to 64 Years | 2,882 (20.8%) | 3,691 (24.3%) |
| 65 to 74 Years | 1,423 (29.1%) | 1,844 (34.2%) |
| 75 Years and over | 2,017 (54.3%) | 3,028 (54.7%) |
Disability Class by Sex by Age in Hemet
Disability Class: Hearing Difficulty
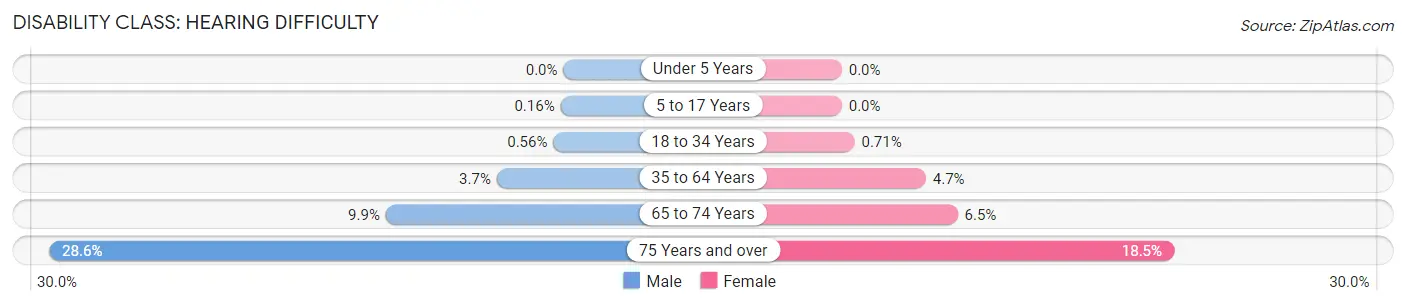
| Age Bracket | Male | Female |
| Under 5 Years | 0 (0.0%) | 0 (0.0%) |
| 5 to 17 Years | 14 (0.2%) | 0 (0.0%) |
| 18 to 34 Years | 54 (0.6%) | 65 (0.7%) |
| 35 to 64 Years | 514 (3.7%) | 711 (4.7%) |
| 65 to 74 Years | 484 (9.9%) | 348 (6.5%) |
| 75 Years and over | 1,064 (28.6%) | 1,023 (18.5%) |
Disability Class: Vision Difficulty
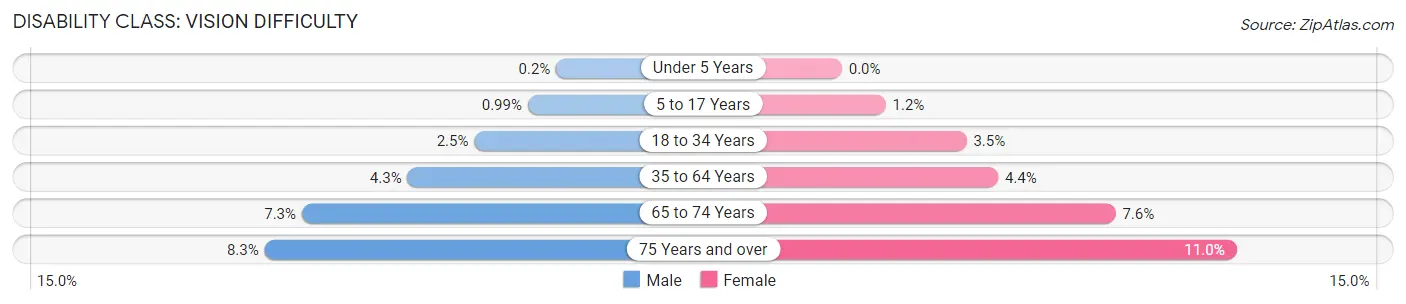
| Age Bracket | Male | Female |
| Under 5 Years | 5 (0.2%) | 0 (0.0%) |
| 5 to 17 Years | 87 (1.0%) | 91 (1.2%) |
| 18 to 34 Years | 238 (2.5%) | 316 (3.5%) |
| 35 to 64 Years | 602 (4.3%) | 660 (4.3%) |
| 65 to 74 Years | 356 (7.3%) | 411 (7.6%) |
| 75 Years and over | 309 (8.3%) | 608 (11.0%) |
Disability Class: Cognitive Difficulty
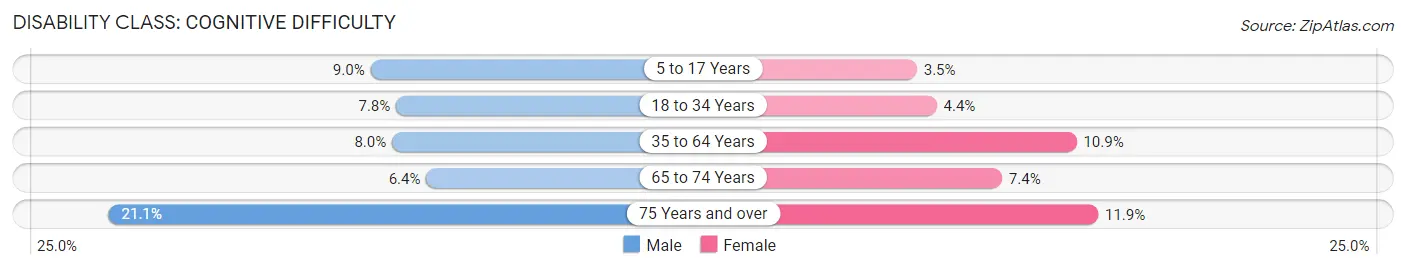
| Age Bracket | Male | Female |
| 5 to 17 Years | 787 (8.9%) | 259 (3.5%) |
| 18 to 34 Years | 745 (7.8%) | 401 (4.4%) |
| 35 to 64 Years | 1,103 (8.0%) | 1,653 (10.9%) |
| 65 to 74 Years | 311 (6.4%) | 401 (7.4%) |
| 75 Years and over | 784 (21.1%) | 658 (11.9%) |
Disability Class: Ambulatory Difficulty
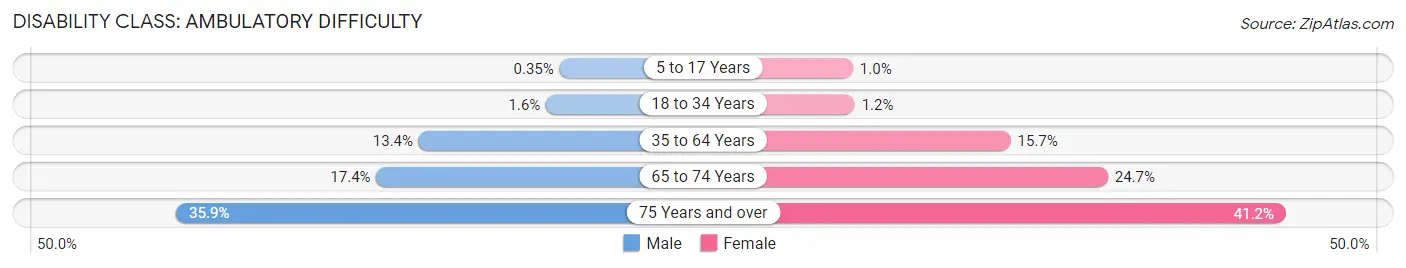
| Age Bracket | Male | Female |
| 5 to 17 Years | 31 (0.4%) | 77 (1.0%) |
| 18 to 34 Years | 153 (1.6%) | 109 (1.2%) |
| 35 to 64 Years | 1,860 (13.4%) | 2,377 (15.7%) |
| 65 to 74 Years | 849 (17.3%) | 1,332 (24.7%) |
| 75 Years and over | 1,335 (35.9%) | 2,280 (41.2%) |
Disability Class: Self-Care Difficulty
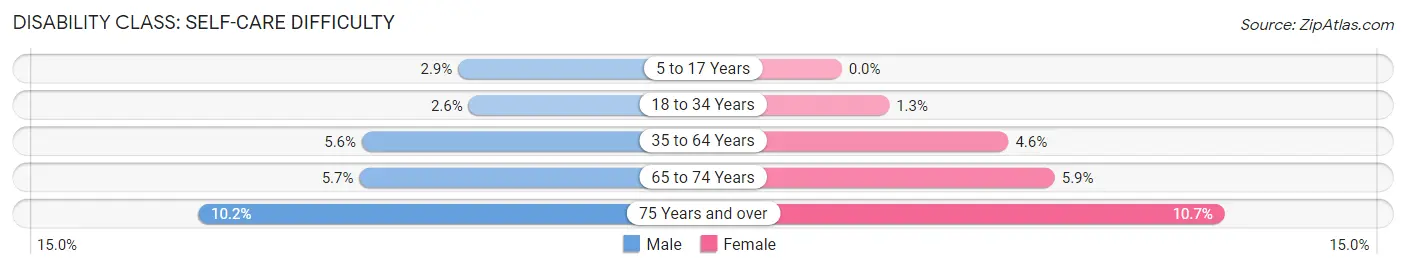
| Age Bracket | Male | Female |
| 5 to 17 Years | 258 (2.9%) | 0 (0.0%) |
| 18 to 34 Years | 253 (2.6%) | 120 (1.3%) |
| 35 to 64 Years | 778 (5.6%) | 704 (4.6%) |
| 65 to 74 Years | 278 (5.7%) | 320 (5.9%) |
| 75 Years and over | 378 (10.2%) | 590 (10.7%) |
Technology Access in Hemet
Computing Device Access in Hemet
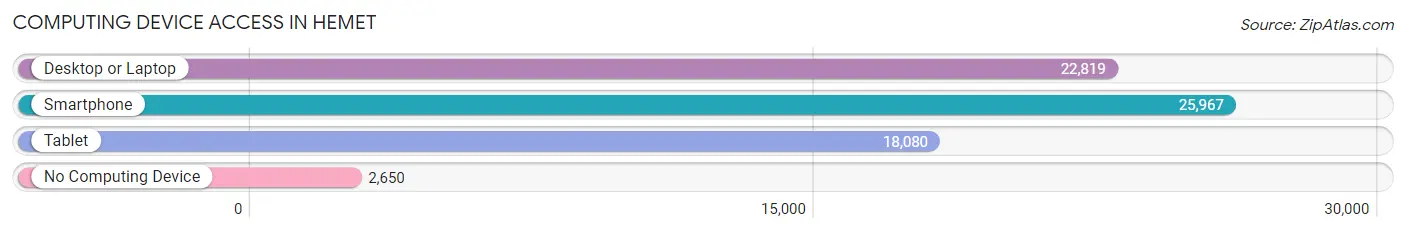
| Device Type | # Households | % Households |
| Desktop or Laptop | 22,819 | 73.7% |
| Smartphone | 25,967 | 83.9% |
| Tablet | 18,080 | 58.4% |
| No Computing Device | 2,650 | 8.6% |
| Total | 30,963 | 100.0% |
Internet Access in Hemet
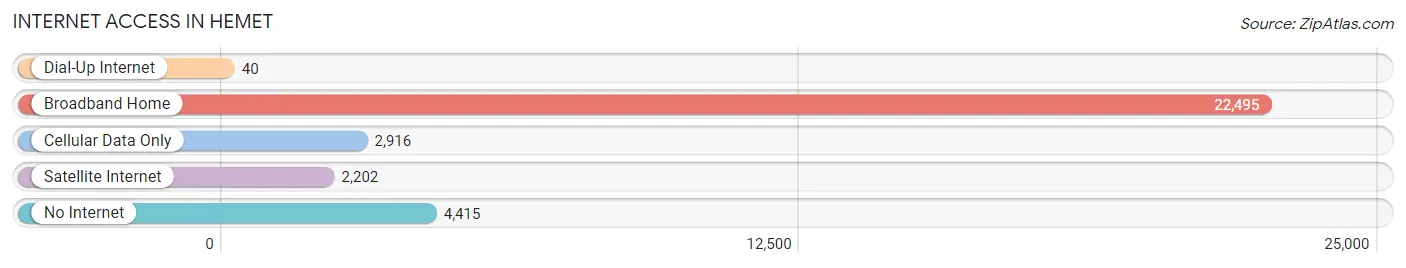
| Internet Type | # Households | % Households |
| Dial-Up Internet | 40 | 0.1% |
| Broadband Home | 22,495 | 72.7% |
| Cellular Data Only | 2,916 | 9.4% |
| Satellite Internet | 2,202 | 7.1% |
| No Internet | 4,415 | 14.3% |
| Total | 30,963 | 100.0% |
Hemet Summary
Hemet is a city located in Riverside County, California, United States. It is situated in the San Jacinto Valley, approximately 78 miles east of Los Angeles. The city is known for its hot springs, which have been used for centuries by the Cahuilla Indians. As of the 2010 census, the city had a population of 78,657, making it the largest city in the San Jacinto Valley.
Geography
Hemet is located at 33°45'N 116°54'W (33.75, -116.90). According to the United States Census Bureau, the city has a total area of 27.1 square miles (70.2 km2), of which, 27.1 square miles (70.2 km2) of it is land and 0.04 square miles (0.1 km2) of it (0.15%) is water.
Hemet is located in the San Jacinto Valley, which is surrounded by the San Jacinto Mountains to the west and the San Bernardino Mountains to the east. The valley floor is mostly flat and is composed of alluvial soils. The city is located at the base of the San Jacinto Mountains, which are part of the Peninsular Ranges.
Climate
Hemet has a hot-summer Mediterranean climate (Köppen climate classification Csa). The average high temperature in July is 95 °F (35 °C) and the average low temperature in January is 40 °F (4 °C). The average annual precipitation is 11.2 inches (284 mm).
Demographics
As of the census of 2000, there were 54,068 people, 19,859 households, and 14,848 families residing in the city. The population density was 2,010.3 people per square mile (775.2/km2). There were 21,835 housing units at an average density of 807.9 per square mile (311.7/km2). The racial makeup of the city was 78.6% White, 4.1% African American, 1.1% Native American, 1.6% Asian, 0.2% Pacific Islander, 11.9% from other races, and 3.5% from two or more races. Hispanic or Latino of any race were 25.8% of the population.
Economy
Hemet is home to a variety of industries, including manufacturing, retail, and healthcare. The city is also home to several major employers, including the Hemet Unified School District, the Hemet Valley Medical Center, and the Soboba Casino.
The city is also home to several small businesses, including restaurants, shops, and services. The city is also home to several wineries, including the Soboba Winery and the San Jacinto Winery.
The city is also home to several annual events, including the Hemet Car Show, the Hemet Valley Balloon Festival, and the Hemet Valley Music Festival.
Conclusion
Hemet is a city located in Riverside County, California, United States. It is situated in the San Jacinto Valley, approximately 78 miles east of Los Angeles. The city is known for its hot springs, which have been used for centuries by the Cahuilla Indians. As of the 2010 census, the city had a population of 78,657, making it the largest city in the San Jacinto Valley. Hemet has a hot-summer Mediterranean climate and is home to a variety of industries, including manufacturing, retail, and healthcare. The city is also home to several major employers, including the Hemet Unified School District, the Hemet Valley Medical Center, and the Soboba Casino. The city is also home to several small businesses, including restaurants, shops, and services. The city is also home to several annual events, including the Hemet Car Show, the Hemet Valley Balloon Festival, and the Hemet Valley Music Festival.
Common Questions
What is Per Capita Income in Hemet?
Per Capita income in Hemet is $26,043.
What is the Median Family Income in Hemet?
Median Family Income in Hemet is $58,768.
What is the Median Household income in Hemet?
Median Household Income in Hemet is $49,901.
What is Income or Wage Gap in Hemet?
Income or Wage Gap in Hemet is 31.8%.
Women in Hemet earn 68.2 cents for every dollar earned by a man.
What is Family Income Deficit in Hemet?
Family Income Deficit in Hemet is $10,852.
Families that are below poverty line in Hemet earn $10,852 less on average than the poverty threshold level.
What is Inequality or Gini Index in Hemet?
Inequality or Gini Index in Hemet is 0.46.
What is the Total Population of Hemet?
Total Population of Hemet is 89,651.
What is the Total Male Population of Hemet?
Total Male Population of Hemet is 43,793.
What is the Total Female Population of Hemet?
Total Female Population of Hemet is 45,858.
What is the Ratio of Males per 100 Females in Hemet?
There are 95.50 Males per 100 Females in Hemet.
What is the Ratio of Females per 100 Males in Hemet?
There are 104.72 Females per 100 Males in Hemet.
What is the Median Population Age in Hemet?
Median Population Age in Hemet is 39.0 Years.
What is the Average Family Size in Hemet
Average Family Size in Hemet is 3.5 People.
What is the Average Household Size in Hemet
Average Household Size in Hemet is 2.9 People.
How Large is the Labor Force in Hemet?
There are 34,908 People in the Labor Forcein in Hemet.
What is the Percentage of People in the Labor Force in Hemet?
49.4% of People are in the Labor Force in Hemet.
What is the Unemployment Rate in Hemet?
Unemployment Rate in Hemet is 9.5%.