Billings, MT Map & Demographics
Billings Map
Billings Overview
$40,679
PER CAPITA INCOME
$91,082
AVG FAMILY INCOME
$69,692
AVG HOUSEHOLD INCOME
25.3%
WAGE / INCOME GAP [ % ]
74.7¢/ $1
WAGE / INCOME GAP [ $ ]
$10,046
FAMILY INCOME DEFICIT
0.46
INEQUALITY / GINI INDEX
117,093
TOTAL POPULATION
57,907
MALE POPULATION
59,186
FEMALE POPULATION
97.84
MALES / 100 FEMALES
102.21
FEMALES / 100 MALES
37.7
MEDIAN AGE
3.0
AVG FAMILY SIZE
2.3
AVG HOUSEHOLD SIZE
62,311
LABOR FORCE [ PEOPLE ]
66.5%
PERCENT IN LABOR FORCE
3.6%
UNEMPLOYMENT RATE
Billings Area Codes
Income in Billings
Income Overview in Billings
Per Capita Income in Billings is $40,679, while median incomes of families and households are $91,082 and $69,692 respectively.
| Characteristic | Number | Measure |
| Per Capita Income | 117,093 | $40,679 |
| Median Family Income | 28,199 | $91,082 |
| Mean Family Income | 28,199 | $119,955 |
| Median Household Income | 49,228 | $69,692 |
| Mean Household Income | 49,228 | $95,066 |
| Income Deficit | 28,199 | $10,046 |
| Wage / Income Gap (%) | 117,093 | 25.29% |
| Wage / Income Gap ($) | 117,093 | 74.71¢ per $1 |
| Gini / Inequality Index | 117,093 | 0.46 |
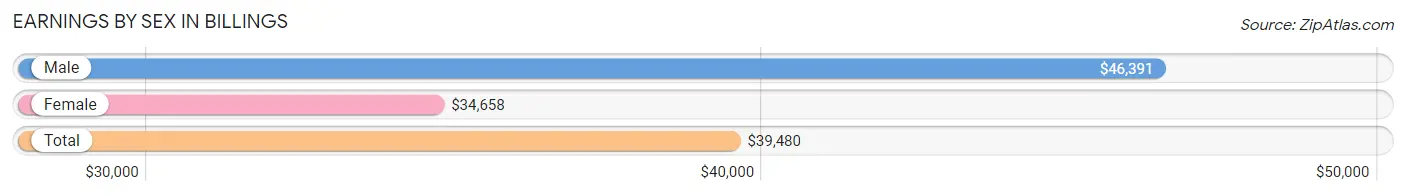
Earnings by Sex in Billings
Average Earnings in Billings are $39,480, $46,391 for men and $34,658 for women, a difference of 25.3%.
| Sex | Number | Average Earnings |
| Male | 34,252 (51.6%) | $46,391 |
| Female | 32,148 (48.4%) | $34,658 |
| Total | 66,400 (100.0%) | $39,480 |
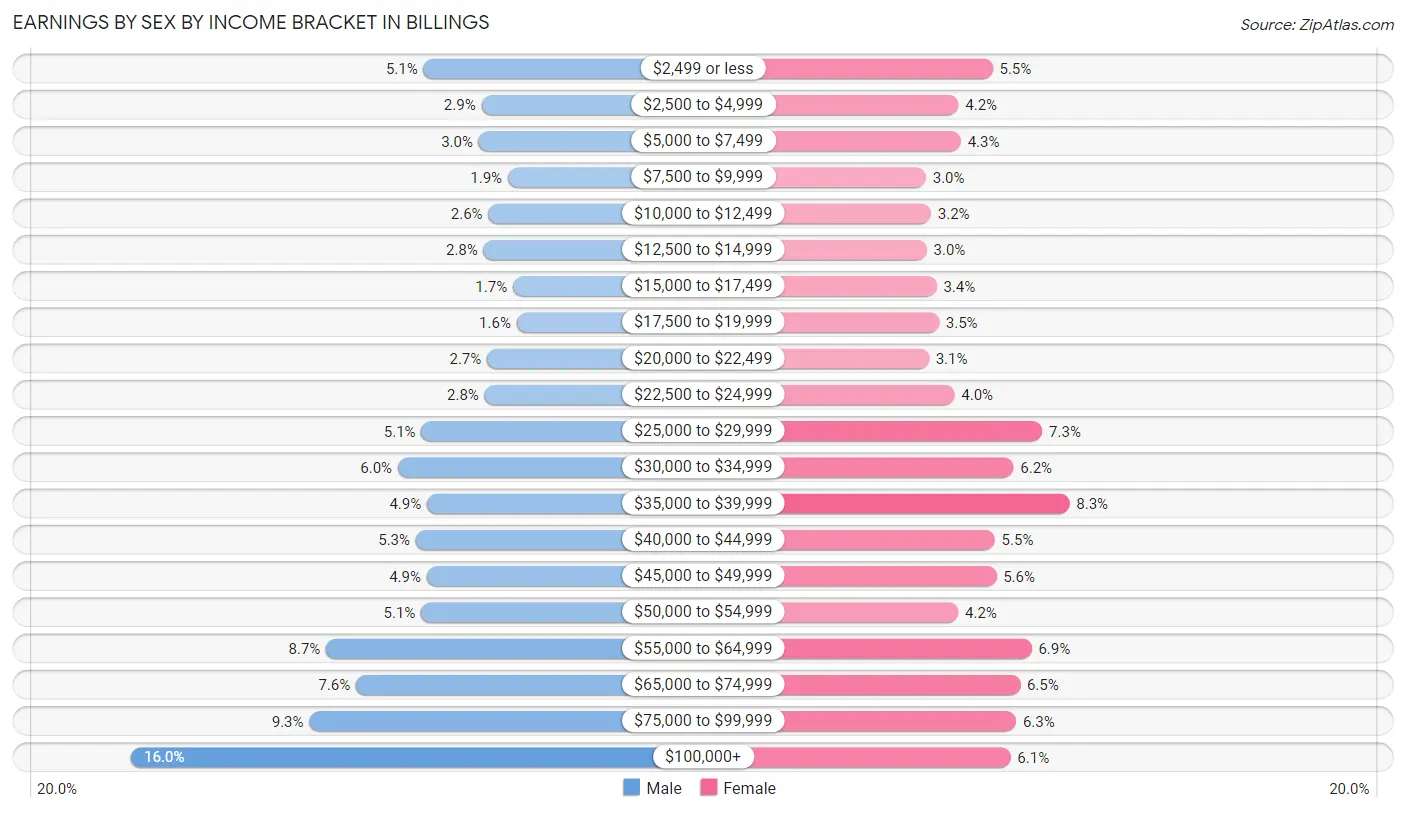
Earnings by Sex by Income Bracket in Billings
The most common earnings brackets in Billings are $100,000+ for men (5,483 | 16.0%) and $35,000 to $39,999 for women (2,682 | 8.3%).
| Income | Male | Female |
| $2,499 or less | 1,731 (5.1%) | 1,756 (5.5%) |
| $2,500 to $4,999 | 987 (2.9%) | 1,344 (4.2%) |
| $5,000 to $7,499 | 1,021 (3.0%) | 1,374 (4.3%) |
| $7,500 to $9,999 | 648 (1.9%) | 951 (3.0%) |
| $10,000 to $12,499 | 896 (2.6%) | 1,014 (3.2%) |
| $12,500 to $14,999 | 958 (2.8%) | 960 (3.0%) |
| $15,000 to $17,499 | 581 (1.7%) | 1,080 (3.4%) |
| $17,500 to $19,999 | 534 (1.6%) | 1,108 (3.5%) |
| $20,000 to $22,499 | 915 (2.7%) | 986 (3.1%) |
| $22,500 to $24,999 | 946 (2.8%) | 1,295 (4.0%) |
| $25,000 to $29,999 | 1,758 (5.1%) | 2,353 (7.3%) |
| $30,000 to $34,999 | 2,059 (6.0%) | 2,005 (6.2%) |
| $35,000 to $39,999 | 1,686 (4.9%) | 2,682 (8.3%) |
| $40,000 to $44,999 | 1,828 (5.3%) | 1,780 (5.5%) |
| $45,000 to $49,999 | 1,690 (4.9%) | 1,799 (5.6%) |
| $50,000 to $54,999 | 1,761 (5.1%) | 1,342 (4.2%) |
| $55,000 to $64,999 | 2,980 (8.7%) | 2,225 (6.9%) |
| $65,000 to $74,999 | 2,596 (7.6%) | 2,086 (6.5%) |
| $75,000 to $99,999 | 3,194 (9.3%) | 2,037 (6.3%) |
| $100,000+ | 5,483 (16.0%) | 1,971 (6.1%) |
| Total | 34,252 (100.0%) | 32,148 (100.0%) |
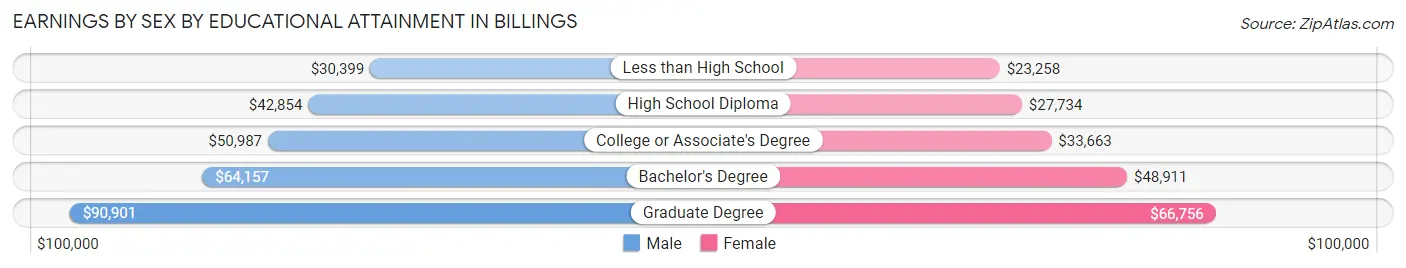
Earnings by Sex by Educational Attainment in Billings
Average earnings in Billings are $53,471 for men and $38,452 for women, a difference of 28.1%. Men with an educational attainment of graduate degree enjoy the highest average annual earnings of $90,901, while those with less than high school education earn the least with $30,399. Women with an educational attainment of graduate degree earn the most with the average annual earnings of $66,756, while those with less than high school education have the smallest earnings of $23,258.
| Educational Attainment | Male Income | Female Income |
| Less than High School | $30,399 | $23,258 |
| High School Diploma | $42,854 | $27,734 |
| College or Associate's Degree | $50,987 | $33,663 |
| Bachelor's Degree | $64,157 | $48,911 |
| Graduate Degree | $90,901 | $66,756 |
| Total | $53,471 | $38,452 |
Family Income in Billings
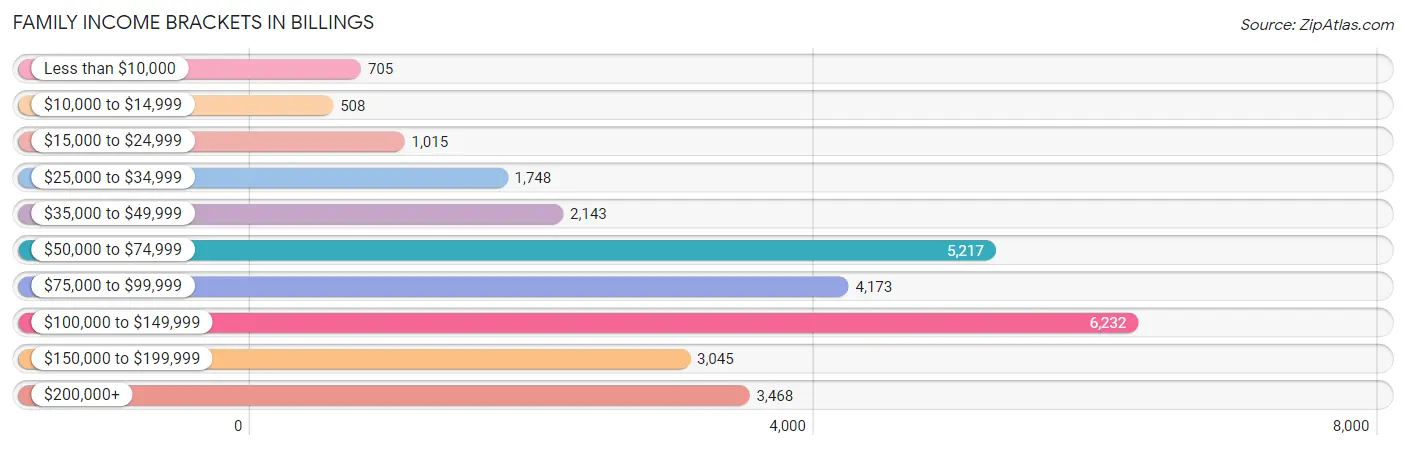
Family Income Brackets in Billings
According to the Billings family income data, there are 6,232 families falling into the $100,000 to $149,999 income range, which is the most common income bracket and makes up 22.1% of all families. Conversely, the $10,000 to $14,999 income bracket is the least frequent group with only 508 families (1.8%) belonging to this category.
| Income Bracket | # Families | % Families |
| Less than $10,000 | 705 | 2.5% |
| $10,000 to $14,999 | 508 | 1.8% |
| $15,000 to $24,999 | 1,015 | 3.6% |
| $25,000 to $34,999 | 1,748 | 6.2% |
| $35,000 to $49,999 | 2,143 | 7.6% |
| $50,000 to $74,999 | 5,217 | 18.5% |
| $75,000 to $99,999 | 4,173 | 14.8% |
| $100,000 to $149,999 | 6,232 | 22.1% |
| $150,000 to $199,999 | 3,045 | 10.8% |
| $200,000+ | 3,468 | 12.3% |
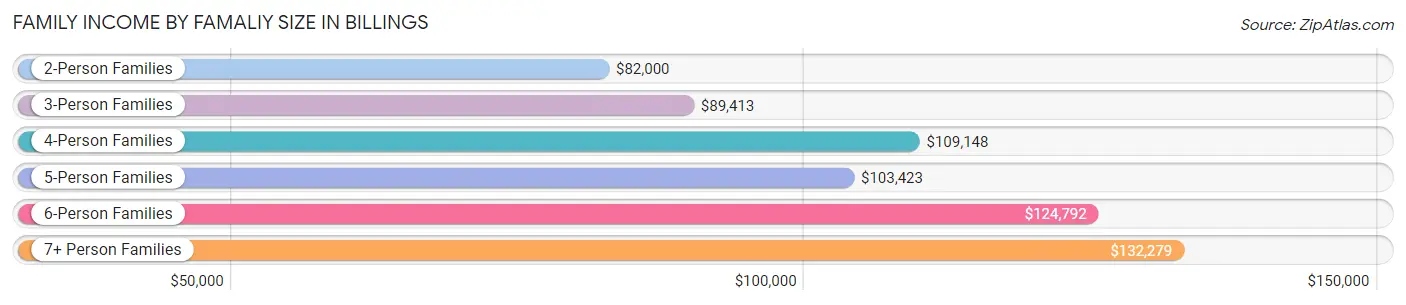
Family Income by Famaliy Size in Billings
7+ person families (621 | 2.2%) account for the highest median family income in Billings with $132,279 per family, while 2-person families (14,520 | 51.5%) have the highest median income of $41,000 per family member.
| Income Bracket | # Families | Median Income |
| 2-Person Families | 14,520 (51.5%) | $82,000 |
| 3-Person Families | 5,597 (19.9%) | $89,413 |
| 4-Person Families | 4,625 (16.4%) | $109,148 |
| 5-Person Families | 2,219 (7.9%) | $103,423 |
| 6-Person Families | 617 (2.2%) | $124,792 |
| 7+ Person Families | 621 (2.2%) | $132,279 |
| Total | 28,199 (100.0%) | $91,082 |
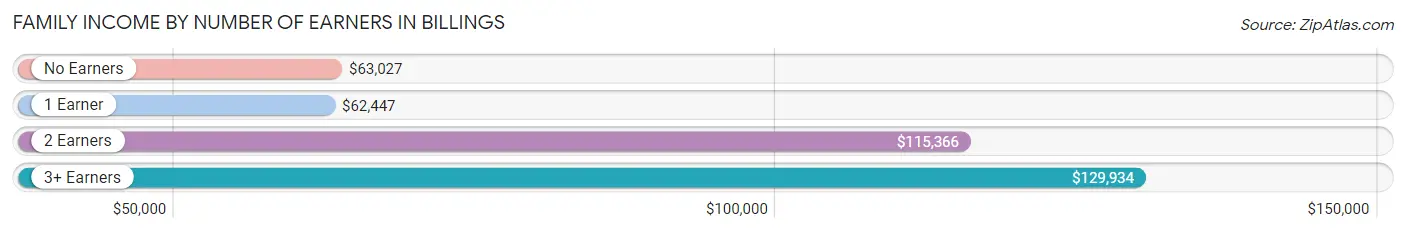
Family Income by Number of Earners in Billings
The median family income in Billings is $91,082, with families comprising 3+ earners (2,577) having the highest median family income of $129,934, while families with 1 earner (8,550) have the lowest median family income of $62,447, accounting for 9.1% and 30.3% of families, respectively.
| Number of Earners | # Families | Median Income |
| No Earners | 4,073 (14.4%) | $63,027 |
| 1 Earner | 8,550 (30.3%) | $62,447 |
| 2 Earners | 12,999 (46.1%) | $115,366 |
| 3+ Earners | 2,577 (9.1%) | $129,934 |
| Total | 28,199 (100.0%) | $91,082 |
Household Income in Billings
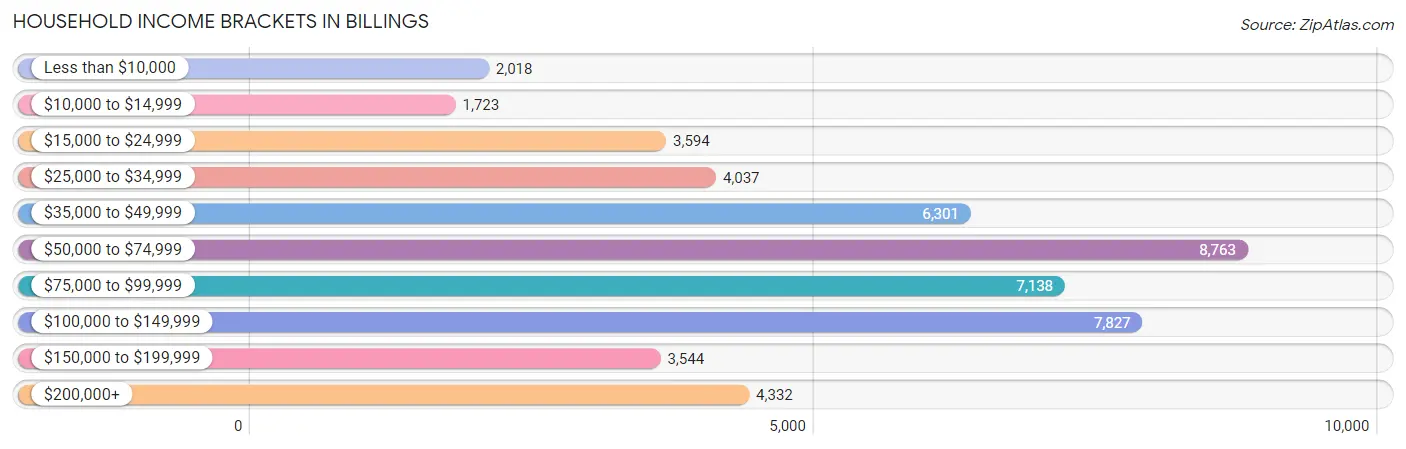
Household Income Brackets in Billings
With 8,763 households falling in the category, the $50,000 to $74,999 income range is the most frequent in Billings, accounting for 17.8% of all households. In contrast, only 1,723 households (3.5%) fall into the $10,000 to $14,999 income bracket, making it the least populous group.
| Income Bracket | # Households | % Households |
| Less than $10,000 | 2,018 | 4.1% |
| $10,000 to $14,999 | 1,723 | 3.5% |
| $15,000 to $24,999 | 3,594 | 7.3% |
| $25,000 to $34,999 | 4,037 | 8.2% |
| $35,000 to $49,999 | 6,301 | 12.8% |
| $50,000 to $74,999 | 8,763 | 17.8% |
| $75,000 to $99,999 | 7,138 | 14.5% |
| $100,000 to $149,999 | 7,827 | 15.9% |
| $150,000 to $199,999 | 3,544 | 7.2% |
| $200,000+ | 4,332 | 8.8% |
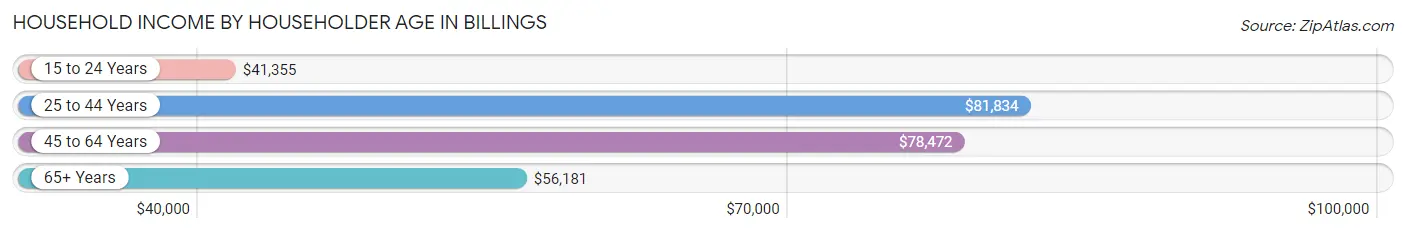
Household Income by Householder Age in Billings
The median household income in Billings is $69,692, with the highest median household income of $81,834 found in the 25 to 44 years age bracket for the primary householder. A total of 17,301 households (35.1%) fall into this category. Meanwhile, the 15 to 24 years age bracket for the primary householder has the lowest median household income of $41,355, with 2,744 households (5.6%) in this group.
| Income Bracket | # Households | Median Income |
| 15 to 24 Years | 2,744 (5.6%) | $41,355 |
| 25 to 44 Years | 17,301 (35.1%) | $81,834 |
| 45 to 64 Years | 15,478 (31.4%) | $78,472 |
| 65+ Years | 13,705 (27.8%) | $56,181 |
| Total | 49,228 (100.0%) | $69,692 |
Poverty in Billings
Income Below Poverty by Sex and Age in Billings
With 10.6% poverty level for males and 11.6% for females among the residents of Billings, 5 year old males and 6 to 11 year old females are the most vulnerable to poverty, with 84 males (17.8%) and 852 females (19.8%) in their respective age groups living below the poverty level.
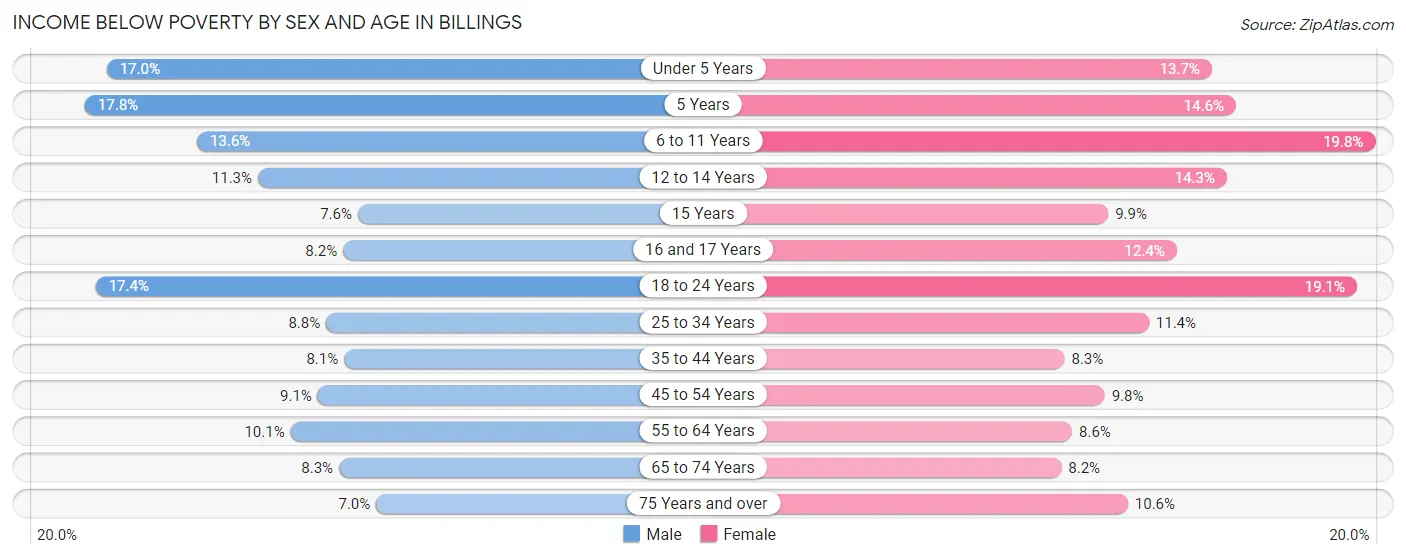
| Age Bracket | Male | Female |
| Under 5 Years | 601 (17.0%) | 438 (13.7%) |
| 5 Years | 84 (17.8%) | 163 (14.6%) |
| 6 to 11 Years | 665 (13.6%) | 852 (19.8%) |
| 12 to 14 Years | 240 (11.3%) | 277 (14.3%) |
| 15 Years | 47 (7.6%) | 75 (9.9%) |
| 16 and 17 Years | 143 (8.2%) | 173 (12.4%) |
| 18 to 24 Years | 862 (17.4%) | 943 (19.1%) |
| 25 to 34 Years | 727 (8.8%) | 919 (11.4%) |
| 35 to 44 Years | 646 (8.1%) | 637 (8.3%) |
| 45 to 54 Years | 571 (9.1%) | 554 (9.8%) |
| 55 to 64 Years | 686 (10.1%) | 607 (8.6%) |
| 65 to 74 Years | 464 (8.3%) | 510 (8.2%) |
| 75 Years and over | 230 (7.0%) | 550 (10.6%) |
| Total | 5,966 (10.6%) | 6,698 (11.6%) |
Income Above Poverty by Sex and Age in Billings
According to the poverty statistics in Billings, males aged 75 years and over and females aged 65 to 74 years are the age groups that are most secure financially, with 93.0% of males and 91.8% of females in these age groups living above the poverty line.
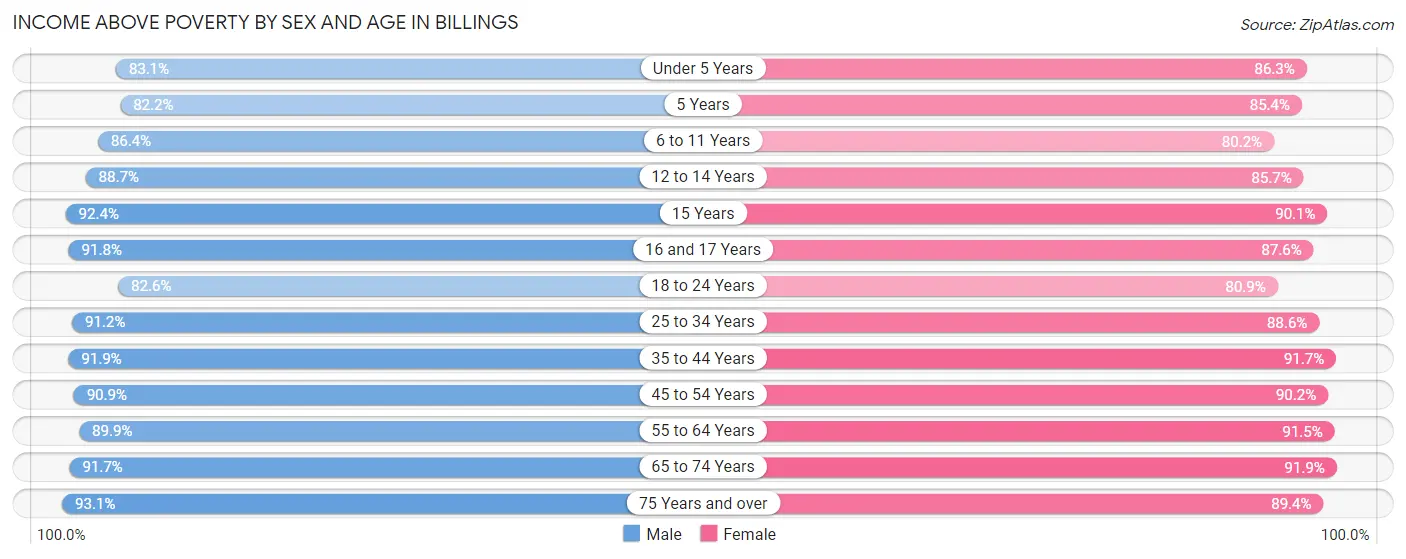
| Age Bracket | Male | Female |
| Under 5 Years | 2,944 (83.1%) | 2,751 (86.3%) |
| 5 Years | 389 (82.2%) | 951 (85.4%) |
| 6 to 11 Years | 4,225 (86.4%) | 3,451 (80.2%) |
| 12 to 14 Years | 1,876 (88.7%) | 1,662 (85.7%) |
| 15 Years | 569 (92.4%) | 683 (90.1%) |
| 16 and 17 Years | 1,606 (91.8%) | 1,219 (87.6%) |
| 18 to 24 Years | 4,103 (82.6%) | 3,990 (80.9%) |
| 25 to 34 Years | 7,524 (91.2%) | 7,139 (88.6%) |
| 35 to 44 Years | 7,289 (91.9%) | 7,064 (91.7%) |
| 45 to 54 Years | 5,693 (90.9%) | 5,121 (90.2%) |
| 55 to 64 Years | 6,083 (89.9%) | 6,493 (91.4%) |
| 65 to 74 Years | 5,106 (91.7%) | 5,749 (91.8%) |
| 75 Years and over | 3,078 (93.0%) | 4,630 (89.4%) |
| Total | 50,485 (89.4%) | 50,903 (88.4%) |
Income Below Poverty Among Married-Couple Families in Billings
The poverty statistics for married-couple families in Billings show that 3.4% or 717 of the total 21,343 families live below the poverty line. Families with 5 or more children have the highest poverty rate of 12.6%, comprising of 27 families. On the other hand, families with no children have the lowest poverty rate of 3.1%, which includes 379 families.
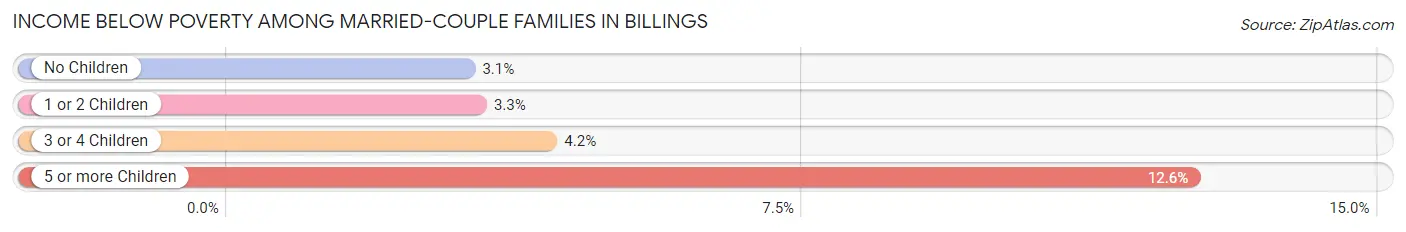
| Children | Above Poverty | Below Poverty |
| No Children | 11,857 (96.9%) | 379 (3.1%) |
| 1 or 2 Children | 6,308 (96.8%) | 212 (3.3%) |
| 3 or 4 Children | 2,273 (95.8%) | 99 (4.2%) |
| 5 or more Children | 188 (87.4%) | 27 (12.6%) |
| Total | 20,626 (96.6%) | 717 (3.4%) |
Income Below Poverty Among Single-Parent Households in Billings
According to the poverty data in Billings, 13.4% or 365 single-father households and 24.7% or 1,024 single-mother households are living below the poverty line. Among single-father households, those with 5 or more children have the highest poverty rate, with 70 households (100.0%) experiencing poverty. Likewise, among single-mother households, those with 5 or more children have the highest poverty rate, with 101 households (100.0%) falling below the poverty line.
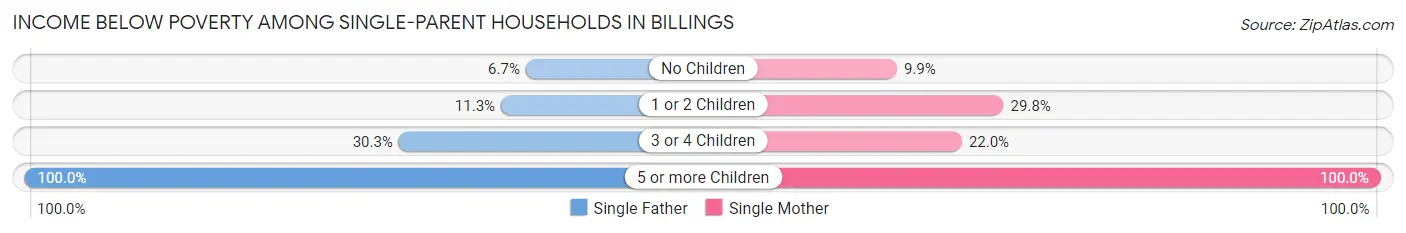
| Children | Single Father | Single Mother |
| No Children | 57 (6.7%) | 126 (9.9%) |
| 1 or 2 Children | 181 (11.3%) | 719 (29.8%) |
| 3 or 4 Children | 57 (30.3%) | 78 (22.0%) |
| 5 or more Children | 70 (100.0%) | 101 (100.0%) |
| Total | 365 (13.4%) | 1,024 (24.7%) |
Income Below Poverty Among Married-Couple vs Single-Parent Households in Billings
The poverty data for Billings shows that 717 of the married-couple family households (3.4%) and 1,389 of the single-parent households (20.3%) are living below the poverty level. Within the married-couple family households, those with 5 or more children have the highest poverty rate, with 27 households (12.6%) falling below the poverty line. Among the single-parent households, those with 5 or more children have the highest poverty rate, with 171 household (100.0%) living below poverty.
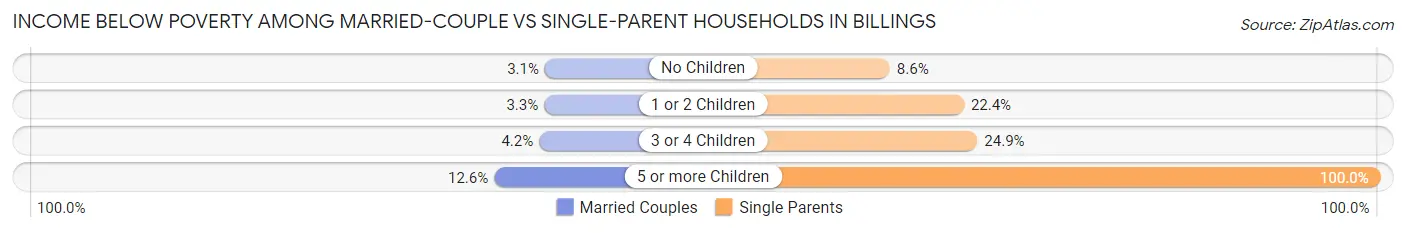
| Children | Married-Couple Families | Single-Parent Households |
| No Children | 379 (3.1%) | 183 (8.6%) |
| 1 or 2 Children | 212 (3.3%) | 900 (22.4%) |
| 3 or 4 Children | 99 (4.2%) | 135 (24.9%) |
| 5 or more Children | 27 (12.6%) | 171 (100.0%) |
| Total | 717 (3.4%) | 1,389 (20.3%) |
Race in Billings
The most populous races in Billings are White / Caucasian (101,714 | 86.9%), Hispanic or Latino (8,258 | 7.0%), and Two or more Races (6,256 | 5.3%).
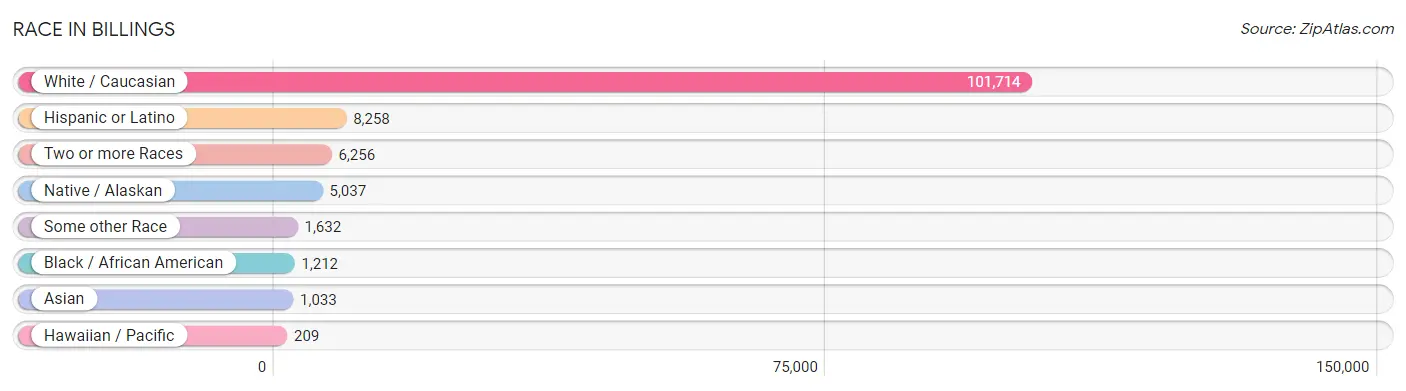
| Race | # Population | % Population |
| Asian | 1,033 | 0.9% |
| Black / African American | 1,212 | 1.0% |
| Hawaiian / Pacific | 209 | 0.2% |
| Hispanic or Latino | 8,258 | 7.0% |
| Native / Alaskan | 5,037 | 4.3% |
| White / Caucasian | 101,714 | 86.9% |
| Two or more Races | 6,256 | 5.3% |
| Some other Race | 1,632 | 1.4% |
| Total | 117,093 | 100.0% |
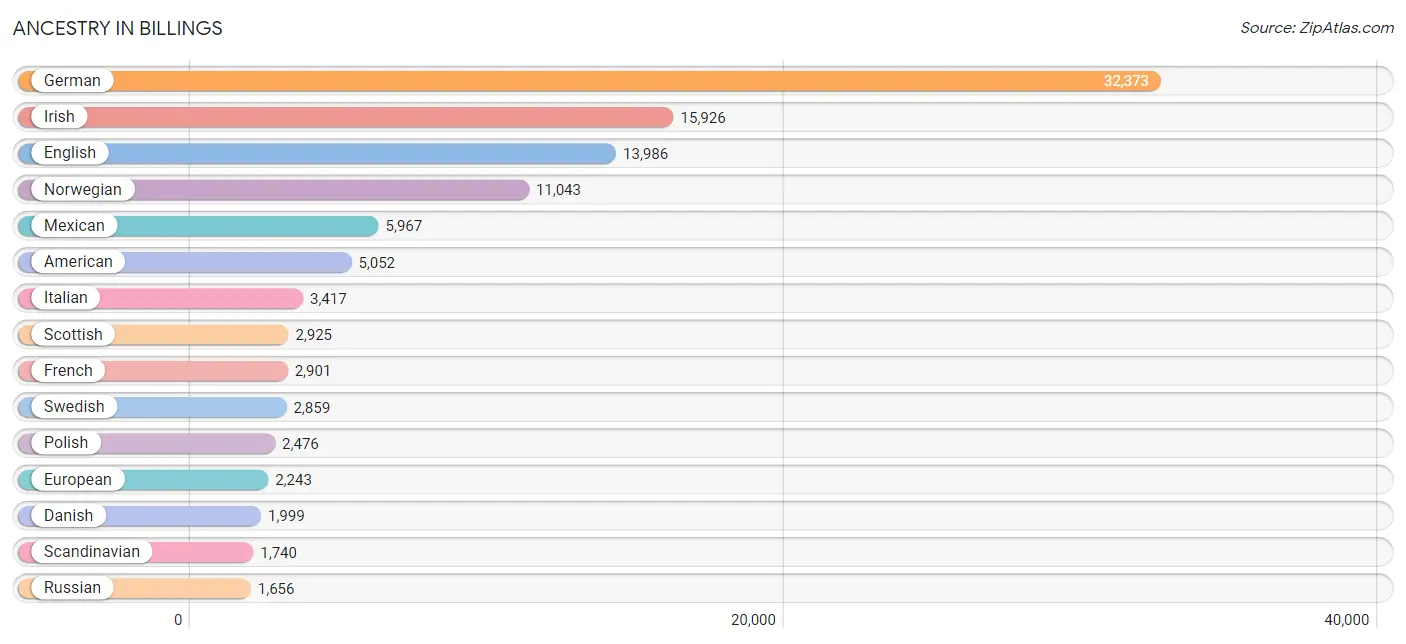
Ancestry in Billings
The most populous ancestries reported in Billings are German (32,373 | 27.7%), Irish (15,926 | 13.6%), English (13,986 | 11.9%), Norwegian (11,043 | 9.4%), and Mexican (5,967 | 5.1%), together accounting for 67.7% of all Billings residents.
| Ancestry | # Population | % Population |
| Afghan | 5 | 0.0% |
| African | 236 | 0.2% |
| Alaskan Athabascan | 13 | 0.0% |
| Albanian | 3 | 0.0% |
| American | 5,052 | 4.3% |
| Apache | 124 | 0.1% |
| Arab | 98 | 0.1% |
| Arapaho | 70 | 0.1% |
| Argentinean | 138 | 0.1% |
| Australian | 20 | 0.0% |
| Austrian | 243 | 0.2% |
| Basque | 42 | 0.0% |
| Belgian | 272 | 0.2% |
| Bhutanese | 471 | 0.4% |
| Blackfeet | 391 | 0.3% |
| Bolivian | 7 | 0.0% |
| Brazilian | 17 | 0.0% |
| British | 704 | 0.6% |
| Bulgarian | 62 | 0.1% |
| Burmese | 213 | 0.2% |
| Canadian | 404 | 0.4% |
| Central American | 49 | 0.0% |
| Cherokee | 264 | 0.2% |
| Cheyenne | 1,030 | 0.9% |
| Chippewa | 418 | 0.4% |
| Choctaw | 28 | 0.0% |
| Colombian | 94 | 0.1% |
| Colville | 23 | 0.0% |
| Cree | 82 | 0.1% |
| Creek | 6 | 0.0% |
| Croatian | 185 | 0.2% |
| Crow | 1,509 | 1.3% |
| Cuban | 127 | 0.1% |
| Czech | 777 | 0.7% |
| Czechoslovakian | 157 | 0.1% |
| Danish | 1,999 | 1.7% |
| Dominican | 72 | 0.1% |
| Dutch | 1,627 | 1.4% |
| Eastern European | 192 | 0.2% |
| English | 13,986 | 11.9% |
| Ethiopian | 9 | 0.0% |
| European | 2,243 | 1.9% |
| Fijian | 186 | 0.2% |
| Finnish | 717 | 0.6% |
| French | 2,901 | 2.5% |
| French Canadian | 718 | 0.6% |
| German | 32,373 | 27.7% |
| Greek | 254 | 0.2% |
| Guamanian / Chamorro | 6 | 0.0% |
| Guatemalan | 17 | 0.0% |
| Guyanese | 39 | 0.0% |
| Haitian | 76 | 0.1% |
| Hungarian | 281 | 0.2% |
| Icelander | 15 | 0.0% |
| Indian (Asian) | 355 | 0.3% |
| Inupiat | 58 | 0.1% |
| Iranian | 33 | 0.0% |
| Irish | 15,926 | 13.6% |
| Iroquois | 30 | 0.0% |
| Italian | 3,417 | 2.9% |
| Jamaican | 33 | 0.0% |
| Japanese | 3 | 0.0% |
| Korean | 488 | 0.4% |
| Latvian | 4 | 0.0% |
| Lebanese | 21 | 0.0% |
| Lithuanian | 95 | 0.1% |
| Lumbee | 13 | 0.0% |
| Luxembourger | 29 | 0.0% |
| Mexican | 5,967 | 5.1% |
| Mexican American Indian | 28 | 0.0% |
| Mongolian | 15 | 0.0% |
| Native Hawaiian | 162 | 0.1% |
| Navajo | 221 | 0.2% |
| New Zealander | 16 | 0.0% |
| Nigerian | 26 | 0.0% |
| Northern European | 464 | 0.4% |
| Norwegian | 11,043 | 9.4% |
| Panamanian | 32 | 0.0% |
| Pennsylvania German | 35 | 0.0% |
| Peruvian | 53 | 0.1% |
| Polish | 2,476 | 2.1% |
| Portuguese | 294 | 0.3% |
| Potawatomi | 78 | 0.1% |
| Puerto Rican | 249 | 0.2% |
| Puget Sound Salish | 7 | 0.0% |
| Romanian | 23 | 0.0% |
| Russian | 1,656 | 1.4% |
| Samoan | 342 | 0.3% |
| Scandinavian | 1,740 | 1.5% |
| Scotch-Irish | 1,375 | 1.2% |
| Scottish | 2,925 | 2.5% |
| Serbian | 333 | 0.3% |
| Shoshone | 71 | 0.1% |
| Sioux | 199 | 0.2% |
| Slavic | 125 | 0.1% |
| Slovak | 102 | 0.1% |
| Slovene | 103 | 0.1% |
| South American | 292 | 0.3% |
| Spaniard | 787 | 0.7% |
| Spanish | 415 | 0.4% |
| Spanish American | 7 | 0.0% |
| Sri Lankan | 419 | 0.4% |
| Subsaharan African | 276 | 0.2% |
| Swedish | 2,859 | 2.4% |
| Swiss | 391 | 0.3% |
| Thai | 57 | 0.1% |
| Tohono O'Odham | 4 | 0.0% |
| Turkish | 9 | 0.0% |
| Ukrainian | 214 | 0.2% |
| Ute | 30 | 0.0% |
| Welsh | 753 | 0.6% |
| West Indian | 47 | 0.0% |
| Yugoslavian | 248 | 0.2% | View All 113 Rows |
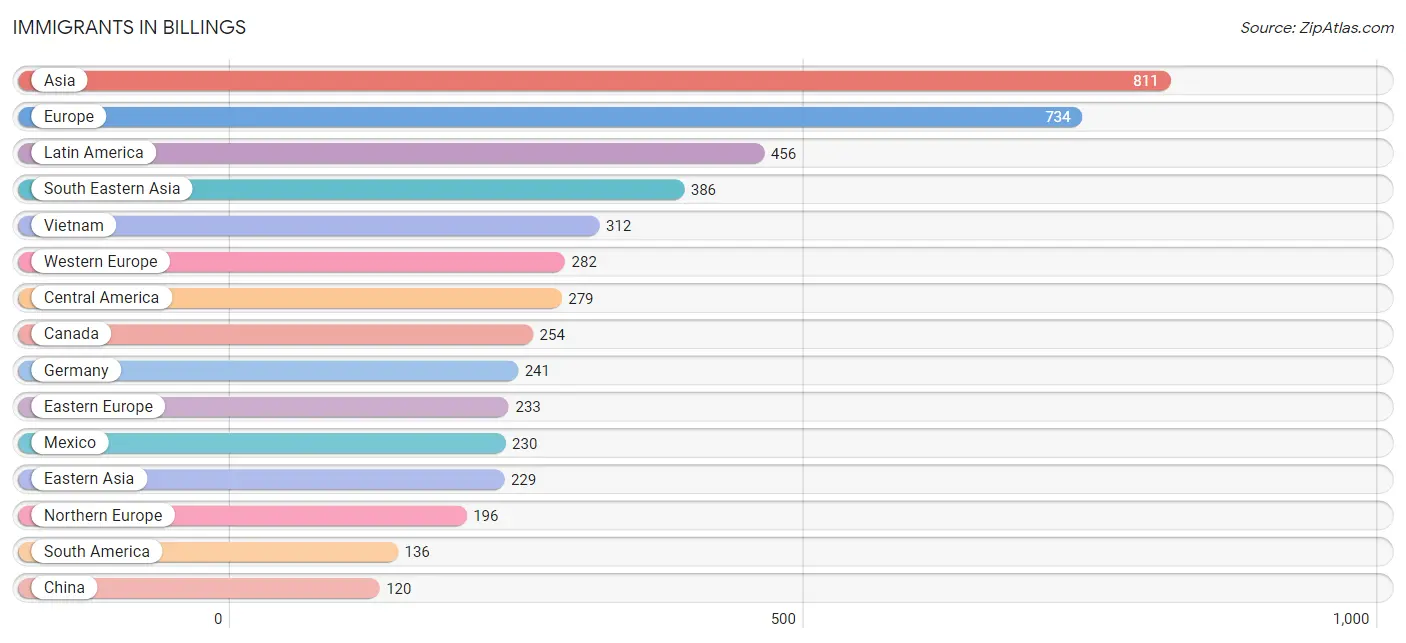
Immigrants in Billings
The most numerous immigrant groups reported in Billings came from Asia (811 | 0.7%), Europe (734 | 0.6%), Latin America (456 | 0.4%), South Eastern Asia (386 | 0.3%), and Vietnam (312 | 0.3%), together accounting for 2.3% of all Billings residents.
| Immigration Origin | # Population | % Population |
| Africa | 9 | 0.0% |
| Albania | 3 | 0.0% |
| Asia | 811 | 0.7% |
| Australia | 55 | 0.1% |
| Bolivia | 7 | 0.0% |
| Brazil | 30 | 0.0% |
| Bulgaria | 20 | 0.0% |
| Canada | 254 | 0.2% |
| Caribbean | 41 | 0.0% |
| Central America | 279 | 0.2% |
| Chile | 8 | 0.0% |
| China | 120 | 0.1% |
| Colombia | 29 | 0.0% |
| Czechoslovakia | 10 | 0.0% |
| Dominican Republic | 41 | 0.0% |
| Eastern Africa | 9 | 0.0% |
| Eastern Asia | 229 | 0.2% |
| Eastern Europe | 233 | 0.2% |
| England | 25 | 0.0% |
| Ethiopia | 9 | 0.0% |
| Europe | 734 | 0.6% |
| France | 11 | 0.0% |
| Germany | 241 | 0.2% |
| Guatemala | 17 | 0.0% |
| Guyana | 12 | 0.0% |
| Hong Kong | 53 | 0.1% |
| India | 39 | 0.0% |
| Indonesia | 4 | 0.0% |
| Iran | 3 | 0.0% |
| Iraq | 41 | 0.0% |
| Ireland | 53 | 0.1% |
| Italy | 23 | 0.0% |
| Japan | 53 | 0.1% |
| Korea | 56 | 0.1% |
| Latin America | 456 | 0.4% |
| Malaysia | 4 | 0.0% |
| Mexico | 230 | 0.2% |
| Netherlands | 9 | 0.0% |
| Northern Europe | 196 | 0.2% |
| Oceania | 110 | 0.1% |
| Panama | 32 | 0.0% |
| Peru | 50 | 0.0% |
| Philippines | 66 | 0.1% |
| Poland | 15 | 0.0% |
| Romania | 36 | 0.0% |
| Russia | 112 | 0.1% |
| Saudi Arabia | 79 | 0.1% |
| South America | 136 | 0.1% |
| South Central Asia | 76 | 0.1% |
| South Eastern Asia | 386 | 0.3% |
| Southern Europe | 23 | 0.0% |
| Sweden | 7 | 0.0% |
| Switzerland | 21 | 0.0% |
| Ukraine | 37 | 0.0% |
| Vietnam | 312 | 0.3% |
| Western Asia | 120 | 0.1% |
| Western Europe | 282 | 0.2% | View All 57 Rows |
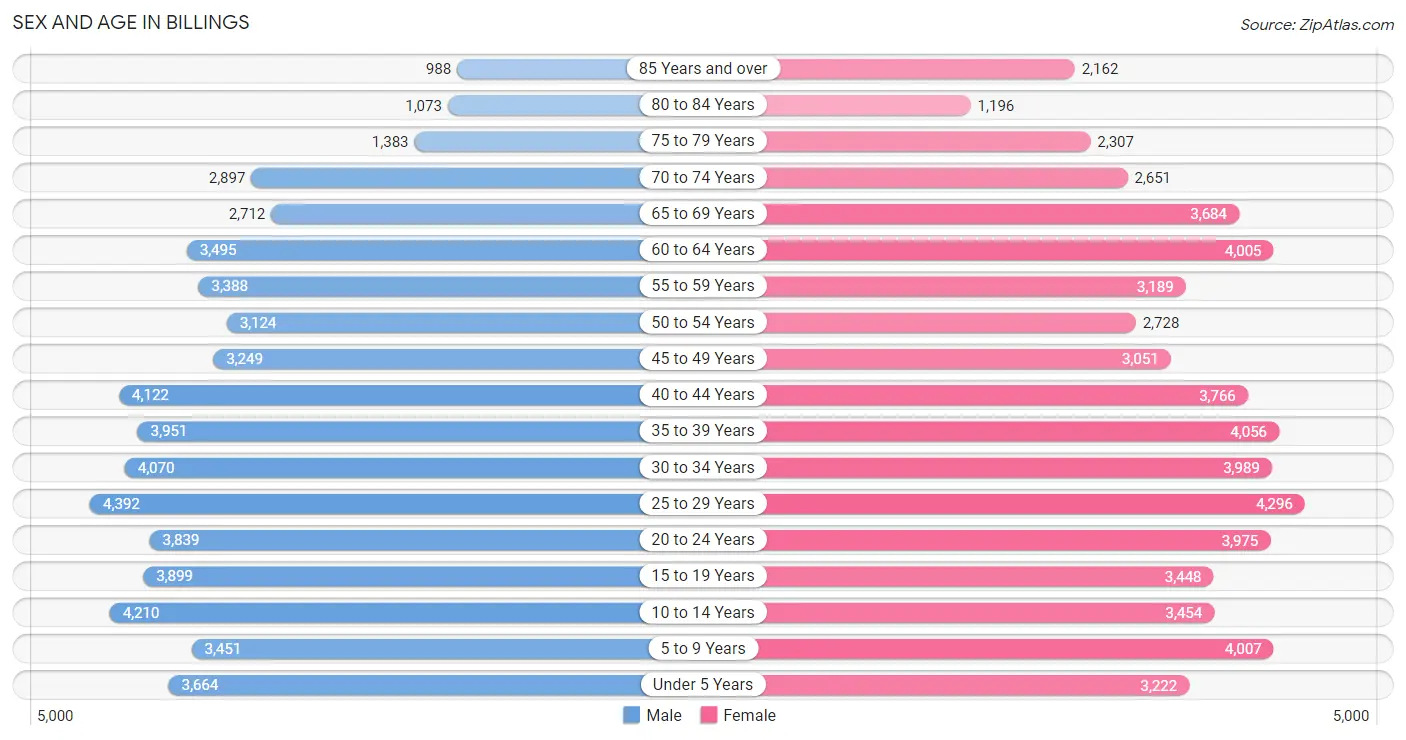
Sex and Age in Billings
Sex and Age in Billings
The most populous age groups in Billings are 25 to 29 Years (4,392 | 7.6%) for men and 25 to 29 Years (4,296 | 7.3%) for women.
| Age Bracket | Male | Female |
| Under 5 Years | 3,664 (6.3%) | 3,222 (5.4%) |
| 5 to 9 Years | 3,451 (6.0%) | 4,007 (6.8%) |
| 10 to 14 Years | 4,210 (7.3%) | 3,454 (5.8%) |
| 15 to 19 Years | 3,899 (6.7%) | 3,448 (5.8%) |
| 20 to 24 Years | 3,839 (6.6%) | 3,975 (6.7%) |
| 25 to 29 Years | 4,392 (7.6%) | 4,296 (7.3%) |
| 30 to 34 Years | 4,070 (7.0%) | 3,989 (6.7%) |
| 35 to 39 Years | 3,951 (6.8%) | 4,056 (6.9%) |
| 40 to 44 Years | 4,122 (7.1%) | 3,766 (6.4%) |
| 45 to 49 Years | 3,249 (5.6%) | 3,051 (5.1%) |
| 50 to 54 Years | 3,124 (5.4%) | 2,728 (4.6%) |
| 55 to 59 Years | 3,388 (5.9%) | 3,189 (5.4%) |
| 60 to 64 Years | 3,495 (6.0%) | 4,005 (6.8%) |
| 65 to 69 Years | 2,712 (4.7%) | 3,684 (6.2%) |
| 70 to 74 Years | 2,897 (5.0%) | 2,651 (4.5%) |
| 75 to 79 Years | 1,383 (2.4%) | 2,307 (3.9%) |
| 80 to 84 Years | 1,073 (1.8%) | 1,196 (2.0%) |
| 85 Years and over | 988 (1.7%) | 2,162 (3.6%) |
| Total | 57,907 (100.0%) | 59,186 (100.0%) |
Families and Households in Billings
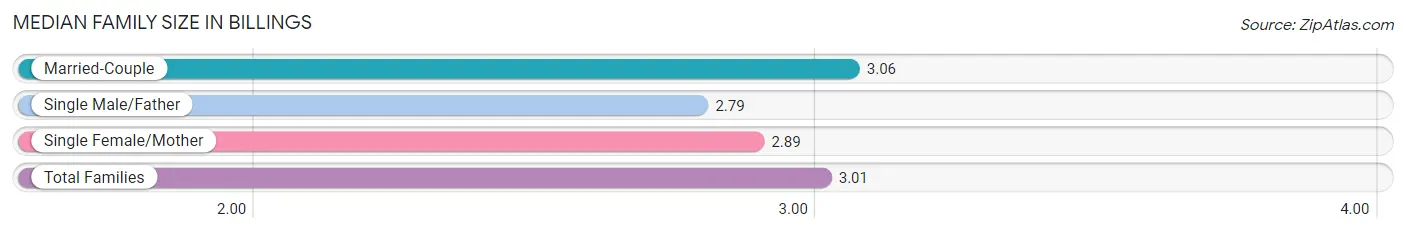
Median Family Size in Billings
The median family size in Billings is 3.01 persons per family, with married-couple families (21,343 | 75.7%) accounting for the largest median family size of 3.06 persons per family. On the other hand, single male/father families (2,719 | 9.6%) represent the smallest median family size with 2.79 persons per family.
| Family Type | # Families | Family Size |
| Married-Couple | 21,343 (75.7%) | 3.06 |
| Single Male/Father | 2,719 (9.6%) | 2.79 |
| Single Female/Mother | 4,137 (14.7%) | 2.89 |
| Total Families | 28,199 (100.0%) | 3.01 |
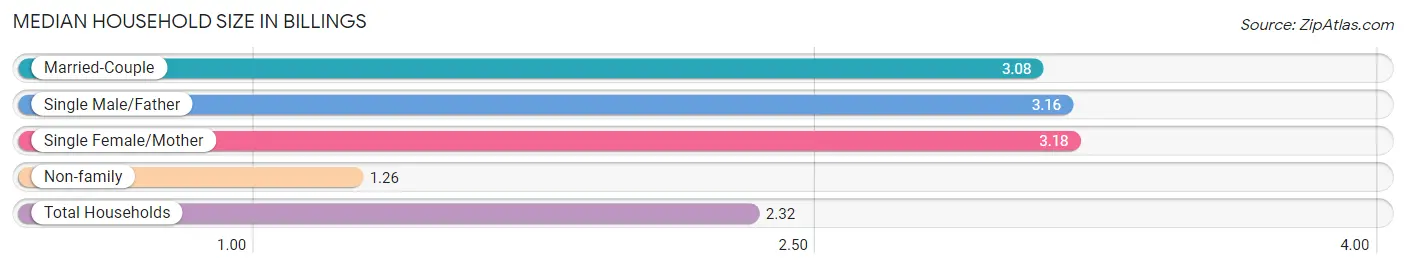
Median Household Size in Billings
The median household size in Billings is 2.32 persons per household, with single female/mother households (4,137 | 8.4%) accounting for the largest median household size of 3.18 persons per household. non-family households (21,029 | 42.7%) represent the smallest median household size with 1.26 persons per household.
| Household Type | # Households | Household Size |
| Married-Couple | 21,343 (43.4%) | 3.08 |
| Single Male/Father | 2,719 (5.5%) | 3.16 |
| Single Female/Mother | 4,137 (8.4%) | 3.18 |
| Non-family | 21,029 (42.7%) | 1.26 |
| Total Households | 49,228 (100.0%) | 2.32 |
Household Size by Marriage Status in Billings
Out of a total of 49,228 households in Billings, 28,199 (57.3%) are family households, while 21,029 (42.7%) are nonfamily households. The most numerous type of family households are 2-person households, comprising 13,449, and the most common type of nonfamily households are 1-person households, comprising 16,904.
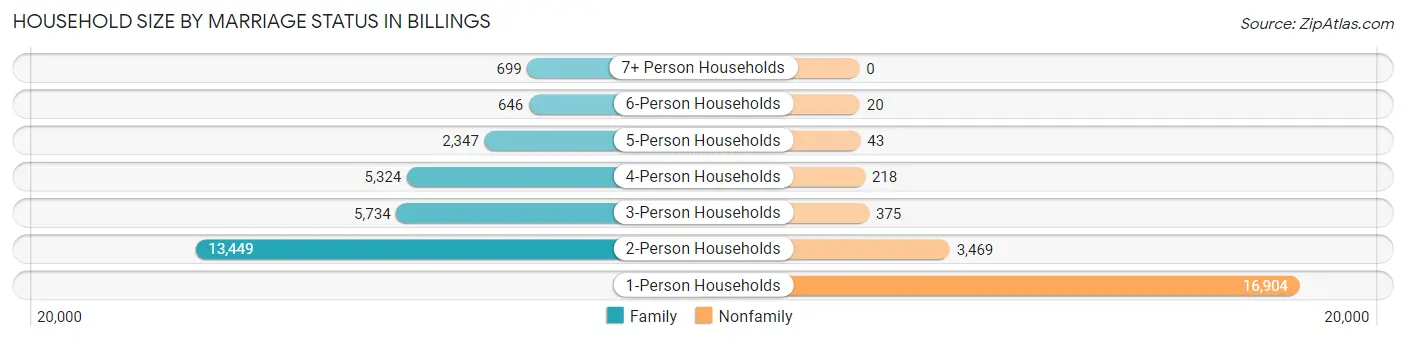
| Household Size | Family Households | Nonfamily Households |
| 1-Person Households | - | 16,904 (34.3%) |
| 2-Person Households | 13,449 (27.3%) | 3,469 (7.0%) |
| 3-Person Households | 5,734 (11.7%) | 375 (0.8%) |
| 4-Person Households | 5,324 (10.8%) | 218 (0.4%) |
| 5-Person Households | 2,347 (4.8%) | 43 (0.1%) |
| 6-Person Households | 646 (1.3%) | 20 (0.0%) |
| 7+ Person Households | 699 (1.4%) | 0 (0.0%) |
| Total | 28,199 (57.3%) | 21,029 (42.7%) |
Female Fertility in Billings
Fertility by Age in Billings
Average fertility rate in Billings is 64.0 births per 1,000 women. Women in the age bracket of 20 to 34 years have the highest fertility rate with 94.0 births per 1,000 women. Women in the age bracket of 20 to 34 years acount for 66.4% of all women with births.
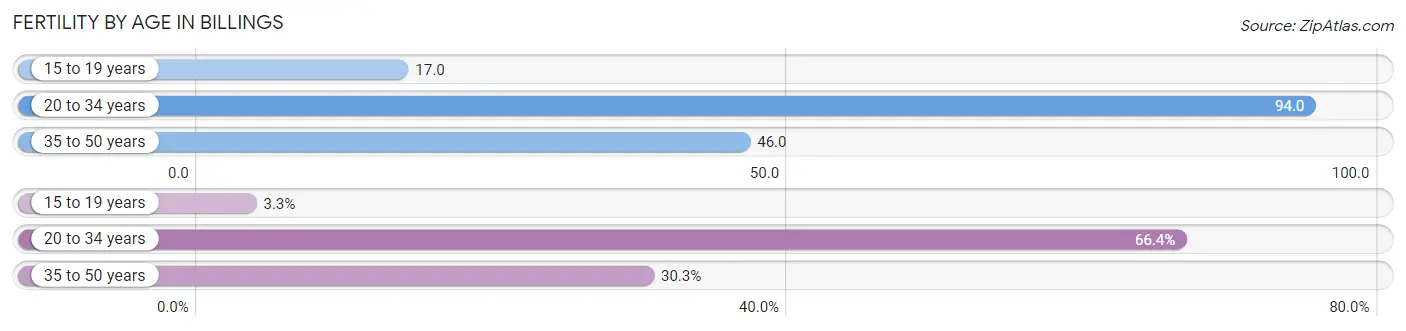
| Age Bracket | Women with Births | Births / 1,000 Women |
| 15 to 19 years | 57 (3.3%) | 17.0 |
| 20 to 34 years | 1,150 (66.4%) | 94.0 |
| 35 to 50 years | 524 (30.3%) | 46.0 |
| Total | 1,731 (100.0%) | 64.0 |
Fertility by Age by Marriage Status in Billings
71.4% of women with births (1,731) in Billings are married. The highest percentage of unmarried women with births falls into 15 to 19 years age bracket with 100.0% of them unmarried at the time of birth, while the lowest percentage of unmarried women with births belong to 35 to 50 years age bracket with 20.2% of them unmarried.
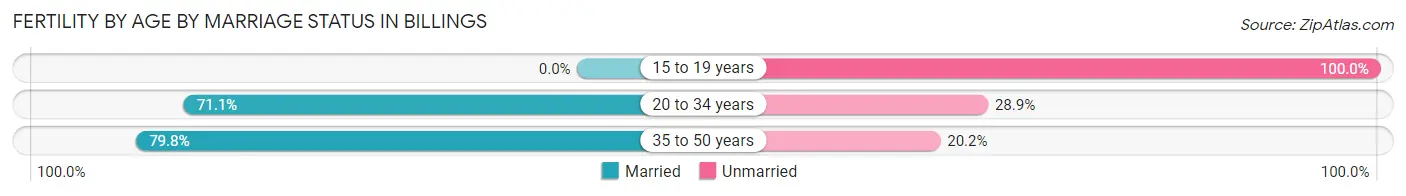
| Age Bracket | Married | Unmarried |
| 15 to 19 years | 0 (0.0%) | 57 (100.0%) |
| 20 to 34 years | 818 (71.1%) | 332 (28.9%) |
| 35 to 50 years | 418 (79.8%) | 106 (20.2%) |
| Total | 1,236 (71.4%) | 495 (28.6%) |
Fertility by Education in Billings
Average fertility rate in Billings is 64.0 births per 1,000 women. Women with the education attainment of graduate degree have the highest fertility rate of 76.0 births per 1,000 women, while women with the education attainment of less than high school have the lowest fertility at 44.0 births per 1,000 women. Women with the education attainment of college or associate's degree represent 29.7% of all women with births.
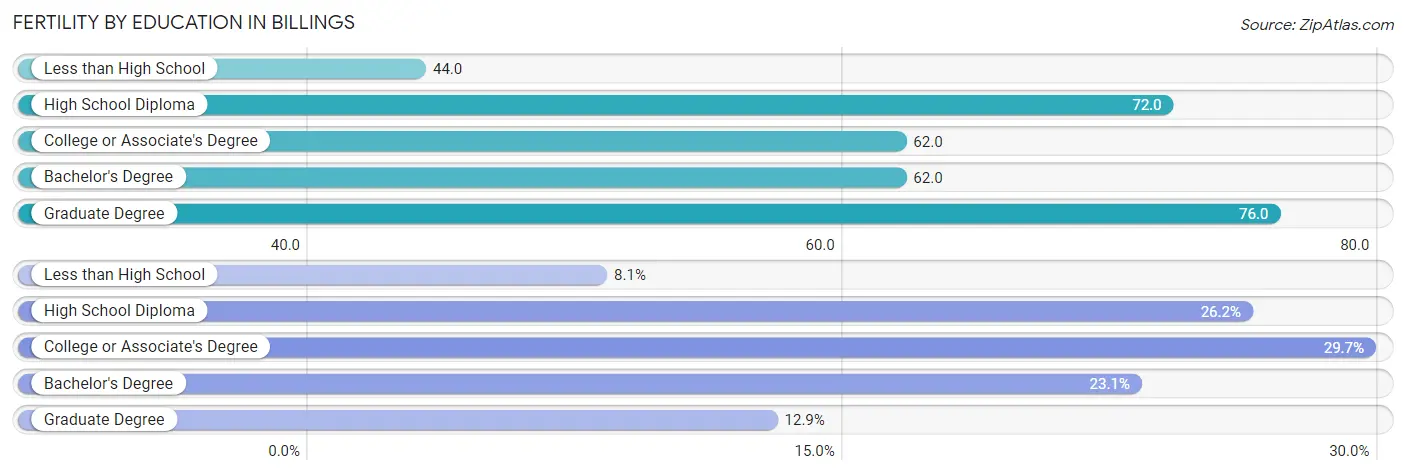
| Educational Attainment | Women with Births | Births / 1,000 Women |
| Less than High School | 140 (8.1%) | 44.0 |
| High School Diploma | 454 (26.2%) | 72.0 |
| College or Associate's Degree | 514 (29.7%) | 62.0 |
| Bachelor's Degree | 400 (23.1%) | 62.0 |
| Graduate Degree | 223 (12.9%) | 76.0 |
| Total | 1,731 (100.0%) | 64.0 |
Fertility by Education by Marriage Status in Billings
28.6% of women with births in Billings are unmarried. Women with the educational attainment of graduate degree are most likely to be married with 100.0% of them married at childbirth, while women with the educational attainment of less than high school are least likely to be married with 56.4% of them unmarried at childbirth.
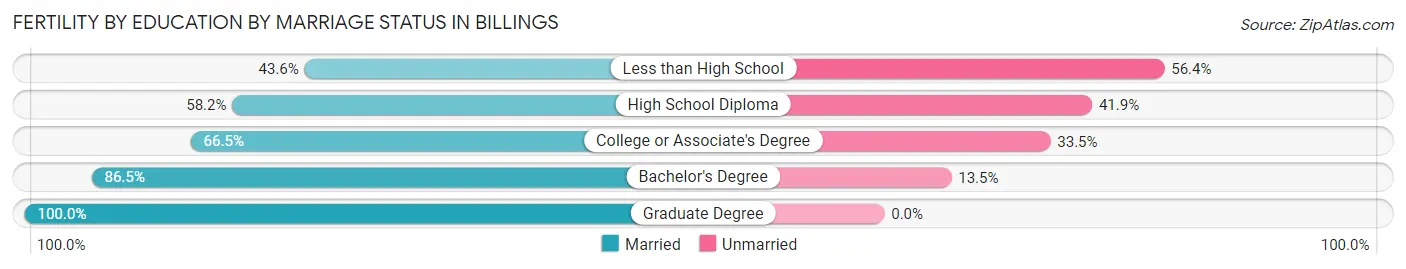
| Educational Attainment | Married | Unmarried |
| Less than High School | 61 (43.6%) | 79 (56.4%) |
| High School Diploma | 264 (58.2%) | 190 (41.8%) |
| College or Associate's Degree | 342 (66.5%) | 172 (33.5%) |
| Bachelor's Degree | 346 (86.5%) | 54 (13.5%) |
| Graduate Degree | 223 (100.0%) | 0 (0.0%) |
| Total | 1,236 (71.4%) | 495 (28.6%) |
Employment Characteristics in Billings
Employment by Class of Employer in Billings
Among the 59,272 employed individuals in Billings, private company employees (37,638 | 63.5%), not-for-profit organizations (7,773 | 13.1%), and local government employees (4,019 | 6.8%) make up the most common classes of employment.
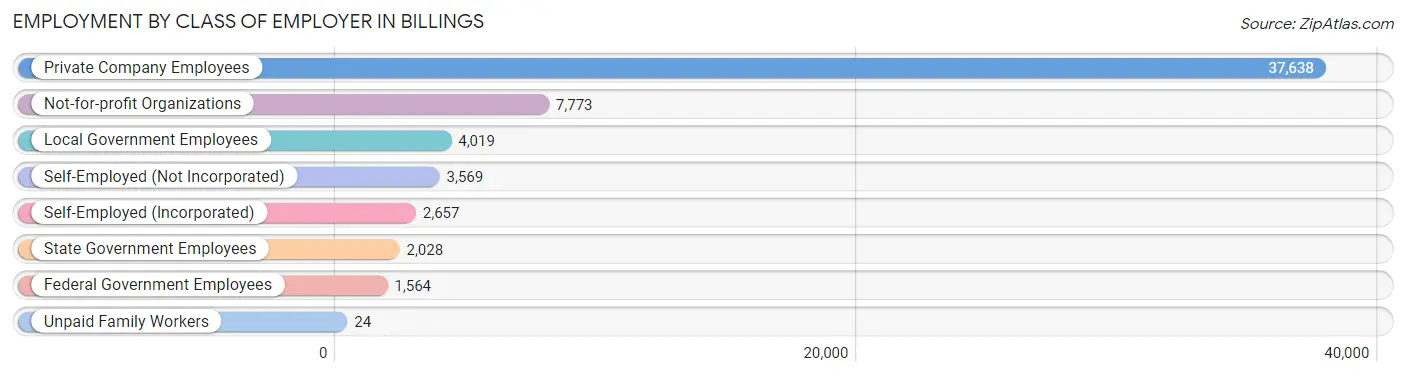
| Employer Class | # Employees | % Employees |
| Private Company Employees | 37,638 | 63.5% |
| Self-Employed (Incorporated) | 2,657 | 4.5% |
| Self-Employed (Not Incorporated) | 3,569 | 6.0% |
| Not-for-profit Organizations | 7,773 | 13.1% |
| Local Government Employees | 4,019 | 6.8% |
| State Government Employees | 2,028 | 3.4% |
| Federal Government Employees | 1,564 | 2.6% |
| Unpaid Family Workers | 24 | 0.0% |
| Total | 59,272 | 100.0% |
Employment Status by Age in Billings
According to the labor force statistics for Billings, out of the total population over 16 years of age (93,701), 66.5% or 62,311 individuals are in the labor force, with 3.6% or 2,243 of them unemployed. The age group with the highest labor force participation rate is 30 to 34 years, with 88.7% or 7,148 individuals in the labor force. Within the labor force, the 20 to 24 years age range has the highest percentage of unemployed individuals, with 8.5% or 549 of them being unemployed.
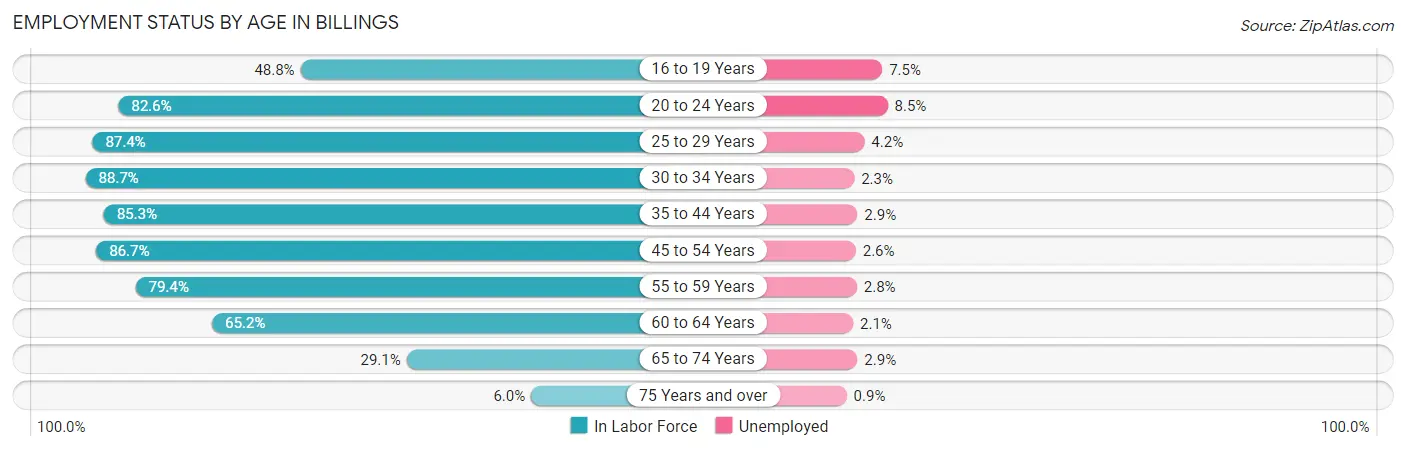
| Age Bracket | In Labor Force | Unemployed |
| 16 to 19 Years | 2,910 (48.8%) | 218 (7.5%) |
| 20 to 24 Years | 6,454 (82.6%) | 549 (8.5%) |
| 25 to 29 Years | 7,593 (87.4%) | 319 (4.2%) |
| 30 to 34 Years | 7,148 (88.7%) | 164 (2.3%) |
| 35 to 44 Years | 13,558 (85.3%) | 393 (2.9%) |
| 45 to 54 Years | 10,536 (86.7%) | 274 (2.6%) |
| 55 to 59 Years | 5,222 (79.4%) | 146 (2.8%) |
| 60 to 64 Years | 4,890 (65.2%) | 103 (2.1%) |
| 65 to 74 Years | 3,476 (29.1%) | 101 (2.9%) |
| 75 Years and over | 547 (6.0%) | 5 (0.9%) |
| Total | 62,311 (66.5%) | 2,243 (3.6%) |
Employment Status by Educational Attainment in Billings
According to labor force statistics for Billings, 83.1% of individuals (48,922) out of the total population between 25 and 64 years of age (58,871) are in the labor force, with 2.9% or 1,419 of them being unemployed. The group with the highest labor force participation rate are those with the educational attainment of bachelor's degree or higher, with 88.2% or 19,560 individuals in the labor force. Within the labor force, individuals with less than high school education have the highest percentage of unemployment, with 10.4% or 152 of them being unemployed.
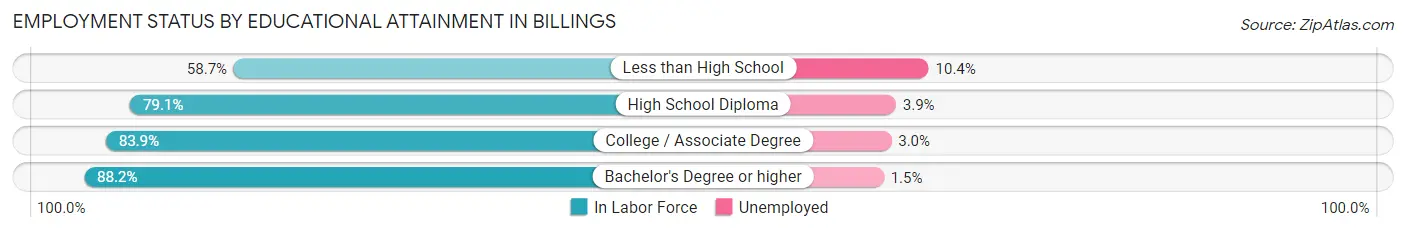
| Educational Attainment | In Labor Force | Unemployed |
| Less than High School | 1,463 (58.7%) | 259 (10.4%) |
| High School Diploma | 12,552 (79.1%) | 619 (3.9%) |
| College / Associate Degree | 15,381 (83.9%) | 550 (3.0%) |
| Bachelor's Degree or higher | 19,560 (88.2%) | 333 (1.5%) |
| Total | 48,922 (83.1%) | 1,707 (2.9%) |
Employment Occupations by Sex in Billings
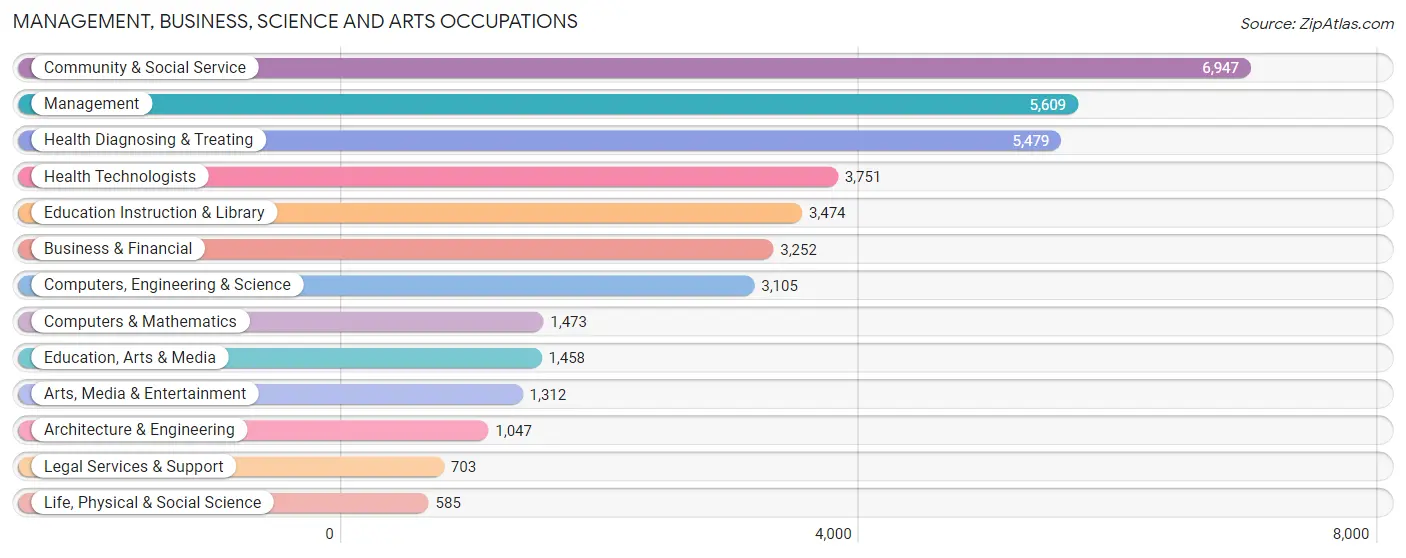
Management, Business, Science and Arts Occupations
The most common Management, Business, Science and Arts occupations in Billings are Community & Social Service (6,947 | 11.6%), Management (5,609 | 9.3%), Health Diagnosing & Treating (5,479 | 9.1%), Health Technologists (3,751 | 6.2%), and Education Instruction & Library (3,474 | 5.8%).
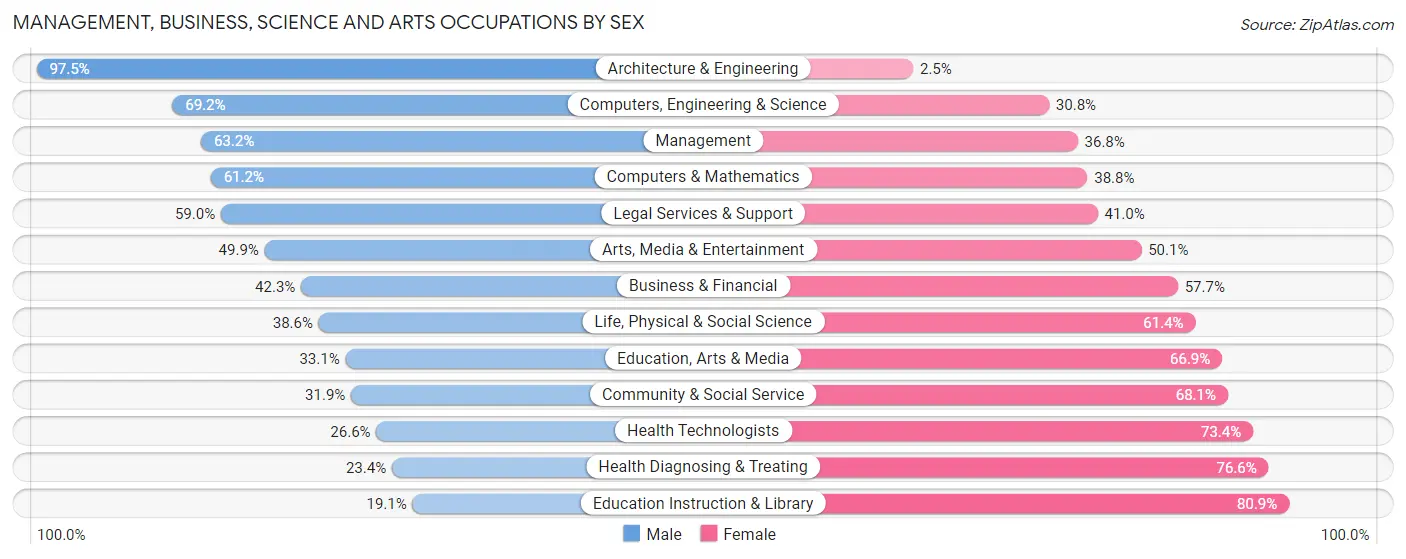
Management, Business, Science and Arts Occupations by Sex
Within the Management, Business, Science and Arts occupations in Billings, the most male-oriented occupations are Architecture & Engineering (97.5%), Computers, Engineering & Science (69.2%), and Management (63.2%), while the most female-oriented occupations are Education Instruction & Library (80.9%), Health Diagnosing & Treating (76.6%), and Health Technologists (73.4%).
| Occupation | Male | Female |
| Management | 3,545 (63.2%) | 2,064 (36.8%) |
| Business & Financial | 1,376 (42.3%) | 1,876 (57.7%) |
| Computers, Engineering & Science | 2,148 (69.2%) | 957 (30.8%) |
| Computers & Mathematics | 901 (61.2%) | 572 (38.8%) |
| Architecture & Engineering | 1,021 (97.5%) | 26 (2.5%) |
| Life, Physical & Social Science | 226 (38.6%) | 359 (61.4%) |
| Community & Social Service | 2,215 (31.9%) | 4,732 (68.1%) |
| Education, Arts & Media | 482 (33.1%) | 976 (66.9%) |
| Legal Services & Support | 415 (59.0%) | 288 (41.0%) |
| Education Instruction & Library | 663 (19.1%) | 2,811 (80.9%) |
| Arts, Media & Entertainment | 655 (49.9%) | 657 (50.1%) |
| Health Diagnosing & Treating | 1,280 (23.4%) | 4,199 (76.6%) |
| Health Technologists | 998 (26.6%) | 2,753 (73.4%) |
| Total (Category) | 10,564 (43.3%) | 13,828 (56.7%) |
| Total (Overall) | 30,754 (51.2%) | 29,296 (48.8%) |
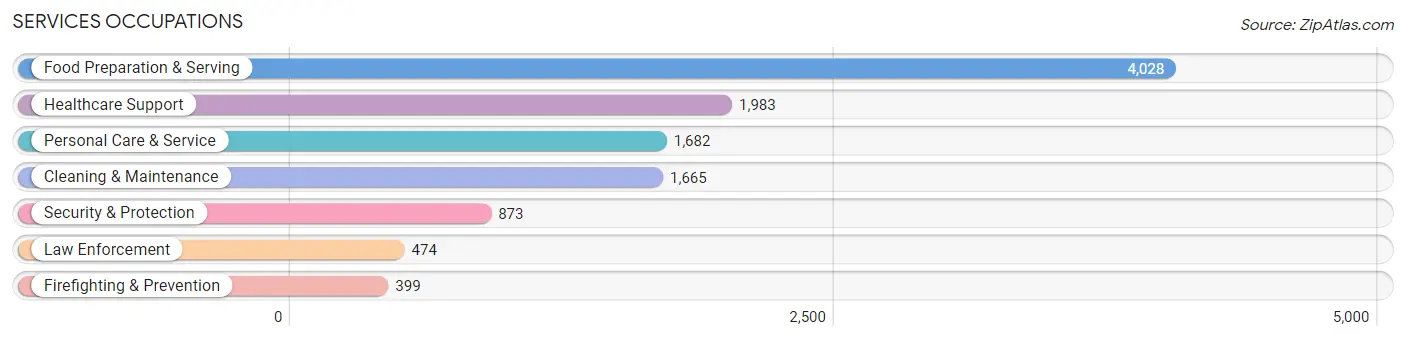
Services Occupations
The most common Services occupations in Billings are Food Preparation & Serving (4,028 | 6.7%), Healthcare Support (1,983 | 3.3%), Personal Care & Service (1,682 | 2.8%), Cleaning & Maintenance (1,665 | 2.8%), and Security & Protection (873 | 1.5%).
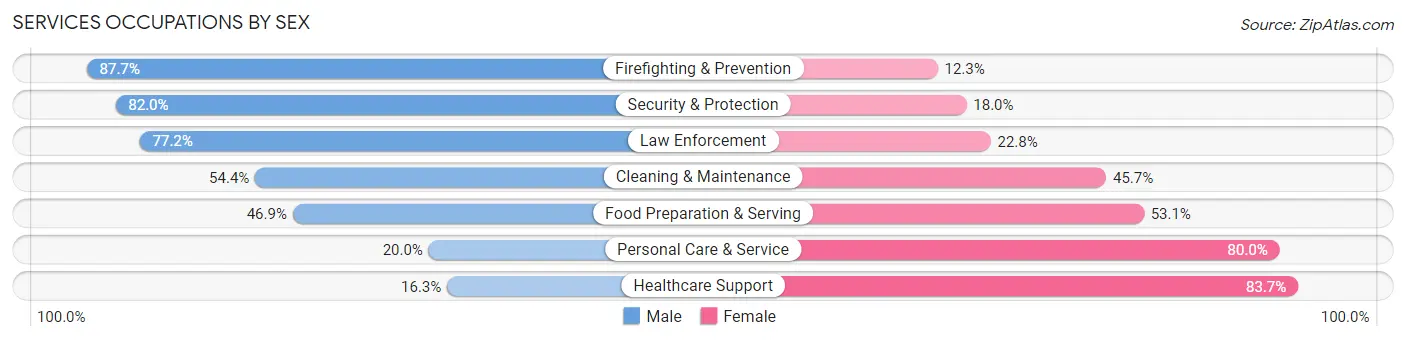
Services Occupations by Sex
Within the Services occupations in Billings, the most male-oriented occupations are Firefighting & Prevention (87.7%), Security & Protection (82.0%), and Law Enforcement (77.2%), while the most female-oriented occupations are Healthcare Support (83.7%), Personal Care & Service (80.0%), and Food Preparation & Serving (53.1%).
| Occupation | Male | Female |
| Healthcare Support | 324 (16.3%) | 1,659 (83.7%) |
| Security & Protection | 716 (82.0%) | 157 (18.0%) |
| Firefighting & Prevention | 350 (87.7%) | 49 (12.3%) |
| Law Enforcement | 366 (77.2%) | 108 (22.8%) |
| Food Preparation & Serving | 1,889 (46.9%) | 2,139 (53.1%) |
| Cleaning & Maintenance | 905 (54.3%) | 760 (45.7%) |
| Personal Care & Service | 336 (20.0%) | 1,346 (80.0%) |
| Total (Category) | 4,170 (40.8%) | 6,061 (59.2%) |
| Total (Overall) | 30,754 (51.2%) | 29,296 (48.8%) |
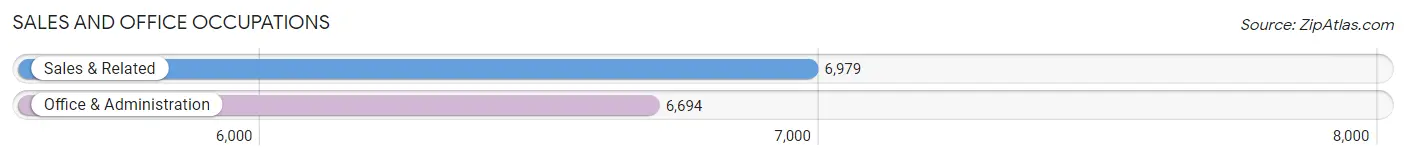
Sales and Office Occupations
The most common Sales and Office occupations in Billings are Sales & Related (6,979 | 11.6%), and Office & Administration (6,694 | 11.2%).
Sales and Office Occupations by Sex
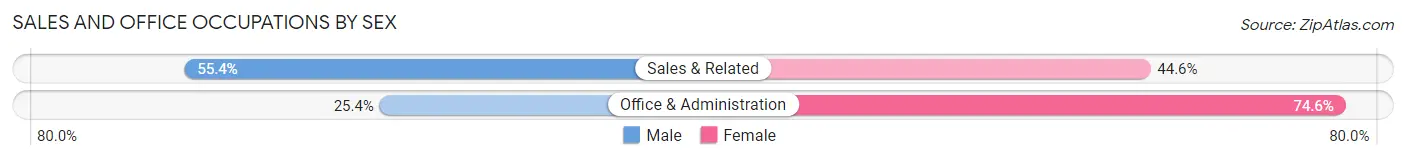
| Occupation | Male | Female |
| Sales & Related | 3,867 (55.4%) | 3,112 (44.6%) |
| Office & Administration | 1,698 (25.4%) | 4,996 (74.6%) |
| Total (Category) | 5,565 (40.7%) | 8,108 (59.3%) |
| Total (Overall) | 30,754 (51.2%) | 29,296 (48.8%) |
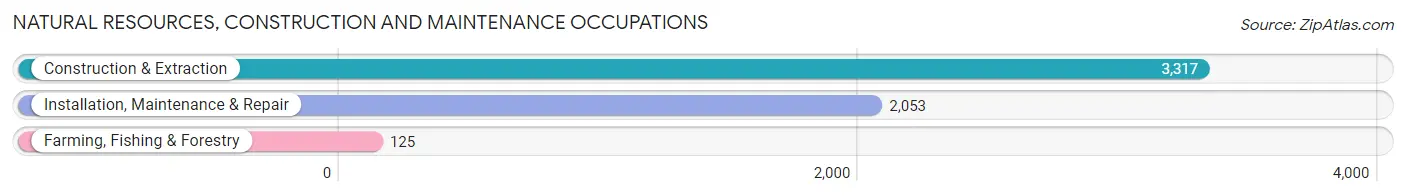
Natural Resources, Construction and Maintenance Occupations
The most common Natural Resources, Construction and Maintenance occupations in Billings are Construction & Extraction (3,317 | 5.5%), Installation, Maintenance & Repair (2,053 | 3.4%), and Farming, Fishing & Forestry (125 | 0.2%).
Natural Resources, Construction and Maintenance Occupations by Sex
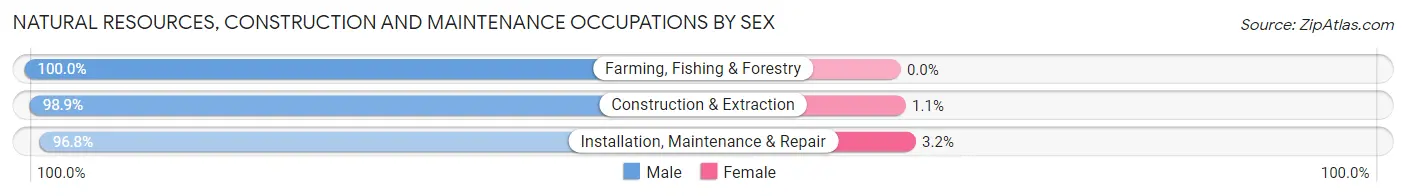
| Occupation | Male | Female |
| Farming, Fishing & Forestry | 125 (100.0%) | 0 (0.0%) |
| Construction & Extraction | 3,281 (98.9%) | 36 (1.1%) |
| Installation, Maintenance & Repair | 1,988 (96.8%) | 65 (3.2%) |
| Total (Category) | 5,394 (98.2%) | 101 (1.8%) |
| Total (Overall) | 30,754 (51.2%) | 29,296 (48.8%) |
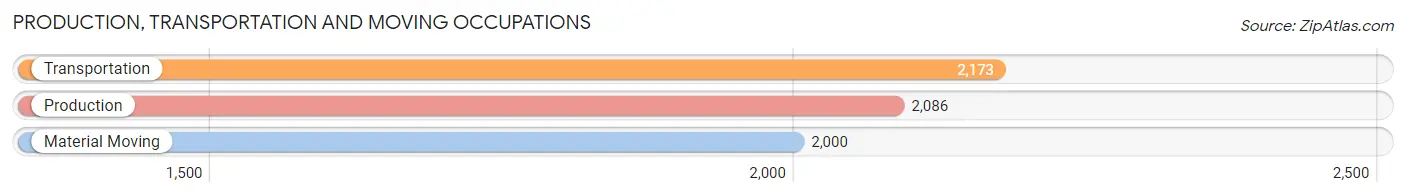
Production, Transportation and Moving Occupations
The most common Production, Transportation and Moving occupations in Billings are Transportation (2,173 | 3.6%), Production (2,086 | 3.5%), and Material Moving (2,000 | 3.3%).
Production, Transportation and Moving Occupations by Sex
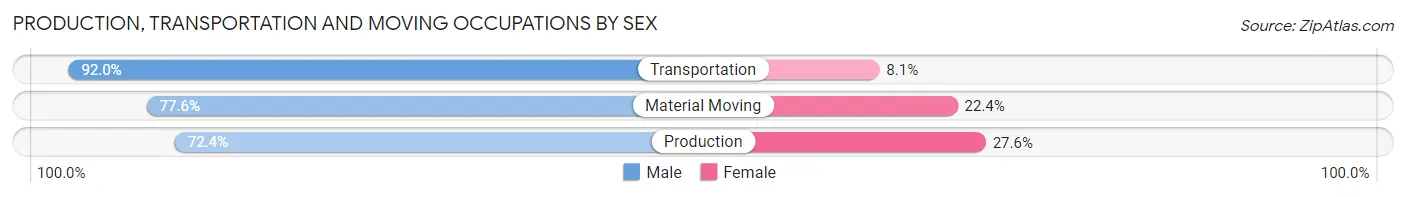
| Occupation | Male | Female |
| Production | 1,511 (72.4%) | 575 (27.6%) |
| Transportation | 1,998 (91.9%) | 175 (8.1%) |
| Material Moving | 1,552 (77.6%) | 448 (22.4%) |
| Total (Category) | 5,061 (80.9%) | 1,198 (19.1%) |
| Total (Overall) | 30,754 (51.2%) | 29,296 (48.8%) |
Employment Industries by Sex in Billings
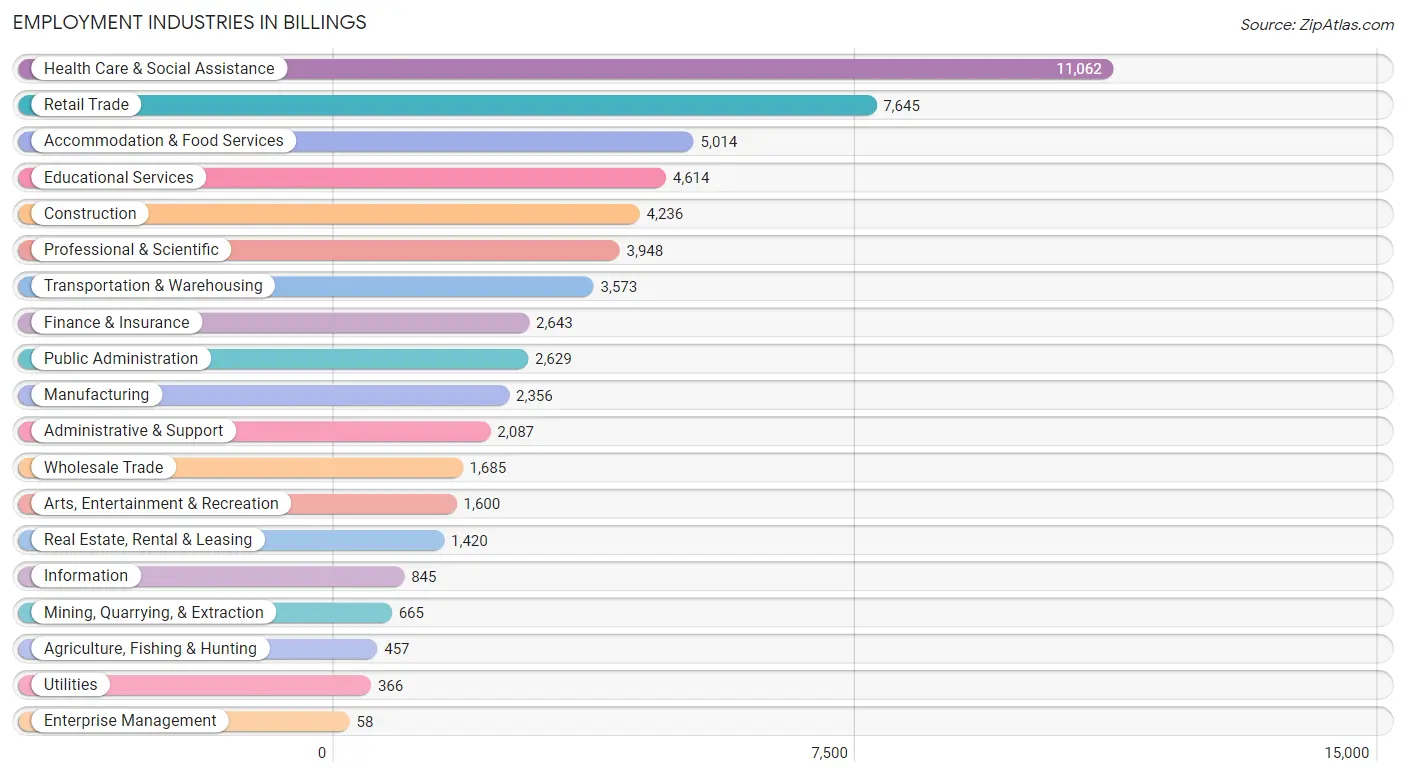
Employment Industries in Billings
The major employment industries in Billings include Health Care & Social Assistance (11,062 | 18.4%), Retail Trade (7,645 | 12.7%), Accommodation & Food Services (5,014 | 8.4%), Educational Services (4,614 | 7.7%), and Construction (4,236 | 7.0%).
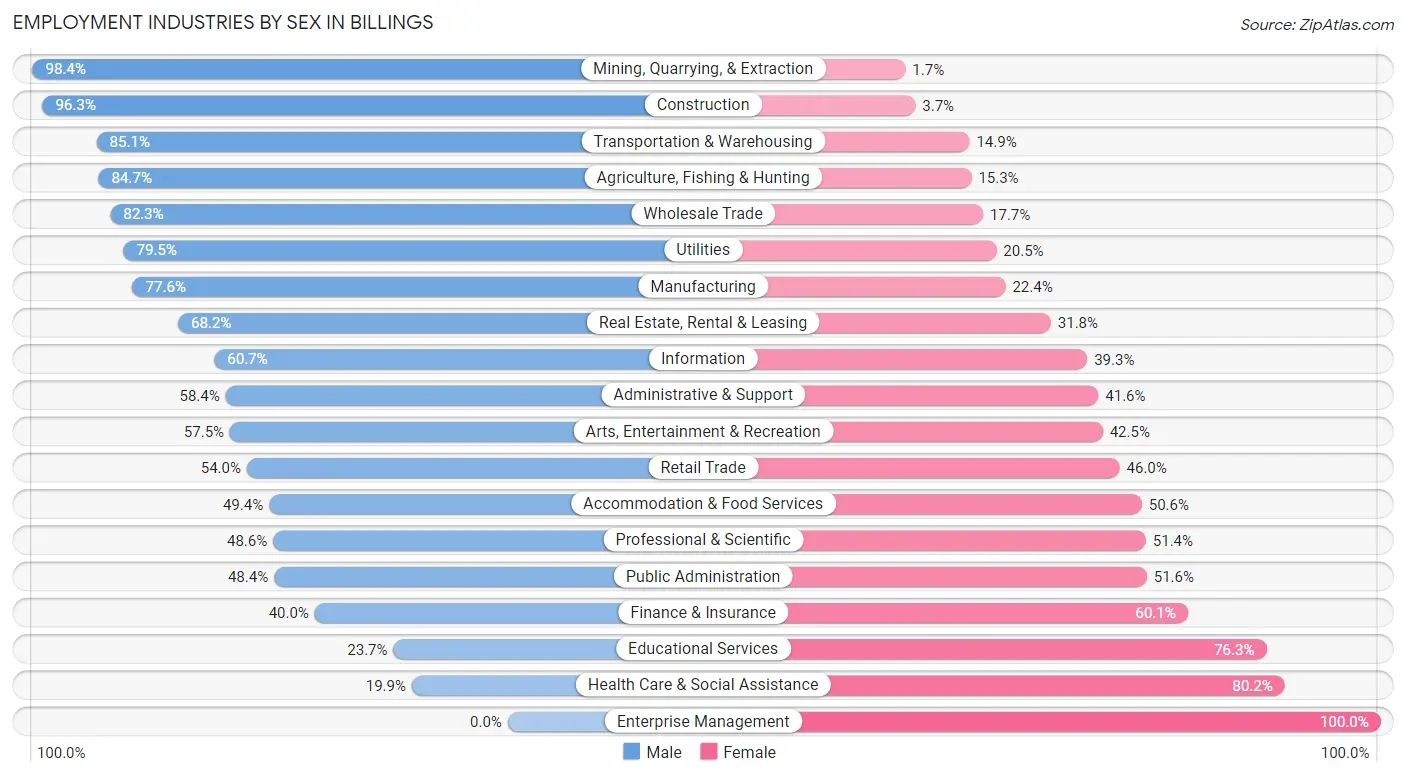
Employment Industries by Sex in Billings
The Billings industries that see more men than women are Mining, Quarrying, & Extraction (98.4%), Construction (96.3%), and Transportation & Warehousing (85.1%), whereas the industries that tend to have a higher number of women are Enterprise Management (100.0%), Health Care & Social Assistance (80.1%), and Educational Services (76.3%).
| Industry | Male | Female |
| Agriculture, Fishing & Hunting | 387 (84.7%) | 70 (15.3%) |
| Mining, Quarrying, & Extraction | 654 (98.4%) | 11 (1.7%) |
| Construction | 4,079 (96.3%) | 157 (3.7%) |
| Manufacturing | 1,829 (77.6%) | 527 (22.4%) |
| Wholesale Trade | 1,386 (82.3%) | 299 (17.7%) |
| Retail Trade | 4,129 (54.0%) | 3,516 (46.0%) |
| Transportation & Warehousing | 3,040 (85.1%) | 533 (14.9%) |
| Utilities | 291 (79.5%) | 75 (20.5%) |
| Information | 513 (60.7%) | 332 (39.3%) |
| Finance & Insurance | 1,056 (40.0%) | 1,587 (60.1%) |
| Real Estate, Rental & Leasing | 969 (68.2%) | 451 (31.8%) |
| Professional & Scientific | 1,918 (48.6%) | 2,030 (51.4%) |
| Enterprise Management | 0 (0.0%) | 58 (100.0%) |
| Administrative & Support | 1,219 (58.4%) | 868 (41.6%) |
| Educational Services | 1,092 (23.7%) | 3,522 (76.3%) |
| Health Care & Social Assistance | 2,196 (19.9%) | 8,866 (80.1%) |
| Arts, Entertainment & Recreation | 920 (57.5%) | 680 (42.5%) |
| Accommodation & Food Services | 2,478 (49.4%) | 2,536 (50.6%) |
| Public Administration | 1,272 (48.4%) | 1,357 (51.6%) |
| Total | 30,754 (51.2%) | 29,296 (48.8%) |
Education in Billings
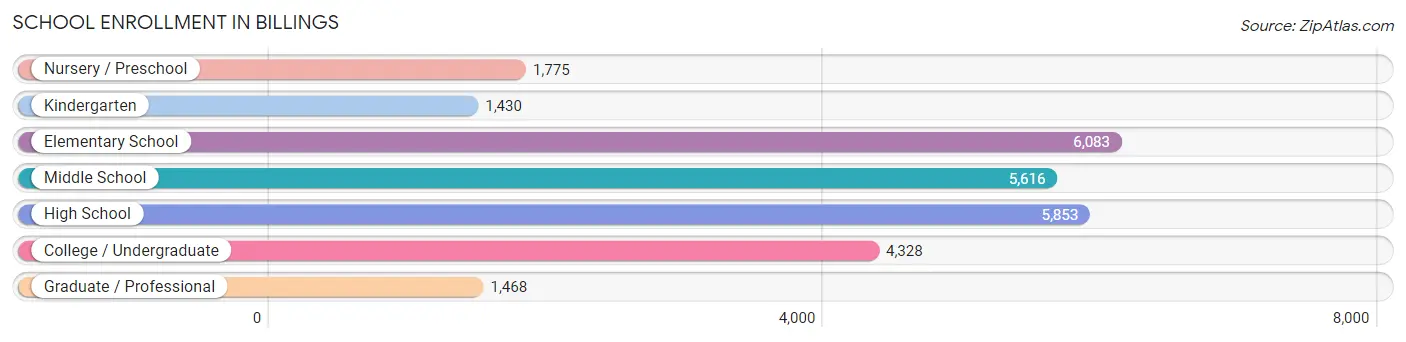
School Enrollment in Billings
The most common levels of schooling among the 26,553 students in Billings are elementary school (6,083 | 22.9%), high school (5,853 | 22.0%), and middle school (5,616 | 21.1%).
| School Level | # Students | % Students |
| Nursery / Preschool | 1,775 | 6.7% |
| Kindergarten | 1,430 | 5.4% |
| Elementary School | 6,083 | 22.9% |
| Middle School | 5,616 | 21.1% |
| High School | 5,853 | 22.0% |
| College / Undergraduate | 4,328 | 16.3% |
| Graduate / Professional | 1,468 | 5.5% |
| Total | 26,553 | 100.0% |
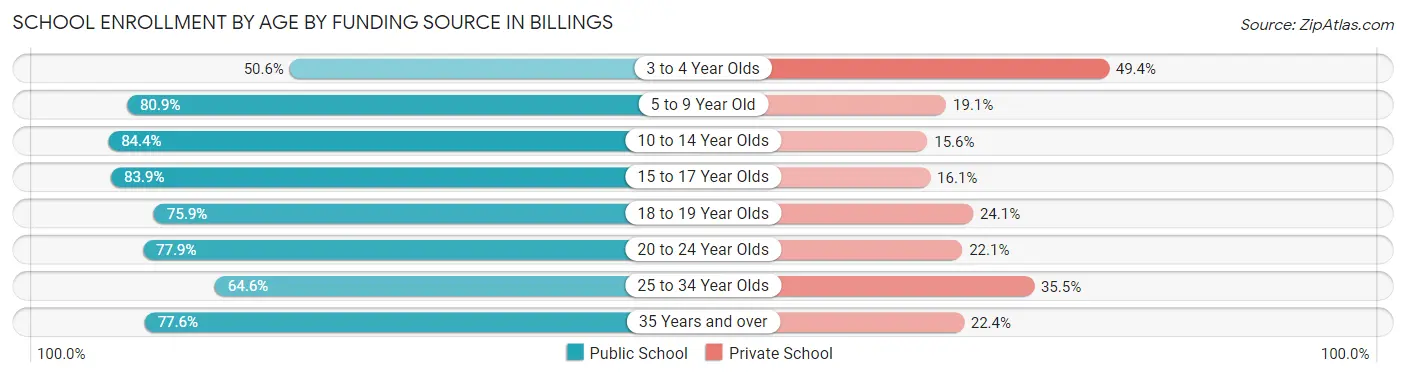
School Enrollment by Age by Funding Source in Billings
Out of a total of 26,553 students who are enrolled in schools in Billings, 5,470 (20.6%) attend a private institution, while the remaining 21,083 (79.4%) are enrolled in public schools. The age group of 3 to 4 year olds has the highest likelihood of being enrolled in private schools, with 558 (49.4% in the age bracket) enrolled. Conversely, the age group of 10 to 14 year olds has the lowest likelihood of being enrolled in a private school, with 6,361 (84.4% in the age bracket) attending a public institution.
| Age Bracket | Public School | Private School |
| 3 to 4 Year Olds | 572 (50.6%) | 558 (49.4%) |
| 5 to 9 Year Old | 5,662 (80.9%) | 1,335 (19.1%) |
| 10 to 14 Year Olds | 6,361 (84.4%) | 1,174 (15.6%) |
| 15 to 17 Year Olds | 3,719 (83.9%) | 714 (16.1%) |
| 18 to 19 Year Olds | 1,185 (75.9%) | 376 (24.1%) |
| 20 to 24 Year Olds | 1,687 (77.9%) | 478 (22.1%) |
| 25 to 34 Year Olds | 1,129 (64.5%) | 620 (35.4%) |
| 35 Years and over | 763 (77.6%) | 220 (22.4%) |
| Total | 21,083 (79.4%) | 5,470 (20.6%) |
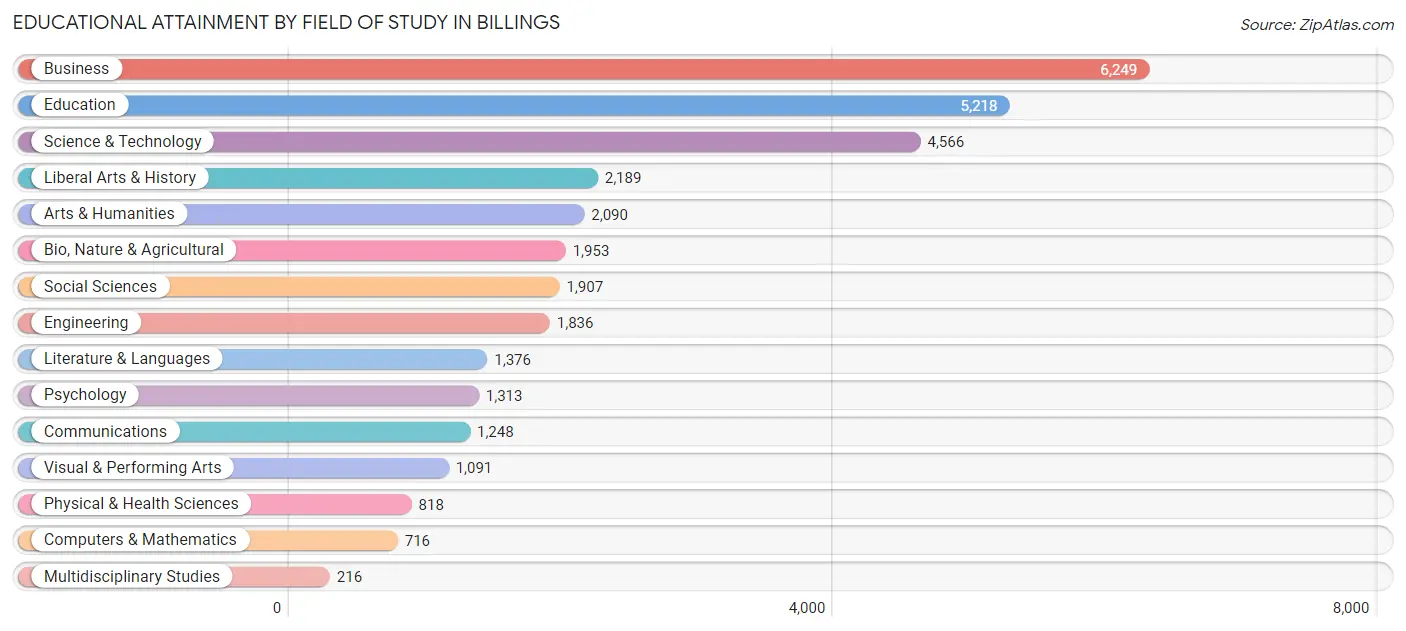
Educational Attainment by Field of Study in Billings
Business (6,249 | 19.1%), education (5,218 | 15.9%), science & technology (4,566 | 13.9%), liberal arts & history (2,189 | 6.7%), and arts & humanities (2,090 | 6.4%) are the most common fields of study among 32,786 individuals in Billings who have obtained a bachelor's degree or higher.
| Field of Study | # Graduates | % Graduates |
| Computers & Mathematics | 716 | 2.2% |
| Bio, Nature & Agricultural | 1,953 | 6.0% |
| Physical & Health Sciences | 818 | 2.5% |
| Psychology | 1,313 | 4.0% |
| Social Sciences | 1,907 | 5.8% |
| Engineering | 1,836 | 5.6% |
| Multidisciplinary Studies | 216 | 0.7% |
| Science & Technology | 4,566 | 13.9% |
| Business | 6,249 | 19.1% |
| Education | 5,218 | 15.9% |
| Literature & Languages | 1,376 | 4.2% |
| Liberal Arts & History | 2,189 | 6.7% |
| Visual & Performing Arts | 1,091 | 3.3% |
| Communications | 1,248 | 3.8% |
| Arts & Humanities | 2,090 | 6.4% |
| Total | 32,786 | 100.0% |
Transportation & Commute in Billings
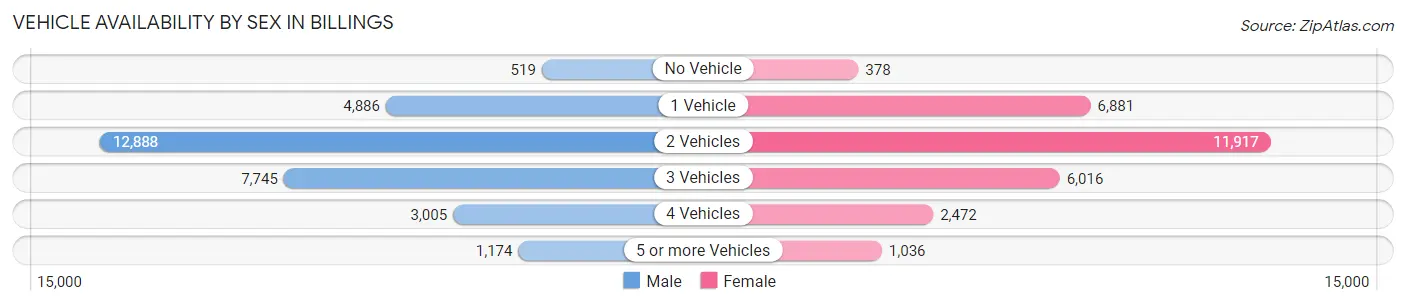
Vehicle Availability by Sex in Billings
The most prevalent vehicle ownership categories in Billings are males with 2 vehicles (12,888, accounting for 42.6%) and females with 2 vehicles (11,917, making up 44.9%).
| Vehicles Available | Male | Female |
| No Vehicle | 519 (1.7%) | 378 (1.3%) |
| 1 Vehicle | 4,886 (16.2%) | 6,881 (24.0%) |
| 2 Vehicles | 12,888 (42.6%) | 11,917 (41.5%) |
| 3 Vehicles | 7,745 (25.6%) | 6,016 (21.0%) |
| 4 Vehicles | 3,005 (9.9%) | 2,472 (8.6%) |
| 5 or more Vehicles | 1,174 (3.9%) | 1,036 (3.6%) |
| Total | 30,217 (100.0%) | 28,700 (100.0%) |
Commute Time in Billings
The most frequently occuring commute durations in Billings are 15 to 19 minutes (15,221 commuters, 27.5%), 10 to 14 minutes (13,197 commuters, 23.9%), and 5 to 9 minutes (8,507 commuters, 15.4%).
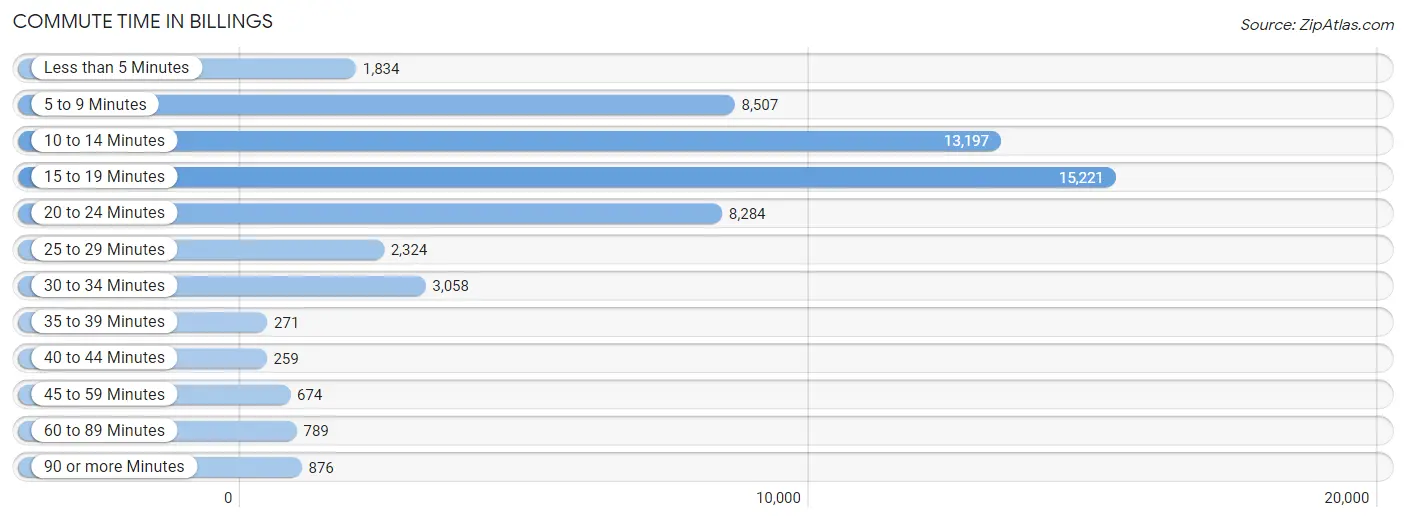
| Commute Time | # Commuters | % Commuters |
| Less than 5 Minutes | 1,834 | 3.3% |
| 5 to 9 Minutes | 8,507 | 15.4% |
| 10 to 14 Minutes | 13,197 | 23.9% |
| 15 to 19 Minutes | 15,221 | 27.5% |
| 20 to 24 Minutes | 8,284 | 15.0% |
| 25 to 29 Minutes | 2,324 | 4.2% |
| 30 to 34 Minutes | 3,058 | 5.5% |
| 35 to 39 Minutes | 271 | 0.5% |
| 40 to 44 Minutes | 259 | 0.5% |
| 45 to 59 Minutes | 674 | 1.2% |
| 60 to 89 Minutes | 789 | 1.4% |
| 90 or more Minutes | 876 | 1.6% |
Commute Time by Sex in Billings
The most common commute times in Billings are 15 to 19 minutes (7,554 commuters, 26.3%) for males and 15 to 19 minutes (7,667 commuters, 28.9%) for females.
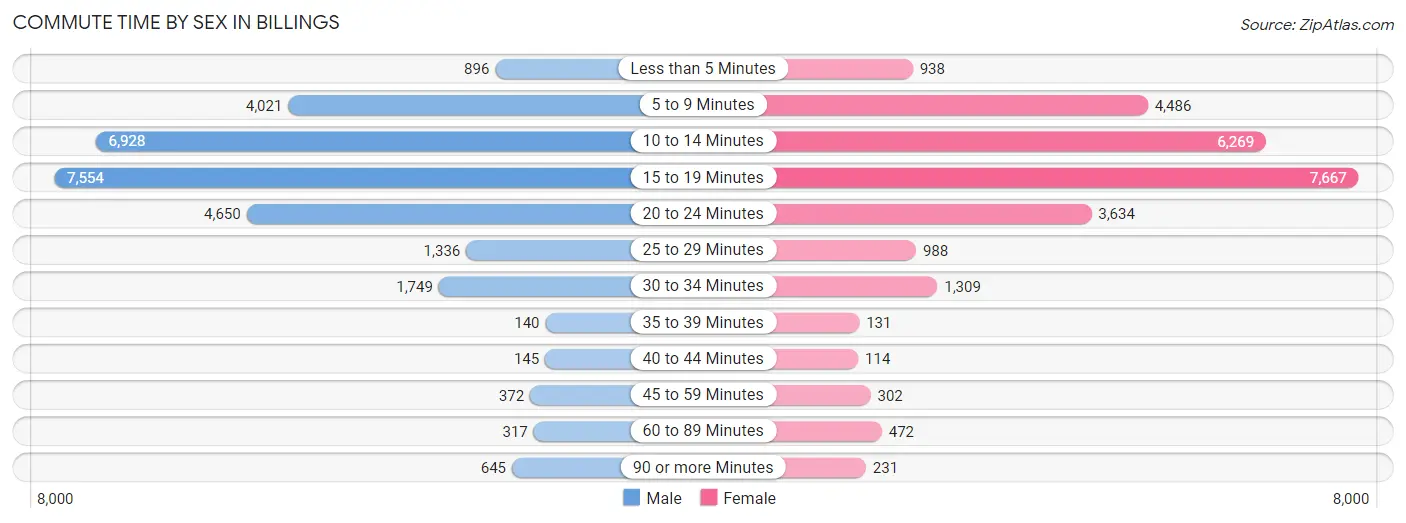
| Commute Time | Male | Female |
| Less than 5 Minutes | 896 (3.1%) | 938 (3.5%) |
| 5 to 9 Minutes | 4,021 (14.0%) | 4,486 (16.9%) |
| 10 to 14 Minutes | 6,928 (24.1%) | 6,269 (23.6%) |
| 15 to 19 Minutes | 7,554 (26.3%) | 7,667 (28.9%) |
| 20 to 24 Minutes | 4,650 (16.2%) | 3,634 (13.7%) |
| 25 to 29 Minutes | 1,336 (4.6%) | 988 (3.7%) |
| 30 to 34 Minutes | 1,749 (6.1%) | 1,309 (4.9%) |
| 35 to 39 Minutes | 140 (0.5%) | 131 (0.5%) |
| 40 to 44 Minutes | 145 (0.5%) | 114 (0.4%) |
| 45 to 59 Minutes | 372 (1.3%) | 302 (1.1%) |
| 60 to 89 Minutes | 317 (1.1%) | 472 (1.8%) |
| 90 or more Minutes | 645 (2.2%) | 231 (0.9%) |
Time of Departure to Work by Sex in Billings
The most frequent times of departure to work in Billings are 7:30 AM to 7:59 AM (4,924, 17.1%) for males and 7:30 AM to 7:59 AM (5,874, 22.1%) for females.
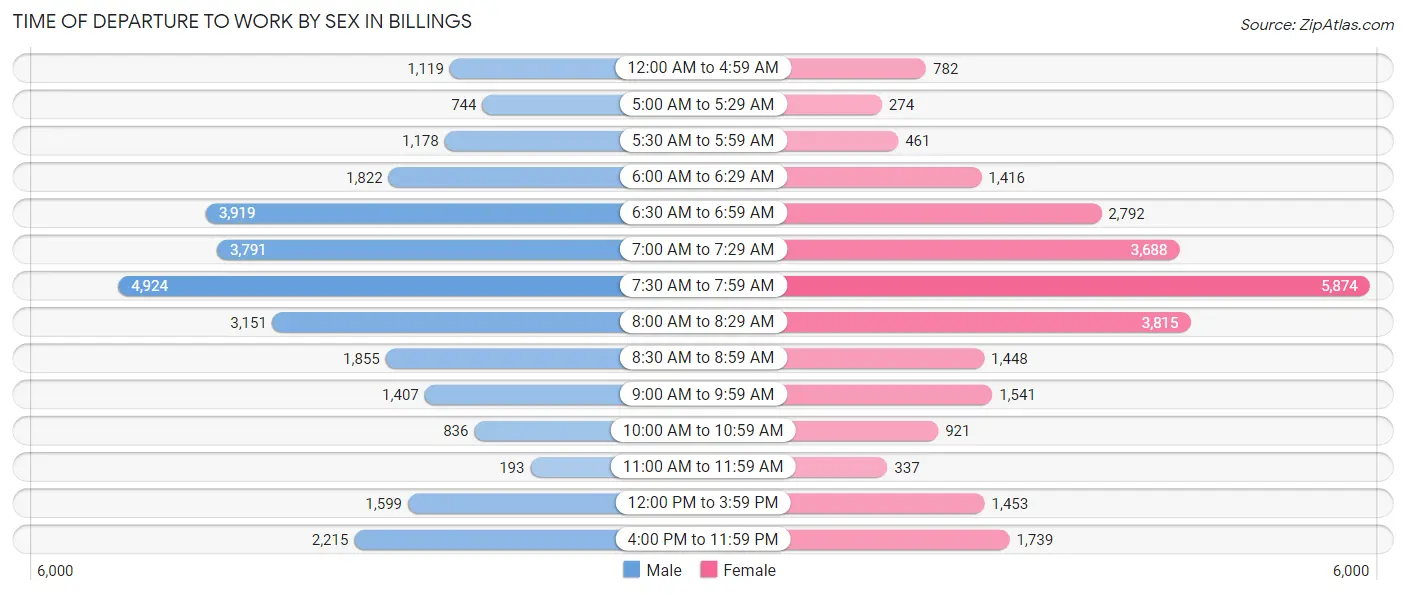
| Time of Departure | Male | Female |
| 12:00 AM to 4:59 AM | 1,119 (3.9%) | 782 (2.9%) |
| 5:00 AM to 5:29 AM | 744 (2.6%) | 274 (1.0%) |
| 5:30 AM to 5:59 AM | 1,178 (4.1%) | 461 (1.7%) |
| 6:00 AM to 6:29 AM | 1,822 (6.3%) | 1,416 (5.3%) |
| 6:30 AM to 6:59 AM | 3,919 (13.6%) | 2,792 (10.5%) |
| 7:00 AM to 7:29 AM | 3,791 (13.2%) | 3,688 (13.9%) |
| 7:30 AM to 7:59 AM | 4,924 (17.1%) | 5,874 (22.1%) |
| 8:00 AM to 8:29 AM | 3,151 (11.0%) | 3,815 (14.4%) |
| 8:30 AM to 8:59 AM | 1,855 (6.5%) | 1,448 (5.5%) |
| 9:00 AM to 9:59 AM | 1,407 (4.9%) | 1,541 (5.8%) |
| 10:00 AM to 10:59 AM | 836 (2.9%) | 921 (3.5%) |
| 11:00 AM to 11:59 AM | 193 (0.7%) | 337 (1.3%) |
| 12:00 PM to 3:59 PM | 1,599 (5.6%) | 1,453 (5.5%) |
| 4:00 PM to 11:59 PM | 2,215 (7.7%) | 1,739 (6.6%) |
| Total | 28,753 (100.0%) | 26,541 (100.0%) |
Housing Occupancy in Billings
Occupancy by Ownership in Billings
Of the total 49,228 dwellings in Billings, owner-occupied units account for 31,898 (64.8%), while renter-occupied units make up 17,330 (35.2%).
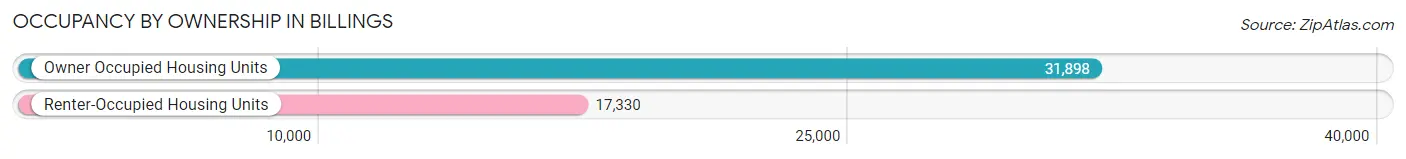
| Occupancy | # Housing Units | % Housing Units |
| Owner Occupied Housing Units | 31,898 | 64.8% |
| Renter-Occupied Housing Units | 17,330 | 35.2% |
| Total Occupied Housing Units | 49,228 | 100.0% |
Occupancy by Household Size in Billings
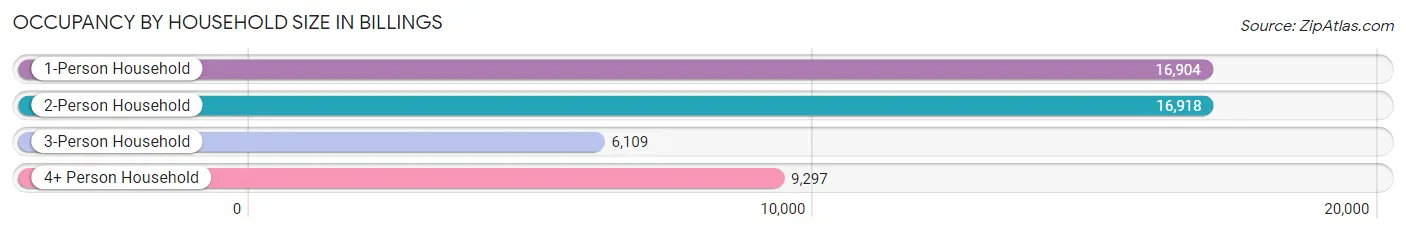
| Household Size | # Housing Units | % Housing Units |
| 1-Person Household | 16,904 | 34.3% |
| 2-Person Household | 16,918 | 34.4% |
| 3-Person Household | 6,109 | 12.4% |
| 4+ Person Household | 9,297 | 18.9% |
| Total Housing Units | 49,228 | 100.0% |
Occupancy by Ownership by Household Size in Billings
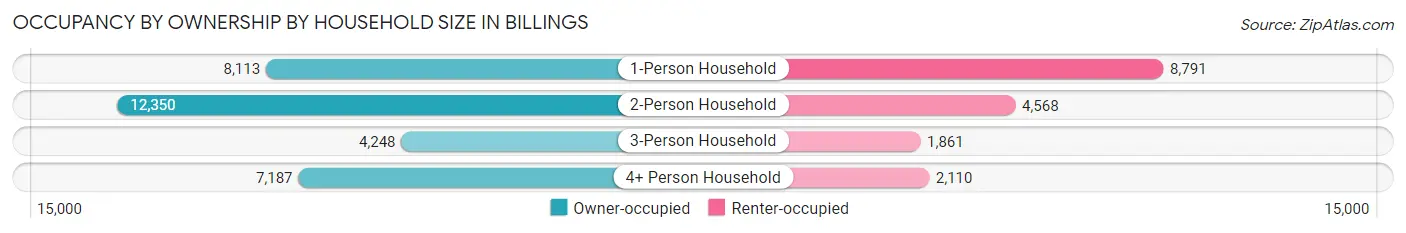
| Household Size | Owner-occupied | Renter-occupied |
| 1-Person Household | 8,113 (48.0%) | 8,791 (52.0%) |
| 2-Person Household | 12,350 (73.0%) | 4,568 (27.0%) |
| 3-Person Household | 4,248 (69.5%) | 1,861 (30.5%) |
| 4+ Person Household | 7,187 (77.3%) | 2,110 (22.7%) |
| Total Housing Units | 31,898 (64.8%) | 17,330 (35.2%) |
Occupancy by Educational Attainment in Billings
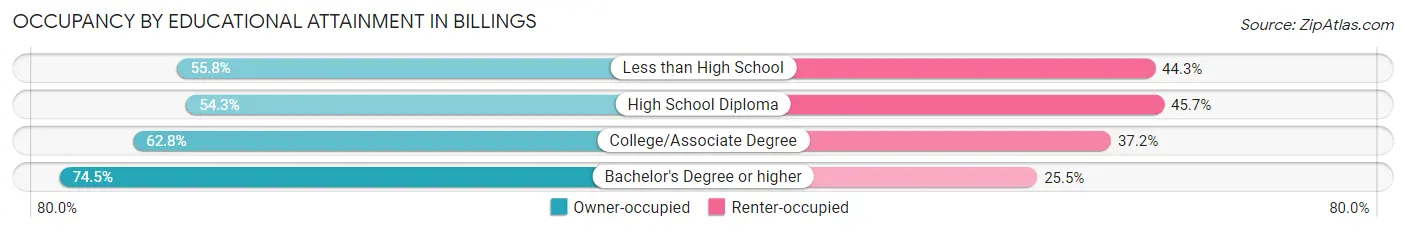
| Household Size | Owner-occupied | Renter-occupied |
| Less than High School | 926 (55.7%) | 735 (44.3%) |
| High School Diploma | 6,860 (54.3%) | 5,764 (45.7%) |
| College/Associate Degree | 10,233 (62.8%) | 6,071 (37.2%) |
| Bachelor's Degree or higher | 13,879 (74.5%) | 4,760 (25.5%) |
Occupancy by Age of Householder in Billings
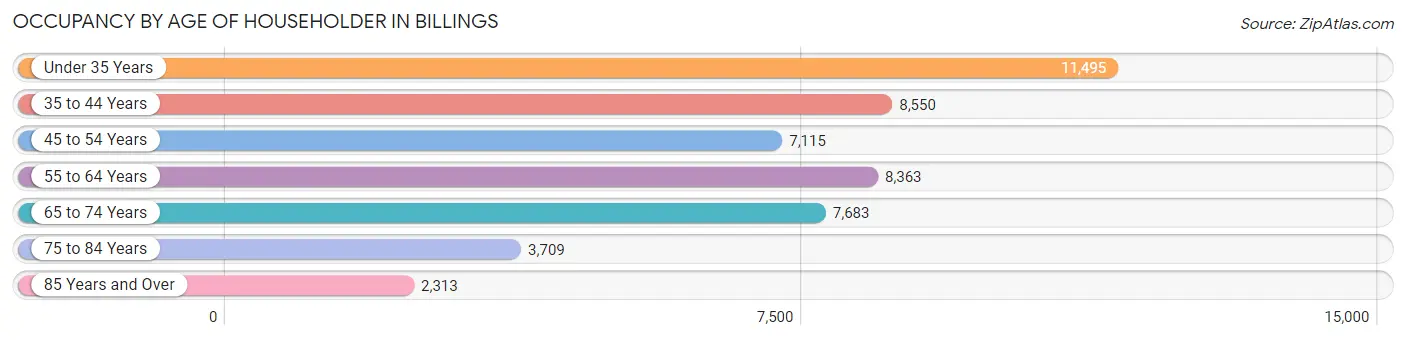
| Age Bracket | # Households | % Households |
| Under 35 Years | 11,495 | 23.4% |
| 35 to 44 Years | 8,550 | 17.4% |
| 45 to 54 Years | 7,115 | 14.4% |
| 55 to 64 Years | 8,363 | 17.0% |
| 65 to 74 Years | 7,683 | 15.6% |
| 75 to 84 Years | 3,709 | 7.5% |
| 85 Years and Over | 2,313 | 4.7% |
| Total | 49,228 | 100.0% |
Housing Finances in Billings
Median Income by Occupancy in Billings
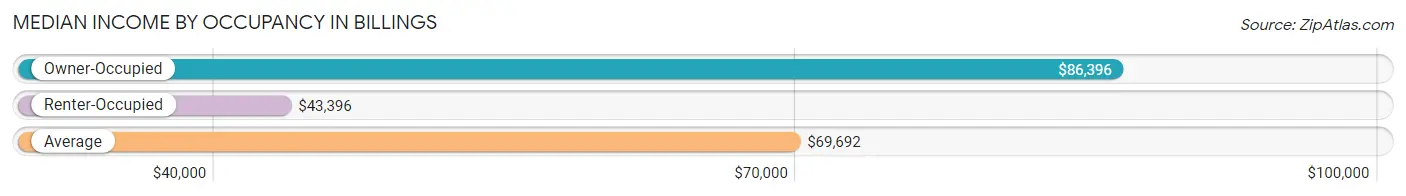
| Occupancy Type | # Households | Median Income |
| Owner-Occupied | 31,898 (64.8%) | $86,396 |
| Renter-Occupied | 17,330 (35.2%) | $43,396 |
| Average | 49,228 (100.0%) | $69,692 |
Occupancy by Householder Income Bracket in Billings
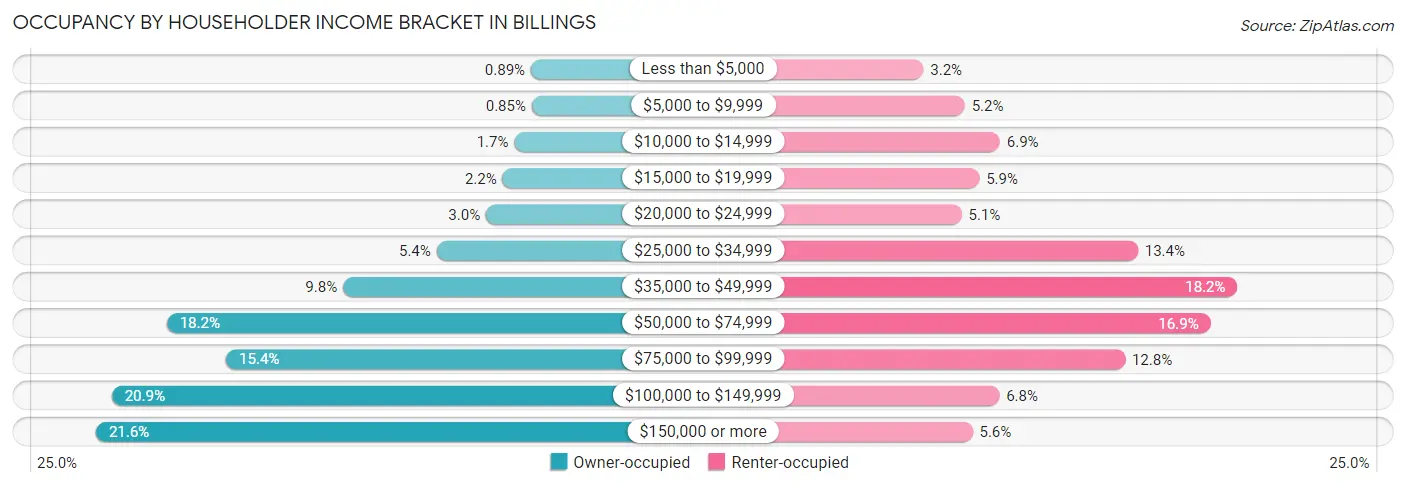
| Income Bracket | Owner-occupied | Renter-occupied |
| Less than $5,000 | 285 (0.9%) | 559 (3.2%) |
| $5,000 to $9,999 | 272 (0.9%) | 902 (5.2%) |
| $10,000 to $14,999 | 536 (1.7%) | 1,191 (6.9%) |
| $15,000 to $19,999 | 716 (2.2%) | 1,020 (5.9%) |
| $20,000 to $24,999 | 967 (3.0%) | 876 (5.1%) |
| $25,000 to $34,999 | 1,715 (5.4%) | 2,329 (13.4%) |
| $35,000 to $49,999 | 3,138 (9.8%) | 3,150 (18.2%) |
| $50,000 to $74,999 | 5,815 (18.2%) | 2,929 (16.9%) |
| $75,000 to $99,999 | 4,912 (15.4%) | 2,224 (12.8%) |
| $100,000 to $149,999 | 6,651 (20.8%) | 1,185 (6.8%) |
| $150,000 or more | 6,891 (21.6%) | 965 (5.6%) |
| Total | 31,898 (100.0%) | 17,330 (100.0%) |
Monthly Housing Cost Tiers in Billings
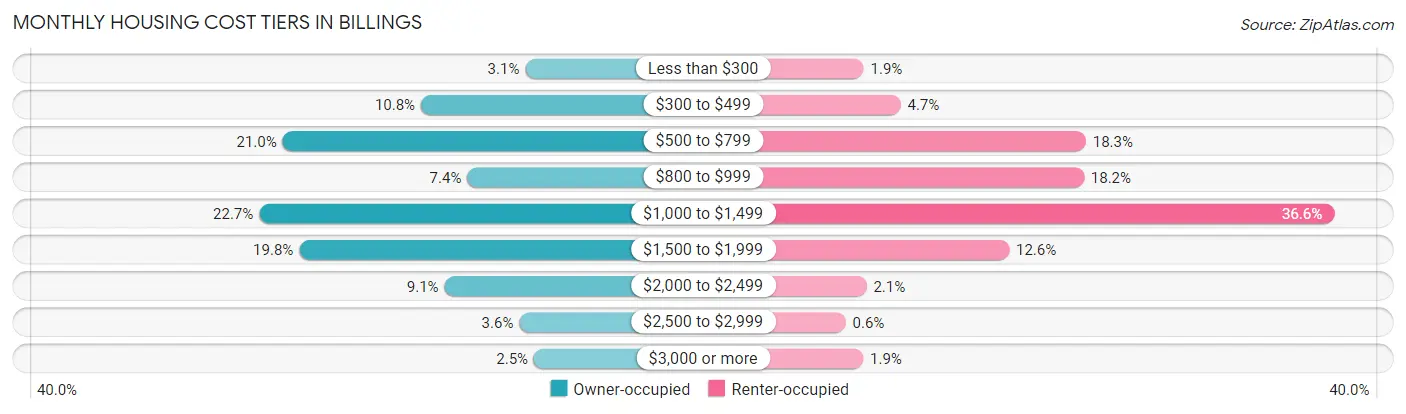
| Monthly Cost | Owner-occupied | Renter-occupied |
| Less than $300 | 1,000 (3.1%) | 334 (1.9%) |
| $300 to $499 | 3,449 (10.8%) | 805 (4.6%) |
| $500 to $799 | 6,699 (21.0%) | 3,170 (18.3%) |
| $800 to $999 | 2,360 (7.4%) | 3,145 (18.1%) |
| $1,000 to $1,499 | 7,251 (22.7%) | 6,337 (36.6%) |
| $1,500 to $1,999 | 6,310 (19.8%) | 2,191 (12.6%) |
| $2,000 to $2,499 | 2,897 (9.1%) | 370 (2.1%) |
| $2,500 to $2,999 | 1,139 (3.6%) | 104 (0.6%) |
| $3,000 or more | 793 (2.5%) | 328 (1.9%) |
| Total | 31,898 (100.0%) | 17,330 (100.0%) |
Physical Housing Characteristics in Billings
Housing Structures in Billings
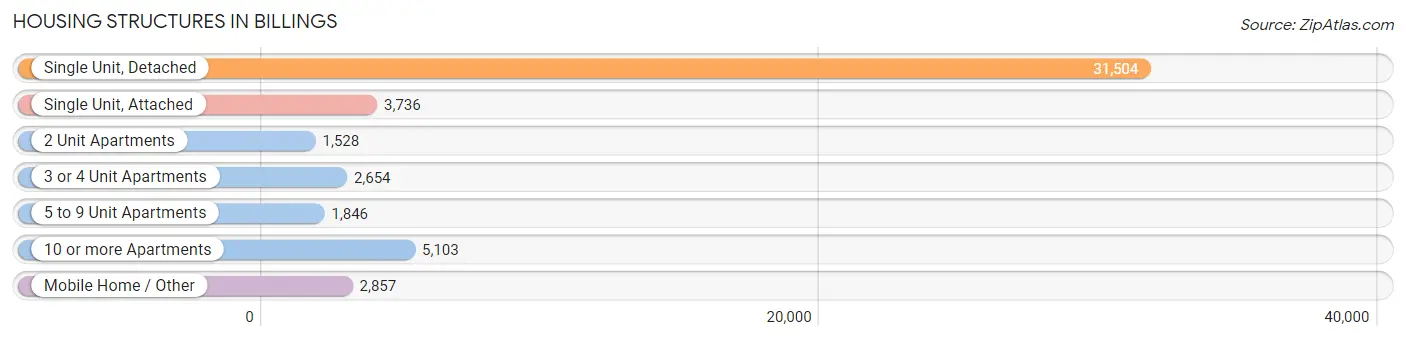
| Structure Type | # Housing Units | % Housing Units |
| Single Unit, Detached | 31,504 | 64.0% |
| Single Unit, Attached | 3,736 | 7.6% |
| 2 Unit Apartments | 1,528 | 3.1% |
| 3 or 4 Unit Apartments | 2,654 | 5.4% |
| 5 to 9 Unit Apartments | 1,846 | 3.7% |
| 10 or more Apartments | 5,103 | 10.4% |
| Mobile Home / Other | 2,857 | 5.8% |
| Total | 49,228 | 100.0% |
Housing Structures by Occupancy in Billings
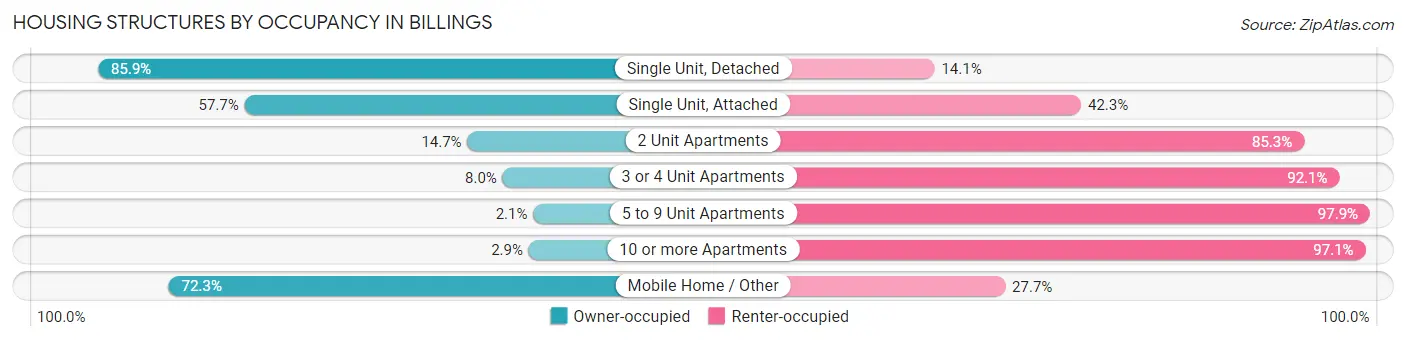
| Structure Type | Owner-occupied | Renter-occupied |
| Single Unit, Detached | 27,056 (85.9%) | 4,448 (14.1%) |
| Single Unit, Attached | 2,154 (57.7%) | 1,582 (42.3%) |
| 2 Unit Apartments | 225 (14.7%) | 1,303 (85.3%) |
| 3 or 4 Unit Apartments | 211 (8.0%) | 2,443 (92.0%) |
| 5 to 9 Unit Apartments | 38 (2.1%) | 1,808 (97.9%) |
| 10 or more Apartments | 149 (2.9%) | 4,954 (97.1%) |
| Mobile Home / Other | 2,065 (72.3%) | 792 (27.7%) |
| Total | 31,898 (64.8%) | 17,330 (35.2%) |
Housing Structures by Number of Rooms in Billings
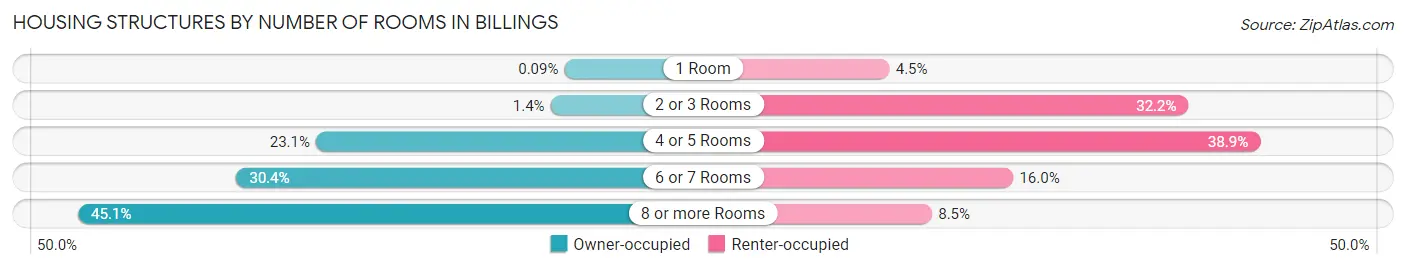
| Number of Rooms | Owner-occupied | Renter-occupied |
| 1 Room | 28 (0.1%) | 783 (4.5%) |
| 2 or 3 Rooms | 437 (1.4%) | 5,583 (32.2%) |
| 4 or 5 Rooms | 7,358 (23.1%) | 6,733 (38.9%) |
| 6 or 7 Rooms | 9,704 (30.4%) | 2,766 (16.0%) |
| 8 or more Rooms | 14,371 (45.1%) | 1,465 (8.5%) |
| Total | 31,898 (100.0%) | 17,330 (100.0%) |
Housing Structure by Heating Type in Billings
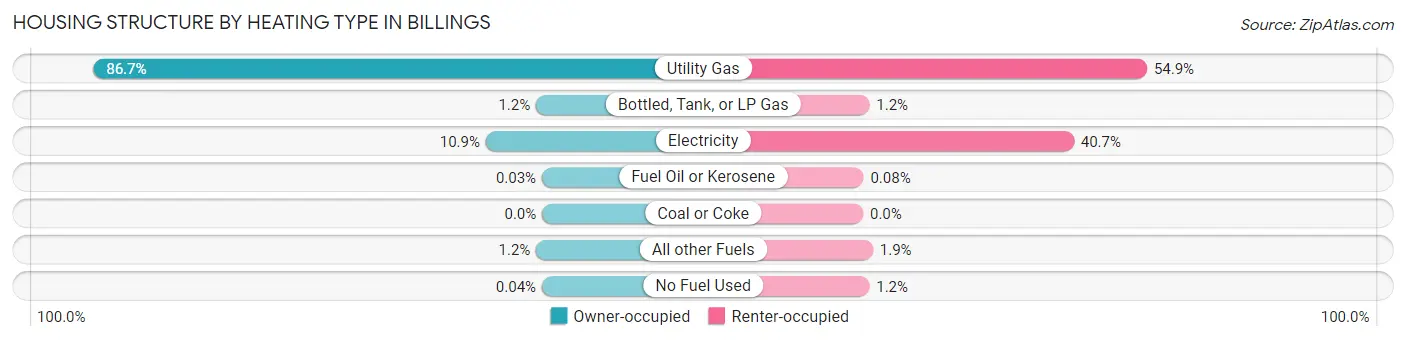
| Heating Type | Owner-occupied | Renter-occupied |
| Utility Gas | 27,661 (86.7%) | 9,507 (54.9%) |
| Bottled, Tank, or LP Gas | 373 (1.2%) | 212 (1.2%) |
| Electricity | 3,472 (10.9%) | 7,058 (40.7%) |
| Fuel Oil or Kerosene | 11 (0.0%) | 14 (0.1%) |
| Coal or Coke | 0 (0.0%) | 0 (0.0%) |
| All other Fuels | 368 (1.1%) | 330 (1.9%) |
| No Fuel Used | 13 (0.0%) | 209 (1.2%) |
| Total | 31,898 (100.0%) | 17,330 (100.0%) |
Household Vehicle Usage in Billings
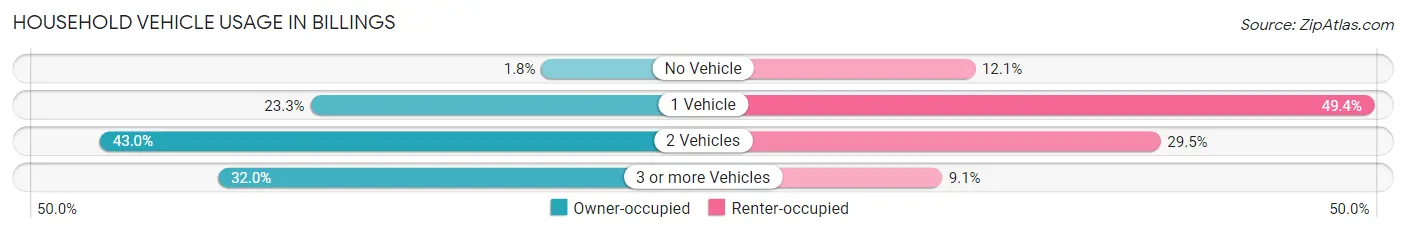
| Vehicles per Household | Owner-occupied | Renter-occupied |
| No Vehicle | 562 (1.8%) | 2,103 (12.1%) |
| 1 Vehicle | 7,438 (23.3%) | 8,556 (49.4%) |
| 2 Vehicles | 13,705 (43.0%) | 5,103 (29.4%) |
| 3 or more Vehicles | 10,193 (32.0%) | 1,568 (9.0%) |
| Total | 31,898 (100.0%) | 17,330 (100.0%) |
Real Estate & Mortgages in Billings
Real Estate and Mortgage Overview in Billings
| Characteristic | Without Mortgage | With Mortgage |
| Housing Units | 12,628 | 19,270 |
| Median Property Value | $279,900 | $288,800 |
| Median Household Income | $72,058 | $4,416 |
| Monthly Housing Costs | $571 | $793 |
| Real Estate Taxes | $2,601 | $243 |
Property Value by Mortgage Status in Billings
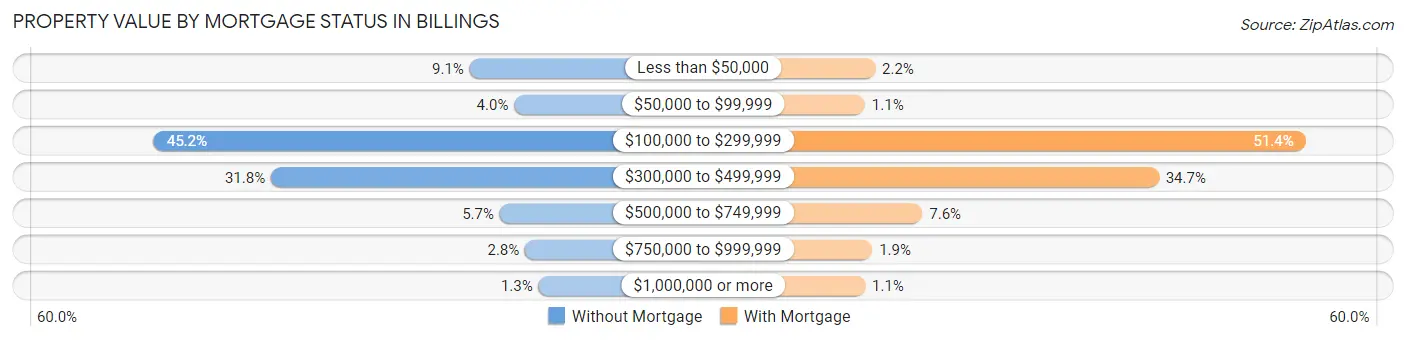
| Property Value | Without Mortgage | With Mortgage |
| Less than $50,000 | 1,153 (9.1%) | 429 (2.2%) |
| $50,000 to $99,999 | 510 (4.0%) | 206 (1.1%) |
| $100,000 to $299,999 | 5,712 (45.2%) | 9,909 (51.4%) |
| $300,000 to $499,999 | 4,021 (31.8%) | 6,678 (34.6%) |
| $500,000 to $749,999 | 719 (5.7%) | 1,470 (7.6%) |
| $750,000 to $999,999 | 354 (2.8%) | 368 (1.9%) |
| $1,000,000 or more | 159 (1.3%) | 210 (1.1%) |
| Total | 12,628 (100.0%) | 19,270 (100.0%) |
Household Income by Mortgage Status in Billings
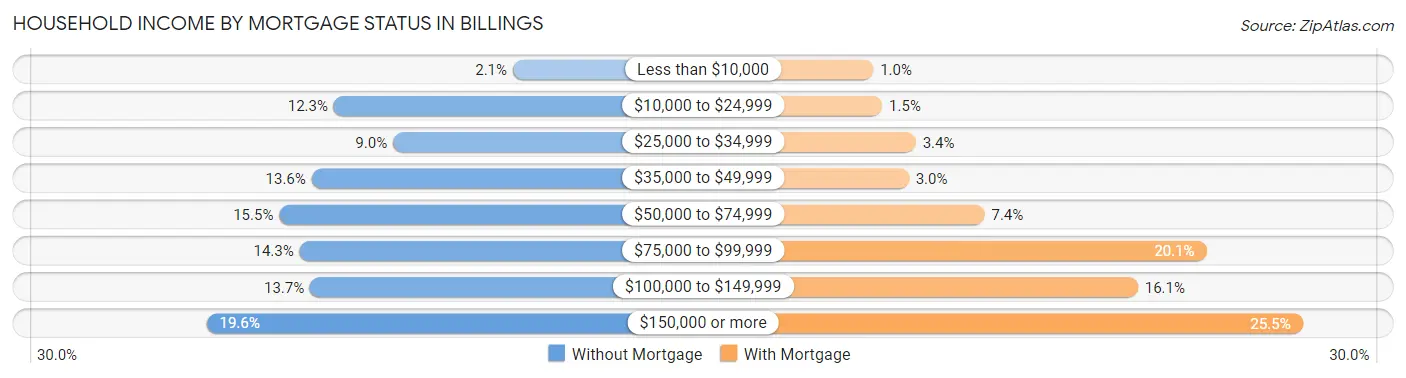
| Household Income | Without Mortgage | With Mortgage |
| Less than $10,000 | 265 (2.1%) | 194 (1.0%) |
| $10,000 to $24,999 | 1,557 (12.3%) | 292 (1.5%) |
| $25,000 to $34,999 | 1,130 (8.9%) | 662 (3.4%) |
| $35,000 to $49,999 | 1,717 (13.6%) | 585 (3.0%) |
| $50,000 to $74,999 | 1,951 (15.4%) | 1,421 (7.4%) |
| $75,000 to $99,999 | 1,804 (14.3%) | 3,864 (20.1%) |
| $100,000 to $149,999 | 1,729 (13.7%) | 3,108 (16.1%) |
| $150,000 or more | 2,475 (19.6%) | 4,922 (25.5%) |
| Total | 12,628 (100.0%) | 19,270 (100.0%) |
Property Value to Household Income Ratio in Billings
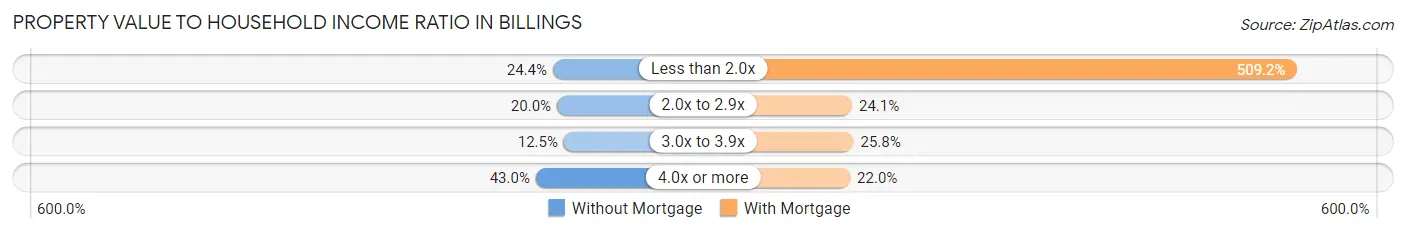
| Value-to-Income Ratio | Without Mortgage | With Mortgage |
| Less than 2.0x | 3,081 (24.4%) | 98,125 (509.2%) |
| 2.0x to 2.9x | 2,520 (20.0%) | 4,648 (24.1%) |
| 3.0x to 3.9x | 1,577 (12.5%) | 4,962 (25.8%) |
| 4.0x or more | 5,435 (43.0%) | 4,247 (22.0%) |
| Total | 12,628 (100.0%) | 19,270 (100.0%) |
Real Estate Taxes by Mortgage Status in Billings
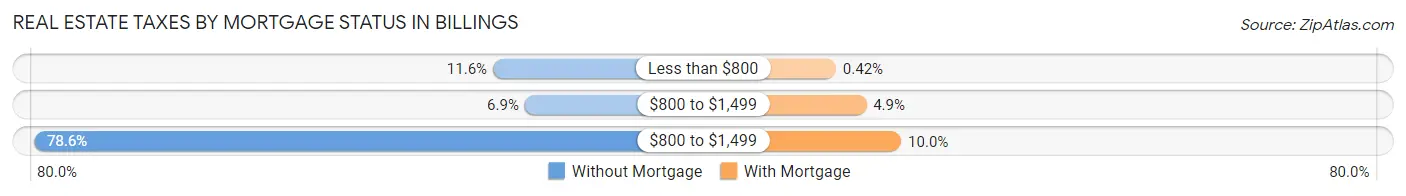
| Property Taxes | Without Mortgage | With Mortgage |
| Less than $800 | 1,461 (11.6%) | 81 (0.4%) |
| $800 to $1,499 | 874 (6.9%) | 934 (4.9%) |
| $800 to $1,499 | 9,929 (78.6%) | 1,917 (10.0%) |
| Total | 12,628 (100.0%) | 19,270 (100.0%) |
Health & Disability in Billings
Health Insurance Coverage by Age in Billings
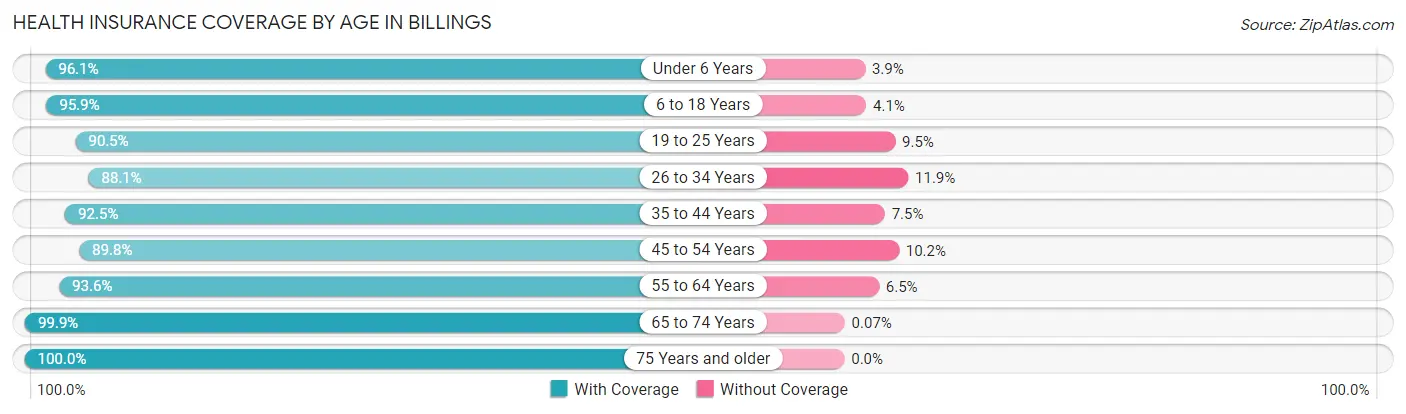
| Age Bracket | With Coverage | Without Coverage |
| Under 6 Years | 8,146 (96.1%) | 327 (3.9%) |
| 6 to 18 Years | 18,723 (95.9%) | 793 (4.1%) |
| 19 to 25 Years | 9,562 (90.5%) | 1,000 (9.5%) |
| 26 to 34 Years | 13,086 (88.1%) | 1,767 (11.9%) |
| 35 to 44 Years | 14,449 (92.5%) | 1,178 (7.5%) |
| 45 to 54 Years | 10,729 (89.8%) | 1,214 (10.2%) |
| 55 to 64 Years | 12,975 (93.5%) | 894 (6.5%) |
| 65 to 74 Years | 11,821 (99.9%) | 8 (0.1%) |
| 75 Years and older | 8,488 (100.0%) | 0 (0.0%) |
| Total | 107,979 (93.8%) | 7,181 (6.2%) |
Health Insurance Coverage by Citizenship Status in Billings
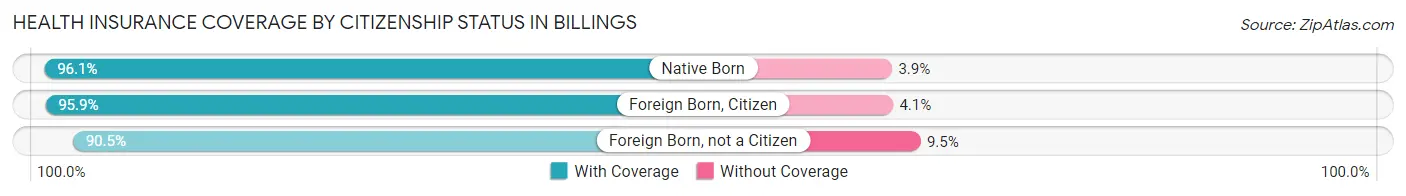
| Citizenship Status | With Coverage | Without Coverage |
| Native Born | 8,146 (96.1%) | 327 (3.9%) |
| Foreign Born, Citizen | 18,723 (95.9%) | 793 (4.1%) |
| Foreign Born, not a Citizen | 9,562 (90.5%) | 1,000 (9.5%) |
Health Insurance Coverage by Household Income in Billings
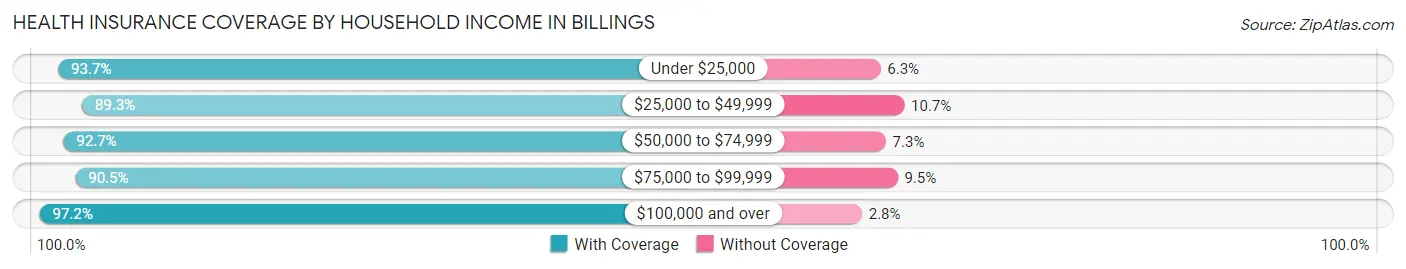
| Household Income | With Coverage | Without Coverage |
| Under $25,000 | 10,525 (93.7%) | 706 (6.3%) |
| $25,000 to $49,999 | 16,432 (89.3%) | 1,977 (10.7%) |
| $50,000 to $74,999 | 18,057 (92.7%) | 1,417 (7.3%) |
| $75,000 to $99,999 | 16,564 (90.5%) | 1,739 (9.5%) |
| $100,000 and over | 45,233 (97.2%) | 1,308 (2.8%) |
Public vs Private Health Insurance Coverage by Age in Billings
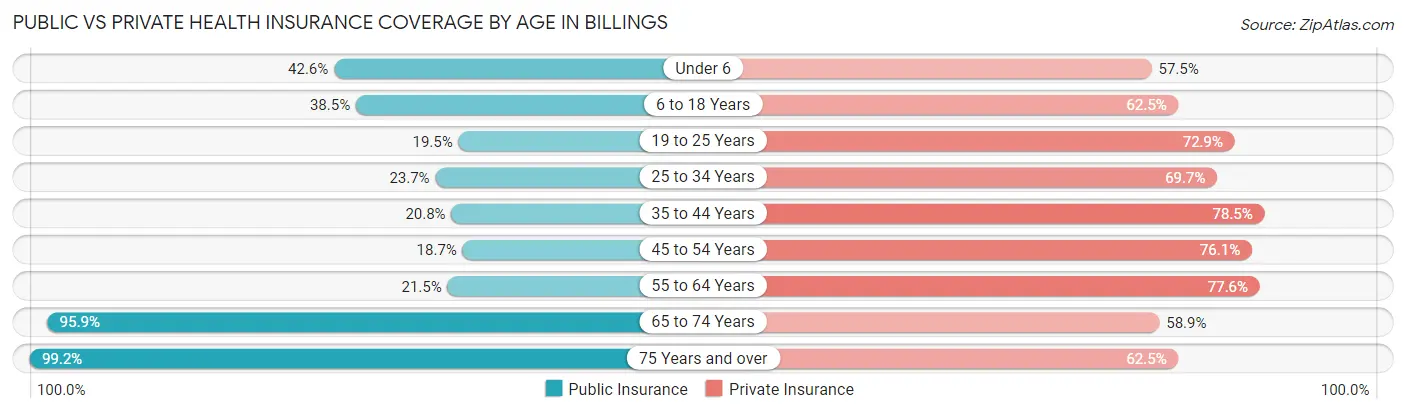
| Age Bracket | Public Insurance | Private Insurance |
| Under 6 | 3,605 (42.5%) | 4,872 (57.5%) |
| 6 to 18 Years | 7,511 (38.5%) | 12,201 (62.5%) |
| 19 to 25 Years | 2,055 (19.5%) | 7,704 (72.9%) |
| 25 to 34 Years | 3,526 (23.7%) | 10,349 (69.7%) |
| 35 to 44 Years | 3,246 (20.8%) | 12,262 (78.5%) |
| 45 to 54 Years | 2,232 (18.7%) | 9,092 (76.1%) |
| 55 to 64 Years | 2,982 (21.5%) | 10,761 (77.6%) |
| 65 to 74 Years | 11,344 (95.9%) | 6,971 (58.9%) |
| 75 Years and over | 8,419 (99.2%) | 5,304 (62.5%) |
| Total | 44,920 (39.0%) | 79,516 (69.1%) |
Disability Status by Sex by Age in Billings
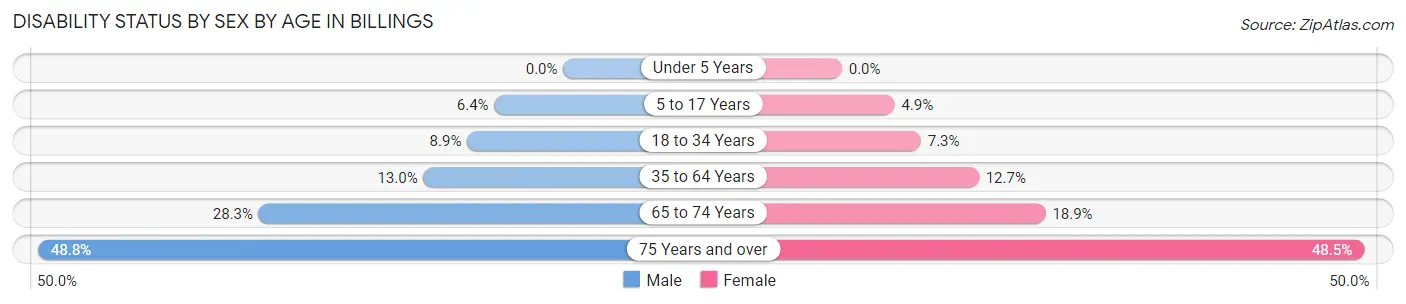
| Age Bracket | Male | Female |
| Under 5 Years | 0 (0.0%) | 0 (0.0%) |
| 5 to 17 Years | 640 (6.4%) | 470 (4.9%) |
| 18 to 34 Years | 1,212 (8.9%) | 976 (7.3%) |
| 35 to 64 Years | 2,720 (13.0%) | 2,602 (12.7%) |
| 65 to 74 Years | 1,574 (28.3%) | 1,183 (18.9%) |
| 75 Years and over | 1,613 (48.8%) | 2,510 (48.5%) |
Disability Class by Sex by Age in Billings
Disability Class: Hearing Difficulty
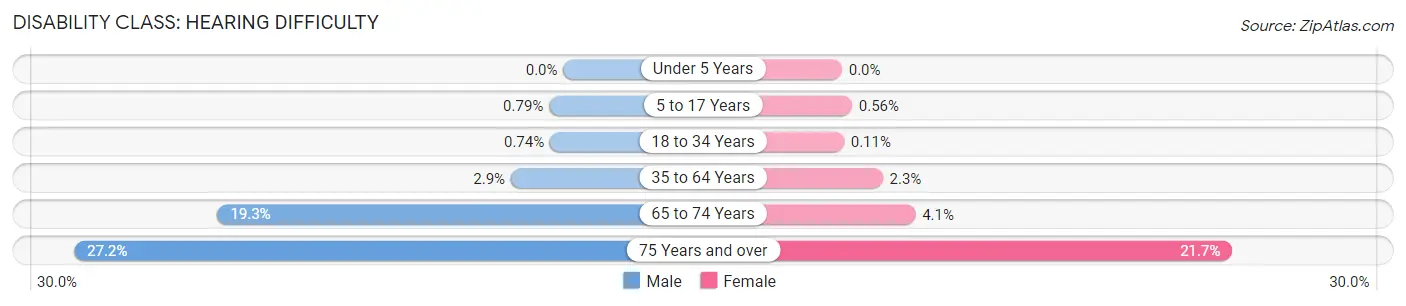
| Age Bracket | Male | Female |
| Under 5 Years | 0 (0.0%) | 0 (0.0%) |
| 5 to 17 Years | 79 (0.8%) | 54 (0.6%) |
| 18 to 34 Years | 101 (0.7%) | 14 (0.1%) |
| 35 to 64 Years | 612 (2.9%) | 465 (2.3%) |
| 65 to 74 Years | 1,073 (19.3%) | 256 (4.1%) |
| 75 Years and over | 901 (27.2%) | 1,126 (21.7%) |
Disability Class: Vision Difficulty
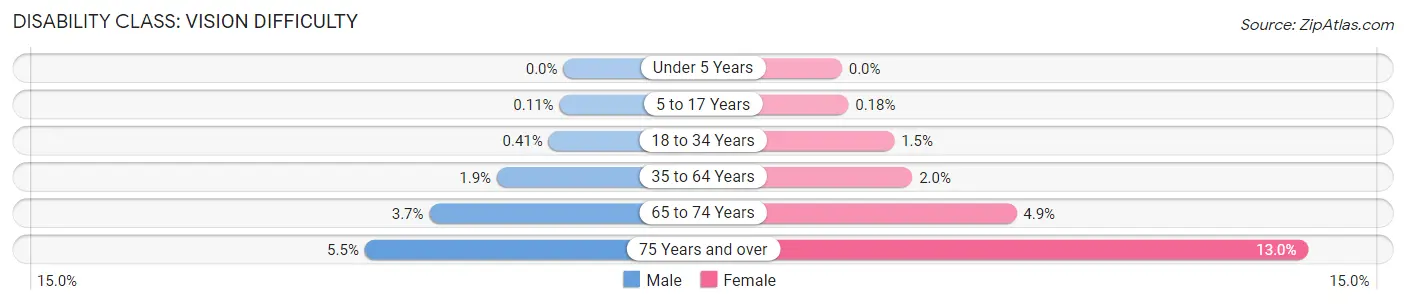
| Age Bracket | Male | Female |
| Under 5 Years | 0 (0.0%) | 0 (0.0%) |
| 5 to 17 Years | 11 (0.1%) | 17 (0.2%) |
| 18 to 34 Years | 56 (0.4%) | 195 (1.5%) |
| 35 to 64 Years | 387 (1.8%) | 401 (2.0%) |
| 65 to 74 Years | 208 (3.7%) | 304 (4.9%) |
| 75 Years and over | 183 (5.5%) | 673 (13.0%) |
Disability Class: Cognitive Difficulty
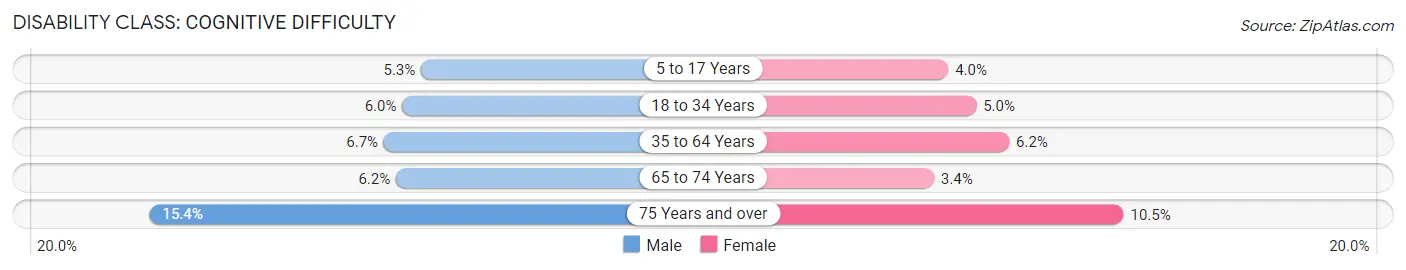
| Age Bracket | Male | Female |
| 5 to 17 Years | 528 (5.3%) | 380 (4.0%) |
| 18 to 34 Years | 813 (6.0%) | 664 (5.0%) |
| 35 to 64 Years | 1,395 (6.7%) | 1,271 (6.2%) |
| 65 to 74 Years | 346 (6.2%) | 214 (3.4%) |
| 75 Years and over | 508 (15.4%) | 542 (10.5%) |
Disability Class: Ambulatory Difficulty
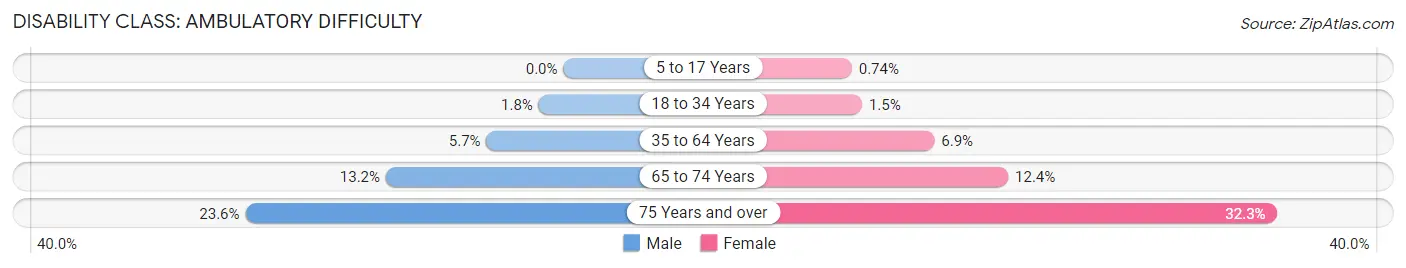
| Age Bracket | Male | Female |
| 5 to 17 Years | 0 (0.0%) | 71 (0.7%) |
| 18 to 34 Years | 249 (1.8%) | 200 (1.5%) |
| 35 to 64 Years | 1,196 (5.7%) | 1,406 (6.9%) |
| 65 to 74 Years | 734 (13.2%) | 773 (12.3%) |
| 75 Years and over | 781 (23.6%) | 1,675 (32.3%) |
Disability Class: Self-Care Difficulty
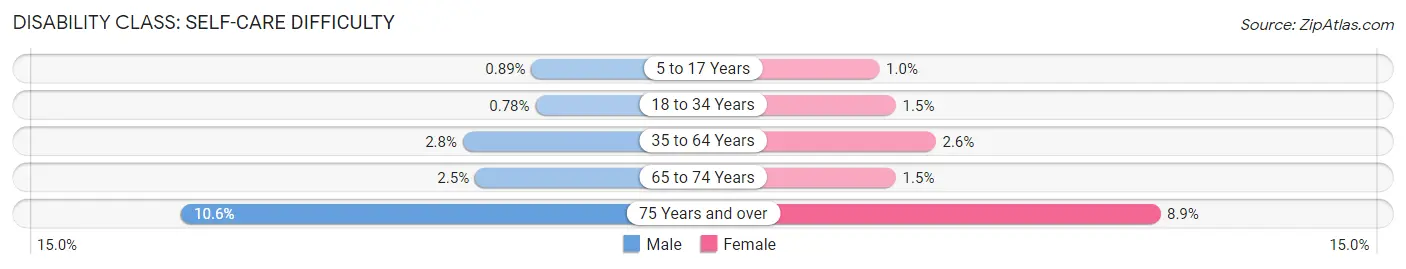
| Age Bracket | Male | Female |
| 5 to 17 Years | 89 (0.9%) | 100 (1.0%) |
| 18 to 34 Years | 106 (0.8%) | 200 (1.5%) |
| 35 to 64 Years | 587 (2.8%) | 535 (2.6%) |
| 65 to 74 Years | 137 (2.5%) | 94 (1.5%) |
| 75 Years and over | 352 (10.6%) | 459 (8.9%) |
Technology Access in Billings
Computing Device Access in Billings
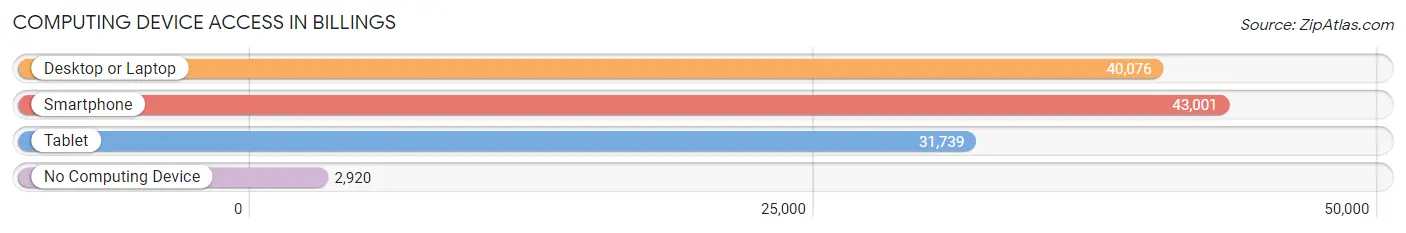
| Device Type | # Households | % Households |
| Desktop or Laptop | 40,076 | 81.4% |
| Smartphone | 43,001 | 87.4% |
| Tablet | 31,739 | 64.5% |
| No Computing Device | 2,920 | 5.9% |
| Total | 49,228 | 100.0% |
Internet Access in Billings
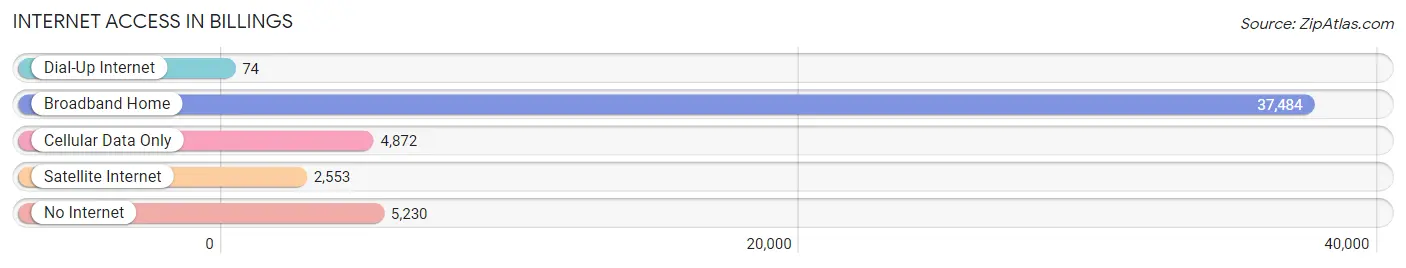
| Internet Type | # Households | % Households |
| Dial-Up Internet | 74 | 0.2% |
| Broadband Home | 37,484 | 76.1% |
| Cellular Data Only | 4,872 | 9.9% |
| Satellite Internet | 2,553 | 5.2% |
| No Internet | 5,230 | 10.6% |
| Total | 49,228 | 100.0% |
Billings Summary
Billings, Montana is the largest city in the state and the county seat of Yellowstone County. It is located in the south-central portion of the state, near the Wyoming border. The city is situated in the Yellowstone Valley, which is a wide, flat valley surrounded by the Rims, a large formation of sandstone cliffs. Billings is the largest city in a 500-mile radius, and is the principal city of the Billings Metropolitan Area, which has a population of over 170,000.
History
The area that is now Billings was first inhabited by Native Americans, including the Crow, Cheyenne, and Sioux tribes. The first European settlers arrived in the area in the late 1800s, and the city was officially founded in 1882. The city was named after Frederick Billings, a former president of the Northern Pacific Railway.
The city quickly grew, and by the early 1900s, it was the largest city in Montana. The city was a major hub for the Northern Pacific Railway, and it was also a major center for the cattle industry. The city was also home to a large number of saloons and brothels, which earned it the nickname “The Magic City.”
In the mid-1900s, the city began to diversify its economy, and it became a major center for healthcare, education, and finance. The city also became a major center for oil and gas production, and it is now home to several major oil and gas companies.
Geography
Billings is located in the Yellowstone Valley, which is a wide, flat valley surrounded by the Rims, a large formation of sandstone cliffs. The city is situated at an elevation of 3,118 feet, and it is located at the intersection of Interstate 90 and Interstate 94. The city is located near the Yellowstone River, and it is also close to several major lakes, including Lake Elmo and Lake Yellowstone.
The city has a total area of 37.2 square miles, and it has a humid continental climate, with cold, dry winters and hot, humid summers. The average annual temperature is 44.3 degrees Fahrenheit, and the average annual precipitation is 16.3 inches.
Economy
Billings is the economic hub of the region, and it is home to a diverse economy. The city is a major center for healthcare, education, finance, and oil and gas production. The city is also home to several major companies, including St. Vincent Healthcare, First Interstate Bank, and ConocoPhillips.
The city is also home to a large number of small businesses, including restaurants, retail stores, and service providers. The city is also home to a large number of tourist attractions, including the Yellowstone Art Museum, the Moss Mansion, and the Western Heritage Center.
Demographics
As of the 2010 census, the population of Billings was 104,170, and the population of the Billings Metropolitan Area was 170,498. The city has a population density of 2,811 people per square mile, and the median household income is $50,867. The median age is 35.7 years, and the city is home to a large number of ethnic and racial minorities. The largest racial group is white, at 83.3%, followed by Native American, at 6.2%, and Hispanic or Latino, at 5.3%. The city is also home to a large number of immigrants, with the largest group being from Mexico, at 4.2%.
Common Questions
What is Per Capita Income in Billings?
Per Capita income in Billings is $40,679.
What is the Median Family Income in Billings?
Median Family Income in Billings is $91,082.
What is the Median Household income in Billings?
Median Household Income in Billings is $69,692.
What is Income or Wage Gap in Billings?
Income or Wage Gap in Billings is 25.3%.
Women in Billings earn 74.7 cents for every dollar earned by a man.
What is Family Income Deficit in Billings?
Family Income Deficit in Billings is $10,046.
Families that are below poverty line in Billings earn $10,046 less on average than the poverty threshold level.
What is Inequality or Gini Index in Billings?
Inequality or Gini Index in Billings is 0.46.
What is the Total Population of Billings?
Total Population of Billings is 117,093.
What is the Total Male Population of Billings?
Total Male Population of Billings is 57,907.
What is the Total Female Population of Billings?
Total Female Population of Billings is 59,186.
What is the Ratio of Males per 100 Females in Billings?
There are 97.84 Males per 100 Females in Billings.
What is the Ratio of Females per 100 Males in Billings?
There are 102.21 Females per 100 Males in Billings.
What is the Median Population Age in Billings?
Median Population Age in Billings is 37.7 Years.
What is the Average Family Size in Billings
Average Family Size in Billings is 3.0 People.
What is the Average Household Size in Billings
Average Household Size in Billings is 2.3 People.
How Large is the Labor Force in Billings?
There are 62,311 People in the Labor Forcein in Billings.
What is the Percentage of People in the Labor Force in Billings?
66.5% of People are in the Labor Force in Billings.
What is the Unemployment Rate in Billings?
Unemployment Rate in Billings is 3.6%.