East Grand Forks, MN Map & Demographics
East Grand Forks Map
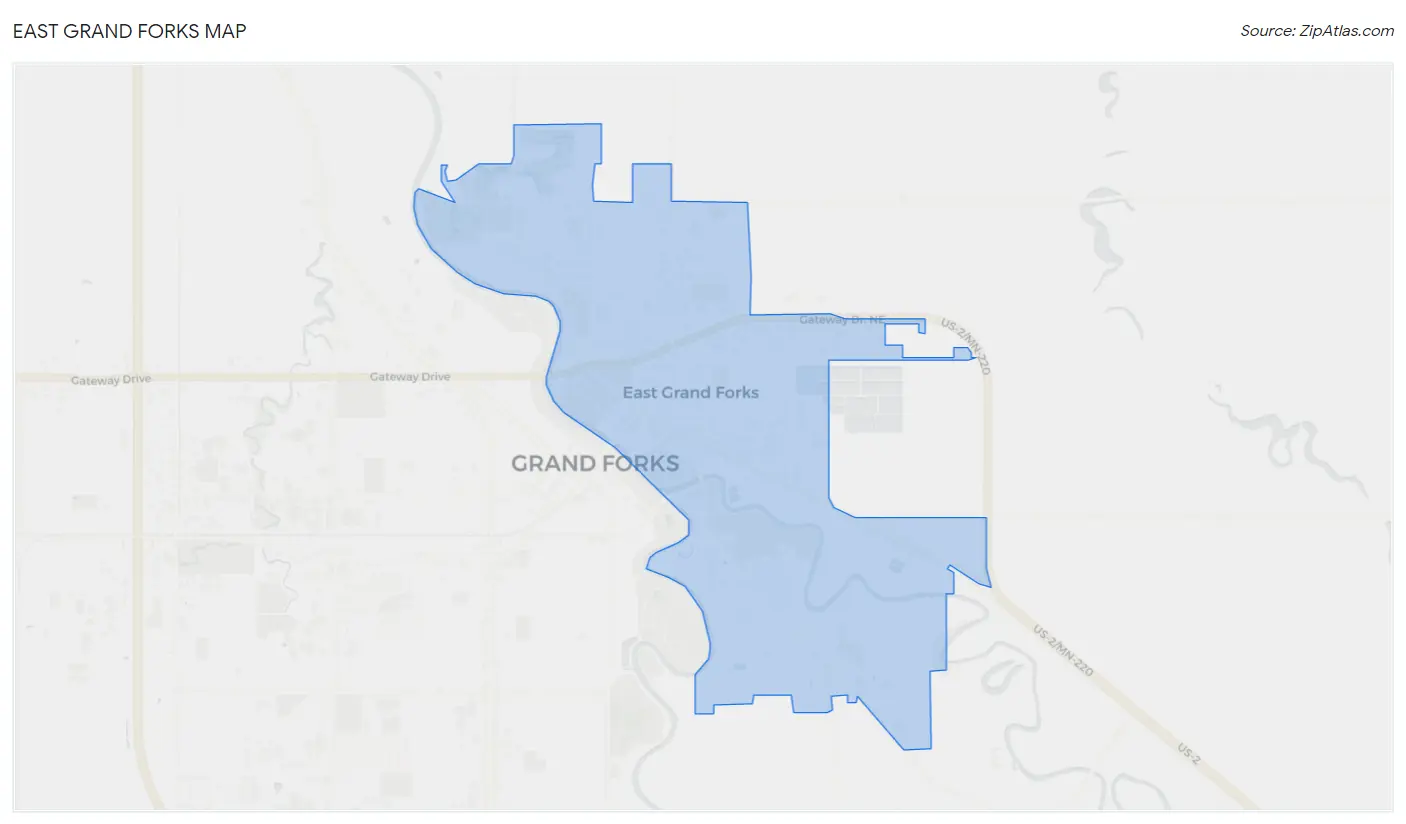
East Grand Forks Overview
$34,821
PER CAPITA INCOME
$102,545
AVG FAMILY INCOME
$81,783
AVG HOUSEHOLD INCOME
24.7%
WAGE / INCOME GAP [ % ]
75.3¢/ $1
WAGE / INCOME GAP [ $ ]
0.40
INEQUALITY / GINI INDEX
9,118
TOTAL POPULATION
4,743
MALE POPULATION
4,375
FEMALE POPULATION
108.41
MALES / 100 FEMALES
92.24
FEMALES / 100 MALES
33.6
MEDIAN AGE
3.2
AVG FAMILY SIZE
2.7
AVG HOUSEHOLD SIZE
4,851
LABOR FORCE [ PEOPLE ]
72.2%
PERCENT IN LABOR FORCE
3.3%
UNEMPLOYMENT RATE
East Grand Forks Zip Codes
East Grand Forks Area Codes
Income in East Grand Forks
Income Overview in East Grand Forks
Per Capita Income in East Grand Forks is $34,821, while median incomes of families and households are $102,545 and $81,783 respectively.
| Characteristic | Number | Measure |
| Per Capita Income | 9,118 | $34,821 |
| Median Family Income | 2,299 | $102,545 |
| Mean Family Income | 2,299 | $109,337 |
| Median Household Income | 3,371 | $81,783 |
| Mean Household Income | 3,371 | $91,866 |
| Income Deficit | 2,299 | $0 |
| Wage / Income Gap (%) | 9,118 | 24.72% |
| Wage / Income Gap ($) | 9,118 | 75.28¢ per $1 |
| Gini / Inequality Index | 9,118 | 0.40 |
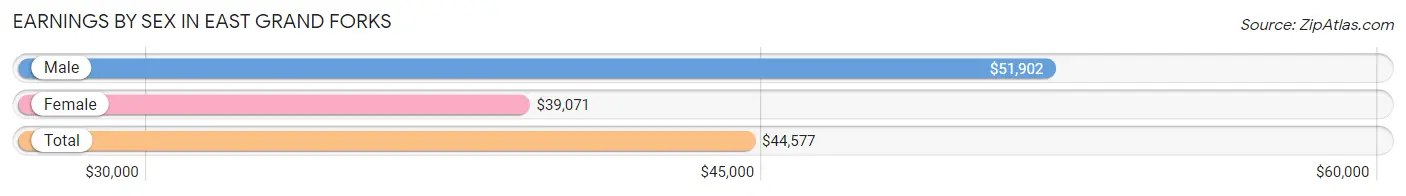
Earnings by Sex in East Grand Forks
Average Earnings in East Grand Forks are $44,577, $51,902 for men and $39,071 for women, a difference of 24.7%.
| Sex | Number | Average Earnings |
| Male | 2,604 (51.3%) | $51,902 |
| Female | 2,468 (48.7%) | $39,071 |
| Total | 5,072 (100.0%) | $44,577 |
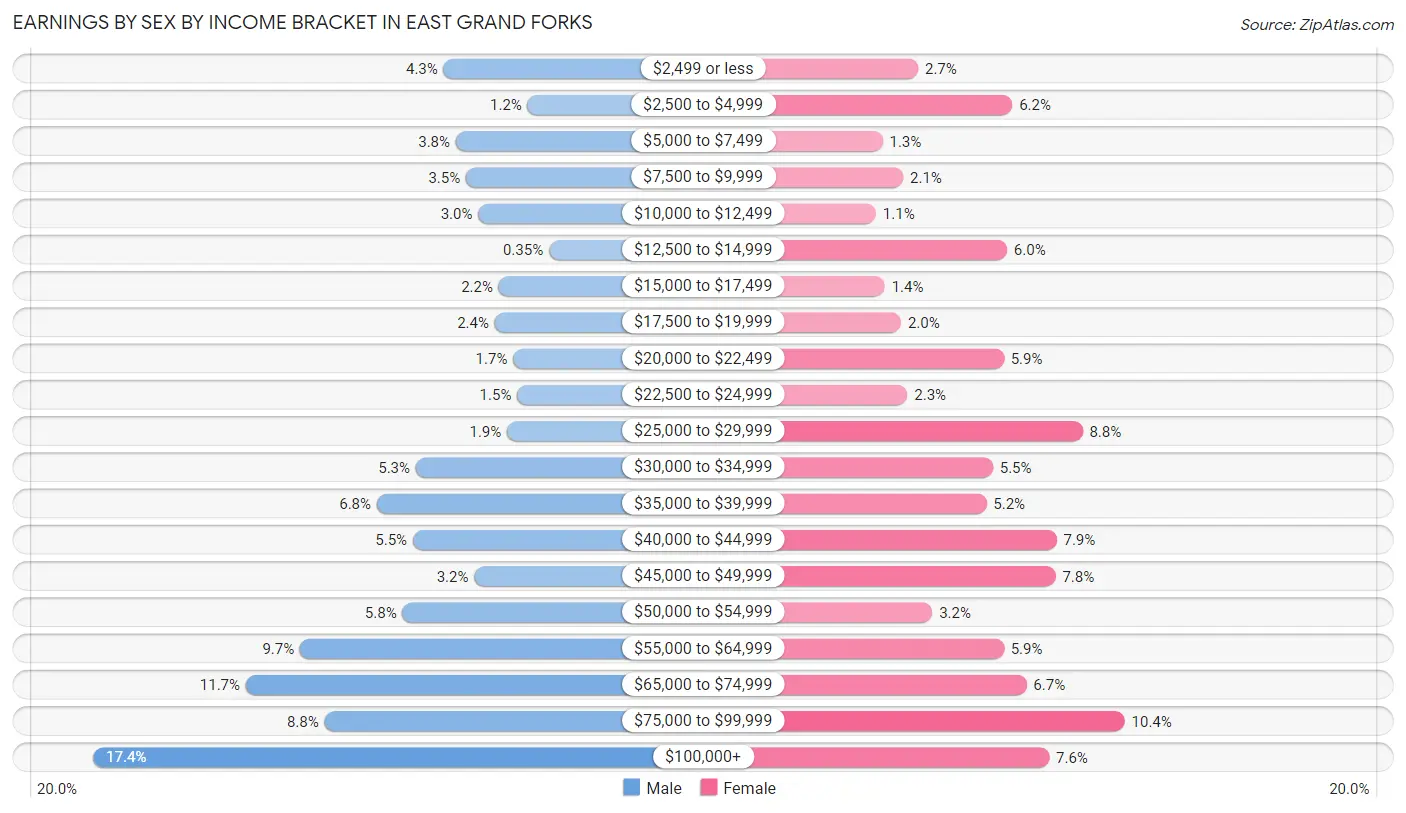
Earnings by Sex by Income Bracket in East Grand Forks
The most common earnings brackets in East Grand Forks are $100,000+ for men (454 | 17.4%) and $75,000 to $99,999 for women (257 | 10.4%).
| Income | Male | Female |
| $2,499 or less | 112 (4.3%) | 66 (2.7%) |
| $2,500 to $4,999 | 30 (1.1%) | 153 (6.2%) |
| $5,000 to $7,499 | 100 (3.8%) | 33 (1.3%) |
| $7,500 to $9,999 | 90 (3.5%) | 52 (2.1%) |
| $10,000 to $12,499 | 78 (3.0%) | 27 (1.1%) |
| $12,500 to $14,999 | 9 (0.4%) | 148 (6.0%) |
| $15,000 to $17,499 | 58 (2.2%) | 35 (1.4%) |
| $17,500 to $19,999 | 62 (2.4%) | 50 (2.0%) |
| $20,000 to $22,499 | 44 (1.7%) | 145 (5.9%) |
| $22,500 to $24,999 | 40 (1.5%) | 56 (2.3%) |
| $25,000 to $29,999 | 50 (1.9%) | 218 (8.8%) |
| $30,000 to $34,999 | 139 (5.3%) | 135 (5.5%) |
| $35,000 to $39,999 | 177 (6.8%) | 129 (5.2%) |
| $40,000 to $44,999 | 142 (5.4%) | 194 (7.9%) |
| $45,000 to $49,999 | 82 (3.2%) | 193 (7.8%) |
| $50,000 to $54,999 | 152 (5.8%) | 79 (3.2%) |
| $55,000 to $64,999 | 252 (9.7%) | 145 (5.9%) |
| $65,000 to $74,999 | 305 (11.7%) | 166 (6.7%) |
| $75,000 to $99,999 | 228 (8.8%) | 257 (10.4%) |
| $100,000+ | 454 (17.4%) | 187 (7.6%) |
| Total | 2,604 (100.0%) | 2,468 (100.0%) |
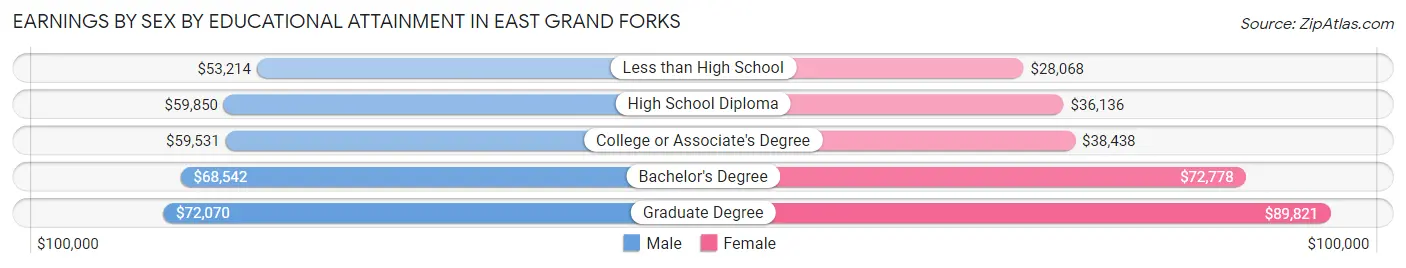
Earnings by Sex by Educational Attainment in East Grand Forks
Average earnings in East Grand Forks are $61,520 for men and $44,763 for women, a difference of 27.2%. Men with an educational attainment of graduate degree enjoy the highest average annual earnings of $72,070, while those with less than high school education earn the least with $53,214. Women with an educational attainment of graduate degree earn the most with the average annual earnings of $89,821, while those with less than high school education have the smallest earnings of $28,068.
| Educational Attainment | Male Income | Female Income |
| Less than High School | $53,214 | $28,068 |
| High School Diploma | $59,850 | $36,136 |
| College or Associate's Degree | $59,531 | $38,438 |
| Bachelor's Degree | $68,542 | $72,778 |
| Graduate Degree | $72,070 | $89,821 |
| Total | $61,520 | $44,763 |
Family Income in East Grand Forks
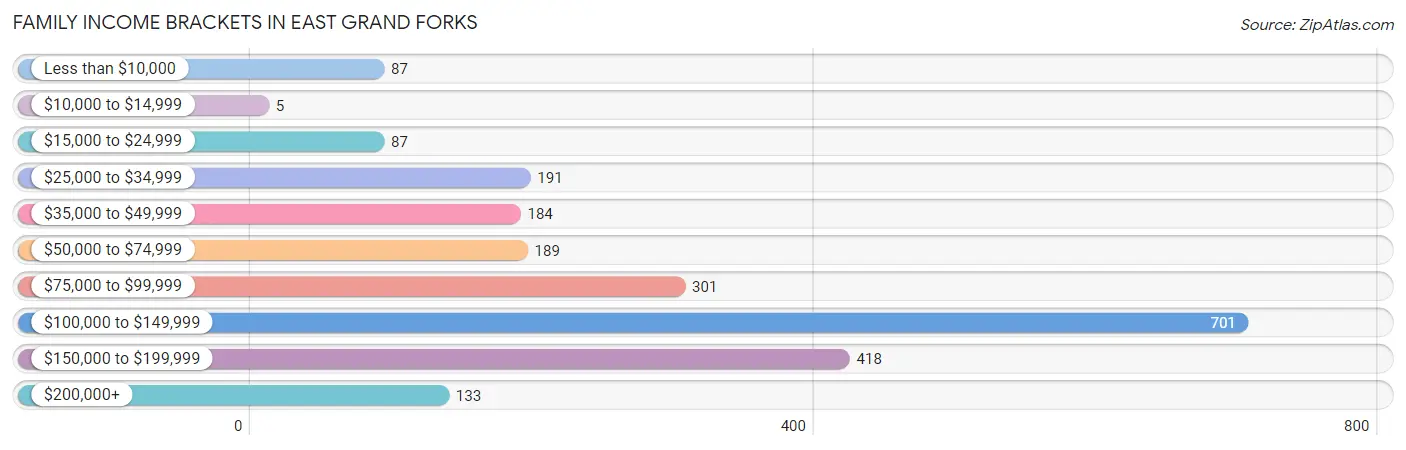
Family Income Brackets in East Grand Forks
According to the East Grand Forks family income data, there are 701 families falling into the $100,000 to $149,999 income range, which is the most common income bracket and makes up 30.5% of all families. Conversely, the $10,000 to $14,999 income bracket is the least frequent group with only 5 families (0.2%) belonging to this category.
| Income Bracket | # Families | % Families |
| Less than $10,000 | 87 | 3.8% |
| $10,000 to $14,999 | 5 | 0.2% |
| $15,000 to $24,999 | 87 | 3.8% |
| $25,000 to $34,999 | 191 | 8.3% |
| $35,000 to $49,999 | 184 | 8.0% |
| $50,000 to $74,999 | 189 | 8.2% |
| $75,000 to $99,999 | 301 | 13.1% |
| $100,000 to $149,999 | 701 | 30.5% |
| $150,000 to $199,999 | 418 | 18.2% |
| $200,000+ | 133 | 5.8% |
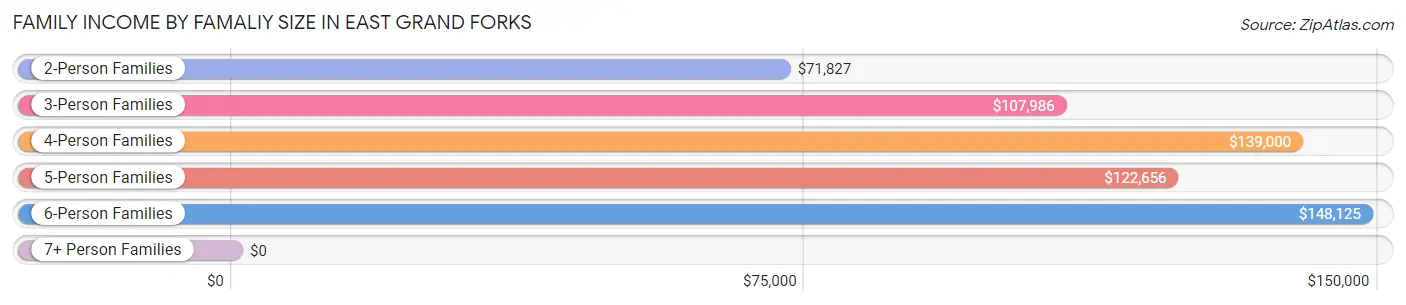
Family Income by Famaliy Size in East Grand Forks
6-person families (46 | 2.0%) account for the highest median family income in East Grand Forks with $148,125 per family, while 3-person families (396 | 17.2%) have the highest median income of $35,995 per family member.
| Income Bracket | # Families | Median Income |
| 2-Person Families | 1,067 (46.4%) | $71,827 |
| 3-Person Families | 396 (17.2%) | $107,986 |
| 4-Person Families | 504 (21.9%) | $139,000 |
| 5-Person Families | 277 (12.0%) | $122,656 |
| 6-Person Families | 46 (2.0%) | $148,125 |
| 7+ Person Families | 9 (0.4%) | $0 |
| Total | 2,299 (100.0%) | $102,545 |
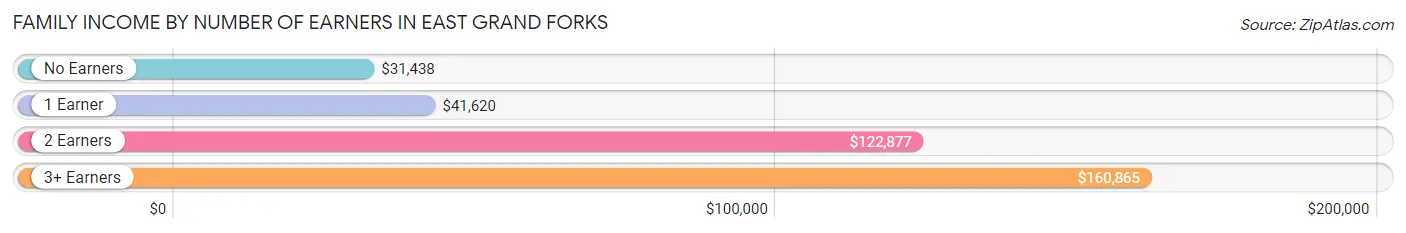
Family Income by Number of Earners in East Grand Forks
The median family income in East Grand Forks is $102,545, with families comprising 3+ earners (257) having the highest median family income of $160,865, while families with no earners (243) have the lowest median family income of $31,438, accounting for 11.2% and 10.6% of families, respectively.
| Number of Earners | # Families | Median Income |
| No Earners | 243 (10.6%) | $31,438 |
| 1 Earner | 551 (24.0%) | $41,620 |
| 2 Earners | 1,248 (54.3%) | $122,877 |
| 3+ Earners | 257 (11.2%) | $160,865 |
| Total | 2,299 (100.0%) | $102,545 |
Household Income in East Grand Forks
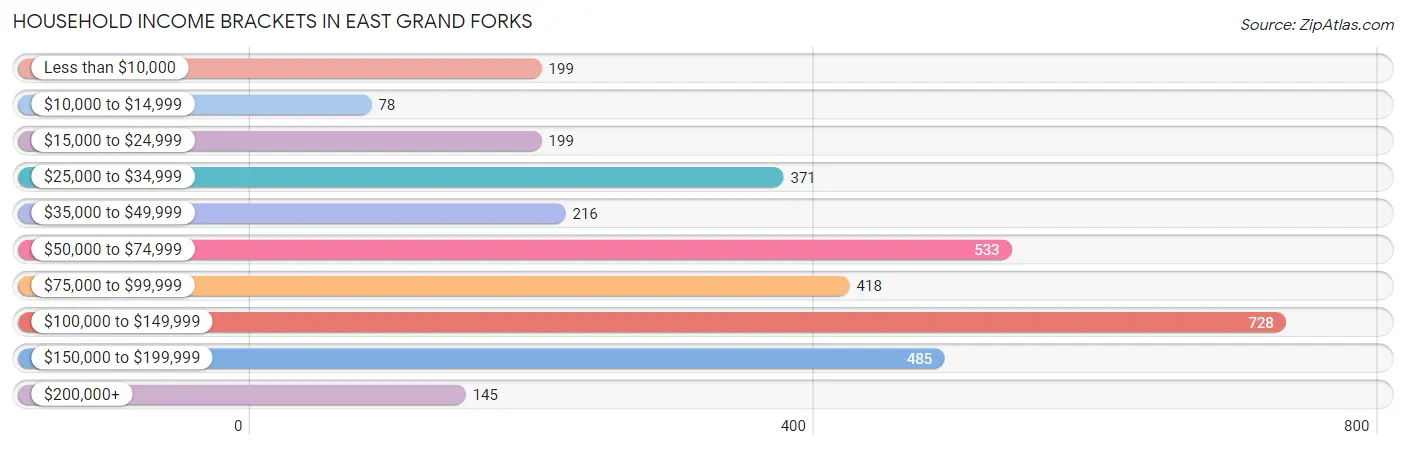
Household Income Brackets in East Grand Forks
With 728 households falling in the category, the $100,000 to $149,999 income range is the most frequent in East Grand Forks, accounting for 21.6% of all households. In contrast, only 78 households (2.3%) fall into the $10,000 to $14,999 income bracket, making it the least populous group.
| Income Bracket | # Households | % Households |
| Less than $10,000 | 199 | 5.9% |
| $10,000 to $14,999 | 78 | 2.3% |
| $15,000 to $24,999 | 199 | 5.9% |
| $25,000 to $34,999 | 371 | 11.0% |
| $35,000 to $49,999 | 216 | 6.4% |
| $50,000 to $74,999 | 533 | 15.8% |
| $75,000 to $99,999 | 418 | 12.4% |
| $100,000 to $149,999 | 728 | 21.6% |
| $150,000 to $199,999 | 485 | 14.4% |
| $200,000+ | 145 | 4.3% |
Household Income by Householder Age in East Grand Forks
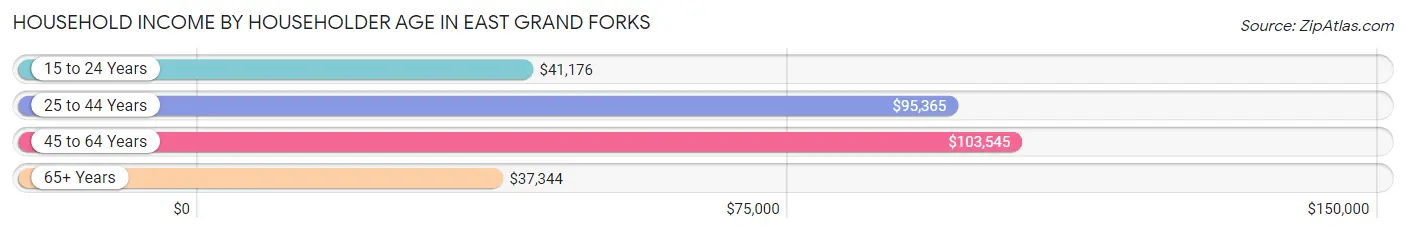
The median household income in East Grand Forks is $81,783, with the highest median household income of $103,545 found in the 45 to 64 years age bracket for the primary householder. A total of 1,132 households (33.6%) fall into this category. Meanwhile, the 65+ years age bracket for the primary householder has the lowest median household income of $37,344, with 660 households (19.6%) in this group.
| Income Bracket | # Households | Median Income |
| 15 to 24 Years | 230 (6.8%) | $41,176 |
| 25 to 44 Years | 1,349 (40.0%) | $95,365 |
| 45 to 64 Years | 1,132 (33.6%) | $103,545 |
| 65+ Years | 660 (19.6%) | $37,344 |
| Total | 3,371 (100.0%) | $81,783 |
Poverty in East Grand Forks
Income Below Poverty by Sex and Age in East Grand Forks
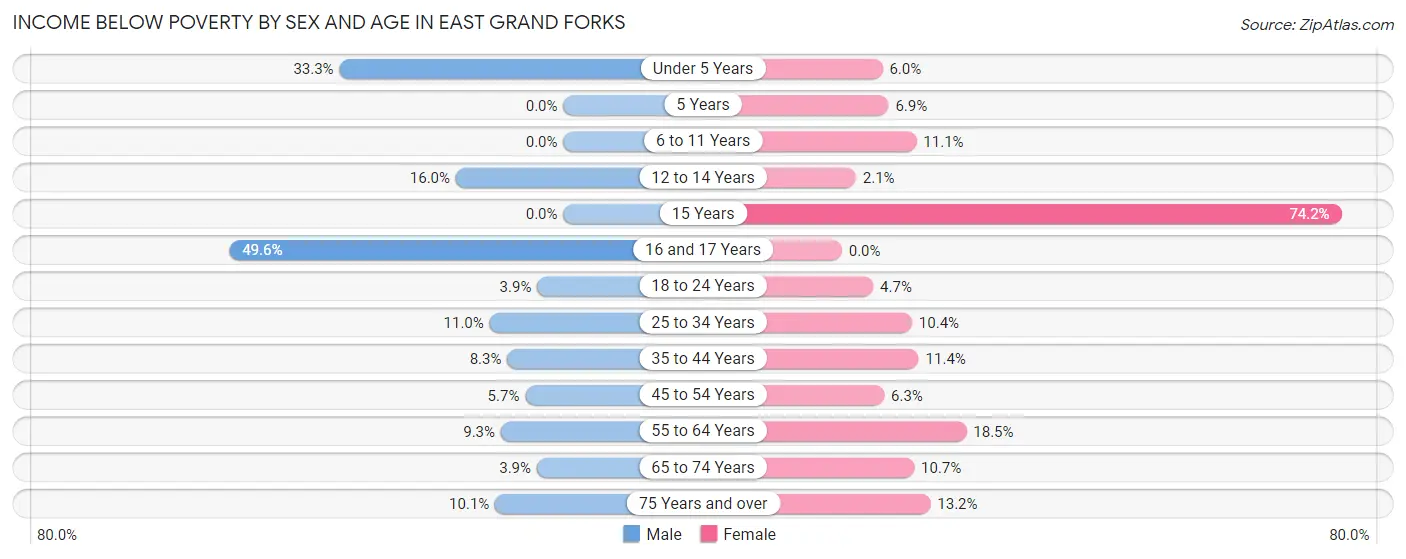
With 10.0% poverty level for males and 10.5% for females among the residents of East Grand Forks, 16 and 17 year old males and 15 year old females are the most vulnerable to poverty, with 63 males (49.6%) and 23 females (74.2%) in their respective age groups living below the poverty level.
| Age Bracket | Male | Female |
| Under 5 Years | 128 (33.3%) | 16 (6.0%) |
| 5 Years | 0 (0.0%) | 7 (6.9%) |
| 6 to 11 Years | 0 (0.0%) | 36 (11.1%) |
| 12 to 14 Years | 45 (16.0%) | 5 (2.1%) |
| 15 Years | 0 (0.0%) | 23 (74.2%) |
| 16 and 17 Years | 63 (49.6%) | 0 (0.0%) |
| 18 to 24 Years | 21 (3.9%) | 15 (4.7%) |
| 25 to 34 Years | 62 (11.0%) | 66 (10.4%) |
| 35 to 44 Years | 46 (8.3%) | 81 (11.4%) |
| 45 to 54 Years | 35 (5.7%) | 25 (6.3%) |
| 55 to 64 Years | 44 (9.3%) | 116 (18.5%) |
| 65 to 74 Years | 12 (3.9%) | 29 (10.7%) |
| 75 Years and over | 16 (10.1%) | 33 (13.2%) |
| Total | 472 (10.0%) | 452 (10.5%) |
Income Above Poverty by Sex and Age in East Grand Forks
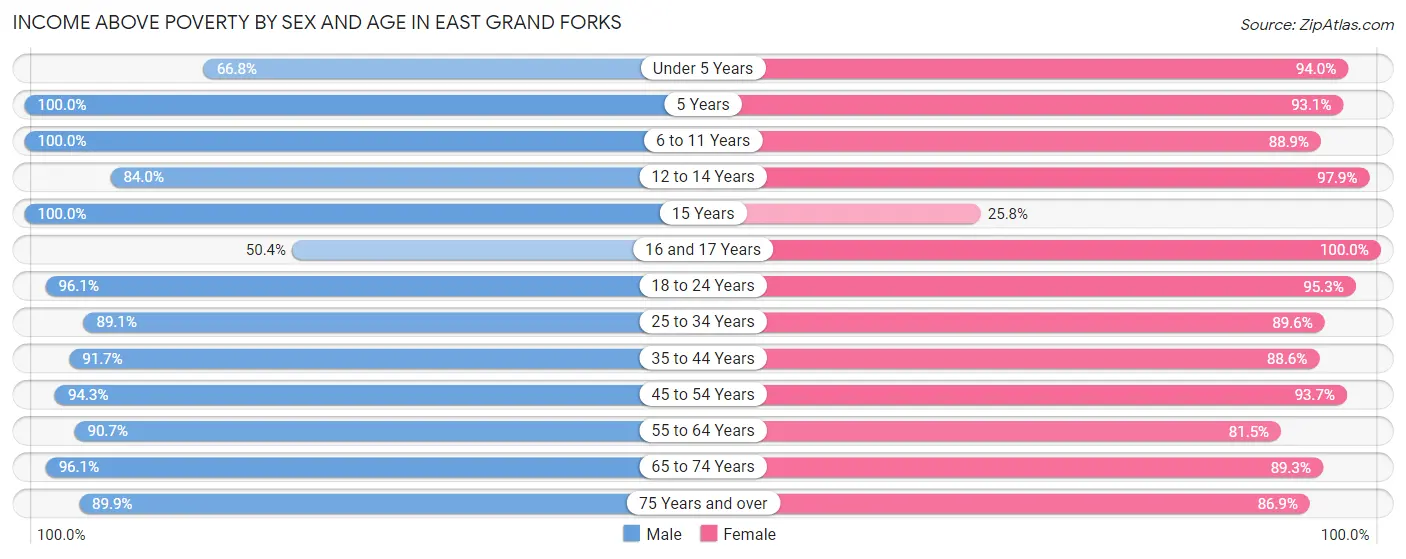
According to the poverty statistics in East Grand Forks, males aged 5 years and females aged 16 and 17 years are the age groups that are most secure financially, with 100.0% of males and 100.0% of females in these age groups living above the poverty line.
| Age Bracket | Male | Female |
| Under 5 Years | 257 (66.7%) | 249 (94.0%) |
| 5 Years | 119 (100.0%) | 94 (93.1%) |
| 6 to 11 Years | 576 (100.0%) | 289 (88.9%) |
| 12 to 14 Years | 237 (84.0%) | 234 (97.9%) |
| 15 Years | 33 (100.0%) | 8 (25.8%) |
| 16 and 17 Years | 64 (50.4%) | 148 (100.0%) |
| 18 to 24 Years | 520 (96.1%) | 307 (95.3%) |
| 25 to 34 Years | 504 (89.0%) | 568 (89.6%) |
| 35 to 44 Years | 507 (91.7%) | 629 (88.6%) |
| 45 to 54 Years | 583 (94.3%) | 373 (93.7%) |
| 55 to 64 Years | 430 (90.7%) | 511 (81.5%) |
| 65 to 74 Years | 293 (96.1%) | 241 (89.3%) |
| 75 Years and over | 142 (89.9%) | 218 (86.9%) |
| Total | 4,265 (90.0%) | 3,869 (89.5%) |
Income Below Poverty Among Married-Couple Families in East Grand Forks
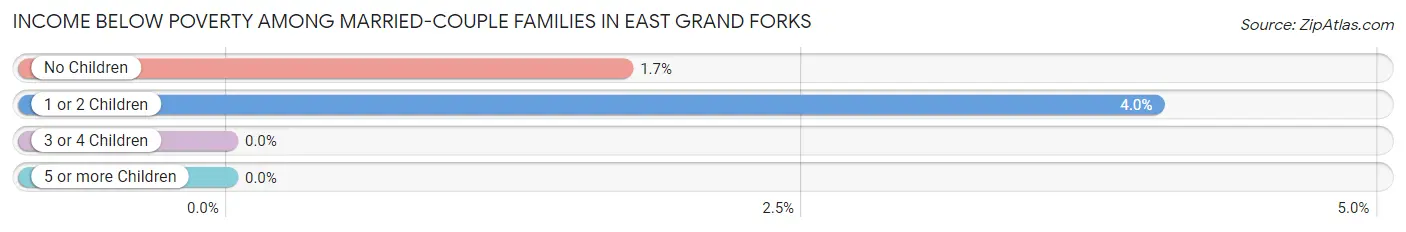
The poverty statistics for married-couple families in East Grand Forks show that 2.4% or 43 of the total 1,806 families live below the poverty line. Families with 1 or 2 children have the highest poverty rate of 4.0%, comprising of 29 families. On the other hand, families with 3 or 4 children have the lowest poverty rate of 0.0%, which includes 0 families.
| Children | Above Poverty | Below Poverty |
| No Children | 802 (98.3%) | 14 (1.7%) |
| 1 or 2 Children | 690 (96.0%) | 29 (4.0%) |
| 3 or 4 Children | 262 (100.0%) | 0 (0.0%) |
| 5 or more Children | 9 (100.0%) | 0 (0.0%) |
| Total | 1,763 (97.6%) | 43 (2.4%) |
Income Below Poverty Among Single-Parent Households in East Grand Forks
According to the poverty data in East Grand Forks, 4.7% or 5 single-father households and 20.9% or 81 single-mother households are living below the poverty line. Among single-father households, those with 5 or more children have the highest poverty rate, with 5 households (100.0%) experiencing poverty. Likewise, among single-mother households, those with 3 or 4 children have the highest poverty rate, with 39 households (83.0%) falling below the poverty line.
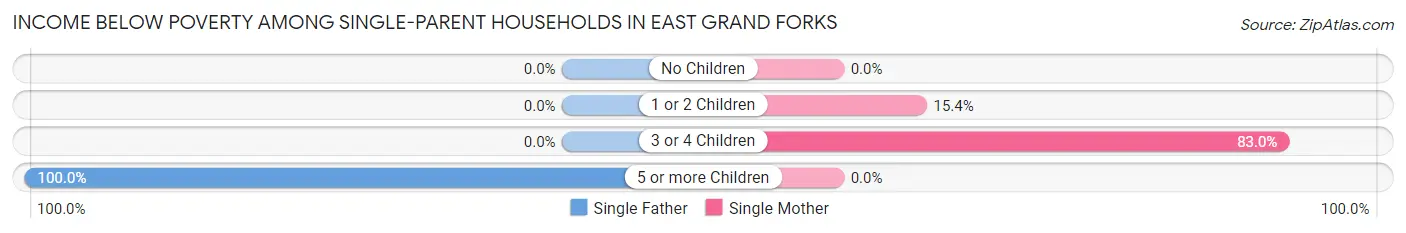
| Children | Single Father | Single Mother |
| No Children | 0 (0.0%) | 0 (0.0%) |
| 1 or 2 Children | 0 (0.0%) | 42 (15.4%) |
| 3 or 4 Children | 0 (0.0%) | 39 (83.0%) |
| 5 or more Children | 5 (100.0%) | 0 (0.0%) |
| Total | 5 (4.7%) | 81 (20.9%) |
Income Below Poverty Among Married-Couple vs Single-Parent Households in East Grand Forks
The poverty data for East Grand Forks shows that 43 of the married-couple family households (2.4%) and 86 of the single-parent households (17.4%) are living below the poverty level. Within the married-couple family households, those with 1 or 2 children have the highest poverty rate, with 29 households (4.0%) falling below the poverty line. Among the single-parent households, those with 5 or more children have the highest poverty rate, with 5 household (100.0%) living below poverty.
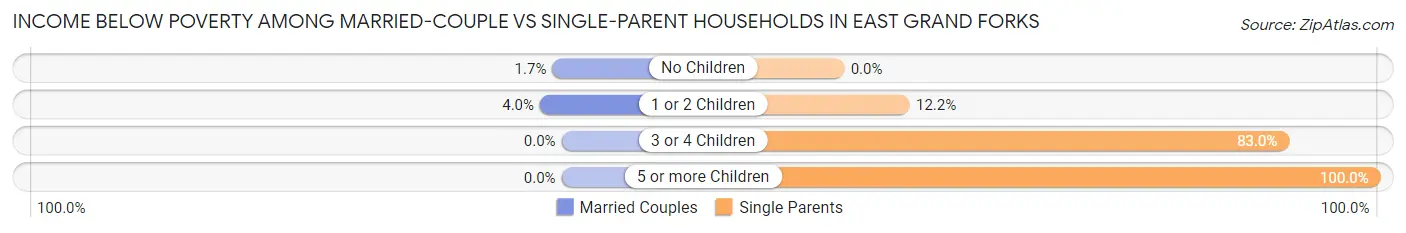
| Children | Married-Couple Families | Single-Parent Households |
| No Children | 14 (1.7%) | 0 (0.0%) |
| 1 or 2 Children | 29 (4.0%) | 42 (12.2%) |
| 3 or 4 Children | 0 (0.0%) | 39 (83.0%) |
| 5 or more Children | 0 (0.0%) | 5 (100.0%) |
| Total | 43 (2.4%) | 86 (17.4%) |
Race in East Grand Forks
The most populous races in East Grand Forks are White / Caucasian (7,649 | 83.9%), Hispanic or Latino (650 | 7.1%), and Two or more Races (577 | 6.3%).
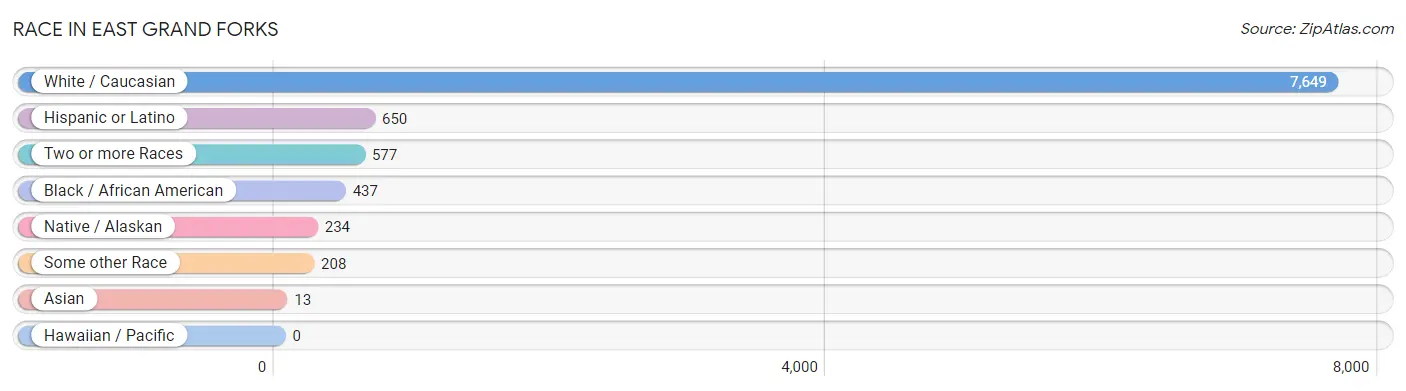
| Race | # Population | % Population |
| Asian | 13 | 0.1% |
| Black / African American | 437 | 4.8% |
| Hawaiian / Pacific | 0 | 0.0% |
| Hispanic or Latino | 650 | 7.1% |
| Native / Alaskan | 234 | 2.6% |
| White / Caucasian | 7,649 | 83.9% |
| Two or more Races | 577 | 6.3% |
| Some other Race | 208 | 2.3% |
| Total | 9,118 | 100.0% |
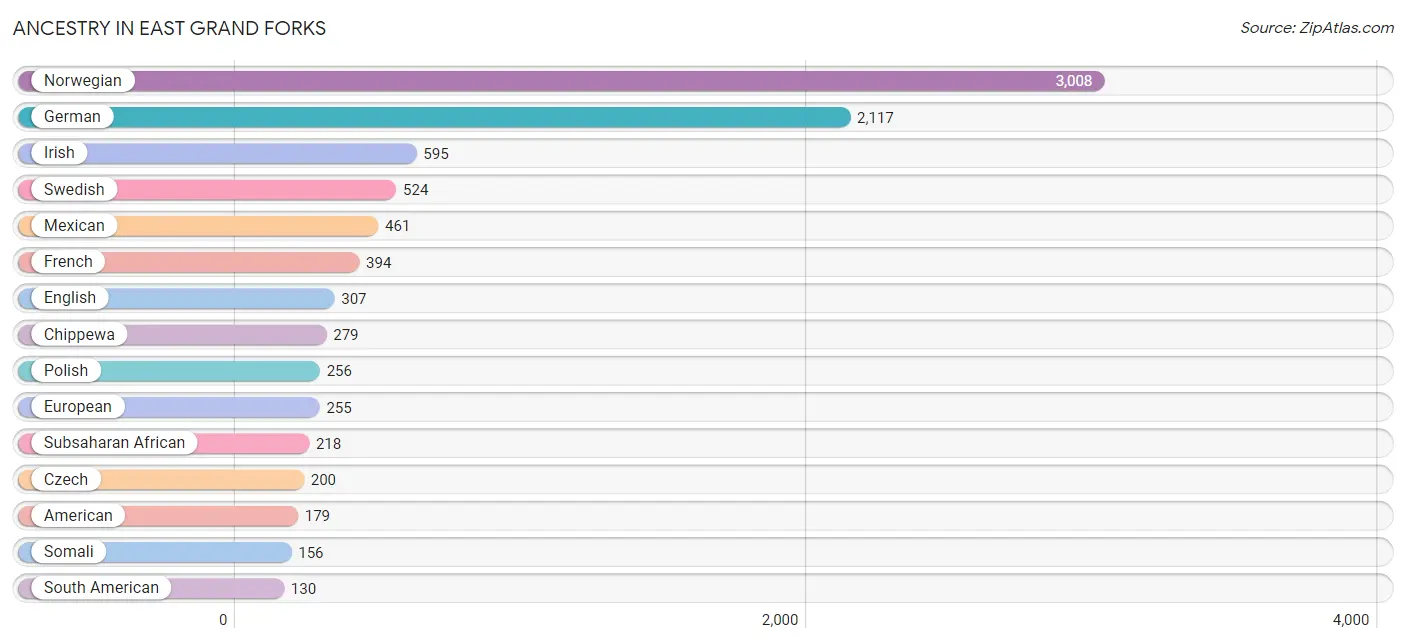
Ancestry in East Grand Forks
The most populous ancestries reported in East Grand Forks are Norwegian (3,008 | 33.0%), German (2,117 | 23.2%), Irish (595 | 6.5%), Swedish (524 | 5.8%), and Mexican (461 | 5.1%), together accounting for 73.6% of all East Grand Forks residents.
| Ancestry | # Population | % Population |
| African | 50 | 0.5% |
| American | 179 | 2.0% |
| Arab | 51 | 0.6% |
| Austrian | 14 | 0.2% |
| Bhutanese | 11 | 0.1% |
| Blackfeet | 17 | 0.2% |
| Bolivian | 64 | 0.7% |
| Brazilian | 22 | 0.2% |
| Chilean | 13 | 0.1% |
| Chippewa | 279 | 3.1% |
| Cuban | 19 | 0.2% |
| Czech | 200 | 2.2% |
| Czechoslovakian | 19 | 0.2% |
| Danish | 8 | 0.1% |
| Dutch | 37 | 0.4% |
| Eastern European | 14 | 0.2% |
| Ecuadorian | 53 | 0.6% |
| English | 307 | 3.4% |
| European | 255 | 2.8% |
| Finnish | 32 | 0.4% |
| French | 394 | 4.3% |
| French Canadian | 100 | 1.1% |
| German | 2,117 | 23.2% |
| Ghanaian | 12 | 0.1% |
| Haitian | 43 | 0.5% |
| Icelander | 66 | 0.7% |
| Indian (Asian) | 25 | 0.3% |
| Iraqi | 44 | 0.5% |
| Irish | 595 | 6.5% |
| Italian | 59 | 0.6% |
| Lebanese | 7 | 0.1% |
| Macedonian | 7 | 0.1% |
| Mexican | 461 | 5.1% |
| Northern European | 42 | 0.5% |
| Norwegian | 3,008 | 33.0% |
| Paiute | 19 | 0.2% |
| Polish | 256 | 2.8% |
| Puerto Rican | 36 | 0.4% |
| Romanian | 7 | 0.1% |
| Russian | 77 | 0.8% |
| Scandinavian | 106 | 1.2% |
| Scotch-Irish | 18 | 0.2% |
| Scottish | 52 | 0.6% |
| Serbian | 10 | 0.1% |
| Sioux | 7 | 0.1% |
| Somali | 156 | 1.7% |
| South American | 130 | 1.4% |
| Subsaharan African | 218 | 2.4% |
| Swedish | 524 | 5.8% |
| Ukrainian | 10 | 0.1% |
| Welsh | 7 | 0.1% | View All 51 Rows |
Immigrants in East Grand Forks
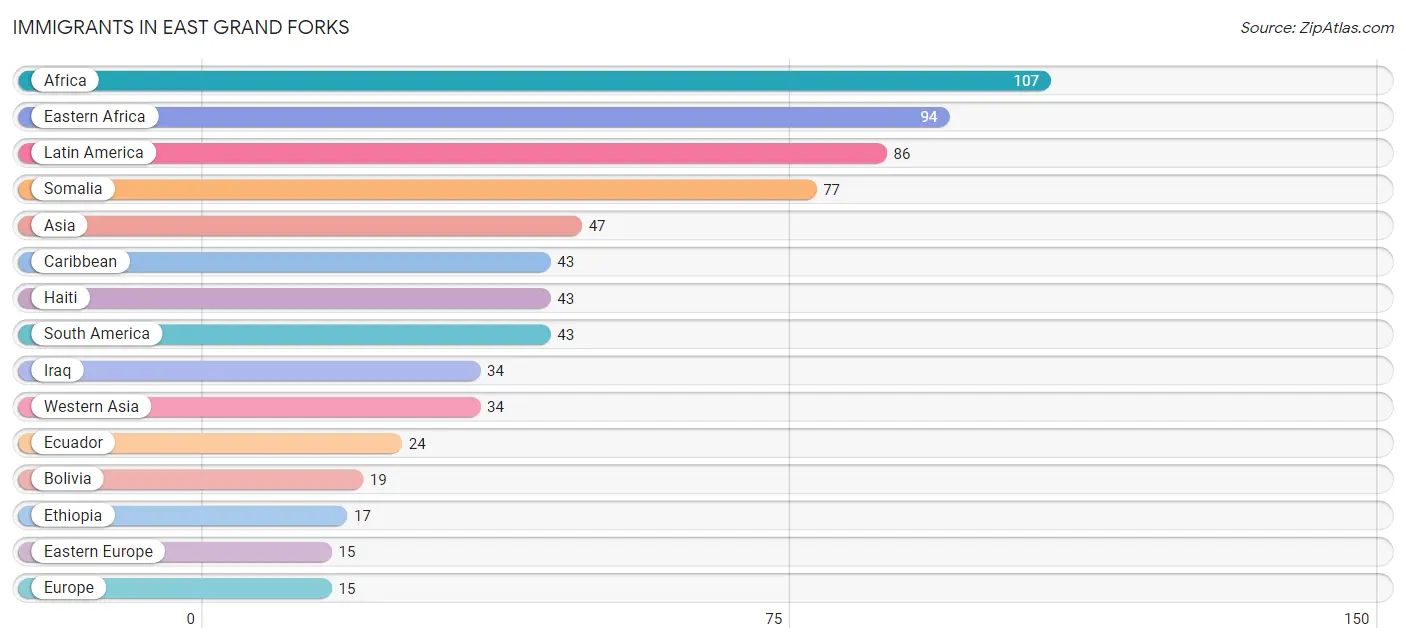
The most numerous immigrant groups reported in East Grand Forks came from Africa (107 | 1.2%), Eastern Africa (94 | 1.0%), Latin America (86 | 0.9%), Somalia (77 | 0.8%), and Asia (47 | 0.5%), together accounting for 4.5% of all East Grand Forks residents.
| Immigration Origin | # Population | % Population |
| Africa | 107 | 1.2% |
| Asia | 47 | 0.5% |
| Bolivia | 19 | 0.2% |
| Caribbean | 43 | 0.5% |
| China | 4 | 0.0% |
| Eastern Africa | 94 | 1.0% |
| Eastern Asia | 4 | 0.0% |
| Eastern Europe | 15 | 0.2% |
| Ecuador | 24 | 0.3% |
| Ethiopia | 17 | 0.2% |
| Europe | 15 | 0.2% |
| Haiti | 43 | 0.5% |
| India | 9 | 0.1% |
| Iraq | 34 | 0.4% |
| Latin America | 86 | 0.9% |
| Moldova | 15 | 0.2% |
| Somalia | 77 | 0.8% |
| South America | 43 | 0.5% |
| South Central Asia | 9 | 0.1% |
| Western Asia | 34 | 0.4% | View All 20 Rows |
Sex and Age in East Grand Forks
Sex and Age in East Grand Forks
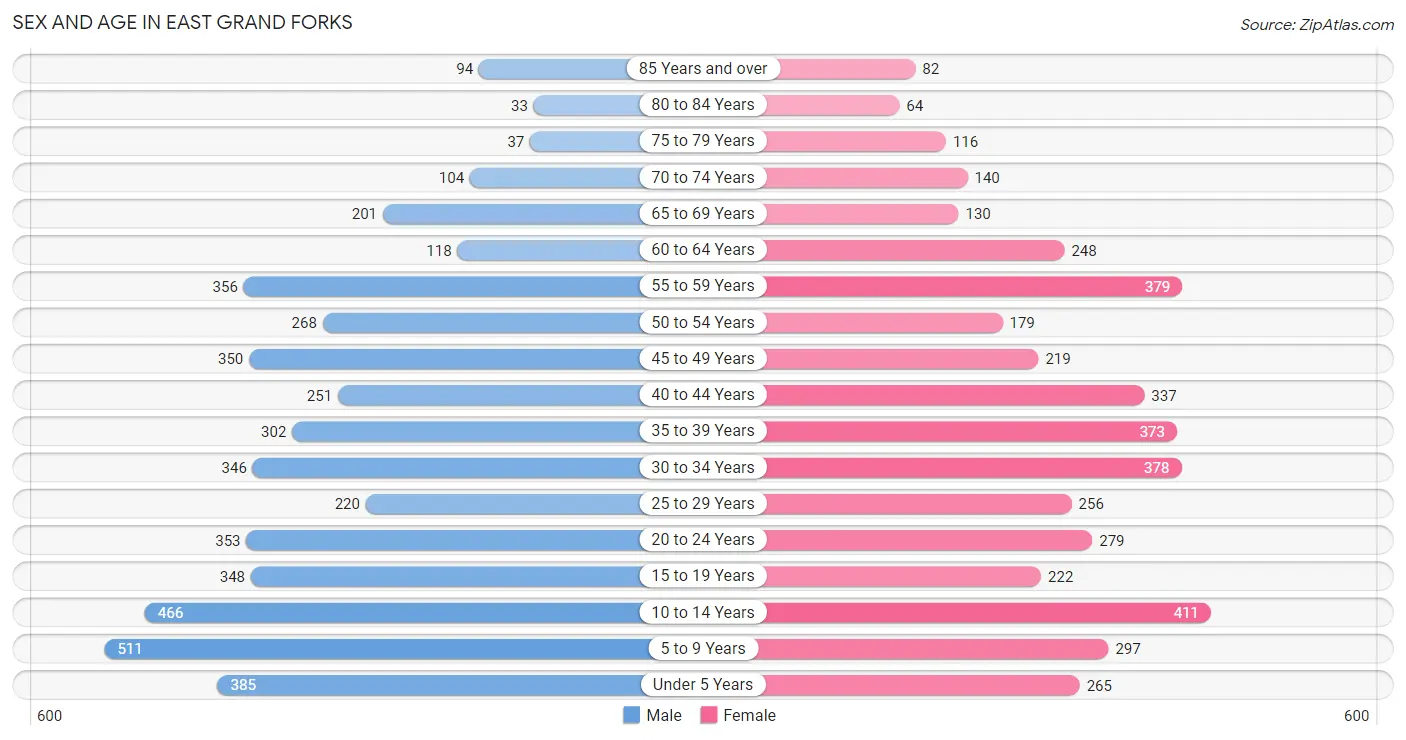
The most populous age groups in East Grand Forks are 5 to 9 Years (511 | 10.8%) for men and 10 to 14 Years (411 | 9.4%) for women.
| Age Bracket | Male | Female |
| Under 5 Years | 385 (8.1%) | 265 (6.1%) |
| 5 to 9 Years | 511 (10.8%) | 297 (6.8%) |
| 10 to 14 Years | 466 (9.8%) | 411 (9.4%) |
| 15 to 19 Years | 348 (7.3%) | 222 (5.1%) |
| 20 to 24 Years | 353 (7.4%) | 279 (6.4%) |
| 25 to 29 Years | 220 (4.6%) | 256 (5.9%) |
| 30 to 34 Years | 346 (7.3%) | 378 (8.6%) |
| 35 to 39 Years | 302 (6.4%) | 373 (8.5%) |
| 40 to 44 Years | 251 (5.3%) | 337 (7.7%) |
| 45 to 49 Years | 350 (7.4%) | 219 (5.0%) |
| 50 to 54 Years | 268 (5.7%) | 179 (4.1%) |
| 55 to 59 Years | 356 (7.5%) | 379 (8.7%) |
| 60 to 64 Years | 118 (2.5%) | 248 (5.7%) |
| 65 to 69 Years | 201 (4.2%) | 130 (3.0%) |
| 70 to 74 Years | 104 (2.2%) | 140 (3.2%) |
| 75 to 79 Years | 37 (0.8%) | 116 (2.6%) |
| 80 to 84 Years | 33 (0.7%) | 64 (1.5%) |
| 85 Years and over | 94 (2.0%) | 82 (1.9%) |
| Total | 4,743 (100.0%) | 4,375 (100.0%) |
Families and Households in East Grand Forks
Median Family Size in East Grand Forks
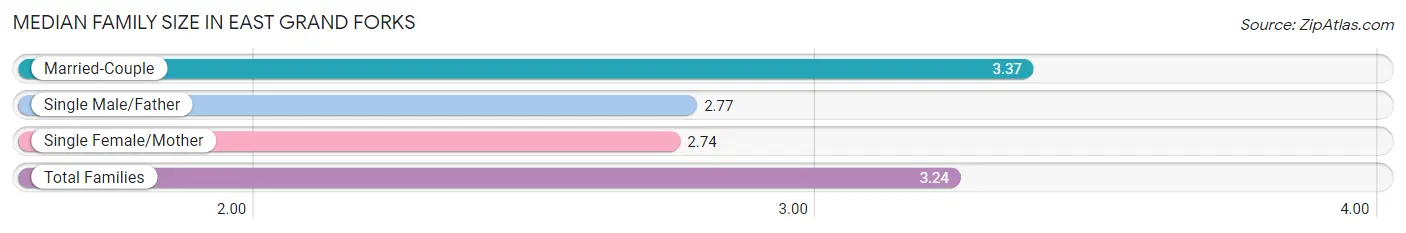
The median family size in East Grand Forks is 3.24 persons per family, with married-couple families (1,806 | 78.6%) accounting for the largest median family size of 3.37 persons per family. On the other hand, single female/mother families (387 | 16.8%) represent the smallest median family size with 2.74 persons per family.
| Family Type | # Families | Family Size |
| Married-Couple | 1,806 (78.6%) | 3.37 |
| Single Male/Father | 106 (4.6%) | 2.77 |
| Single Female/Mother | 387 (16.8%) | 2.74 |
| Total Families | 2,299 (100.0%) | 3.24 |
Median Household Size in East Grand Forks
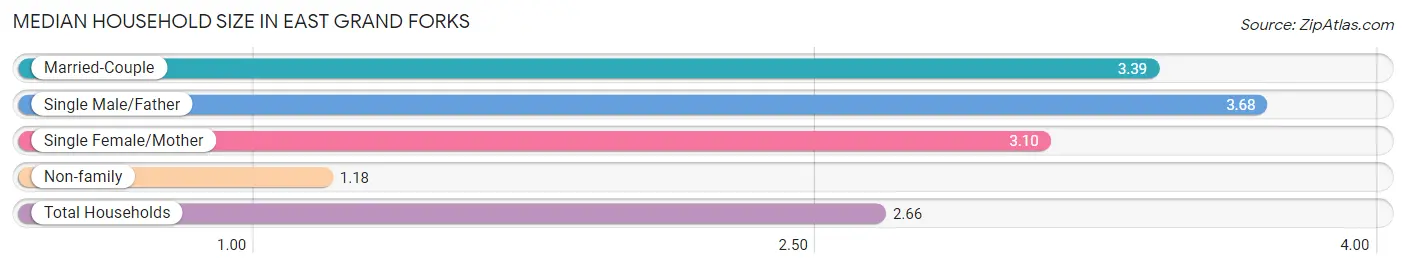
The median household size in East Grand Forks is 2.66 persons per household, with single male/father households (106 | 3.1%) accounting for the largest median household size of 3.68 persons per household. non-family households (1,072 | 31.8%) represent the smallest median household size with 1.18 persons per household.
| Household Type | # Households | Household Size |
| Married-Couple | 1,806 (53.6%) | 3.39 |
| Single Male/Father | 106 (3.1%) | 3.68 |
| Single Female/Mother | 387 (11.5%) | 3.10 |
| Non-family | 1,072 (31.8%) | 1.18 |
| Total Households | 3,371 (100.0%) | 2.66 |
Household Size by Marriage Status in East Grand Forks
Out of a total of 3,371 households in East Grand Forks, 2,299 (68.2%) are family households, while 1,072 (31.8%) are nonfamily households. The most numerous type of family households are 2-person households, comprising 920, and the most common type of nonfamily households are 1-person households, comprising 920.
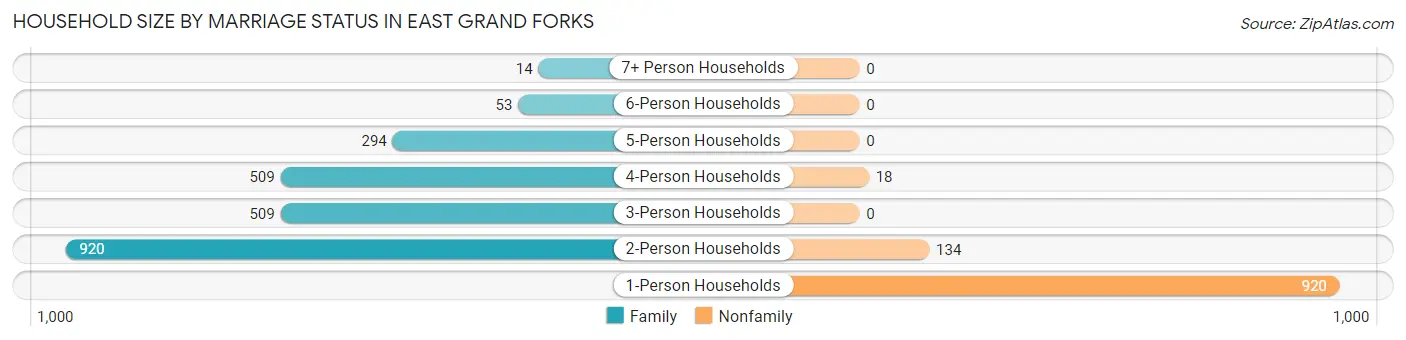
| Household Size | Family Households | Nonfamily Households |
| 1-Person Households | - | 920 (27.3%) |
| 2-Person Households | 920 (27.3%) | 134 (4.0%) |
| 3-Person Households | 509 (15.1%) | 0 (0.0%) |
| 4-Person Households | 509 (15.1%) | 18 (0.5%) |
| 5-Person Households | 294 (8.7%) | 0 (0.0%) |
| 6-Person Households | 53 (1.6%) | 0 (0.0%) |
| 7+ Person Households | 14 (0.4%) | 0 (0.0%) |
| Total | 2,299 (68.2%) | 1,072 (31.8%) |
Female Fertility in East Grand Forks
Fertility by Age in East Grand Forks
Average fertility rate in East Grand Forks is 96.0 births per 1,000 women. Women in the age bracket of 20 to 34 years have the highest fertility rate with 192.0 births per 1,000 women. Women in the age bracket of 20 to 34 years acount for 87.1% of all women with births.
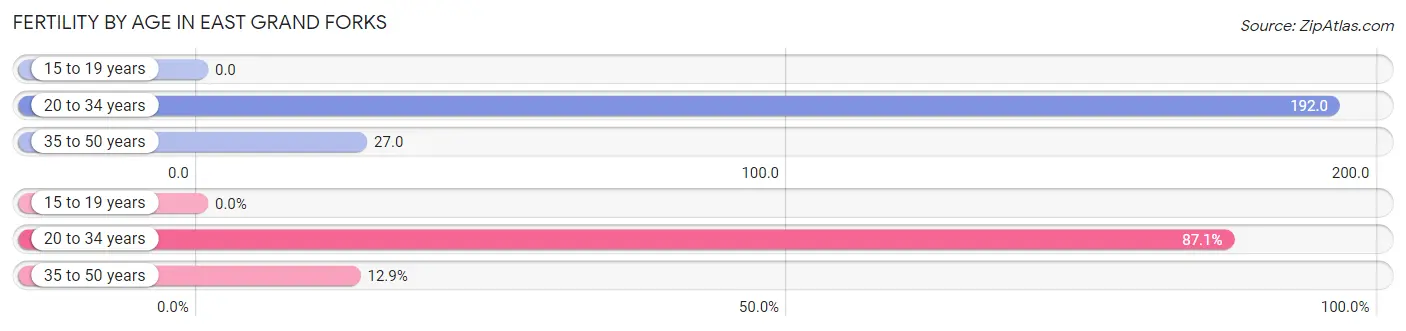
| Age Bracket | Women with Births | Births / 1,000 Women |
| 15 to 19 years | 0 (0.0%) | 0.0 |
| 20 to 34 years | 175 (87.1%) | 192.0 |
| 35 to 50 years | 26 (12.9%) | 27.0 |
| Total | 201 (100.0%) | 96.0 |
Fertility by Age by Marriage Status in East Grand Forks
82.1% of women with births (201) in East Grand Forks are married. The highest percentage of unmarried women with births falls into 20 to 34 years age bracket with 20.6% of them unmarried at the time of birth, while the lowest percentage of unmarried women with births belong to 35 to 50 years age bracket with 0.0% of them unmarried.
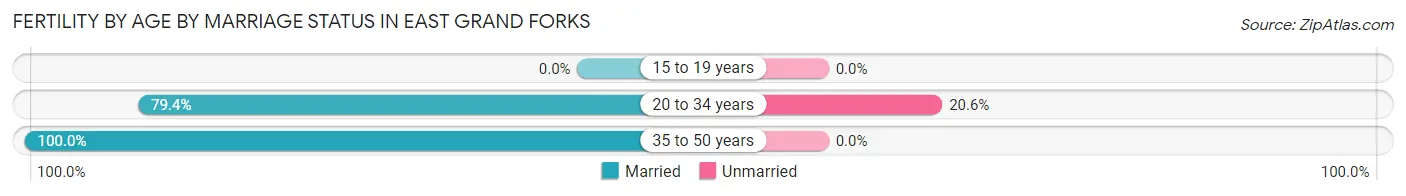
| Age Bracket | Married | Unmarried |
| 15 to 19 years | 0 (0.0%) | 0 (0.0%) |
| 20 to 34 years | 139 (79.4%) | 36 (20.6%) |
| 35 to 50 years | 26 (100.0%) | 0 (0.0%) |
| Total | 165 (82.1%) | 36 (17.9%) |
Fertility by Education in East Grand Forks
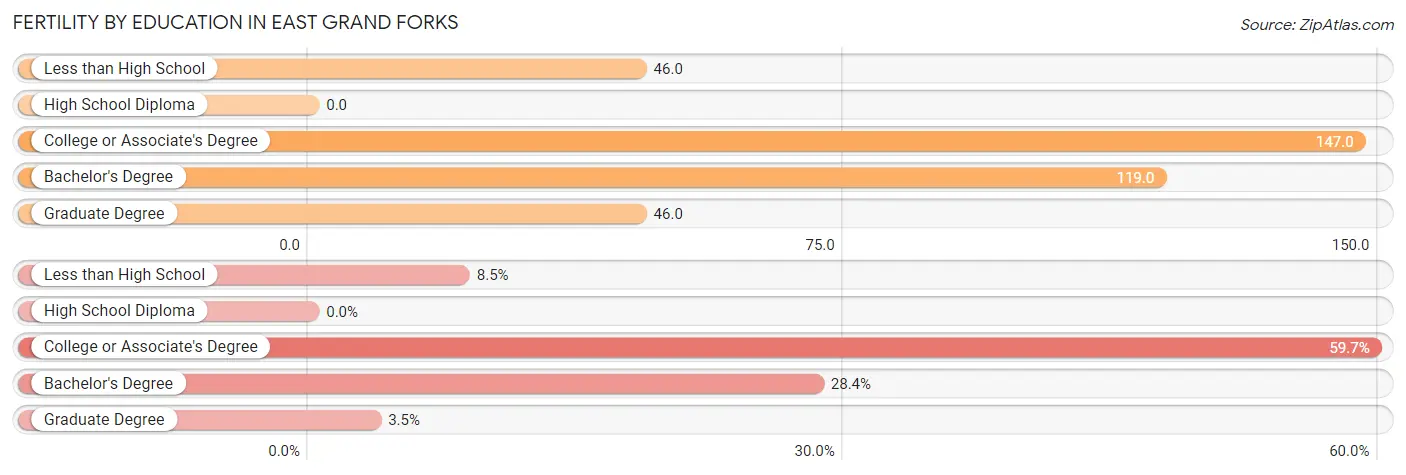
| Educational Attainment | Women with Births | Births / 1,000 Women |
| Less than High School | 17 (8.5%) | 46.0 |
| High School Diploma | 0 (0.0%) | 0.0 |
| College or Associate's Degree | 120 (59.7%) | 147.0 |
| Bachelor's Degree | 57 (28.4%) | 119.0 |
| Graduate Degree | 7 (3.5%) | 46.0 |
| Total | 201 (100.0%) | 96.0 |
Fertility by Education by Marriage Status in East Grand Forks
17.9% of women with births in East Grand Forks are unmarried. Women with the educational attainment of graduate degree are most likely to be married with 100.0% of them married at childbirth, while women with the educational attainment of less than high school are least likely to be married with 100.0% of them unmarried at childbirth.
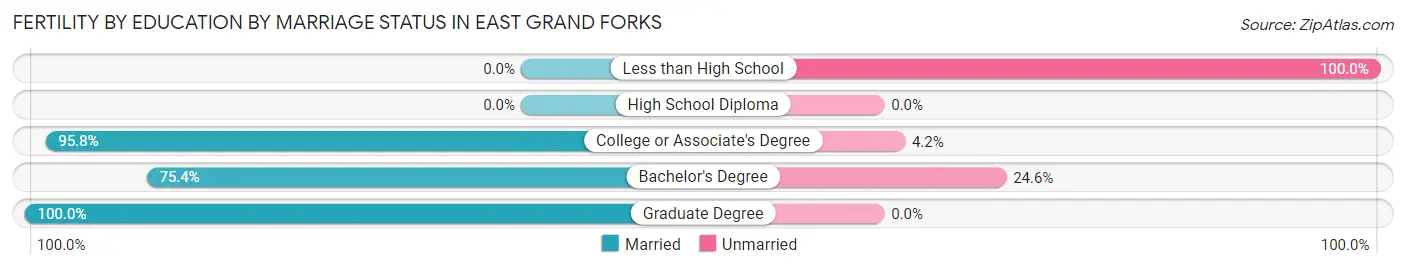
| Educational Attainment | Married | Unmarried |
| Less than High School | 0 (0.0%) | 17 (100.0%) |
| High School Diploma | 0 (0.0%) | 0 (0.0%) |
| College or Associate's Degree | 115 (95.8%) | 5 (4.2%) |
| Bachelor's Degree | 43 (75.4%) | 14 (24.6%) |
| Graduate Degree | 7 (100.0%) | 0 (0.0%) |
| Total | 165 (82.1%) | 36 (17.9%) |
Employment Characteristics in East Grand Forks
Employment by Class of Employer in East Grand Forks
Among the 4,664 employed individuals in East Grand Forks, private company employees (2,926 | 62.7%), not-for-profit organizations (670 | 14.4%), and local government employees (352 | 7.5%) make up the most common classes of employment.
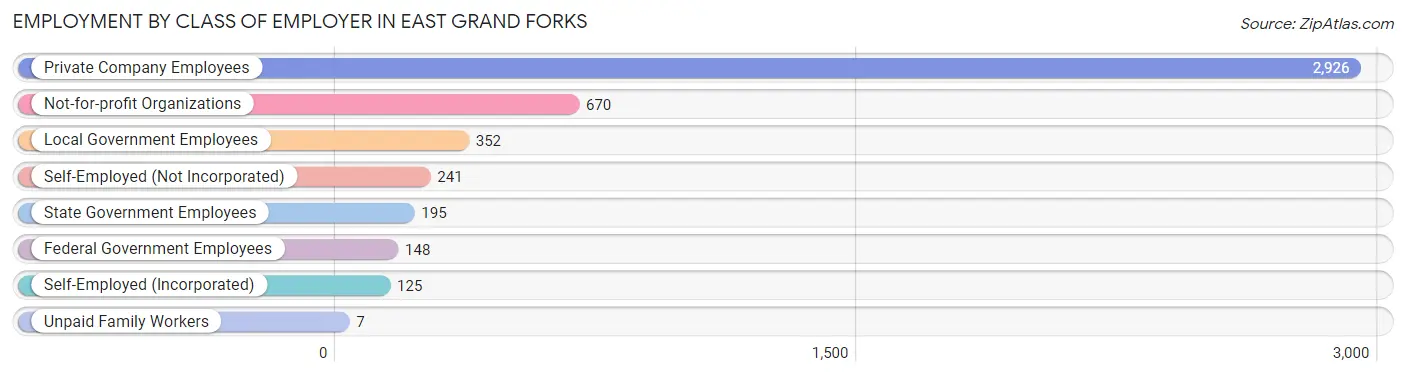
| Employer Class | # Employees | % Employees |
| Private Company Employees | 2,926 | 62.7% |
| Self-Employed (Incorporated) | 125 | 2.7% |
| Self-Employed (Not Incorporated) | 241 | 5.2% |
| Not-for-profit Organizations | 670 | 14.4% |
| Local Government Employees | 352 | 7.5% |
| State Government Employees | 195 | 4.2% |
| Federal Government Employees | 148 | 3.2% |
| Unpaid Family Workers | 7 | 0.2% |
| Total | 4,664 | 100.0% |
Employment Status by Age in East Grand Forks
According to the labor force statistics for East Grand Forks, out of the total population over 16 years of age (6,719), 72.2% or 4,851 individuals are in the labor force, with 3.3% or 160 of them unemployed. The age group with the highest labor force participation rate is 30 to 34 years, with 96.0% or 695 individuals in the labor force. Within the labor force, the 25 to 29 years age range has the highest percentage of unemployed individuals, with 7.2% or 31 of them being unemployed.

| Age Bracket | In Labor Force | Unemployed |
| 16 to 19 Years | 254 (50.2%) | 0 (0.0%) |
| 20 to 24 Years | 474 (75.0%) | 0 (0.0%) |
| 25 to 29 Years | 430 (90.3%) | 31 (7.2%) |
| 30 to 34 Years | 695 (96.0%) | 50 (7.2%) |
| 35 to 44 Years | 1,204 (95.3%) | 45 (3.7%) |
| 45 to 54 Years | 855 (84.2%) | 35 (4.1%) |
| 55 to 59 Years | 550 (74.8%) | 0 (0.0%) |
| 60 to 64 Years | 253 (69.1%) | 0 (0.0%) |
| 65 to 74 Years | 137 (23.8%) | 0 (0.0%) |
| 75 Years and over | 0 (0.0%) | 0 (0.0%) |
| Total | 4,851 (72.2%) | 160 (3.3%) |
Employment Status by Educational Attainment in East Grand Forks
According to labor force statistics for East Grand Forks, 87.1% of individuals (3,989) out of the total population between 25 and 64 years of age (4,580) are in the labor force, with 4.0% or 160 of them being unemployed. The group with the highest labor force participation rate are those with the educational attainment of college / associate degree, with 90.9% or 1,783 individuals in the labor force. Within the labor force, individuals with high school diploma education have the highest percentage of unemployment, with 15.8% or 111 of them being unemployed.
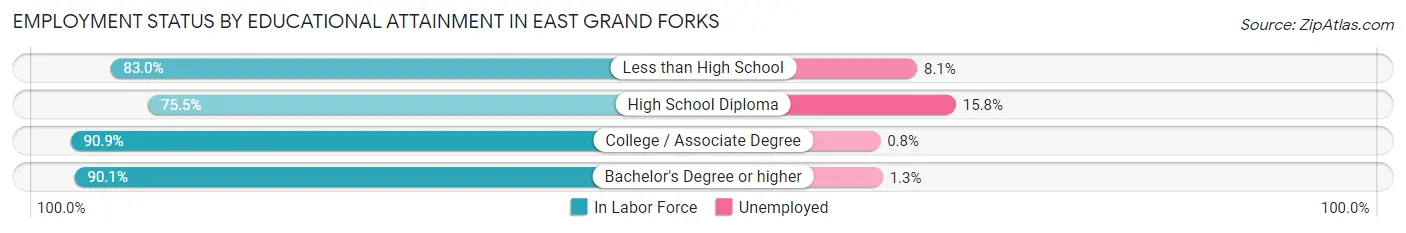
| Educational Attainment | In Labor Force | Unemployed |
| Less than High School | 210 (83.0%) | 20 (8.1%) |
| High School Diploma | 704 (75.5%) | 147 (15.8%) |
| College / Associate Degree | 1,783 (90.9%) | 16 (0.8%) |
| Bachelor's Degree or higher | 1,290 (90.1%) | 19 (1.3%) |
| Total | 3,989 (87.1%) | 183 (4.0%) |
Employment Occupations by Sex in East Grand Forks
Management, Business, Science and Arts Occupations
The most common Management, Business, Science and Arts occupations in East Grand Forks are Management (458 | 9.8%), Community & Social Service (443 | 9.5%), Health Diagnosing & Treating (308 | 6.6%), Education Instruction & Library (288 | 6.2%), and Business & Financial (235 | 5.0%).
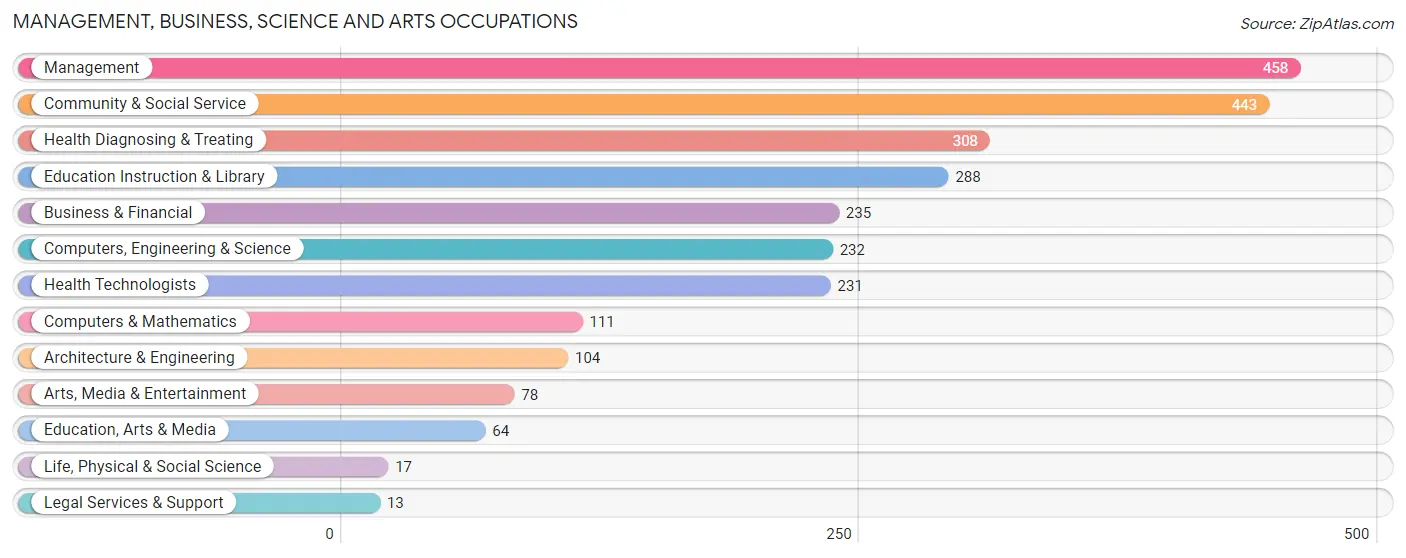
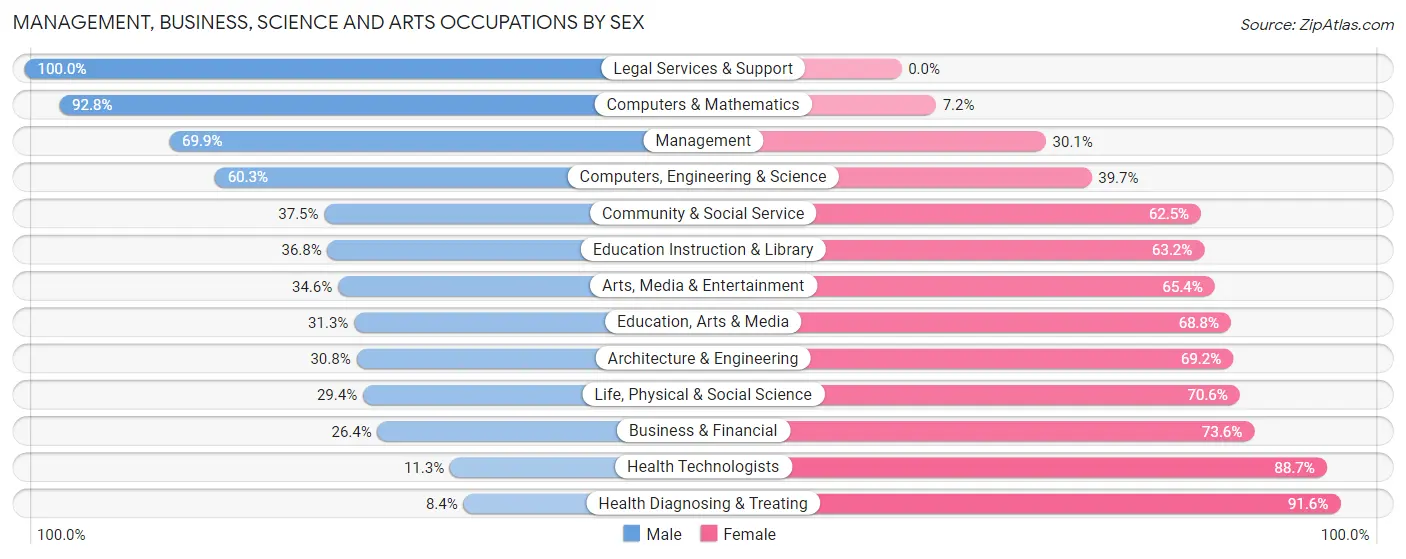
Management, Business, Science and Arts Occupations by Sex
Within the Management, Business, Science and Arts occupations in East Grand Forks, the most male-oriented occupations are Legal Services & Support (100.0%), Computers & Mathematics (92.8%), and Management (69.9%), while the most female-oriented occupations are Health Diagnosing & Treating (91.6%), Health Technologists (88.7%), and Business & Financial (73.6%).
| Occupation | Male | Female |
| Management | 320 (69.9%) | 138 (30.1%) |
| Business & Financial | 62 (26.4%) | 173 (73.6%) |
| Computers, Engineering & Science | 140 (60.3%) | 92 (39.7%) |
| Computers & Mathematics | 103 (92.8%) | 8 (7.2%) |
| Architecture & Engineering | 32 (30.8%) | 72 (69.2%) |
| Life, Physical & Social Science | 5 (29.4%) | 12 (70.6%) |
| Community & Social Service | 166 (37.5%) | 277 (62.5%) |
| Education, Arts & Media | 20 (31.2%) | 44 (68.8%) |
| Legal Services & Support | 13 (100.0%) | 0 (0.0%) |
| Education Instruction & Library | 106 (36.8%) | 182 (63.2%) |
| Arts, Media & Entertainment | 27 (34.6%) | 51 (65.4%) |
| Health Diagnosing & Treating | 26 (8.4%) | 282 (91.6%) |
| Health Technologists | 26 (11.3%) | 205 (88.7%) |
| Total (Category) | 714 (42.6%) | 962 (57.4%) |
| Total (Overall) | 2,429 (52.1%) | 2,237 (47.9%) |
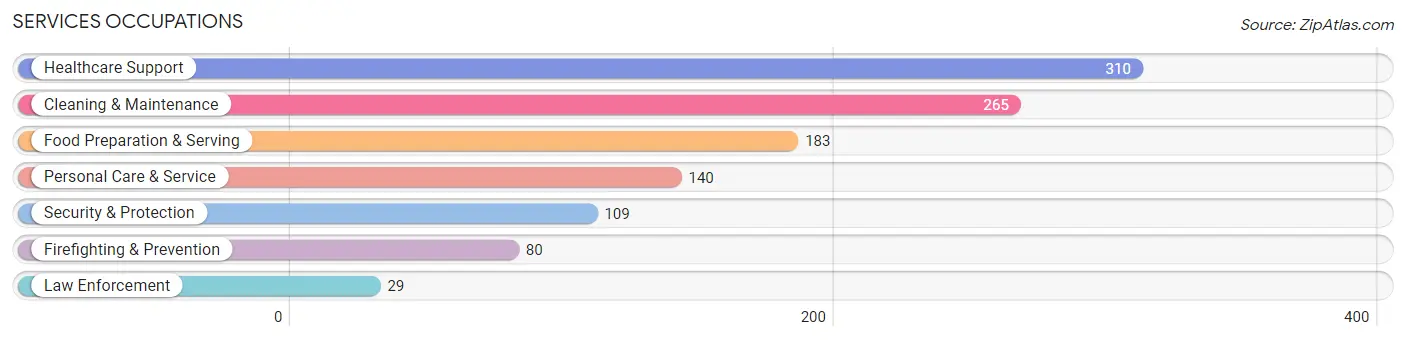
Services Occupations
The most common Services occupations in East Grand Forks are Healthcare Support (310 | 6.6%), Cleaning & Maintenance (265 | 5.7%), Food Preparation & Serving (183 | 3.9%), Personal Care & Service (140 | 3.0%), and Security & Protection (109 | 2.3%).
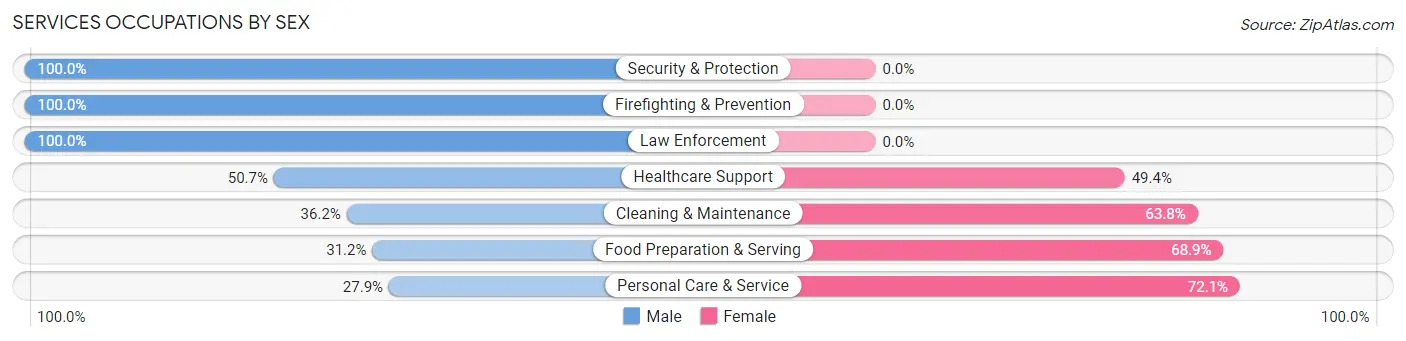
Services Occupations by Sex
Within the Services occupations in East Grand Forks, the most male-oriented occupations are Security & Protection (100.0%), Firefighting & Prevention (100.0%), and Law Enforcement (100.0%), while the most female-oriented occupations are Personal Care & Service (72.1%), Food Preparation & Serving (68.9%), and Cleaning & Maintenance (63.8%).
| Occupation | Male | Female |
| Healthcare Support | 157 (50.6%) | 153 (49.3%) |
| Security & Protection | 109 (100.0%) | 0 (0.0%) |
| Firefighting & Prevention | 80 (100.0%) | 0 (0.0%) |
| Law Enforcement | 29 (100.0%) | 0 (0.0%) |
| Food Preparation & Serving | 57 (31.1%) | 126 (68.9%) |
| Cleaning & Maintenance | 96 (36.2%) | 169 (63.8%) |
| Personal Care & Service | 39 (27.9%) | 101 (72.1%) |
| Total (Category) | 458 (45.5%) | 549 (54.5%) |
| Total (Overall) | 2,429 (52.1%) | 2,237 (47.9%) |
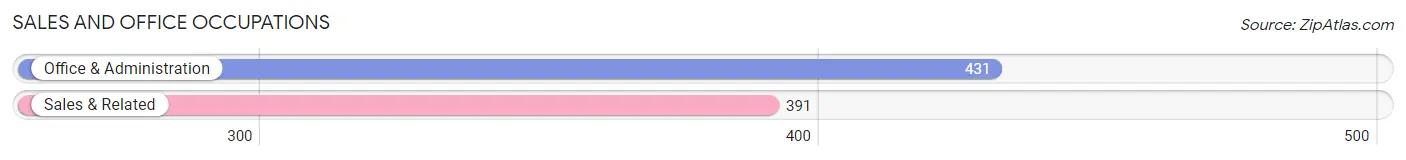
Sales and Office Occupations
The most common Sales and Office occupations in East Grand Forks are Office & Administration (431 | 9.2%), and Sales & Related (391 | 8.4%).
Sales and Office Occupations by Sex
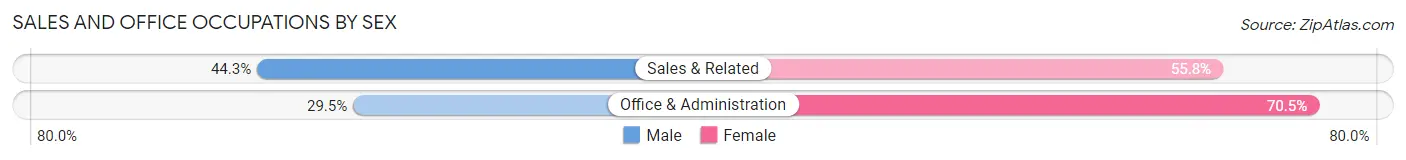
| Occupation | Male | Female |
| Sales & Related | 173 (44.3%) | 218 (55.7%) |
| Office & Administration | 127 (29.5%) | 304 (70.5%) |
| Total (Category) | 300 (36.5%) | 522 (63.5%) |
| Total (Overall) | 2,429 (52.1%) | 2,237 (47.9%) |
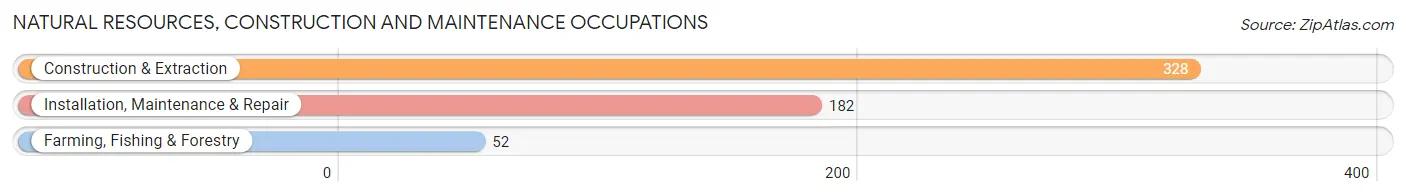
Natural Resources, Construction and Maintenance Occupations
The most common Natural Resources, Construction and Maintenance occupations in East Grand Forks are Construction & Extraction (328 | 7.0%), Installation, Maintenance & Repair (182 | 3.9%), and Farming, Fishing & Forestry (52 | 1.1%).
Natural Resources, Construction and Maintenance Occupations by Sex
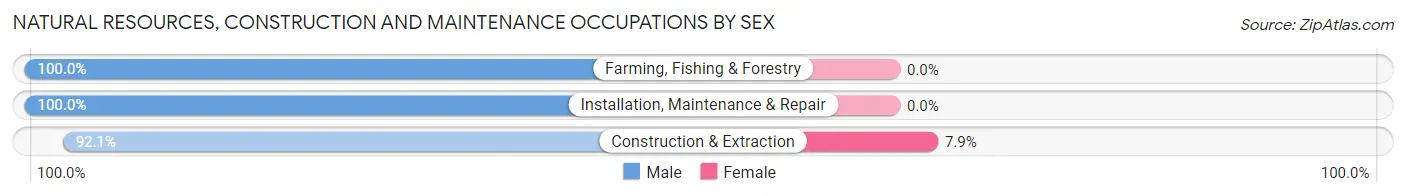
| Occupation | Male | Female |
| Farming, Fishing & Forestry | 52 (100.0%) | 0 (0.0%) |
| Construction & Extraction | 302 (92.1%) | 26 (7.9%) |
| Installation, Maintenance & Repair | 182 (100.0%) | 0 (0.0%) |
| Total (Category) | 536 (95.4%) | 26 (4.6%) |
| Total (Overall) | 2,429 (52.1%) | 2,237 (47.9%) |
Production, Transportation and Moving Occupations
The most common Production, Transportation and Moving occupations in East Grand Forks are Production (269 | 5.8%), Transportation (192 | 4.1%), and Material Moving (138 | 3.0%).
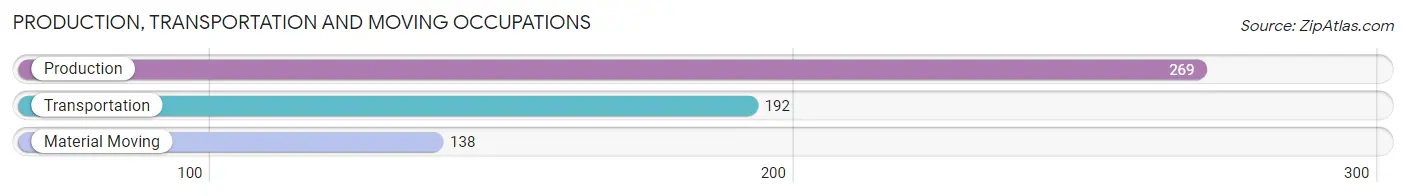
Production, Transportation and Moving Occupations by Sex
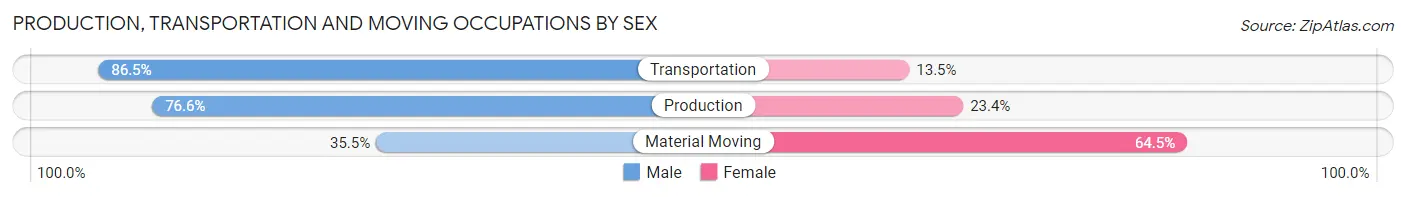
| Occupation | Male | Female |
| Production | 206 (76.6%) | 63 (23.4%) |
| Transportation | 166 (86.5%) | 26 (13.5%) |
| Material Moving | 49 (35.5%) | 89 (64.5%) |
| Total (Category) | 421 (70.3%) | 178 (29.7%) |
| Total (Overall) | 2,429 (52.1%) | 2,237 (47.9%) |
Employment Industries by Sex in East Grand Forks
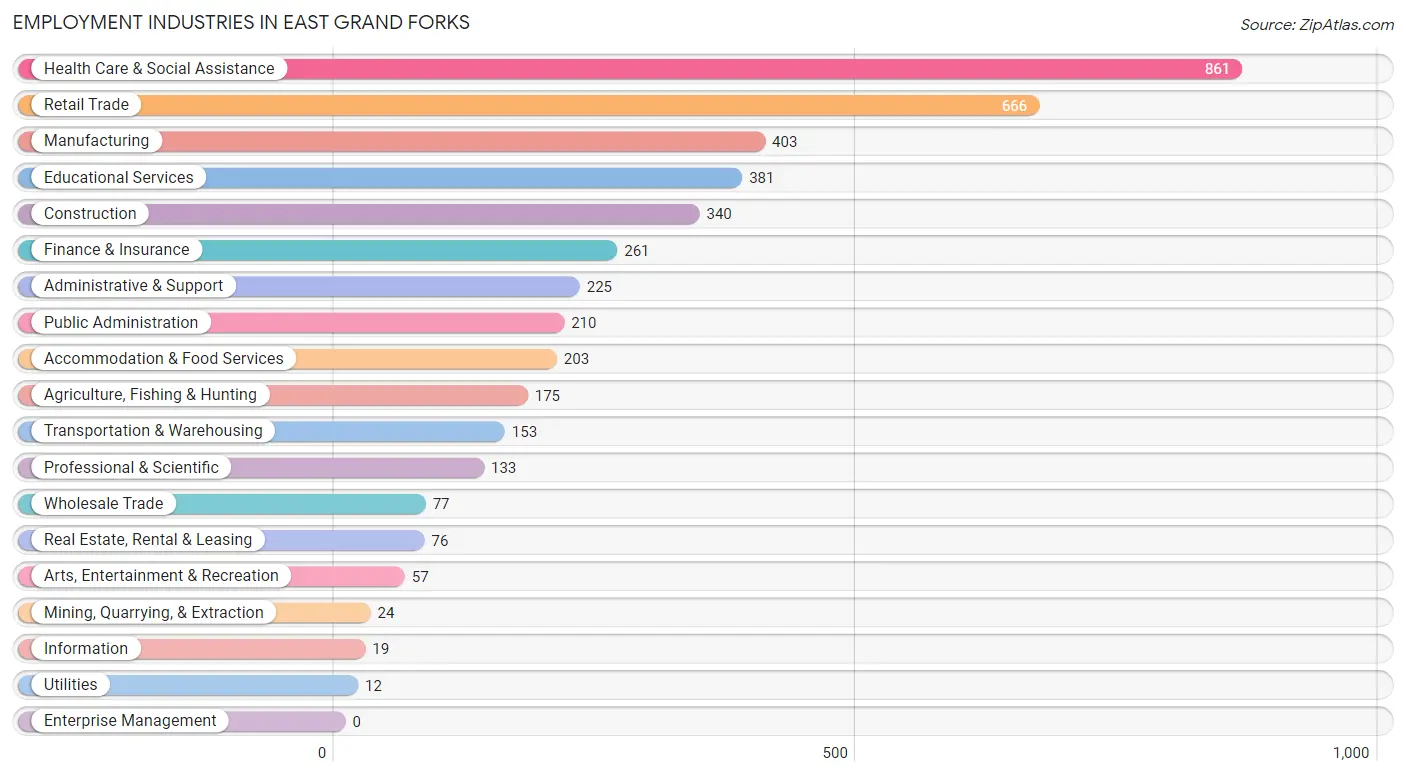
Employment Industries in East Grand Forks
The major employment industries in East Grand Forks include Health Care & Social Assistance (861 | 18.4%), Retail Trade (666 | 14.3%), Manufacturing (403 | 8.6%), Educational Services (381 | 8.2%), and Construction (340 | 7.3%).
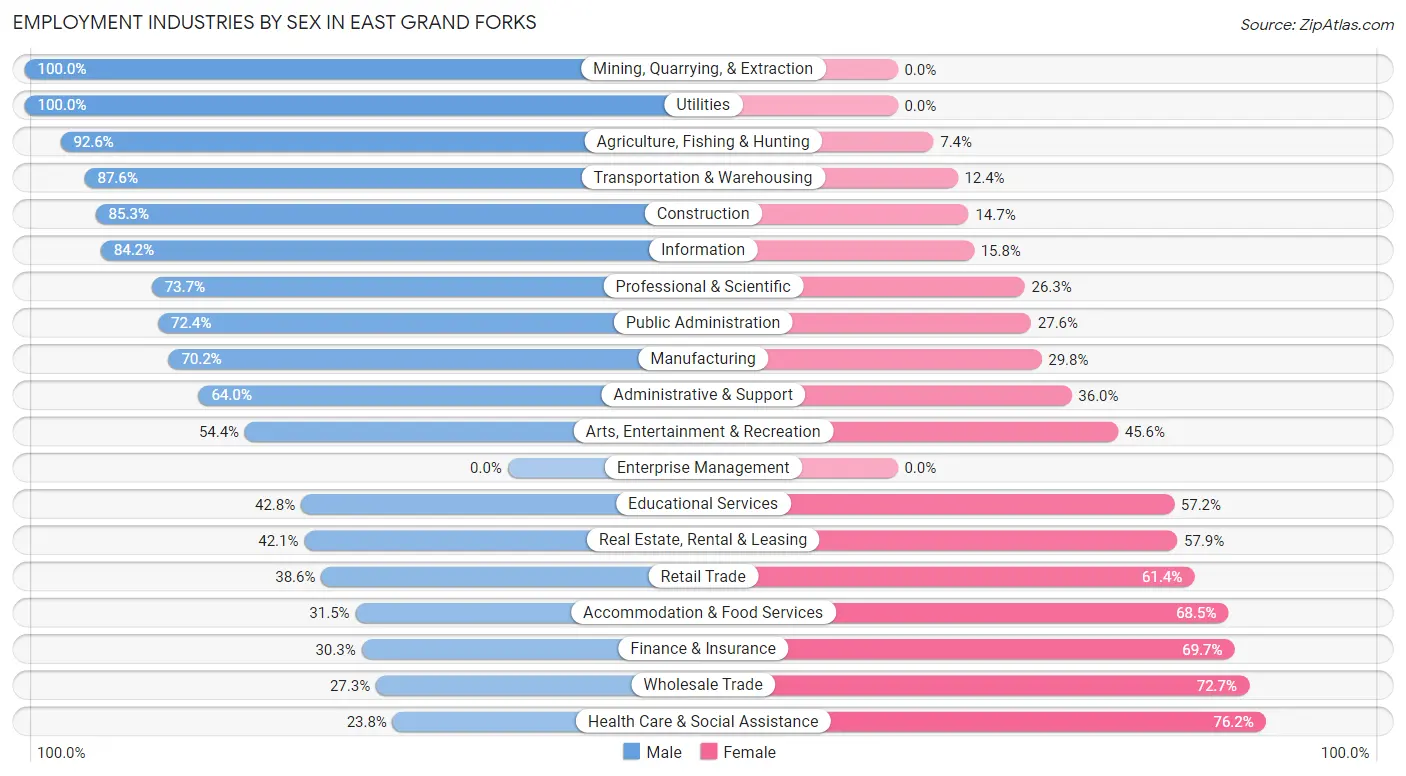
Employment Industries by Sex in East Grand Forks
The East Grand Forks industries that see more men than women are Mining, Quarrying, & Extraction (100.0%), Utilities (100.0%), and Agriculture, Fishing & Hunting (92.6%), whereas the industries that tend to have a higher number of women are Health Care & Social Assistance (76.2%), Wholesale Trade (72.7%), and Finance & Insurance (69.7%).
| Industry | Male | Female |
| Agriculture, Fishing & Hunting | 162 (92.6%) | 13 (7.4%) |
| Mining, Quarrying, & Extraction | 24 (100.0%) | 0 (0.0%) |
| Construction | 290 (85.3%) | 50 (14.7%) |
| Manufacturing | 283 (70.2%) | 120 (29.8%) |
| Wholesale Trade | 21 (27.3%) | 56 (72.7%) |
| Retail Trade | 257 (38.6%) | 409 (61.4%) |
| Transportation & Warehousing | 134 (87.6%) | 19 (12.4%) |
| Utilities | 12 (100.0%) | 0 (0.0%) |
| Information | 16 (84.2%) | 3 (15.8%) |
| Finance & Insurance | 79 (30.3%) | 182 (69.7%) |
| Real Estate, Rental & Leasing | 32 (42.1%) | 44 (57.9%) |
| Professional & Scientific | 98 (73.7%) | 35 (26.3%) |
| Enterprise Management | 0 (0.0%) | 0 (0.0%) |
| Administrative & Support | 144 (64.0%) | 81 (36.0%) |
| Educational Services | 163 (42.8%) | 218 (57.2%) |
| Health Care & Social Assistance | 205 (23.8%) | 656 (76.2%) |
| Arts, Entertainment & Recreation | 31 (54.4%) | 26 (45.6%) |
| Accommodation & Food Services | 64 (31.5%) | 139 (68.5%) |
| Public Administration | 152 (72.4%) | 58 (27.6%) |
| Total | 2,429 (52.1%) | 2,237 (47.9%) |
Education in East Grand Forks
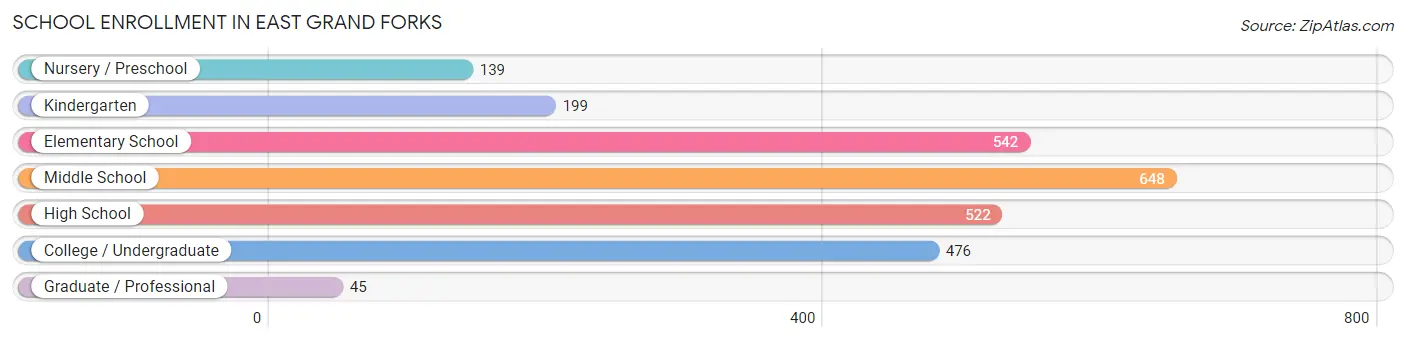
School Enrollment in East Grand Forks
The most common levels of schooling among the 2,571 students in East Grand Forks are middle school (648 | 25.2%), elementary school (542 | 21.1%), and high school (522 | 20.3%).
| School Level | # Students | % Students |
| Nursery / Preschool | 139 | 5.4% |
| Kindergarten | 199 | 7.7% |
| Elementary School | 542 | 21.1% |
| Middle School | 648 | 25.2% |
| High School | 522 | 20.3% |
| College / Undergraduate | 476 | 18.5% |
| Graduate / Professional | 45 | 1.8% |
| Total | 2,571 | 100.0% |
School Enrollment by Age by Funding Source in East Grand Forks
Out of a total of 2,571 students who are enrolled in schools in East Grand Forks, 360 (14.0%) attend a private institution, while the remaining 2,211 (86.0%) are enrolled in public schools. The age group of 3 to 4 year olds has the highest likelihood of being enrolled in private schools, with 36 (28.8% in the age bracket) enrolled. Conversely, the age group of 20 to 24 year olds has the lowest likelihood of being enrolled in a private school, with 243 (94.9% in the age bracket) attending a public institution.
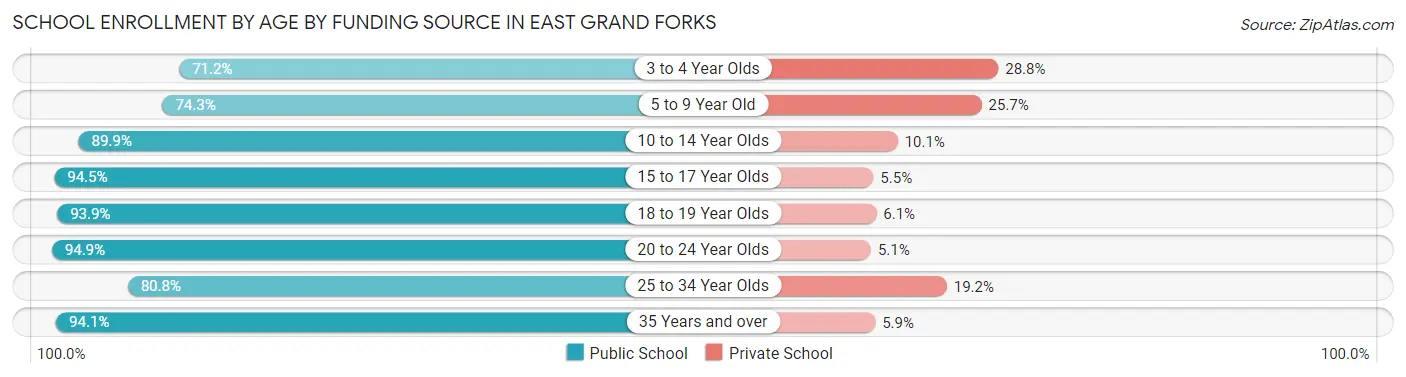
| Age Bracket | Public School | Private School |
| 3 to 4 Year Olds | 89 (71.2%) | 36 (28.8%) |
| 5 to 9 Year Old | 486 (74.3%) | 168 (25.7%) |
| 10 to 14 Year Olds | 715 (89.9%) | 80 (10.1%) |
| 15 to 17 Year Olds | 290 (94.5%) | 17 (5.5%) |
| 18 to 19 Year Olds | 170 (93.9%) | 11 (6.1%) |
| 20 to 24 Year Olds | 243 (94.9%) | 13 (5.1%) |
| 25 to 34 Year Olds | 122 (80.8%) | 29 (19.2%) |
| 35 Years and over | 96 (94.1%) | 6 (5.9%) |
| Total | 2,211 (86.0%) | 360 (14.0%) |
Educational Attainment by Field of Study in East Grand Forks
Science & technology (406 | 22.0%), business (355 | 19.3%), education (320 | 17.3%), arts & humanities (178 | 9.7%), and communications (91 | 4.9%) are the most common fields of study among 1,844 individuals in East Grand Forks who have obtained a bachelor's degree or higher.
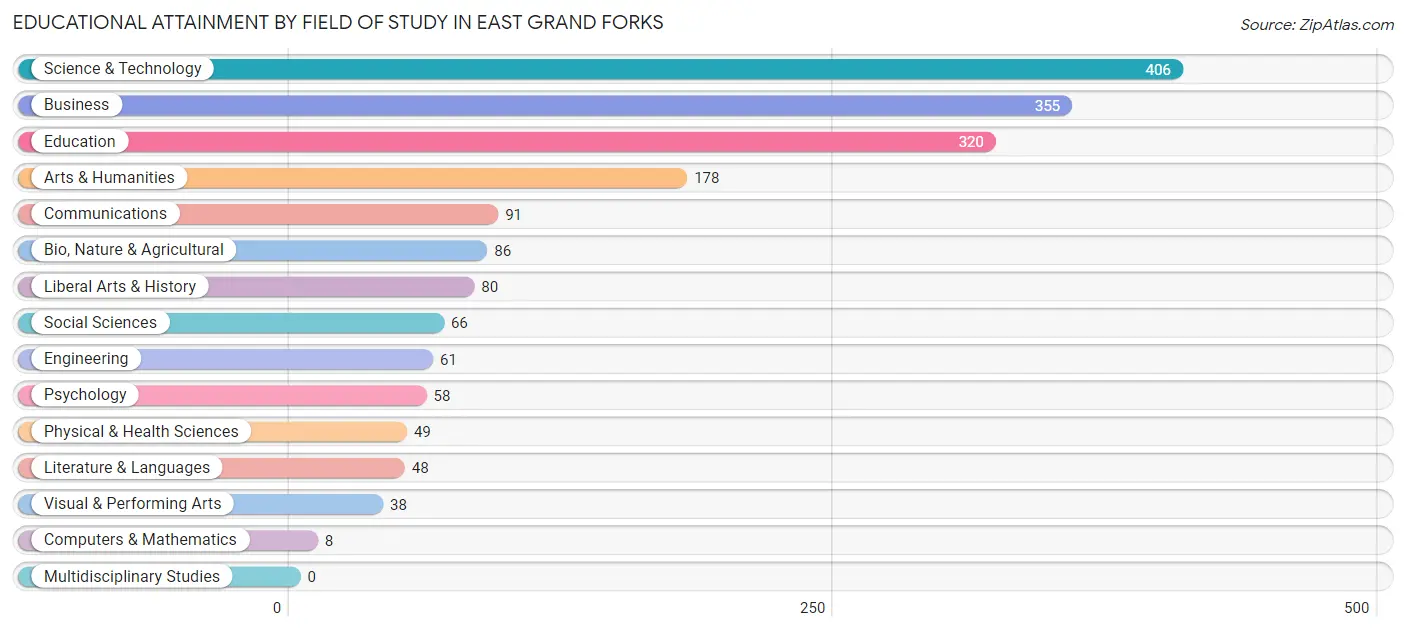
| Field of Study | # Graduates | % Graduates |
| Computers & Mathematics | 8 | 0.4% |
| Bio, Nature & Agricultural | 86 | 4.7% |
| Physical & Health Sciences | 49 | 2.7% |
| Psychology | 58 | 3.2% |
| Social Sciences | 66 | 3.6% |
| Engineering | 61 | 3.3% |
| Multidisciplinary Studies | 0 | 0.0% |
| Science & Technology | 406 | 22.0% |
| Business | 355 | 19.3% |
| Education | 320 | 17.3% |
| Literature & Languages | 48 | 2.6% |
| Liberal Arts & History | 80 | 4.3% |
| Visual & Performing Arts | 38 | 2.1% |
| Communications | 91 | 4.9% |
| Arts & Humanities | 178 | 9.7% |
| Total | 1,844 | 100.0% |
Transportation & Commute in East Grand Forks
Vehicle Availability by Sex in East Grand Forks
The most prevalent vehicle ownership categories in East Grand Forks are males with 2 vehicles (1,034, accounting for 42.5%) and females with 2 vehicles (912, making up 47.1%).
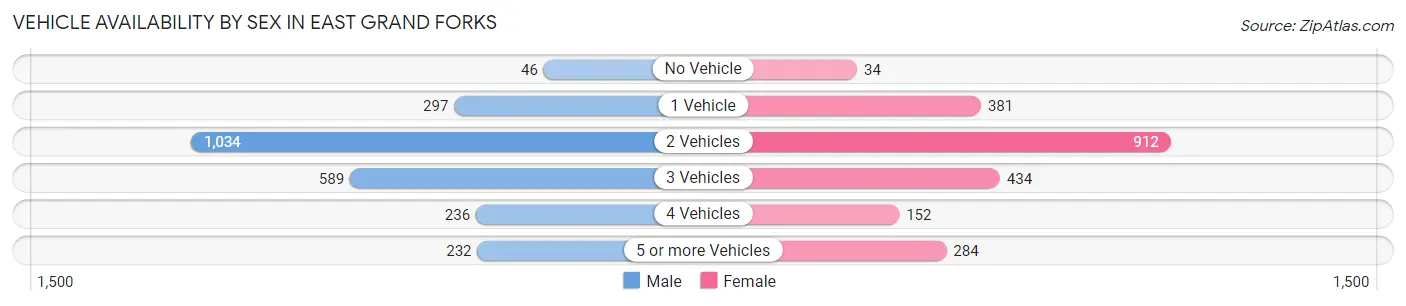
| Vehicles Available | Male | Female |
| No Vehicle | 46 (1.9%) | 34 (1.5%) |
| 1 Vehicle | 297 (12.2%) | 381 (17.3%) |
| 2 Vehicles | 1,034 (42.5%) | 912 (41.5%) |
| 3 Vehicles | 589 (24.2%) | 434 (19.8%) |
| 4 Vehicles | 236 (9.7%) | 152 (6.9%) |
| 5 or more Vehicles | 232 (9.5%) | 284 (12.9%) |
| Total | 2,434 (100.0%) | 2,197 (100.0%) |
Commute Time in East Grand Forks
The most frequently occuring commute durations in East Grand Forks are 15 to 19 minutes (1,100 commuters, 25.4%), 10 to 14 minutes (937 commuters, 21.6%), and 5 to 9 minutes (867 commuters, 20.0%).
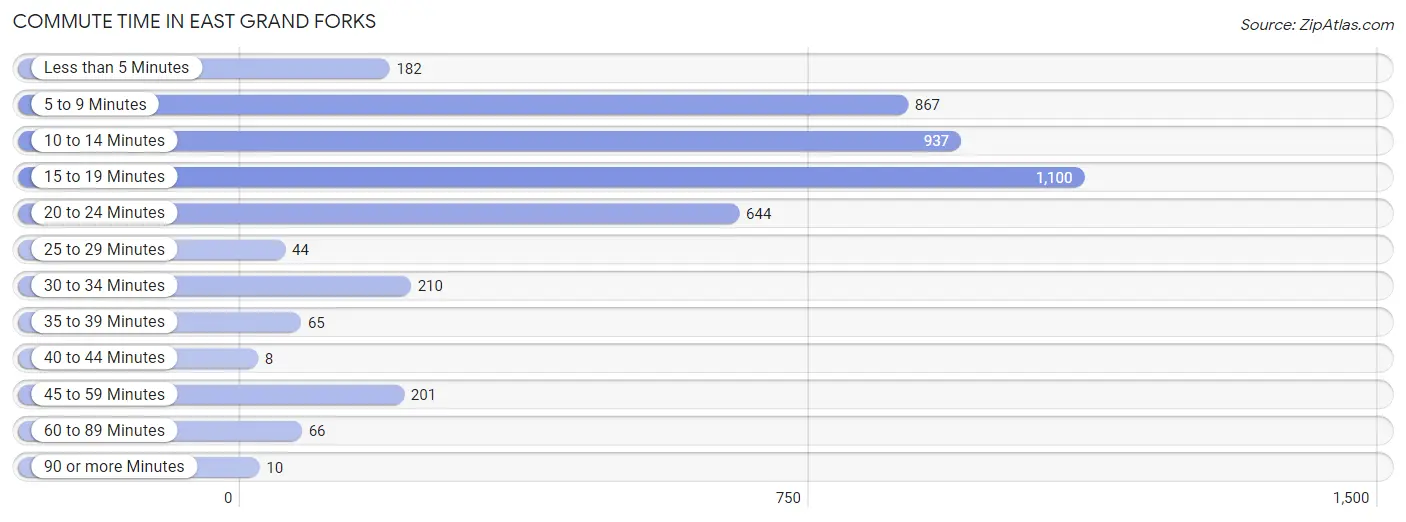
| Commute Time | # Commuters | % Commuters |
| Less than 5 Minutes | 182 | 4.2% |
| 5 to 9 Minutes | 867 | 20.0% |
| 10 to 14 Minutes | 937 | 21.6% |
| 15 to 19 Minutes | 1,100 | 25.4% |
| 20 to 24 Minutes | 644 | 14.9% |
| 25 to 29 Minutes | 44 | 1.0% |
| 30 to 34 Minutes | 210 | 4.9% |
| 35 to 39 Minutes | 65 | 1.5% |
| 40 to 44 Minutes | 8 | 0.2% |
| 45 to 59 Minutes | 201 | 4.6% |
| 60 to 89 Minutes | 66 | 1.5% |
| 90 or more Minutes | 10 | 0.2% |
Commute Time by Sex in East Grand Forks
The most common commute times in East Grand Forks are 15 to 19 minutes (556 commuters, 24.3%) for males and 15 to 19 minutes (544 commuters, 26.5%) for females.
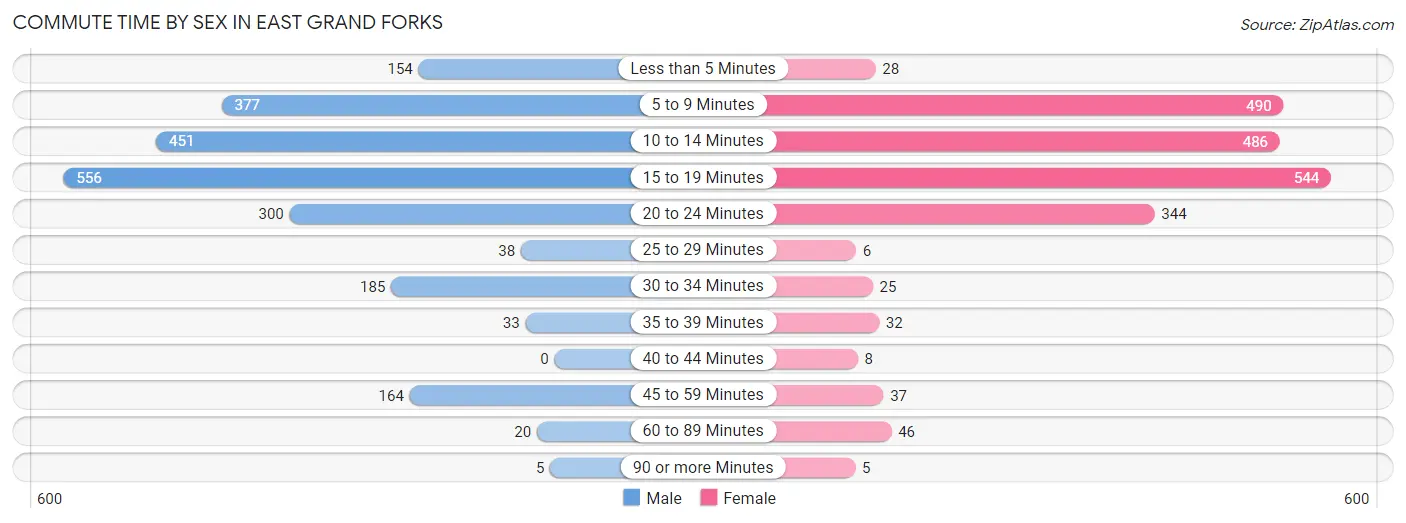
| Commute Time | Male | Female |
| Less than 5 Minutes | 154 (6.8%) | 28 (1.4%) |
| 5 to 9 Minutes | 377 (16.5%) | 490 (23.9%) |
| 10 to 14 Minutes | 451 (19.8%) | 486 (23.7%) |
| 15 to 19 Minutes | 556 (24.3%) | 544 (26.5%) |
| 20 to 24 Minutes | 300 (13.1%) | 344 (16.8%) |
| 25 to 29 Minutes | 38 (1.7%) | 6 (0.3%) |
| 30 to 34 Minutes | 185 (8.1%) | 25 (1.2%) |
| 35 to 39 Minutes | 33 (1.5%) | 32 (1.6%) |
| 40 to 44 Minutes | 0 (0.0%) | 8 (0.4%) |
| 45 to 59 Minutes | 164 (7.2%) | 37 (1.8%) |
| 60 to 89 Minutes | 20 (0.9%) | 46 (2.2%) |
| 90 or more Minutes | 5 (0.2%) | 5 (0.2%) |
Time of Departure to Work by Sex in East Grand Forks
The most frequent times of departure to work in East Grand Forks are 7:30 AM to 7:59 AM (502, 22.0%) for males and 7:30 AM to 7:59 AM (491, 23.9%) for females.
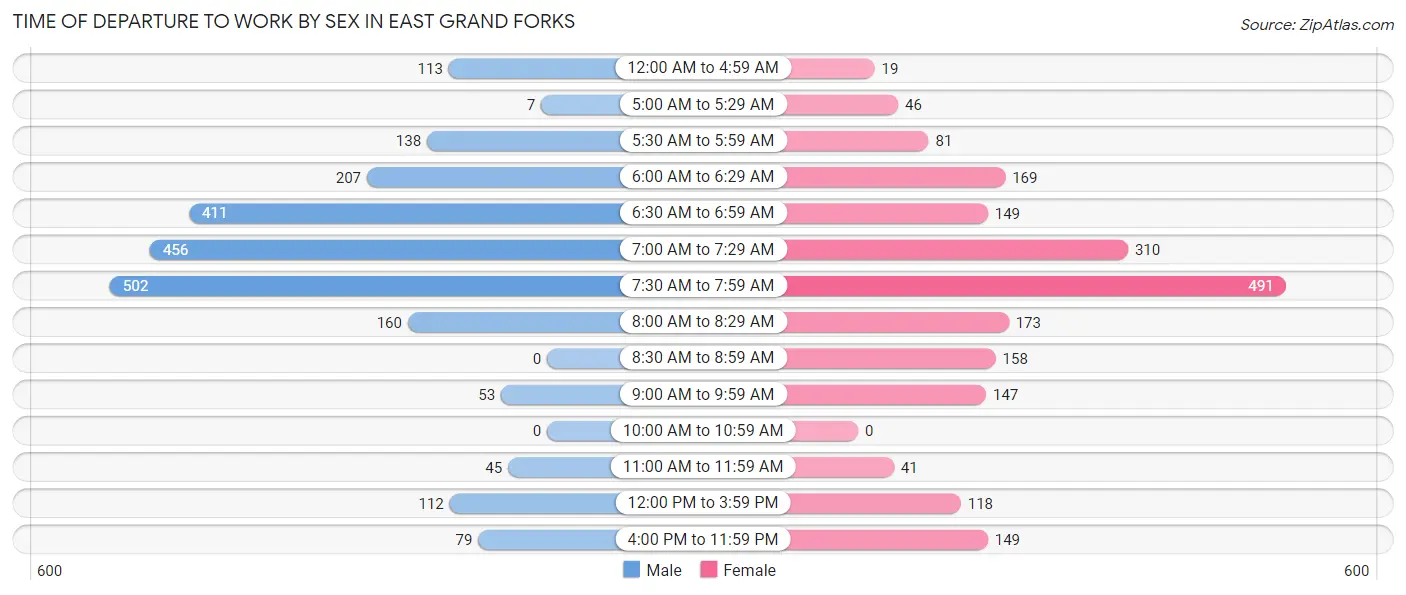
| Time of Departure | Male | Female |
| 12:00 AM to 4:59 AM | 113 (5.0%) | 19 (0.9%) |
| 5:00 AM to 5:29 AM | 7 (0.3%) | 46 (2.2%) |
| 5:30 AM to 5:59 AM | 138 (6.0%) | 81 (4.0%) |
| 6:00 AM to 6:29 AM | 207 (9.1%) | 169 (8.2%) |
| 6:30 AM to 6:59 AM | 411 (18.0%) | 149 (7.3%) |
| 7:00 AM to 7:29 AM | 456 (20.0%) | 310 (15.1%) |
| 7:30 AM to 7:59 AM | 502 (22.0%) | 491 (23.9%) |
| 8:00 AM to 8:29 AM | 160 (7.0%) | 173 (8.4%) |
| 8:30 AM to 8:59 AM | 0 (0.0%) | 158 (7.7%) |
| 9:00 AM to 9:59 AM | 53 (2.3%) | 147 (7.2%) |
| 10:00 AM to 10:59 AM | 0 (0.0%) | 0 (0.0%) |
| 11:00 AM to 11:59 AM | 45 (2.0%) | 41 (2.0%) |
| 12:00 PM to 3:59 PM | 112 (4.9%) | 118 (5.8%) |
| 4:00 PM to 11:59 PM | 79 (3.5%) | 149 (7.3%) |
| Total | 2,283 (100.0%) | 2,051 (100.0%) |
Housing Occupancy in East Grand Forks
Occupancy by Ownership in East Grand Forks
Of the total 3,371 dwellings in East Grand Forks, owner-occupied units account for 2,298 (68.2%), while renter-occupied units make up 1,073 (31.8%).
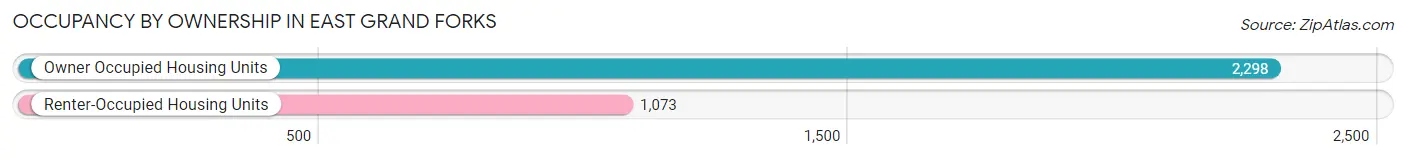
| Occupancy | # Housing Units | % Housing Units |
| Owner Occupied Housing Units | 2,298 | 68.2% |
| Renter-Occupied Housing Units | 1,073 | 31.8% |
| Total Occupied Housing Units | 3,371 | 100.0% |
Occupancy by Household Size in East Grand Forks
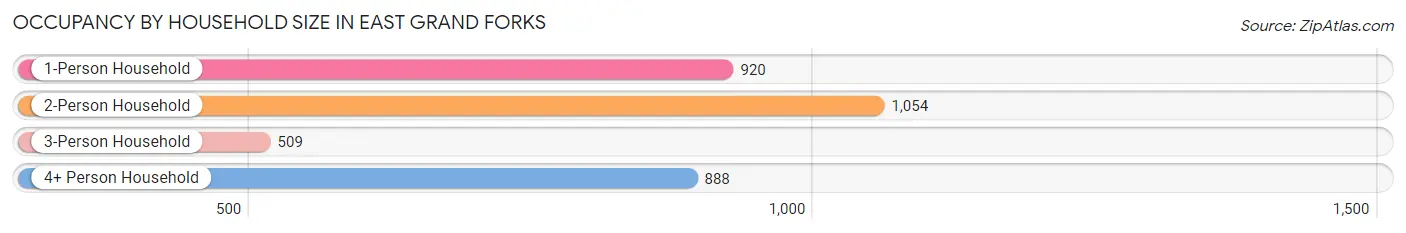
| Household Size | # Housing Units | % Housing Units |
| 1-Person Household | 920 | 27.3% |
| 2-Person Household | 1,054 | 31.3% |
| 3-Person Household | 509 | 15.1% |
| 4+ Person Household | 888 | 26.3% |
| Total Housing Units | 3,371 | 100.0% |
Occupancy by Ownership by Household Size in East Grand Forks
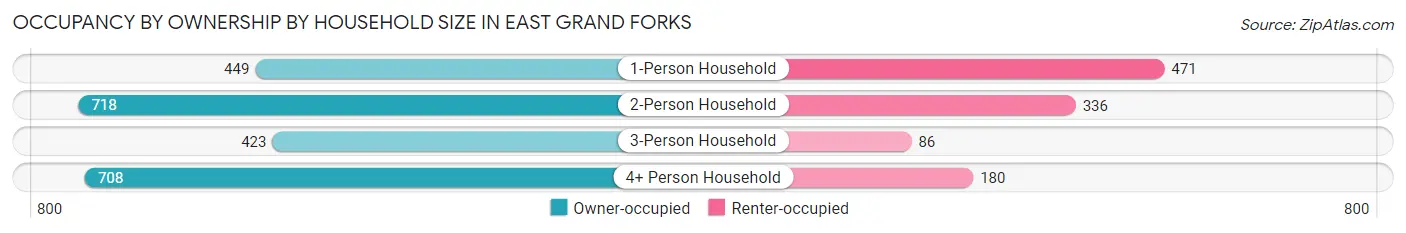
| Household Size | Owner-occupied | Renter-occupied |
| 1-Person Household | 449 (48.8%) | 471 (51.2%) |
| 2-Person Household | 718 (68.1%) | 336 (31.9%) |
| 3-Person Household | 423 (83.1%) | 86 (16.9%) |
| 4+ Person Household | 708 (79.7%) | 180 (20.3%) |
| Total Housing Units | 2,298 (68.2%) | 1,073 (31.8%) |
Occupancy by Educational Attainment in East Grand Forks
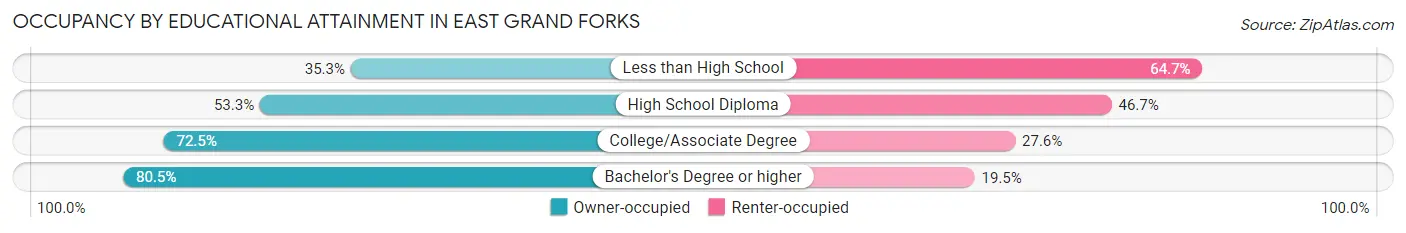
| Household Size | Owner-occupied | Renter-occupied |
| Less than High School | 83 (35.3%) | 152 (64.7%) |
| High School Diploma | 384 (53.3%) | 336 (46.7%) |
| College/Associate Degree | 1,023 (72.5%) | 389 (27.6%) |
| Bachelor's Degree or higher | 808 (80.5%) | 196 (19.5%) |
Occupancy by Age of Householder in East Grand Forks
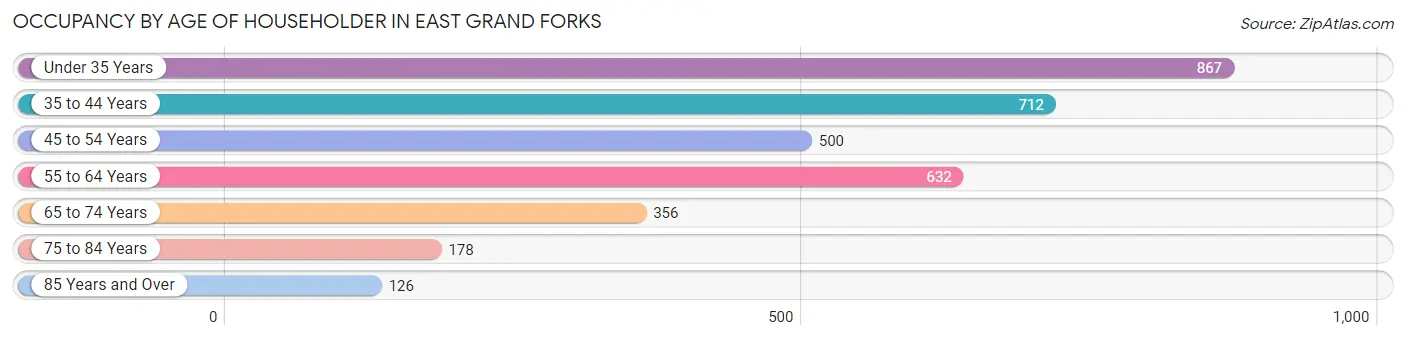
| Age Bracket | # Households | % Households |
| Under 35 Years | 867 | 25.7% |
| 35 to 44 Years | 712 | 21.1% |
| 45 to 54 Years | 500 | 14.8% |
| 55 to 64 Years | 632 | 18.8% |
| 65 to 74 Years | 356 | 10.6% |
| 75 to 84 Years | 178 | 5.3% |
| 85 Years and Over | 126 | 3.7% |
| Total | 3,371 | 100.0% |
Housing Finances in East Grand Forks
Median Income by Occupancy in East Grand Forks
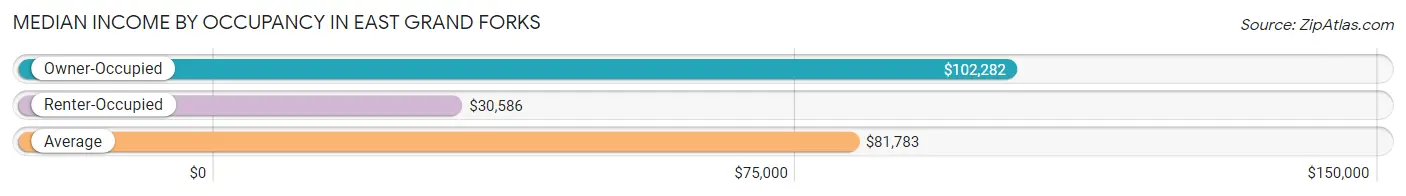
| Occupancy Type | # Households | Median Income |
| Owner-Occupied | 2,298 (68.2%) | $102,282 |
| Renter-Occupied | 1,073 (31.8%) | $30,586 |
| Average | 3,371 (100.0%) | $81,783 |
Occupancy by Householder Income Bracket in East Grand Forks
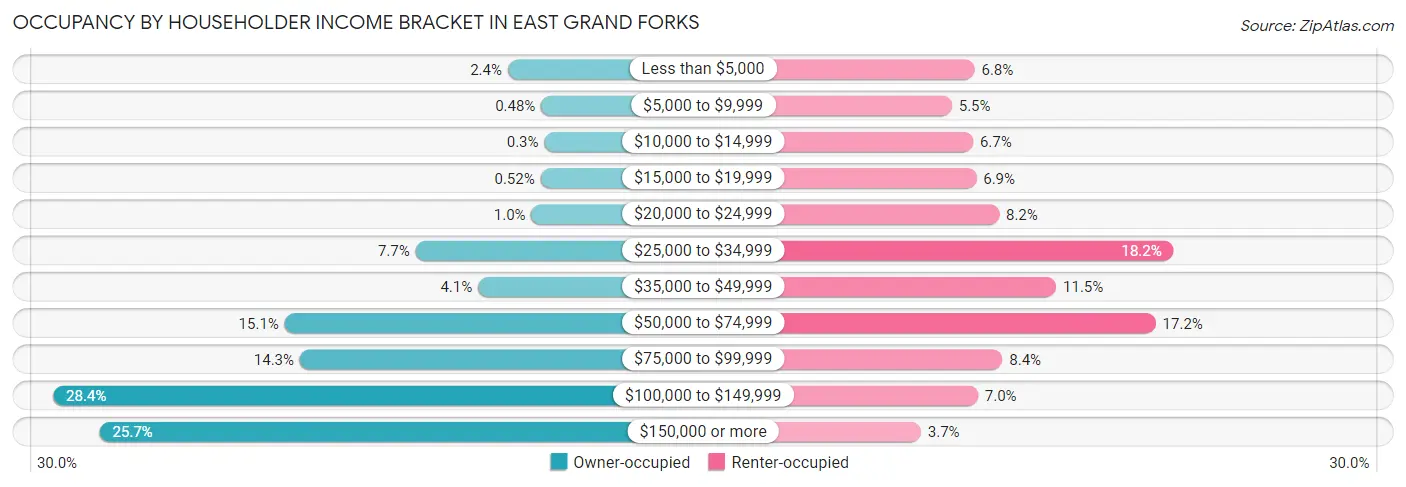
| Income Bracket | Owner-occupied | Renter-occupied |
| Less than $5,000 | 55 (2.4%) | 73 (6.8%) |
| $5,000 to $9,999 | 11 (0.5%) | 59 (5.5%) |
| $10,000 to $14,999 | 7 (0.3%) | 72 (6.7%) |
| $15,000 to $19,999 | 12 (0.5%) | 74 (6.9%) |
| $20,000 to $24,999 | 24 (1.0%) | 88 (8.2%) |
| $25,000 to $34,999 | 176 (7.7%) | 195 (18.2%) |
| $35,000 to $49,999 | 94 (4.1%) | 123 (11.5%) |
| $50,000 to $74,999 | 348 (15.1%) | 184 (17.2%) |
| $75,000 to $99,999 | 328 (14.3%) | 90 (8.4%) |
| $100,000 to $149,999 | 652 (28.4%) | 75 (7.0%) |
| $150,000 or more | 591 (25.7%) | 40 (3.7%) |
| Total | 2,298 (100.0%) | 1,073 (100.0%) |
Monthly Housing Cost Tiers in East Grand Forks
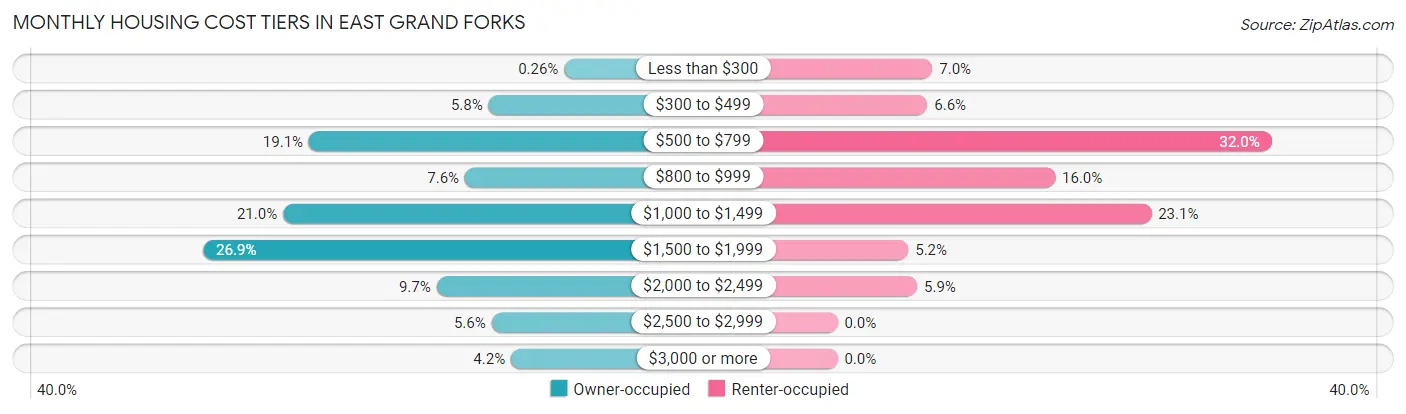
| Monthly Cost | Owner-occupied | Renter-occupied |
| Less than $300 | 6 (0.3%) | 75 (7.0%) |
| $300 to $499 | 134 (5.8%) | 71 (6.6%) |
| $500 to $799 | 438 (19.1%) | 343 (32.0%) |
| $800 to $999 | 174 (7.6%) | 172 (16.0%) |
| $1,000 to $1,499 | 482 (21.0%) | 248 (23.1%) |
| $1,500 to $1,999 | 617 (26.9%) | 56 (5.2%) |
| $2,000 to $2,499 | 222 (9.7%) | 63 (5.9%) |
| $2,500 to $2,999 | 129 (5.6%) | 0 (0.0%) |
| $3,000 or more | 96 (4.2%) | 0 (0.0%) |
| Total | 2,298 (100.0%) | 1,073 (100.0%) |
Physical Housing Characteristics in East Grand Forks
Housing Structures in East Grand Forks
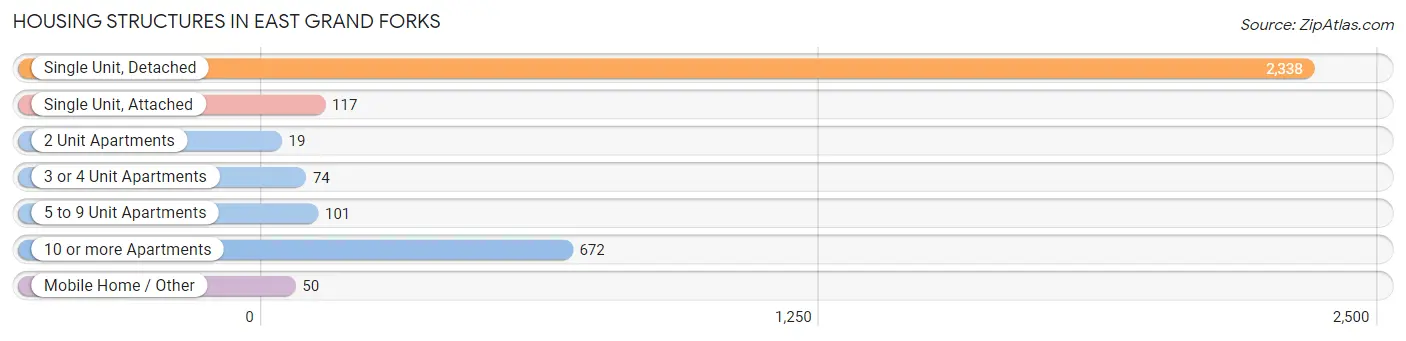
| Structure Type | # Housing Units | % Housing Units |
| Single Unit, Detached | 2,338 | 69.4% |
| Single Unit, Attached | 117 | 3.5% |
| 2 Unit Apartments | 19 | 0.6% |
| 3 or 4 Unit Apartments | 74 | 2.2% |
| 5 to 9 Unit Apartments | 101 | 3.0% |
| 10 or more Apartments | 672 | 19.9% |
| Mobile Home / Other | 50 | 1.5% |
| Total | 3,371 | 100.0% |
Housing Structures by Occupancy in East Grand Forks
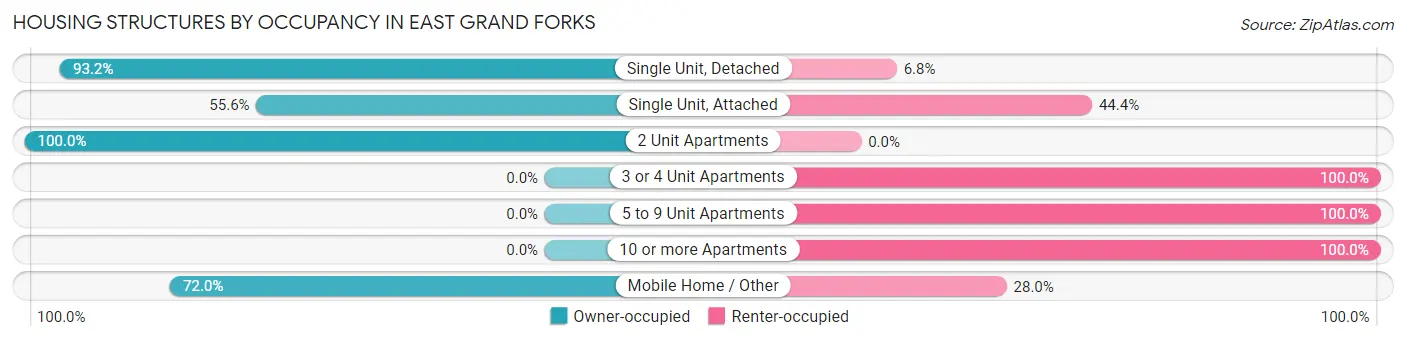
| Structure Type | Owner-occupied | Renter-occupied |
| Single Unit, Detached | 2,178 (93.2%) | 160 (6.8%) |
| Single Unit, Attached | 65 (55.6%) | 52 (44.4%) |
| 2 Unit Apartments | 19 (100.0%) | 0 (0.0%) |
| 3 or 4 Unit Apartments | 0 (0.0%) | 74 (100.0%) |
| 5 to 9 Unit Apartments | 0 (0.0%) | 101 (100.0%) |
| 10 or more Apartments | 0 (0.0%) | 672 (100.0%) |
| Mobile Home / Other | 36 (72.0%) | 14 (28.0%) |
| Total | 2,298 (68.2%) | 1,073 (31.8%) |
Housing Structures by Number of Rooms in East Grand Forks
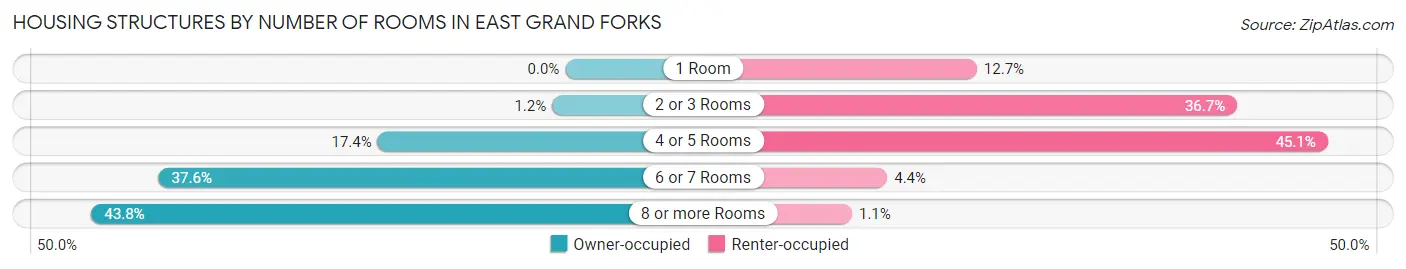
| Number of Rooms | Owner-occupied | Renter-occupied |
| 1 Room | 0 (0.0%) | 136 (12.7%) |
| 2 or 3 Rooms | 28 (1.2%) | 394 (36.7%) |
| 4 or 5 Rooms | 399 (17.4%) | 484 (45.1%) |
| 6 or 7 Rooms | 864 (37.6%) | 47 (4.4%) |
| 8 or more Rooms | 1,007 (43.8%) | 12 (1.1%) |
| Total | 2,298 (100.0%) | 1,073 (100.0%) |
Housing Structure by Heating Type in East Grand Forks
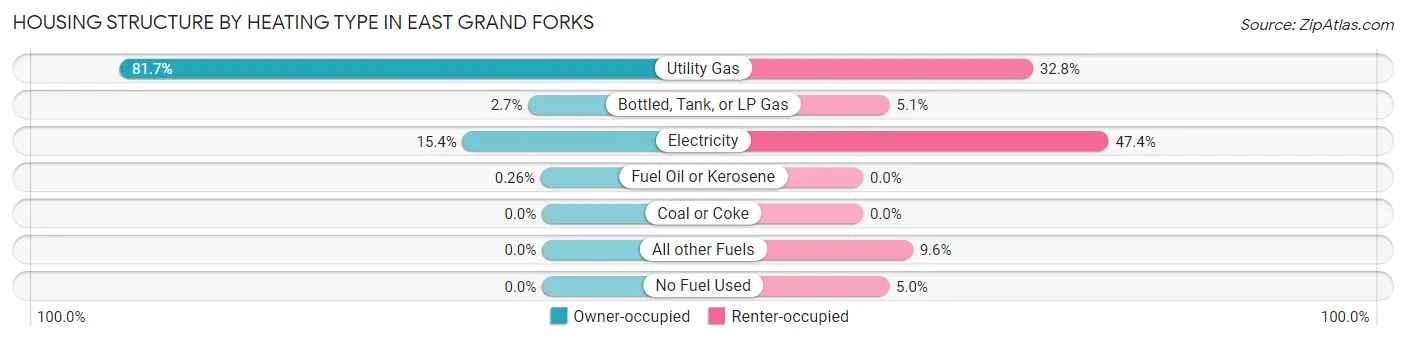
| Heating Type | Owner-occupied | Renter-occupied |
| Utility Gas | 1,878 (81.7%) | 352 (32.8%) |
| Bottled, Tank, or LP Gas | 61 (2.6%) | 55 (5.1%) |
| Electricity | 353 (15.4%) | 509 (47.4%) |
| Fuel Oil or Kerosene | 6 (0.3%) | 0 (0.0%) |
| Coal or Coke | 0 (0.0%) | 0 (0.0%) |
| All other Fuels | 0 (0.0%) | 103 (9.6%) |
| No Fuel Used | 0 (0.0%) | 54 (5.0%) |
| Total | 2,298 (100.0%) | 1,073 (100.0%) |
Household Vehicle Usage in East Grand Forks
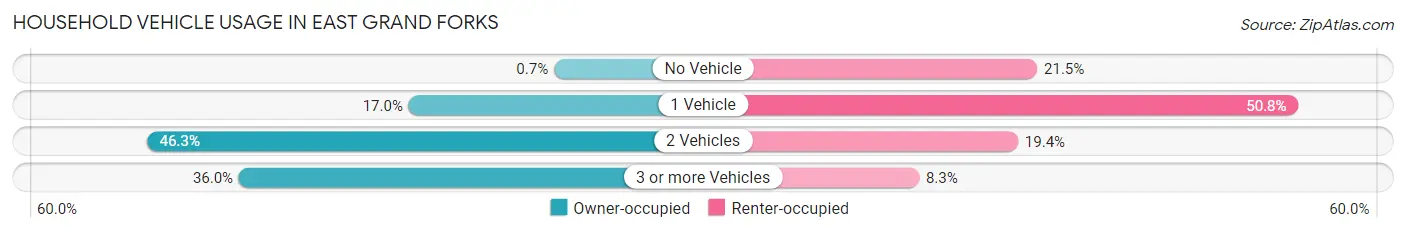
| Vehicles per Household | Owner-occupied | Renter-occupied |
| No Vehicle | 16 (0.7%) | 231 (21.5%) |
| 1 Vehicle | 390 (17.0%) | 545 (50.8%) |
| 2 Vehicles | 1,065 (46.3%) | 208 (19.4%) |
| 3 or more Vehicles | 827 (36.0%) | 89 (8.3%) |
| Total | 2,298 (100.0%) | 1,073 (100.0%) |
Real Estate & Mortgages in East Grand Forks
Real Estate and Mortgage Overview in East Grand Forks
| Characteristic | Without Mortgage | With Mortgage |
| Housing Units | 589 | 1,709 |
| Median Property Value | $222,900 | $246,300 |
| Median Household Income | $72,214 | $508 |
| Monthly Housing Costs | $636 | $96 |
| Real Estate Taxes | $2,750 | $33 |
Property Value by Mortgage Status in East Grand Forks
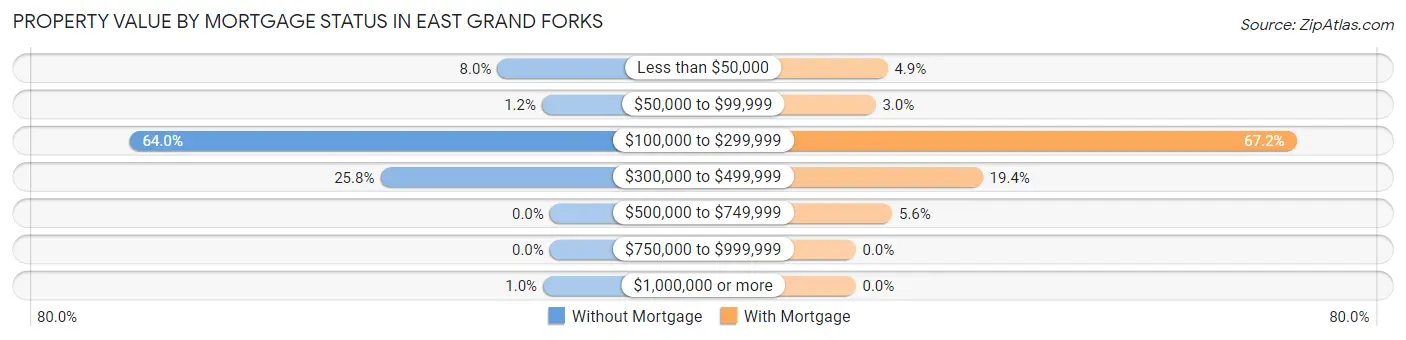
| Property Value | Without Mortgage | With Mortgage |
| Less than $50,000 | 47 (8.0%) | 83 (4.9%) |
| $50,000 to $99,999 | 7 (1.2%) | 52 (3.0%) |
| $100,000 to $299,999 | 377 (64.0%) | 1,148 (67.2%) |
| $300,000 to $499,999 | 152 (25.8%) | 331 (19.4%) |
| $500,000 to $749,999 | 0 (0.0%) | 95 (5.6%) |
| $750,000 to $999,999 | 0 (0.0%) | 0 (0.0%) |
| $1,000,000 or more | 6 (1.0%) | 0 (0.0%) |
| Total | 589 (100.0%) | 1,709 (100.0%) |
Household Income by Mortgage Status in East Grand Forks
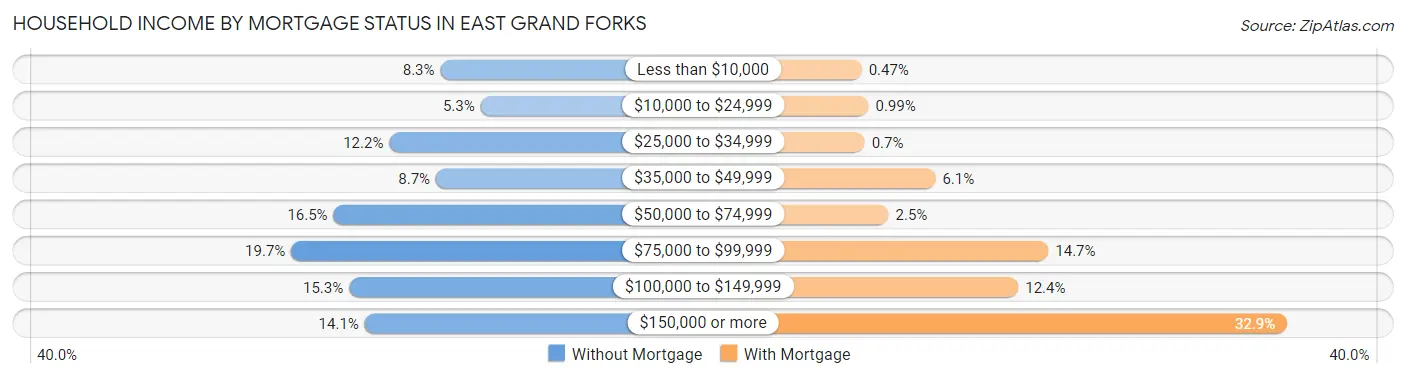
| Household Income | Without Mortgage | With Mortgage |
| Less than $10,000 | 49 (8.3%) | 8 (0.5%) |
| $10,000 to $24,999 | 31 (5.3%) | 17 (1.0%) |
| $25,000 to $34,999 | 72 (12.2%) | 12 (0.7%) |
| $35,000 to $49,999 | 51 (8.7%) | 104 (6.1%) |
| $50,000 to $74,999 | 97 (16.5%) | 43 (2.5%) |
| $75,000 to $99,999 | 116 (19.7%) | 251 (14.7%) |
| $100,000 to $149,999 | 90 (15.3%) | 212 (12.4%) |
| $150,000 or more | 83 (14.1%) | 562 (32.9%) |
| Total | 589 (100.0%) | 1,709 (100.0%) |
Property Value to Household Income Ratio in East Grand Forks
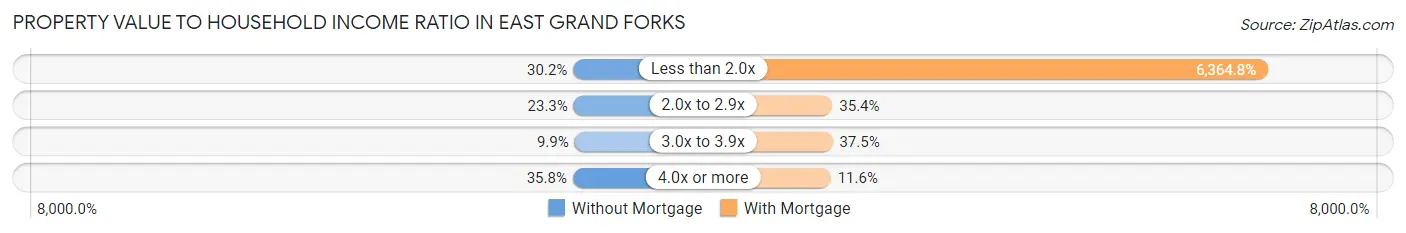
| Value-to-Income Ratio | Without Mortgage | With Mortgage |
| Less than 2.0x | 178 (30.2%) | 108,775 (6,364.8%) |
| 2.0x to 2.9x | 137 (23.3%) | 605 (35.4%) |
| 3.0x to 3.9x | 58 (9.9%) | 640 (37.4%) |
| 4.0x or more | 211 (35.8%) | 199 (11.6%) |
| Total | 589 (100.0%) | 1,709 (100.0%) |
Real Estate Taxes by Mortgage Status in East Grand Forks

| Property Taxes | Without Mortgage | With Mortgage |
| Less than $800 | 45 (7.6%) | 17 (1.0%) |
| $800 to $1,499 | 10 (1.7%) | 123 (7.2%) |
| $800 to $1,499 | 507 (86.1%) | 164 (9.6%) |
| Total | 589 (100.0%) | 1,709 (100.0%) |
Health & Disability in East Grand Forks
Health Insurance Coverage by Age in East Grand Forks
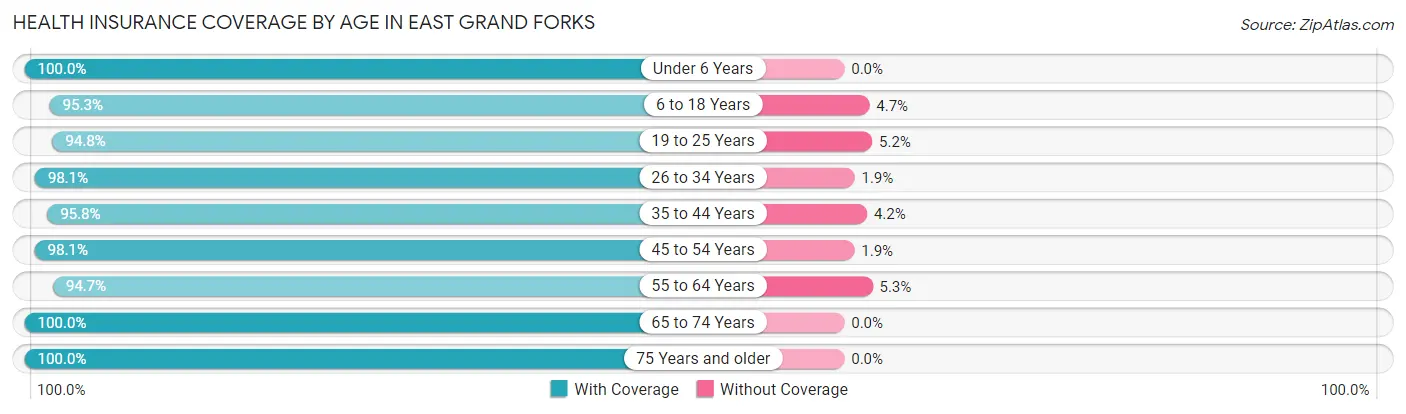
| Age Bracket | With Coverage | Without Coverage |
| Under 6 Years | 870 (100.0%) | 0 (0.0%) |
| 6 to 18 Years | 1,874 (95.3%) | 92 (4.7%) |
| 19 to 25 Years | 841 (94.8%) | 46 (5.2%) |
| 26 to 34 Years | 977 (98.1%) | 19 (1.9%) |
| 35 to 44 Years | 1,201 (95.8%) | 53 (4.2%) |
| 45 to 54 Years | 997 (98.1%) | 19 (1.9%) |
| 55 to 64 Years | 1,043 (94.7%) | 58 (5.3%) |
| 65 to 74 Years | 575 (100.0%) | 0 (0.0%) |
| 75 Years and older | 409 (100.0%) | 0 (0.0%) |
| Total | 8,787 (96.8%) | 287 (3.2%) |
Health Insurance Coverage by Citizenship Status in East Grand Forks
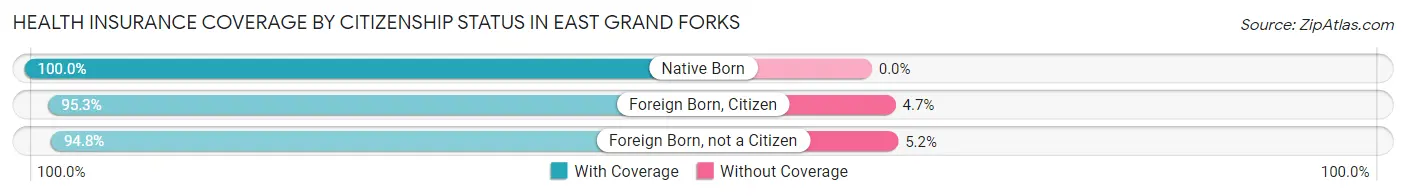
| Citizenship Status | With Coverage | Without Coverage |
| Native Born | 870 (100.0%) | 0 (0.0%) |
| Foreign Born, Citizen | 1,874 (95.3%) | 92 (4.7%) |
| Foreign Born, not a Citizen | 841 (94.8%) | 46 (5.2%) |
Health Insurance Coverage by Household Income in East Grand Forks
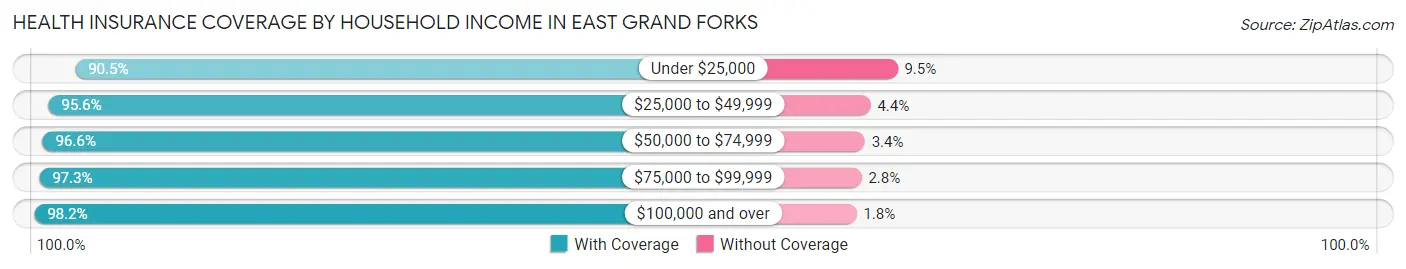
| Household Income | With Coverage | Without Coverage |
| Under $25,000 | 811 (90.5%) | 85 (9.5%) |
| $25,000 to $49,999 | 1,076 (95.6%) | 50 (4.4%) |
| $50,000 to $74,999 | 948 (96.6%) | 33 (3.4%) |
| $75,000 to $99,999 | 1,166 (97.3%) | 33 (2.8%) |
| $100,000 and over | 4,663 (98.2%) | 86 (1.8%) |
Public vs Private Health Insurance Coverage by Age in East Grand Forks
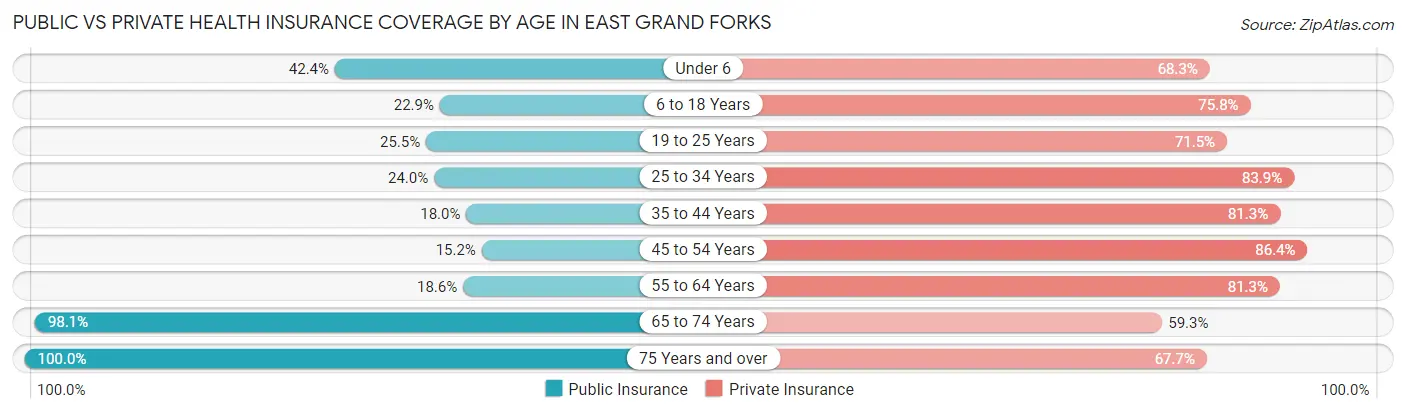
| Age Bracket | Public Insurance | Private Insurance |
| Under 6 | 369 (42.4%) | 594 (68.3%) |
| 6 to 18 Years | 451 (22.9%) | 1,491 (75.8%) |
| 19 to 25 Years | 226 (25.5%) | 634 (71.5%) |
| 25 to 34 Years | 239 (24.0%) | 836 (83.9%) |
| 35 to 44 Years | 226 (18.0%) | 1,020 (81.3%) |
| 45 to 54 Years | 154 (15.2%) | 878 (86.4%) |
| 55 to 64 Years | 205 (18.6%) | 895 (81.3%) |
| 65 to 74 Years | 564 (98.1%) | 341 (59.3%) |
| 75 Years and over | 409 (100.0%) | 277 (67.7%) |
| Total | 2,843 (31.3%) | 6,966 (76.8%) |
Disability Status by Sex by Age in East Grand Forks
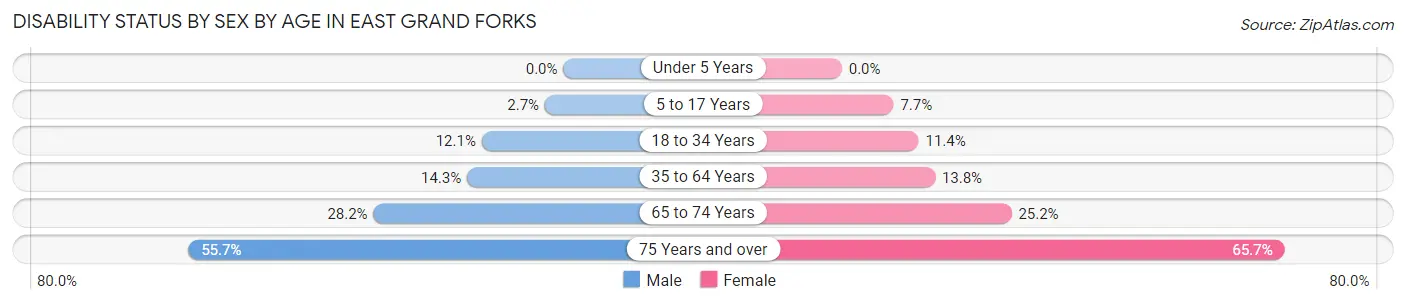
| Age Bracket | Male | Female |
| Under 5 Years | 0 (0.0%) | 0 (0.0%) |
| 5 to 17 Years | 31 (2.7%) | 68 (7.7%) |
| 18 to 34 Years | 132 (12.1%) | 109 (11.4%) |
| 35 to 64 Years | 234 (14.3%) | 240 (13.8%) |
| 65 to 74 Years | 86 (28.2%) | 68 (25.2%) |
| 75 Years and over | 88 (55.7%) | 165 (65.7%) |
Disability Class by Sex by Age in East Grand Forks
Disability Class: Hearing Difficulty
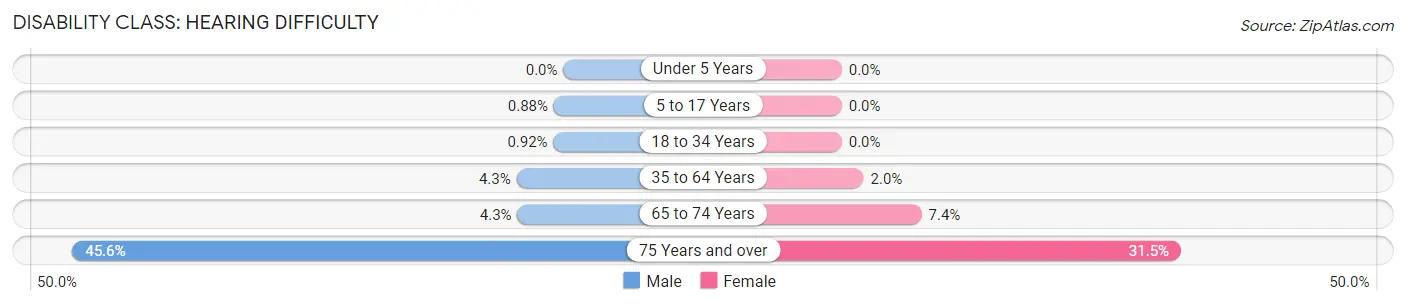
| Age Bracket | Male | Female |
| Under 5 Years | 0 (0.0%) | 0 (0.0%) |
| 5 to 17 Years | 10 (0.9%) | 0 (0.0%) |
| 18 to 34 Years | 10 (0.9%) | 0 (0.0%) |
| 35 to 64 Years | 71 (4.3%) | 35 (2.0%) |
| 65 to 74 Years | 13 (4.3%) | 20 (7.4%) |
| 75 Years and over | 72 (45.6%) | 79 (31.5%) |
Disability Class: Vision Difficulty
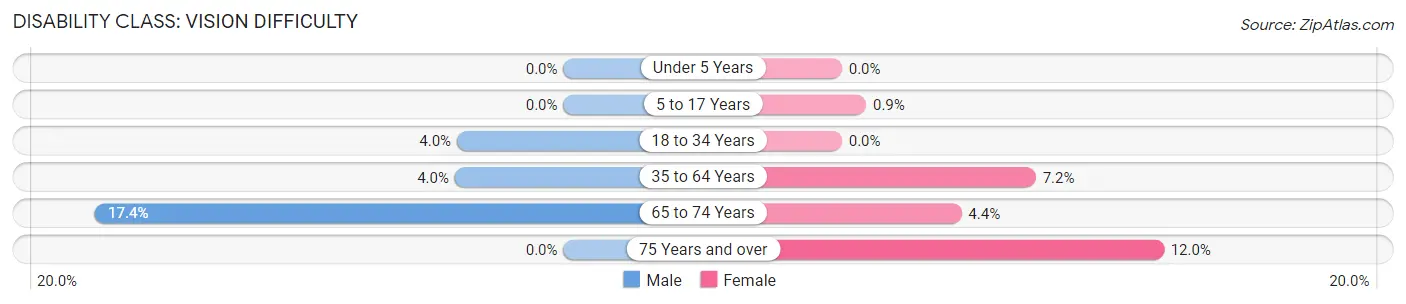
| Age Bracket | Male | Female |
| Under 5 Years | 0 (0.0%) | 0 (0.0%) |
| 5 to 17 Years | 0 (0.0%) | 8 (0.9%) |
| 18 to 34 Years | 43 (4.0%) | 0 (0.0%) |
| 35 to 64 Years | 66 (4.0%) | 125 (7.2%) |
| 65 to 74 Years | 53 (17.4%) | 12 (4.4%) |
| 75 Years and over | 0 (0.0%) | 30 (11.9%) |
Disability Class: Cognitive Difficulty
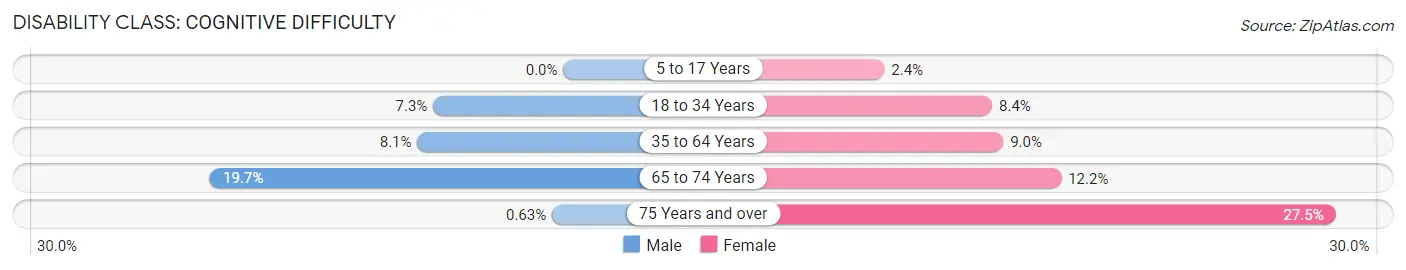
| Age Bracket | Male | Female |
| 5 to 17 Years | 0 (0.0%) | 21 (2.4%) |
| 18 to 34 Years | 79 (7.2%) | 80 (8.4%) |
| 35 to 64 Years | 133 (8.1%) | 156 (9.0%) |
| 65 to 74 Years | 60 (19.7%) | 33 (12.2%) |
| 75 Years and over | 1 (0.6%) | 69 (27.5%) |
Disability Class: Ambulatory Difficulty
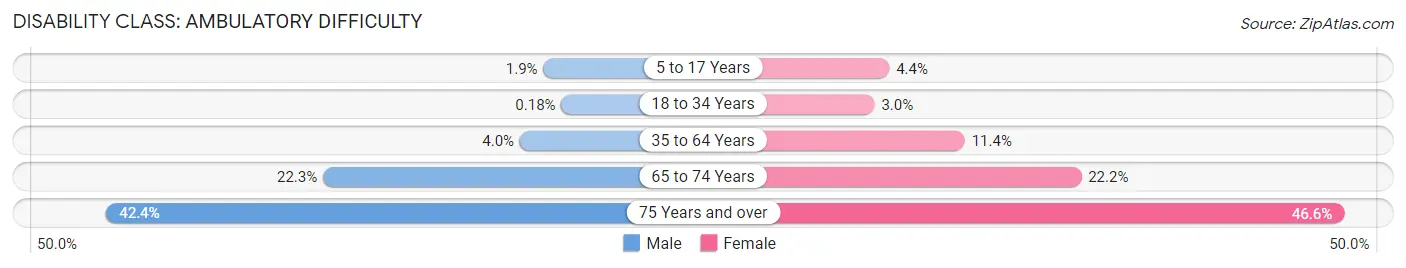
| Age Bracket | Male | Female |
| 5 to 17 Years | 21 (1.8%) | 39 (4.4%) |
| 18 to 34 Years | 2 (0.2%) | 29 (3.0%) |
| 35 to 64 Years | 66 (4.0%) | 198 (11.4%) |
| 65 to 74 Years | 68 (22.3%) | 60 (22.2%) |
| 75 Years and over | 67 (42.4%) | 117 (46.6%) |
Disability Class: Self-Care Difficulty
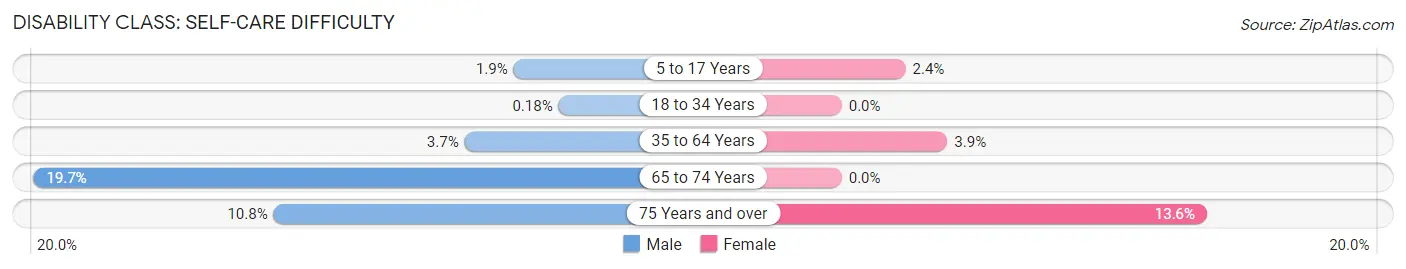
| Age Bracket | Male | Female |
| 5 to 17 Years | 21 (1.8%) | 21 (2.4%) |
| 18 to 34 Years | 2 (0.2%) | 0 (0.0%) |
| 35 to 64 Years | 60 (3.7%) | 68 (3.9%) |
| 65 to 74 Years | 60 (19.7%) | 0 (0.0%) |
| 75 Years and over | 17 (10.8%) | 34 (13.6%) |
Technology Access in East Grand Forks
Computing Device Access in East Grand Forks
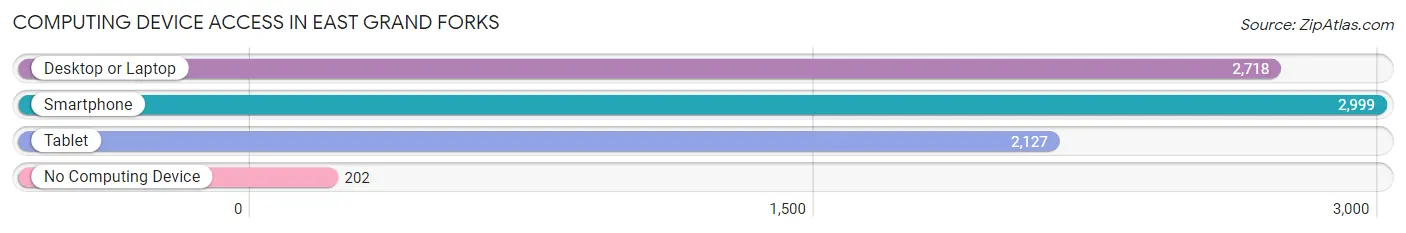
| Device Type | # Households | % Households |
| Desktop or Laptop | 2,718 | 80.6% |
| Smartphone | 2,999 | 89.0% |
| Tablet | 2,127 | 63.1% |
| No Computing Device | 202 | 6.0% |
| Total | 3,371 | 100.0% |
Internet Access in East Grand Forks
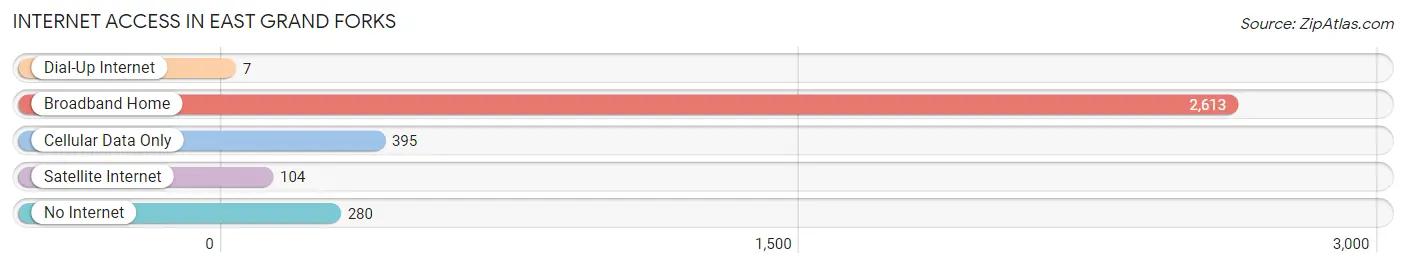
| Internet Type | # Households | % Households |
| Dial-Up Internet | 7 | 0.2% |
| Broadband Home | 2,613 | 77.5% |
| Cellular Data Only | 395 | 11.7% |
| Satellite Internet | 104 | 3.1% |
| No Internet | 280 | 8.3% |
| Total | 3,371 | 100.0% |
East Grand Forks Summary
Grand Forks, Minnesota is a city located in Polk County, Minnesota, United States. It is situated along the Red River of the North, which forms the border between Minnesota and North Dakota. The city is part of the Grand Forks-East Grand Forks metropolitan area, which is the largest metropolitan area in the state of Minnesota. As of the 2010 census, the city had a population of 8,601.
History
Grand Forks was first settled in 1875 by a group of Norwegian immigrants. The city was named after the nearby Grand Forks River, which was named by French explorers in the late 1700s. The city was incorporated in 1881 and was the county seat of Polk County.
In 1897, the city was devastated by a major flood, which caused extensive damage to the city and its infrastructure. The city was rebuilt and continued to grow, becoming a major center for the lumber industry.
In the early 1900s, Grand Forks was a major hub for the Great Northern Railway. The city was also home to a large military base, Camp Grafton, which was used during World War II.
Geography
Grand Forks is located at the confluence of the Red River of the North and the Red Lake River. The city is situated in a flat, low-lying area, with an elevation of 890 feet (271 m). The city is located in the Red River Valley, which is part of the Great Plains region.
The city is surrounded by several small lakes, including Lake Agassiz, Lake Traverse, and Lake of the Woods. The city is also located near the Turtle Mountains, which are part of the larger Rocky Mountains.
Economy
Grand Forks is a major center for the agricultural industry, with a large number of farms located in the surrounding area. The city is also home to several manufacturing companies, including a large paper mill and a large food processing plant.
The city is also home to the University of North Dakota, which is the state's largest university. The university is a major employer in the city, and is also a major contributor to the local economy.
Demographics
As of the 2010 census, the population of Grand Forks was 8,601. The racial makeup of the city was 92.3% White, 2.2% African American, 0.7% Native American, 1.2% Asian, 0.1% Pacific Islander, 1.7% from other races, and 2.0% from two or more races. Hispanic or Latino of any race were 4.2% of the population.
The median income for a household in the city was $41,945, and the median income for a family was $51,945. The per capita income for the city was $20,945. About 11.2% of families and 15.2% of the population were below the poverty line, including 22.2% of those under age 18 and 8.2% of those age 65 or over.
Conclusion
Grand Forks, Minnesota is a city located in Polk County, Minnesota, United States. It is situated along the Red River of the North, which forms the border between Minnesota and North Dakota. The city is part of the Grand Forks-East Grand Forks metropolitan area, which is the largest metropolitan area in the state of Minnesota. As of the 2010 census, the city had a population of 8,601. Grand Forks is a major center for the agricultural industry, with a large number of farms located in the surrounding area. The city is also home to several manufacturing companies, including a large paper mill and a large food processing plant. The city is also home to the University of North Dakota, which is the state's largest university. The racial makeup of the city was 92.3% White, 2.2% African American, 0.7% Native American, 1.2% Asian, 0.1% Pacific Islander, 1.7% from other races, and 2.0% from two or more races. Hispanic or Latino of any race were 4.2% of the population. Grand Forks is a vibrant city with a rich history, diverse economy, and diverse population.
Common Questions
What is Per Capita Income in East Grand Forks?
Per Capita income in East Grand Forks is $34,821.
What is the Median Family Income in East Grand Forks?
Median Family Income in East Grand Forks is $102,545.
What is the Median Household income in East Grand Forks?
Median Household Income in East Grand Forks is $81,783.
What is Income or Wage Gap in East Grand Forks?
Income or Wage Gap in East Grand Forks is 24.7%.
Women in East Grand Forks earn 75.3 cents for every dollar earned by a man.
What is Inequality or Gini Index in East Grand Forks?
Inequality or Gini Index in East Grand Forks is 0.40.
What is the Total Population of East Grand Forks?
Total Population of East Grand Forks is 9,118.
What is the Total Male Population of East Grand Forks?
Total Male Population of East Grand Forks is 4,743.
What is the Total Female Population of East Grand Forks?
Total Female Population of East Grand Forks is 4,375.
What is the Ratio of Males per 100 Females in East Grand Forks?
There are 108.41 Males per 100 Females in East Grand Forks.
What is the Ratio of Females per 100 Males in East Grand Forks?
There are 92.24 Females per 100 Males in East Grand Forks.
What is the Median Population Age in East Grand Forks?
Median Population Age in East Grand Forks is 33.6 Years.
What is the Average Family Size in East Grand Forks
Average Family Size in East Grand Forks is 3.2 People.
What is the Average Household Size in East Grand Forks
Average Household Size in East Grand Forks is 2.7 People.
How Large is the Labor Force in East Grand Forks?
There are 4,851 People in the Labor Forcein in East Grand Forks.
What is the Percentage of People in the Labor Force in East Grand Forks?
72.2% of People are in the Labor Force in East Grand Forks.
What is the Unemployment Rate in East Grand Forks?
Unemployment Rate in East Grand Forks is 3.3%.