Shakopee, MN Map & Demographics
Shakopee Map
Shakopee Overview
$43,594
PER CAPITA INCOME
$118,653
AVG FAMILY INCOME
$103,924
AVG HOUSEHOLD INCOME
28.8%
WAGE / INCOME GAP [ % ]
71.2¢/ $1
WAGE / INCOME GAP [ $ ]
0.40
INEQUALITY / GINI INDEX
44,135
TOTAL POPULATION
21,409
MALE POPULATION
22,726
FEMALE POPULATION
94.20
MALES / 100 FEMALES
106.15
FEMALES / 100 MALES
35.0
MEDIAN AGE
3.2
AVG FAMILY SIZE
2.8
AVG HOUSEHOLD SIZE
25,269
LABOR FORCE [ PEOPLE ]
74.7%
PERCENT IN LABOR FORCE
3.9%
UNEMPLOYMENT RATE
Shakopee Zip Codes
Shakopee Area Codes
Income in Shakopee
Income Overview in Shakopee
Per Capita Income in Shakopee is $43,594, while median incomes of families and households are $118,653 and $103,924 respectively.
| Characteristic | Number | Measure |
| Per Capita Income | 44,135 | $43,594 |
| Median Family Income | 11,285 | $118,653 |
| Mean Family Income | 11,285 | $135,651 |
| Median Household Income | 15,570 | $103,924 |
| Mean Household Income | 15,570 | $124,482 |
| Income Deficit | 11,285 | $0 |
| Wage / Income Gap (%) | 44,135 | 28.84% |
| Wage / Income Gap ($) | 44,135 | 71.16¢ per $1 |
| Gini / Inequality Index | 44,135 | 0.40 |
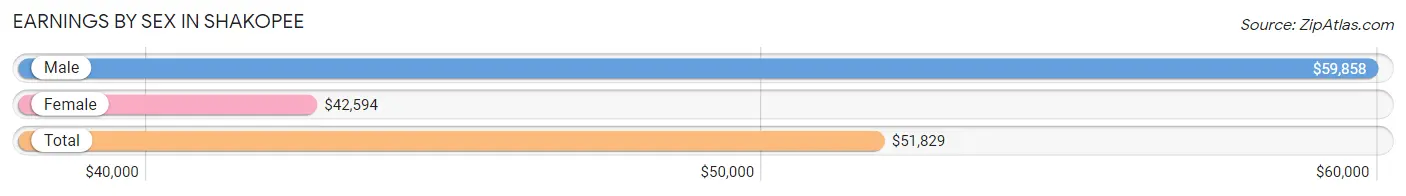
Earnings by Sex in Shakopee
Average Earnings in Shakopee are $51,829, $59,858 for men and $42,594 for women, a difference of 28.8%.
| Sex | Number | Average Earnings |
| Male | 13,565 (51.3%) | $59,858 |
| Female | 12,879 (48.7%) | $42,594 |
| Total | 26,444 (100.0%) | $51,829 |
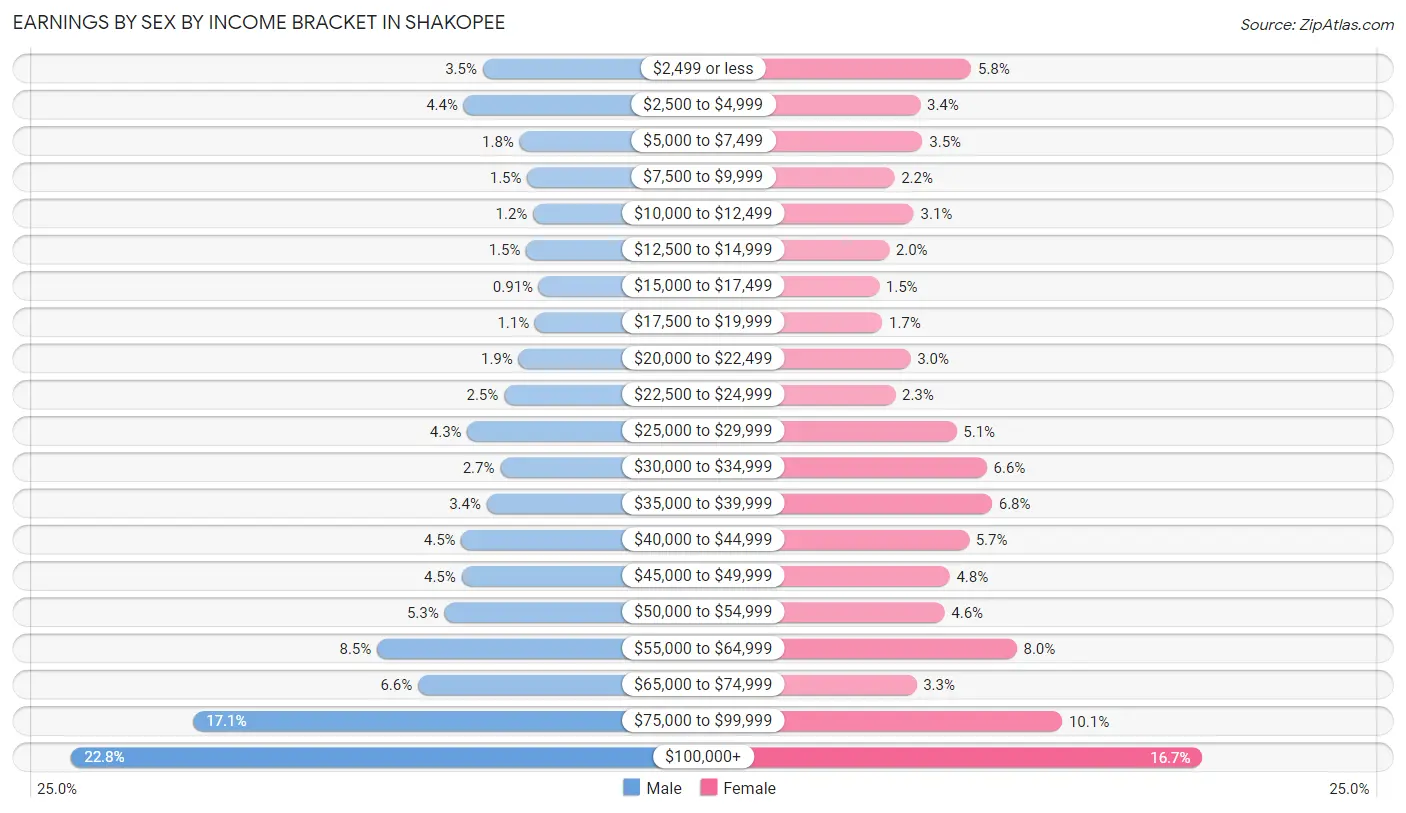
Earnings by Sex by Income Bracket in Shakopee
The most common earnings brackets in Shakopee are $100,000+ for men (3,094 | 22.8%) and $100,000+ for women (2,144 | 16.7%).
| Income | Male | Female |
| $2,499 or less | 480 (3.5%) | 750 (5.8%) |
| $2,500 to $4,999 | 601 (4.4%) | 442 (3.4%) |
| $5,000 to $7,499 | 245 (1.8%) | 456 (3.5%) |
| $7,500 to $9,999 | 197 (1.5%) | 286 (2.2%) |
| $10,000 to $12,499 | 160 (1.2%) | 403 (3.1%) |
| $12,500 to $14,999 | 204 (1.5%) | 254 (2.0%) |
| $15,000 to $17,499 | 123 (0.9%) | 193 (1.5%) |
| $17,500 to $19,999 | 148 (1.1%) | 212 (1.7%) |
| $20,000 to $22,499 | 252 (1.9%) | 383 (3.0%) |
| $22,500 to $24,999 | 344 (2.5%) | 291 (2.3%) |
| $25,000 to $29,999 | 578 (4.3%) | 661 (5.1%) |
| $30,000 to $34,999 | 369 (2.7%) | 844 (6.6%) |
| $35,000 to $39,999 | 455 (3.4%) | 875 (6.8%) |
| $40,000 to $44,999 | 616 (4.5%) | 735 (5.7%) |
| $45,000 to $49,999 | 614 (4.5%) | 620 (4.8%) |
| $50,000 to $54,999 | 723 (5.3%) | 589 (4.6%) |
| $55,000 to $64,999 | 1,151 (8.5%) | 1,024 (8.0%) |
| $65,000 to $74,999 | 891 (6.6%) | 419 (3.3%) |
| $75,000 to $99,999 | 2,320 (17.1%) | 1,298 (10.1%) |
| $100,000+ | 3,094 (22.8%) | 2,144 (16.7%) |
| Total | 13,565 (100.0%) | 12,879 (100.0%) |
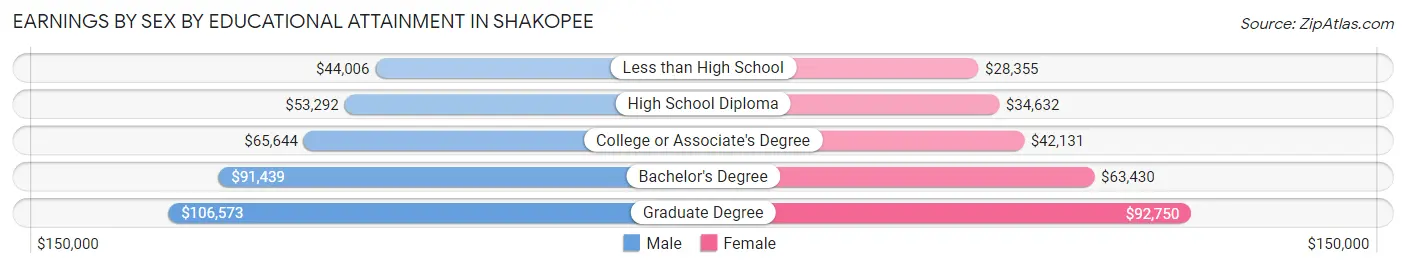
Earnings by Sex by Educational Attainment in Shakopee
Average earnings in Shakopee are $72,544 for men and $48,780 for women, a difference of 32.8%. Men with an educational attainment of graduate degree enjoy the highest average annual earnings of $106,573, while those with less than high school education earn the least with $44,006. Women with an educational attainment of graduate degree earn the most with the average annual earnings of $92,750, while those with less than high school education have the smallest earnings of $28,355.
| Educational Attainment | Male Income | Female Income |
| Less than High School | $44,006 | $28,355 |
| High School Diploma | $53,292 | $34,632 |
| College or Associate's Degree | $65,644 | $42,131 |
| Bachelor's Degree | $91,439 | $63,430 |
| Graduate Degree | $106,573 | $92,750 |
| Total | $72,544 | $48,780 |
Family Income in Shakopee
Family Income Brackets in Shakopee
According to the Shakopee family income data, there are 2,494 families falling into the $100,000 to $149,999 income range, which is the most common income bracket and makes up 22.1% of all families.
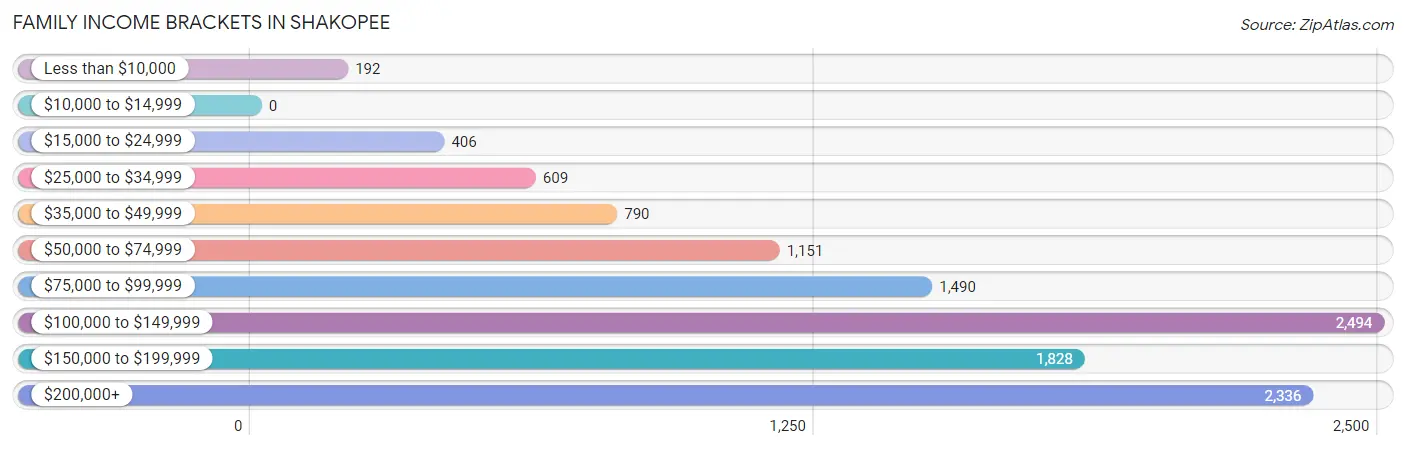
| Income Bracket | # Families | % Families |
| Less than $10,000 | 192 | 1.7% |
| $10,000 to $14,999 | 0 | 0.0% |
| $15,000 to $24,999 | 406 | 3.6% |
| $25,000 to $34,999 | 609 | 5.4% |
| $35,000 to $49,999 | 790 | 7.0% |
| $50,000 to $74,999 | 1,151 | 10.2% |
| $75,000 to $99,999 | 1,490 | 13.2% |
| $100,000 to $149,999 | 2,494 | 22.1% |
| $150,000 to $199,999 | 1,828 | 16.2% |
| $200,000+ | 2,336 | 20.7% |
Family Income by Famaliy Size in Shakopee
3-person families (2,835 | 25.1%) account for the highest median family income in Shakopee with $140,136 per family, while 2-person families (3,774 | 33.4%) have the highest median income of $51,565 per family member.
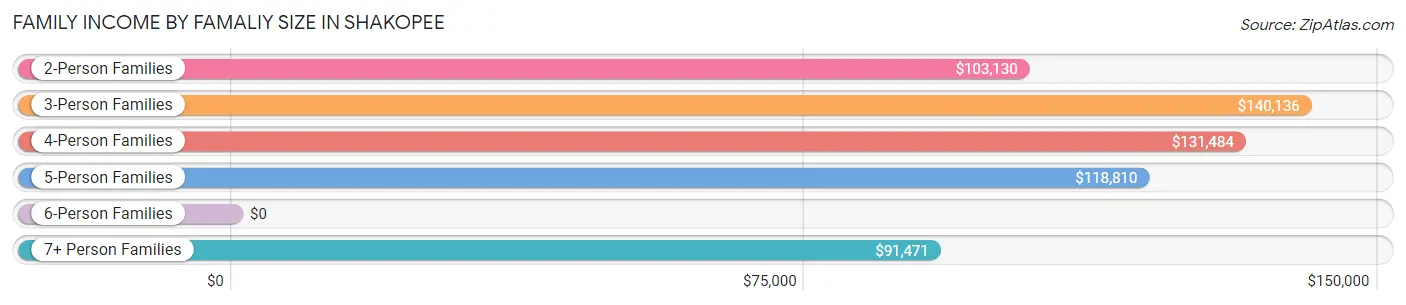
| Income Bracket | # Families | Median Income |
| 2-Person Families | 3,774 (33.4%) | $103,130 |
| 3-Person Families | 2,835 (25.1%) | $140,136 |
| 4-Person Families | 3,185 (28.2%) | $131,484 |
| 5-Person Families | 994 (8.8%) | $118,810 |
| 6-Person Families | 429 (3.8%) | $0 |
| 7+ Person Families | 68 (0.6%) | $91,471 |
| Total | 11,285 (100.0%) | $118,653 |
Family Income by Number of Earners in Shakopee
The median family income in Shakopee is $118,653, with families comprising 3+ earners (2,222) having the highest median family income of $160,581, while families with no earners (598) have the lowest median family income of $55,357, accounting for 19.7% and 5.3% of families, respectively.
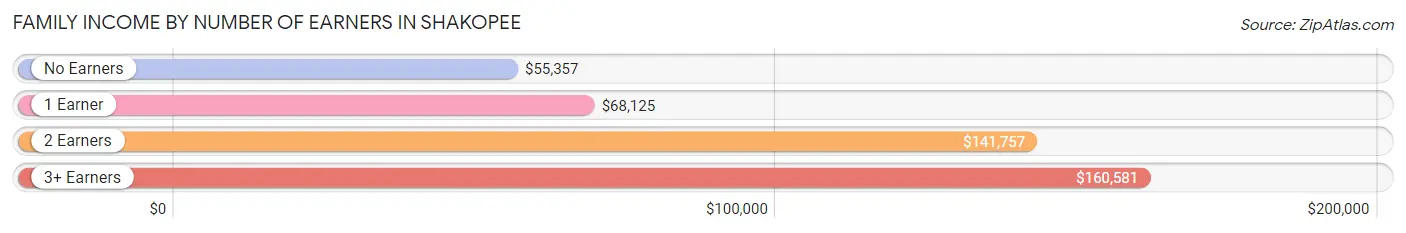
| Number of Earners | # Families | Median Income |
| No Earners | 598 (5.3%) | $55,357 |
| 1 Earner | 3,102 (27.5%) | $68,125 |
| 2 Earners | 5,363 (47.5%) | $141,757 |
| 3+ Earners | 2,222 (19.7%) | $160,581 |
| Total | 11,285 (100.0%) | $118,653 |
Household Income in Shakopee
Household Income Brackets in Shakopee
With 3,348 households falling in the category, the $100,000 to $149,999 income range is the most frequent in Shakopee, accounting for 21.5% of all households. In contrast, only 140 households (0.9%) fall into the $10,000 to $14,999 income bracket, making it the least populous group.
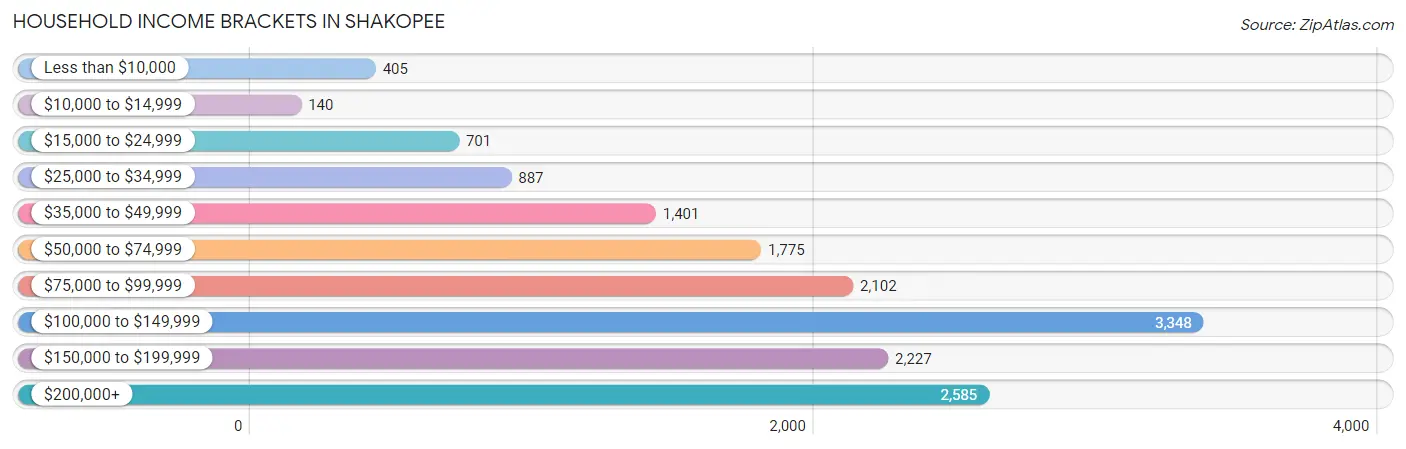
| Income Bracket | # Households | % Households |
| Less than $10,000 | 405 | 2.6% |
| $10,000 to $14,999 | 140 | 0.9% |
| $15,000 to $24,999 | 701 | 4.5% |
| $25,000 to $34,999 | 887 | 5.7% |
| $35,000 to $49,999 | 1,401 | 9.0% |
| $50,000 to $74,999 | 1,775 | 11.4% |
| $75,000 to $99,999 | 2,102 | 13.5% |
| $100,000 to $149,999 | 3,348 | 21.5% |
| $150,000 to $199,999 | 2,227 | 14.3% |
| $200,000+ | 2,585 | 16.6% |
Household Income by Householder Age in Shakopee
The median household income in Shakopee is $103,924, with the highest median household income of $123,462 found in the 45 to 64 years age bracket for the primary householder. A total of 5,905 households (37.9%) fall into this category. Meanwhile, the 65+ years age bracket for the primary householder has the lowest median household income of $56,085, with 2,507 households (16.1%) in this group.
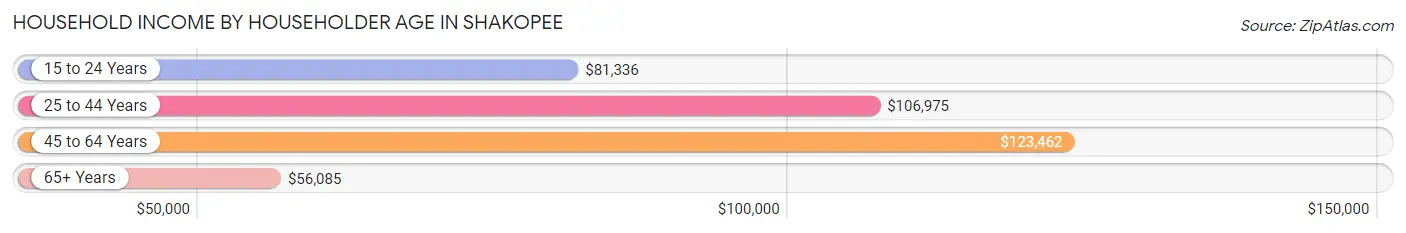
| Income Bracket | # Households | Median Income |
| 15 to 24 Years | 905 (5.8%) | $81,336 |
| 25 to 44 Years | 6,253 (40.2%) | $106,975 |
| 45 to 64 Years | 5,905 (37.9%) | $123,462 |
| 65+ Years | 2,507 (16.1%) | $56,085 |
| Total | 15,570 (100.0%) | $103,924 |
Poverty in Shakopee
Income Below Poverty by Sex and Age in Shakopee
With 5.8% poverty level for males and 7.8% for females among the residents of Shakopee, 6 to 11 year old males and 6 to 11 year old females are the most vulnerable to poverty, with 341 males (16.0%) and 315 females (16.3%) in their respective age groups living below the poverty level.
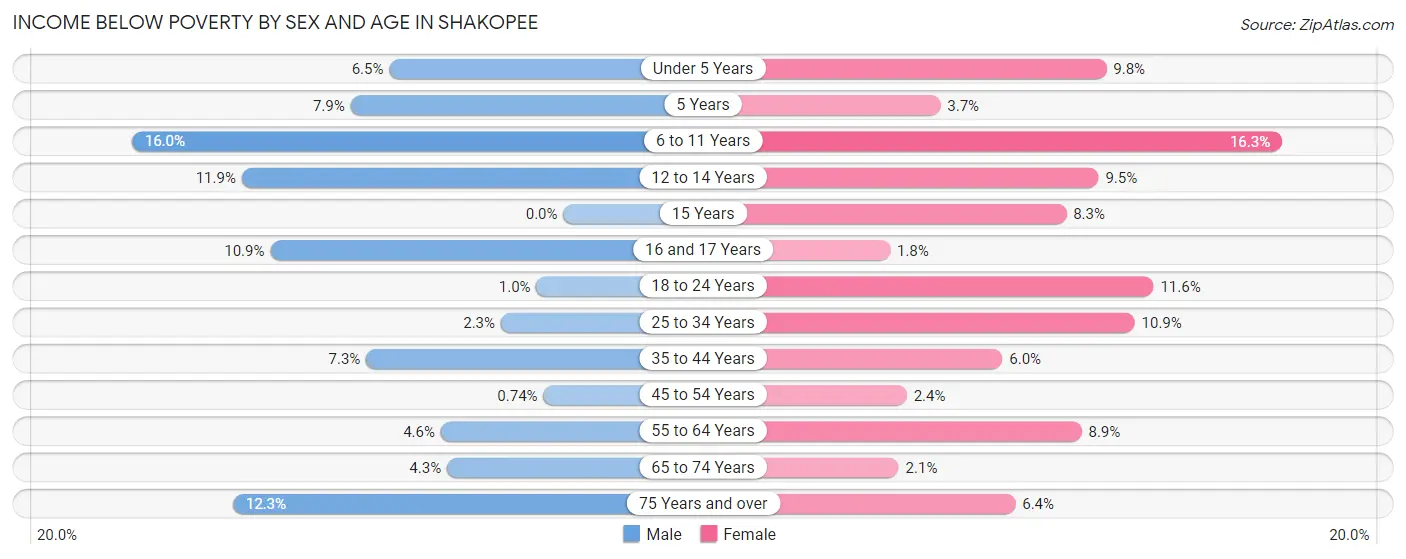
| Age Bracket | Male | Female |
| Under 5 Years | 88 (6.5%) | 160 (9.8%) |
| 5 Years | 26 (7.9%) | 6 (3.7%) |
| 6 to 11 Years | 341 (16.0%) | 315 (16.3%) |
| 12 to 14 Years | 86 (11.9%) | 95 (9.5%) |
| 15 Years | 0 (0.0%) | 27 (8.3%) |
| 16 and 17 Years | 72 (10.9%) | 15 (1.8%) |
| 18 to 24 Years | 20 (1.0%) | 240 (11.6%) |
| 25 to 34 Years | 64 (2.3%) | 336 (10.9%) |
| 35 to 44 Years | 262 (7.3%) | 206 (6.0%) |
| 45 to 54 Years | 23 (0.7%) | 84 (2.4%) |
| 55 to 64 Years | 93 (4.5%) | 155 (8.9%) |
| 65 to 74 Years | 55 (4.3%) | 30 (2.1%) |
| 75 Years and over | 80 (12.3%) | 54 (6.4%) |
| Total | 1,210 (5.8%) | 1,723 (7.8%) |
Income Above Poverty by Sex and Age in Shakopee
According to the poverty statistics in Shakopee, males aged 15 years and females aged 16 and 17 years are the age groups that are most secure financially, with 100.0% of males and 98.2% of females in these age groups living above the poverty line.
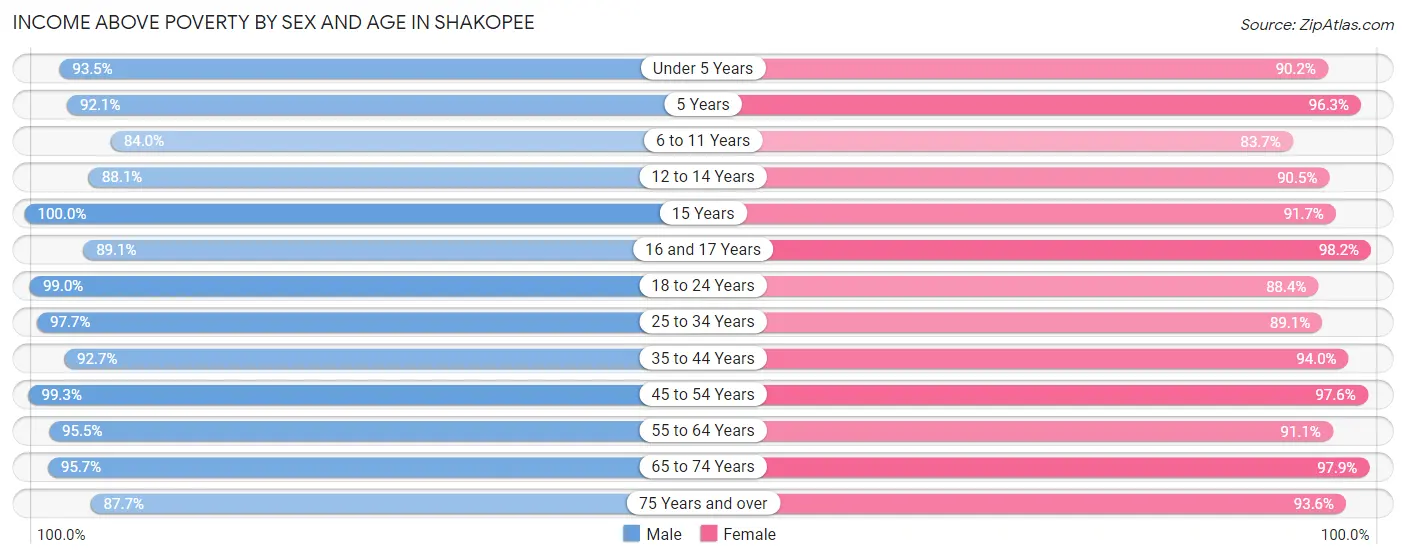
| Age Bracket | Male | Female |
| Under 5 Years | 1,275 (93.5%) | 1,470 (90.2%) |
| 5 Years | 303 (92.1%) | 158 (96.3%) |
| 6 to 11 Years | 1,788 (84.0%) | 1,613 (83.7%) |
| 12 to 14 Years | 634 (88.1%) | 902 (90.5%) |
| 15 Years | 451 (100.0%) | 297 (91.7%) |
| 16 and 17 Years | 590 (89.1%) | 825 (98.2%) |
| 18 to 24 Years | 1,971 (99.0%) | 1,834 (88.4%) |
| 25 to 34 Years | 2,697 (97.7%) | 2,755 (89.1%) |
| 35 to 44 Years | 3,316 (92.7%) | 3,250 (94.0%) |
| 45 to 54 Years | 3,077 (99.3%) | 3,404 (97.6%) |
| 55 to 64 Years | 1,950 (95.5%) | 1,587 (91.1%) |
| 65 to 74 Years | 1,219 (95.7%) | 1,393 (97.9%) |
| 75 Years and over | 572 (87.7%) | 785 (93.6%) |
| Total | 19,843 (94.3%) | 20,273 (92.2%) |
Income Below Poverty Among Married-Couple Families in Shakopee
The poverty statistics for married-couple families in Shakopee show that 1.6% or 125 of the total 7,782 families live below the poverty line. Families with 1 or 2 children have the highest poverty rate of 2.3%, comprising of 83 families. On the other hand, families with 5 or more children have the lowest poverty rate of 0.0%, which includes 0 families.
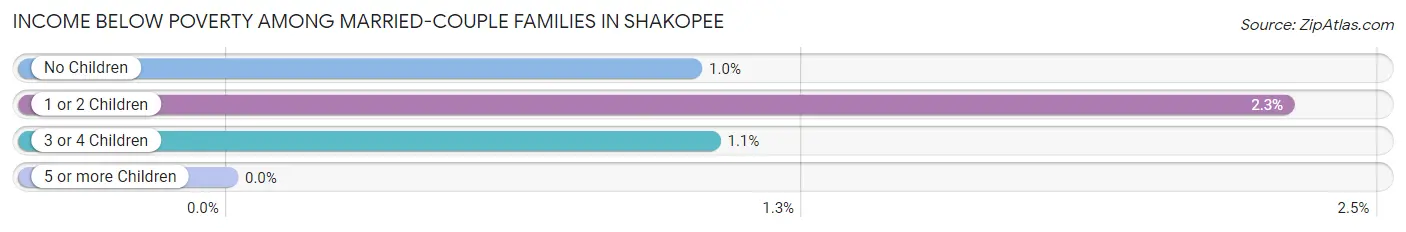
| Children | Above Poverty | Below Poverty |
| No Children | 3,544 (99.0%) | 36 (1.0%) |
| 1 or 2 Children | 3,522 (97.7%) | 83 (2.3%) |
| 3 or 4 Children | 566 (99.0%) | 6 (1.1%) |
| 5 or more Children | 25 (100.0%) | 0 (0.0%) |
| Total | 7,657 (98.4%) | 125 (1.6%) |
Income Below Poverty Among Single-Parent Households in Shakopee
According to the poverty data in Shakopee, 10.4% or 150 single-father households and 12.0% or 248 single-mother households are living below the poverty line. Among single-father households, those with 3 or 4 children have the highest poverty rate, with 150 households (87.7%) experiencing poverty. Likewise, among single-mother households, those with 5 or more children have the highest poverty rate, with 72 households (100.0%) falling below the poverty line.
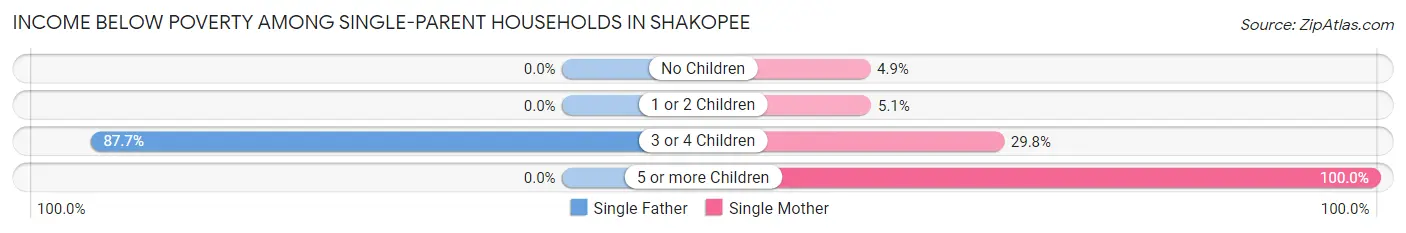
| Children | Single Father | Single Mother |
| No Children | 0 (0.0%) | 29 (4.9%) |
| 1 or 2 Children | 0 (0.0%) | 56 (5.1%) |
| 3 or 4 Children | 150 (87.7%) | 91 (29.8%) |
| 5 or more Children | 0 (0.0%) | 72 (100.0%) |
| Total | 150 (10.4%) | 248 (12.0%) |
Income Below Poverty Among Married-Couple vs Single-Parent Households in Shakopee
The poverty data for Shakopee shows that 125 of the married-couple family households (1.6%) and 398 of the single-parent households (11.4%) are living below the poverty level. Within the married-couple family households, those with 1 or 2 children have the highest poverty rate, with 83 households (2.3%) falling below the poverty line. Among the single-parent households, those with 5 or more children have the highest poverty rate, with 72 household (100.0%) living below poverty.
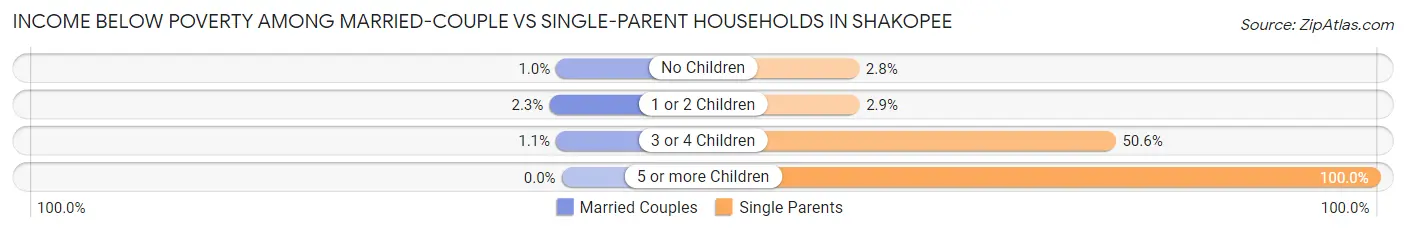
| Children | Married-Couple Families | Single-Parent Households |
| No Children | 36 (1.0%) | 29 (2.8%) |
| 1 or 2 Children | 83 (2.3%) | 56 (2.9%) |
| 3 or 4 Children | 6 (1.1%) | 241 (50.6%) |
| 5 or more Children | 0 (0.0%) | 72 (100.0%) |
| Total | 125 (1.6%) | 398 (11.4%) |
Race in Shakopee
The most populous races in Shakopee are White / Caucasian (29,152 | 66.0%), Asian (5,389 | 12.2%), and Hispanic or Latino (3,961 | 9.0%).
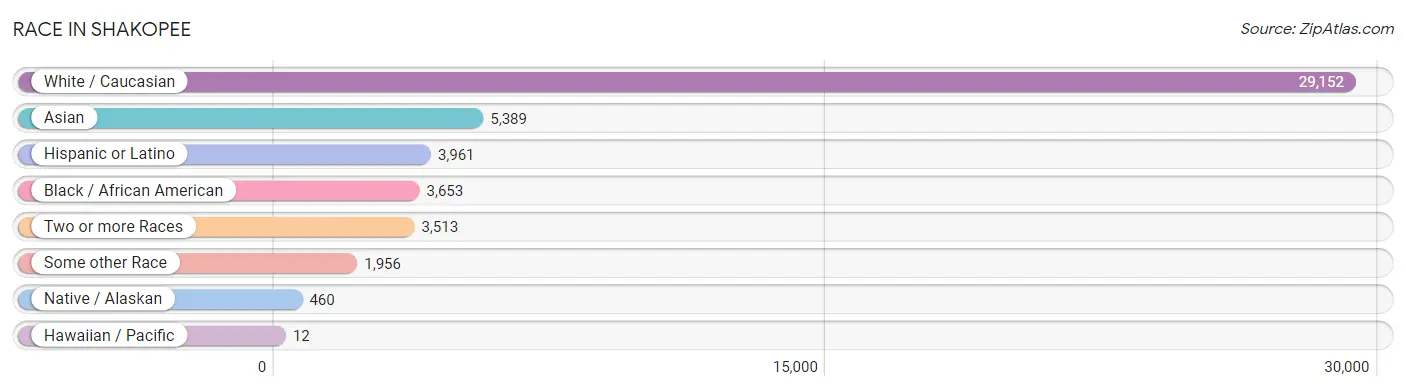
| Race | # Population | % Population |
| Asian | 5,389 | 12.2% |
| Black / African American | 3,653 | 8.3% |
| Hawaiian / Pacific | 12 | 0.0% |
| Hispanic or Latino | 3,961 | 9.0% |
| Native / Alaskan | 460 | 1.0% |
| White / Caucasian | 29,152 | 66.0% |
| Two or more Races | 3,513 | 8.0% |
| Some other Race | 1,956 | 4.4% |
| Total | 44,135 | 100.0% |
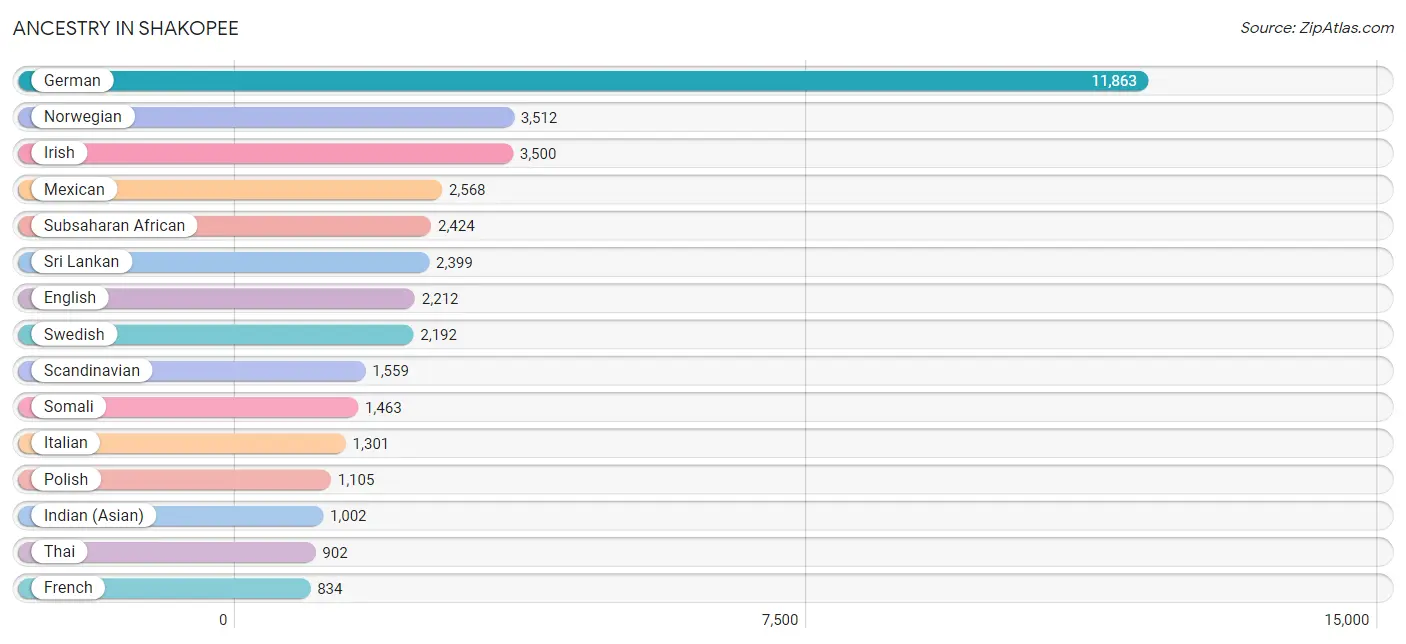
Ancestry in Shakopee
The most populous ancestries reported in Shakopee are German (11,863 | 26.9%), Norwegian (3,512 | 8.0%), Irish (3,500 | 7.9%), Mexican (2,568 | 5.8%), and Subsaharan African (2,424 | 5.5%), together accounting for 54.1% of all Shakopee residents.
| Ancestry | # Population | % Population |
| African | 242 | 0.5% |
| Aleut | 20 | 0.1% |
| American | 700 | 1.6% |
| Apache | 154 | 0.4% |
| Arab | 9 | 0.0% |
| Armenian | 3 | 0.0% |
| Austrian | 25 | 0.1% |
| Bangladeshi | 88 | 0.2% |
| Belgian | 65 | 0.2% |
| Bhutanese | 362 | 0.8% |
| British | 105 | 0.2% |
| Burmese | 121 | 0.3% |
| Canadian | 27 | 0.1% |
| Central American | 604 | 1.4% |
| Central American Indian | 184 | 0.4% |
| Cherokee | 310 | 0.7% |
| Chickasaw | 35 | 0.1% |
| Chippewa | 281 | 0.6% |
| Croatian | 19 | 0.0% |
| Cuban | 14 | 0.0% |
| Czech | 510 | 1.2% |
| Czechoslovakian | 77 | 0.2% |
| Danish | 320 | 0.7% |
| Dominican | 9 | 0.0% |
| Dutch | 479 | 1.1% |
| Eastern European | 89 | 0.2% |
| English | 2,212 | 5.0% |
| Ethiopian | 574 | 1.3% |
| European | 818 | 1.8% |
| Finnish | 483 | 1.1% |
| French | 834 | 1.9% |
| French Canadian | 559 | 1.3% |
| German | 11,863 | 26.9% |
| German Russian | 31 | 0.1% |
| Ghanaian | 80 | 0.2% |
| Greek | 18 | 0.0% |
| Guamanian / Chamorro | 6 | 0.0% |
| Guatemalan | 311 | 0.7% |
| Guyanese | 205 | 0.5% |
| Honduran | 128 | 0.3% |
| Hungarian | 65 | 0.2% |
| Indian (Asian) | 1,002 | 2.3% |
| Irish | 3,500 | 7.9% |
| Israeli | 205 | 0.5% |
| Italian | 1,301 | 2.9% |
| Japanese | 573 | 1.3% |
| Kenyan | 77 | 0.2% |
| Korean | 258 | 0.6% |
| Laotian | 88 | 0.2% |
| Latvian | 89 | 0.2% |
| Lithuanian | 2 | 0.0% |
| Luxembourger | 7 | 0.0% |
| Malaysian | 660 | 1.5% |
| Mexican | 2,568 | 5.8% |
| Mexican American Indian | 2 | 0.0% |
| Native Hawaiian | 301 | 0.7% |
| Nigerian | 12 | 0.0% |
| Northern European | 86 | 0.2% |
| Norwegian | 3,512 | 8.0% |
| Pennsylvania German | 24 | 0.1% |
| Peruvian | 241 | 0.5% |
| Polish | 1,105 | 2.5% |
| Portuguese | 38 | 0.1% |
| Puerto Rican | 385 | 0.9% |
| Romanian | 8 | 0.0% |
| Russian | 626 | 1.4% |
| Salvadoran | 165 | 0.4% |
| Scandinavian | 1,559 | 3.5% |
| Scotch-Irish | 110 | 0.3% |
| Scottish | 302 | 0.7% |
| Serbian | 7 | 0.0% |
| Sioux | 240 | 0.5% |
| Slovak | 54 | 0.1% |
| Slovene | 73 | 0.2% |
| Somali | 1,463 | 3.3% |
| South American | 241 | 0.5% |
| South American Indian | 159 | 0.4% |
| Spaniard | 12 | 0.0% |
| Sri Lankan | 2,399 | 5.4% |
| Subsaharan African | 2,424 | 5.5% |
| Swedish | 2,192 | 5.0% |
| Swiss | 101 | 0.2% |
| Thai | 902 | 2.0% |
| Trinidadian and Tobagonian | 61 | 0.1% |
| Ukrainian | 313 | 0.7% |
| Welsh | 69 | 0.2% |
| Yugoslavian | 3 | 0.0% |
| Yuman | 24 | 0.1% | View All 88 Rows |
Immigrants in Shakopee
The most numerous immigrant groups reported in Shakopee came from Asia (3,048 | 6.9%), Latin America (1,867 | 4.2%), South Eastern Asia (1,803 | 4.1%), Africa (1,793 | 4.1%), and Eastern Africa (1,702 | 3.9%), together accounting for 23.1% of all Shakopee residents.
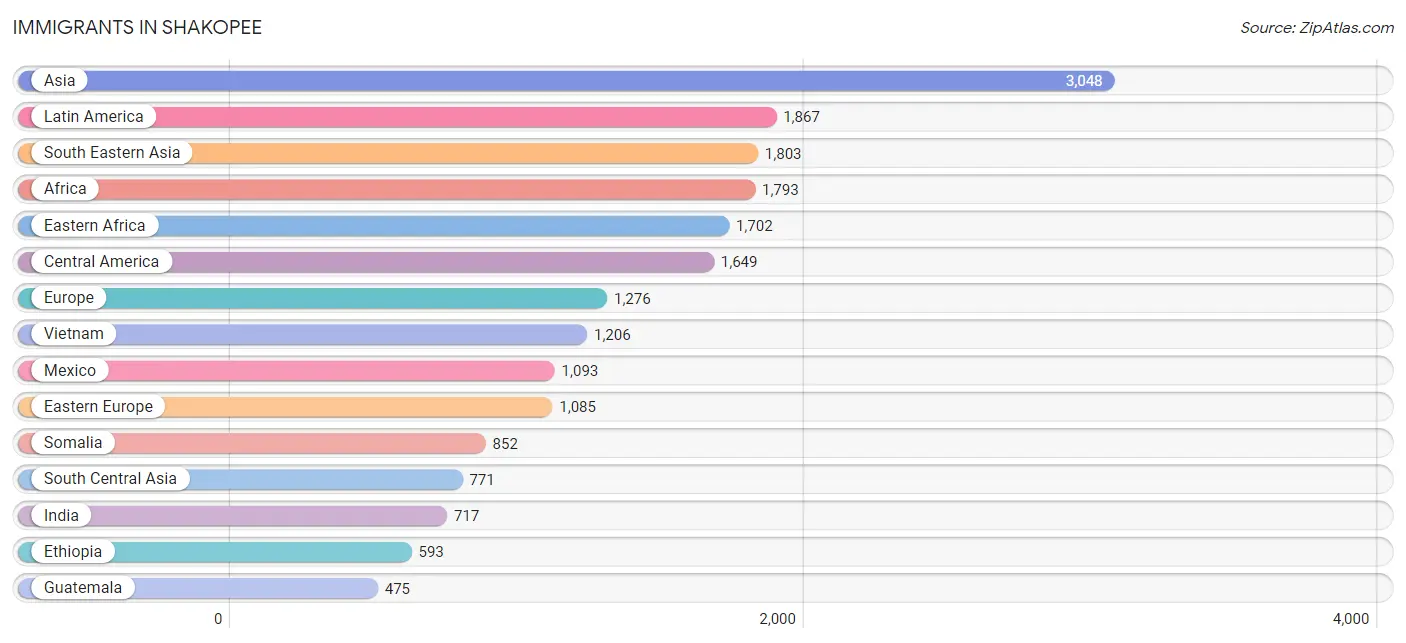
| Immigration Origin | # Population | % Population |
| Africa | 1,793 | 4.1% |
| Armenia | 3 | 0.0% |
| Asia | 3,048 | 6.9% |
| Cambodia | 354 | 0.8% |
| Cameroon | 11 | 0.0% |
| Canada | 23 | 0.1% |
| Caribbean | 72 | 0.2% |
| Central America | 1,649 | 3.7% |
| China | 214 | 0.5% |
| Czechoslovakia | 17 | 0.0% |
| Denmark | 25 | 0.1% |
| Eastern Africa | 1,702 | 3.9% |
| Eastern Asia | 229 | 0.5% |
| Eastern Europe | 1,085 | 2.5% |
| El Salvador | 50 | 0.1% |
| England | 11 | 0.0% |
| Eritrea | 40 | 0.1% |
| Ethiopia | 593 | 1.3% |
| Europe | 1,276 | 2.9% |
| Germany | 66 | 0.2% |
| Ghana | 80 | 0.2% |
| Guatemala | 475 | 1.1% |
| Guyana | 146 | 0.3% |
| Honduras | 31 | 0.1% |
| India | 717 | 1.6% |
| Indonesia | 88 | 0.2% |
| Japan | 15 | 0.0% |
| Kenya | 102 | 0.2% |
| Laos | 37 | 0.1% |
| Latin America | 1,867 | 4.2% |
| Latvia | 31 | 0.1% |
| Mexico | 1,093 | 2.5% |
| Middle Africa | 11 | 0.0% |
| Moldova | 42 | 0.1% |
| Northern Europe | 122 | 0.3% |
| Philippines | 71 | 0.2% |
| Poland | 297 | 0.7% |
| Russia | 391 | 0.9% |
| Somalia | 852 | 1.9% |
| South America | 146 | 0.3% |
| South Central Asia | 771 | 1.8% |
| South Eastern Asia | 1,803 | 4.1% |
| Switzerland | 3 | 0.0% |
| Thailand | 47 | 0.1% |
| Trinidad and Tobago | 72 | 0.2% |
| Uganda | 23 | 0.1% |
| Ukraine | 307 | 0.7% |
| Uzbekistan | 54 | 0.1% |
| Vietnam | 1,206 | 2.7% |
| Western Africa | 80 | 0.2% |
| Western Asia | 3 | 0.0% |
| Western Europe | 69 | 0.2% | View All 52 Rows |
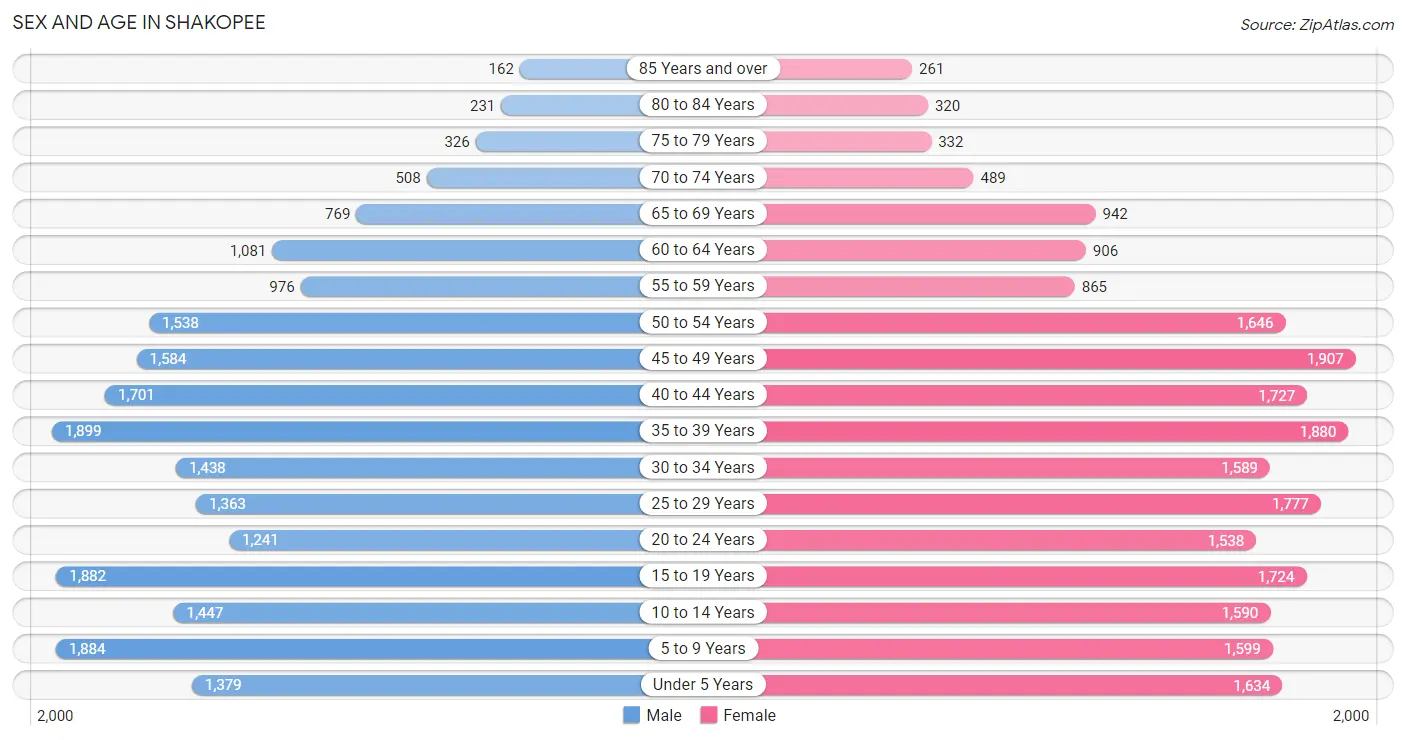
Sex and Age in Shakopee
Sex and Age in Shakopee
The most populous age groups in Shakopee are 35 to 39 Years (1,899 | 8.9%) for men and 45 to 49 Years (1,907 | 8.4%) for women.
| Age Bracket | Male | Female |
| Under 5 Years | 1,379 (6.4%) | 1,634 (7.2%) |
| 5 to 9 Years | 1,884 (8.8%) | 1,599 (7.0%) |
| 10 to 14 Years | 1,447 (6.8%) | 1,590 (7.0%) |
| 15 to 19 Years | 1,882 (8.8%) | 1,724 (7.6%) |
| 20 to 24 Years | 1,241 (5.8%) | 1,538 (6.8%) |
| 25 to 29 Years | 1,363 (6.4%) | 1,777 (7.8%) |
| 30 to 34 Years | 1,438 (6.7%) | 1,589 (7.0%) |
| 35 to 39 Years | 1,899 (8.9%) | 1,880 (8.3%) |
| 40 to 44 Years | 1,701 (8.0%) | 1,727 (7.6%) |
| 45 to 49 Years | 1,584 (7.4%) | 1,907 (8.4%) |
| 50 to 54 Years | 1,538 (7.2%) | 1,646 (7.2%) |
| 55 to 59 Years | 976 (4.6%) | 865 (3.8%) |
| 60 to 64 Years | 1,081 (5.1%) | 906 (4.0%) |
| 65 to 69 Years | 769 (3.6%) | 942 (4.2%) |
| 70 to 74 Years | 508 (2.4%) | 489 (2.1%) |
| 75 to 79 Years | 326 (1.5%) | 332 (1.5%) |
| 80 to 84 Years | 231 (1.1%) | 320 (1.4%) |
| 85 Years and over | 162 (0.8%) | 261 (1.1%) |
| Total | 21,409 (100.0%) | 22,726 (100.0%) |
Families and Households in Shakopee
Median Family Size in Shakopee
The median family size in Shakopee is 3.20 persons per family, with single female/mother families (2,064 | 18.3%) accounting for the largest median family size of 3.46 persons per family. On the other hand, single male/father families (1,439 | 12.8%) represent the smallest median family size with 2.81 persons per family.
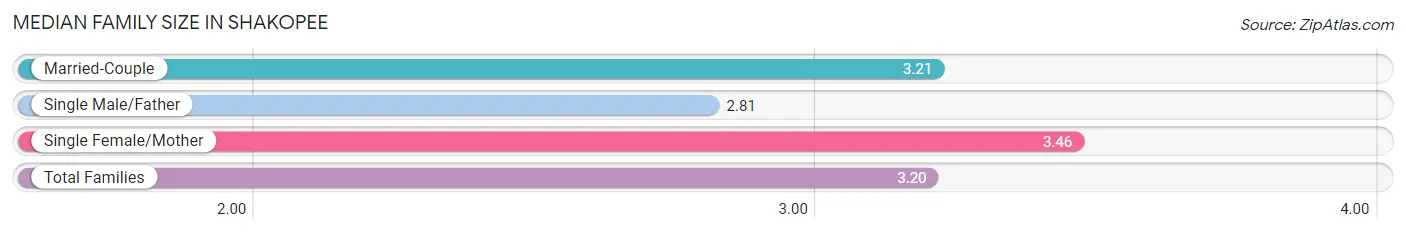
| Family Type | # Families | Family Size |
| Married-Couple | 7,782 (69.0%) | 3.21 |
| Single Male/Father | 1,439 (12.8%) | 2.81 |
| Single Female/Mother | 2,064 (18.3%) | 3.46 |
| Total Families | 11,285 (100.0%) | 3.20 |
Median Household Size in Shakopee
The median household size in Shakopee is 2.78 persons per household, with single female/mother households (2,064 | 13.3%) accounting for the largest median household size of 3.69 persons per household. non-family households (4,285 | 27.5%) represent the smallest median household size with 1.37 persons per household.
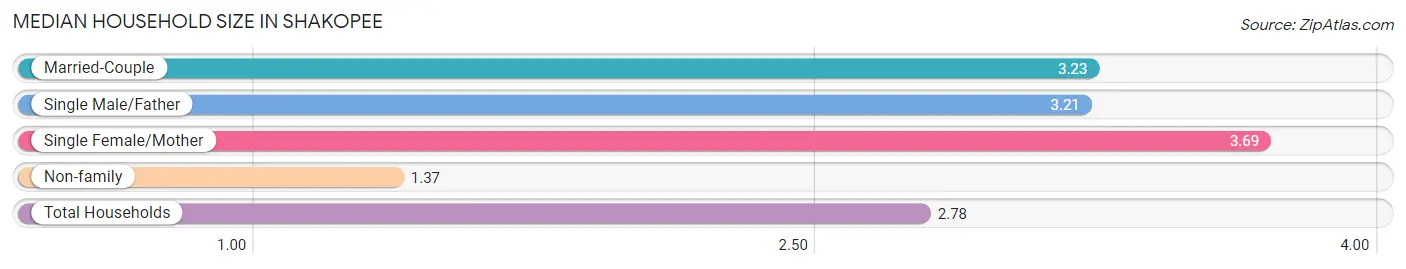
| Household Type | # Households | Household Size |
| Married-Couple | 7,782 (50.0%) | 3.23 |
| Single Male/Father | 1,439 (9.2%) | 3.21 |
| Single Female/Mother | 2,064 (13.3%) | 3.69 |
| Non-family | 4,285 (27.5%) | 1.37 |
| Total Households | 15,570 (100.0%) | 2.78 |
Household Size by Marriage Status in Shakopee
Out of a total of 15,570 households in Shakopee, 11,285 (72.5%) are family households, while 4,285 (27.5%) are nonfamily households. The most numerous type of family households are 4-person households, comprising 3,431, and the most common type of nonfamily households are 1-person households, comprising 3,101.
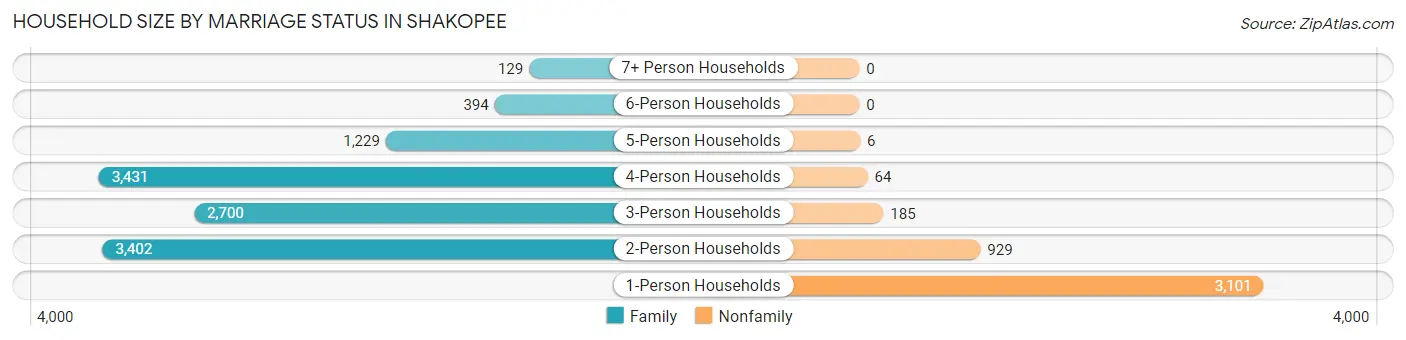
| Household Size | Family Households | Nonfamily Households |
| 1-Person Households | - | 3,101 (19.9%) |
| 2-Person Households | 3,402 (21.8%) | 929 (6.0%) |
| 3-Person Households | 2,700 (17.3%) | 185 (1.2%) |
| 4-Person Households | 3,431 (22.0%) | 64 (0.4%) |
| 5-Person Households | 1,229 (7.9%) | 6 (0.0%) |
| 6-Person Households | 394 (2.5%) | 0 (0.0%) |
| 7+ Person Households | 129 (0.8%) | 0 (0.0%) |
| Total | 11,285 (72.5%) | 4,285 (27.5%) |
Female Fertility in Shakopee
Fertility by Age in Shakopee
Average fertility rate in Shakopee is 48.0 births per 1,000 women. Women in the age bracket of 20 to 34 years have the highest fertility rate with 96.0 births per 1,000 women. Women in the age bracket of 20 to 34 years acount for 79.0% of all women with births.
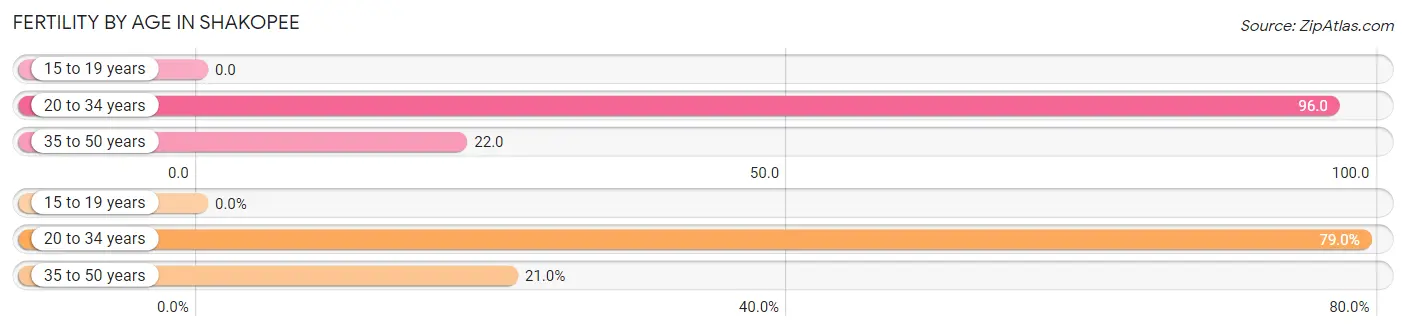
| Age Bracket | Women with Births | Births / 1,000 Women |
| 15 to 19 years | 0 (0.0%) | 0.0 |
| 20 to 34 years | 473 (79.0%) | 96.0 |
| 35 to 50 years | 126 (21.0%) | 22.0 |
| Total | 599 (100.0%) | 48.0 |
Fertility by Age by Marriage Status in Shakopee
89.5% of women with births (599) in Shakopee are married. The highest percentage of unmarried women with births falls into 35 to 50 years age bracket with 17.5% of them unmarried at the time of birth, while the lowest percentage of unmarried women with births belong to 20 to 34 years age bracket with 8.7% of them unmarried.
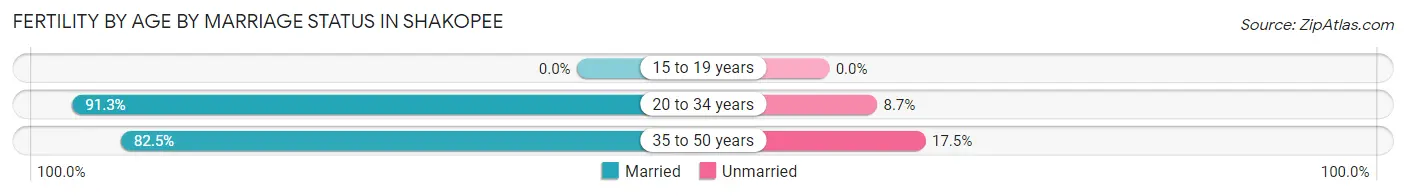
| Age Bracket | Married | Unmarried |
| 15 to 19 years | 0 (0.0%) | 0 (0.0%) |
| 20 to 34 years | 432 (91.3%) | 41 (8.7%) |
| 35 to 50 years | 104 (82.5%) | 22 (17.5%) |
| Total | 536 (89.5%) | 63 (10.5%) |
Fertility by Education in Shakopee
Average fertility rate in Shakopee is 48.0 births per 1,000 women. Women with the education attainment of high school diploma have the highest fertility rate of 85.0 births per 1,000 women, while women with the education attainment of college or associate's degree have the lowest fertility at 22.0 births per 1,000 women. Women with the education attainment of high school diploma represent 36.1% of all women with births.
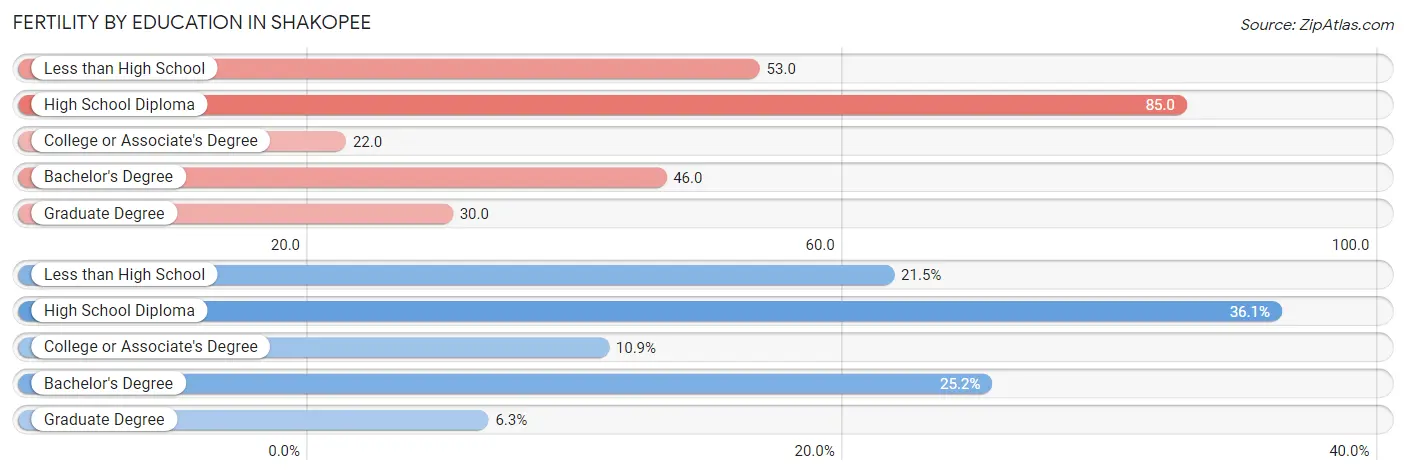
| Educational Attainment | Women with Births | Births / 1,000 Women |
| Less than High School | 129 (21.5%) | 53.0 |
| High School Diploma | 216 (36.1%) | 85.0 |
| College or Associate's Degree | 65 (10.8%) | 22.0 |
| Bachelor's Degree | 151 (25.2%) | 46.0 |
| Graduate Degree | 38 (6.3%) | 30.0 |
| Total | 599 (100.0%) | 48.0 |
Fertility by Education by Marriage Status in Shakopee
10.5% of women with births in Shakopee are unmarried. Women with the educational attainment of graduate degree are most likely to be married with 100.0% of them married at childbirth, while women with the educational attainment of college or associate's degree are least likely to be married with 16.9% of them unmarried at childbirth.
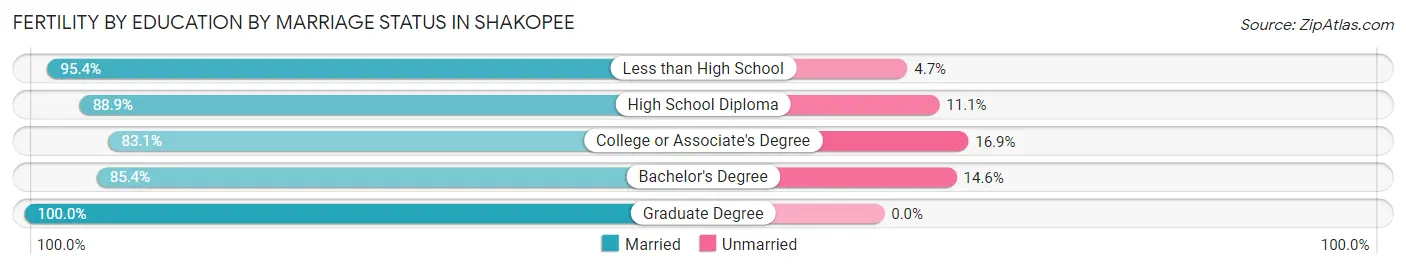
| Educational Attainment | Married | Unmarried |
| Less than High School | 123 (95.4%) | 6 (4.6%) |
| High School Diploma | 192 (88.9%) | 24 (11.1%) |
| College or Associate's Degree | 54 (83.1%) | 11 (16.9%) |
| Bachelor's Degree | 129 (85.4%) | 22 (14.6%) |
| Graduate Degree | 38 (100.0%) | 0 (0.0%) |
| Total | 536 (89.5%) | 63 (10.5%) |
Employment Characteristics in Shakopee
Employment by Class of Employer in Shakopee
Among the 23,864 employed individuals in Shakopee, private company employees (17,965 | 75.3%), not-for-profit organizations (2,259 | 9.5%), and local government employees (1,281 | 5.4%) make up the most common classes of employment.
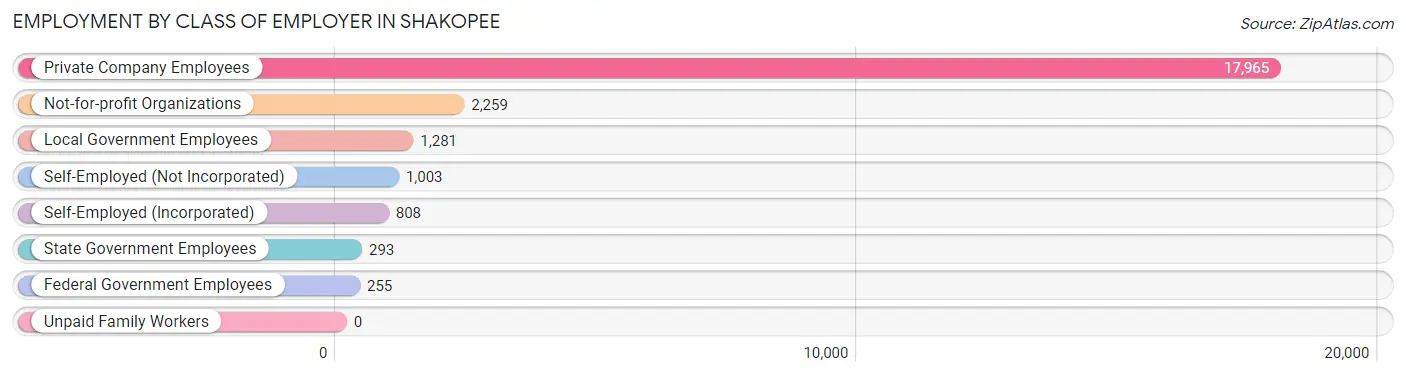
| Employer Class | # Employees | % Employees |
| Private Company Employees | 17,965 | 75.3% |
| Self-Employed (Incorporated) | 808 | 3.4% |
| Self-Employed (Not Incorporated) | 1,003 | 4.2% |
| Not-for-profit Organizations | 2,259 | 9.5% |
| Local Government Employees | 1,281 | 5.4% |
| State Government Employees | 293 | 1.2% |
| Federal Government Employees | 255 | 1.1% |
| Unpaid Family Workers | 0 | 0.0% |
| Total | 23,864 | 100.0% |
Employment Status by Age in Shakopee
According to the labor force statistics for Shakopee, out of the total population over 16 years of age (33,827), 74.7% or 25,269 individuals are in the labor force, with 3.9% or 985 of them unemployed. The age group with the highest labor force participation rate is 20 to 24 years, with 90.2% or 2,507 individuals in the labor force. Within the labor force, the 20 to 24 years age range has the highest percentage of unemployed individuals, with 8.5% or 213 of them being unemployed.
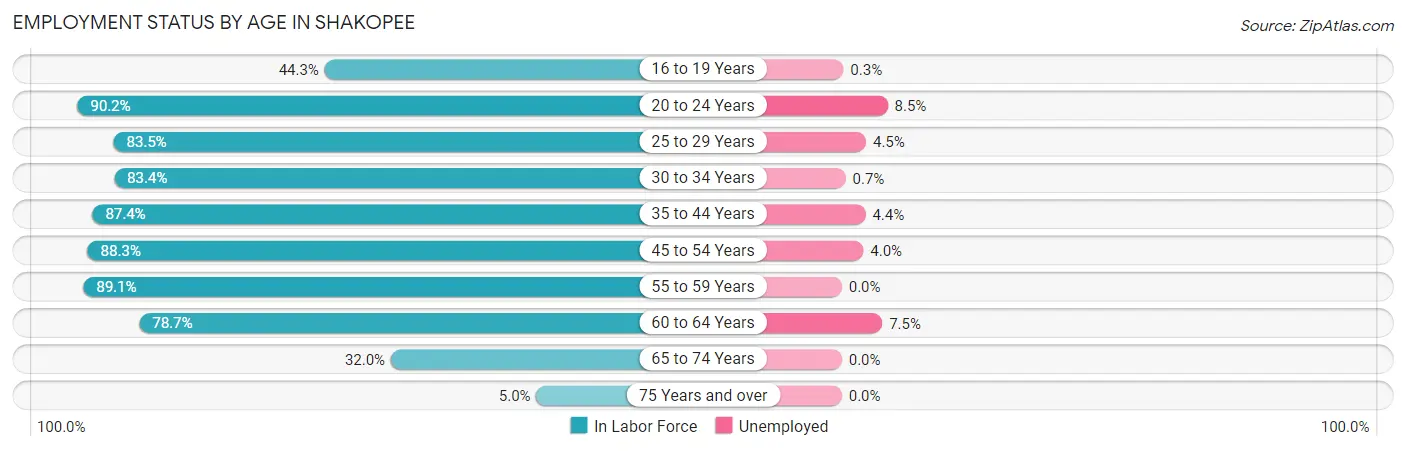
| Age Bracket | In Labor Force | Unemployed |
| 16 to 19 Years | 1,254 (44.3%) | 4 (0.3%) |
| 20 to 24 Years | 2,507 (90.2%) | 213 (8.5%) |
| 25 to 29 Years | 2,622 (83.5%) | 118 (4.5%) |
| 30 to 34 Years | 2,525 (83.4%) | 18 (0.7%) |
| 35 to 44 Years | 6,299 (87.4%) | 277 (4.4%) |
| 45 to 54 Years | 5,894 (88.3%) | 236 (4.0%) |
| 55 to 59 Years | 1,640 (89.1%) | 0 (0.0%) |
| 60 to 64 Years | 1,564 (78.7%) | 117 (7.5%) |
| 65 to 74 Years | 867 (32.0%) | 0 (0.0%) |
| 75 Years and over | 82 (5.0%) | 0 (0.0%) |
| Total | 25,269 (74.7%) | 985 (3.9%) |
Employment Status by Educational Attainment in Shakopee
According to labor force statistics for Shakopee, 86.0% of individuals (20,534) out of the total population between 25 and 64 years of age (23,877) are in the labor force, with 3.7% or 760 of them being unemployed. The group with the highest labor force participation rate are those with the educational attainment of bachelor's degree or higher, with 94.4% or 9,135 individuals in the labor force. Within the labor force, individuals with high school diploma education have the highest percentage of unemployment, with 9.4% or 411 of them being unemployed.
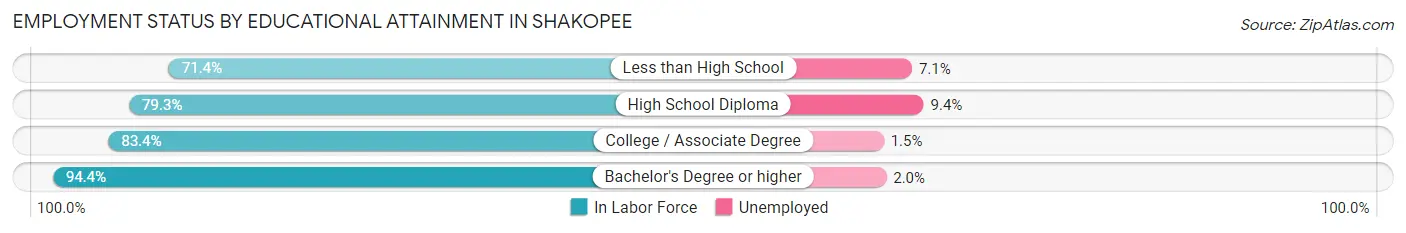
| Educational Attainment | In Labor Force | Unemployed |
| Less than High School | 1,208 (71.4%) | 120 (7.1%) |
| High School Diploma | 4,377 (79.3%) | 519 (9.4%) |
| College / Associate Degree | 5,828 (83.4%) | 105 (1.5%) |
| Bachelor's Degree or higher | 9,135 (94.4%) | 194 (2.0%) |
| Total | 20,534 (86.0%) | 883 (3.7%) |
Employment Occupations by Sex in Shakopee
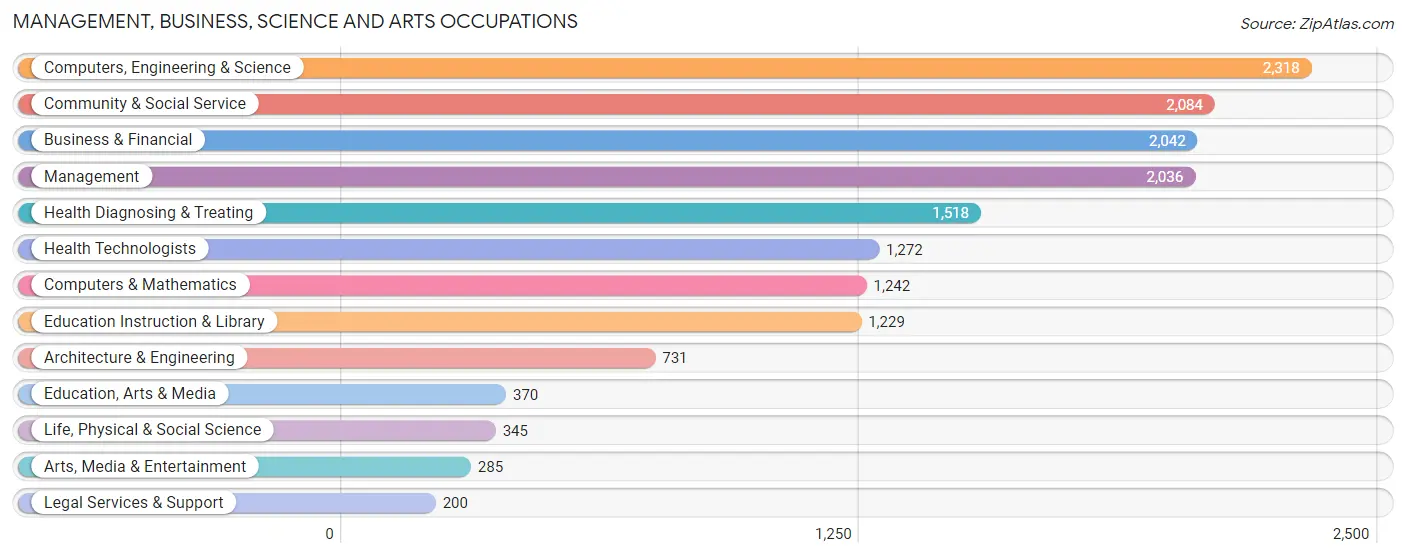
Management, Business, Science and Arts Occupations
The most common Management, Business, Science and Arts occupations in Shakopee are Computers, Engineering & Science (2,318 | 9.6%), Community & Social Service (2,084 | 8.6%), Business & Financial (2,042 | 8.4%), Management (2,036 | 8.4%), and Health Diagnosing & Treating (1,518 | 6.3%).
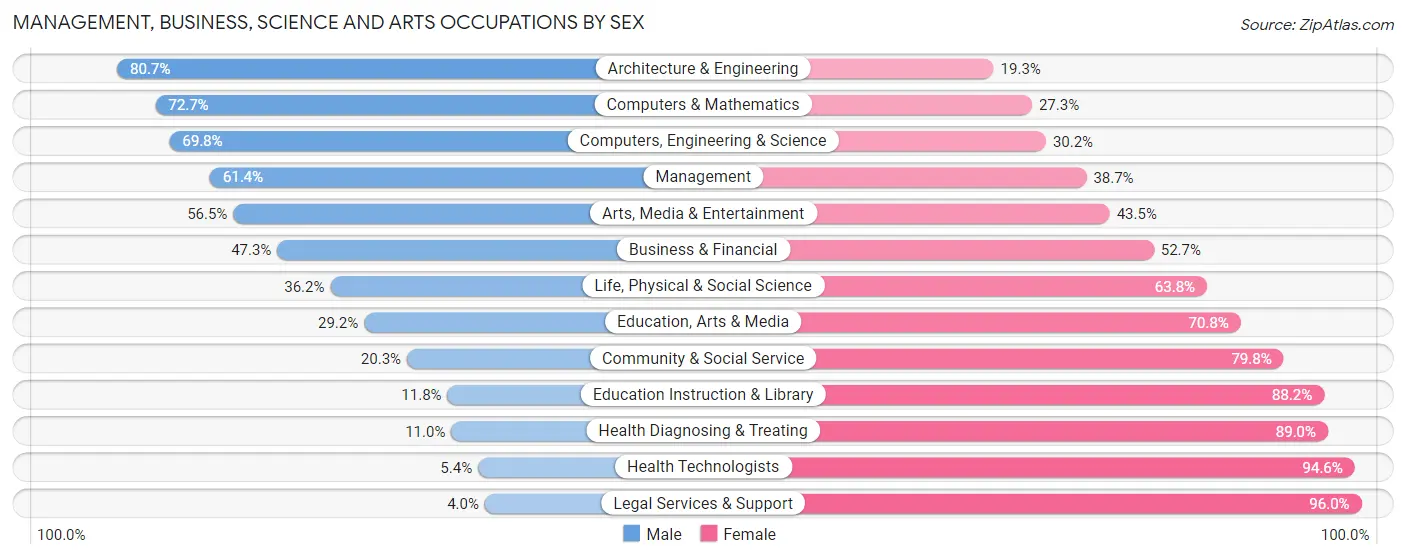
Management, Business, Science and Arts Occupations by Sex
Within the Management, Business, Science and Arts occupations in Shakopee, the most male-oriented occupations are Architecture & Engineering (80.7%), Computers & Mathematics (72.7%), and Computers, Engineering & Science (69.8%), while the most female-oriented occupations are Legal Services & Support (96.0%), Health Technologists (94.6%), and Health Diagnosing & Treating (89.0%).
| Occupation | Male | Female |
| Management | 1,249 (61.4%) | 787 (38.7%) |
| Business & Financial | 966 (47.3%) | 1,076 (52.7%) |
| Computers, Engineering & Science | 1,618 (69.8%) | 700 (30.2%) |
| Computers & Mathematics | 903 (72.7%) | 339 (27.3%) |
| Architecture & Engineering | 590 (80.7%) | 141 (19.3%) |
| Life, Physical & Social Science | 125 (36.2%) | 220 (63.8%) |
| Community & Social Service | 422 (20.3%) | 1,662 (79.7%) |
| Education, Arts & Media | 108 (29.2%) | 262 (70.8%) |
| Legal Services & Support | 8 (4.0%) | 192 (96.0%) |
| Education Instruction & Library | 145 (11.8%) | 1,084 (88.2%) |
| Arts, Media & Entertainment | 161 (56.5%) | 124 (43.5%) |
| Health Diagnosing & Treating | 167 (11.0%) | 1,351 (89.0%) |
| Health Technologists | 69 (5.4%) | 1,203 (94.6%) |
| Total (Category) | 4,422 (44.2%) | 5,576 (55.8%) |
| Total (Overall) | 12,525 (51.7%) | 11,699 (48.3%) |
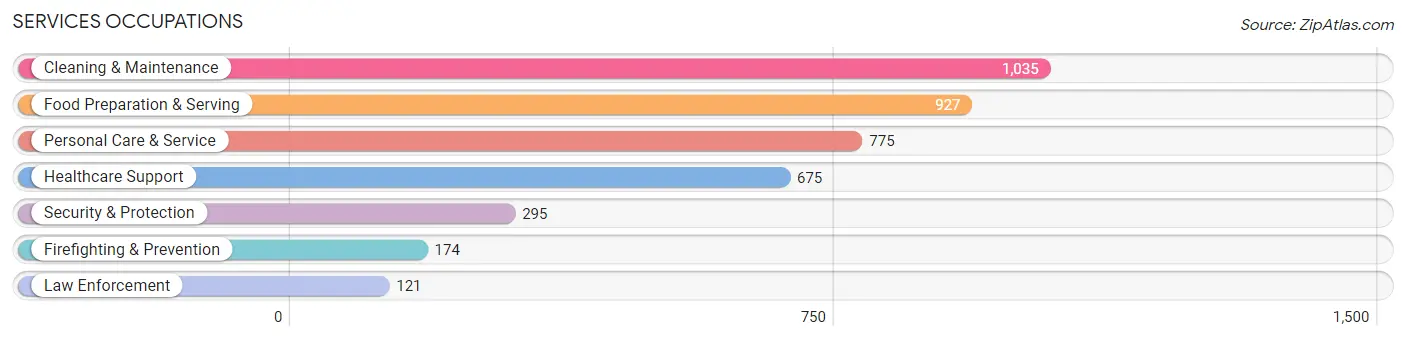
Services Occupations
The most common Services occupations in Shakopee are Cleaning & Maintenance (1,035 | 4.3%), Food Preparation & Serving (927 | 3.8%), Personal Care & Service (775 | 3.2%), Healthcare Support (675 | 2.8%), and Security & Protection (295 | 1.2%).
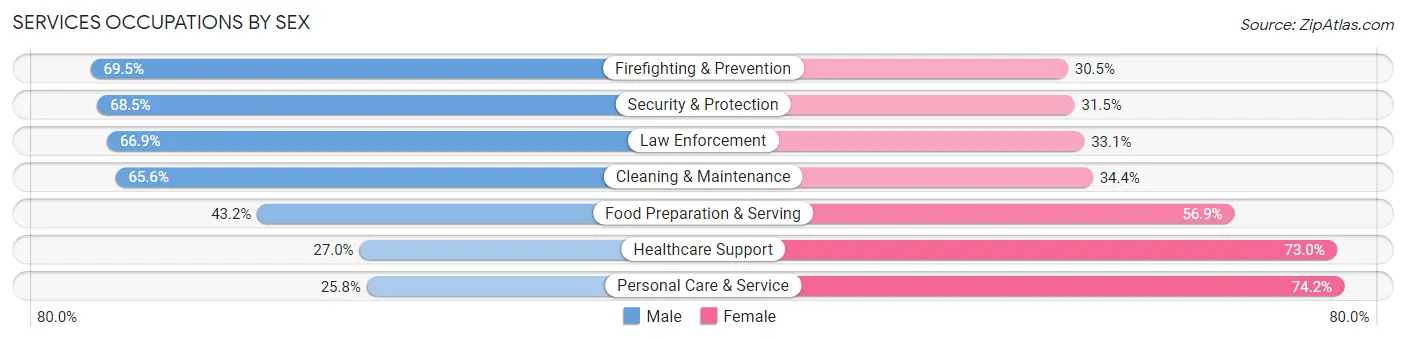
Services Occupations by Sex
Within the Services occupations in Shakopee, the most male-oriented occupations are Firefighting & Prevention (69.5%), Security & Protection (68.5%), and Law Enforcement (66.9%), while the most female-oriented occupations are Personal Care & Service (74.2%), Healthcare Support (73.0%), and Food Preparation & Serving (56.9%).
| Occupation | Male | Female |
| Healthcare Support | 182 (27.0%) | 493 (73.0%) |
| Security & Protection | 202 (68.5%) | 93 (31.5%) |
| Firefighting & Prevention | 121 (69.5%) | 53 (30.5%) |
| Law Enforcement | 81 (66.9%) | 40 (33.1%) |
| Food Preparation & Serving | 400 (43.1%) | 527 (56.9%) |
| Cleaning & Maintenance | 679 (65.6%) | 356 (34.4%) |
| Personal Care & Service | 200 (25.8%) | 575 (74.2%) |
| Total (Category) | 1,663 (44.9%) | 2,044 (55.1%) |
| Total (Overall) | 12,525 (51.7%) | 11,699 (48.3%) |
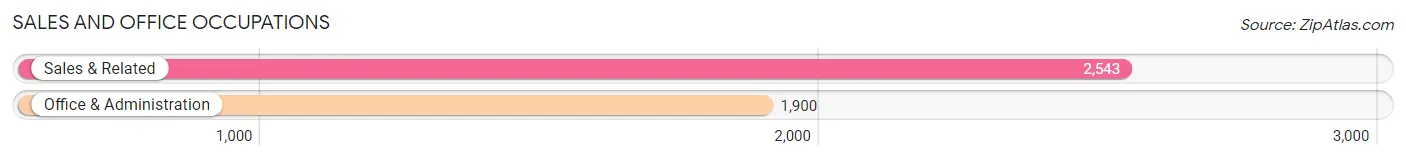
Sales and Office Occupations
The most common Sales and Office occupations in Shakopee are Sales & Related (2,543 | 10.5%), and Office & Administration (1,900 | 7.8%).
Sales and Office Occupations by Sex
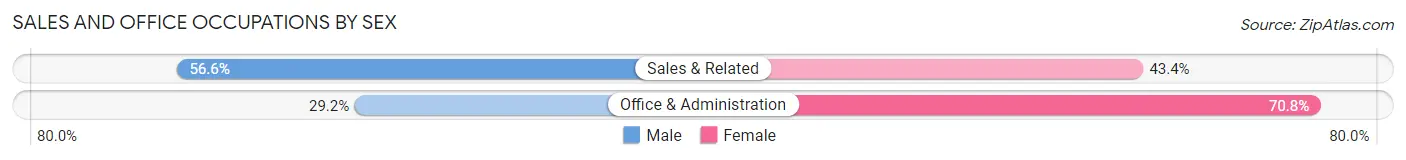
| Occupation | Male | Female |
| Sales & Related | 1,440 (56.6%) | 1,103 (43.4%) |
| Office & Administration | 554 (29.2%) | 1,346 (70.8%) |
| Total (Category) | 1,994 (44.9%) | 2,449 (55.1%) |
| Total (Overall) | 12,525 (51.7%) | 11,699 (48.3%) |
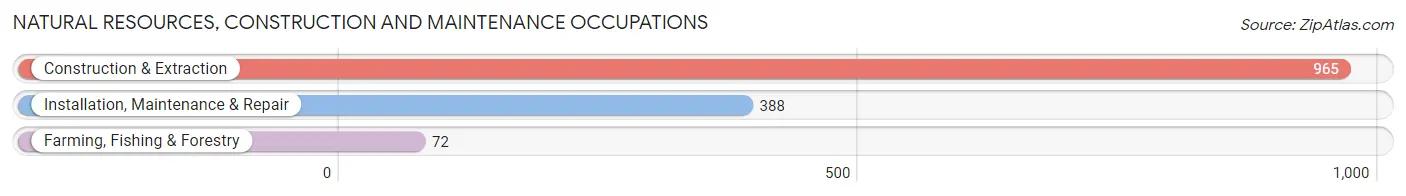
Natural Resources, Construction and Maintenance Occupations
The most common Natural Resources, Construction and Maintenance occupations in Shakopee are Construction & Extraction (965 | 4.0%), Installation, Maintenance & Repair (388 | 1.6%), and Farming, Fishing & Forestry (72 | 0.3%).
Natural Resources, Construction and Maintenance Occupations by Sex
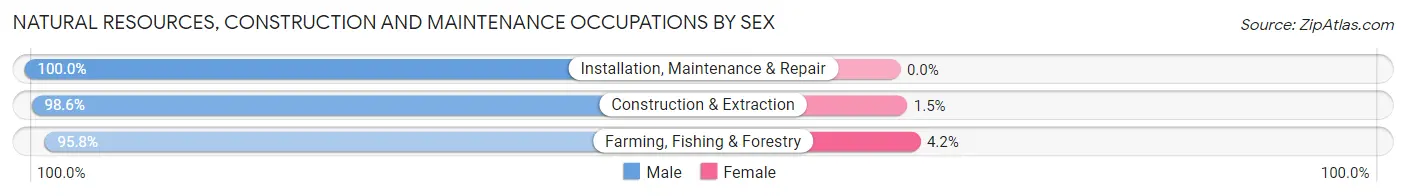
| Occupation | Male | Female |
| Farming, Fishing & Forestry | 69 (95.8%) | 3 (4.2%) |
| Construction & Extraction | 951 (98.6%) | 14 (1.5%) |
| Installation, Maintenance & Repair | 388 (100.0%) | 0 (0.0%) |
| Total (Category) | 1,408 (98.8%) | 17 (1.2%) |
| Total (Overall) | 12,525 (51.7%) | 11,699 (48.3%) |
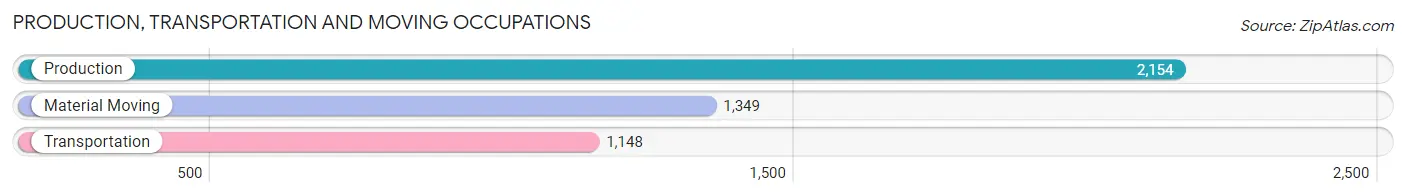
Production, Transportation and Moving Occupations
The most common Production, Transportation and Moving occupations in Shakopee are Production (2,154 | 8.9%), Material Moving (1,349 | 5.6%), and Transportation (1,148 | 4.7%).
Production, Transportation and Moving Occupations by Sex
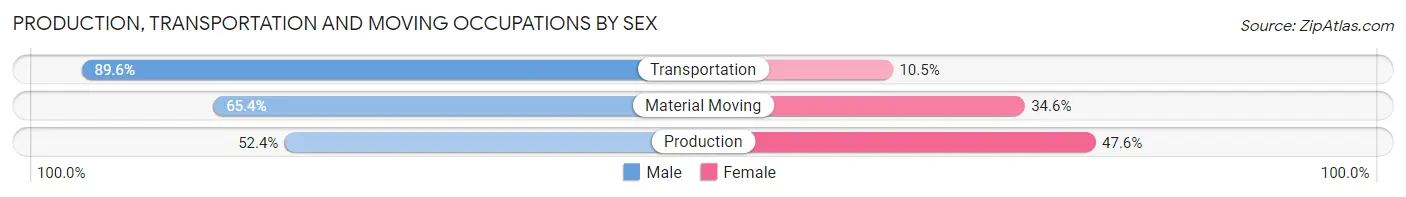
| Occupation | Male | Female |
| Production | 1,128 (52.4%) | 1,026 (47.6%) |
| Transportation | 1,028 (89.5%) | 120 (10.4%) |
| Material Moving | 882 (65.4%) | 467 (34.6%) |
| Total (Category) | 3,038 (65.3%) | 1,613 (34.7%) |
| Total (Overall) | 12,525 (51.7%) | 11,699 (48.3%) |
Employment Industries by Sex in Shakopee
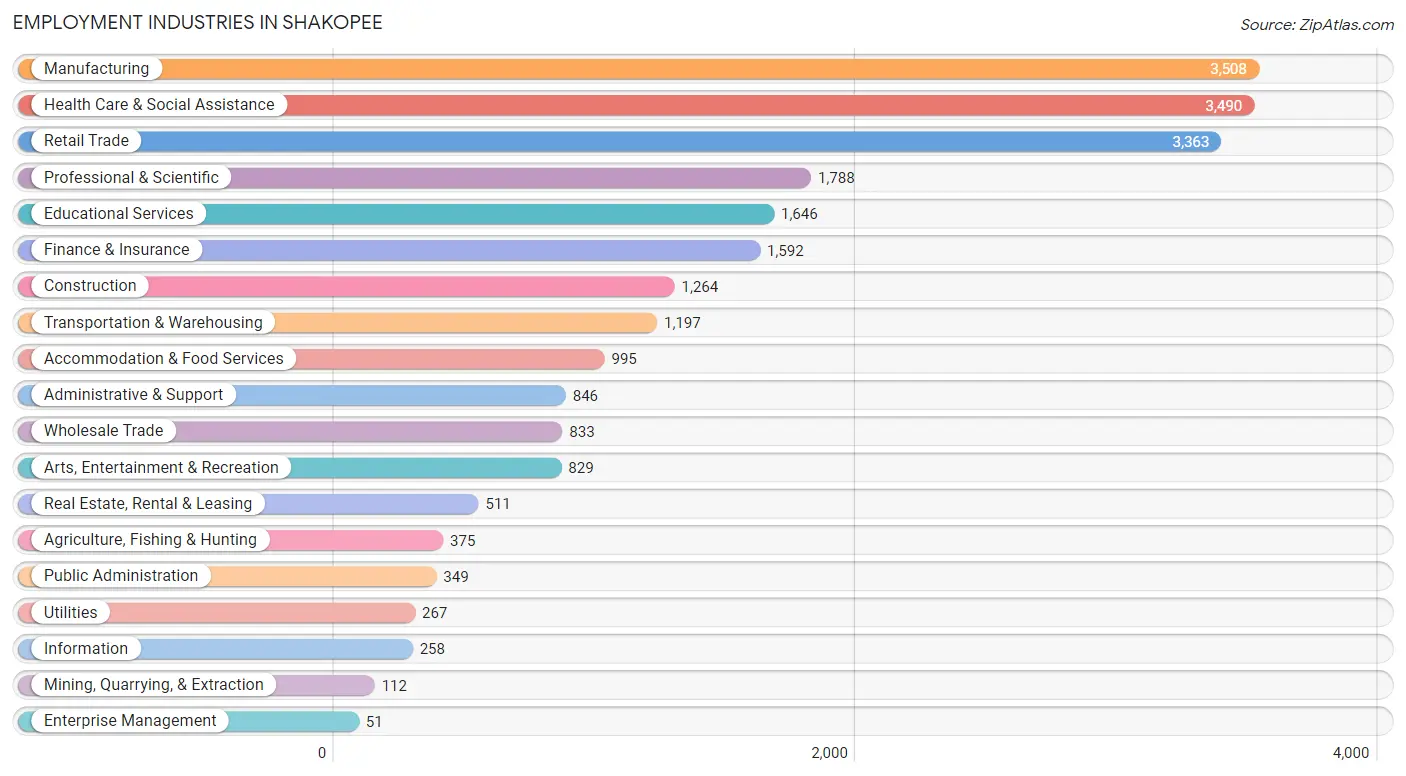
Employment Industries in Shakopee
The major employment industries in Shakopee include Manufacturing (3,508 | 14.5%), Health Care & Social Assistance (3,490 | 14.4%), Retail Trade (3,363 | 13.9%), Professional & Scientific (1,788 | 7.4%), and Educational Services (1,646 | 6.8%).
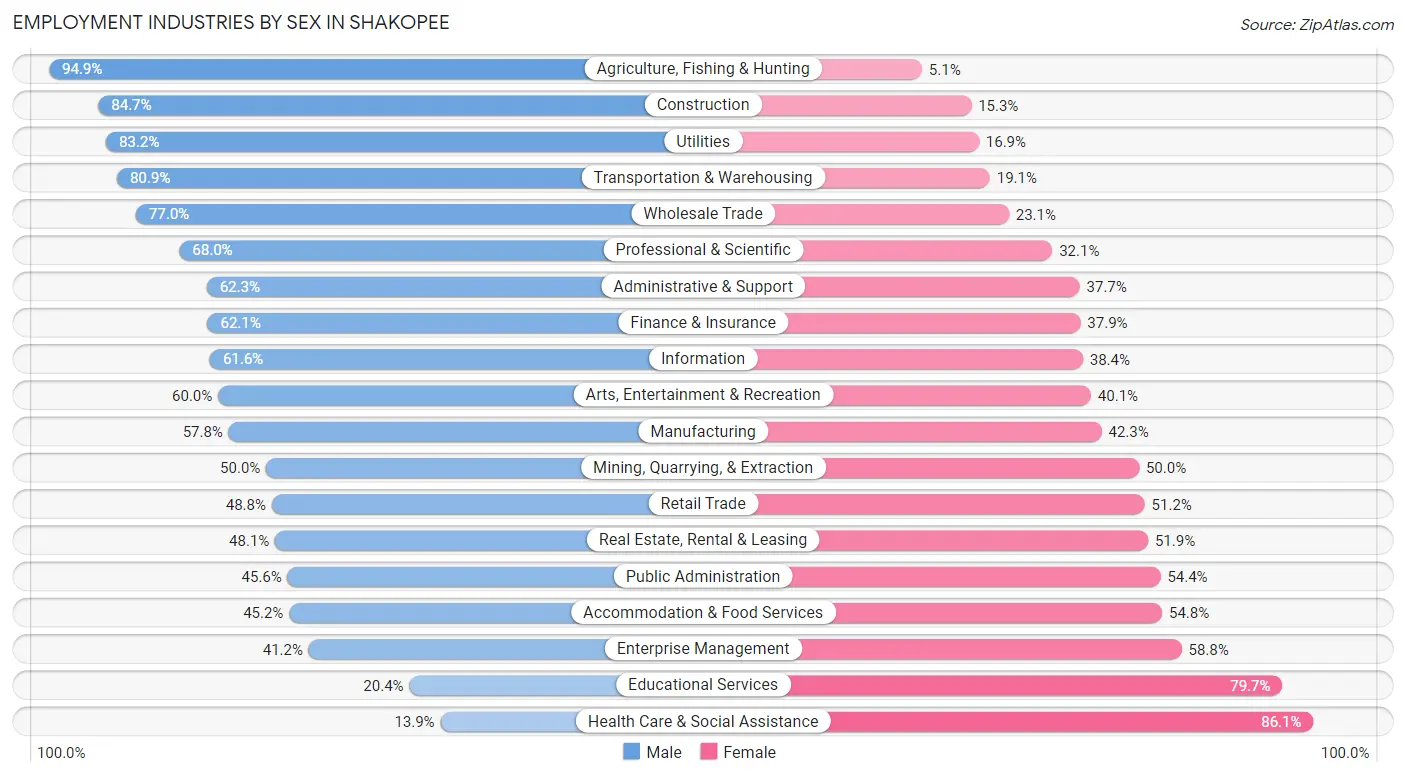
Employment Industries by Sex in Shakopee
The Shakopee industries that see more men than women are Agriculture, Fishing & Hunting (94.9%), Construction (84.7%), and Utilities (83.2%), whereas the industries that tend to have a higher number of women are Health Care & Social Assistance (86.1%), Educational Services (79.6%), and Enterprise Management (58.8%).
| Industry | Male | Female |
| Agriculture, Fishing & Hunting | 356 (94.9%) | 19 (5.1%) |
| Mining, Quarrying, & Extraction | 56 (50.0%) | 56 (50.0%) |
| Construction | 1,071 (84.7%) | 193 (15.3%) |
| Manufacturing | 2,026 (57.8%) | 1,482 (42.2%) |
| Wholesale Trade | 641 (76.9%) | 192 (23.1%) |
| Retail Trade | 1,642 (48.8%) | 1,721 (51.2%) |
| Transportation & Warehousing | 968 (80.9%) | 229 (19.1%) |
| Utilities | 222 (83.2%) | 45 (16.9%) |
| Information | 159 (61.6%) | 99 (38.4%) |
| Finance & Insurance | 989 (62.1%) | 603 (37.9%) |
| Real Estate, Rental & Leasing | 246 (48.1%) | 265 (51.9%) |
| Professional & Scientific | 1,215 (67.9%) | 573 (32.1%) |
| Enterprise Management | 21 (41.2%) | 30 (58.8%) |
| Administrative & Support | 527 (62.3%) | 319 (37.7%) |
| Educational Services | 335 (20.3%) | 1,311 (79.6%) |
| Health Care & Social Assistance | 486 (13.9%) | 3,004 (86.1%) |
| Arts, Entertainment & Recreation | 497 (60.0%) | 332 (40.1%) |
| Accommodation & Food Services | 450 (45.2%) | 545 (54.8%) |
| Public Administration | 159 (45.6%) | 190 (54.4%) |
| Total | 12,525 (51.7%) | 11,699 (48.3%) |
Education in Shakopee
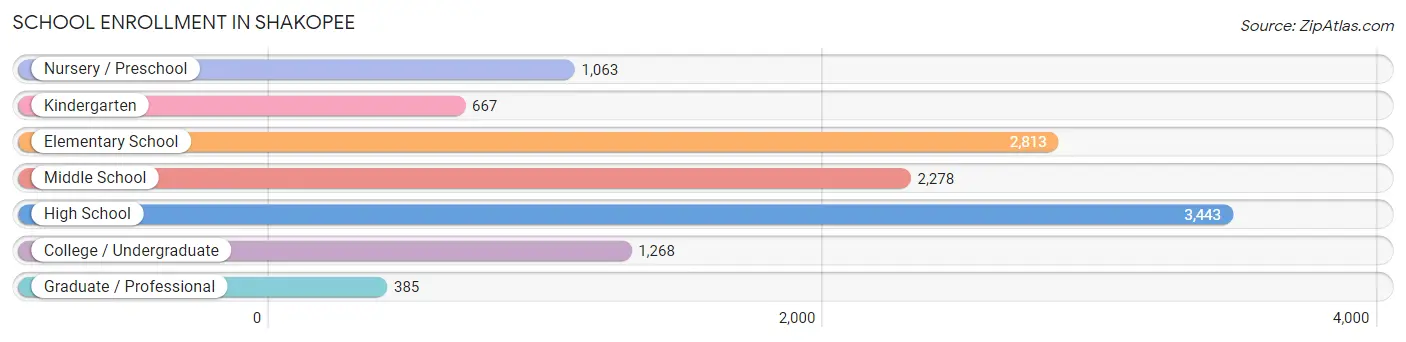
School Enrollment in Shakopee
The most common levels of schooling among the 11,917 students in Shakopee are high school (3,443 | 28.9%), elementary school (2,813 | 23.6%), and middle school (2,278 | 19.1%).
| School Level | # Students | % Students |
| Nursery / Preschool | 1,063 | 8.9% |
| Kindergarten | 667 | 5.6% |
| Elementary School | 2,813 | 23.6% |
| Middle School | 2,278 | 19.1% |
| High School | 3,443 | 28.9% |
| College / Undergraduate | 1,268 | 10.6% |
| Graduate / Professional | 385 | 3.2% |
| Total | 11,917 | 100.0% |
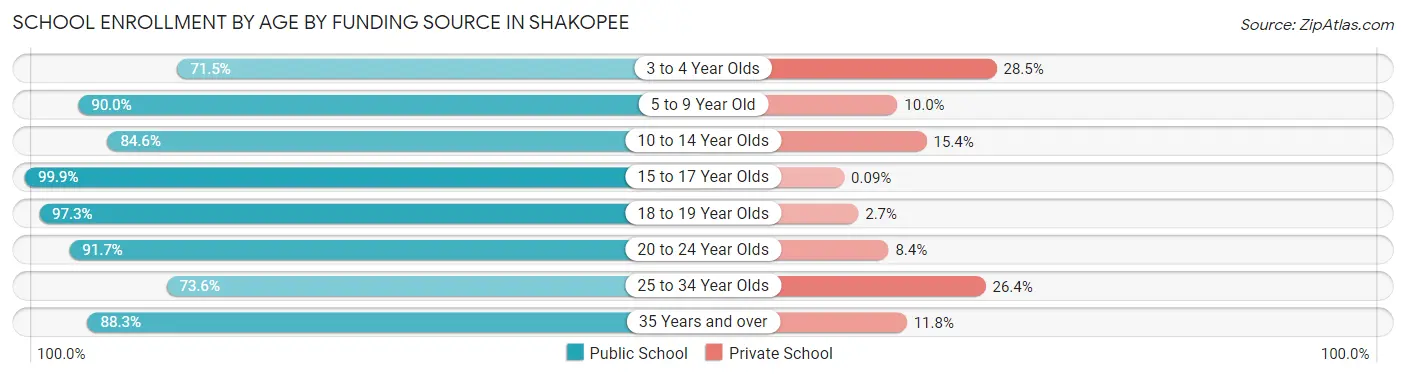
School Enrollment by Age by Funding Source in Shakopee
Out of a total of 11,917 students who are enrolled in schools in Shakopee, 1,299 (10.9%) attend a private institution, while the remaining 10,618 (89.1%) are enrolled in public schools. The age group of 3 to 4 year olds has the highest likelihood of being enrolled in private schools, with 193 (28.5% in the age bracket) enrolled. Conversely, the age group of 15 to 17 year olds has the lowest likelihood of being enrolled in a private school, with 2,275 (99.9% in the age bracket) attending a public institution.
| Age Bracket | Public School | Private School |
| 3 to 4 Year Olds | 485 (71.5%) | 193 (28.5%) |
| 5 to 9 Year Old | 3,022 (90.0%) | 336 (10.0%) |
| 10 to 14 Year Olds | 2,531 (84.6%) | 462 (15.4%) |
| 15 to 17 Year Olds | 2,275 (99.9%) | 2 (0.1%) |
| 18 to 19 Year Olds | 895 (97.3%) | 25 (2.7%) |
| 20 to 24 Year Olds | 571 (91.6%) | 52 (8.4%) |
| 25 to 34 Year Olds | 529 (73.6%) | 190 (26.4%) |
| 35 Years and over | 308 (88.2%) | 41 (11.7%) |
| Total | 10,618 (89.1%) | 1,299 (10.9%) |
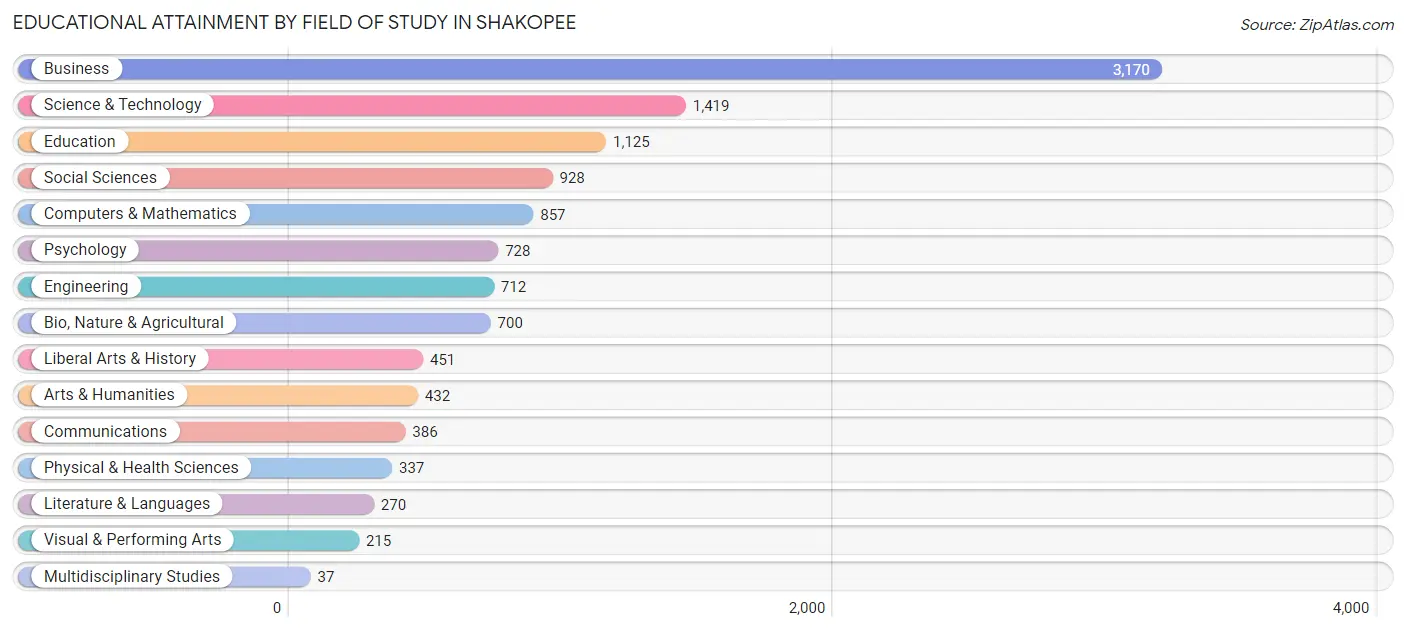
Educational Attainment by Field of Study in Shakopee
Business (3,170 | 26.9%), science & technology (1,419 | 12.1%), education (1,125 | 9.6%), social sciences (928 | 7.9%), and computers & mathematics (857 | 7.3%) are the most common fields of study among 11,767 individuals in Shakopee who have obtained a bachelor's degree or higher.
| Field of Study | # Graduates | % Graduates |
| Computers & Mathematics | 857 | 7.3% |
| Bio, Nature & Agricultural | 700 | 5.9% |
| Physical & Health Sciences | 337 | 2.9% |
| Psychology | 728 | 6.2% |
| Social Sciences | 928 | 7.9% |
| Engineering | 712 | 6.0% |
| Multidisciplinary Studies | 37 | 0.3% |
| Science & Technology | 1,419 | 12.1% |
| Business | 3,170 | 26.9% |
| Education | 1,125 | 9.6% |
| Literature & Languages | 270 | 2.3% |
| Liberal Arts & History | 451 | 3.8% |
| Visual & Performing Arts | 215 | 1.8% |
| Communications | 386 | 3.3% |
| Arts & Humanities | 432 | 3.7% |
| Total | 11,767 | 100.0% |
Transportation & Commute in Shakopee
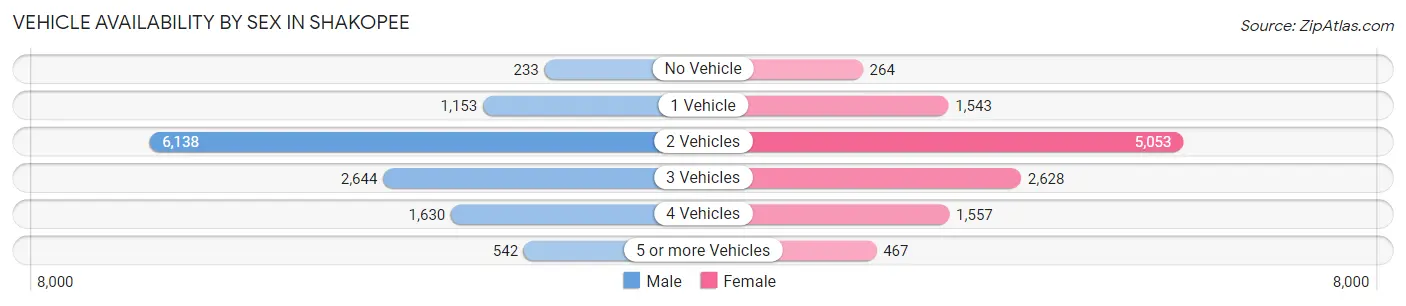
Vehicle Availability by Sex in Shakopee
The most prevalent vehicle ownership categories in Shakopee are males with 2 vehicles (6,138, accounting for 49.7%) and females with 2 vehicles (5,053, making up 53.3%).
| Vehicles Available | Male | Female |
| No Vehicle | 233 (1.9%) | 264 (2.3%) |
| 1 Vehicle | 1,153 (9.3%) | 1,543 (13.4%) |
| 2 Vehicles | 6,138 (49.7%) | 5,053 (43.9%) |
| 3 Vehicles | 2,644 (21.4%) | 2,628 (22.8%) |
| 4 Vehicles | 1,630 (13.2%) | 1,557 (13.5%) |
| 5 or more Vehicles | 542 (4.4%) | 467 (4.1%) |
| Total | 12,340 (100.0%) | 11,512 (100.0%) |
Commute Time in Shakopee
The most frequently occuring commute durations in Shakopee are 30 to 34 minutes (3,873 commuters, 19.4%), 15 to 19 minutes (2,904 commuters, 14.5%), and 10 to 14 minutes (2,889 commuters, 14.4%).
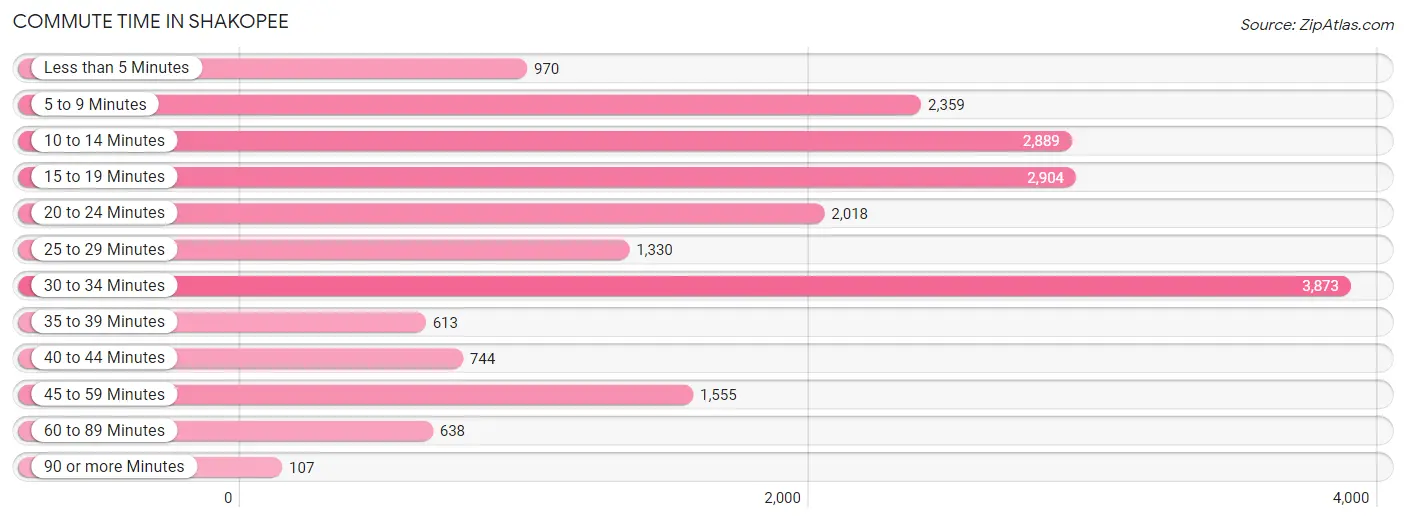
| Commute Time | # Commuters | % Commuters |
| Less than 5 Minutes | 970 | 4.9% |
| 5 to 9 Minutes | 2,359 | 11.8% |
| 10 to 14 Minutes | 2,889 | 14.4% |
| 15 to 19 Minutes | 2,904 | 14.5% |
| 20 to 24 Minutes | 2,018 | 10.1% |
| 25 to 29 Minutes | 1,330 | 6.7% |
| 30 to 34 Minutes | 3,873 | 19.4% |
| 35 to 39 Minutes | 613 | 3.1% |
| 40 to 44 Minutes | 744 | 3.7% |
| 45 to 59 Minutes | 1,555 | 7.8% |
| 60 to 89 Minutes | 638 | 3.2% |
| 90 or more Minutes | 107 | 0.5% |
Commute Time by Sex in Shakopee
The most common commute times in Shakopee are 30 to 34 minutes (1,917 commuters, 18.1%) for males and 30 to 34 minutes (1,956 commuters, 20.7%) for females.
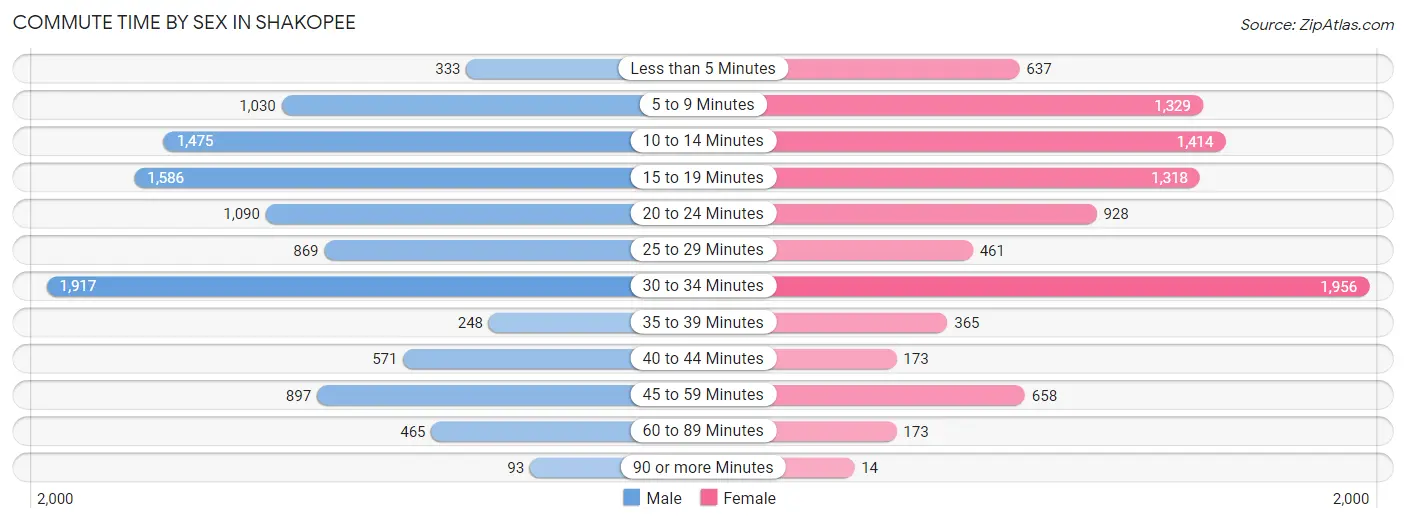
| Commute Time | Male | Female |
| Less than 5 Minutes | 333 (3.2%) | 637 (6.8%) |
| 5 to 9 Minutes | 1,030 (9.7%) | 1,329 (14.1%) |
| 10 to 14 Minutes | 1,475 (14.0%) | 1,414 (15.0%) |
| 15 to 19 Minutes | 1,586 (15.0%) | 1,318 (14.0%) |
| 20 to 24 Minutes | 1,090 (10.3%) | 928 (9.9%) |
| 25 to 29 Minutes | 869 (8.2%) | 461 (4.9%) |
| 30 to 34 Minutes | 1,917 (18.1%) | 1,956 (20.7%) |
| 35 to 39 Minutes | 248 (2.4%) | 365 (3.9%) |
| 40 to 44 Minutes | 571 (5.4%) | 173 (1.8%) |
| 45 to 59 Minutes | 897 (8.5%) | 658 (7.0%) |
| 60 to 89 Minutes | 465 (4.4%) | 173 (1.8%) |
| 90 or more Minutes | 93 (0.9%) | 14 (0.2%) |
Time of Departure to Work by Sex in Shakopee
The most frequent times of departure to work in Shakopee are 7:00 AM to 7:29 AM (1,555, 14.7%) for males and 7:00 AM to 7:29 AM (1,286, 13.6%) for females.
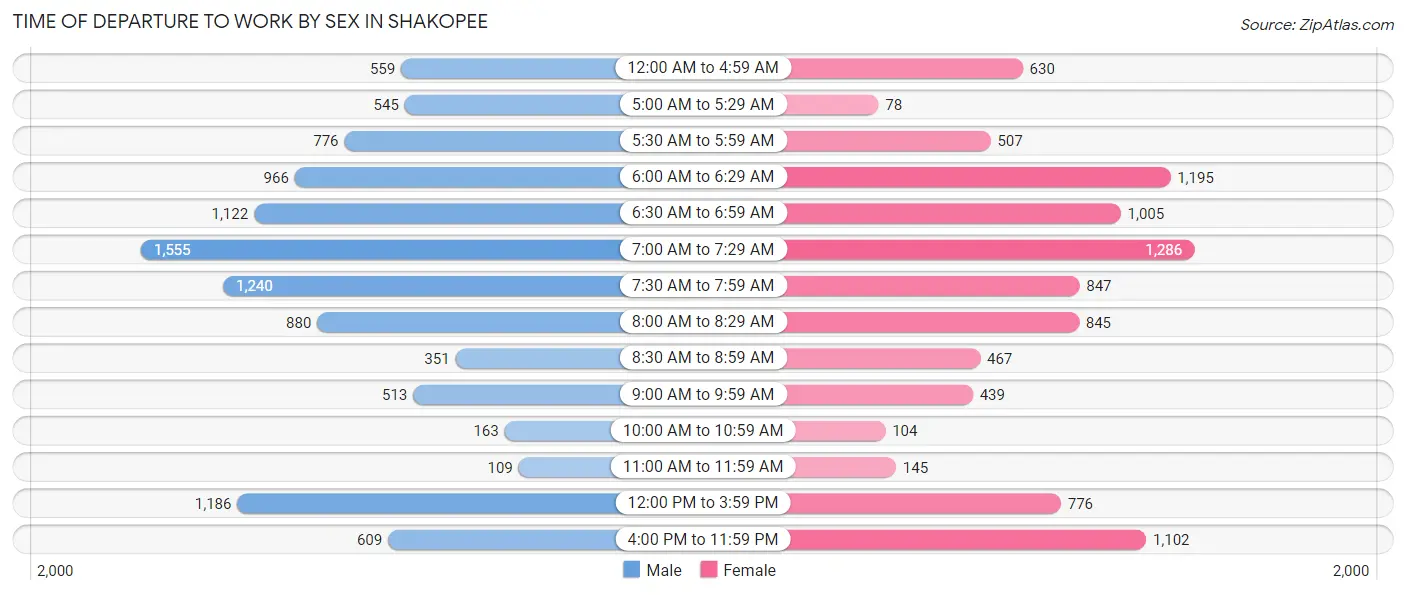
| Time of Departure | Male | Female |
| 12:00 AM to 4:59 AM | 559 (5.3%) | 630 (6.7%) |
| 5:00 AM to 5:29 AM | 545 (5.1%) | 78 (0.8%) |
| 5:30 AM to 5:59 AM | 776 (7.3%) | 507 (5.4%) |
| 6:00 AM to 6:29 AM | 966 (9.1%) | 1,195 (12.7%) |
| 6:30 AM to 6:59 AM | 1,122 (10.6%) | 1,005 (10.7%) |
| 7:00 AM to 7:29 AM | 1,555 (14.7%) | 1,286 (13.6%) |
| 7:30 AM to 7:59 AM | 1,240 (11.7%) | 847 (9.0%) |
| 8:00 AM to 8:29 AM | 880 (8.3%) | 845 (9.0%) |
| 8:30 AM to 8:59 AM | 351 (3.3%) | 467 (5.0%) |
| 9:00 AM to 9:59 AM | 513 (4.9%) | 439 (4.7%) |
| 10:00 AM to 10:59 AM | 163 (1.5%) | 104 (1.1%) |
| 11:00 AM to 11:59 AM | 109 (1.0%) | 145 (1.5%) |
| 12:00 PM to 3:59 PM | 1,186 (11.2%) | 776 (8.2%) |
| 4:00 PM to 11:59 PM | 609 (5.8%) | 1,102 (11.7%) |
| Total | 10,574 (100.0%) | 9,426 (100.0%) |
Housing Occupancy in Shakopee
Occupancy by Ownership in Shakopee
Of the total 15,570 dwellings in Shakopee, owner-occupied units account for 11,380 (73.1%), while renter-occupied units make up 4,190 (26.9%).
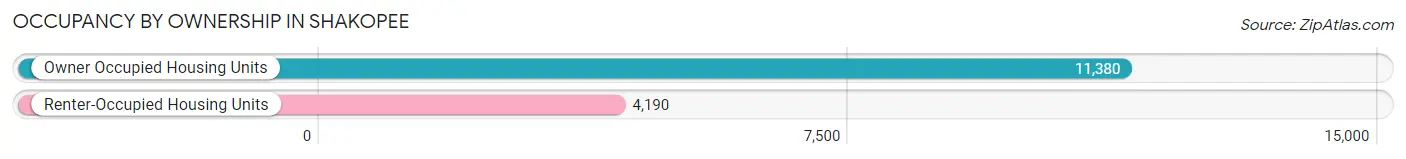
| Occupancy | # Housing Units | % Housing Units |
| Owner Occupied Housing Units | 11,380 | 73.1% |
| Renter-Occupied Housing Units | 4,190 | 26.9% |
| Total Occupied Housing Units | 15,570 | 100.0% |
Occupancy by Household Size in Shakopee
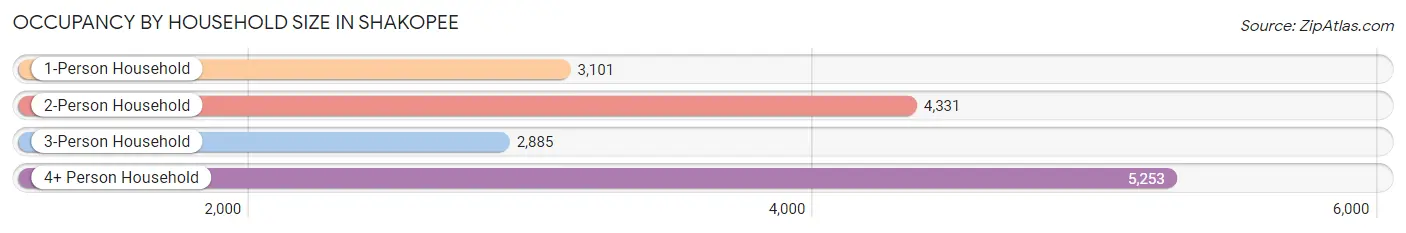
| Household Size | # Housing Units | % Housing Units |
| 1-Person Household | 3,101 | 19.9% |
| 2-Person Household | 4,331 | 27.8% |
| 3-Person Household | 2,885 | 18.5% |
| 4+ Person Household | 5,253 | 33.7% |
| Total Housing Units | 15,570 | 100.0% |
Occupancy by Ownership by Household Size in Shakopee
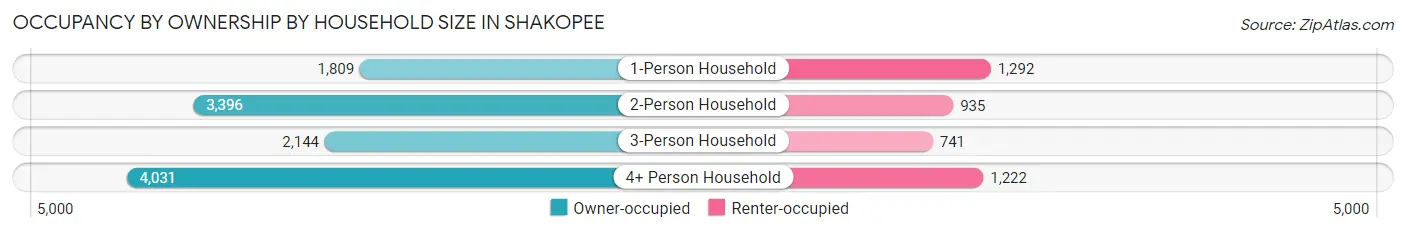
| Household Size | Owner-occupied | Renter-occupied |
| 1-Person Household | 1,809 (58.3%) | 1,292 (41.7%) |
| 2-Person Household | 3,396 (78.4%) | 935 (21.6%) |
| 3-Person Household | 2,144 (74.3%) | 741 (25.7%) |
| 4+ Person Household | 4,031 (76.7%) | 1,222 (23.3%) |
| Total Housing Units | 11,380 (73.1%) | 4,190 (26.9%) |
Occupancy by Educational Attainment in Shakopee
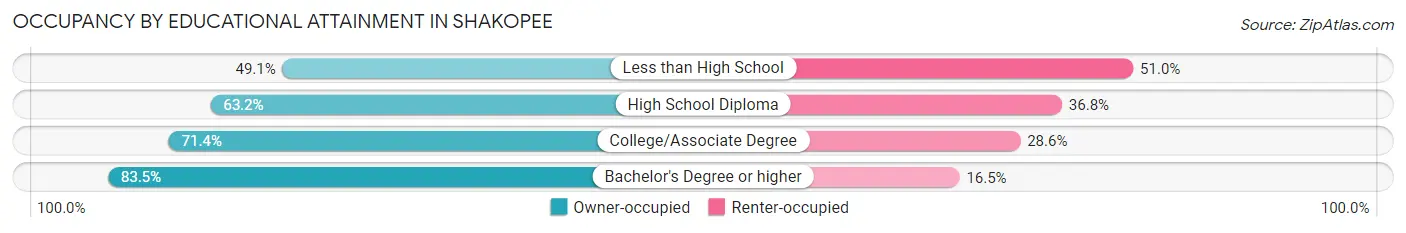
| Household Size | Owner-occupied | Renter-occupied |
| Less than High School | 517 (49.0%) | 537 (50.9%) |
| High School Diploma | 2,315 (63.2%) | 1,350 (36.8%) |
| College/Associate Degree | 3,034 (71.4%) | 1,213 (28.6%) |
| Bachelor's Degree or higher | 5,514 (83.5%) | 1,090 (16.5%) |
Occupancy by Age of Householder in Shakopee
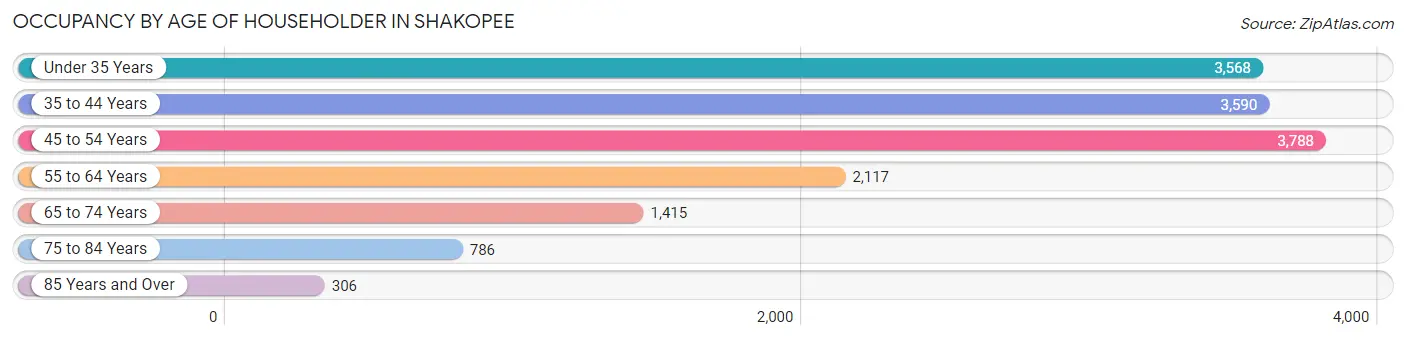
| Age Bracket | # Households | % Households |
| Under 35 Years | 3,568 | 22.9% |
| 35 to 44 Years | 3,590 | 23.1% |
| 45 to 54 Years | 3,788 | 24.3% |
| 55 to 64 Years | 2,117 | 13.6% |
| 65 to 74 Years | 1,415 | 9.1% |
| 75 to 84 Years | 786 | 5.1% |
| 85 Years and Over | 306 | 2.0% |
| Total | 15,570 | 100.0% |
Housing Finances in Shakopee
Median Income by Occupancy in Shakopee
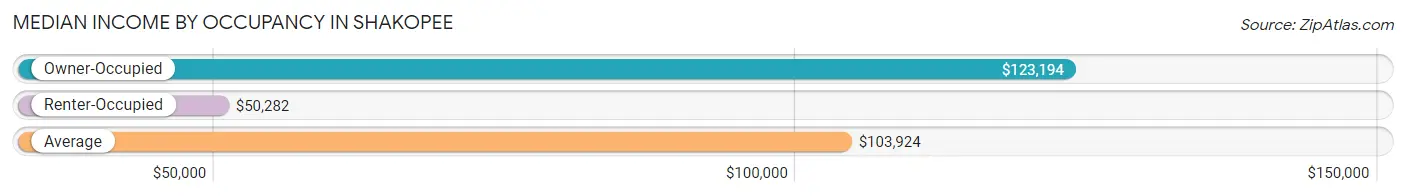
| Occupancy Type | # Households | Median Income |
| Owner-Occupied | 11,380 (73.1%) | $123,194 |
| Renter-Occupied | 4,190 (26.9%) | $50,282 |
| Average | 15,570 (100.0%) | $103,924 |
Occupancy by Householder Income Bracket in Shakopee
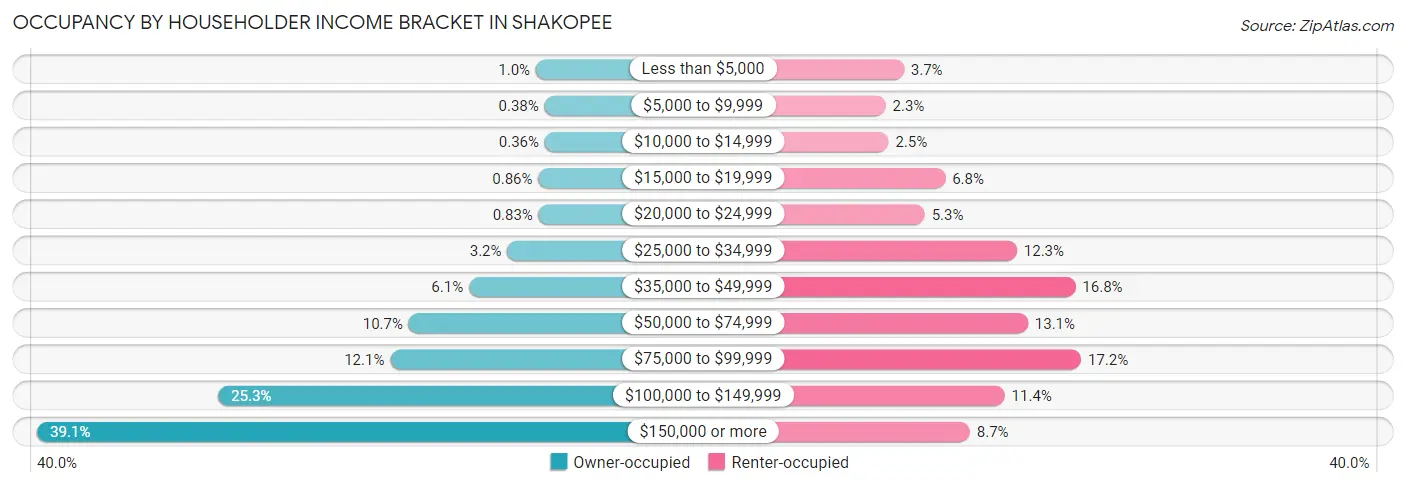
| Income Bracket | Owner-occupied | Renter-occupied |
| Less than $5,000 | 118 (1.0%) | 154 (3.7%) |
| $5,000 to $9,999 | 43 (0.4%) | 96 (2.3%) |
| $10,000 to $14,999 | 41 (0.4%) | 105 (2.5%) |
| $15,000 to $19,999 | 98 (0.9%) | 286 (6.8%) |
| $20,000 to $24,999 | 94 (0.8%) | 221 (5.3%) |
| $25,000 to $34,999 | 367 (3.2%) | 515 (12.3%) |
| $35,000 to $49,999 | 699 (6.1%) | 702 (16.8%) |
| $50,000 to $74,999 | 1,221 (10.7%) | 550 (13.1%) |
| $75,000 to $99,999 | 1,381 (12.1%) | 720 (17.2%) |
| $100,000 to $149,999 | 2,874 (25.3%) | 476 (11.4%) |
| $150,000 or more | 4,444 (39.1%) | 365 (8.7%) |
| Total | 11,380 (100.0%) | 4,190 (100.0%) |
Monthly Housing Cost Tiers in Shakopee
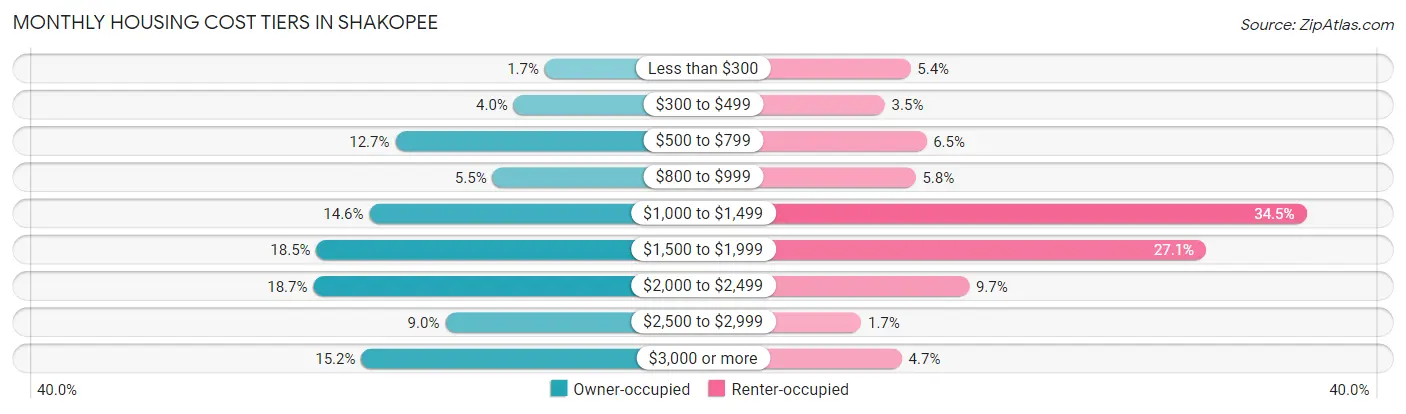
| Monthly Cost | Owner-occupied | Renter-occupied |
| Less than $300 | 192 (1.7%) | 225 (5.4%) |
| $300 to $499 | 453 (4.0%) | 146 (3.5%) |
| $500 to $799 | 1,445 (12.7%) | 274 (6.5%) |
| $800 to $999 | 631 (5.5%) | 241 (5.8%) |
| $1,000 to $1,499 | 1,663 (14.6%) | 1,447 (34.5%) |
| $1,500 to $1,999 | 2,107 (18.5%) | 1,137 (27.1%) |
| $2,000 to $2,499 | 2,133 (18.7%) | 406 (9.7%) |
| $2,500 to $2,999 | 1,026 (9.0%) | 73 (1.7%) |
| $3,000 or more | 1,730 (15.2%) | 198 (4.7%) |
| Total | 11,380 (100.0%) | 4,190 (100.0%) |
Physical Housing Characteristics in Shakopee
Housing Structures in Shakopee
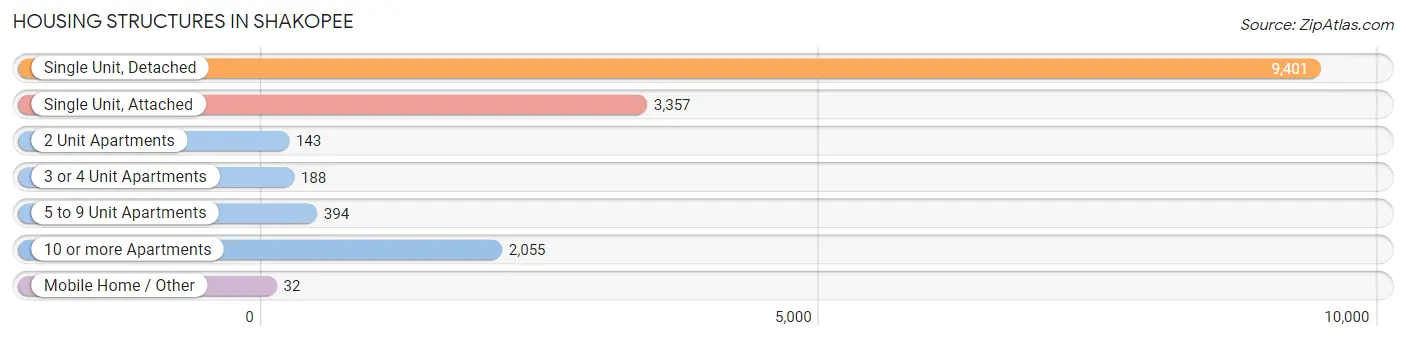
| Structure Type | # Housing Units | % Housing Units |
| Single Unit, Detached | 9,401 | 60.4% |
| Single Unit, Attached | 3,357 | 21.6% |
| 2 Unit Apartments | 143 | 0.9% |
| 3 or 4 Unit Apartments | 188 | 1.2% |
| 5 to 9 Unit Apartments | 394 | 2.5% |
| 10 or more Apartments | 2,055 | 13.2% |
| Mobile Home / Other | 32 | 0.2% |
| Total | 15,570 | 100.0% |
Housing Structures by Occupancy in Shakopee
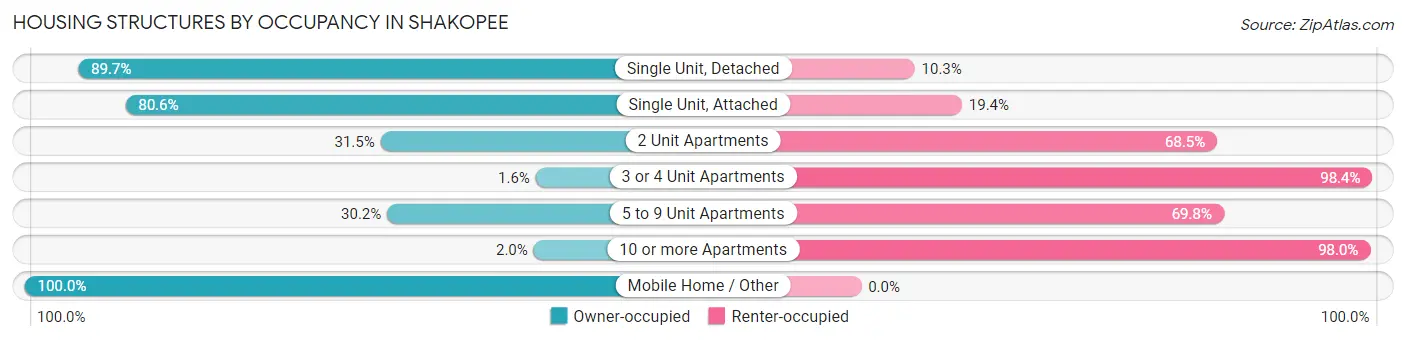
| Structure Type | Owner-occupied | Renter-occupied |
| Single Unit, Detached | 8,434 (89.7%) | 967 (10.3%) |
| Single Unit, Attached | 2,706 (80.6%) | 651 (19.4%) |
| 2 Unit Apartments | 45 (31.5%) | 98 (68.5%) |
| 3 or 4 Unit Apartments | 3 (1.6%) | 185 (98.4%) |
| 5 to 9 Unit Apartments | 119 (30.2%) | 275 (69.8%) |
| 10 or more Apartments | 41 (2.0%) | 2,014 (98.0%) |
| Mobile Home / Other | 32 (100.0%) | 0 (0.0%) |
| Total | 11,380 (73.1%) | 4,190 (26.9%) |
Housing Structures by Number of Rooms in Shakopee
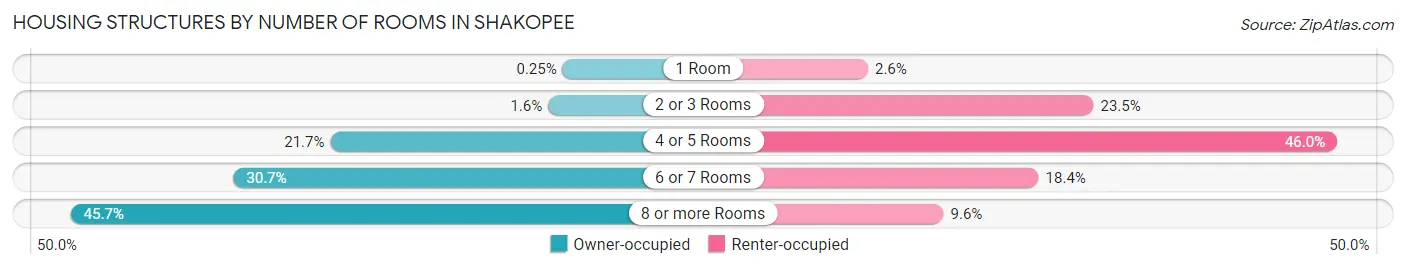
| Number of Rooms | Owner-occupied | Renter-occupied |
| 1 Room | 29 (0.3%) | 109 (2.6%) |
| 2 or 3 Rooms | 181 (1.6%) | 983 (23.5%) |
| 4 or 5 Rooms | 2,473 (21.7%) | 1,926 (46.0%) |
| 6 or 7 Rooms | 3,492 (30.7%) | 770 (18.4%) |
| 8 or more Rooms | 5,205 (45.7%) | 402 (9.6%) |
| Total | 11,380 (100.0%) | 4,190 (100.0%) |
Housing Structure by Heating Type in Shakopee
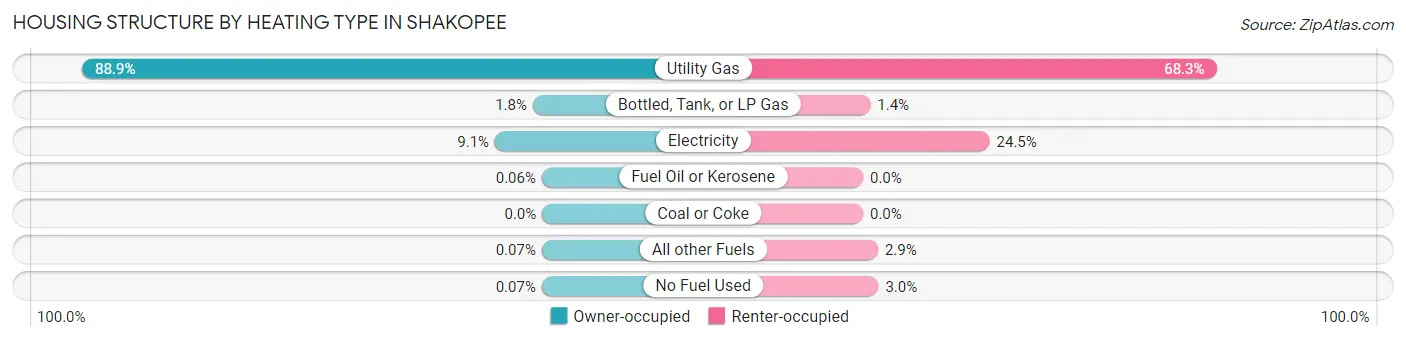
| Heating Type | Owner-occupied | Renter-occupied |
| Utility Gas | 10,116 (88.9%) | 2,860 (68.3%) |
| Bottled, Tank, or LP Gas | 204 (1.8%) | 59 (1.4%) |
| Electricity | 1,037 (9.1%) | 1,025 (24.5%) |
| Fuel Oil or Kerosene | 7 (0.1%) | 0 (0.0%) |
| Coal or Coke | 0 (0.0%) | 0 (0.0%) |
| All other Fuels | 8 (0.1%) | 121 (2.9%) |
| No Fuel Used | 8 (0.1%) | 125 (3.0%) |
| Total | 11,380 (100.0%) | 4,190 (100.0%) |
Household Vehicle Usage in Shakopee
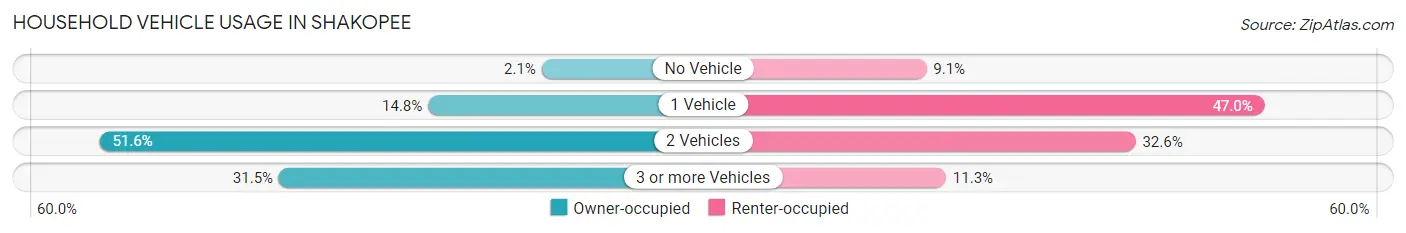
| Vehicles per Household | Owner-occupied | Renter-occupied |
| No Vehicle | 237 (2.1%) | 382 (9.1%) |
| 1 Vehicle | 1,684 (14.8%) | 1,970 (47.0%) |
| 2 Vehicles | 5,873 (51.6%) | 1,364 (32.6%) |
| 3 or more Vehicles | 3,586 (31.5%) | 474 (11.3%) |
| Total | 11,380 (100.0%) | 4,190 (100.0%) |
Real Estate & Mortgages in Shakopee
Real Estate and Mortgage Overview in Shakopee
| Characteristic | Without Mortgage | With Mortgage |
| Housing Units | 2,663 | 8,717 |
| Median Property Value | $317,900 | $357,600 |
| Median Household Income | $86,981 | $3,606 |
| Monthly Housing Costs | $648 | $1,730 |
| Real Estate Taxes | $3,434 | $270 |
Property Value by Mortgage Status in Shakopee
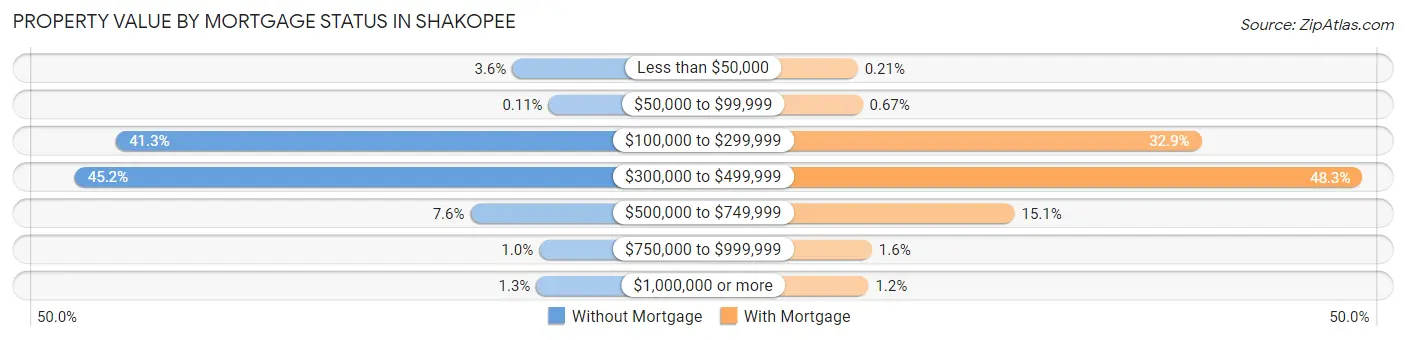
| Property Value | Without Mortgage | With Mortgage |
| Less than $50,000 | 95 (3.6%) | 18 (0.2%) |
| $50,000 to $99,999 | 3 (0.1%) | 58 (0.7%) |
| $100,000 to $299,999 | 1,099 (41.3%) | 2,871 (32.9%) |
| $300,000 to $499,999 | 1,204 (45.2%) | 4,207 (48.3%) |
| $500,000 to $749,999 | 201 (7.5%) | 1,320 (15.1%) |
| $750,000 to $999,999 | 27 (1.0%) | 136 (1.6%) |
| $1,000,000 or more | 34 (1.3%) | 107 (1.2%) |
| Total | 2,663 (100.0%) | 8,717 (100.0%) |
Household Income by Mortgage Status in Shakopee
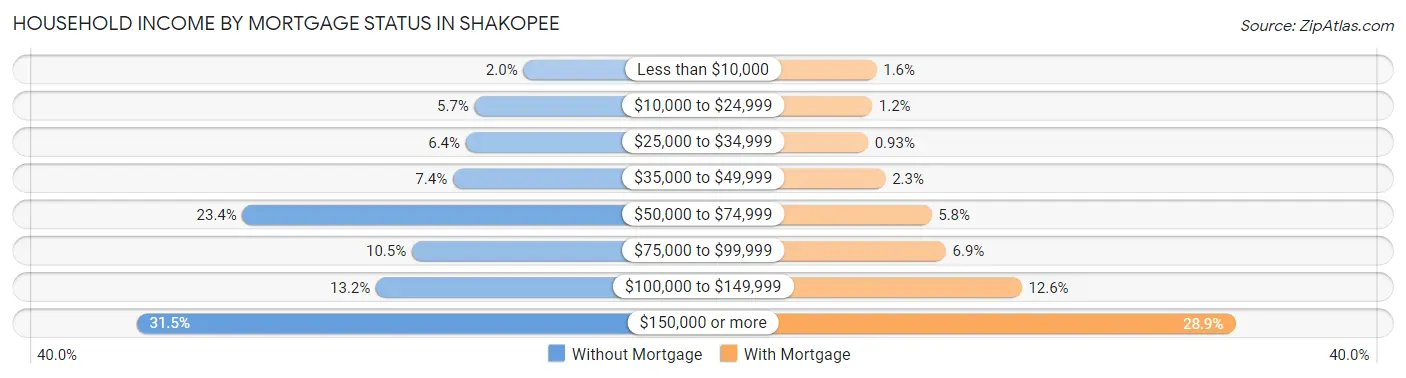
| Household Income | Without Mortgage | With Mortgage |
| Less than $10,000 | 53 (2.0%) | 138 (1.6%) |
| $10,000 to $24,999 | 152 (5.7%) | 108 (1.2%) |
| $25,000 to $34,999 | 170 (6.4%) | 81 (0.9%) |
| $35,000 to $49,999 | 196 (7.4%) | 197 (2.3%) |
| $50,000 to $74,999 | 623 (23.4%) | 503 (5.8%) |
| $75,000 to $99,999 | 279 (10.5%) | 598 (6.9%) |
| $100,000 to $149,999 | 352 (13.2%) | 1,102 (12.6%) |
| $150,000 or more | 838 (31.5%) | 2,522 (28.9%) |
| Total | 2,663 (100.0%) | 8,717 (100.0%) |
Property Value to Household Income Ratio in Shakopee
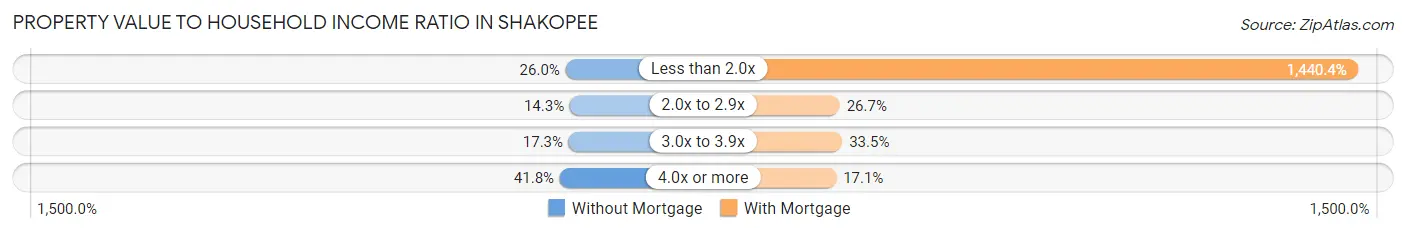
| Value-to-Income Ratio | Without Mortgage | With Mortgage |
| Less than 2.0x | 693 (26.0%) | 125,558 (1,440.4%) |
| 2.0x to 2.9x | 381 (14.3%) | 2,326 (26.7%) |
| 3.0x to 3.9x | 461 (17.3%) | 2,921 (33.5%) |
| 4.0x or more | 1,112 (41.8%) | 1,491 (17.1%) |
| Total | 2,663 (100.0%) | 8,717 (100.0%) |
Real Estate Taxes by Mortgage Status in Shakopee
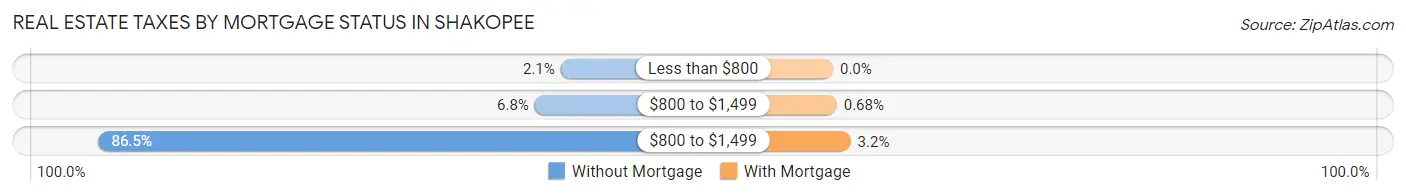
| Property Taxes | Without Mortgage | With Mortgage |
| Less than $800 | 56 (2.1%) | 0 (0.0%) |
| $800 to $1,499 | 182 (6.8%) | 59 (0.7%) |
| $800 to $1,499 | 2,303 (86.5%) | 281 (3.2%) |
| Total | 2,663 (100.0%) | 8,717 (100.0%) |
Health & Disability in Shakopee
Health Insurance Coverage by Age in Shakopee
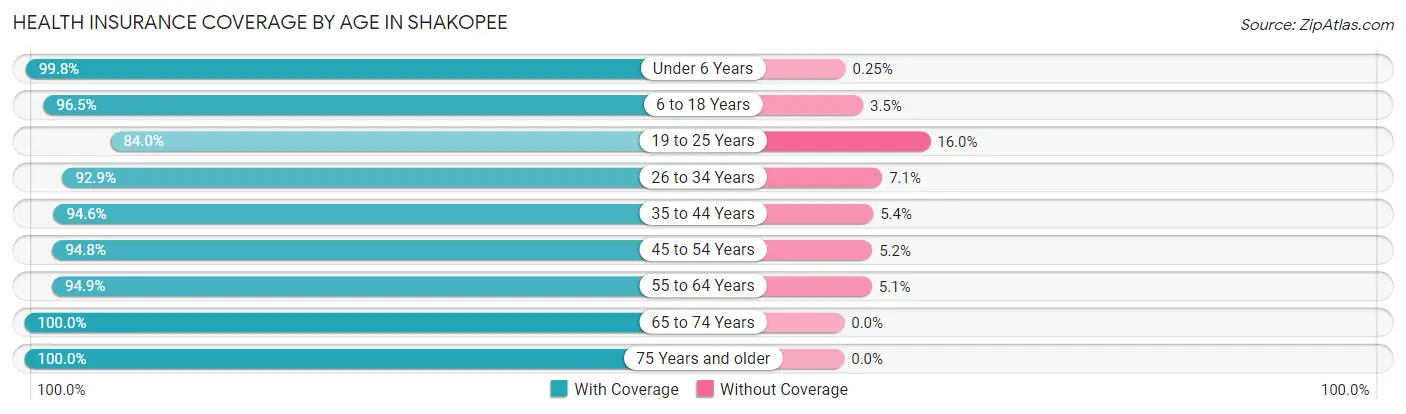
| Age Bracket | With Coverage | Without Coverage |
| Under 6 Years | 3,576 (99.8%) | 9 (0.3%) |
| 6 to 18 Years | 9,060 (96.5%) | 328 (3.5%) |
| 19 to 25 Years | 2,829 (84.0%) | 540 (16.0%) |
| 26 to 34 Years | 4,980 (92.9%) | 379 (7.1%) |
| 35 to 44 Years | 6,633 (94.6%) | 378 (5.4%) |
| 45 to 54 Years | 6,245 (94.8%) | 343 (5.2%) |
| 55 to 64 Years | 3,591 (94.9%) | 194 (5.1%) |
| 65 to 74 Years | 2,697 (100.0%) | 0 (0.0%) |
| 75 Years and older | 1,491 (100.0%) | 0 (0.0%) |
| Total | 41,102 (95.0%) | 2,171 (5.0%) |
Health Insurance Coverage by Citizenship Status in Shakopee
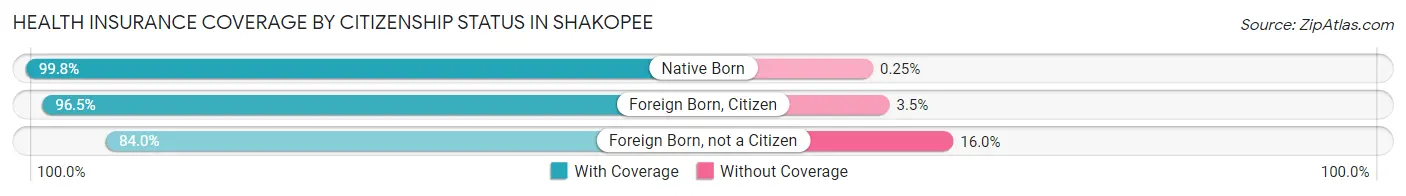
| Citizenship Status | With Coverage | Without Coverage |
| Native Born | 3,576 (99.8%) | 9 (0.3%) |
| Foreign Born, Citizen | 9,060 (96.5%) | 328 (3.5%) |
| Foreign Born, not a Citizen | 2,829 (84.0%) | 540 (16.0%) |
Health Insurance Coverage by Household Income in Shakopee
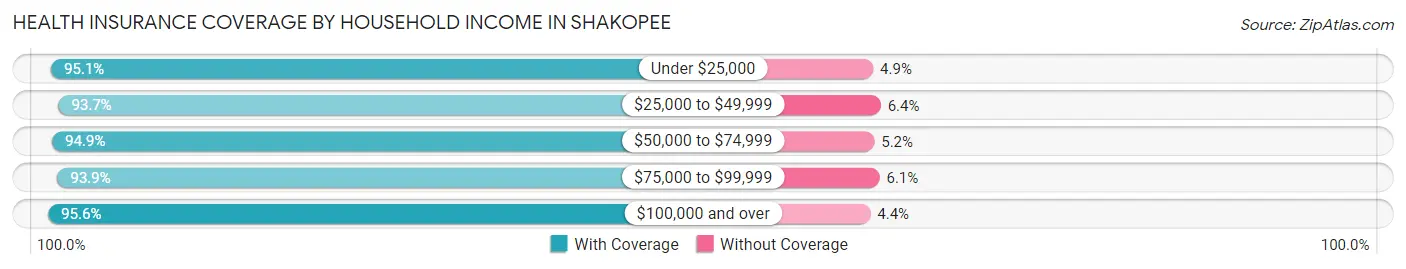
| Household Income | With Coverage | Without Coverage |
| Under $25,000 | 2,196 (95.1%) | 114 (4.9%) |
| $25,000 to $49,999 | 4,664 (93.6%) | 316 (6.4%) |
| $50,000 to $74,999 | 3,847 (94.9%) | 209 (5.1%) |
| $75,000 to $99,999 | 6,644 (93.9%) | 434 (6.1%) |
| $100,000 and over | 23,691 (95.6%) | 1,096 (4.4%) |
Public vs Private Health Insurance Coverage by Age in Shakopee
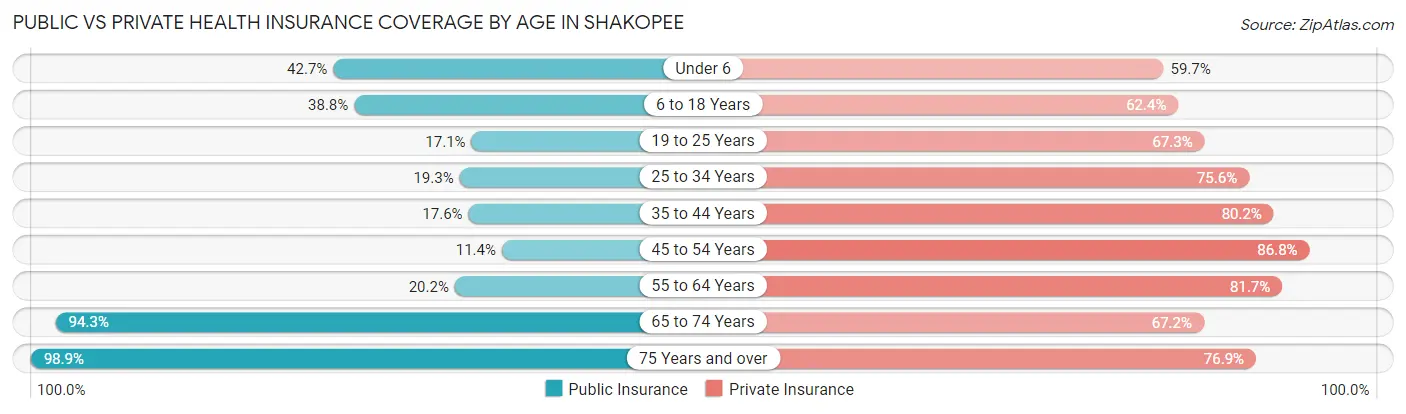
| Age Bracket | Public Insurance | Private Insurance |
| Under 6 | 1,532 (42.7%) | 2,141 (59.7%) |
| 6 to 18 Years | 3,646 (38.8%) | 5,862 (62.4%) |
| 19 to 25 Years | 575 (17.1%) | 2,268 (67.3%) |
| 25 to 34 Years | 1,033 (19.3%) | 4,050 (75.6%) |
| 35 to 44 Years | 1,235 (17.6%) | 5,620 (80.2%) |
| 45 to 54 Years | 753 (11.4%) | 5,718 (86.8%) |
| 55 to 64 Years | 763 (20.2%) | 3,093 (81.7%) |
| 65 to 74 Years | 2,542 (94.3%) | 1,812 (67.2%) |
| 75 Years and over | 1,474 (98.9%) | 1,146 (76.9%) |
| Total | 13,553 (31.3%) | 31,710 (73.3%) |
Disability Status by Sex by Age in Shakopee
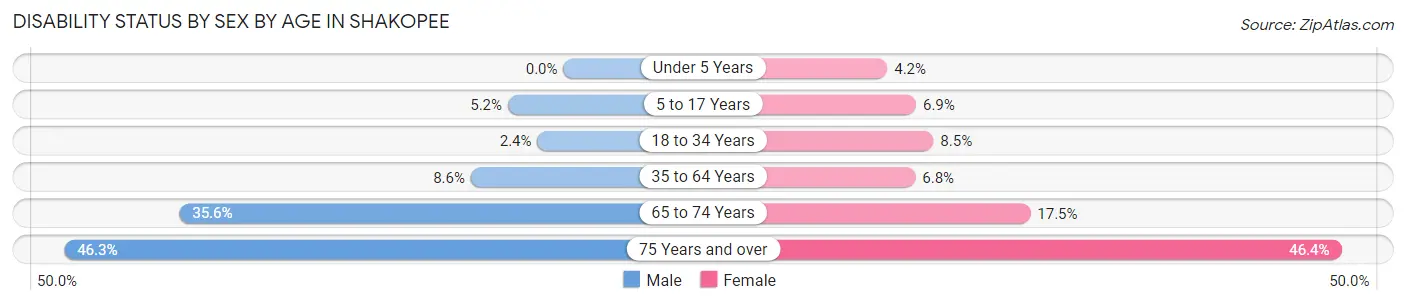
| Age Bracket | Male | Female |
| Under 5 Years | 0 (0.0%) | 69 (4.2%) |
| 5 to 17 Years | 229 (5.1%) | 300 (6.9%) |
| 18 to 34 Years | 114 (2.4%) | 439 (8.5%) |
| 35 to 64 Years | 747 (8.6%) | 593 (6.8%) |
| 65 to 74 Years | 454 (35.6%) | 249 (17.5%) |
| 75 Years and over | 302 (46.3%) | 389 (46.4%) |
Disability Class by Sex by Age in Shakopee
Disability Class: Hearing Difficulty
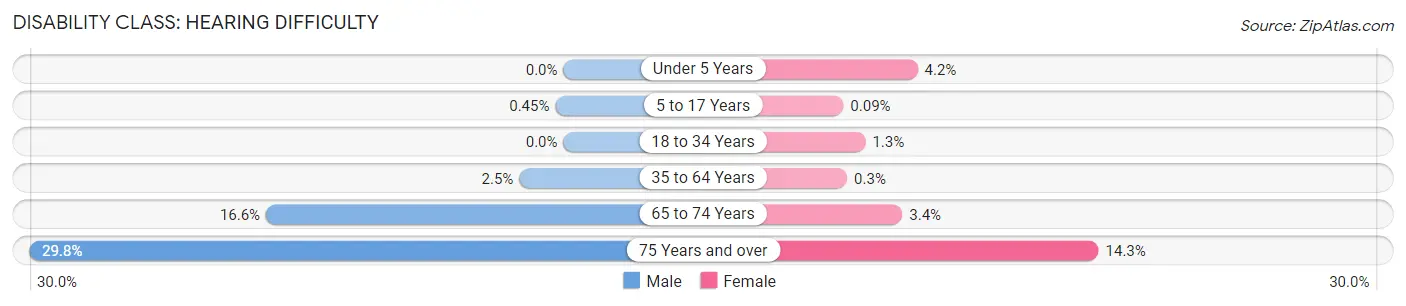
| Age Bracket | Male | Female |
| Under 5 Years | 0 (0.0%) | 69 (4.2%) |
| 5 to 17 Years | 20 (0.4%) | 4 (0.1%) |
| 18 to 34 Years | 0 (0.0%) | 68 (1.3%) |
| 35 to 64 Years | 214 (2.5%) | 26 (0.3%) |
| 65 to 74 Years | 211 (16.6%) | 48 (3.4%) |
| 75 Years and over | 194 (29.7%) | 120 (14.3%) |
Disability Class: Vision Difficulty
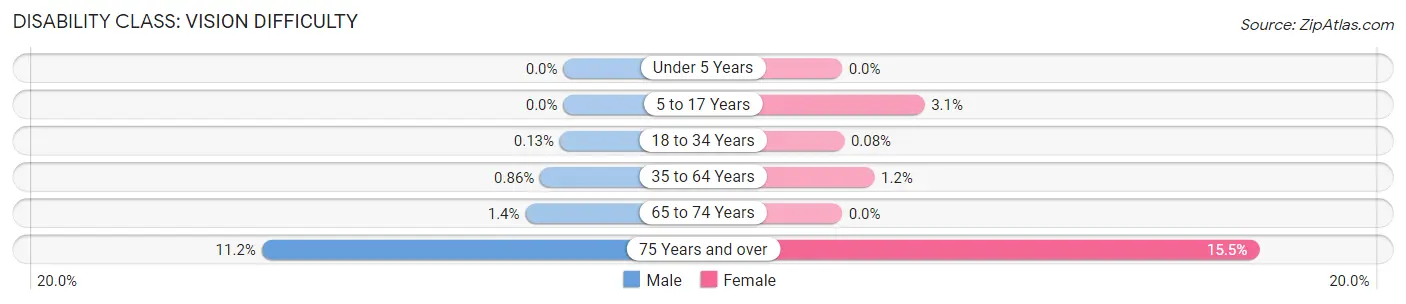
| Age Bracket | Male | Female |
| Under 5 Years | 0 (0.0%) | 0 (0.0%) |
| 5 to 17 Years | 0 (0.0%) | 133 (3.1%) |
| 18 to 34 Years | 6 (0.1%) | 4 (0.1%) |
| 35 to 64 Years | 75 (0.9%) | 104 (1.2%) |
| 65 to 74 Years | 18 (1.4%) | 0 (0.0%) |
| 75 Years and over | 73 (11.2%) | 130 (15.5%) |
Disability Class: Cognitive Difficulty
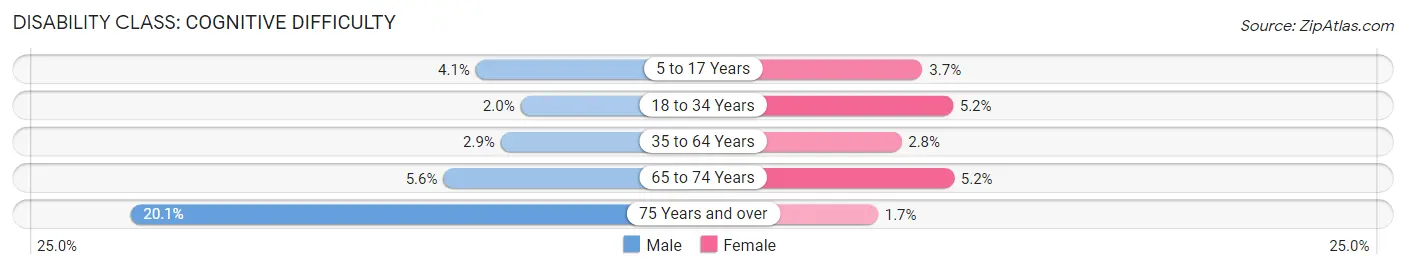
| Age Bracket | Male | Female |
| 5 to 17 Years | 181 (4.1%) | 163 (3.7%) |
| 18 to 34 Years | 94 (2.0%) | 266 (5.1%) |
| 35 to 64 Years | 253 (2.9%) | 240 (2.8%) |
| 65 to 74 Years | 71 (5.6%) | 74 (5.2%) |
| 75 Years and over | 131 (20.1%) | 14 (1.7%) |
Disability Class: Ambulatory Difficulty
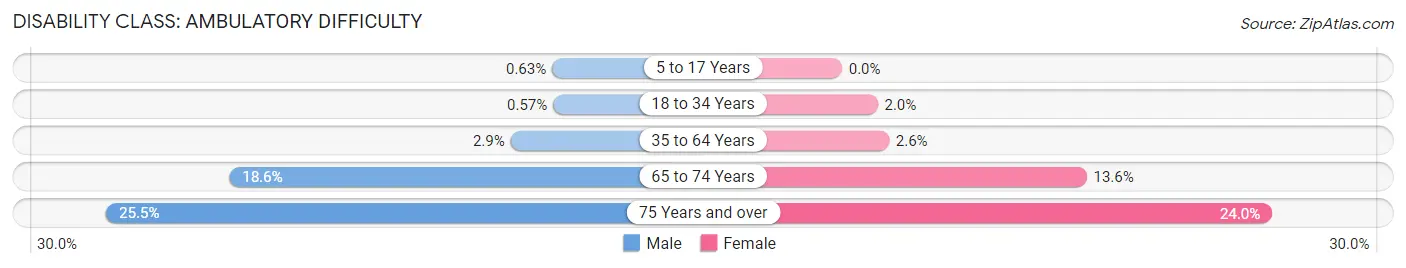
| Age Bracket | Male | Female |
| 5 to 17 Years | 28 (0.6%) | 0 (0.0%) |
| 18 to 34 Years | 27 (0.6%) | 103 (2.0%) |
| 35 to 64 Years | 256 (2.9%) | 228 (2.6%) |
| 65 to 74 Years | 237 (18.6%) | 194 (13.6%) |
| 75 Years and over | 166 (25.5%) | 201 (24.0%) |
Disability Class: Self-Care Difficulty
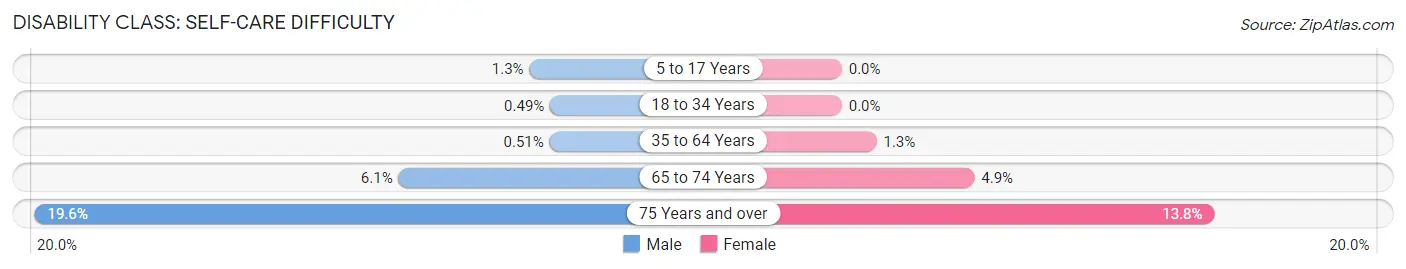
| Age Bracket | Male | Female |
| 5 to 17 Years | 56 (1.3%) | 0 (0.0%) |
| 18 to 34 Years | 23 (0.5%) | 0 (0.0%) |
| 35 to 64 Years | 44 (0.5%) | 112 (1.3%) |
| 65 to 74 Years | 78 (6.1%) | 70 (4.9%) |
| 75 Years and over | 128 (19.6%) | 116 (13.8%) |
Technology Access in Shakopee
Computing Device Access in Shakopee
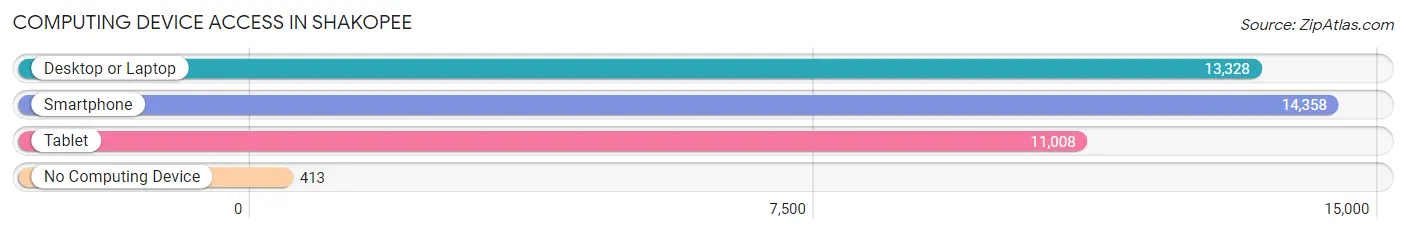
| Device Type | # Households | % Households |
| Desktop or Laptop | 13,328 | 85.6% |
| Smartphone | 14,358 | 92.2% |
| Tablet | 11,008 | 70.7% |
| No Computing Device | 413 | 2.6% |
| Total | 15,570 | 100.0% |
Internet Access in Shakopee
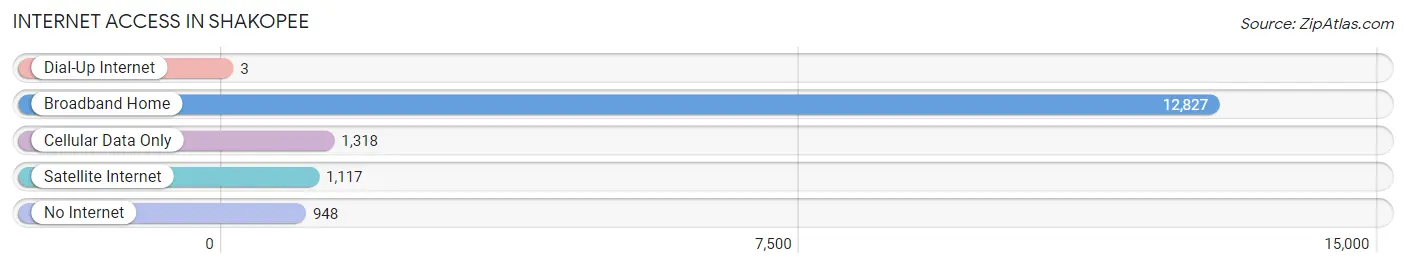
| Internet Type | # Households | % Households |
| Dial-Up Internet | 3 | 0.0% |
| Broadband Home | 12,827 | 82.4% |
| Cellular Data Only | 1,318 | 8.5% |
| Satellite Internet | 1,117 | 7.2% |
| No Internet | 948 | 6.1% |
| Total | 15,570 | 100.0% |
Shakopee Summary
Shakopee, Minnesota is a city located in Scott County, Minnesota, United States. The city is situated on the south bank of the Minnesota River, approximately 25 miles southwest of Minneapolis. As of the 2010 census, the population of Shakopee was 37,076, making it the county’s largest city.
History
The area that is now Shakopee was first settled by the Mdewakanton Dakota Native Americans in the early 1800s. The first European settlers arrived in the area in 1851, and the city was officially incorporated in 1857. The city was named after Chief Shakopee of the Mdewakanton Dakota, who was a prominent leader in the area.
In the late 1800s, Shakopee became a major transportation hub, with the construction of the Minneapolis and St. Louis Railway. The city also became a major agricultural center, with the establishment of several large farms.
In the early 1900s, Shakopee experienced a period of rapid growth, with the construction of several factories and businesses. The city also became a popular tourist destination, with the opening of Valleyfair amusement park in 1976.
Geography
Shakopee is located in Scott County, Minnesota, at the confluence of the Minnesota and Mississippi Rivers. The city is situated on the south bank of the Minnesota River, approximately 25 miles southwest of Minneapolis. The city has a total area of 22.2 square miles, of which 21.9 square miles is land and 0.3 square miles is water.
The city is located in the Minnesota River Valley, and is surrounded by rolling hills and wooded areas. The city is also home to several parks and recreational areas, including Murphy-Hanrehan Park Reserve, Sand Creek Park, and the Minnesota Valley National Wildlife Refuge.
Economy
Shakopee’s economy is largely based on manufacturing and retail. The city is home to several large companies, including 3M, Cargill, and the Shakopee Mdewakanton Sioux Community. The city is also home to several large retail centers, including the Mall of America, Valleyfair, and Canterbury Park.
The city is also home to several large employers, including the Shakopee Public Schools, the Shakopee Mdewakanton Sioux Community, and the City of Shakopee.
Demographics
As of the 2010 census, the population of Shakopee was 37,076, with a population density of 1,637.7 people per square mile. The racial makeup of the city was 79.2% White, 8.2% African American, 0.5% Native American, 5.3% Asian, 0.1% Pacific Islander, 3.7% from other races, and 2.9% from two or more races. Hispanic or Latino of any race were 8.2% of the population.
The median income for a household in the city was $63,945, and the median income for a family was $76,945. The per capita income for the city was $30,945. About 4.2% of families and 6.2% of the population were below the poverty line, including 8.2% of those under age 18 and 4.2% of those age 65 or over.
Common Questions
What is Per Capita Income in Shakopee?
Per Capita income in Shakopee is $43,594.
What is the Median Family Income in Shakopee?
Median Family Income in Shakopee is $118,653.
What is the Median Household income in Shakopee?
Median Household Income in Shakopee is $103,924.
What is Income or Wage Gap in Shakopee?
Income or Wage Gap in Shakopee is 28.8%.
Women in Shakopee earn 71.2 cents for every dollar earned by a man.
What is Inequality or Gini Index in Shakopee?
Inequality or Gini Index in Shakopee is 0.40.
What is the Total Population of Shakopee?
Total Population of Shakopee is 44,135.
What is the Total Male Population of Shakopee?
Total Male Population of Shakopee is 21,409.
What is the Total Female Population of Shakopee?
Total Female Population of Shakopee is 22,726.
What is the Ratio of Males per 100 Females in Shakopee?
There are 94.20 Males per 100 Females in Shakopee.
What is the Ratio of Females per 100 Males in Shakopee?
There are 106.15 Females per 100 Males in Shakopee.
What is the Median Population Age in Shakopee?
Median Population Age in Shakopee is 35.0 Years.
What is the Average Family Size in Shakopee
Average Family Size in Shakopee is 3.2 People.
What is the Average Household Size in Shakopee
Average Household Size in Shakopee is 2.8 People.
How Large is the Labor Force in Shakopee?
There are 25,269 People in the Labor Forcein in Shakopee.
What is the Percentage of People in the Labor Force in Shakopee?
74.7% of People are in the Labor Force in Shakopee.
What is the Unemployment Rate in Shakopee?
Unemployment Rate in Shakopee is 3.9%.