Lansing, MI Map & Demographics
Lansing Map
Lansing Overview
$28,483
PER CAPITA INCOME
$63,701
AVG FAMILY INCOME
$50,747
AVG HOUSEHOLD INCOME
23.4%
WAGE / INCOME GAP [ % ]
76.6¢/ $1
WAGE / INCOME GAP [ $ ]
$10,955
FAMILY INCOME DEFICIT
0.42
INEQUALITY / GINI INDEX
112,986
TOTAL POPULATION
55,579
MALE POPULATION
57,407
FEMALE POPULATION
96.82
MALES / 100 FEMALES
103.29
FEMALES / 100 MALES
32.9
MEDIAN AGE
3.1
AVG FAMILY SIZE
2.2
AVG HOUSEHOLD SIZE
60,766
LABOR FORCE [ PEOPLE ]
67.5%
PERCENT IN LABOR FORCE
8.3%
UNEMPLOYMENT RATE
Lansing Area Codes
Income in Lansing
Income Overview in Lansing
Per Capita Income in Lansing is $28,483, while median incomes of families and households are $63,701 and $50,747 respectively.
| Characteristic | Number | Measure |
| Per Capita Income | 112,986 | $28,483 |
| Median Family Income | 24,360 | $63,701 |
| Mean Family Income | 24,360 | $73,914 |
| Median Household Income | 50,137 | $50,747 |
| Mean Household Income | 50,137 | $62,633 |
| Income Deficit | 24,360 | $10,955 |
| Wage / Income Gap (%) | 112,986 | 23.36% |
| Wage / Income Gap ($) | 112,986 | 76.64¢ per $1 |
| Gini / Inequality Index | 112,986 | 0.42 |
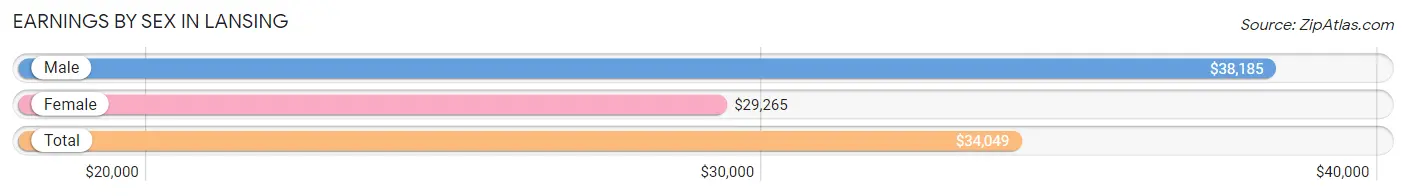
Earnings by Sex in Lansing
Average Earnings in Lansing are $34,049, $38,185 for men and $29,265 for women, a difference of 23.4%.
| Sex | Number | Average Earnings |
| Male | 31,071 (49.4%) | $38,185 |
| Female | 31,801 (50.6%) | $29,265 |
| Total | 62,872 (100.0%) | $34,049 |
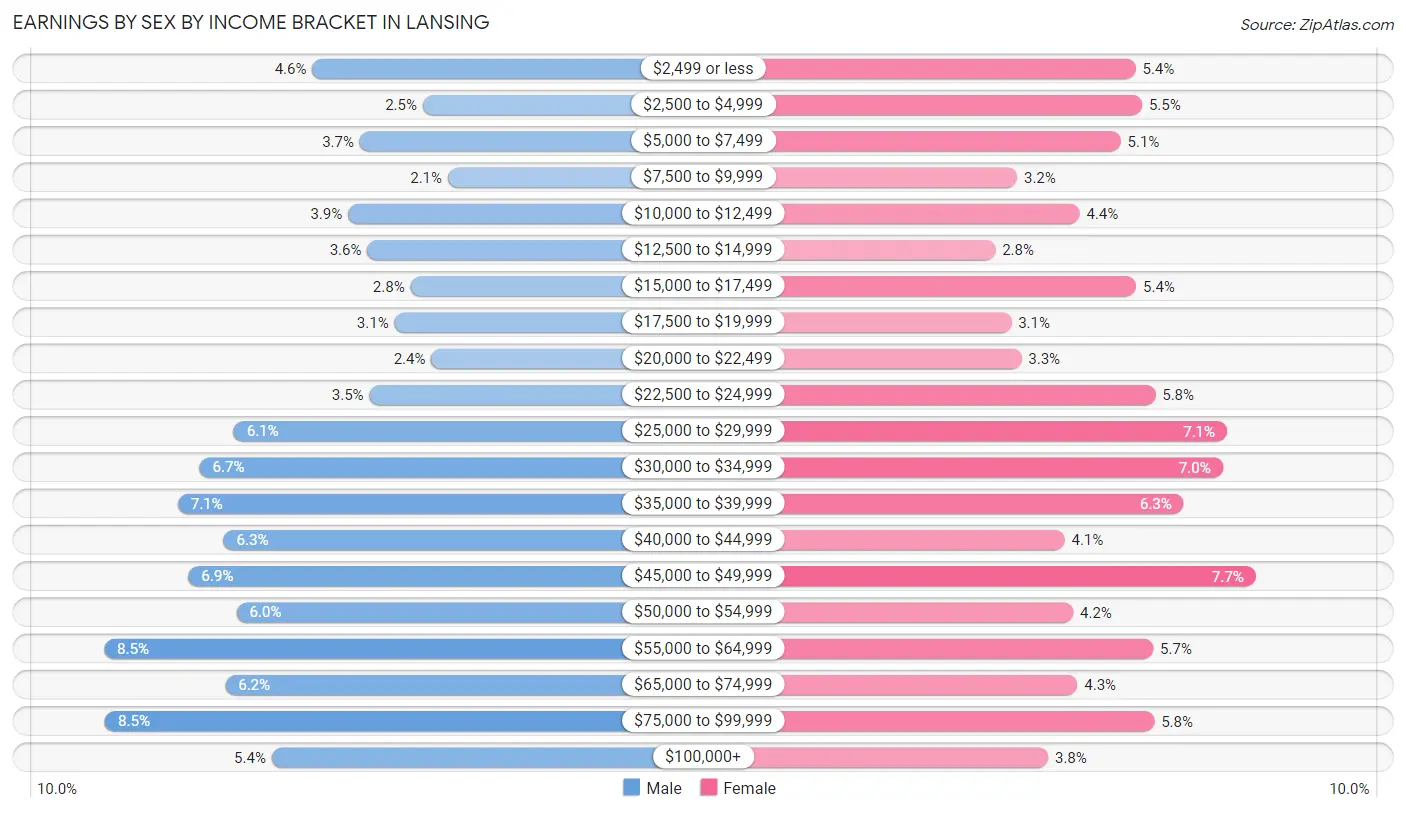
Earnings by Sex by Income Bracket in Lansing
The most common earnings brackets in Lansing are $55,000 to $64,999 for men (2,644 | 8.5%) and $45,000 to $49,999 for women (2,436 | 7.7%).
| Income | Male | Female |
| $2,499 or less | 1,431 (4.6%) | 1,722 (5.4%) |
| $2,500 to $4,999 | 788 (2.5%) | 1,759 (5.5%) |
| $5,000 to $7,499 | 1,155 (3.7%) | 1,632 (5.1%) |
| $7,500 to $9,999 | 643 (2.1%) | 1,014 (3.2%) |
| $10,000 to $12,499 | 1,225 (3.9%) | 1,387 (4.4%) |
| $12,500 to $14,999 | 1,112 (3.6%) | 885 (2.8%) |
| $15,000 to $17,499 | 862 (2.8%) | 1,723 (5.4%) |
| $17,500 to $19,999 | 955 (3.1%) | 978 (3.1%) |
| $20,000 to $22,499 | 739 (2.4%) | 1,041 (3.3%) |
| $22,500 to $24,999 | 1,101 (3.5%) | 1,838 (5.8%) |
| $25,000 to $29,999 | 1,889 (6.1%) | 2,265 (7.1%) |
| $30,000 to $34,999 | 2,089 (6.7%) | 2,240 (7.0%) |
| $35,000 to $39,999 | 2,215 (7.1%) | 2,007 (6.3%) |
| $40,000 to $44,999 | 1,948 (6.3%) | 1,299 (4.1%) |
| $45,000 to $49,999 | 2,153 (6.9%) | 2,436 (7.7%) |
| $50,000 to $54,999 | 1,874 (6.0%) | 1,347 (4.2%) |
| $55,000 to $64,999 | 2,644 (8.5%) | 1,824 (5.7%) |
| $65,000 to $74,999 | 1,940 (6.2%) | 1,373 (4.3%) |
| $75,000 to $99,999 | 2,639 (8.5%) | 1,833 (5.8%) |
| $100,000+ | 1,669 (5.4%) | 1,198 (3.8%) |
| Total | 31,071 (100.0%) | 31,801 (100.0%) |
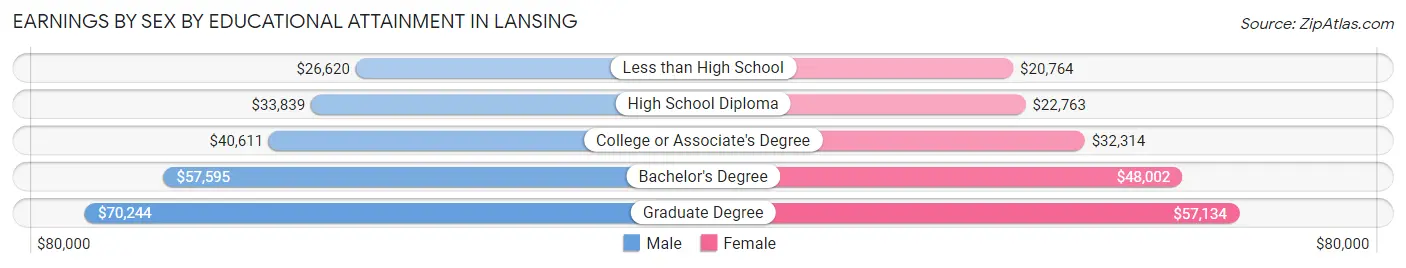
Earnings by Sex by Educational Attainment in Lansing
Average earnings in Lansing are $42,391 for men and $34,647 for women, a difference of 18.3%. Men with an educational attainment of graduate degree enjoy the highest average annual earnings of $70,244, while those with less than high school education earn the least with $26,620. Women with an educational attainment of graduate degree earn the most with the average annual earnings of $57,134, while those with less than high school education have the smallest earnings of $20,764.
| Educational Attainment | Male Income | Female Income |
| Less than High School | $26,620 | $20,764 |
| High School Diploma | $33,839 | $22,763 |
| College or Associate's Degree | $40,611 | $32,314 |
| Bachelor's Degree | $57,595 | $48,002 |
| Graduate Degree | $70,244 | $57,134 |
| Total | $42,391 | $34,647 |
Family Income in Lansing
Family Income Brackets in Lansing
According to the Lansing family income data, there are 4,848 families falling into the $50,000 to $74,999 income range, which is the most common income bracket and makes up 19.9% of all families. Conversely, the $200,000+ income bracket is the least frequent group with only 731 families (3.0%) belonging to this category.
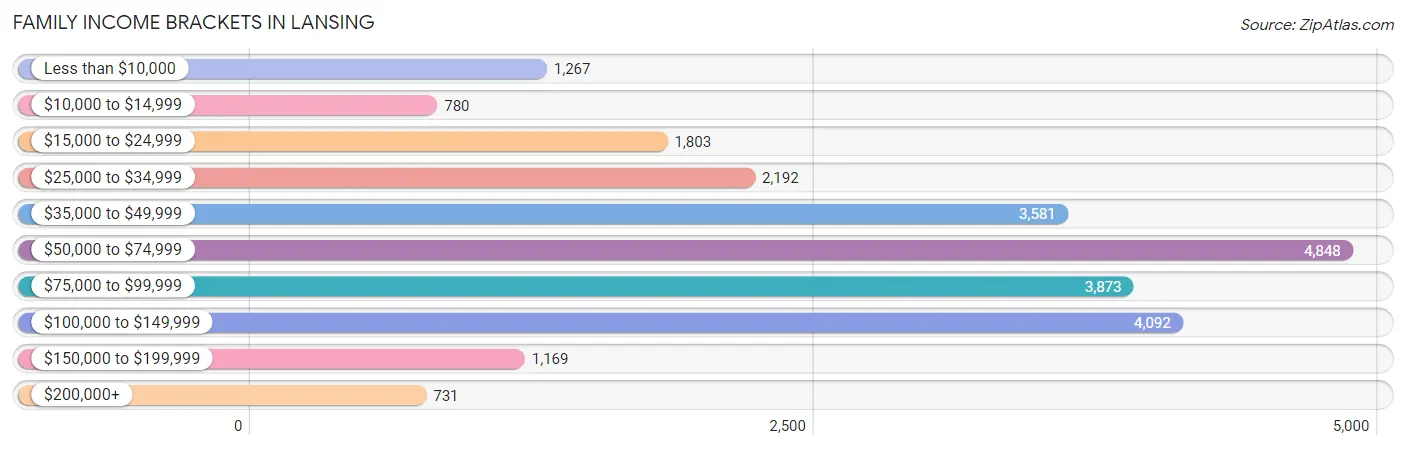
| Income Bracket | # Families | % Families |
| Less than $10,000 | 1,267 | 5.2% |
| $10,000 to $14,999 | 780 | 3.2% |
| $15,000 to $24,999 | 1,803 | 7.4% |
| $25,000 to $34,999 | 2,192 | 9.0% |
| $35,000 to $49,999 | 3,581 | 14.7% |
| $50,000 to $74,999 | 4,848 | 19.9% |
| $75,000 to $99,999 | 3,873 | 15.9% |
| $100,000 to $149,999 | 4,092 | 16.8% |
| $150,000 to $199,999 | 1,169 | 4.8% |
| $200,000+ | 731 | 3.0% |
Family Income by Famaliy Size in Lansing
7+ person families (305 | 1.3%) account for the highest median family income in Lansing with $93,688 per family, while 2-person families (12,484 | 51.2%) have the highest median income of $31,990 per family member.
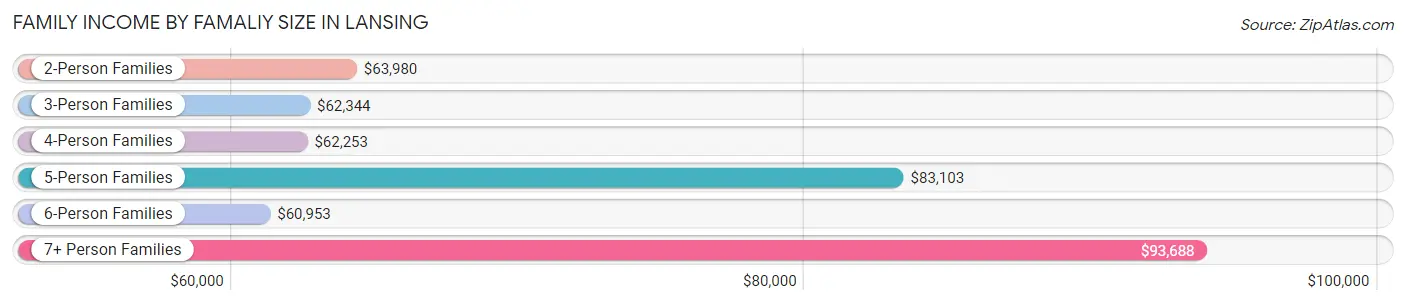
| Income Bracket | # Families | Median Income |
| 2-Person Families | 12,484 (51.2%) | $63,980 |
| 3-Person Families | 5,461 (22.4%) | $62,344 |
| 4-Person Families | 3,961 (16.3%) | $62,253 |
| 5-Person Families | 1,381 (5.7%) | $83,103 |
| 6-Person Families | 768 (3.2%) | $60,953 |
| 7+ Person Families | 305 (1.3%) | $93,688 |
| Total | 24,360 (100.0%) | $63,701 |
Family Income by Number of Earners in Lansing
The median family income in Lansing is $63,701, with families comprising 3+ earners (1,905) having the highest median family income of $105,417, while families with no earners (3,217) have the lowest median family income of $38,364, accounting for 7.8% and 13.2% of families, respectively.
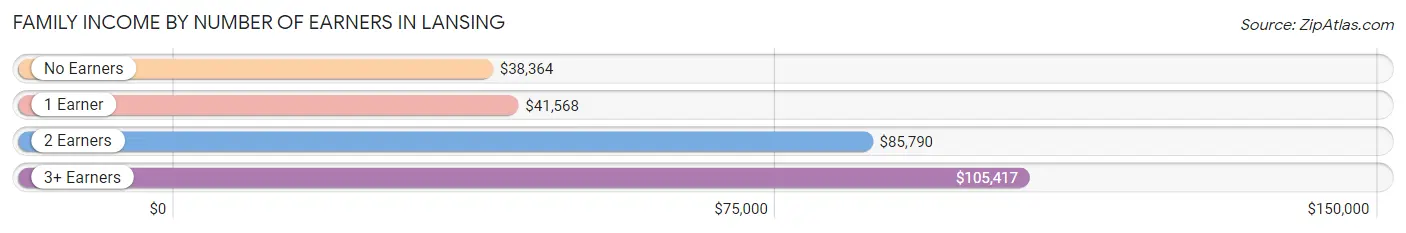
| Number of Earners | # Families | Median Income |
| No Earners | 3,217 (13.2%) | $38,364 |
| 1 Earner | 9,351 (38.4%) | $41,568 |
| 2 Earners | 9,887 (40.6%) | $85,790 |
| 3+ Earners | 1,905 (7.8%) | $105,417 |
| Total | 24,360 (100.0%) | $63,701 |
Household Income in Lansing
Household Income Brackets in Lansing
With 10,529 households falling in the category, the $50,000 to $74,999 income range is the most frequent in Lansing, accounting for 21.0% of all households. In contrast, only 1,003 households (2.0%) fall into the $200,000+ income bracket, making it the least populous group.
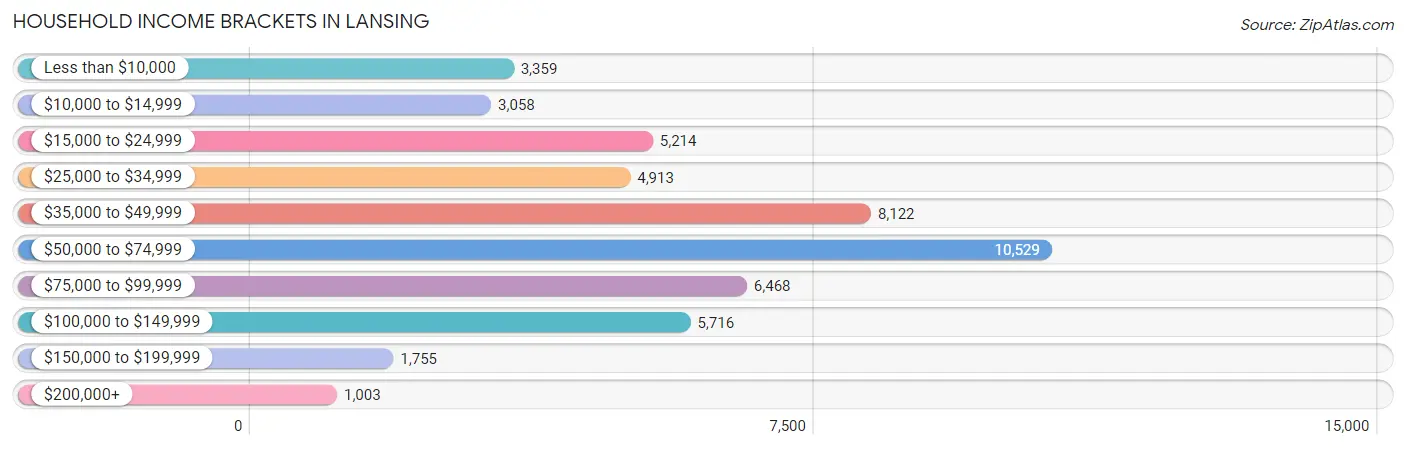
| Income Bracket | # Households | % Households |
| Less than $10,000 | 3,359 | 6.7% |
| $10,000 to $14,999 | 3,058 | 6.1% |
| $15,000 to $24,999 | 5,214 | 10.4% |
| $25,000 to $34,999 | 4,913 | 9.8% |
| $35,000 to $49,999 | 8,122 | 16.2% |
| $50,000 to $74,999 | 10,529 | 21.0% |
| $75,000 to $99,999 | 6,468 | 12.9% |
| $100,000 to $149,999 | 5,716 | 11.4% |
| $150,000 to $199,999 | 1,755 | 3.5% |
| $200,000+ | 1,003 | 2.0% |
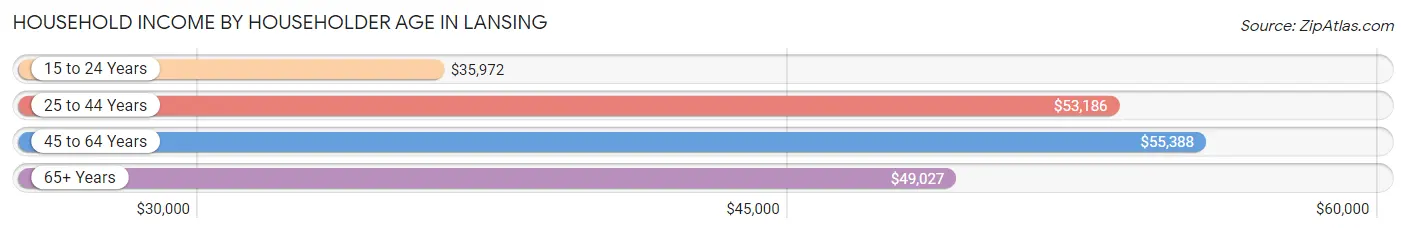
Household Income by Householder Age in Lansing
The median household income in Lansing is $50,747, with the highest median household income of $55,388 found in the 45 to 64 years age bracket for the primary householder. A total of 15,599 households (31.1%) fall into this category. Meanwhile, the 15 to 24 years age bracket for the primary householder has the lowest median household income of $35,972, with 4,746 households (9.5%) in this group.
| Income Bracket | # Households | Median Income |
| 15 to 24 Years | 4,746 (9.5%) | $35,972 |
| 25 to 44 Years | 19,495 (38.9%) | $53,186 |
| 45 to 64 Years | 15,599 (31.1%) | $55,388 |
| 65+ Years | 10,297 (20.5%) | $49,027 |
| Total | 50,137 (100.0%) | $50,747 |
Poverty in Lansing
Income Below Poverty by Sex and Age in Lansing
With 19.3% poverty level for males and 20.7% for females among the residents of Lansing, 5 year old males and 5 year old females are the most vulnerable to poverty, with 278 males (42.8%) and 369 females (44.4%) in their respective age groups living below the poverty level.
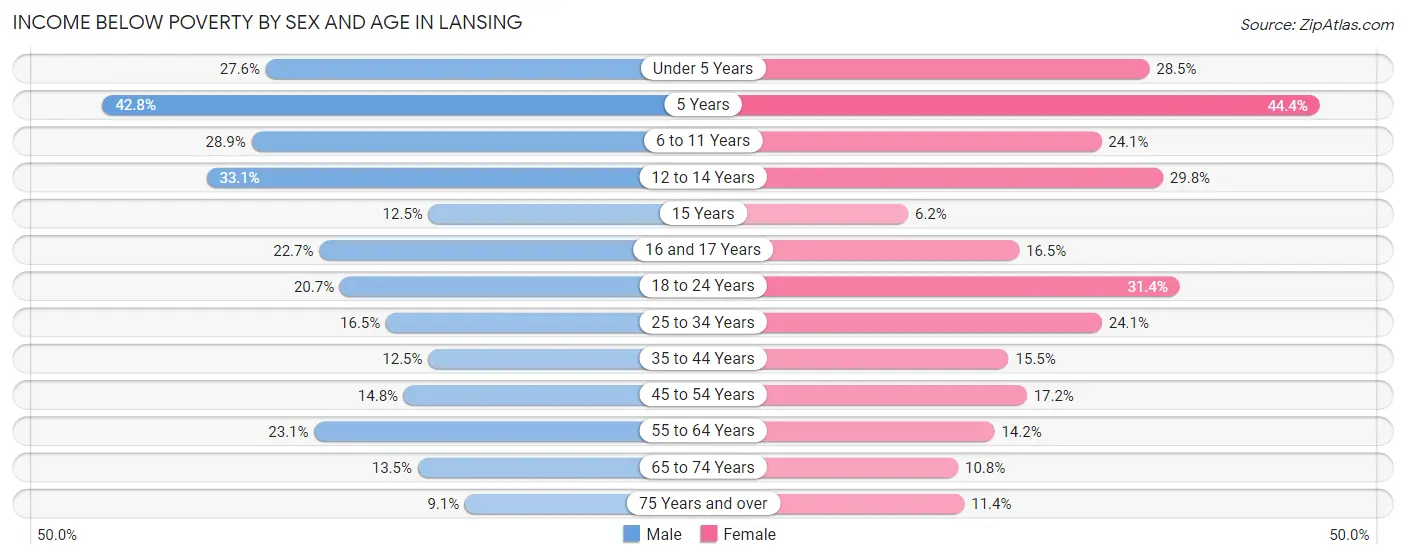
| Age Bracket | Male | Female |
| Under 5 Years | 1,173 (27.6%) | 941 (28.5%) |
| 5 Years | 278 (42.8%) | 369 (44.4%) |
| 6 to 11 Years | 1,183 (28.9%) | 900 (24.1%) |
| 12 to 14 Years | 571 (33.1%) | 683 (29.8%) |
| 15 Years | 101 (12.5%) | 16 (6.1%) |
| 16 and 17 Years | 268 (22.7%) | 257 (16.5%) |
| 18 to 24 Years | 1,358 (20.7%) | 2,088 (31.4%) |
| 25 to 34 Years | 1,750 (16.5%) | 2,613 (24.1%) |
| 35 to 44 Years | 871 (12.5%) | 1,035 (15.5%) |
| 45 to 54 Years | 874 (14.8%) | 1,051 (17.2%) |
| 55 to 64 Years | 1,387 (23.1%) | 933 (14.2%) |
| 65 to 74 Years | 587 (13.5%) | 553 (10.8%) |
| 75 Years and over | 163 (9.1%) | 327 (11.4%) |
| Total | 10,564 (19.3%) | 11,766 (20.7%) |
Income Above Poverty by Sex and Age in Lansing
According to the poverty statistics in Lansing, males aged 75 years and over and females aged 15 years are the age groups that are most secure financially, with 90.9% of males and 93.9% of females in these age groups living above the poverty line.
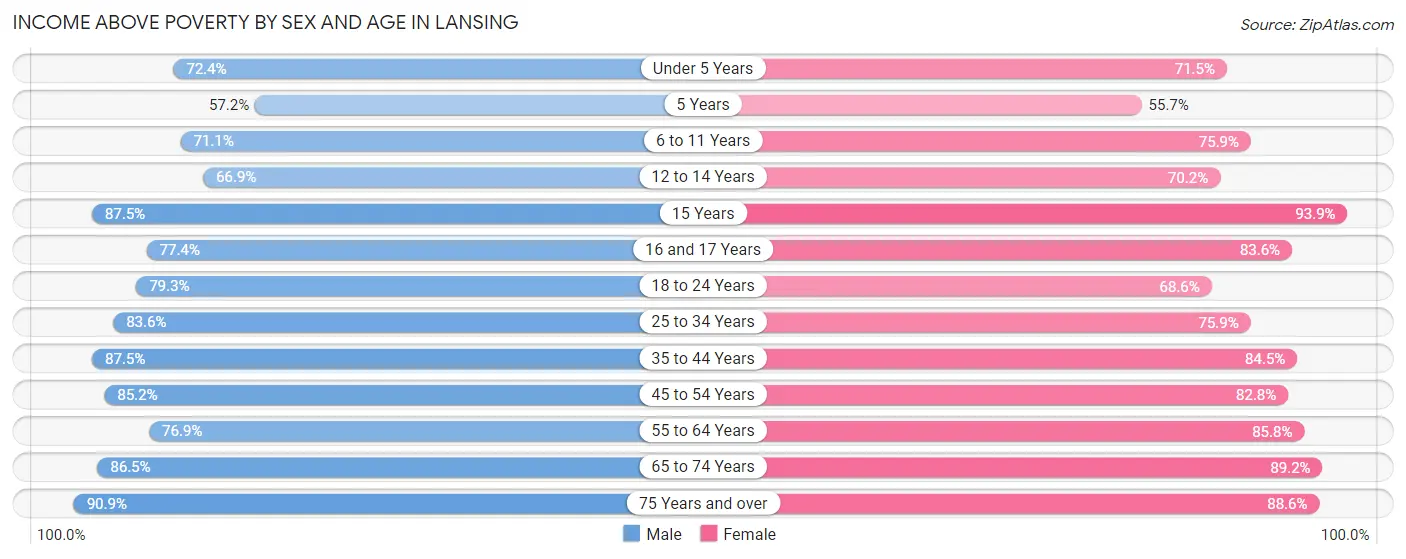
| Age Bracket | Male | Female |
| Under 5 Years | 3,076 (72.4%) | 2,356 (71.5%) |
| 5 Years | 372 (57.2%) | 463 (55.6%) |
| 6 to 11 Years | 2,905 (71.1%) | 2,837 (75.9%) |
| 12 to 14 Years | 1,153 (66.9%) | 1,609 (70.2%) |
| 15 Years | 707 (87.5%) | 244 (93.9%) |
| 16 and 17 Years | 915 (77.3%) | 1,305 (83.6%) |
| 18 to 24 Years | 5,194 (79.3%) | 4,571 (68.6%) |
| 25 to 34 Years | 8,891 (83.6%) | 8,214 (75.9%) |
| 35 to 44 Years | 6,080 (87.5%) | 5,651 (84.5%) |
| 45 to 54 Years | 5,032 (85.2%) | 5,072 (82.8%) |
| 55 to 64 Years | 4,615 (76.9%) | 5,650 (85.8%) |
| 65 to 74 Years | 3,758 (86.5%) | 4,570 (89.2%) |
| 75 Years and over | 1,624 (90.9%) | 2,549 (88.6%) |
| Total | 44,322 (80.7%) | 45,091 (79.3%) |
Income Below Poverty Among Married-Couple Families in Lansing
The poverty statistics for married-couple families in Lansing show that 7.1% or 1,034 of the total 14,521 families live below the poverty line. Families with 5 or more children have the highest poverty rate of 57.9%, comprising of 95 families. On the other hand, families with no children have the lowest poverty rate of 3.5%, which includes 315 families.
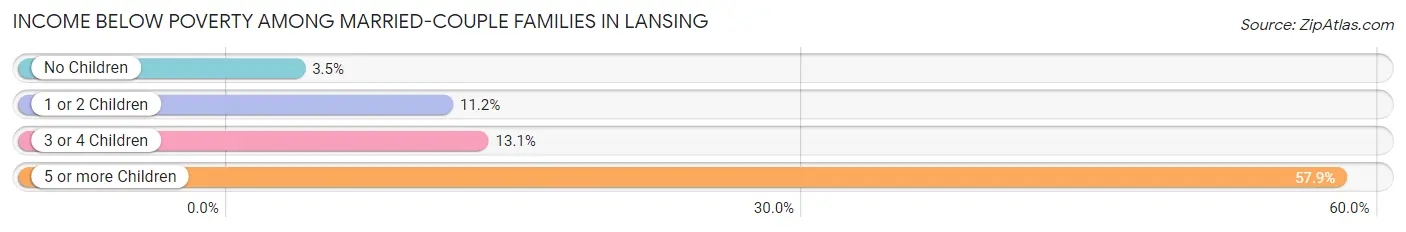
| Children | Above Poverty | Below Poverty |
| No Children | 8,670 (96.5%) | 315 (3.5%) |
| 1 or 2 Children | 3,785 (88.8%) | 479 (11.2%) |
| 3 or 4 Children | 963 (86.9%) | 145 (13.1%) |
| 5 or more Children | 69 (42.1%) | 95 (57.9%) |
| Total | 13,487 (92.9%) | 1,034 (7.1%) |
Income Below Poverty Among Single-Parent Households in Lansing
According to the poverty data in Lansing, 22.5% or 647 single-father households and 30.2% or 2,105 single-mother households are living below the poverty line. Among single-father households, those with 5 or more children have the highest poverty rate, with 37 households (100.0%) experiencing poverty. Likewise, among single-mother households, those with 3 or 4 children have the highest poverty rate, with 358 households (47.9%) falling below the poverty line.
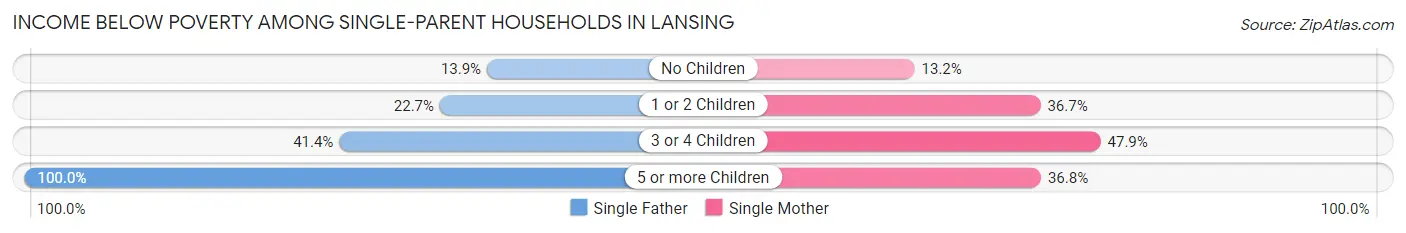
| Children | Single Father | Single Mother |
| No Children | 172 (13.9%) | 299 (13.2%) |
| 1 or 2 Children | 272 (22.7%) | 1,405 (36.7%) |
| 3 or 4 Children | 166 (41.4%) | 358 (47.9%) |
| 5 or more Children | 37 (100.0%) | 43 (36.7%) |
| Total | 647 (22.5%) | 2,105 (30.2%) |
Income Below Poverty Among Married-Couple vs Single-Parent Households in Lansing
The poverty data for Lansing shows that 1,034 of the married-couple family households (7.1%) and 2,752 of the single-parent households (28.0%) are living below the poverty level. Within the married-couple family households, those with 5 or more children have the highest poverty rate, with 95 households (57.9%) falling below the poverty line. Among the single-parent households, those with 5 or more children have the highest poverty rate, with 80 household (51.9%) living below poverty.
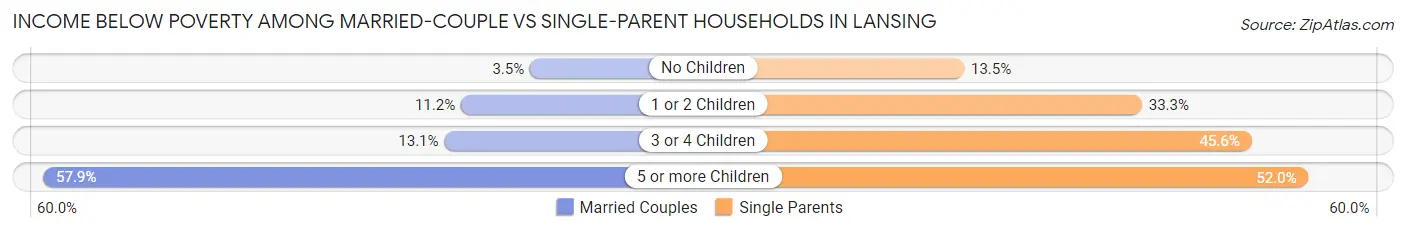
| Children | Married-Couple Families | Single-Parent Households |
| No Children | 315 (3.5%) | 471 (13.5%) |
| 1 or 2 Children | 479 (11.2%) | 1,677 (33.3%) |
| 3 or 4 Children | 145 (13.1%) | 524 (45.6%) |
| 5 or more Children | 95 (57.9%) | 80 (51.9%) |
| Total | 1,034 (7.1%) | 2,752 (28.0%) |
Race in Lansing
The most populous races in Lansing are White / Caucasian (65,728 | 58.2%), Black / African American (26,796 | 23.7%), and Hispanic or Latino (14,105 | 12.5%).
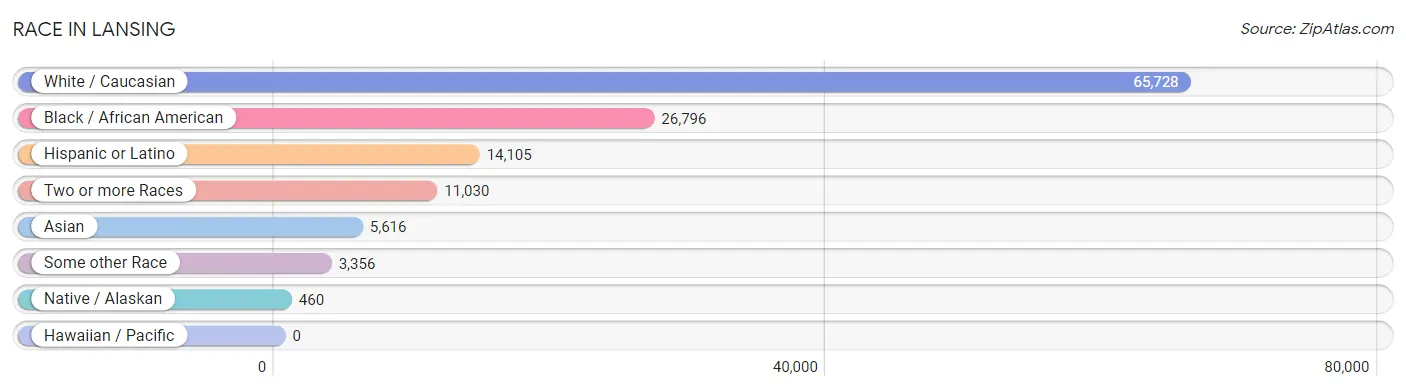
| Race | # Population | % Population |
| Asian | 5,616 | 5.0% |
| Black / African American | 26,796 | 23.7% |
| Hawaiian / Pacific | 0 | 0.0% |
| Hispanic or Latino | 14,105 | 12.5% |
| Native / Alaskan | 460 | 0.4% |
| White / Caucasian | 65,728 | 58.2% |
| Two or more Races | 11,030 | 9.8% |
| Some other Race | 3,356 | 3.0% |
| Total | 112,986 | 100.0% |
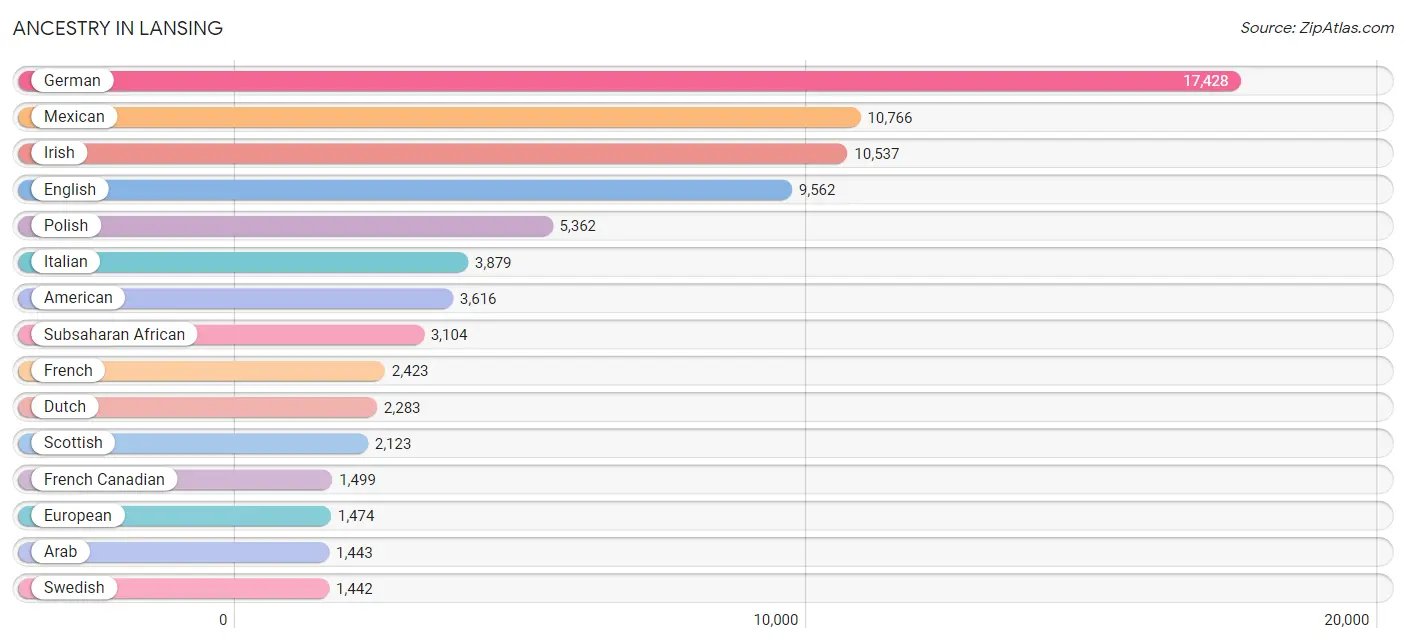
Ancestry in Lansing
The most populous ancestries reported in Lansing are German (17,428 | 15.4%), Mexican (10,766 | 9.5%), Irish (10,537 | 9.3%), English (9,562 | 8.5%), and Polish (5,362 | 4.8%), together accounting for 47.5% of all Lansing residents.
| Ancestry | # Population | % Population |
| Afghan | 91 | 0.1% |
| African | 1,266 | 1.1% |
| Albanian | 15 | 0.0% |
| Alsatian | 6 | 0.0% |
| American | 3,616 | 3.2% |
| Apache | 75 | 0.1% |
| Arab | 1,443 | 1.3% |
| Argentinean | 29 | 0.0% |
| Armenian | 39 | 0.0% |
| Austrian | 59 | 0.1% |
| Bangladeshi | 199 | 0.2% |
| Belgian | 255 | 0.2% |
| Belizean | 7 | 0.0% |
| Bhutanese | 246 | 0.2% |
| Blackfeet | 82 | 0.1% |
| Brazilian | 40 | 0.0% |
| British | 640 | 0.6% |
| British West Indian | 11 | 0.0% |
| Bulgarian | 14 | 0.0% |
| Burmese | 490 | 0.4% |
| Canadian | 218 | 0.2% |
| Central American | 284 | 0.3% |
| Central American Indian | 26 | 0.0% |
| Cherokee | 241 | 0.2% |
| Chickasaw | 5 | 0.0% |
| Chippewa | 305 | 0.3% |
| Choctaw | 56 | 0.1% |
| Colombian | 66 | 0.1% |
| Cree | 11 | 0.0% |
| Croatian | 144 | 0.1% |
| Cuban | 1,009 | 0.9% |
| Czech | 600 | 0.5% |
| Czechoslovakian | 82 | 0.1% |
| Danish | 293 | 0.3% |
| Dominican | 41 | 0.0% |
| Dutch | 2,283 | 2.0% |
| Eastern European | 114 | 0.1% |
| Ecuadorian | 60 | 0.1% |
| Egyptian | 111 | 0.1% |
| English | 9,562 | 8.5% |
| Ethiopian | 144 | 0.1% |
| European | 1,474 | 1.3% |
| Finnish | 490 | 0.4% |
| French | 2,423 | 2.1% |
| French American Indian | 16 | 0.0% |
| French Canadian | 1,499 | 1.3% |
| German | 17,428 | 15.4% |
| Ghanaian | 29 | 0.0% |
| Greek | 438 | 0.4% |
| Guatemalan | 77 | 0.1% |
| Haitian | 606 | 0.5% |
| Honduran | 85 | 0.1% |
| Hopi | 8 | 0.0% |
| Houma | 12 | 0.0% |
| Hungarian | 309 | 0.3% |
| Icelander | 13 | 0.0% |
| Indian (Asian) | 928 | 0.8% |
| Indonesian | 683 | 0.6% |
| Iranian | 56 | 0.1% |
| Iraqi | 276 | 0.2% |
| Irish | 10,537 | 9.3% |
| Iroquois | 88 | 0.1% |
| Israeli | 9 | 0.0% |
| Italian | 3,879 | 3.4% |
| Jamaican | 255 | 0.2% |
| Kenyan | 7 | 0.0% |
| Korean | 729 | 0.6% |
| Laotian | 16 | 0.0% |
| Latvian | 10 | 0.0% |
| Lebanese | 642 | 0.6% |
| Liberian | 25 | 0.0% |
| Lithuanian | 95 | 0.1% |
| Luxembourger | 20 | 0.0% |
| Macedonian | 12 | 0.0% |
| Malaysian | 107 | 0.1% |
| Maltese | 17 | 0.0% |
| Mexican | 10,766 | 9.5% |
| Mexican American Indian | 83 | 0.1% |
| Moroccan | 121 | 0.1% |
| Native Hawaiian | 141 | 0.1% |
| Navajo | 6 | 0.0% |
| Nigerian | 149 | 0.1% |
| Northern European | 63 | 0.1% |
| Norwegian | 686 | 0.6% |
| Ottawa | 103 | 0.1% |
| Pakistani | 191 | 0.2% |
| Palestinian | 28 | 0.0% |
| Panamanian | 96 | 0.1% |
| Pennsylvania German | 92 | 0.1% |
| Peruvian | 53 | 0.1% |
| Polish | 5,362 | 4.8% |
| Portuguese | 12 | 0.0% |
| Potawatomi | 97 | 0.1% |
| Puerto Rican | 783 | 0.7% |
| Romanian | 185 | 0.2% |
| Russian | 528 | 0.5% |
| Salvadoran | 26 | 0.0% |
| Samoan | 109 | 0.1% |
| Scandinavian | 307 | 0.3% |
| Scotch-Irish | 532 | 0.5% |
| Scottish | 2,123 | 1.9% |
| Serbian | 67 | 0.1% |
| Sioux | 137 | 0.1% |
| Slavic | 105 | 0.1% |
| Slovak | 135 | 0.1% |
| Slovene | 23 | 0.0% |
| Somali | 327 | 0.3% |
| South American | 278 | 0.3% |
| South American Indian | 10 | 0.0% |
| Spaniard | 168 | 0.2% |
| Spanish | 82 | 0.1% |
| Spanish American | 116 | 0.1% |
| Sri Lankan | 771 | 0.7% |
| Subsaharan African | 3,104 | 2.8% |
| Sudanese | 586 | 0.5% |
| Swedish | 1,442 | 1.3% |
| Swiss | 316 | 0.3% |
| Syrian | 44 | 0.0% |
| Thai | 911 | 0.8% |
| Trinidadian and Tobagonian | 15 | 0.0% |
| Turkish | 7 | 0.0% |
| Ugandan | 94 | 0.1% |
| Ukrainian | 175 | 0.2% |
| Uruguayan | 13 | 0.0% |
| Venezuelan | 57 | 0.1% |
| Vietnamese | 12 | 0.0% |
| Welsh | 783 | 0.7% |
| West Indian | 22 | 0.0% |
| Yugoslavian | 23 | 0.0% | View All 129 Rows |
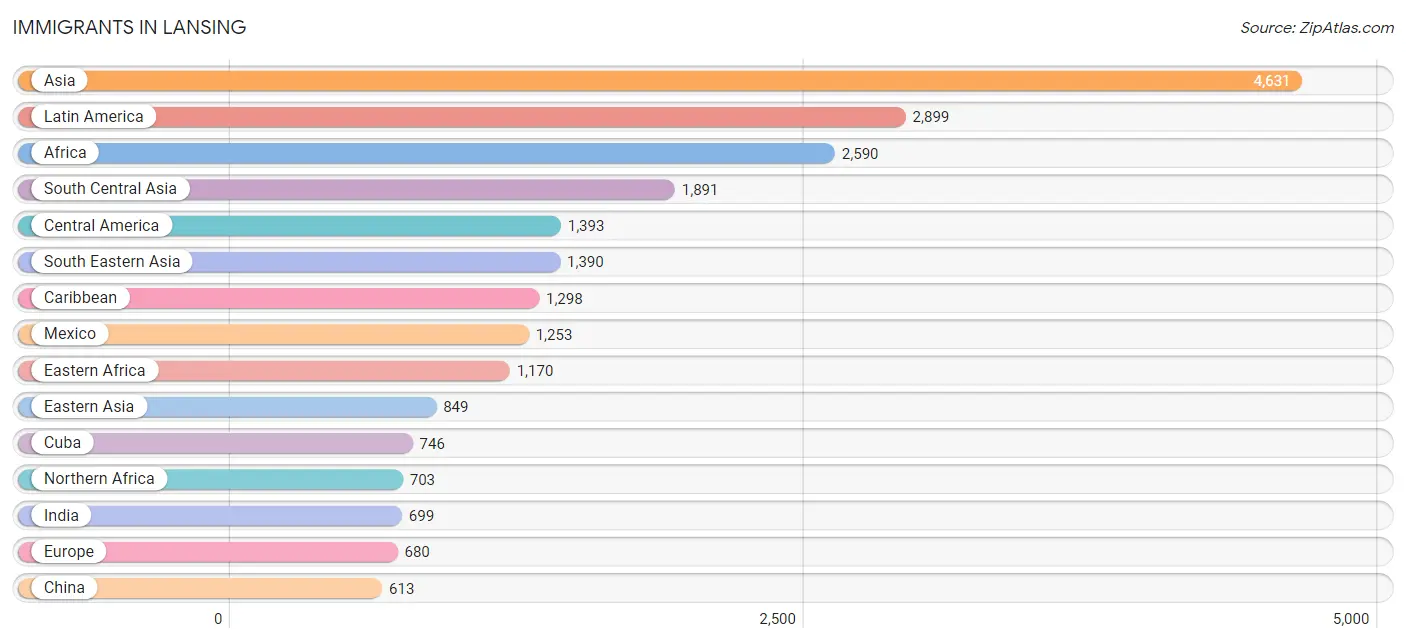
Immigrants in Lansing
The most numerous immigrant groups reported in Lansing came from Asia (4,631 | 4.1%), Latin America (2,899 | 2.6%), Africa (2,590 | 2.3%), South Central Asia (1,891 | 1.7%), and Central America (1,393 | 1.2%), together accounting for 11.9% of all Lansing residents.
| Immigration Origin | # Population | % Population |
| Afghanistan | 81 | 0.1% |
| Africa | 2,590 | 2.3% |
| Argentina | 6 | 0.0% |
| Armenia | 6 | 0.0% |
| Asia | 4,631 | 4.1% |
| Bangladesh | 12 | 0.0% |
| Belarus | 4 | 0.0% |
| Bosnia and Herzegovina | 34 | 0.0% |
| Brazil | 37 | 0.0% |
| Cambodia | 4 | 0.0% |
| Canada | 310 | 0.3% |
| Caribbean | 1,298 | 1.1% |
| Central America | 1,393 | 1.2% |
| China | 613 | 0.5% |
| Colombia | 49 | 0.0% |
| Congo | 54 | 0.1% |
| Cuba | 746 | 0.7% |
| Eastern Africa | 1,170 | 1.0% |
| Eastern Asia | 849 | 0.7% |
| Eastern Europe | 286 | 0.3% |
| Ecuador | 33 | 0.0% |
| El Salvador | 13 | 0.0% |
| England | 72 | 0.1% |
| Ethiopia | 40 | 0.0% |
| Europe | 680 | 0.6% |
| France | 55 | 0.1% |
| Germany | 109 | 0.1% |
| Ghana | 157 | 0.1% |
| Guatemala | 75 | 0.1% |
| Haiti | 495 | 0.4% |
| Honduras | 52 | 0.1% |
| Hong Kong | 22 | 0.0% |
| India | 699 | 0.6% |
| Indonesia | 18 | 0.0% |
| Iran | 81 | 0.1% |
| Iraq | 303 | 0.3% |
| Ireland | 13 | 0.0% |
| Israel | 9 | 0.0% |
| Italy | 7 | 0.0% |
| Jamaica | 42 | 0.0% |
| Japan | 7 | 0.0% |
| Kenya | 124 | 0.1% |
| Korea | 229 | 0.2% |
| Laos | 47 | 0.0% |
| Latin America | 2,899 | 2.6% |
| Lebanon | 137 | 0.1% |
| Liberia | 52 | 0.1% |
| Mexico | 1,253 | 1.1% |
| Micronesia | 7 | 0.0% |
| Middle Africa | 313 | 0.3% |
| Morocco | 96 | 0.1% |
| Nepal | 609 | 0.5% |
| Netherlands | 12 | 0.0% |
| Nigeria | 67 | 0.1% |
| Northern Africa | 703 | 0.6% |
| Northern Europe | 165 | 0.2% |
| Oceania | 7 | 0.0% |
| Pakistan | 90 | 0.1% |
| Peru | 13 | 0.0% |
| Philippines | 248 | 0.2% |
| Poland | 14 | 0.0% |
| Romania | 64 | 0.1% |
| Russia | 124 | 0.1% |
| Senegal | 39 | 0.0% |
| Singapore | 5 | 0.0% |
| Somalia | 427 | 0.4% |
| South America | 208 | 0.2% |
| South Central Asia | 1,891 | 1.7% |
| South Eastern Asia | 1,390 | 1.2% |
| Southern Europe | 53 | 0.1% |
| Spain | 39 | 0.0% |
| Sri Lanka | 83 | 0.1% |
| Sudan | 607 | 0.5% |
| Thailand | 202 | 0.2% |
| Trinidad and Tobago | 15 | 0.0% |
| Turkey | 7 | 0.0% |
| Uganda | 94 | 0.1% |
| Ukraine | 29 | 0.0% |
| Uruguay | 13 | 0.0% |
| Venezuela | 57 | 0.1% |
| Vietnam | 473 | 0.4% |
| Western Africa | 315 | 0.3% |
| Western Asia | 489 | 0.4% |
| Western Europe | 176 | 0.2% |
| Zaire | 122 | 0.1% | View All 85 Rows |
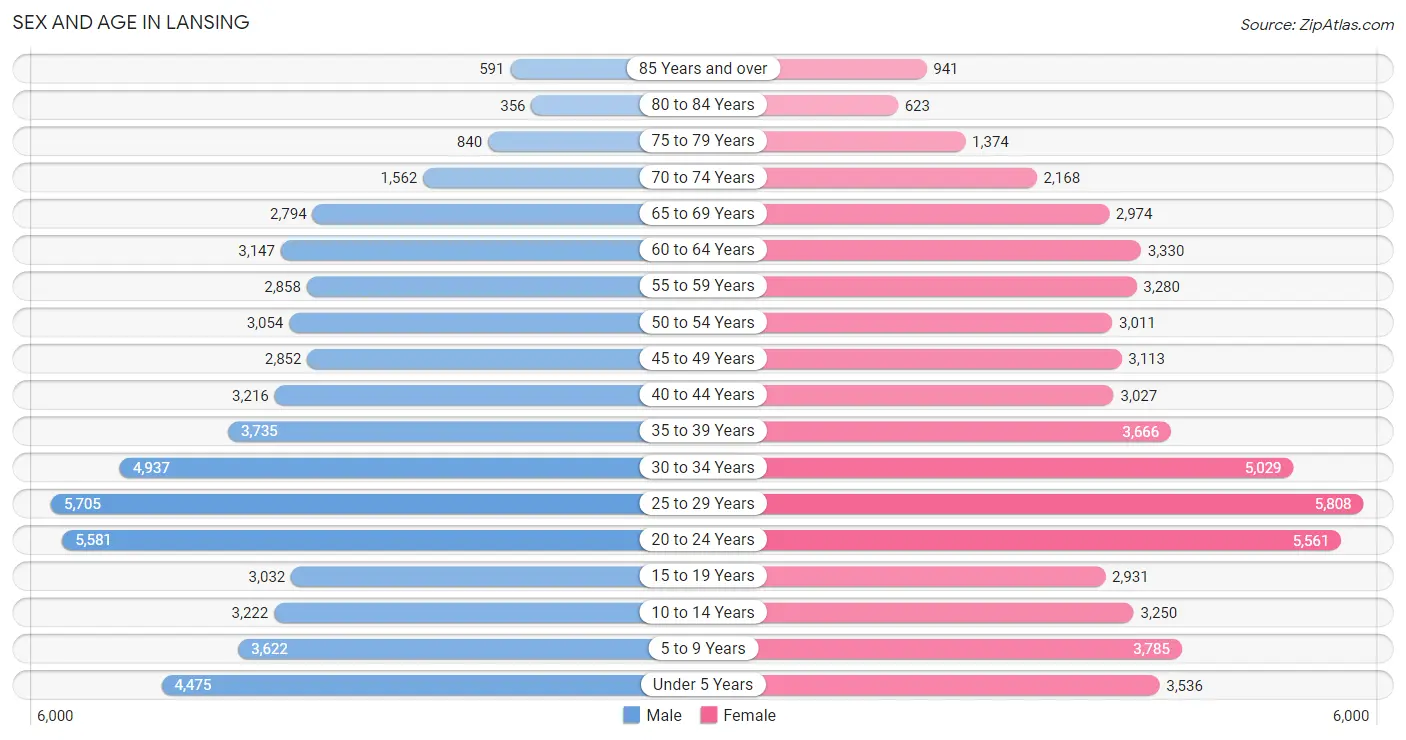
Sex and Age in Lansing
Sex and Age in Lansing
The most populous age groups in Lansing are 25 to 29 Years (5,705 | 10.3%) for men and 25 to 29 Years (5,808 | 10.1%) for women.
| Age Bracket | Male | Female |
| Under 5 Years | 4,475 (8.1%) | 3,536 (6.2%) |
| 5 to 9 Years | 3,622 (6.5%) | 3,785 (6.6%) |
| 10 to 14 Years | 3,222 (5.8%) | 3,250 (5.7%) |
| 15 to 19 Years | 3,032 (5.5%) | 2,931 (5.1%) |
| 20 to 24 Years | 5,581 (10.0%) | 5,561 (9.7%) |
| 25 to 29 Years | 5,705 (10.3%) | 5,808 (10.1%) |
| 30 to 34 Years | 4,937 (8.9%) | 5,029 (8.8%) |
| 35 to 39 Years | 3,735 (6.7%) | 3,666 (6.4%) |
| 40 to 44 Years | 3,216 (5.8%) | 3,027 (5.3%) |
| 45 to 49 Years | 2,852 (5.1%) | 3,113 (5.4%) |
| 50 to 54 Years | 3,054 (5.5%) | 3,011 (5.2%) |
| 55 to 59 Years | 2,858 (5.1%) | 3,280 (5.7%) |
| 60 to 64 Years | 3,147 (5.7%) | 3,330 (5.8%) |
| 65 to 69 Years | 2,794 (5.0%) | 2,974 (5.2%) |
| 70 to 74 Years | 1,562 (2.8%) | 2,168 (3.8%) |
| 75 to 79 Years | 840 (1.5%) | 1,374 (2.4%) |
| 80 to 84 Years | 356 (0.6%) | 623 (1.1%) |
| 85 Years and over | 591 (1.1%) | 941 (1.6%) |
| Total | 55,579 (100.0%) | 57,407 (100.0%) |
Families and Households in Lansing
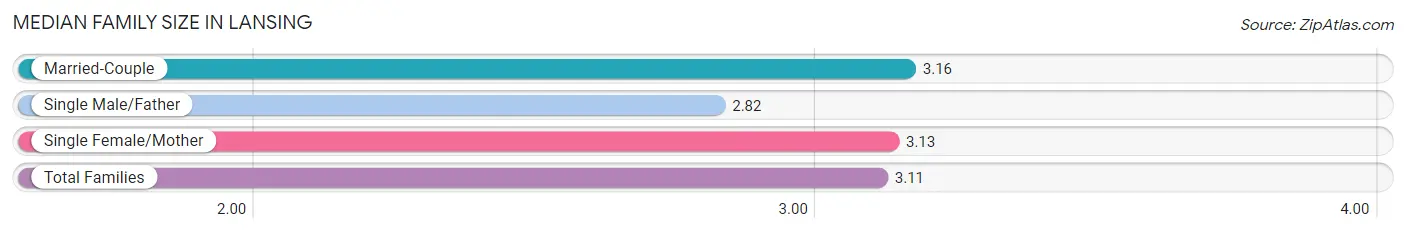
Median Family Size in Lansing
The median family size in Lansing is 3.11 persons per family, with married-couple families (14,521 | 59.6%) accounting for the largest median family size of 3.16 persons per family. On the other hand, single male/father families (2,878 | 11.8%) represent the smallest median family size with 2.82 persons per family.
| Family Type | # Families | Family Size |
| Married-Couple | 14,521 (59.6%) | 3.16 |
| Single Male/Father | 2,878 (11.8%) | 2.82 |
| Single Female/Mother | 6,961 (28.6%) | 3.13 |
| Total Families | 24,360 (100.0%) | 3.11 |
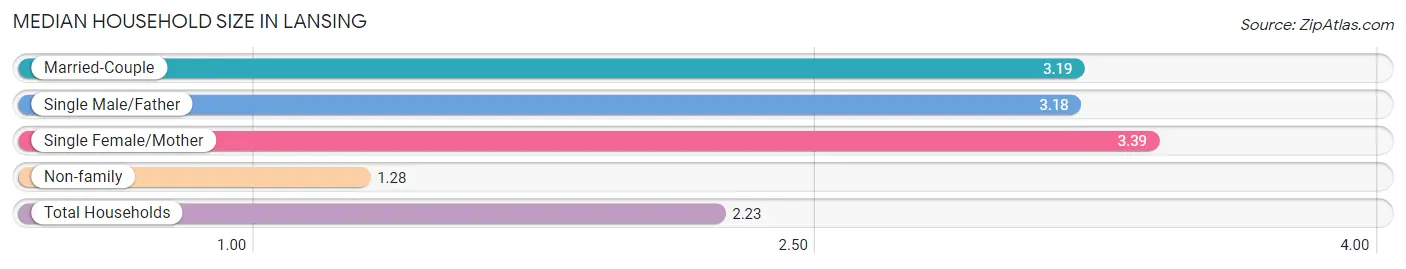
Median Household Size in Lansing
The median household size in Lansing is 2.23 persons per household, with single female/mother households (6,961 | 13.9%) accounting for the largest median household size of 3.39 persons per household. non-family households (25,777 | 51.4%) represent the smallest median household size with 1.28 persons per household.
| Household Type | # Households | Household Size |
| Married-Couple | 14,521 (29.0%) | 3.19 |
| Single Male/Father | 2,878 (5.7%) | 3.18 |
| Single Female/Mother | 6,961 (13.9%) | 3.39 |
| Non-family | 25,777 (51.4%) | 1.28 |
| Total Households | 50,137 (100.0%) | 2.23 |
Household Size by Marriage Status in Lansing
Out of a total of 50,137 households in Lansing, 24,360 (48.6%) are family households, while 25,777 (51.4%) are nonfamily households. The most numerous type of family households are 2-person households, comprising 11,226, and the most common type of nonfamily households are 1-person households, comprising 20,579.
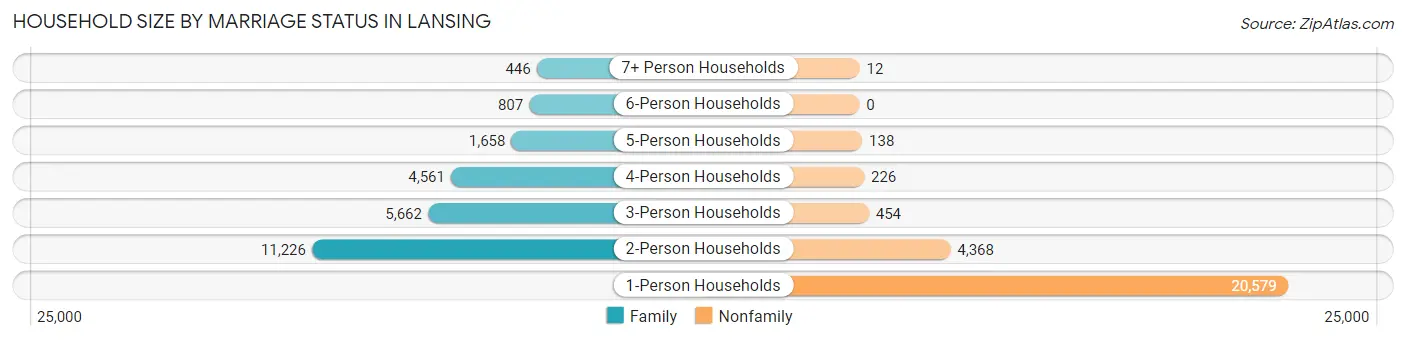
| Household Size | Family Households | Nonfamily Households |
| 1-Person Households | - | 20,579 (41.0%) |
| 2-Person Households | 11,226 (22.4%) | 4,368 (8.7%) |
| 3-Person Households | 5,662 (11.3%) | 454 (0.9%) |
| 4-Person Households | 4,561 (9.1%) | 226 (0.4%) |
| 5-Person Households | 1,658 (3.3%) | 138 (0.3%) |
| 6-Person Households | 807 (1.6%) | 0 (0.0%) |
| 7+ Person Households | 446 (0.9%) | 12 (0.0%) |
| Total | 24,360 (48.6%) | 25,777 (51.4%) |
Female Fertility in Lansing
Fertility by Age in Lansing
Average fertility rate in Lansing is 47.0 births per 1,000 women. Women in the age bracket of 20 to 34 years have the highest fertility rate with 61.0 births per 1,000 women. Women in the age bracket of 20 to 34 years acount for 71.3% of all women with births.
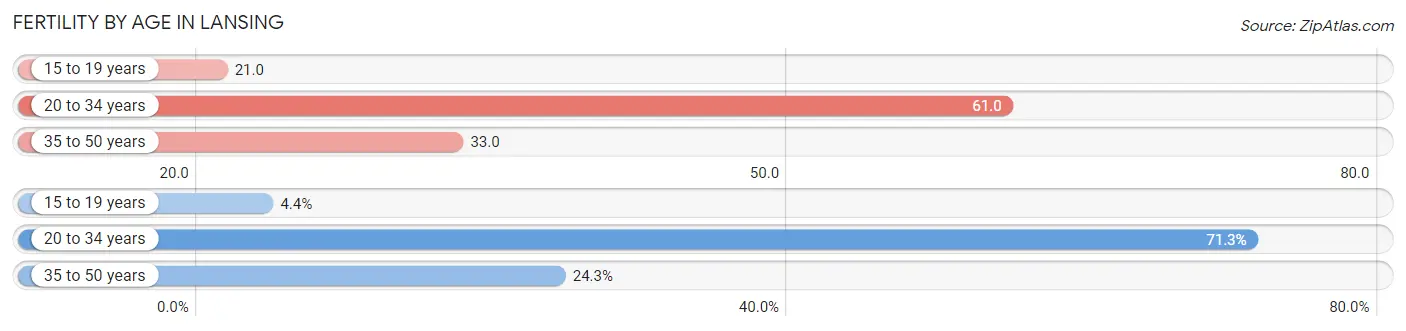
| Age Bracket | Women with Births | Births / 1,000 Women |
| 15 to 19 years | 62 (4.4%) | 21.0 |
| 20 to 34 years | 995 (71.3%) | 61.0 |
| 35 to 50 years | 339 (24.3%) | 33.0 |
| Total | 1,396 (100.0%) | 47.0 |
Fertility by Age by Marriage Status in Lansing
62.3% of women with births (1,396) in Lansing are married. The highest percentage of unmarried women with births falls into 15 to 19 years age bracket with 100.0% of them unmarried at the time of birth, while the lowest percentage of unmarried women with births belong to 35 to 50 years age bracket with 33.0% of them unmarried.
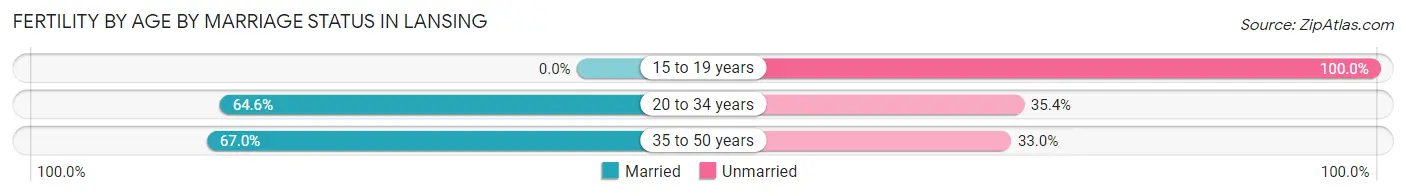
| Age Bracket | Married | Unmarried |
| 15 to 19 years | 0 (0.0%) | 62 (100.0%) |
| 20 to 34 years | 643 (64.6%) | 352 (35.4%) |
| 35 to 50 years | 227 (67.0%) | 112 (33.0%) |
| Total | 870 (62.3%) | 526 (37.7%) |
Fertility by Education in Lansing
Average fertility rate in Lansing is 47.0 births per 1,000 women. Women with the education attainment of less than high school have the highest fertility rate of 64.0 births per 1,000 women, while women with the education attainment of graduate degree have the lowest fertility at 31.0 births per 1,000 women. Women with the education attainment of college or associate's degree represent 39.0% of all women with births.
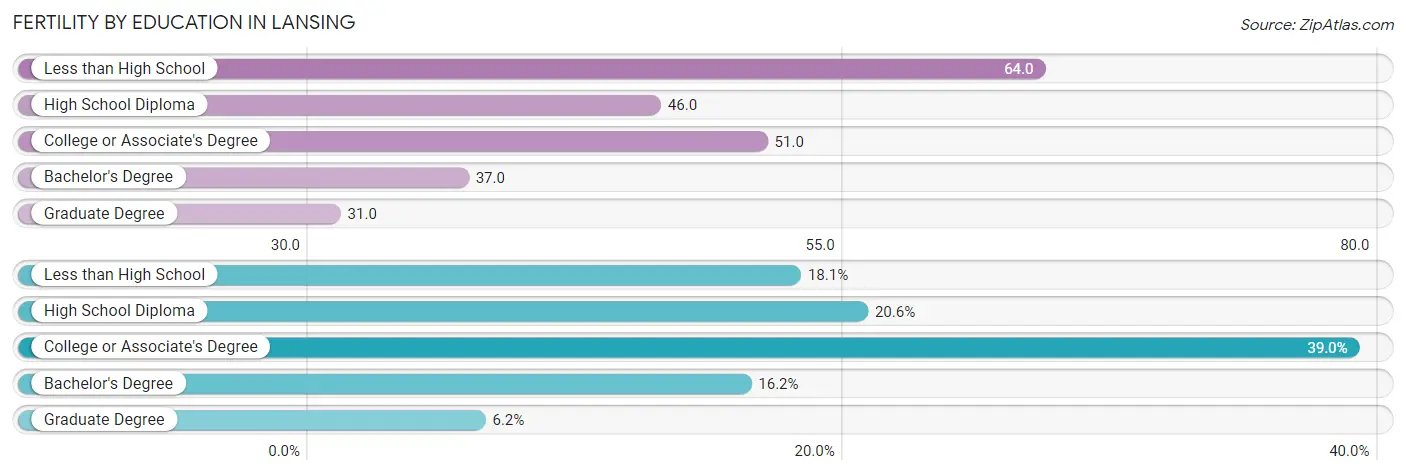
| Educational Attainment | Women with Births | Births / 1,000 Women |
| Less than High School | 252 (18.0%) | 64.0 |
| High School Diploma | 287 (20.6%) | 46.0 |
| College or Associate's Degree | 544 (39.0%) | 51.0 |
| Bachelor's Degree | 226 (16.2%) | 37.0 |
| Graduate Degree | 87 (6.2%) | 31.0 |
| Total | 1,396 (100.0%) | 47.0 |
Fertility by Education by Marriage Status in Lansing
37.7% of women with births in Lansing are unmarried. Women with the educational attainment of graduate degree are most likely to be married with 100.0% of them married at childbirth, while women with the educational attainment of less than high school are least likely to be married with 56.8% of them unmarried at childbirth.
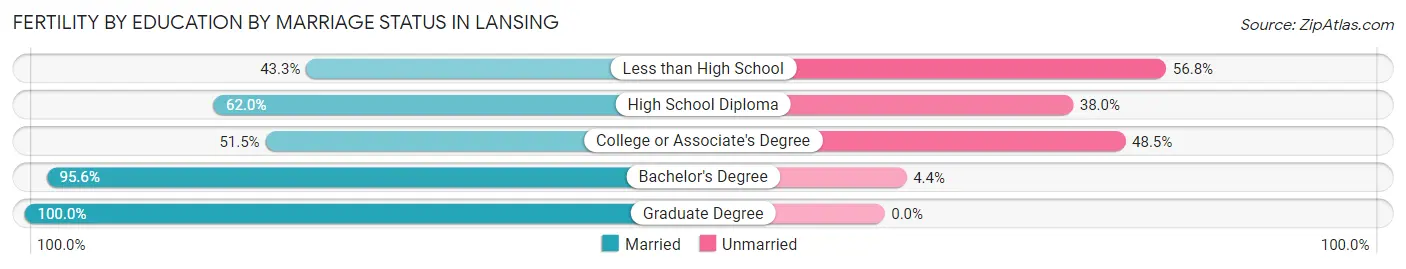
| Educational Attainment | Married | Unmarried |
| Less than High School | 109 (43.2%) | 143 (56.8%) |
| High School Diploma | 178 (62.0%) | 109 (38.0%) |
| College or Associate's Degree | 280 (51.5%) | 264 (48.5%) |
| Bachelor's Degree | 216 (95.6%) | 10 (4.4%) |
| Graduate Degree | 87 (100.0%) | 0 (0.0%) |
| Total | 870 (62.3%) | 526 (37.7%) |
Employment Characteristics in Lansing
Employment by Class of Employer in Lansing
Among the 54,239 employed individuals in Lansing, private company employees (34,356 | 63.3%), not-for-profit organizations (6,594 | 12.2%), and state government employees (6,380 | 11.8%) make up the most common classes of employment.
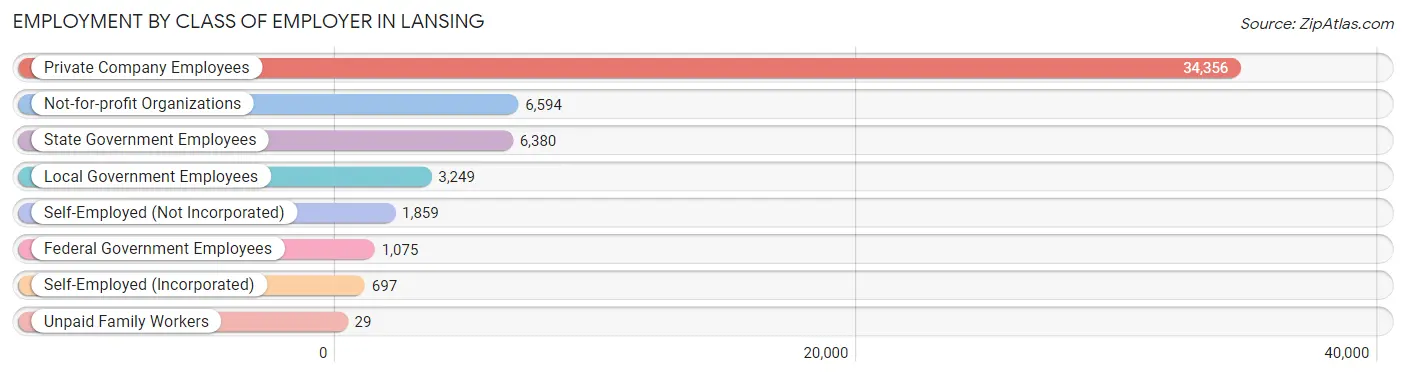
| Employer Class | # Employees | % Employees |
| Private Company Employees | 34,356 | 63.3% |
| Self-Employed (Incorporated) | 697 | 1.3% |
| Self-Employed (Not Incorporated) | 1,859 | 3.4% |
| Not-for-profit Organizations | 6,594 | 12.2% |
| Local Government Employees | 3,249 | 6.0% |
| State Government Employees | 6,380 | 11.8% |
| Federal Government Employees | 1,075 | 2.0% |
| Unpaid Family Workers | 29 | 0.1% |
| Total | 54,239 | 100.0% |
Employment Status by Age in Lansing
According to the labor force statistics for Lansing, out of the total population over 16 years of age (90,023), 67.5% or 60,766 individuals are in the labor force, with 8.3% or 5,044 of them unemployed. The age group with the highest labor force participation rate is 30 to 34 years, with 85.4% or 8,511 individuals in the labor force. Within the labor force, the 16 to 19 years age range has the highest percentage of unemployed individuals, with 38.4% or 943 of them being unemployed.
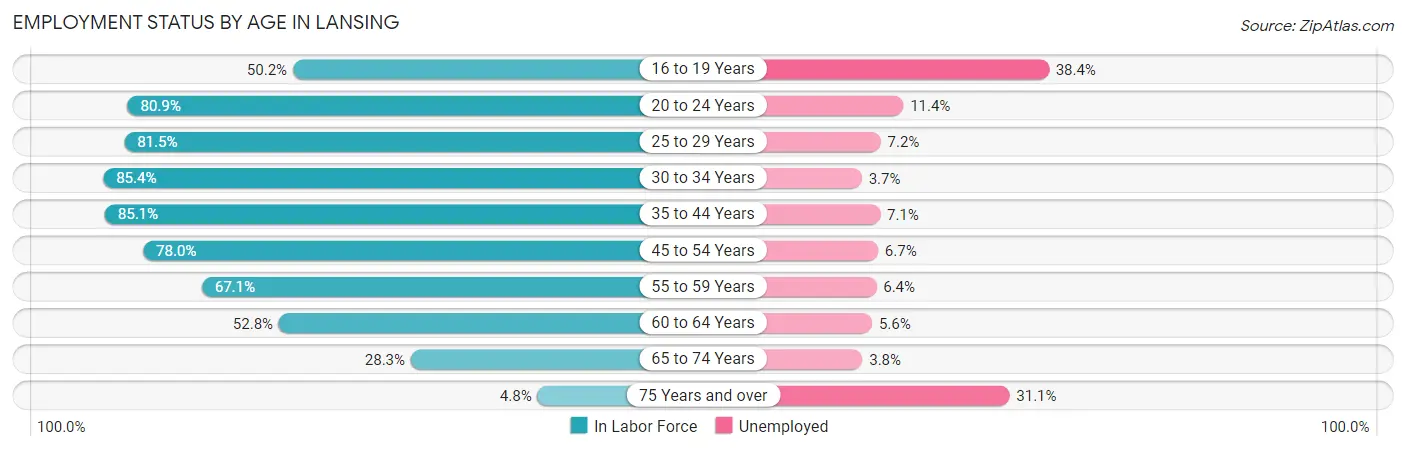
| Age Bracket | In Labor Force | Unemployed |
| 16 to 19 Years | 2,455 (50.2%) | 943 (38.4%) |
| 20 to 24 Years | 9,014 (80.9%) | 1,028 (11.4%) |
| 25 to 29 Years | 9,383 (81.5%) | 676 (7.2%) |
| 30 to 34 Years | 8,511 (85.4%) | 315 (3.7%) |
| 35 to 44 Years | 11,611 (85.1%) | 824 (7.1%) |
| 45 to 54 Years | 9,383 (78.0%) | 629 (6.7%) |
| 55 to 59 Years | 4,119 (67.1%) | 264 (6.4%) |
| 60 to 64 Years | 3,420 (52.8%) | 192 (5.6%) |
| 65 to 74 Years | 2,688 (28.3%) | 102 (3.8%) |
| 75 Years and over | 227 (4.8%) | 71 (31.1%) |
| Total | 60,766 (67.5%) | 5,044 (8.3%) |
Employment Status by Educational Attainment in Lansing
According to labor force statistics for Lansing, 77.7% of individuals (46,440) out of the total population between 25 and 64 years of age (59,768) are in the labor force, with 6.2% or 2,879 of them being unemployed. The group with the highest labor force participation rate are those with the educational attainment of bachelor's degree or higher, with 87.1% or 15,770 individuals in the labor force. Within the labor force, individuals with less than high school education have the highest percentage of unemployment, with 13.1% or 396 of them being unemployed.
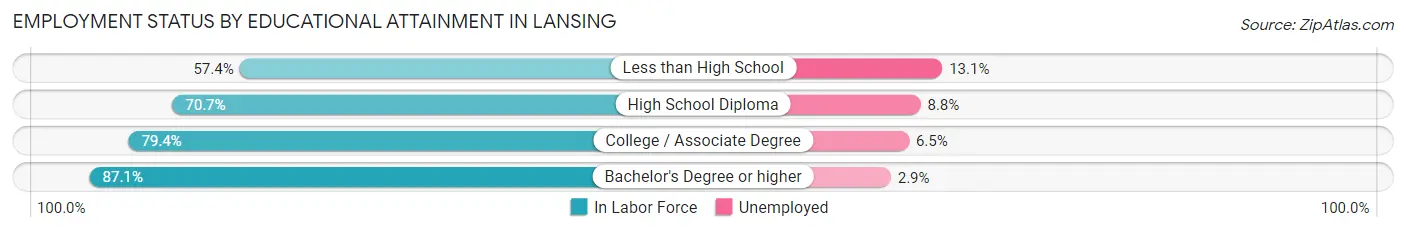
| Educational Attainment | In Labor Force | Unemployed |
| Less than High School | 3,023 (57.4%) | 690 (13.1%) |
| High School Diploma | 10,365 (70.7%) | 1,290 (8.8%) |
| College / Associate Degree | 17,257 (79.4%) | 1,413 (6.5%) |
| Bachelor's Degree or higher | 15,770 (87.1%) | 525 (2.9%) |
| Total | 46,440 (77.7%) | 3,706 (6.2%) |
Employment Occupations by Sex in Lansing
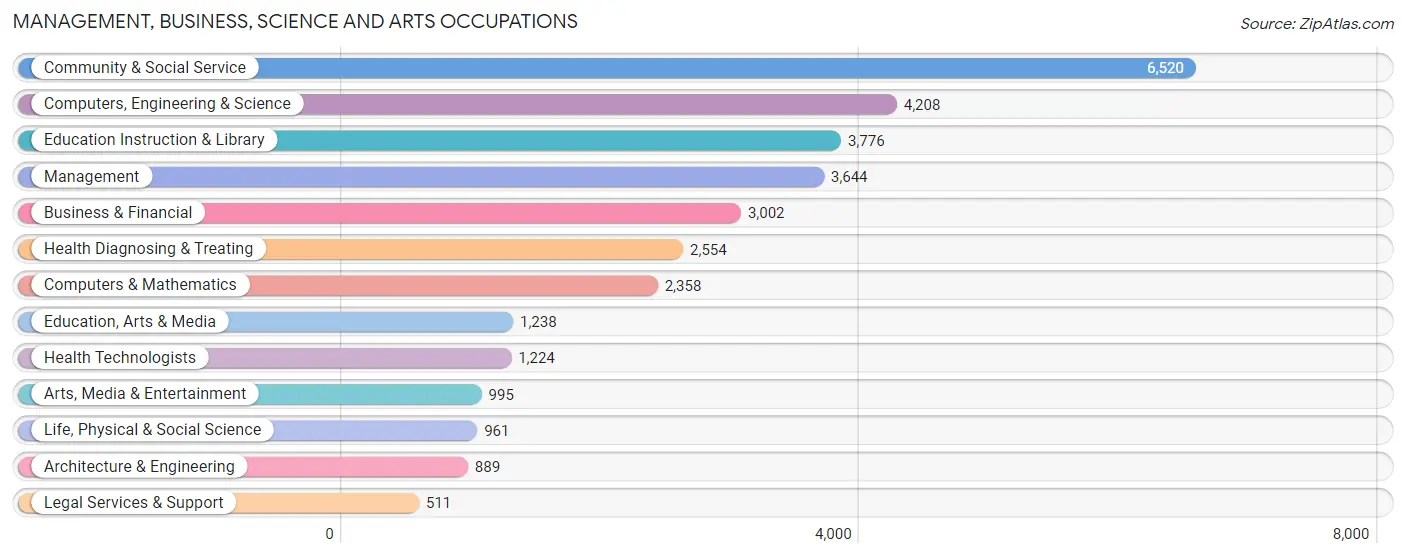
Management, Business, Science and Arts Occupations
The most common Management, Business, Science and Arts occupations in Lansing are Community & Social Service (6,520 | 11.7%), Computers, Engineering & Science (4,208 | 7.5%), Education Instruction & Library (3,776 | 6.8%), Management (3,644 | 6.5%), and Business & Financial (3,002 | 5.4%).
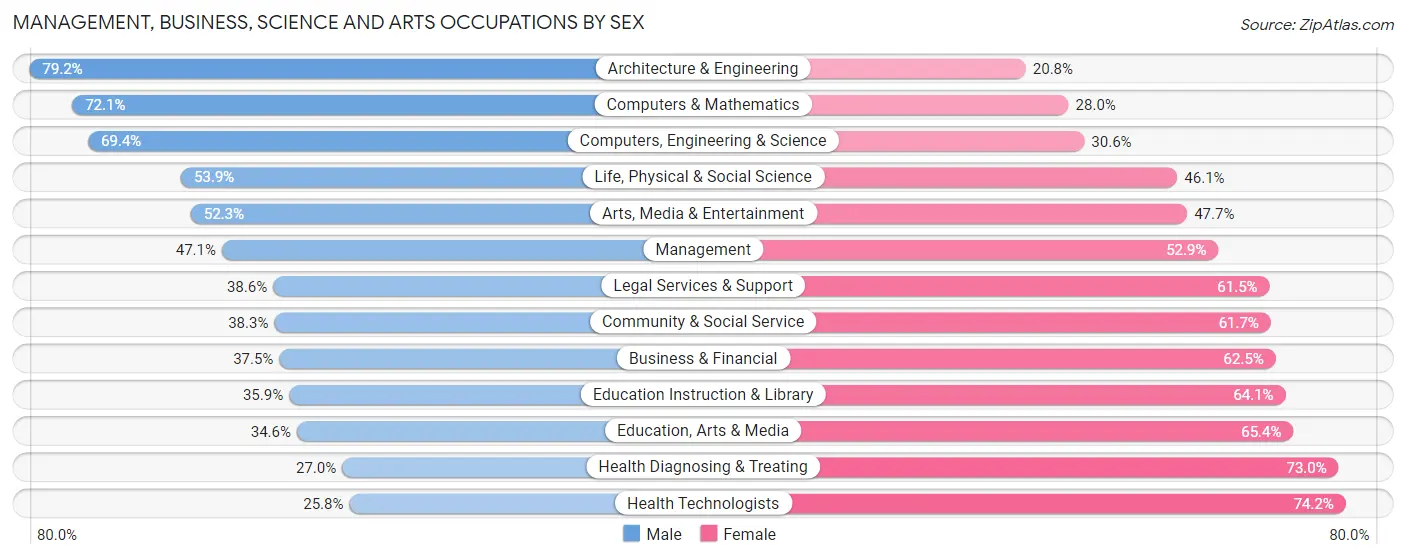
Management, Business, Science and Arts Occupations by Sex
Within the Management, Business, Science and Arts occupations in Lansing, the most male-oriented occupations are Architecture & Engineering (79.2%), Computers & Mathematics (72.1%), and Computers, Engineering & Science (69.4%), while the most female-oriented occupations are Health Technologists (74.2%), Health Diagnosing & Treating (73.0%), and Education, Arts & Media (65.4%).
| Occupation | Male | Female |
| Management | 1,716 (47.1%) | 1,928 (52.9%) |
| Business & Financial | 1,126 (37.5%) | 1,876 (62.5%) |
| Computers, Engineering & Science | 2,921 (69.4%) | 1,287 (30.6%) |
| Computers & Mathematics | 1,699 (72.1%) | 659 (28.0%) |
| Architecture & Engineering | 704 (79.2%) | 185 (20.8%) |
| Life, Physical & Social Science | 518 (53.9%) | 443 (46.1%) |
| Community & Social Service | 2,500 (38.3%) | 4,020 (61.7%) |
| Education, Arts & Media | 428 (34.6%) | 810 (65.4%) |
| Legal Services & Support | 197 (38.6%) | 314 (61.5%) |
| Education Instruction & Library | 1,355 (35.9%) | 2,421 (64.1%) |
| Arts, Media & Entertainment | 520 (52.3%) | 475 (47.7%) |
| Health Diagnosing & Treating | 690 (27.0%) | 1,864 (73.0%) |
| Health Technologists | 316 (25.8%) | 908 (74.2%) |
| Total (Category) | 8,953 (44.9%) | 10,975 (55.1%) |
| Total (Overall) | 27,779 (49.8%) | 27,965 (50.2%) |
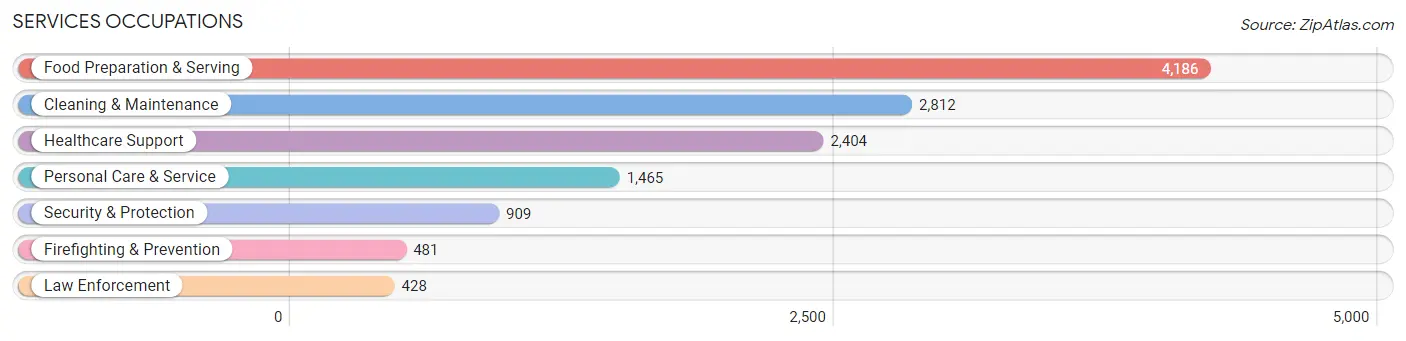
Services Occupations
The most common Services occupations in Lansing are Food Preparation & Serving (4,186 | 7.5%), Cleaning & Maintenance (2,812 | 5.0%), Healthcare Support (2,404 | 4.3%), Personal Care & Service (1,465 | 2.6%), and Security & Protection (909 | 1.6%).
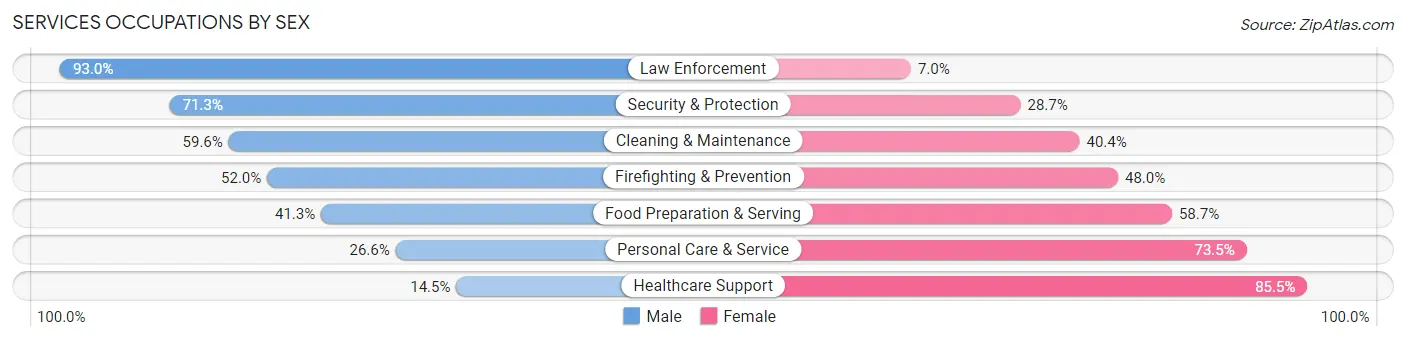
Services Occupations by Sex
Within the Services occupations in Lansing, the most male-oriented occupations are Law Enforcement (93.0%), Security & Protection (71.3%), and Cleaning & Maintenance (59.6%), while the most female-oriented occupations are Healthcare Support (85.5%), Personal Care & Service (73.5%), and Food Preparation & Serving (58.7%).
| Occupation | Male | Female |
| Healthcare Support | 349 (14.5%) | 2,055 (85.5%) |
| Security & Protection | 648 (71.3%) | 261 (28.7%) |
| Firefighting & Prevention | 250 (52.0%) | 231 (48.0%) |
| Law Enforcement | 398 (93.0%) | 30 (7.0%) |
| Food Preparation & Serving | 1,729 (41.3%) | 2,457 (58.7%) |
| Cleaning & Maintenance | 1,676 (59.6%) | 1,136 (40.4%) |
| Personal Care & Service | 389 (26.6%) | 1,076 (73.5%) |
| Total (Category) | 4,791 (40.7%) | 6,985 (59.3%) |
| Total (Overall) | 27,779 (49.8%) | 27,965 (50.2%) |
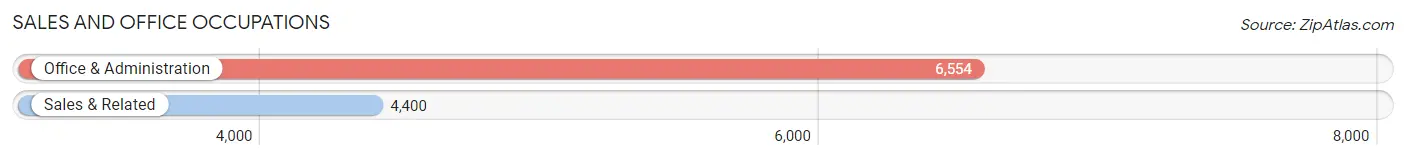
Sales and Office Occupations
The most common Sales and Office occupations in Lansing are Office & Administration (6,554 | 11.8%), and Sales & Related (4,400 | 7.9%).
Sales and Office Occupations by Sex
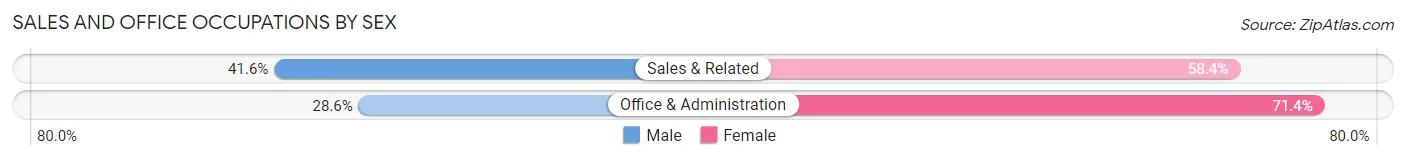
| Occupation | Male | Female |
| Sales & Related | 1,831 (41.6%) | 2,569 (58.4%) |
| Office & Administration | 1,875 (28.6%) | 4,679 (71.4%) |
| Total (Category) | 3,706 (33.8%) | 7,248 (66.2%) |
| Total (Overall) | 27,779 (49.8%) | 27,965 (50.2%) |
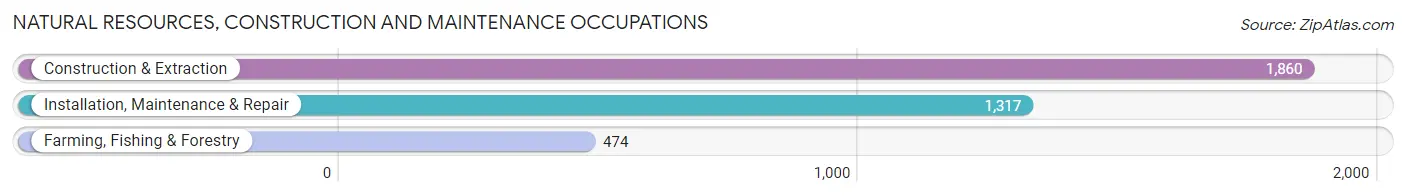
Natural Resources, Construction and Maintenance Occupations
The most common Natural Resources, Construction and Maintenance occupations in Lansing are Construction & Extraction (1,860 | 3.3%), Installation, Maintenance & Repair (1,317 | 2.4%), and Farming, Fishing & Forestry (474 | 0.9%).
Natural Resources, Construction and Maintenance Occupations by Sex
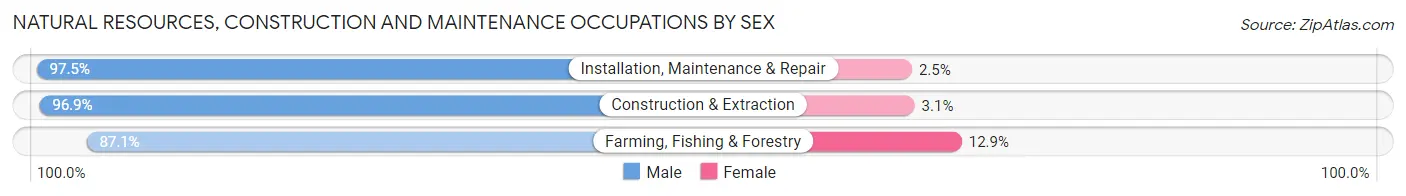
| Occupation | Male | Female |
| Farming, Fishing & Forestry | 413 (87.1%) | 61 (12.9%) |
| Construction & Extraction | 1,803 (96.9%) | 57 (3.1%) |
| Installation, Maintenance & Repair | 1,284 (97.5%) | 33 (2.5%) |
| Total (Category) | 3,500 (95.9%) | 151 (4.1%) |
| Total (Overall) | 27,779 (49.8%) | 27,965 (50.2%) |
Production, Transportation and Moving Occupations
The most common Production, Transportation and Moving occupations in Lansing are Production (4,183 | 7.5%), Material Moving (2,981 | 5.3%), and Transportation (2,271 | 4.1%).

Production, Transportation and Moving Occupations by Sex
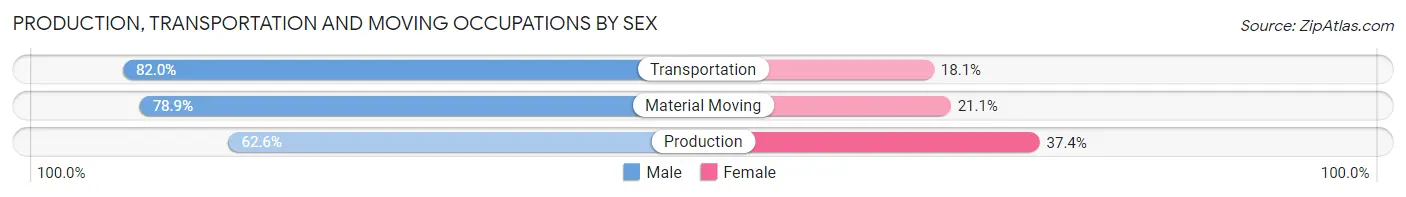
| Occupation | Male | Female |
| Production | 2,617 (62.6%) | 1,566 (37.4%) |
| Transportation | 1,861 (82.0%) | 410 (18.0%) |
| Material Moving | 2,351 (78.9%) | 630 (21.1%) |
| Total (Category) | 6,829 (72.4%) | 2,606 (27.6%) |
| Total (Overall) | 27,779 (49.8%) | 27,965 (50.2%) |
Employment Industries by Sex in Lansing
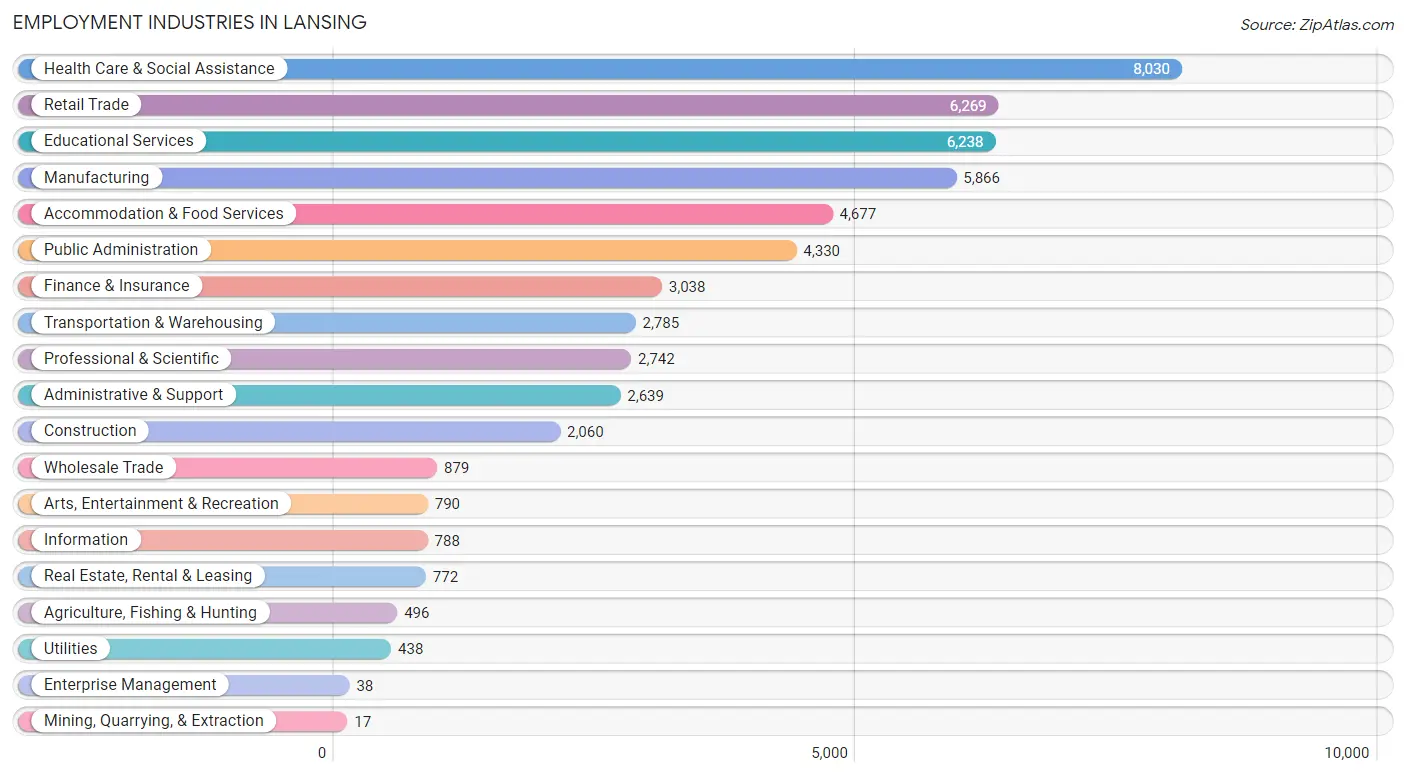
Employment Industries in Lansing
The major employment industries in Lansing include Health Care & Social Assistance (8,030 | 14.4%), Retail Trade (6,269 | 11.3%), Educational Services (6,238 | 11.2%), Manufacturing (5,866 | 10.5%), and Accommodation & Food Services (4,677 | 8.4%).
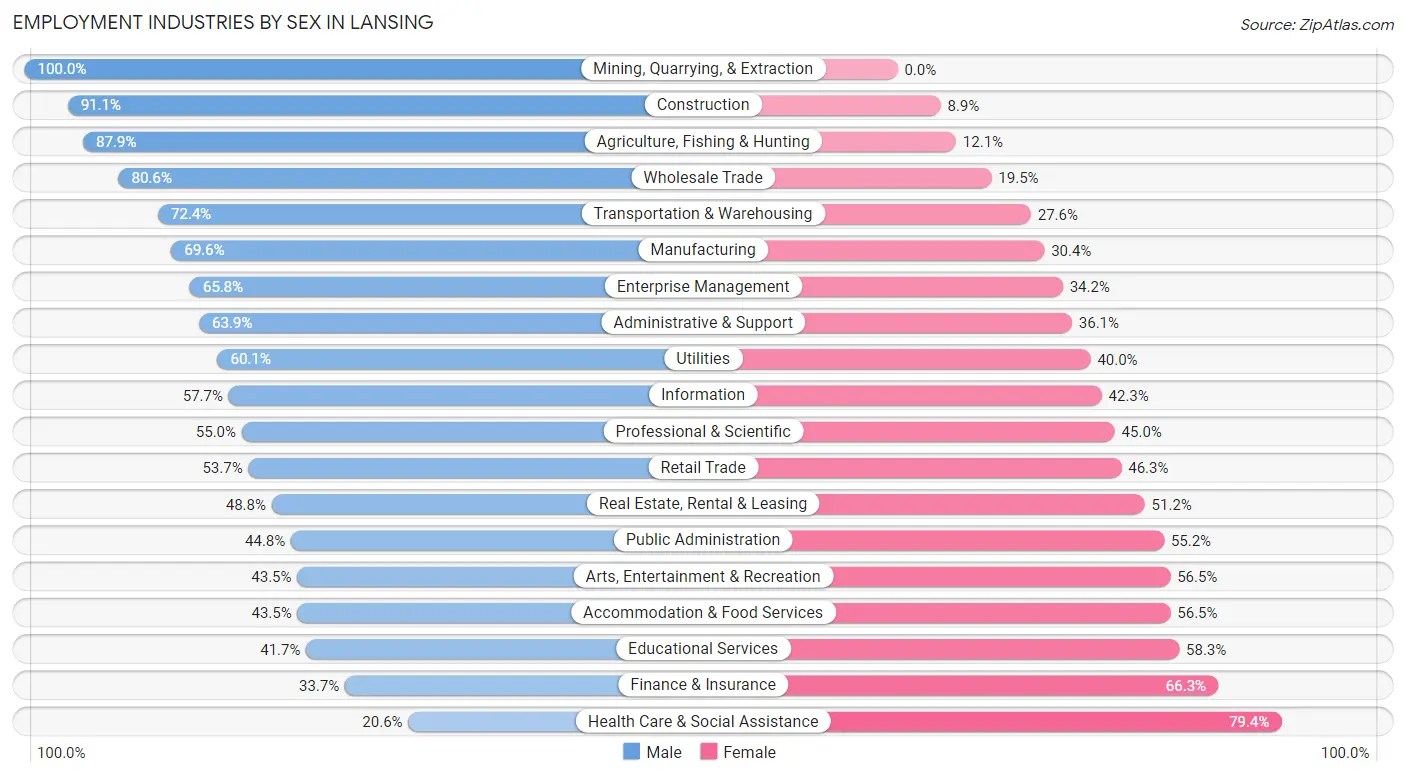
Employment Industries by Sex in Lansing
The Lansing industries that see more men than women are Mining, Quarrying, & Extraction (100.0%), Construction (91.1%), and Agriculture, Fishing & Hunting (87.9%), whereas the industries that tend to have a higher number of women are Health Care & Social Assistance (79.4%), Finance & Insurance (66.3%), and Educational Services (58.3%).
| Industry | Male | Female |
| Agriculture, Fishing & Hunting | 436 (87.9%) | 60 (12.1%) |
| Mining, Quarrying, & Extraction | 17 (100.0%) | 0 (0.0%) |
| Construction | 1,876 (91.1%) | 184 (8.9%) |
| Manufacturing | 4,084 (69.6%) | 1,782 (30.4%) |
| Wholesale Trade | 708 (80.5%) | 171 (19.5%) |
| Retail Trade | 3,364 (53.7%) | 2,905 (46.3%) |
| Transportation & Warehousing | 2,016 (72.4%) | 769 (27.6%) |
| Utilities | 263 (60.1%) | 175 (40.0%) |
| Information | 455 (57.7%) | 333 (42.3%) |
| Finance & Insurance | 1,023 (33.7%) | 2,015 (66.3%) |
| Real Estate, Rental & Leasing | 377 (48.8%) | 395 (51.2%) |
| Professional & Scientific | 1,509 (55.0%) | 1,233 (45.0%) |
| Enterprise Management | 25 (65.8%) | 13 (34.2%) |
| Administrative & Support | 1,686 (63.9%) | 953 (36.1%) |
| Educational Services | 2,601 (41.7%) | 3,637 (58.3%) |
| Health Care & Social Assistance | 1,651 (20.6%) | 6,379 (79.4%) |
| Arts, Entertainment & Recreation | 344 (43.5%) | 446 (56.5%) |
| Accommodation & Food Services | 2,035 (43.5%) | 2,642 (56.5%) |
| Public Administration | 1,941 (44.8%) | 2,389 (55.2%) |
| Total | 27,779 (49.8%) | 27,965 (50.2%) |
Education in Lansing
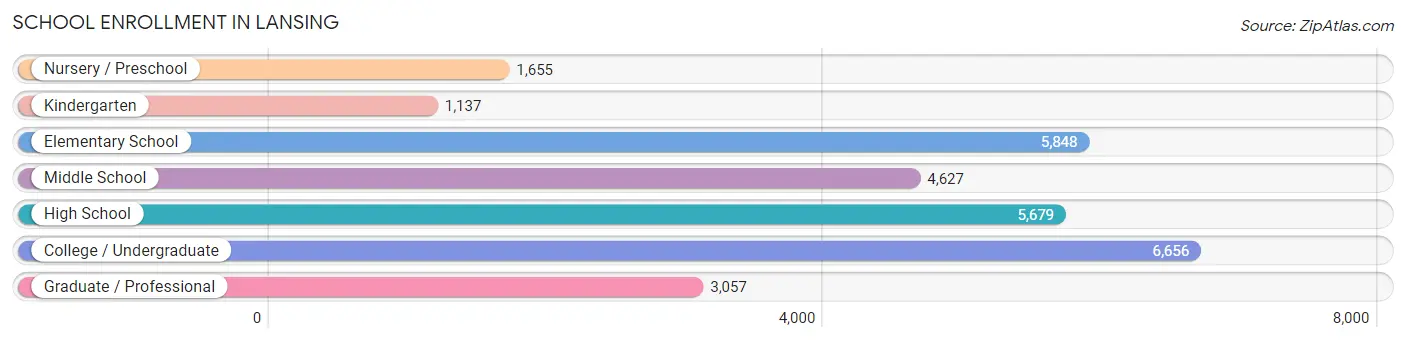
School Enrollment in Lansing
The most common levels of schooling among the 28,659 students in Lansing are college / undergraduate (6,656 | 23.2%), elementary school (5,848 | 20.4%), and high school (5,679 | 19.8%).
| School Level | # Students | % Students |
| Nursery / Preschool | 1,655 | 5.8% |
| Kindergarten | 1,137 | 4.0% |
| Elementary School | 5,848 | 20.4% |
| Middle School | 4,627 | 16.2% |
| High School | 5,679 | 19.8% |
| College / Undergraduate | 6,656 | 23.2% |
| Graduate / Professional | 3,057 | 10.7% |
| Total | 28,659 | 100.0% |
School Enrollment by Age by Funding Source in Lansing
Out of a total of 28,659 students who are enrolled in schools in Lansing, 2,493 (8.7%) attend a private institution, while the remaining 26,166 (91.3%) are enrolled in public schools. The age group of 3 to 4 year olds has the highest likelihood of being enrolled in private schools, with 399 (29.8% in the age bracket) enrolled. Conversely, the age group of 15 to 17 year olds has the lowest likelihood of being enrolled in a private school, with 3,579 (95.0% in the age bracket) attending a public institution.
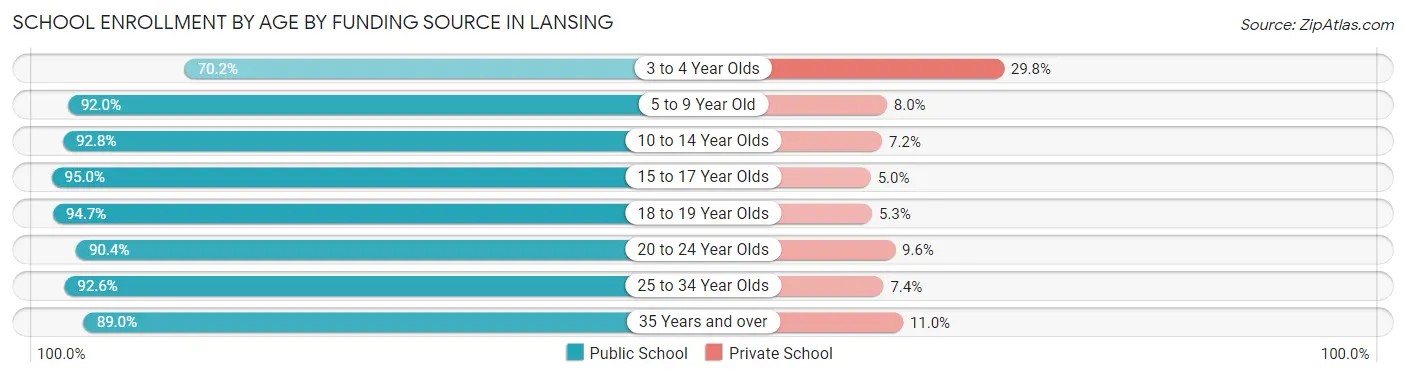
| Age Bracket | Public School | Private School |
| 3 to 4 Year Olds | 939 (70.2%) | 399 (29.8%) |
| 5 to 9 Year Old | 6,157 (92.0%) | 538 (8.0%) |
| 10 to 14 Year Olds | 5,771 (92.8%) | 446 (7.2%) |
| 15 to 17 Year Olds | 3,579 (95.0%) | 190 (5.0%) |
| 18 to 19 Year Olds | 1,221 (94.7%) | 68 (5.3%) |
| 20 to 24 Year Olds | 3,577 (90.4%) | 379 (9.6%) |
| 25 to 34 Year Olds | 3,443 (92.6%) | 276 (7.4%) |
| 35 Years and over | 1,491 (89.0%) | 185 (11.0%) |
| Total | 26,166 (91.3%) | 2,493 (8.7%) |
Educational Attainment by Field of Study in Lansing
Business (3,553 | 14.7%), arts & humanities (2,259 | 9.3%), science & technology (2,167 | 8.9%), bio, nature & agricultural (2,125 | 8.8%), and social sciences (2,027 | 8.4%) are the most common fields of study among 24,236 individuals in Lansing who have obtained a bachelor's degree or higher.
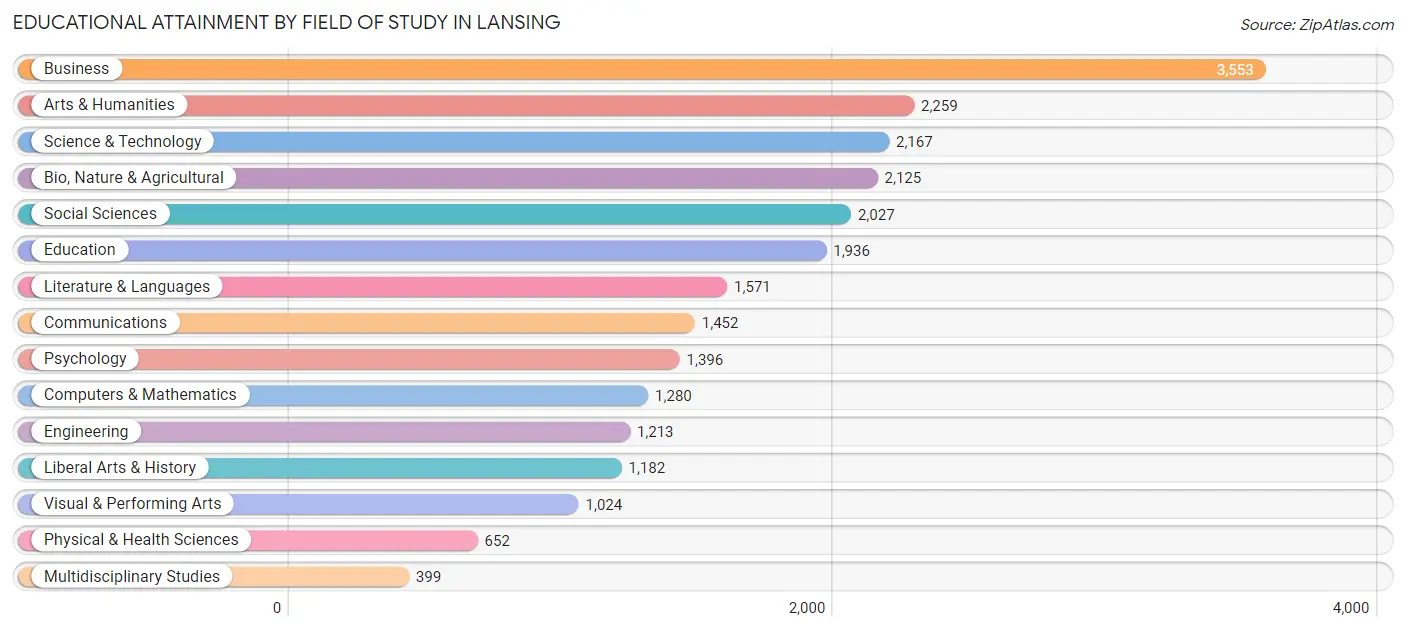
| Field of Study | # Graduates | % Graduates |
| Computers & Mathematics | 1,280 | 5.3% |
| Bio, Nature & Agricultural | 2,125 | 8.8% |
| Physical & Health Sciences | 652 | 2.7% |
| Psychology | 1,396 | 5.8% |
| Social Sciences | 2,027 | 8.4% |
| Engineering | 1,213 | 5.0% |
| Multidisciplinary Studies | 399 | 1.7% |
| Science & Technology | 2,167 | 8.9% |
| Business | 3,553 | 14.7% |
| Education | 1,936 | 8.0% |
| Literature & Languages | 1,571 | 6.5% |
| Liberal Arts & History | 1,182 | 4.9% |
| Visual & Performing Arts | 1,024 | 4.2% |
| Communications | 1,452 | 6.0% |
| Arts & Humanities | 2,259 | 9.3% |
| Total | 24,236 | 100.0% |
Transportation & Commute in Lansing
Vehicle Availability by Sex in Lansing
The most prevalent vehicle ownership categories in Lansing are males with 2 vehicles (10,943, accounting for 40.7%) and females with 2 vehicles (11,604, making up 40.3%).
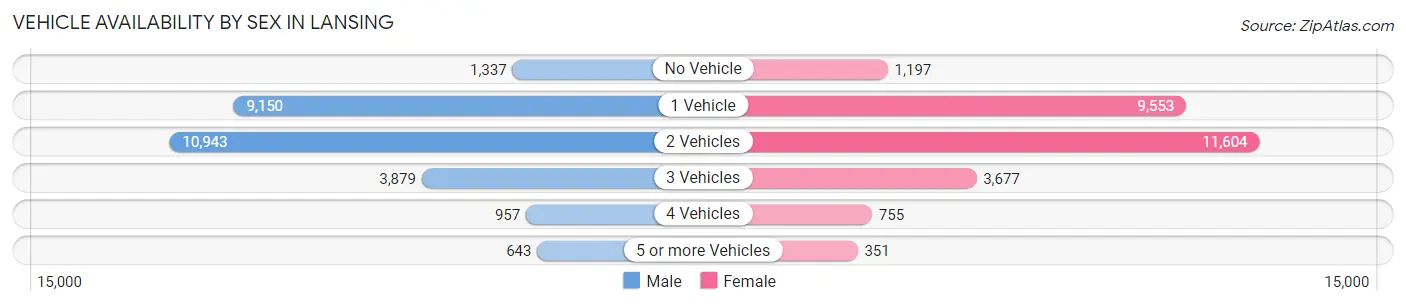
| Vehicles Available | Male | Female |
| No Vehicle | 1,337 (5.0%) | 1,197 (4.4%) |
| 1 Vehicle | 9,150 (34.0%) | 9,553 (35.2%) |
| 2 Vehicles | 10,943 (40.7%) | 11,604 (42.8%) |
| 3 Vehicles | 3,879 (14.4%) | 3,677 (13.6%) |
| 4 Vehicles | 957 (3.6%) | 755 (2.8%) |
| 5 or more Vehicles | 643 (2.4%) | 351 (1.3%) |
| Total | 26,909 (100.0%) | 27,137 (100.0%) |
Commute Time in Lansing
The most frequently occuring commute durations in Lansing are 15 to 19 minutes (13,521 commuters, 27.9%), 10 to 14 minutes (11,323 commuters, 23.4%), and 20 to 24 minutes (8,186 commuters, 16.9%).
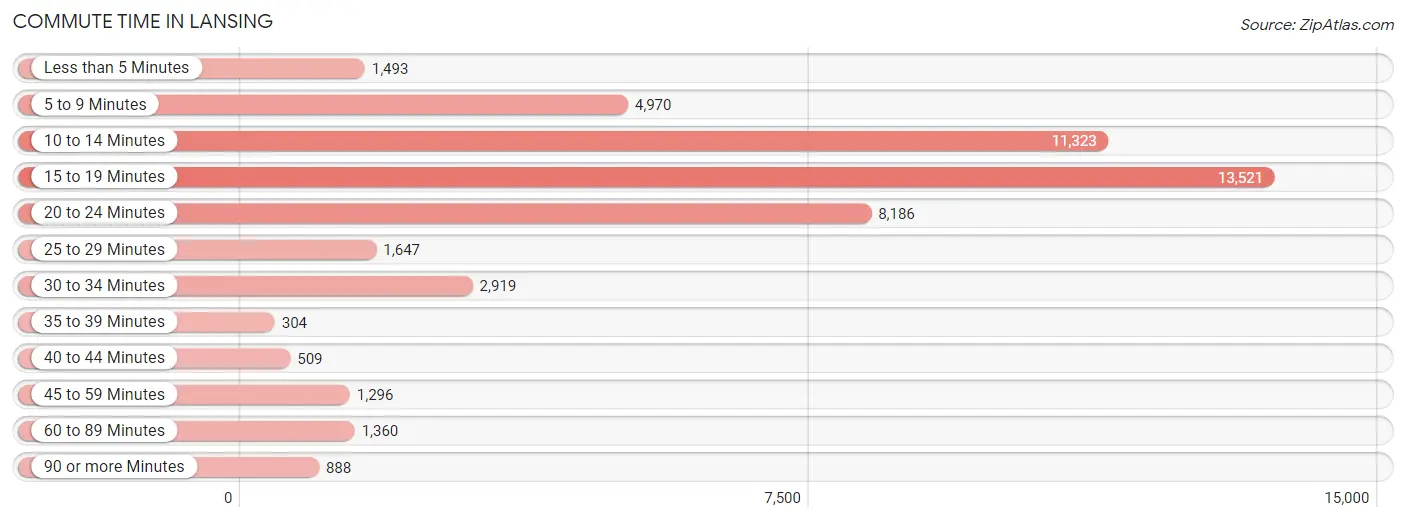
| Commute Time | # Commuters | % Commuters |
| Less than 5 Minutes | 1,493 | 3.1% |
| 5 to 9 Minutes | 4,970 | 10.3% |
| 10 to 14 Minutes | 11,323 | 23.4% |
| 15 to 19 Minutes | 13,521 | 27.9% |
| 20 to 24 Minutes | 8,186 | 16.9% |
| 25 to 29 Minutes | 1,647 | 3.4% |
| 30 to 34 Minutes | 2,919 | 6.0% |
| 35 to 39 Minutes | 304 | 0.6% |
| 40 to 44 Minutes | 509 | 1.1% |
| 45 to 59 Minutes | 1,296 | 2.7% |
| 60 to 89 Minutes | 1,360 | 2.8% |
| 90 or more Minutes | 888 | 1.8% |
Commute Time by Sex in Lansing
The most common commute times in Lansing are 15 to 19 minutes (6,824 commuters, 27.9%) for males and 15 to 19 minutes (6,697 commuters, 27.9%) for females.
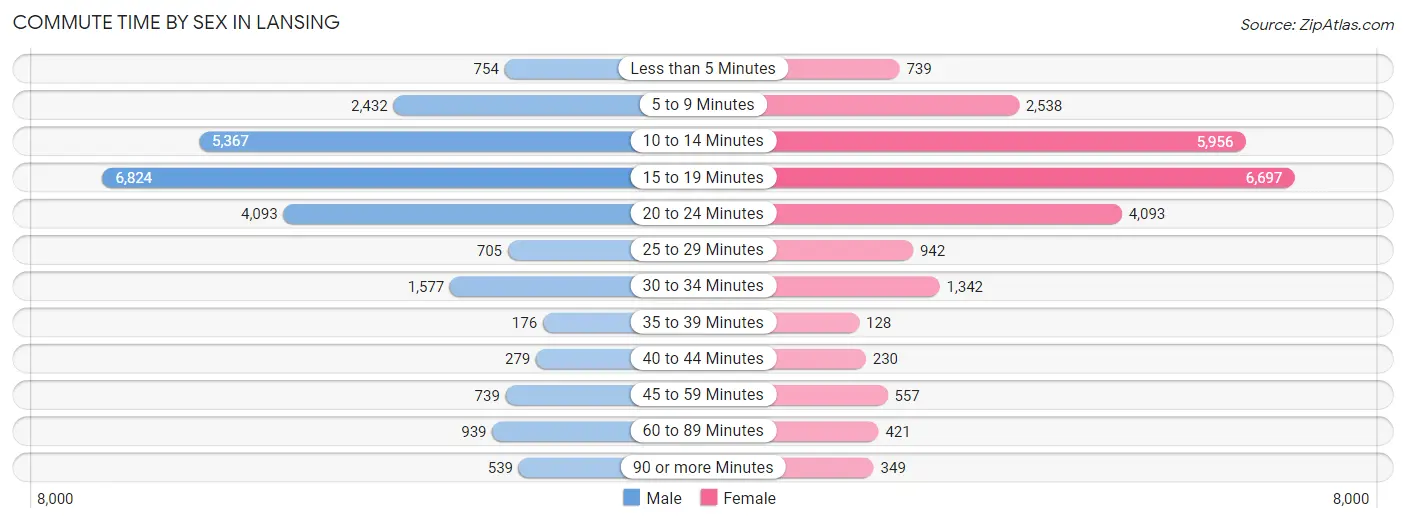
| Commute Time | Male | Female |
| Less than 5 Minutes | 754 (3.1%) | 739 (3.1%) |
| 5 to 9 Minutes | 2,432 (10.0%) | 2,538 (10.6%) |
| 10 to 14 Minutes | 5,367 (22.0%) | 5,956 (24.8%) |
| 15 to 19 Minutes | 6,824 (27.9%) | 6,697 (27.9%) |
| 20 to 24 Minutes | 4,093 (16.8%) | 4,093 (17.1%) |
| 25 to 29 Minutes | 705 (2.9%) | 942 (3.9%) |
| 30 to 34 Minutes | 1,577 (6.5%) | 1,342 (5.6%) |
| 35 to 39 Minutes | 176 (0.7%) | 128 (0.5%) |
| 40 to 44 Minutes | 279 (1.1%) | 230 (1.0%) |
| 45 to 59 Minutes | 739 (3.0%) | 557 (2.3%) |
| 60 to 89 Minutes | 939 (3.8%) | 421 (1.8%) |
| 90 or more Minutes | 539 (2.2%) | 349 (1.5%) |
Time of Departure to Work by Sex in Lansing
The most frequent times of departure to work in Lansing are 7:30 AM to 7:59 AM (2,915, 11.9%) for males and 7:30 AM to 7:59 AM (4,077, 17.0%) for females.
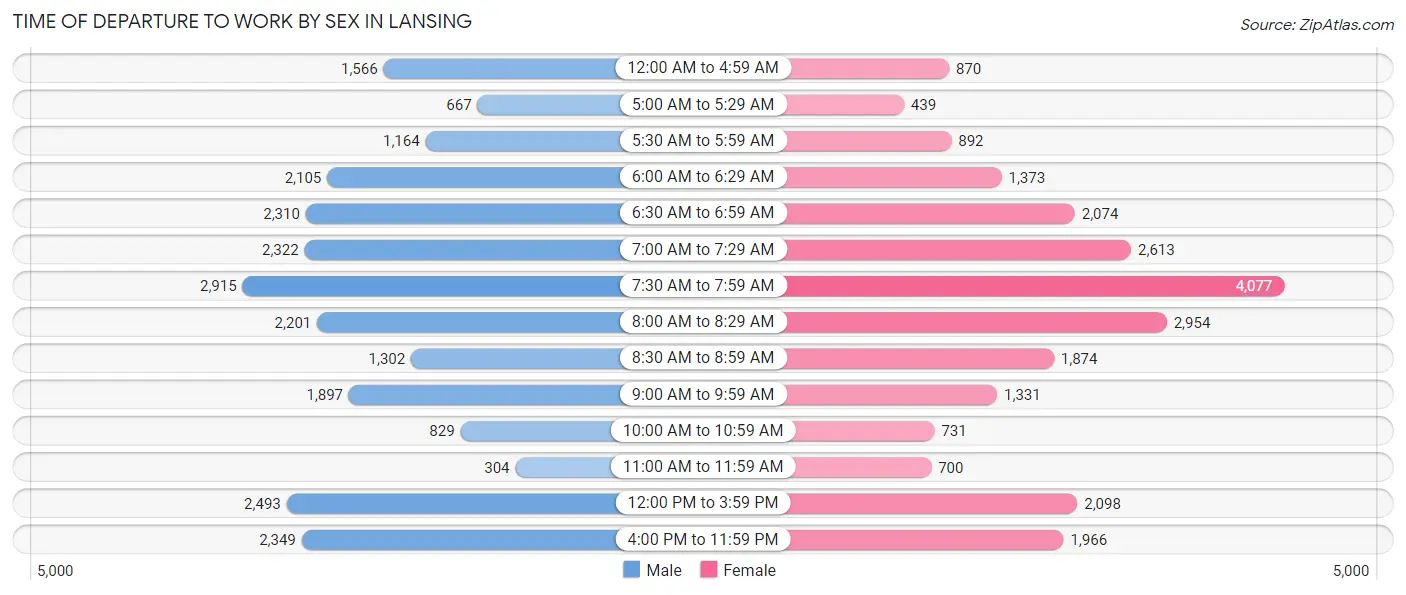
| Time of Departure | Male | Female |
| 12:00 AM to 4:59 AM | 1,566 (6.4%) | 870 (3.6%) |
| 5:00 AM to 5:29 AM | 667 (2.7%) | 439 (1.8%) |
| 5:30 AM to 5:59 AM | 1,164 (4.8%) | 892 (3.7%) |
| 6:00 AM to 6:29 AM | 2,105 (8.6%) | 1,373 (5.7%) |
| 6:30 AM to 6:59 AM | 2,310 (9.5%) | 2,074 (8.6%) |
| 7:00 AM to 7:29 AM | 2,322 (9.5%) | 2,613 (10.9%) |
| 7:30 AM to 7:59 AM | 2,915 (11.9%) | 4,077 (17.0%) |
| 8:00 AM to 8:29 AM | 2,201 (9.0%) | 2,954 (12.3%) |
| 8:30 AM to 8:59 AM | 1,302 (5.3%) | 1,874 (7.8%) |
| 9:00 AM to 9:59 AM | 1,897 (7.8%) | 1,331 (5.6%) |
| 10:00 AM to 10:59 AM | 829 (3.4%) | 731 (3.0%) |
| 11:00 AM to 11:59 AM | 304 (1.2%) | 700 (2.9%) |
| 12:00 PM to 3:59 PM | 2,493 (10.2%) | 2,098 (8.7%) |
| 4:00 PM to 11:59 PM | 2,349 (9.6%) | 1,966 (8.2%) |
| Total | 24,424 (100.0%) | 23,992 (100.0%) |
Housing Occupancy in Lansing
Occupancy by Ownership in Lansing
Of the total 50,137 dwellings in Lansing, owner-occupied units account for 26,743 (53.3%), while renter-occupied units make up 23,394 (46.7%).
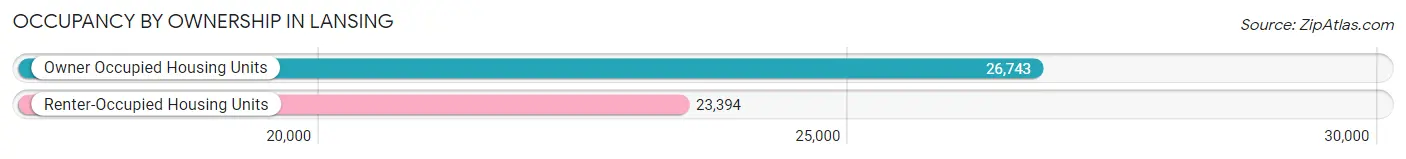
| Occupancy | # Housing Units | % Housing Units |
| Owner Occupied Housing Units | 26,743 | 53.3% |
| Renter-Occupied Housing Units | 23,394 | 46.7% |
| Total Occupied Housing Units | 50,137 | 100.0% |
Occupancy by Household Size in Lansing
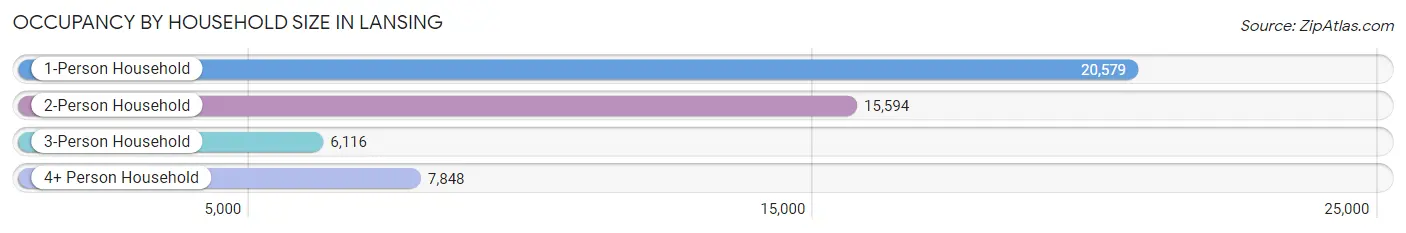
| Household Size | # Housing Units | % Housing Units |
| 1-Person Household | 20,579 | 41.0% |
| 2-Person Household | 15,594 | 31.1% |
| 3-Person Household | 6,116 | 12.2% |
| 4+ Person Household | 7,848 | 15.7% |
| Total Housing Units | 50,137 | 100.0% |
Occupancy by Ownership by Household Size in Lansing
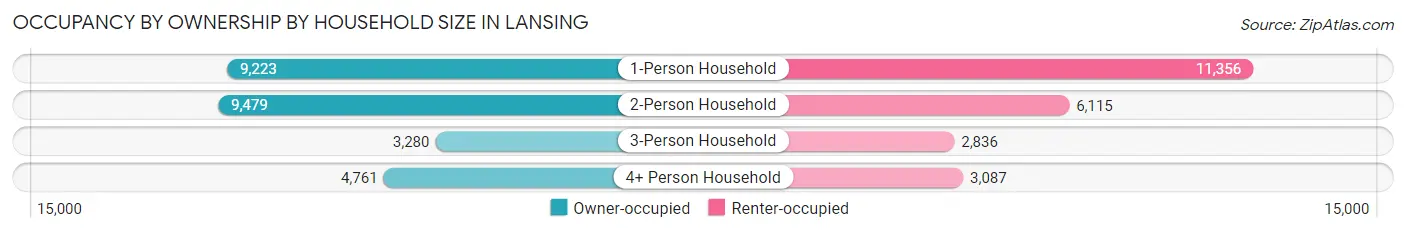
| Household Size | Owner-occupied | Renter-occupied |
| 1-Person Household | 9,223 (44.8%) | 11,356 (55.2%) |
| 2-Person Household | 9,479 (60.8%) | 6,115 (39.2%) |
| 3-Person Household | 3,280 (53.6%) | 2,836 (46.4%) |
| 4+ Person Household | 4,761 (60.7%) | 3,087 (39.3%) |
| Total Housing Units | 26,743 (53.3%) | 23,394 (46.7%) |
Occupancy by Educational Attainment in Lansing
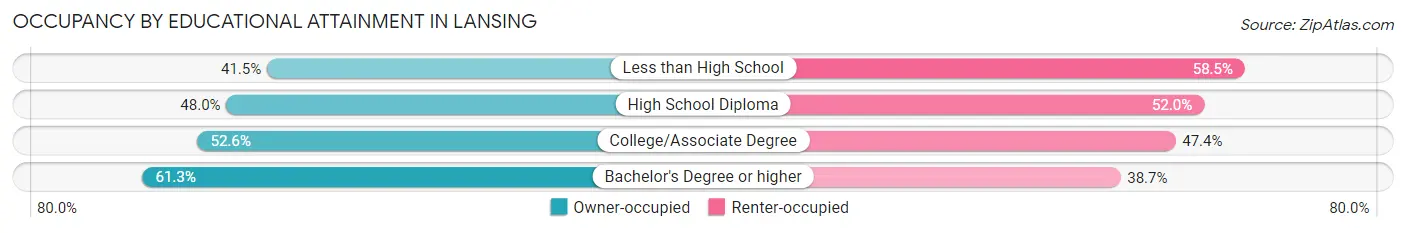
| Household Size | Owner-occupied | Renter-occupied |
| Less than High School | 1,876 (41.5%) | 2,640 (58.5%) |
| High School Diploma | 5,075 (48.0%) | 5,501 (52.0%) |
| College/Associate Degree | 10,157 (52.6%) | 9,166 (47.4%) |
| Bachelor's Degree or higher | 9,635 (61.3%) | 6,087 (38.7%) |
Occupancy by Age of Householder in Lansing
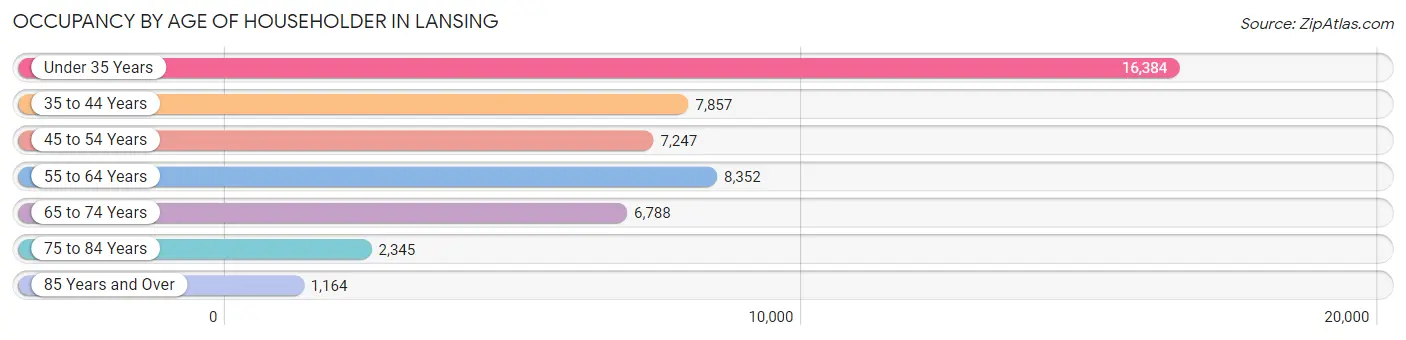
| Age Bracket | # Households | % Households |
| Under 35 Years | 16,384 | 32.7% |
| 35 to 44 Years | 7,857 | 15.7% |
| 45 to 54 Years | 7,247 | 14.4% |
| 55 to 64 Years | 8,352 | 16.7% |
| 65 to 74 Years | 6,788 | 13.5% |
| 75 to 84 Years | 2,345 | 4.7% |
| 85 Years and Over | 1,164 | 2.3% |
| Total | 50,137 | 100.0% |
Housing Finances in Lansing
Median Income by Occupancy in Lansing
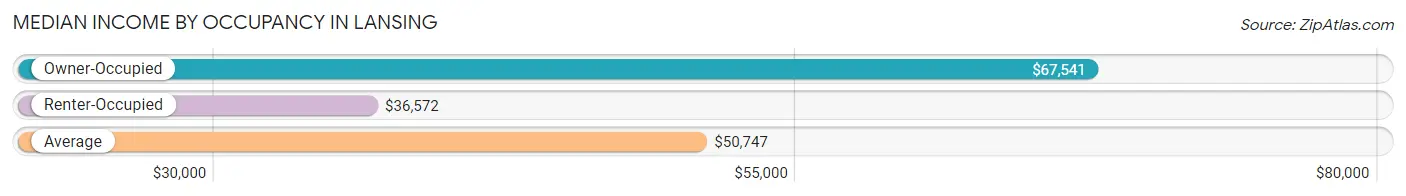
| Occupancy Type | # Households | Median Income |
| Owner-Occupied | 26,743 (53.3%) | $67,541 |
| Renter-Occupied | 23,394 (46.7%) | $36,572 |
| Average | 50,137 (100.0%) | $50,747 |
Occupancy by Householder Income Bracket in Lansing
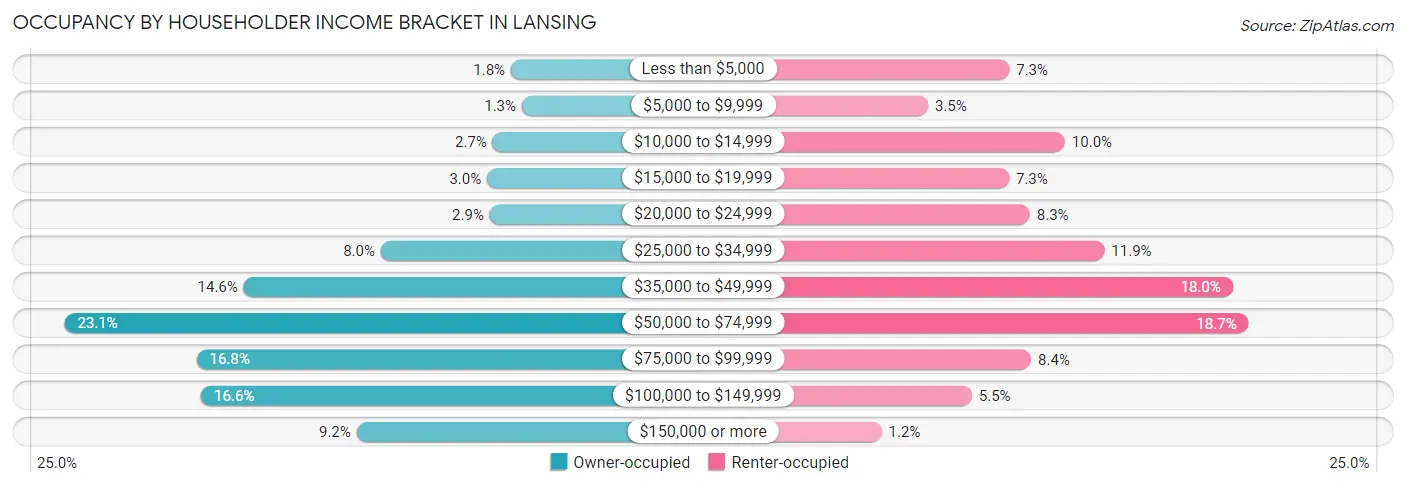
| Income Bracket | Owner-occupied | Renter-occupied |
| Less than $5,000 | 491 (1.8%) | 1,713 (7.3%) |
| $5,000 to $9,999 | 353 (1.3%) | 806 (3.5%) |
| $10,000 to $14,999 | 724 (2.7%) | 2,332 (10.0%) |
| $15,000 to $19,999 | 796 (3.0%) | 1,710 (7.3%) |
| $20,000 to $24,999 | 763 (2.9%) | 1,941 (8.3%) |
| $25,000 to $34,999 | 2,150 (8.0%) | 2,773 (11.8%) |
| $35,000 to $49,999 | 3,897 (14.6%) | 4,202 (18.0%) |
| $50,000 to $74,999 | 6,177 (23.1%) | 4,376 (18.7%) |
| $75,000 to $99,999 | 4,495 (16.8%) | 1,955 (8.4%) |
| $100,000 to $149,999 | 4,438 (16.6%) | 1,296 (5.5%) |
| $150,000 or more | 2,459 (9.2%) | 290 (1.2%) |
| Total | 26,743 (100.0%) | 23,394 (100.0%) |
Monthly Housing Cost Tiers in Lansing
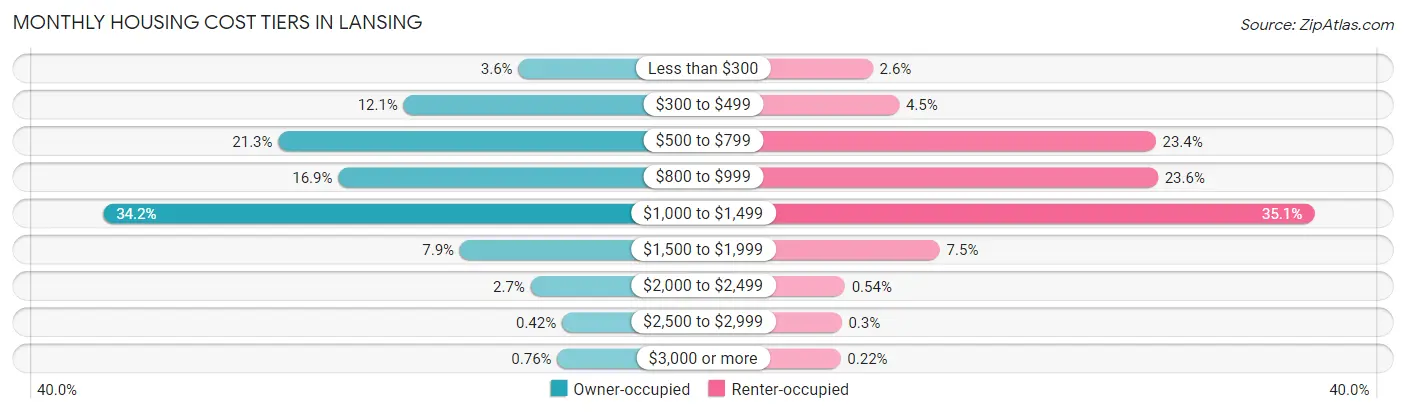
| Monthly Cost | Owner-occupied | Renter-occupied |
| Less than $300 | 972 (3.6%) | 605 (2.6%) |
| $300 to $499 | 3,231 (12.1%) | 1,059 (4.5%) |
| $500 to $799 | 5,699 (21.3%) | 5,482 (23.4%) |
| $800 to $999 | 4,519 (16.9%) | 5,519 (23.6%) |
| $1,000 to $1,499 | 9,150 (34.2%) | 8,212 (35.1%) |
| $1,500 to $1,999 | 2,124 (7.9%) | 1,761 (7.5%) |
| $2,000 to $2,499 | 731 (2.7%) | 126 (0.5%) |
| $2,500 to $2,999 | 113 (0.4%) | 70 (0.3%) |
| $3,000 or more | 204 (0.8%) | 51 (0.2%) |
| Total | 26,743 (100.0%) | 23,394 (100.0%) |
Physical Housing Characteristics in Lansing
Housing Structures in Lansing
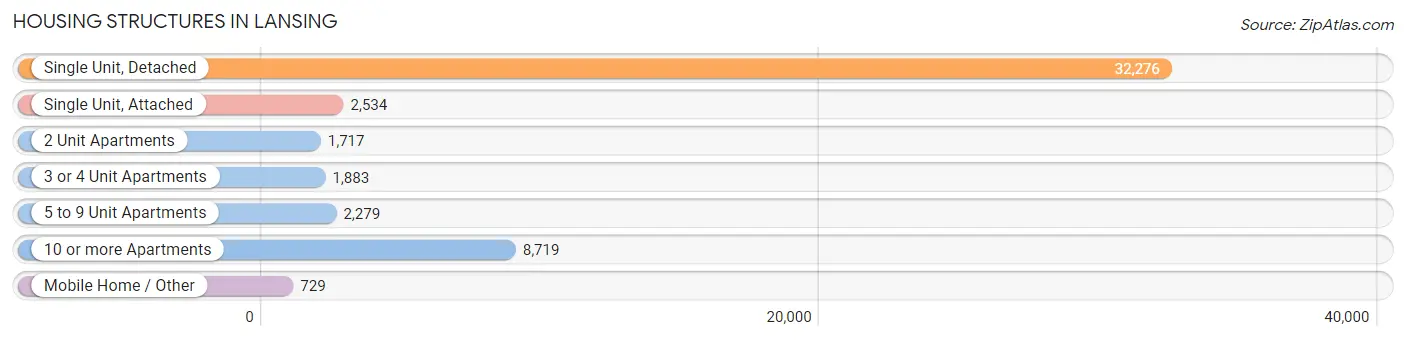
| Structure Type | # Housing Units | % Housing Units |
| Single Unit, Detached | 32,276 | 64.4% |
| Single Unit, Attached | 2,534 | 5.1% |
| 2 Unit Apartments | 1,717 | 3.4% |
| 3 or 4 Unit Apartments | 1,883 | 3.8% |
| 5 to 9 Unit Apartments | 2,279 | 4.5% |
| 10 or more Apartments | 8,719 | 17.4% |
| Mobile Home / Other | 729 | 1.5% |
| Total | 50,137 | 100.0% |
Housing Structures by Occupancy in Lansing
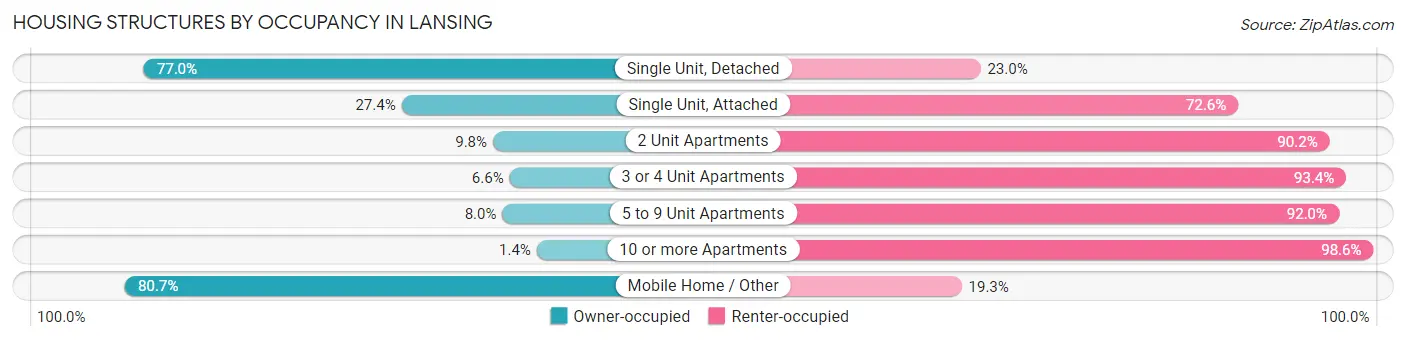
| Structure Type | Owner-occupied | Renter-occupied |
| Single Unit, Detached | 24,861 (77.0%) | 7,415 (23.0%) |
| Single Unit, Attached | 695 (27.4%) | 1,839 (72.6%) |
| 2 Unit Apartments | 169 (9.8%) | 1,548 (90.2%) |
| 3 or 4 Unit Apartments | 125 (6.6%) | 1,758 (93.4%) |
| 5 to 9 Unit Apartments | 183 (8.0%) | 2,096 (92.0%) |
| 10 or more Apartments | 122 (1.4%) | 8,597 (98.6%) |
| Mobile Home / Other | 588 (80.7%) | 141 (19.3%) |
| Total | 26,743 (53.3%) | 23,394 (46.7%) |
Housing Structures by Number of Rooms in Lansing
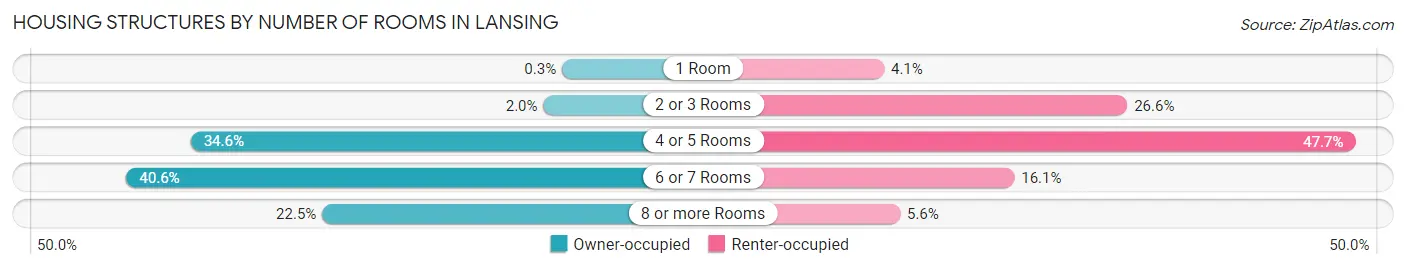
| Number of Rooms | Owner-occupied | Renter-occupied |
| 1 Room | 81 (0.3%) | 955 (4.1%) |
| 2 or 3 Rooms | 539 (2.0%) | 6,215 (26.6%) |
| 4 or 5 Rooms | 9,260 (34.6%) | 11,150 (47.7%) |
| 6 or 7 Rooms | 10,851 (40.6%) | 3,773 (16.1%) |
| 8 or more Rooms | 6,012 (22.5%) | 1,301 (5.6%) |
| Total | 26,743 (100.0%) | 23,394 (100.0%) |
Housing Structure by Heating Type in Lansing
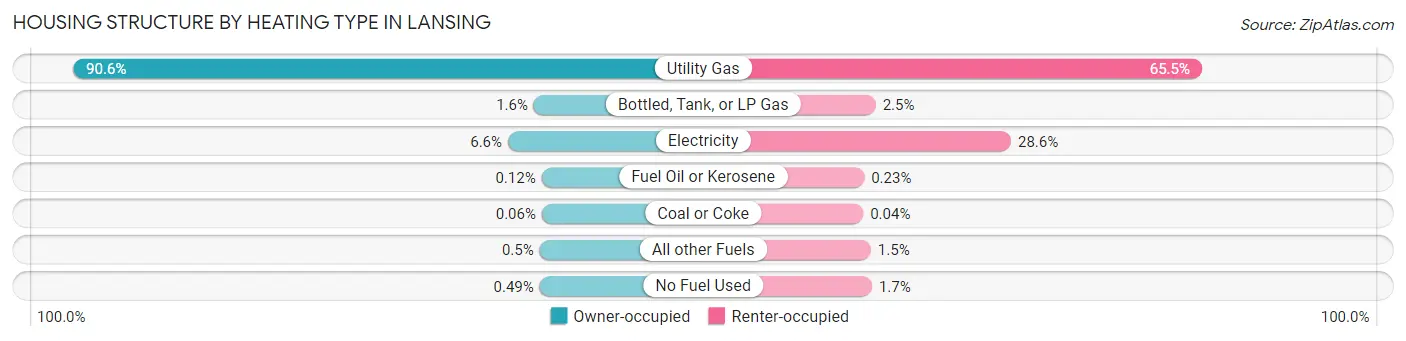
| Heating Type | Owner-occupied | Renter-occupied |
| Utility Gas | 24,234 (90.6%) | 15,311 (65.4%) |
| Bottled, Tank, or LP Gas | 430 (1.6%) | 572 (2.5%) |
| Electricity | 1,768 (6.6%) | 6,690 (28.6%) |
| Fuel Oil or Kerosene | 33 (0.1%) | 53 (0.2%) |
| Coal or Coke | 15 (0.1%) | 10 (0.0%) |
| All other Fuels | 133 (0.5%) | 355 (1.5%) |
| No Fuel Used | 130 (0.5%) | 403 (1.7%) |
| Total | 26,743 (100.0%) | 23,394 (100.0%) |
Household Vehicle Usage in Lansing
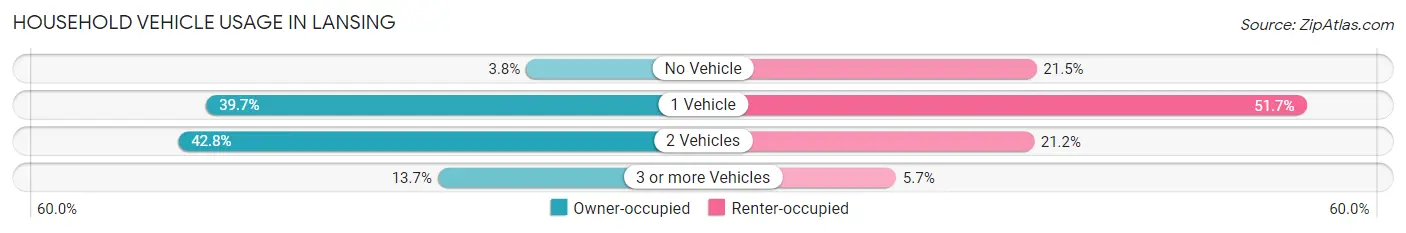
| Vehicles per Household | Owner-occupied | Renter-occupied |
| No Vehicle | 1,022 (3.8%) | 5,017 (21.4%) |
| 1 Vehicle | 10,610 (39.7%) | 12,091 (51.7%) |
| 2 Vehicles | 11,443 (42.8%) | 4,950 (21.2%) |
| 3 or more Vehicles | 3,668 (13.7%) | 1,336 (5.7%) |
| Total | 26,743 (100.0%) | 23,394 (100.0%) |
Real Estate & Mortgages in Lansing
Real Estate and Mortgage Overview in Lansing
| Characteristic | Without Mortgage | With Mortgage |
| Housing Units | 9,227 | 17,516 |
| Median Property Value | $104,500 | $115,700 |
| Median Household Income | $53,542 | $1,811 |
| Monthly Housing Costs | $529 | $204 |
| Real Estate Taxes | $2,443 | $671 |
Property Value by Mortgage Status in Lansing
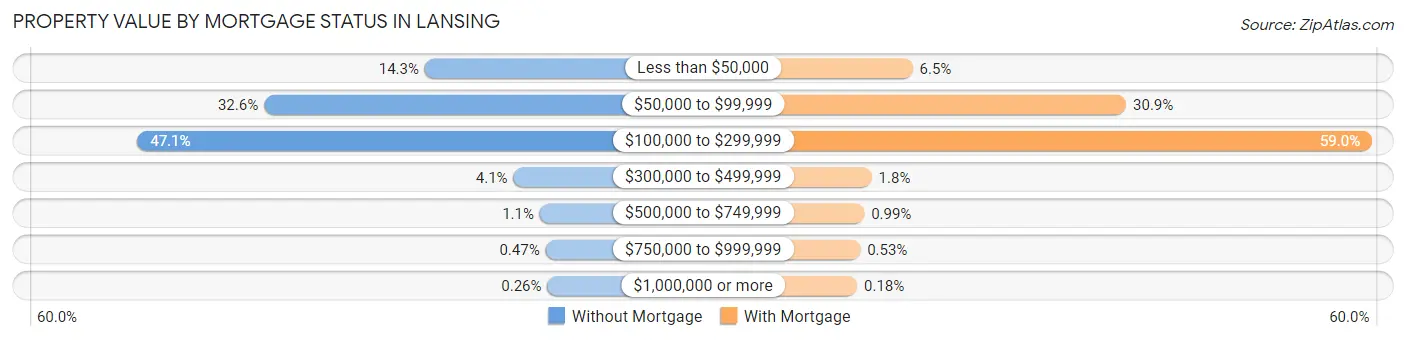
| Property Value | Without Mortgage | With Mortgage |
| Less than $50,000 | 1,316 (14.3%) | 1,142 (6.5%) |
| $50,000 to $99,999 | 3,012 (32.6%) | 5,416 (30.9%) |
| $100,000 to $299,999 | 4,348 (47.1%) | 10,338 (59.0%) |
| $300,000 to $499,999 | 381 (4.1%) | 323 (1.8%) |
| $500,000 to $749,999 | 103 (1.1%) | 173 (1.0%) |
| $750,000 to $999,999 | 43 (0.5%) | 93 (0.5%) |
| $1,000,000 or more | 24 (0.3%) | 31 (0.2%) |
| Total | 9,227 (100.0%) | 17,516 (100.0%) |
Household Income by Mortgage Status in Lansing
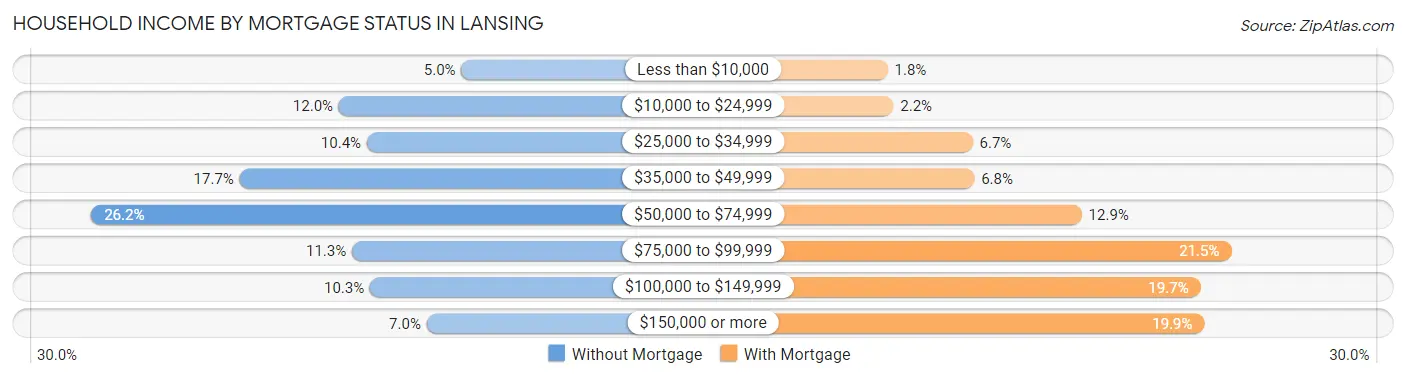
| Household Income | Without Mortgage | With Mortgage |
| Less than $10,000 | 465 (5.0%) | 320 (1.8%) |
| $10,000 to $24,999 | 1,111 (12.0%) | 379 (2.2%) |
| $25,000 to $34,999 | 963 (10.4%) | 1,172 (6.7%) |
| $35,000 to $49,999 | 1,634 (17.7%) | 1,187 (6.8%) |
| $50,000 to $74,999 | 2,417 (26.2%) | 2,263 (12.9%) |
| $75,000 to $99,999 | 1,042 (11.3%) | 3,760 (21.5%) |
| $100,000 to $149,999 | 947 (10.3%) | 3,453 (19.7%) |
| $150,000 or more | 648 (7.0%) | 3,491 (19.9%) |
| Total | 9,227 (100.0%) | 17,516 (100.0%) |
Property Value to Household Income Ratio in Lansing
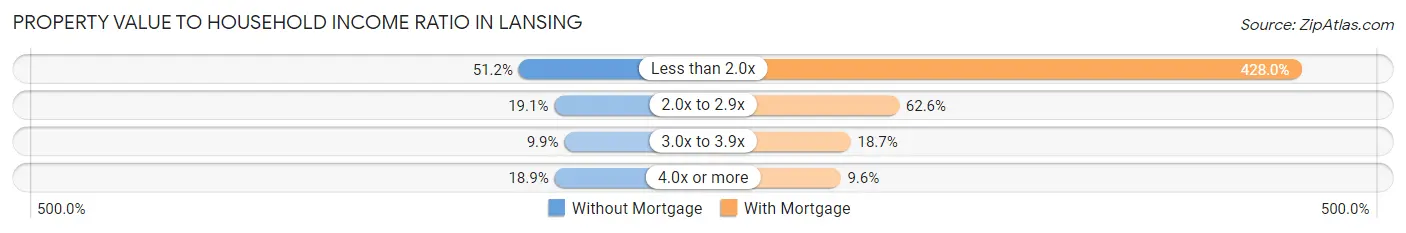
| Value-to-Income Ratio | Without Mortgage | With Mortgage |
| Less than 2.0x | 4,726 (51.2%) | 74,974 (428.0%) |
| 2.0x to 2.9x | 1,758 (19.1%) | 10,969 (62.6%) |
| 3.0x to 3.9x | 915 (9.9%) | 3,276 (18.7%) |
| 4.0x or more | 1,739 (18.9%) | 1,678 (9.6%) |
| Total | 9,227 (100.0%) | 17,516 (100.0%) |
Real Estate Taxes by Mortgage Status in Lansing
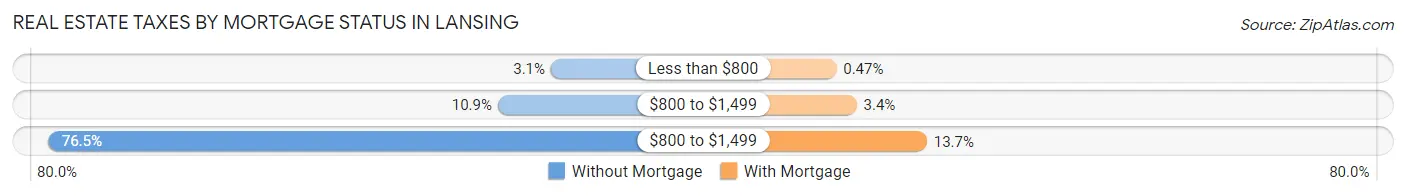
| Property Taxes | Without Mortgage | With Mortgage |
| Less than $800 | 286 (3.1%) | 82 (0.5%) |
| $800 to $1,499 | 1,002 (10.9%) | 603 (3.4%) |
| $800 to $1,499 | 7,055 (76.5%) | 2,399 (13.7%) |
| Total | 9,227 (100.0%) | 17,516 (100.0%) |
Health & Disability in Lansing
Health Insurance Coverage by Age in Lansing
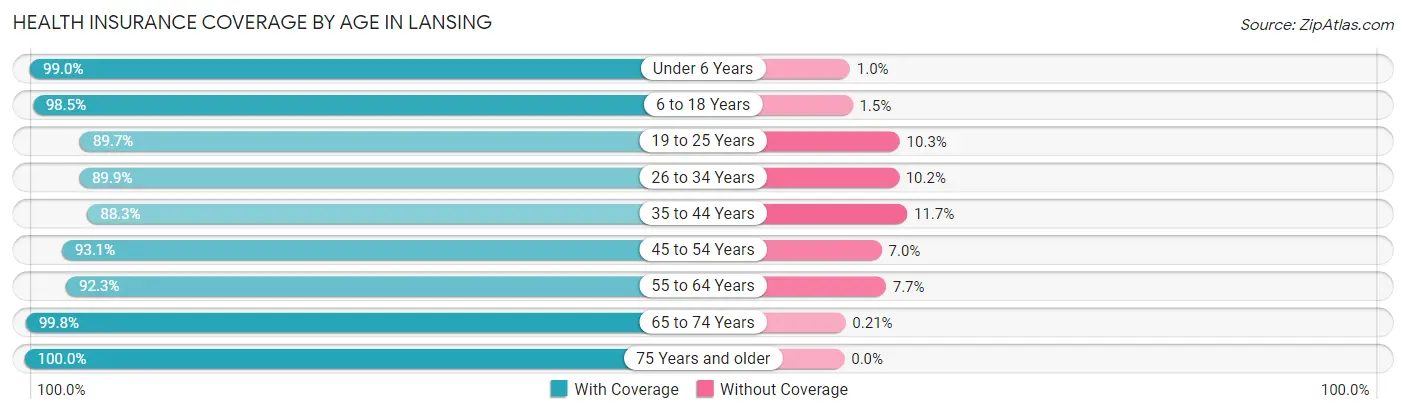
| Age Bracket | With Coverage | Without Coverage |
| Under 6 Years | 9,506 (99.0%) | 99 (1.0%) |
| 6 to 18 Years | 16,743 (98.5%) | 259 (1.5%) |
| 19 to 25 Years | 12,803 (89.7%) | 1,473 (10.3%) |
| 26 to 34 Years | 17,501 (89.8%) | 1,978 (10.2%) |
| 35 to 44 Years | 12,041 (88.3%) | 1,596 (11.7%) |
| 45 to 54 Years | 11,193 (93.0%) | 836 (7.0%) |
| 55 to 64 Years | 11,611 (92.3%) | 974 (7.7%) |
| 65 to 74 Years | 9,448 (99.8%) | 20 (0.2%) |
| 75 Years and older | 4,663 (100.0%) | 0 (0.0%) |
| Total | 105,509 (93.6%) | 7,235 (6.4%) |
Health Insurance Coverage by Citizenship Status in Lansing
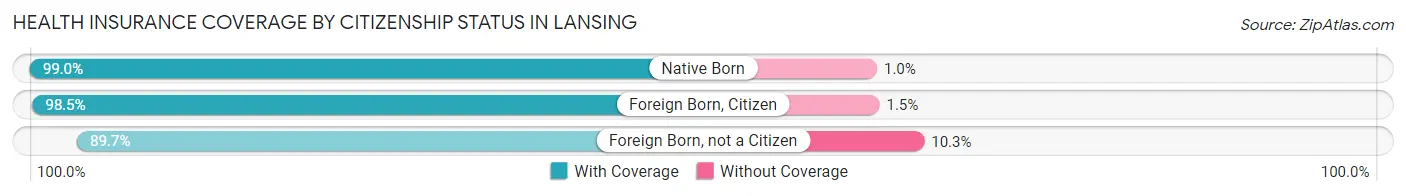
| Citizenship Status | With Coverage | Without Coverage |
| Native Born | 9,506 (99.0%) | 99 (1.0%) |
| Foreign Born, Citizen | 16,743 (98.5%) | 259 (1.5%) |
| Foreign Born, not a Citizen | 12,803 (89.7%) | 1,473 (10.3%) |
Health Insurance Coverage by Household Income in Lansing
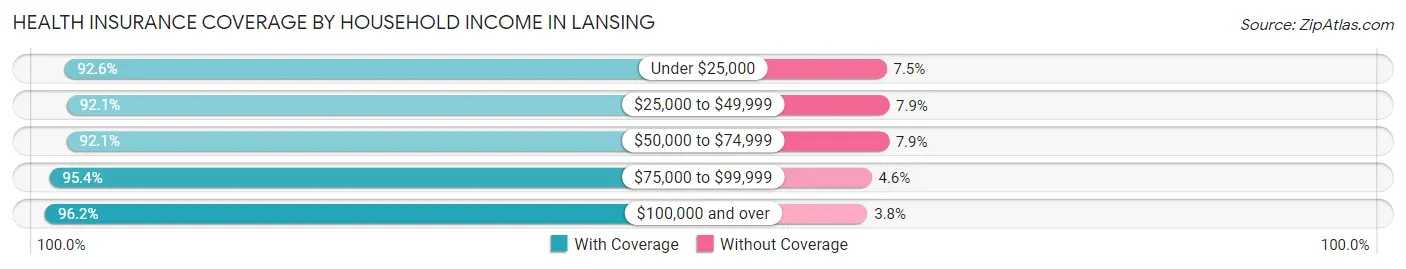
| Household Income | With Coverage | Without Coverage |
| Under $25,000 | 17,961 (92.5%) | 1,445 (7.4%) |
| $25,000 to $49,999 | 25,592 (92.1%) | 2,203 (7.9%) |
| $50,000 to $74,999 | 21,221 (92.1%) | 1,810 (7.9%) |
| $75,000 to $99,999 | 15,767 (95.4%) | 765 (4.6%) |
| $100,000 and over | 24,273 (96.2%) | 969 (3.8%) |
Public vs Private Health Insurance Coverage by Age in Lansing
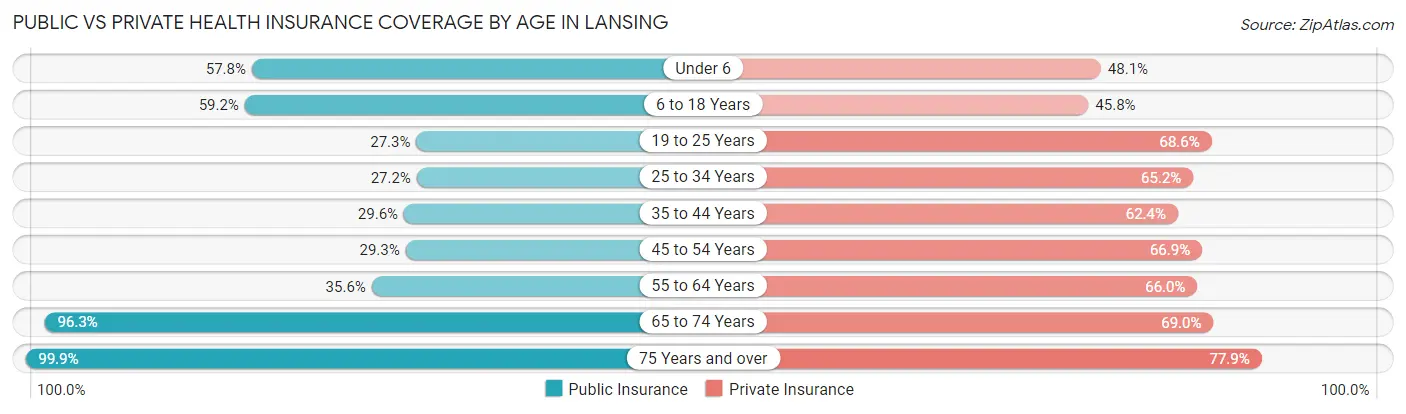
| Age Bracket | Public Insurance | Private Insurance |
| Under 6 | 5,555 (57.8%) | 4,619 (48.1%) |
| 6 to 18 Years | 10,057 (59.2%) | 7,784 (45.8%) |
| 19 to 25 Years | 3,896 (27.3%) | 9,797 (68.6%) |
| 25 to 34 Years | 5,302 (27.2%) | 12,703 (65.2%) |
| 35 to 44 Years | 4,036 (29.6%) | 8,504 (62.4%) |
| 45 to 54 Years | 3,523 (29.3%) | 8,041 (66.8%) |
| 55 to 64 Years | 4,478 (35.6%) | 8,303 (66.0%) |
| 65 to 74 Years | 9,119 (96.3%) | 6,528 (69.0%) |
| 75 Years and over | 4,657 (99.9%) | 3,633 (77.9%) |
| Total | 50,623 (44.9%) | 69,912 (62.0%) |
Disability Status by Sex by Age in Lansing
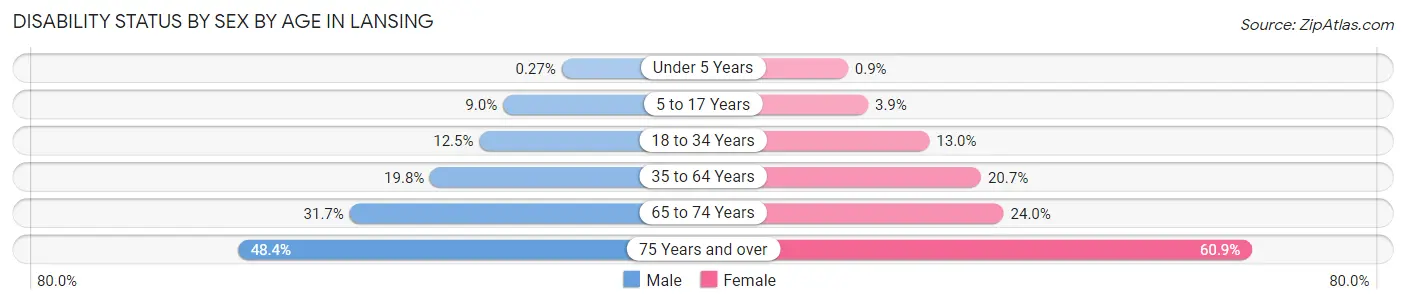
| Age Bracket | Male | Female |
| Under 5 Years | 12 (0.3%) | 32 (0.9%) |
| 5 to 17 Years | 791 (9.0%) | 345 (3.9%) |
| 18 to 34 Years | 2,145 (12.5%) | 2,274 (13.0%) |
| 35 to 64 Years | 3,731 (19.8%) | 4,009 (20.7%) |
| 65 to 74 Years | 1,379 (31.7%) | 1,231 (24.0%) |
| 75 Years and over | 864 (48.3%) | 1,752 (60.9%) |
Disability Class by Sex by Age in Lansing
Disability Class: Hearing Difficulty
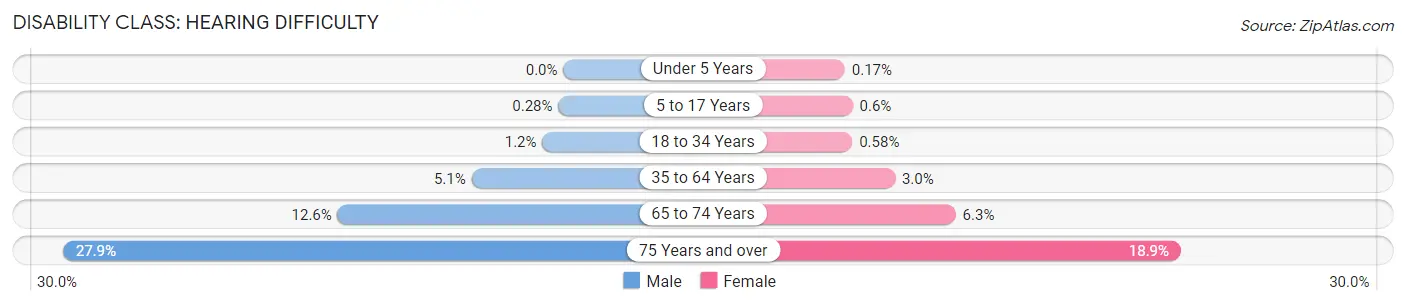
| Age Bracket | Male | Female |
| Under 5 Years | 0 (0.0%) | 6 (0.2%) |
| 5 to 17 Years | 25 (0.3%) | 53 (0.6%) |
| 18 to 34 Years | 201 (1.2%) | 102 (0.6%) |
| 35 to 64 Years | 963 (5.1%) | 574 (3.0%) |
| 65 to 74 Years | 546 (12.6%) | 325 (6.3%) |
| 75 Years and over | 498 (27.9%) | 543 (18.9%) |
Disability Class: Vision Difficulty
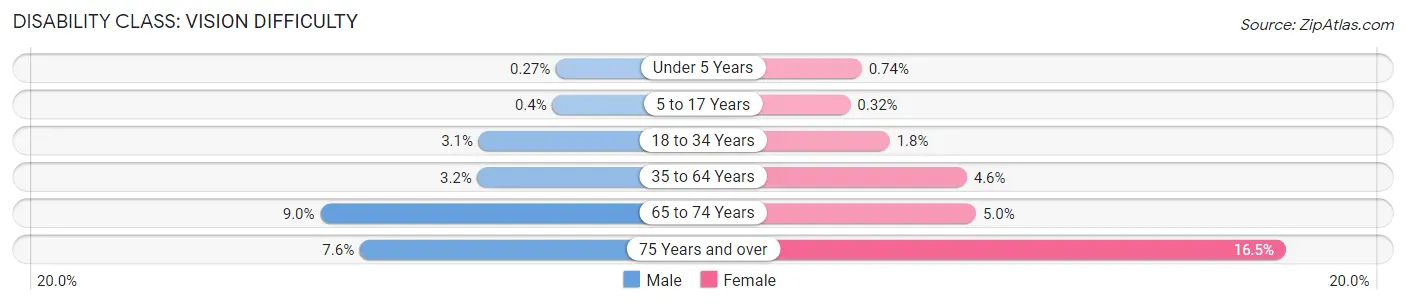
| Age Bracket | Male | Female |
| Under 5 Years | 12 (0.3%) | 26 (0.7%) |
| 5 to 17 Years | 35 (0.4%) | 28 (0.3%) |
| 18 to 34 Years | 539 (3.1%) | 311 (1.8%) |
| 35 to 64 Years | 600 (3.2%) | 899 (4.6%) |
| 65 to 74 Years | 392 (9.0%) | 255 (5.0%) |
| 75 Years and over | 135 (7.5%) | 474 (16.5%) |
Disability Class: Cognitive Difficulty
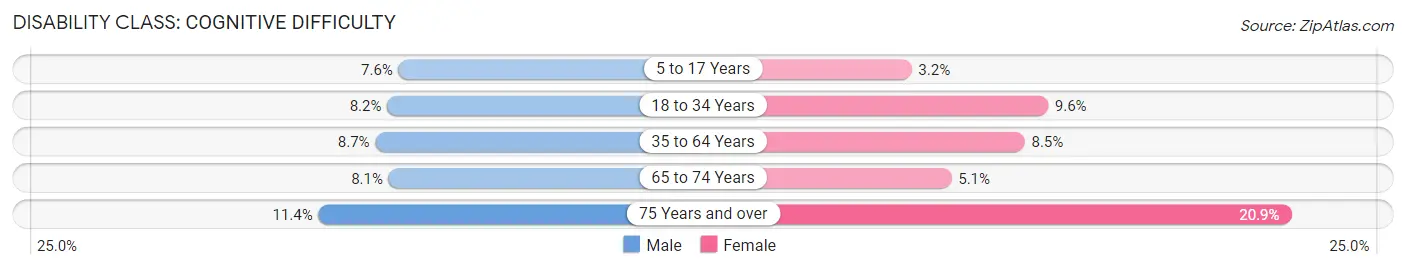
| Age Bracket | Male | Female |
| 5 to 17 Years | 675 (7.6%) | 286 (3.2%) |
| 18 to 34 Years | 1,403 (8.2%) | 1,671 (9.6%) |
| 35 to 64 Years | 1,644 (8.7%) | 1,645 (8.5%) |
| 65 to 74 Years | 352 (8.1%) | 260 (5.1%) |
| 75 Years and over | 203 (11.4%) | 600 (20.9%) |
Disability Class: Ambulatory Difficulty
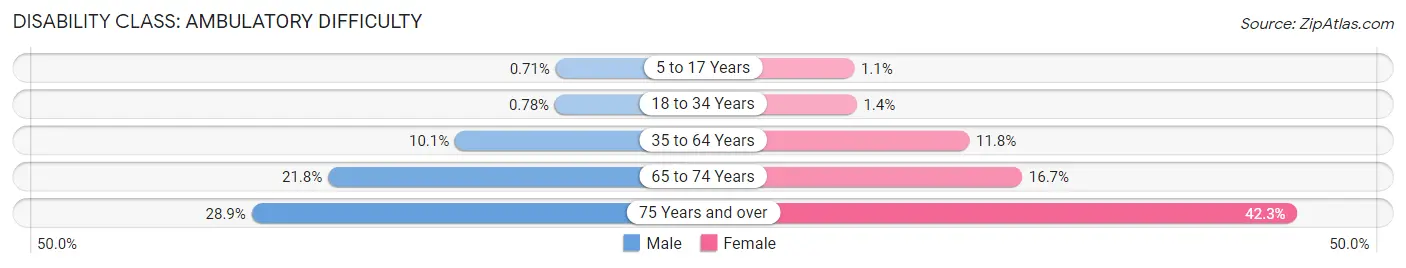
| Age Bracket | Male | Female |
| 5 to 17 Years | 63 (0.7%) | 100 (1.1%) |
| 18 to 34 Years | 134 (0.8%) | 237 (1.4%) |
| 35 to 64 Years | 1,896 (10.1%) | 2,290 (11.8%) |
| 65 to 74 Years | 949 (21.8%) | 856 (16.7%) |
| 75 Years and over | 517 (28.9%) | 1,216 (42.3%) |
Disability Class: Self-Care Difficulty

| Age Bracket | Male | Female |
| 5 to 17 Years | 195 (2.2%) | 111 (1.3%) |
| 18 to 34 Years | 104 (0.6%) | 180 (1.0%) |
| 35 to 64 Years | 568 (3.0%) | 853 (4.4%) |
| 65 to 74 Years | 264 (6.1%) | 252 (4.9%) |
| 75 Years and over | 189 (10.6%) | 346 (12.0%) |
Technology Access in Lansing
Computing Device Access in Lansing
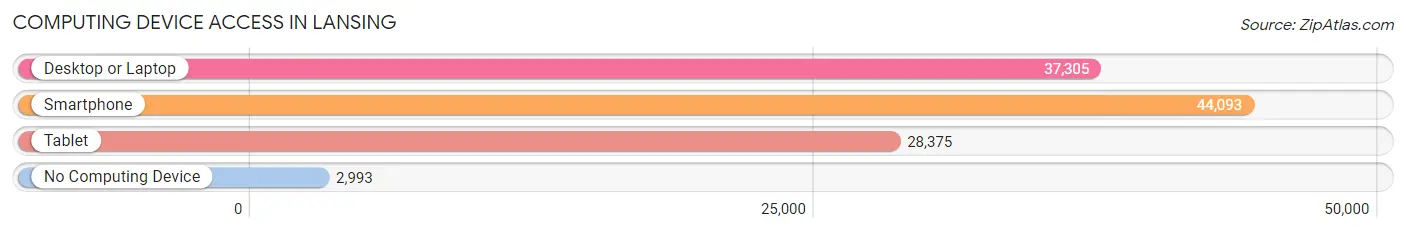
| Device Type | # Households | % Households |
| Desktop or Laptop | 37,305 | 74.4% |
| Smartphone | 44,093 | 87.9% |
| Tablet | 28,375 | 56.6% |
| No Computing Device | 2,993 | 6.0% |
| Total | 50,137 | 100.0% |
Internet Access in Lansing
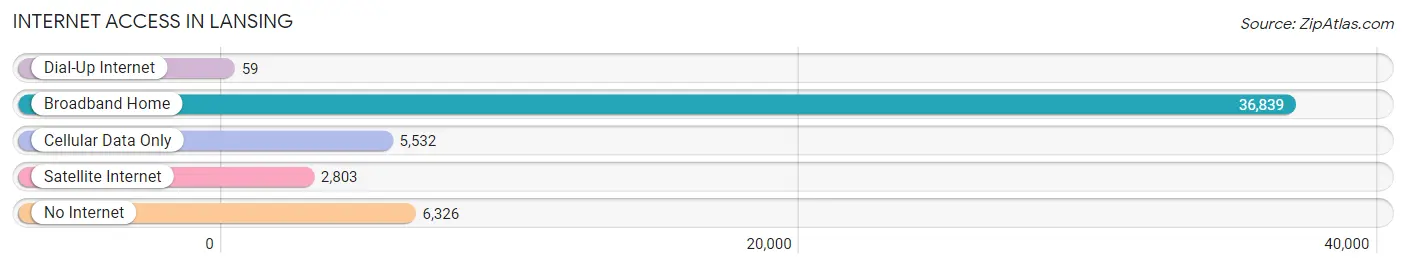
| Internet Type | # Households | % Households |
| Dial-Up Internet | 59 | 0.1% |
| Broadband Home | 36,839 | 73.5% |
| Cellular Data Only | 5,532 | 11.0% |
| Satellite Internet | 2,803 | 5.6% |
| No Internet | 6,326 | 12.6% |
| Total | 50,137 | 100.0% |
Lansing Summary
Lansing, Michigan is the capital of the state of Michigan and the fifth-largest city in the state. Located in the south-central portion of the state, Lansing is the county seat of Ingham County and is part of the Lansing-East Lansing metropolitan area. The city is situated along the Grand River, which flows through the city and is the largest river in Michigan. Lansing is home to Michigan State University, the state’s largest university, and the Michigan State Capitol.
History
The area that is now Lansing was first settled in 1835 by European settlers. The city was founded in 1847 by a group of settlers led by John Lansing, Jr., who was a lawyer and judge from New York. The city was named after him. Lansing was incorporated as a village in 1859 and as a city in 1871.
In the late 19th century, Lansing became an important industrial center, with the city’s economy driven by the automotive industry. The city was home to several automobile manufacturers, including Oldsmobile, which was founded in Lansing in 1897. The city also became a major center for the production of carriages and other horse-drawn vehicles.
In the early 20th century, Lansing was a major center for the production of furniture. The city was also home to several major breweries, including the Oldsmobile Brewing Company.
Geography
Lansing is located in south-central Michigan, in the Grand River Valley. The city is situated along the Grand River, which flows through the city and is the largest river in Michigan. The city is located about 90 miles west of Detroit and about 60 miles east of Grand Rapids.
The city has a total area of 36.2 square miles, of which 35.7 square miles is land and 0.5 square miles is water. The city is located in a humid continental climate zone, with hot, humid summers and cold, snowy winters.
Economy
Lansing’s economy is driven by the government, education, healthcare, and automotive industries. The city is home to several major employers, including Michigan State University, the state government, and the Lansing Board of Water & Light.
The city is also home to several major automotive companies, including General Motors, which has a large manufacturing plant in the city. Other major employers in the city include Sparrow Health System, the Lansing School District, and the Lansing Community College.
Demographics
As of the 2010 census, the population of Lansing was 114,297. The city has a population density of 3,164 people per square mile. The racial makeup of the city was 73.2% White, 19.2% African American, 0.5% Native American, 2.7% Asian, 0.1% Pacific Islander, 1.7% from other races, and 2.7% from two or more races. Hispanic or Latino of any race were 5.2% of the population.
The median income for a household in the city was $37,837, and the median income for a family was $45,919. The per capita income for the city was $20,945. About 17.2% of the population was below the poverty line.
Common Questions
What is Per Capita Income in Lansing?
Per Capita income in Lansing is $28,483.
What is the Median Family Income in Lansing?
Median Family Income in Lansing is $63,701.
What is the Median Household income in Lansing?
Median Household Income in Lansing is $50,747.
What is Income or Wage Gap in Lansing?
Income or Wage Gap in Lansing is 23.4%.
Women in Lansing earn 76.6 cents for every dollar earned by a man.
What is Family Income Deficit in Lansing?
Family Income Deficit in Lansing is $10,955.
Families that are below poverty line in Lansing earn $10,955 less on average than the poverty threshold level.
What is Inequality or Gini Index in Lansing?
Inequality or Gini Index in Lansing is 0.42.
What is the Total Population of Lansing?
Total Population of Lansing is 112,986.
What is the Total Male Population of Lansing?
Total Male Population of Lansing is 55,579.
What is the Total Female Population of Lansing?
Total Female Population of Lansing is 57,407.
What is the Ratio of Males per 100 Females in Lansing?
There are 96.82 Males per 100 Females in Lansing.
What is the Ratio of Females per 100 Males in Lansing?
There are 103.29 Females per 100 Males in Lansing.
What is the Median Population Age in Lansing?
Median Population Age in Lansing is 32.9 Years.
What is the Average Family Size in Lansing
Average Family Size in Lansing is 3.1 People.
What is the Average Household Size in Lansing
Average Household Size in Lansing is 2.2 People.
How Large is the Labor Force in Lansing?
There are 60,766 People in the Labor Forcein in Lansing.
What is the Percentage of People in the Labor Force in Lansing?
67.5% of People are in the Labor Force in Lansing.
What is the Unemployment Rate in Lansing?
Unemployment Rate in Lansing is 8.3%.