Manistique, MI Map & Demographics
Manistique Map
Manistique Overview
$31,643
PER CAPITA INCOME
$67,319
AVG FAMILY INCOME
$36,588
AVG HOUSEHOLD INCOME
50.8%
WAGE / INCOME GAP [ % ]
49.2¢/ $1
WAGE / INCOME GAP [ $ ]
0.53
INEQUALITY / GINI INDEX
2,838
TOTAL POPULATION
1,298
MALE POPULATION
1,540
FEMALE POPULATION
84.29
MALES / 100 FEMALES
118.64
FEMALES / 100 MALES
50.6
MEDIAN AGE
2.8
AVG FAMILY SIZE
1.9
AVG HOUSEHOLD SIZE
1,407
LABOR FORCE [ PEOPLE ]
56.9%
PERCENT IN LABOR FORCE
8.6%
UNEMPLOYMENT RATE
Manistique Zip Codes
Manistique Area Codes
Income in Manistique
Income Overview in Manistique
Per Capita Income in Manistique is $31,643, while median incomes of families and households are $67,319 and $36,588 respectively.
| Characteristic | Number | Measure |
| Per Capita Income | 2,838 | $31,643 |
| Median Family Income | 591 | $67,319 |
| Mean Family Income | 591 | $103,560 |
| Median Household Income | 1,444 | $36,588 |
| Mean Household Income | 1,444 | $62,076 |
| Income Deficit | 591 | $0 |
| Wage / Income Gap (%) | 2,838 | 50.83% |
| Wage / Income Gap ($) | 2,838 | 49.17¢ per $1 |
| Gini / Inequality Index | 2,838 | 0.53 |
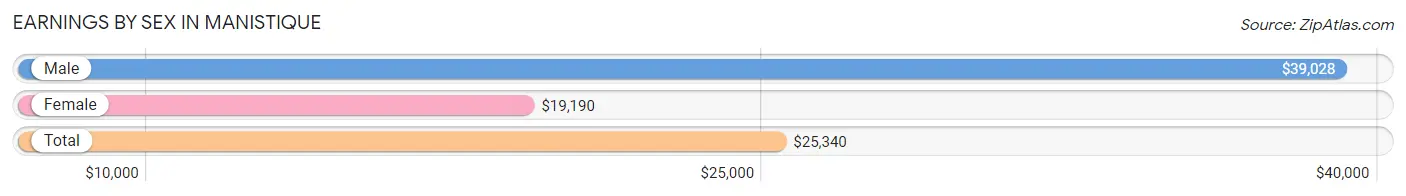
Earnings by Sex in Manistique
Average Earnings in Manistique are $25,340, $39,028 for men and $19,190 for women, a difference of 50.8%.
| Sex | Number | Average Earnings |
| Male | 750 (56.2%) | $39,028 |
| Female | 585 (43.8%) | $19,190 |
| Total | 1,335 (100.0%) | $25,340 |
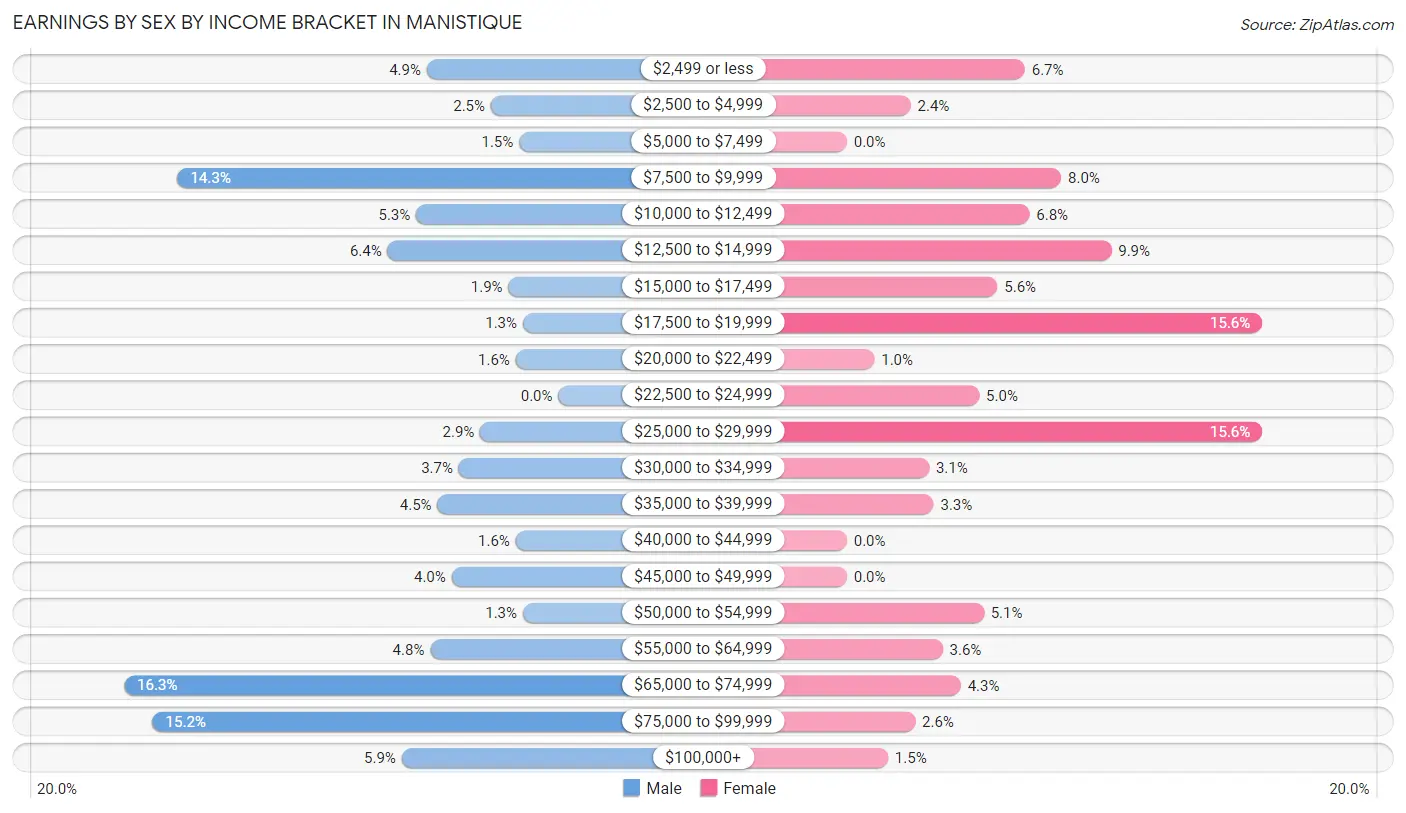
Earnings by Sex by Income Bracket in Manistique
The most common earnings brackets in Manistique are $65,000 to $74,999 for men (122 | 16.3%) and $17,500 to $19,999 for women (91 | 15.6%).
| Income | Male | Female |
| $2,499 or less | 37 (4.9%) | 39 (6.7%) |
| $2,500 to $4,999 | 19 (2.5%) | 14 (2.4%) |
| $5,000 to $7,499 | 11 (1.5%) | 0 (0.0%) |
| $7,500 to $9,999 | 107 (14.3%) | 47 (8.0%) |
| $10,000 to $12,499 | 40 (5.3%) | 40 (6.8%) |
| $12,500 to $14,999 | 48 (6.4%) | 58 (9.9%) |
| $15,000 to $17,499 | 14 (1.9%) | 33 (5.6%) |
| $17,500 to $19,999 | 10 (1.3%) | 91 (15.6%) |
| $20,000 to $22,499 | 12 (1.6%) | 6 (1.0%) |
| $22,500 to $24,999 | 0 (0.0%) | 29 (5.0%) |
| $25,000 to $29,999 | 22 (2.9%) | 91 (15.6%) |
| $30,000 to $34,999 | 28 (3.7%) | 18 (3.1%) |
| $35,000 to $39,999 | 34 (4.5%) | 19 (3.3%) |
| $40,000 to $44,999 | 12 (1.6%) | 0 (0.0%) |
| $45,000 to $49,999 | 30 (4.0%) | 0 (0.0%) |
| $50,000 to $54,999 | 10 (1.3%) | 30 (5.1%) |
| $55,000 to $64,999 | 36 (4.8%) | 21 (3.6%) |
| $65,000 to $74,999 | 122 (16.3%) | 25 (4.3%) |
| $75,000 to $99,999 | 114 (15.2%) | 15 (2.6%) |
| $100,000+ | 44 (5.9%) | 9 (1.5%) |
| Total | 750 (100.0%) | 585 (100.0%) |
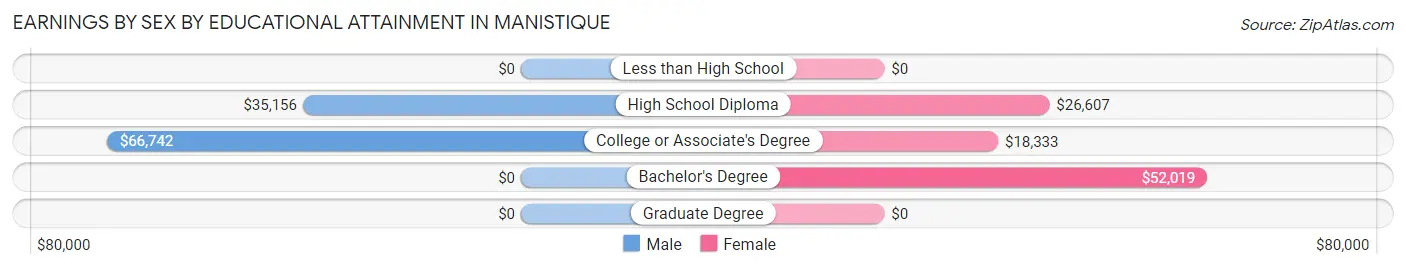
Earnings by Sex by Educational Attainment in Manistique
Average earnings in Manistique are $59,327 for men and $19,533 for women, a difference of 67.1%. Men with an educational attainment of college or associate's degree enjoy the highest average annual earnings of $66,742, while those with high school diploma education earn the least with $35,156. Women with an educational attainment of bachelor's degree earn the most with the average annual earnings of $52,019, while those with college or associate's degree education have the smallest earnings of $18,333.
| Educational Attainment | Male Income | Female Income |
| Less than High School | - | - |
| High School Diploma | $35,156 | $26,607 |
| College or Associate's Degree | $66,742 | $18,333 |
| Bachelor's Degree | - | - |
| Graduate Degree | - | - |
| Total | $59,327 | $19,533 |
Family Income in Manistique
Family Income Brackets in Manistique
According to the Manistique family income data, there are 160 families falling into the $50,000 to $74,999 income range, which is the most common income bracket and makes up 27.1% of all families. Conversely, the $15,000 to $24,999 income bracket is the least frequent group with only 11 families (1.9%) belonging to this category.
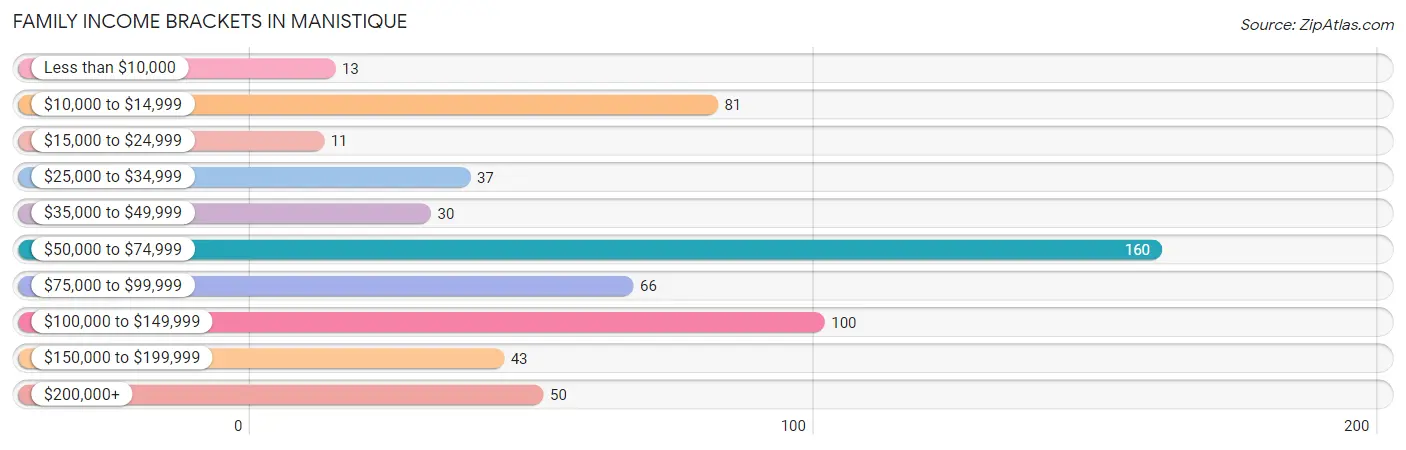
| Income Bracket | # Families | % Families |
| Less than $10,000 | 13 | 2.2% |
| $10,000 to $14,999 | 81 | 13.7% |
| $15,000 to $24,999 | 11 | 1.9% |
| $25,000 to $34,999 | 37 | 6.3% |
| $35,000 to $49,999 | 30 | 5.1% |
| $50,000 to $74,999 | 160 | 27.1% |
| $75,000 to $99,999 | 66 | 11.2% |
| $100,000 to $149,999 | 100 | 16.9% |
| $150,000 to $199,999 | 43 | 7.3% |
| $200,000+ | 50 | 8.5% |
Family Income by Famaliy Size in Manistique
2-person families (321 | 54.3%) account for the highest median family income in Manistique with $65,509 per family, while 2-person families (321 | 54.3%) have the highest median income of $32,754 per family member.
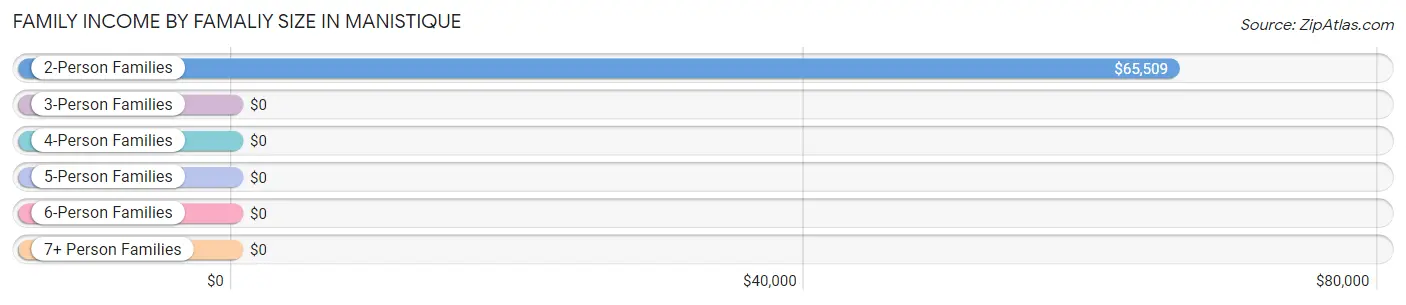
| Income Bracket | # Families | Median Income |
| 2-Person Families | 321 (54.3%) | $65,509 |
| 3-Person Families | 188 (31.8%) | $0 |
| 4-Person Families | 46 (7.8%) | $0 |
| 5-Person Families | 16 (2.7%) | $0 |
| 6-Person Families | 8 (1.3%) | $0 |
| 7+ Person Families | 12 (2.0%) | $0 |
| Total | 591 (100.0%) | $67,319 |
Family Income by Number of Earners in Manistique
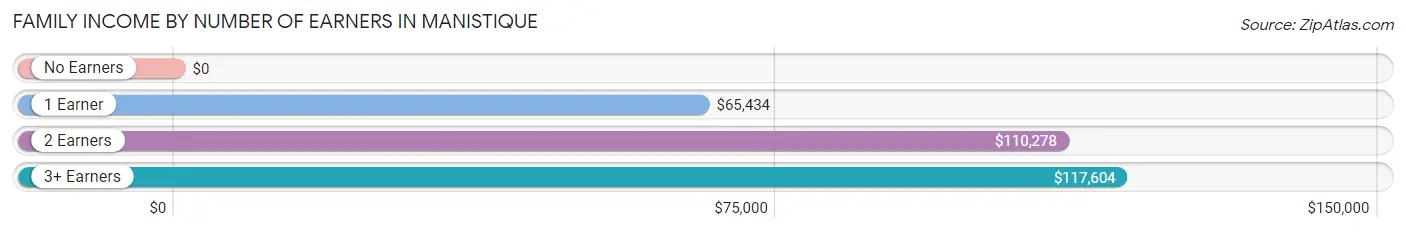
| Number of Earners | # Families | Median Income |
| No Earners | 127 (21.5%) | $0 |
| 1 Earner | 189 (32.0%) | $65,434 |
| 2 Earners | 198 (33.5%) | $110,278 |
| 3+ Earners | 77 (13.0%) | $117,604 |
| Total | 591 (100.0%) | $67,319 |
Household Income in Manistique
Household Income Brackets in Manistique
With 283 households falling in the category, the $15,000 to $24,999 income range is the most frequent in Manistique, accounting for 19.6% of all households. In contrast, only 43 households (3.0%) fall into the $150,000 to $199,999 income bracket, making it the least populous group.
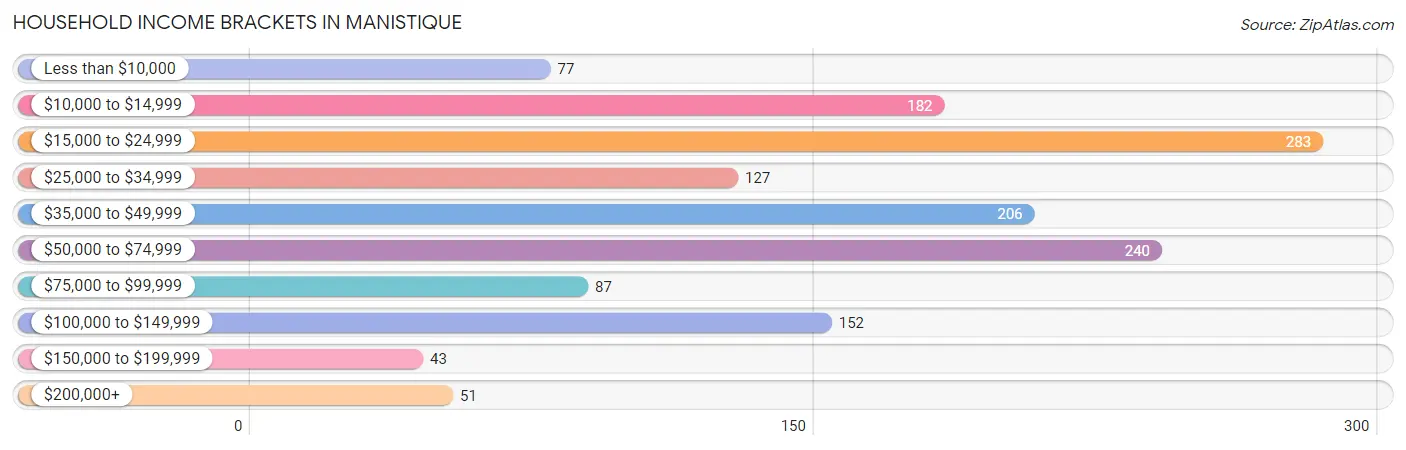
| Income Bracket | # Households | % Households |
| Less than $10,000 | 77 | 5.3% |
| $10,000 to $14,999 | 182 | 12.6% |
| $15,000 to $24,999 | 283 | 19.6% |
| $25,000 to $34,999 | 127 | 8.8% |
| $35,000 to $49,999 | 206 | 14.3% |
| $50,000 to $74,999 | 240 | 16.6% |
| $75,000 to $99,999 | 87 | 6.0% |
| $100,000 to $149,999 | 152 | 10.5% |
| $150,000 to $199,999 | 43 | 3.0% |
| $200,000+ | 51 | 3.5% |
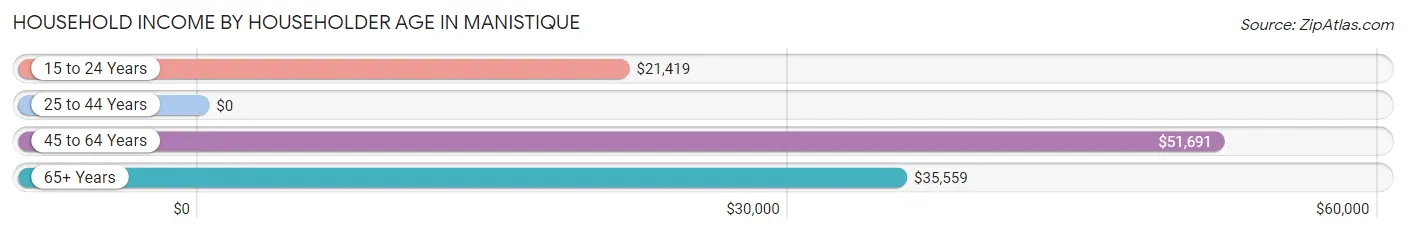
Household Income by Householder Age in Manistique
The median household income in Manistique is $36,588, with the highest median household income of $51,691 found in the 45 to 64 years age bracket for the primary householder. A total of 641 households (44.4%) fall into this category. Meanwhile, the 25 to 44 years age bracket for the primary householder has the lowest median household income of $0, with 253 households (17.5%) in this group.
| Income Bracket | # Households | Median Income |
| 15 to 24 Years | 107 (7.4%) | $21,419 |
| 25 to 44 Years | 253 (17.5%) | $0 |
| 45 to 64 Years | 641 (44.4%) | $51,691 |
| 65+ Years | 443 (30.7%) | $35,559 |
| Total | 1,444 (100.0%) | $36,588 |
Poverty in Manistique
Income Below Poverty by Sex and Age in Manistique
With 16.7% poverty level for males and 25.8% for females among the residents of Manistique, under 5 year old males and 65 to 74 year old females are the most vulnerable to poverty, with 37 males (82.2%) and 126 females (62.1%) in their respective age groups living below the poverty level.
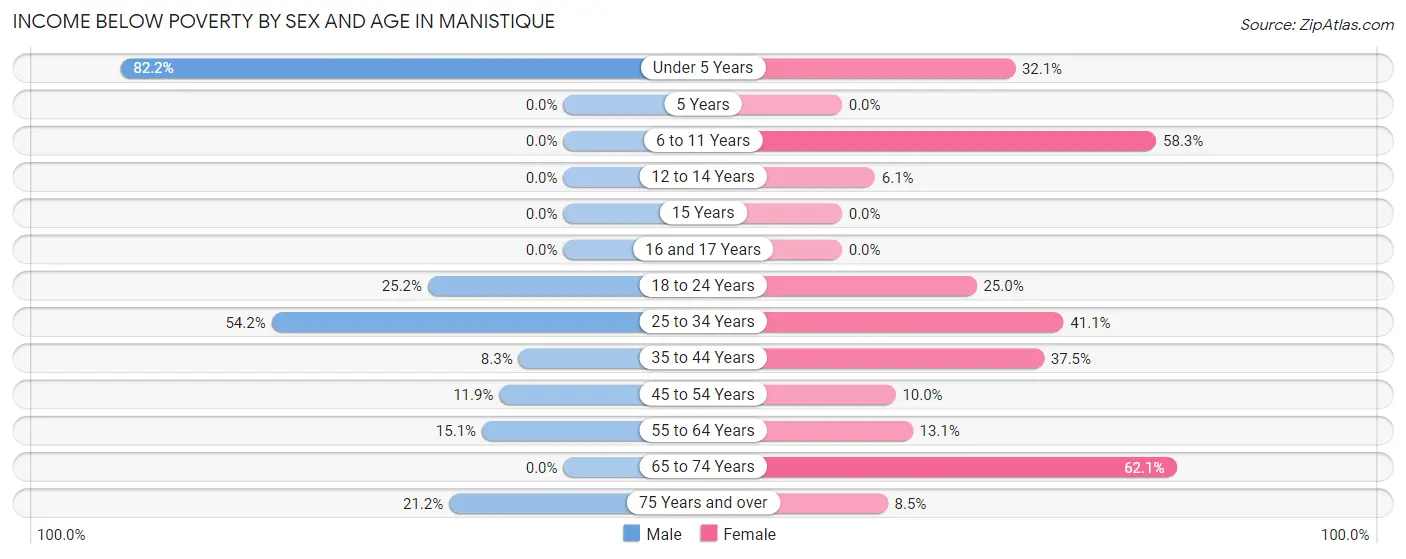
| Age Bracket | Male | Female |
| Under 5 Years | 37 (82.2%) | 18 (32.1%) |
| 5 Years | 0 (0.0%) | 0 (0.0%) |
| 6 to 11 Years | 0 (0.0%) | 28 (58.3%) |
| 12 to 14 Years | 0 (0.0%) | 7 (6.1%) |
| 15 Years | 0 (0.0%) | 0 (0.0%) |
| 16 and 17 Years | 0 (0.0%) | 0 (0.0%) |
| 18 to 24 Years | 42 (25.2%) | 23 (25.0%) |
| 25 to 34 Years | 39 (54.2%) | 51 (41.1%) |
| 35 to 44 Years | 13 (8.3%) | 54 (37.5%) |
| 45 to 54 Years | 25 (11.9%) | 25 (10.0%) |
| 55 to 64 Years | 39 (15.1%) | 39 (13.1%) |
| 65 to 74 Years | 0 (0.0%) | 126 (62.1%) |
| 75 Years and over | 14 (21.2%) | 13 (8.5%) |
| Total | 209 (16.7%) | 384 (25.8%) |
Income Above Poverty by Sex and Age in Manistique
According to the poverty statistics in Manistique, males aged 6 to 11 years and females aged 5 years are the age groups that are most secure financially, with 100.0% of males and 100.0% of females in these age groups living above the poverty line.
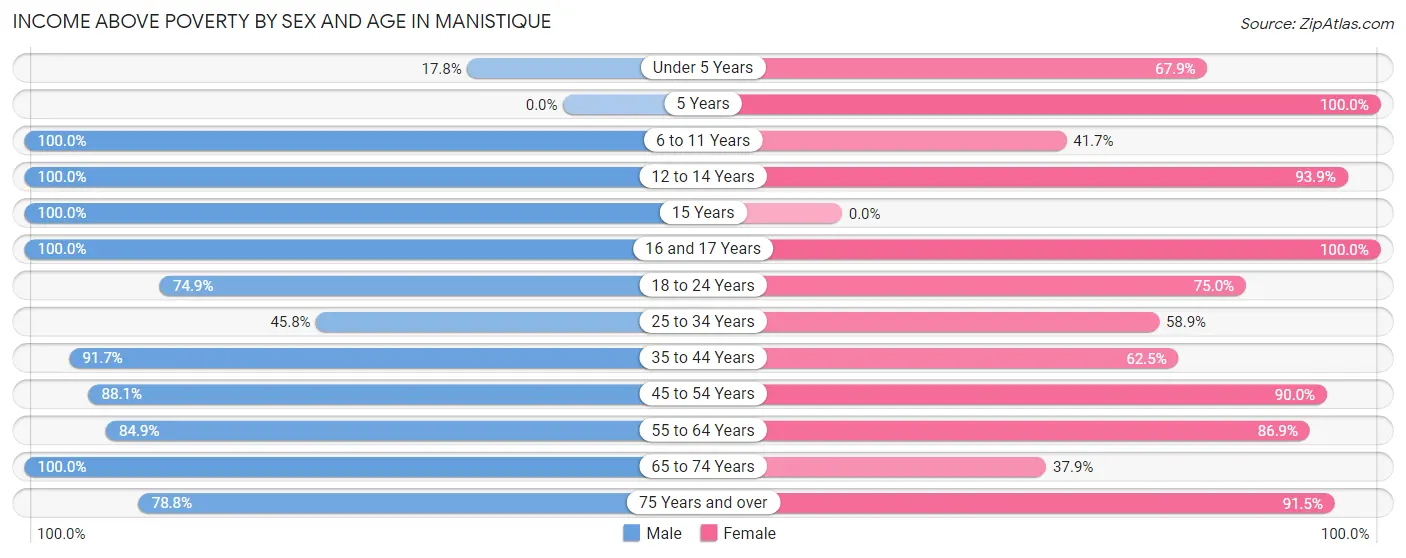
| Age Bracket | Male | Female |
| Under 5 Years | 8 (17.8%) | 38 (67.9%) |
| 5 Years | 0 (0.0%) | 4 (100.0%) |
| 6 to 11 Years | 65 (100.0%) | 20 (41.7%) |
| 12 to 14 Years | 5 (100.0%) | 107 (93.9%) |
| 15 Years | 28 (100.0%) | 0 (0.0%) |
| 16 and 17 Years | 50 (100.0%) | 3 (100.0%) |
| 18 to 24 Years | 125 (74.9%) | 69 (75.0%) |
| 25 to 34 Years | 33 (45.8%) | 73 (58.9%) |
| 35 to 44 Years | 143 (91.7%) | 90 (62.5%) |
| 45 to 54 Years | 185 (88.1%) | 226 (90.0%) |
| 55 to 64 Years | 219 (84.9%) | 258 (86.9%) |
| 65 to 74 Years | 132 (100.0%) | 77 (37.9%) |
| 75 Years and over | 52 (78.8%) | 140 (91.5%) |
| Total | 1,045 (83.3%) | 1,105 (74.2%) |
Income Below Poverty Among Married-Couple Families in Manistique
The poverty statistics for married-couple families in Manistique show that 14.9% or 64 of the total 430 families live below the poverty line. Families with 1 or 2 children have the highest poverty rate of 17.7%, comprising of 11 families. On the other hand, families with 3 or 4 children have the lowest poverty rate of 0.0%, which includes 0 families.
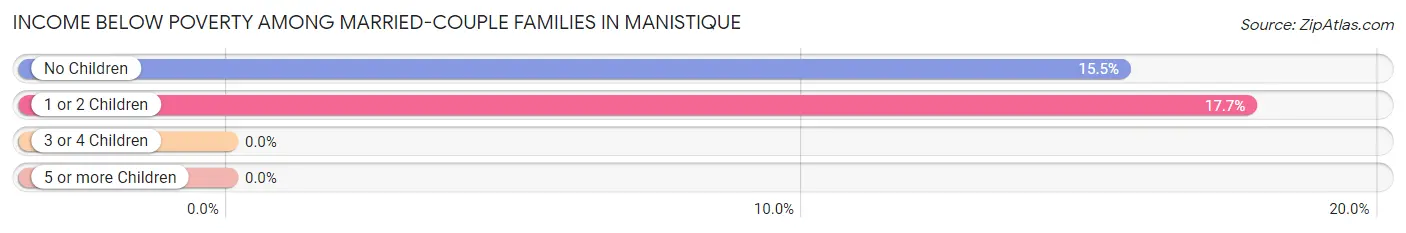
| Children | Above Poverty | Below Poverty |
| No Children | 288 (84.5%) | 53 (15.5%) |
| 1 or 2 Children | 51 (82.3%) | 11 (17.7%) |
| 3 or 4 Children | 15 (100.0%) | 0 (0.0%) |
| 5 or more Children | 12 (100.0%) | 0 (0.0%) |
| Total | 366 (85.1%) | 64 (14.9%) |
Income Below Poverty Among Single-Parent Households in Manistique
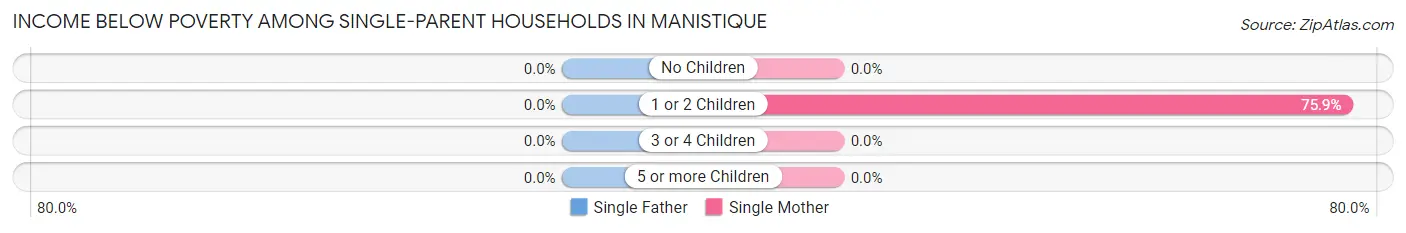
| Children | Single Father | Single Mother |
| No Children | 0 (0.0%) | 0 (0.0%) |
| 1 or 2 Children | 0 (0.0%) | 41 (75.9%) |
| 3 or 4 Children | 0 (0.0%) | 0 (0.0%) |
| 5 or more Children | 0 (0.0%) | 0 (0.0%) |
| Total | 0 (0.0%) | 41 (60.3%) |
Income Below Poverty Among Married-Couple vs Single-Parent Households in Manistique
The poverty data for Manistique shows that 64 of the married-couple family households (14.9%) and 41 of the single-parent households (25.5%) are living below the poverty level. Within the married-couple family households, those with 1 or 2 children have the highest poverty rate, with 11 households (17.7%) falling below the poverty line. Among the single-parent households, those with 1 or 2 children have the highest poverty rate, with 41 household (39.8%) living below poverty.
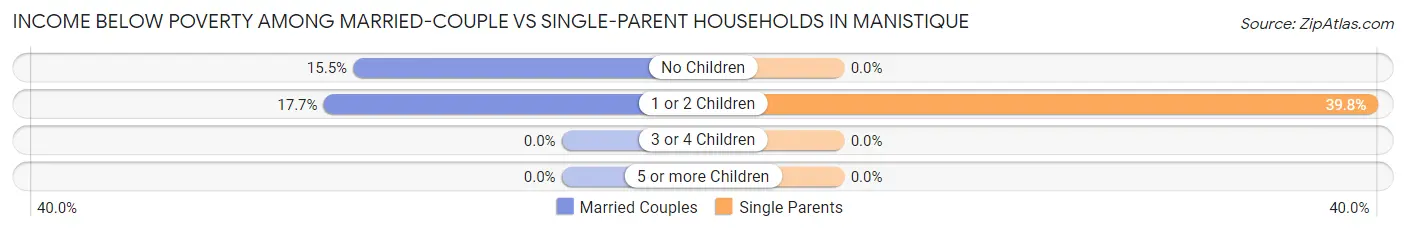
| Children | Married-Couple Families | Single-Parent Households |
| No Children | 53 (15.5%) | 0 (0.0%) |
| 1 or 2 Children | 11 (17.7%) | 41 (39.8%) |
| 3 or 4 Children | 0 (0.0%) | 0 (0.0%) |
| 5 or more Children | 0 (0.0%) | 0 (0.0%) |
| Total | 64 (14.9%) | 41 (25.5%) |
Race in Manistique
The most populous races in Manistique are White / Caucasian (2,326 | 82.0%), Two or more Races (307 | 10.8%), and Native / Alaskan (172 | 6.1%).
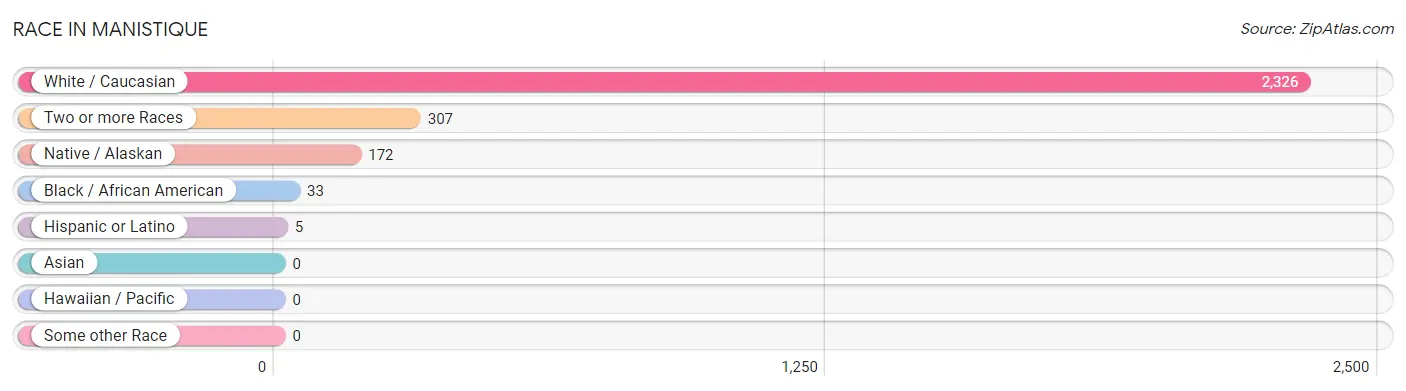
| Race | # Population | % Population |
| Asian | 0 | 0.0% |
| Black / African American | 33 | 1.2% |
| Hawaiian / Pacific | 0 | 0.0% |
| Hispanic or Latino | 5 | 0.2% |
| Native / Alaskan | 172 | 6.1% |
| White / Caucasian | 2,326 | 82.0% |
| Two or more Races | 307 | 10.8% |
| Some other Race | 0 | 0.0% |
| Total | 2,838 | 100.0% |
Ancestry in Manistique
The most populous ancestries reported in Manistique are German (576 | 20.3%), Chippewa (358 | 12.6%), English (348 | 12.3%), French (312 | 11.0%), and Irish (190 | 6.7%), together accounting for 62.8% of all Manistique residents.
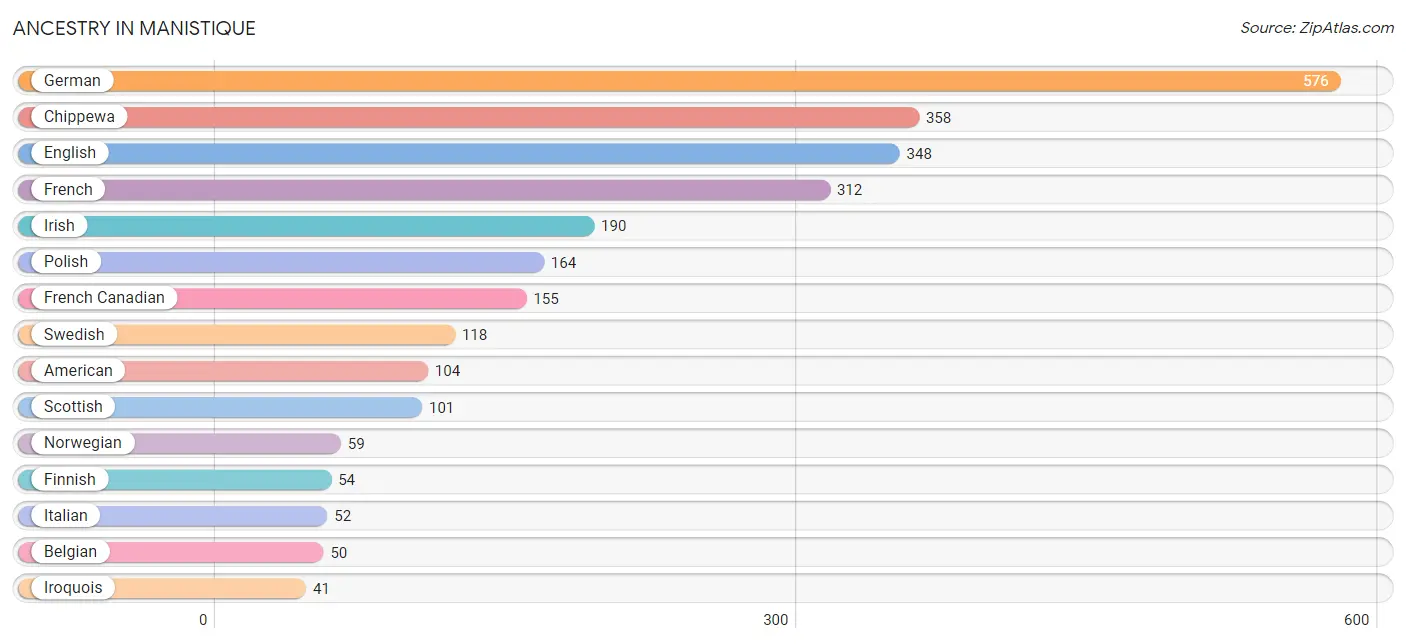
| Ancestry | # Population | % Population |
| American | 104 | 3.7% |
| Belgian | 50 | 1.8% |
| Central American | 5 | 0.2% |
| Chippewa | 358 | 12.6% |
| Czech | 37 | 1.3% |
| Czechoslovakian | 9 | 0.3% |
| Danish | 12 | 0.4% |
| Dutch | 37 | 1.3% |
| English | 348 | 12.3% |
| European | 34 | 1.2% |
| Finnish | 54 | 1.9% |
| French | 312 | 11.0% |
| French American Indian | 12 | 0.4% |
| French Canadian | 155 | 5.5% |
| German | 576 | 20.3% |
| Greek | 18 | 0.6% |
| Irish | 190 | 6.7% |
| Iroquois | 41 | 1.4% |
| Italian | 52 | 1.8% |
| Lithuanian | 15 | 0.5% |
| Lumbee | 1 | 0.0% |
| Norwegian | 59 | 2.1% |
| Ottawa | 14 | 0.5% |
| Polish | 164 | 5.8% |
| Salvadoran | 5 | 0.2% |
| Scandinavian | 18 | 0.6% |
| Scotch-Irish | 1 | 0.0% |
| Scottish | 101 | 3.6% |
| Slovak | 12 | 0.4% |
| Swedish | 118 | 4.2% |
| Welsh | 9 | 0.3% | View All 31 Rows |
Immigrants in Manistique
The most numerous immigrant groups reported in Manistique came from , and Canada (11 | 0.4%), together accounting for 0.4% of all Manistique residents.

| Immigration Origin | # Population | % Population |
| Canada | 11 | 0.4% | View All 1 Rows |
Sex and Age in Manistique
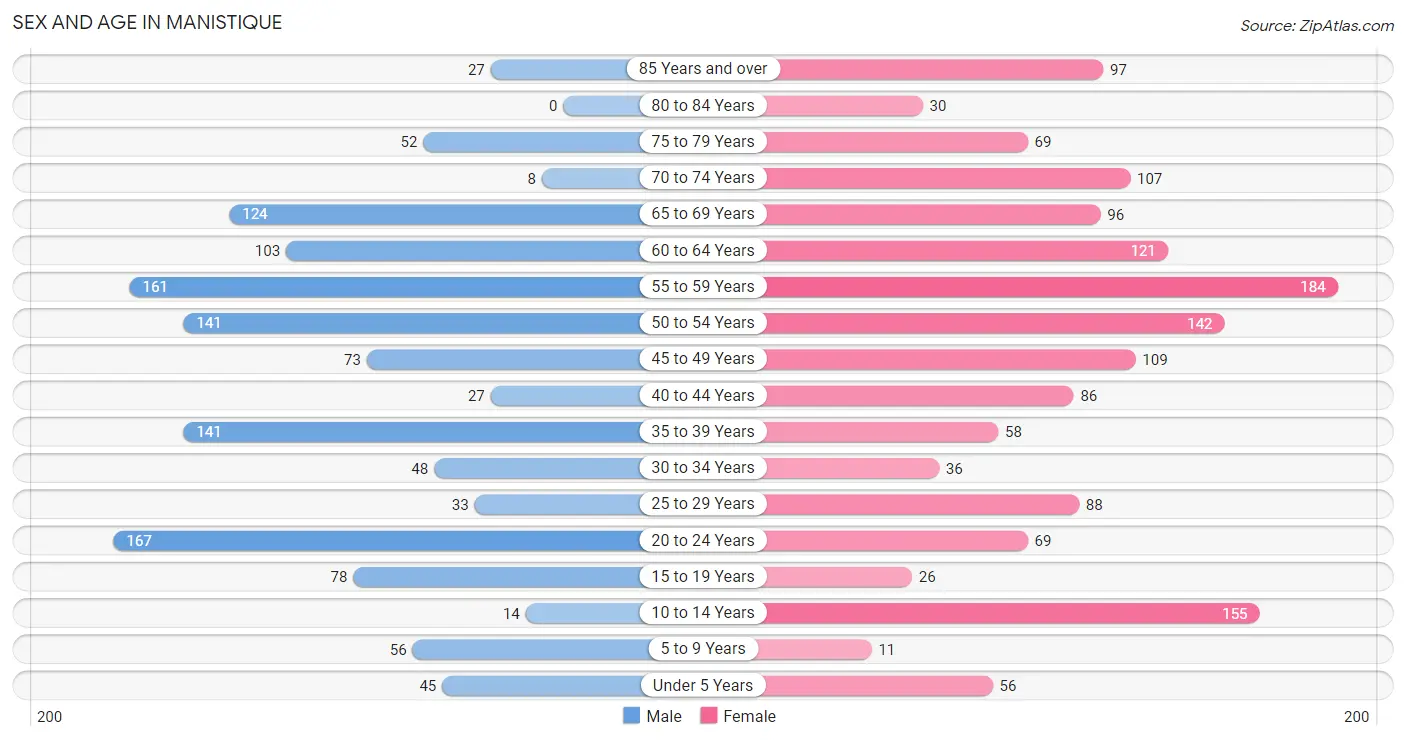
Sex and Age in Manistique
The most populous age groups in Manistique are 20 to 24 Years (167 | 12.9%) for men and 55 to 59 Years (184 | 11.9%) for women.
| Age Bracket | Male | Female |
| Under 5 Years | 45 (3.5%) | 56 (3.6%) |
| 5 to 9 Years | 56 (4.3%) | 11 (0.7%) |
| 10 to 14 Years | 14 (1.1%) | 155 (10.1%) |
| 15 to 19 Years | 78 (6.0%) | 26 (1.7%) |
| 20 to 24 Years | 167 (12.9%) | 69 (4.5%) |
| 25 to 29 Years | 33 (2.5%) | 88 (5.7%) |
| 30 to 34 Years | 48 (3.7%) | 36 (2.3%) |
| 35 to 39 Years | 141 (10.9%) | 58 (3.8%) |
| 40 to 44 Years | 27 (2.1%) | 86 (5.6%) |
| 45 to 49 Years | 73 (5.6%) | 109 (7.1%) |
| 50 to 54 Years | 141 (10.9%) | 142 (9.2%) |
| 55 to 59 Years | 161 (12.4%) | 184 (11.9%) |
| 60 to 64 Years | 103 (7.9%) | 121 (7.9%) |
| 65 to 69 Years | 124 (9.6%) | 96 (6.2%) |
| 70 to 74 Years | 8 (0.6%) | 107 (7.0%) |
| 75 to 79 Years | 52 (4.0%) | 69 (4.5%) |
| 80 to 84 Years | 0 (0.0%) | 30 (1.9%) |
| 85 Years and over | 27 (2.1%) | 97 (6.3%) |
| Total | 1,298 (100.0%) | 1,540 (100.0%) |
Families and Households in Manistique
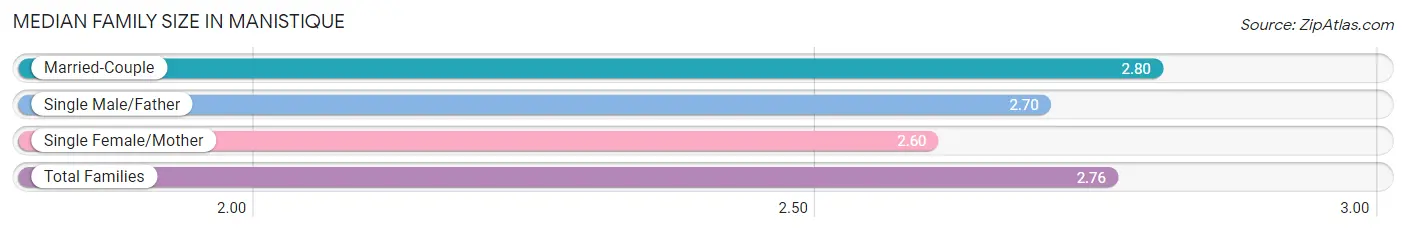
Median Family Size in Manistique
The median family size in Manistique is 2.76 persons per family, with married-couple families (430 | 72.8%) accounting for the largest median family size of 2.8 persons per family. On the other hand, single female/mother families (68 | 11.5%) represent the smallest median family size with 2.60 persons per family.
| Family Type | # Families | Family Size |
| Married-Couple | 430 (72.8%) | 2.80 |
| Single Male/Father | 93 (15.7%) | 2.70 |
| Single Female/Mother | 68 (11.5%) | 2.60 |
| Total Families | 591 (100.0%) | 2.76 |
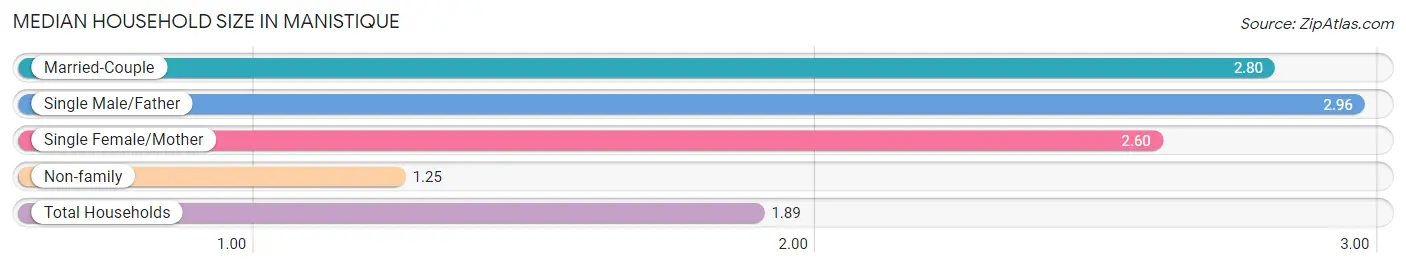
Median Household Size in Manistique
The median household size in Manistique is 1.89 persons per household, with single male/father households (93 | 6.4%) accounting for the largest median household size of 2.96 persons per household. non-family households (853 | 59.1%) represent the smallest median household size with 1.25 persons per household.
| Household Type | # Households | Household Size |
| Married-Couple | 430 (29.8%) | 2.80 |
| Single Male/Father | 93 (6.4%) | 2.96 |
| Single Female/Mother | 68 (4.7%) | 2.60 |
| Non-family | 853 (59.1%) | 1.25 |
| Total Households | 1,444 (100.0%) | 1.89 |
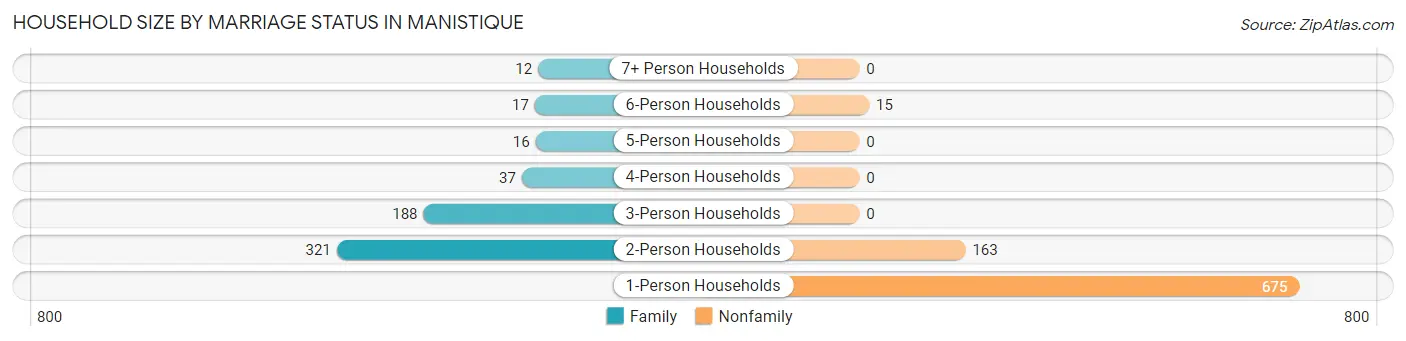
Household Size by Marriage Status in Manistique
Out of a total of 1,444 households in Manistique, 591 (40.9%) are family households, while 853 (59.1%) are nonfamily households. The most numerous type of family households are 2-person households, comprising 321, and the most common type of nonfamily households are 1-person households, comprising 675.
| Household Size | Family Households | Nonfamily Households |
| 1-Person Households | - | 675 (46.8%) |
| 2-Person Households | 321 (22.2%) | 163 (11.3%) |
| 3-Person Households | 188 (13.0%) | 0 (0.0%) |
| 4-Person Households | 37 (2.6%) | 0 (0.0%) |
| 5-Person Households | 16 (1.1%) | 0 (0.0%) |
| 6-Person Households | 17 (1.2%) | 15 (1.0%) |
| 7+ Person Households | 12 (0.8%) | 0 (0.0%) |
| Total | 591 (40.9%) | 853 (59.1%) |
Female Fertility in Manistique
Fertility by Age in Manistique
Average fertility rate in Manistique is 43.0 births per 1,000 women. Women in the age bracket of 20 to 34 years have the highest fertility rate with 114.0 births per 1,000 women. Women in the age bracket of 20 to 34 years acount for 100.0% of all women with births.
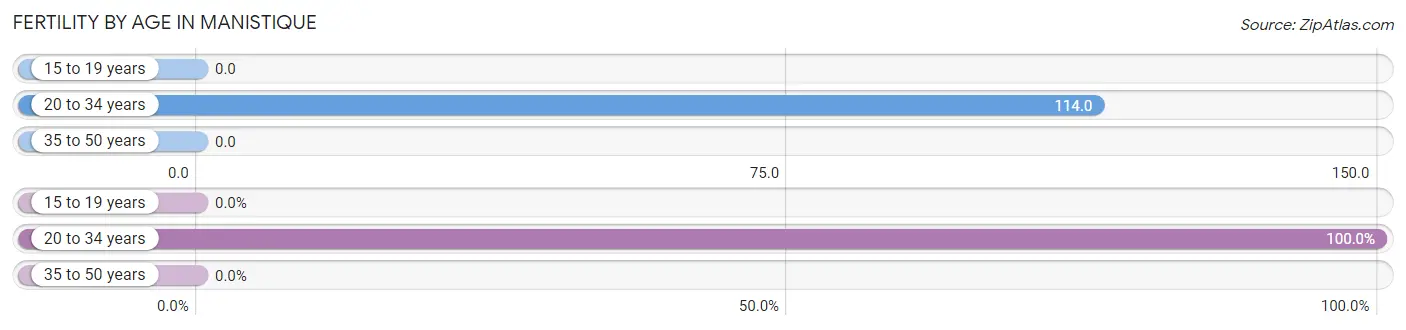
| Age Bracket | Women with Births | Births / 1,000 Women |
| 15 to 19 years | 0 (0.0%) | 0.0 |
| 20 to 34 years | 22 (100.0%) | 114.0 |
| 35 to 50 years | 0 (0.0%) | 0.0 |
| Total | 22 (100.0%) | 43.0 |
Fertility by Age by Marriage Status in Manistique
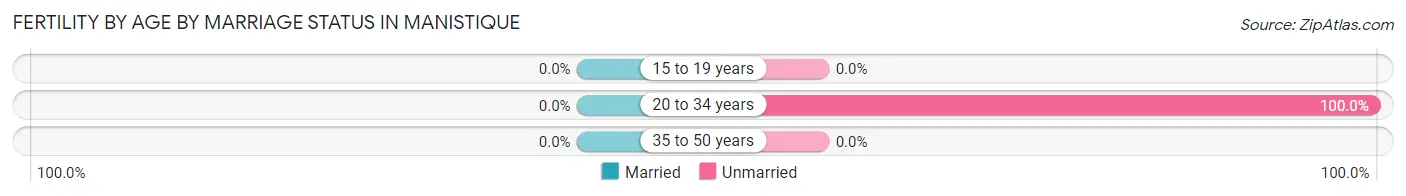
| Age Bracket | Married | Unmarried |
| 15 to 19 years | 0 (0.0%) | 0 (0.0%) |
| 20 to 34 years | 0 (0.0%) | 22 (100.0%) |
| 35 to 50 years | 0 (0.0%) | 0 (0.0%) |
| Total | 0 (0.0%) | 22 (100.0%) |
Fertility by Education in Manistique
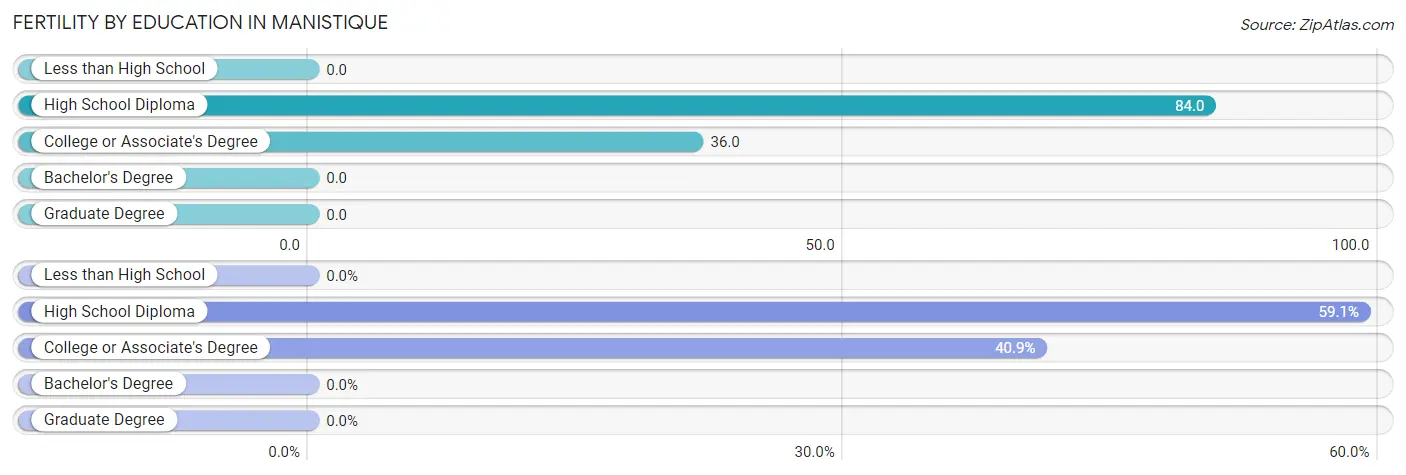
| Educational Attainment | Women with Births | Births / 1,000 Women |
| Less than High School | 0 (0.0%) | 0.0 |
| High School Diploma | 13 (59.1%) | 84.0 |
| College or Associate's Degree | 9 (40.9%) | 36.0 |
| Bachelor's Degree | 0 (0.0%) | 0.0 |
| Graduate Degree | 0 (0.0%) | 0.0 |
| Total | 22 (100.0%) | 43.0 |
Fertility by Education by Marriage Status in Manistique
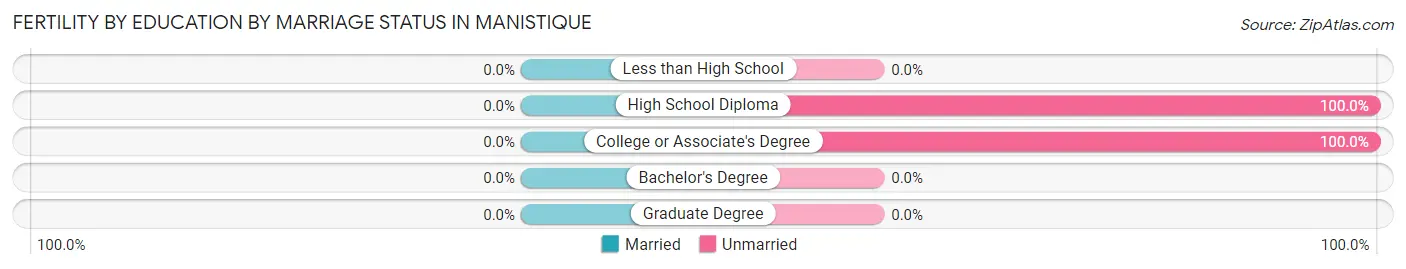
| Educational Attainment | Married | Unmarried |
| Less than High School | 0 (0.0%) | 0 (0.0%) |
| High School Diploma | 0 (0.0%) | 13 (100.0%) |
| College or Associate's Degree | 0 (0.0%) | 9 (100.0%) |
| Bachelor's Degree | 0 (0.0%) | 0 (0.0%) |
| Graduate Degree | 0 (0.0%) | 0 (0.0%) |
| Total | 0 (0.0%) | 22 (100.0%) |
Employment Characteristics in Manistique
Employment by Class of Employer in Manistique
Among the 1,285 employed individuals in Manistique, private company employees (813 | 63.3%), local government employees (190 | 14.8%), and self-employed (incorporated) (103 | 8.0%) make up the most common classes of employment.
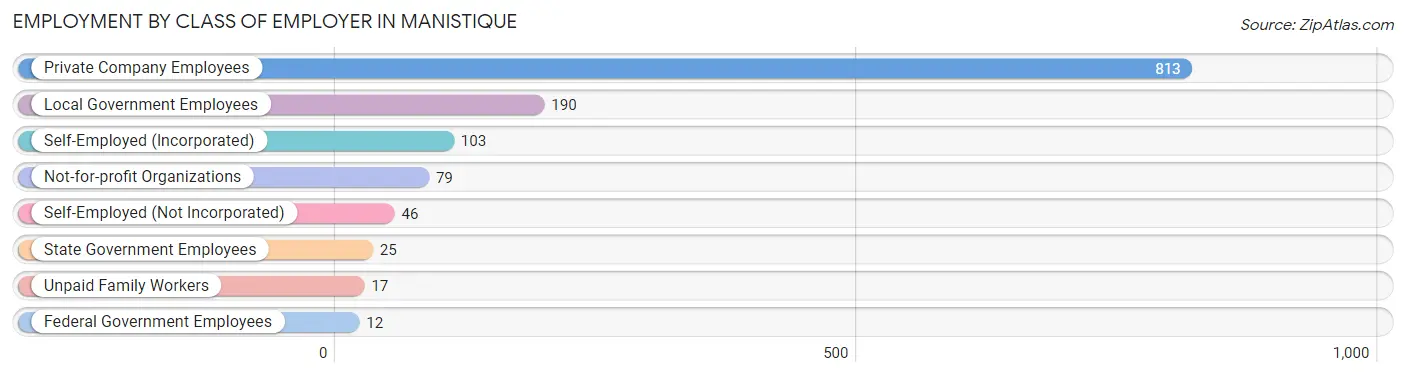
| Employer Class | # Employees | % Employees |
| Private Company Employees | 813 | 63.3% |
| Self-Employed (Incorporated) | 103 | 8.0% |
| Self-Employed (Not Incorporated) | 46 | 3.6% |
| Not-for-profit Organizations | 79 | 6.1% |
| Local Government Employees | 190 | 14.8% |
| State Government Employees | 25 | 1.9% |
| Federal Government Employees | 12 | 0.9% |
| Unpaid Family Workers | 17 | 1.3% |
| Total | 1,285 | 100.0% |
Employment Status by Age in Manistique
According to the labor force statistics for Manistique, out of the total population over 16 years of age (2,473), 56.9% or 1,407 individuals are in the labor force, with 8.6% or 121 of them unemployed. The age group with the highest labor force participation rate is 25 to 29 years, with 87.6% or 106 individuals in the labor force. Within the labor force, the 25 to 29 years age range has the highest percentage of unemployed individuals, with 27.4% or 29 of them being unemployed.
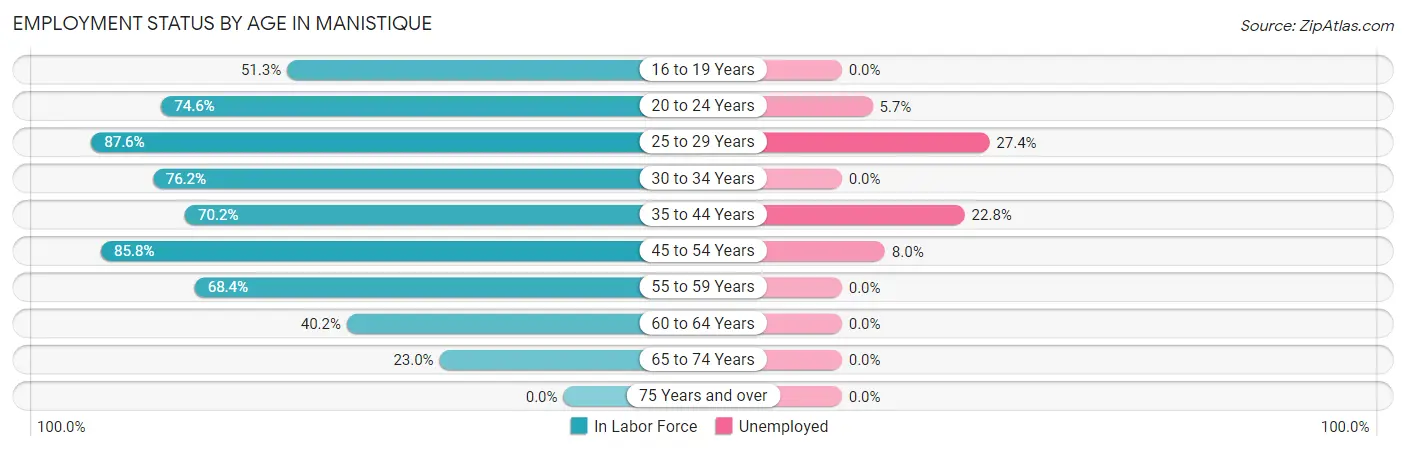
| Age Bracket | In Labor Force | Unemployed |
| 16 to 19 Years | 39 (51.3%) | 0 (0.0%) |
| 20 to 24 Years | 176 (74.6%) | 10 (5.7%) |
| 25 to 29 Years | 106 (87.6%) | 29 (27.4%) |
| 30 to 34 Years | 64 (76.2%) | 0 (0.0%) |
| 35 to 44 Years | 219 (70.2%) | 50 (22.8%) |
| 45 to 54 Years | 399 (85.8%) | 32 (8.0%) |
| 55 to 59 Years | 236 (68.4%) | 0 (0.0%) |
| 60 to 64 Years | 90 (40.2%) | 0 (0.0%) |
| 65 to 74 Years | 77 (23.0%) | 0 (0.0%) |
| 75 Years and over | 0 (0.0%) | 0 (0.0%) |
| Total | 1,407 (56.9%) | 121 (8.6%) |
Employment Status by Educational Attainment in Manistique
According to labor force statistics for Manistique, 71.8% of individuals (1,114) out of the total population between 25 and 64 years of age (1,551) are in the labor force, with 10.0% or 111 of them being unemployed. The group with the highest labor force participation rate are those with the educational attainment of college / associate degree, with 94.8% or 495 individuals in the labor force. Within the labor force, individuals with less than high school education have the highest percentage of unemployment, with 39.7% or 29 of them being unemployed.
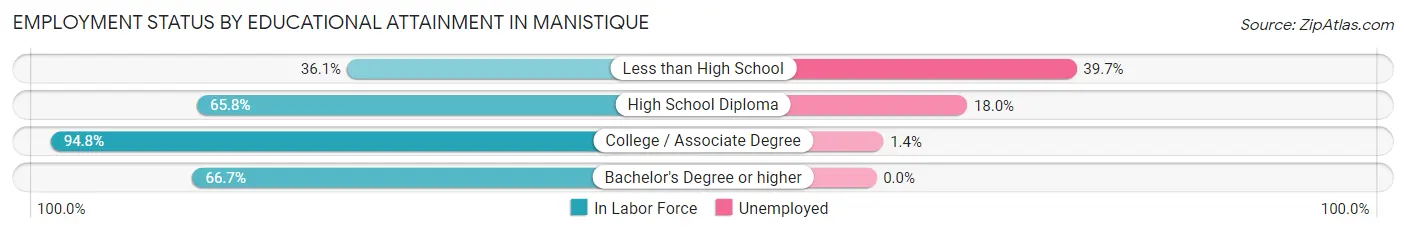
| Educational Attainment | In Labor Force | Unemployed |
| Less than High School | 73 (36.1%) | 80 (39.7%) |
| High School Diploma | 416 (65.8%) | 114 (18.0%) |
| College / Associate Degree | 495 (94.8%) | 7 (1.4%) |
| Bachelor's Degree or higher | 130 (66.7%) | 0 (0.0%) |
| Total | 1,114 (71.8%) | 155 (10.0%) |
Employment Occupations by Sex in Manistique
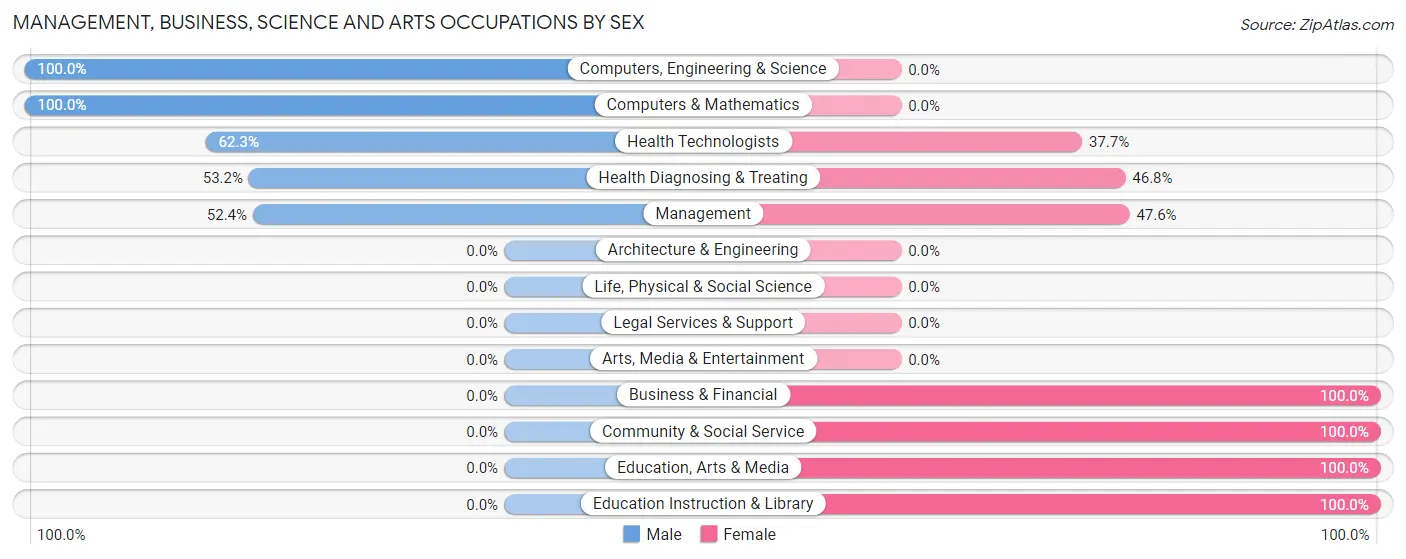
Management, Business, Science and Arts Occupations
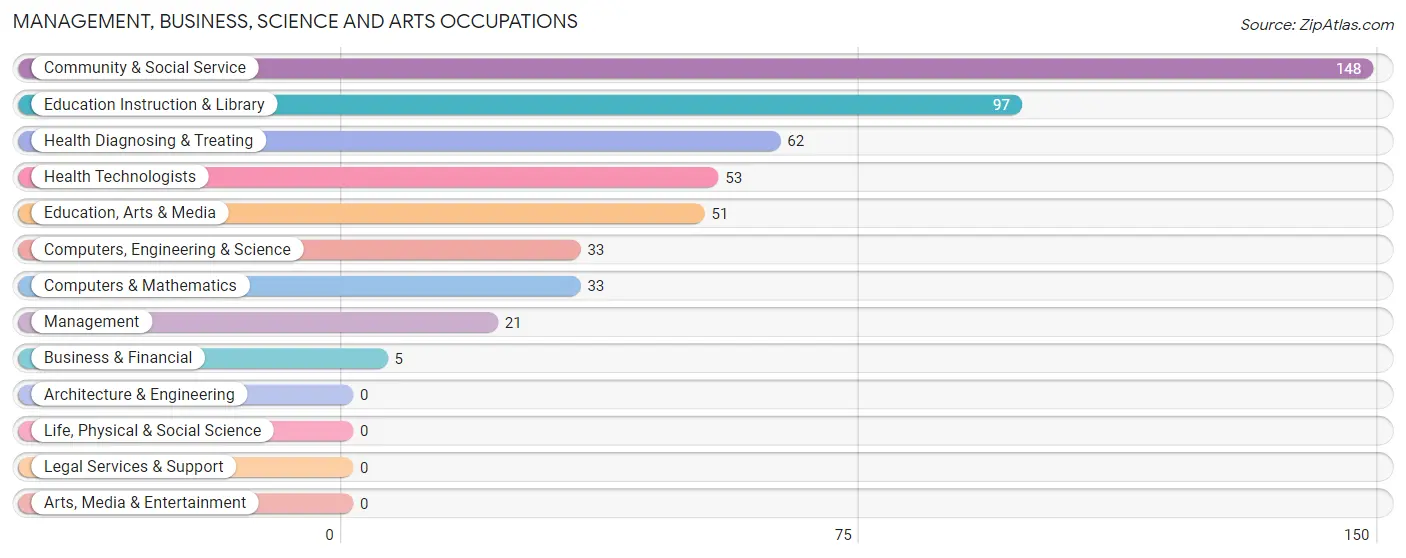
The most common Management, Business, Science and Arts occupations in Manistique are Community & Social Service (148 | 11.5%), Education Instruction & Library (97 | 7.5%), Health Diagnosing & Treating (62 | 4.8%), Health Technologists (53 | 4.1%), and Education, Arts & Media (51 | 4.0%).
Management, Business, Science and Arts Occupations by Sex
Within the Management, Business, Science and Arts occupations in Manistique, the most male-oriented occupations are Computers, Engineering & Science (100.0%), Computers & Mathematics (100.0%), and Health Technologists (62.3%), while the most female-oriented occupations are Business & Financial (100.0%), Community & Social Service (100.0%), and Education, Arts & Media (100.0%).
| Occupation | Male | Female |
| Management | 11 (52.4%) | 10 (47.6%) |
| Business & Financial | 0 (0.0%) | 5 (100.0%) |
| Computers, Engineering & Science | 33 (100.0%) | 0 (0.0%) |
| Computers & Mathematics | 33 (100.0%) | 0 (0.0%) |
| Architecture & Engineering | 0 (0.0%) | 0 (0.0%) |
| Life, Physical & Social Science | 0 (0.0%) | 0 (0.0%) |
| Community & Social Service | 0 (0.0%) | 148 (100.0%) |
| Education, Arts & Media | 0 (0.0%) | 51 (100.0%) |
| Legal Services & Support | 0 (0.0%) | 0 (0.0%) |
| Education Instruction & Library | 0 (0.0%) | 97 (100.0%) |
| Arts, Media & Entertainment | 0 (0.0%) | 0 (0.0%) |
| Health Diagnosing & Treating | 33 (53.2%) | 29 (46.8%) |
| Health Technologists | 33 (62.3%) | 20 (37.7%) |
| Total (Category) | 77 (28.6%) | 192 (71.4%) |
| Total (Overall) | 738 (57.4%) | 547 (42.6%) |
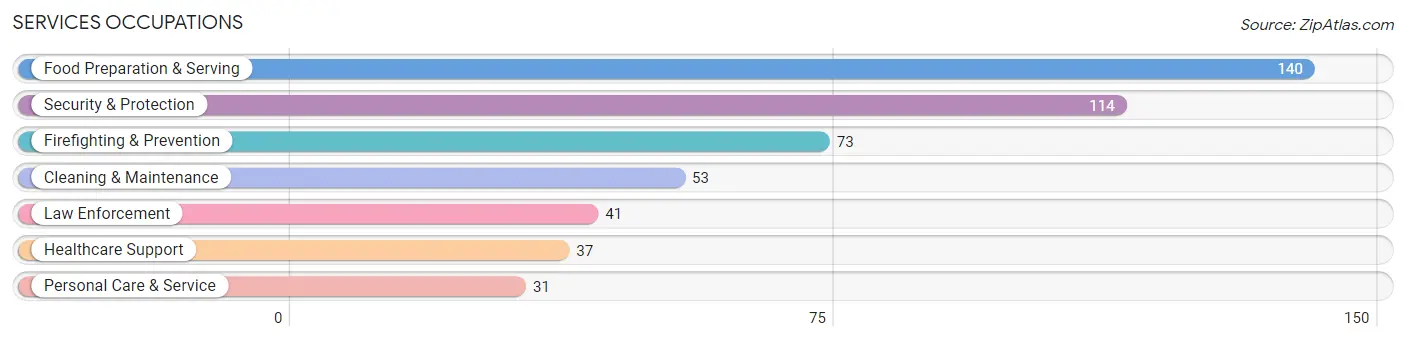
Services Occupations
The most common Services occupations in Manistique are Food Preparation & Serving (140 | 10.9%), Security & Protection (114 | 8.9%), Firefighting & Prevention (73 | 5.7%), Cleaning & Maintenance (53 | 4.1%), and Law Enforcement (41 | 3.2%).
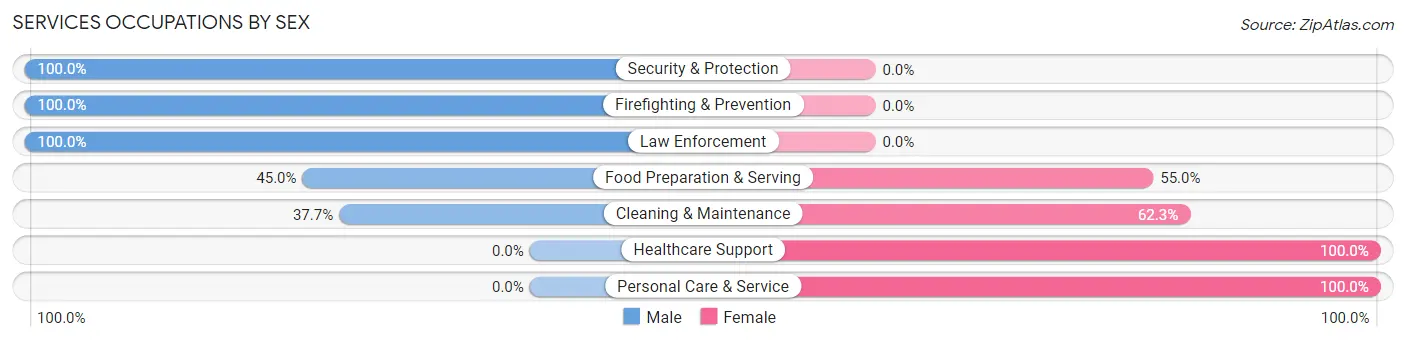
Services Occupations by Sex
Within the Services occupations in Manistique, the most male-oriented occupations are Security & Protection (100.0%), Firefighting & Prevention (100.0%), and Law Enforcement (100.0%), while the most female-oriented occupations are Healthcare Support (100.0%), Personal Care & Service (100.0%), and Cleaning & Maintenance (62.3%).
| Occupation | Male | Female |
| Healthcare Support | 0 (0.0%) | 37 (100.0%) |
| Security & Protection | 114 (100.0%) | 0 (0.0%) |
| Firefighting & Prevention | 73 (100.0%) | 0 (0.0%) |
| Law Enforcement | 41 (100.0%) | 0 (0.0%) |
| Food Preparation & Serving | 63 (45.0%) | 77 (55.0%) |
| Cleaning & Maintenance | 20 (37.7%) | 33 (62.3%) |
| Personal Care & Service | 0 (0.0%) | 31 (100.0%) |
| Total (Category) | 197 (52.5%) | 178 (47.5%) |
| Total (Overall) | 738 (57.4%) | 547 (42.6%) |
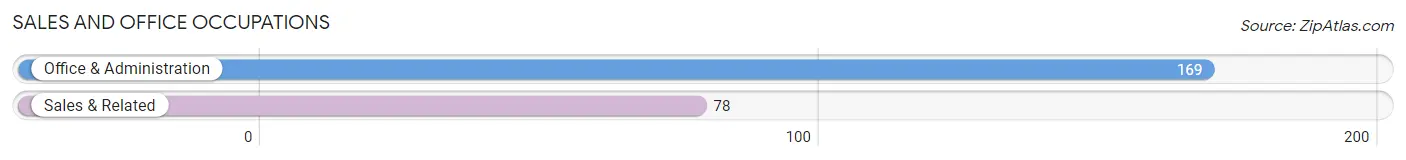
Sales and Office Occupations
The most common Sales and Office occupations in Manistique are Office & Administration (169 | 13.2%), and Sales & Related (78 | 6.1%).
Sales and Office Occupations by Sex
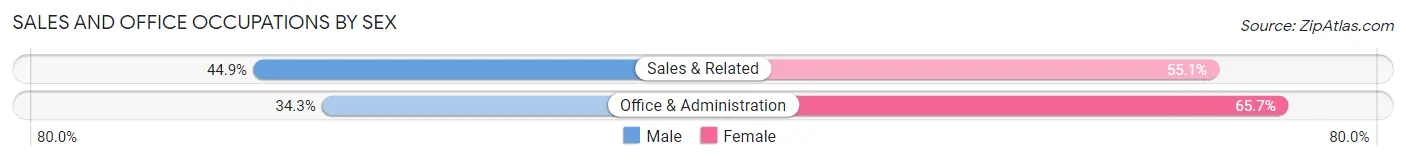
| Occupation | Male | Female |
| Sales & Related | 35 (44.9%) | 43 (55.1%) |
| Office & Administration | 58 (34.3%) | 111 (65.7%) |
| Total (Category) | 93 (37.7%) | 154 (62.4%) |
| Total (Overall) | 738 (57.4%) | 547 (42.6%) |
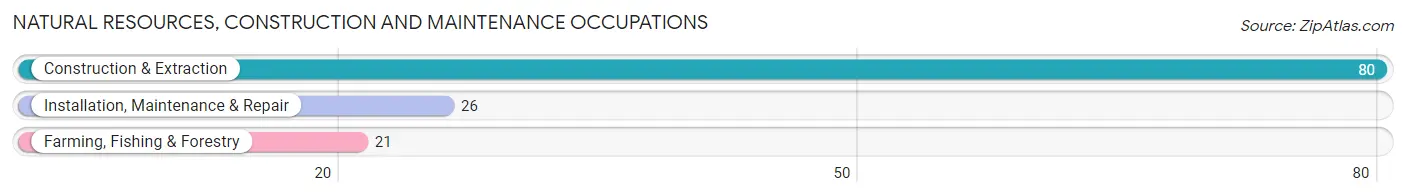
Natural Resources, Construction and Maintenance Occupations
The most common Natural Resources, Construction and Maintenance occupations in Manistique are Construction & Extraction (80 | 6.2%), Installation, Maintenance & Repair (26 | 2.0%), and Farming, Fishing & Forestry (21 | 1.6%).
Natural Resources, Construction and Maintenance Occupations by Sex
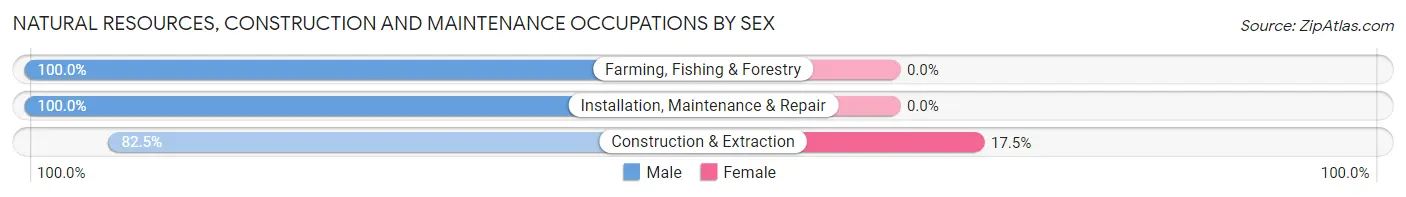
| Occupation | Male | Female |
| Farming, Fishing & Forestry | 21 (100.0%) | 0 (0.0%) |
| Construction & Extraction | 66 (82.5%) | 14 (17.5%) |
| Installation, Maintenance & Repair | 26 (100.0%) | 0 (0.0%) |
| Total (Category) | 113 (89.0%) | 14 (11.0%) |
| Total (Overall) | 738 (57.4%) | 547 (42.6%) |
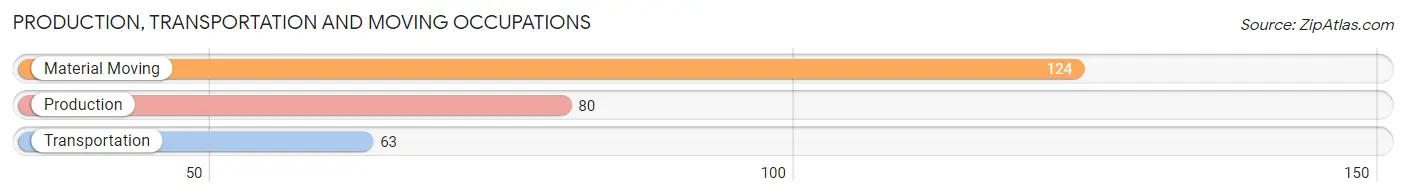
Production, Transportation and Moving Occupations
The most common Production, Transportation and Moving occupations in Manistique are Material Moving (124 | 9.7%), Production (80 | 6.2%), and Transportation (63 | 4.9%).
Production, Transportation and Moving Occupations by Sex
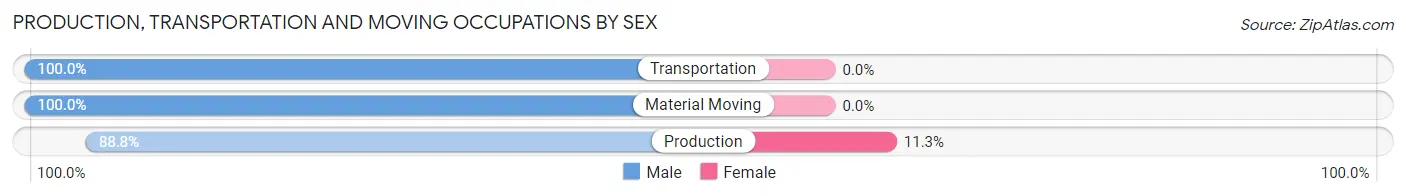
| Occupation | Male | Female |
| Production | 71 (88.7%) | 9 (11.3%) |
| Transportation | 63 (100.0%) | 0 (0.0%) |
| Material Moving | 124 (100.0%) | 0 (0.0%) |
| Total (Category) | 258 (96.6%) | 9 (3.4%) |
| Total (Overall) | 738 (57.4%) | 547 (42.6%) |
Employment Industries by Sex in Manistique
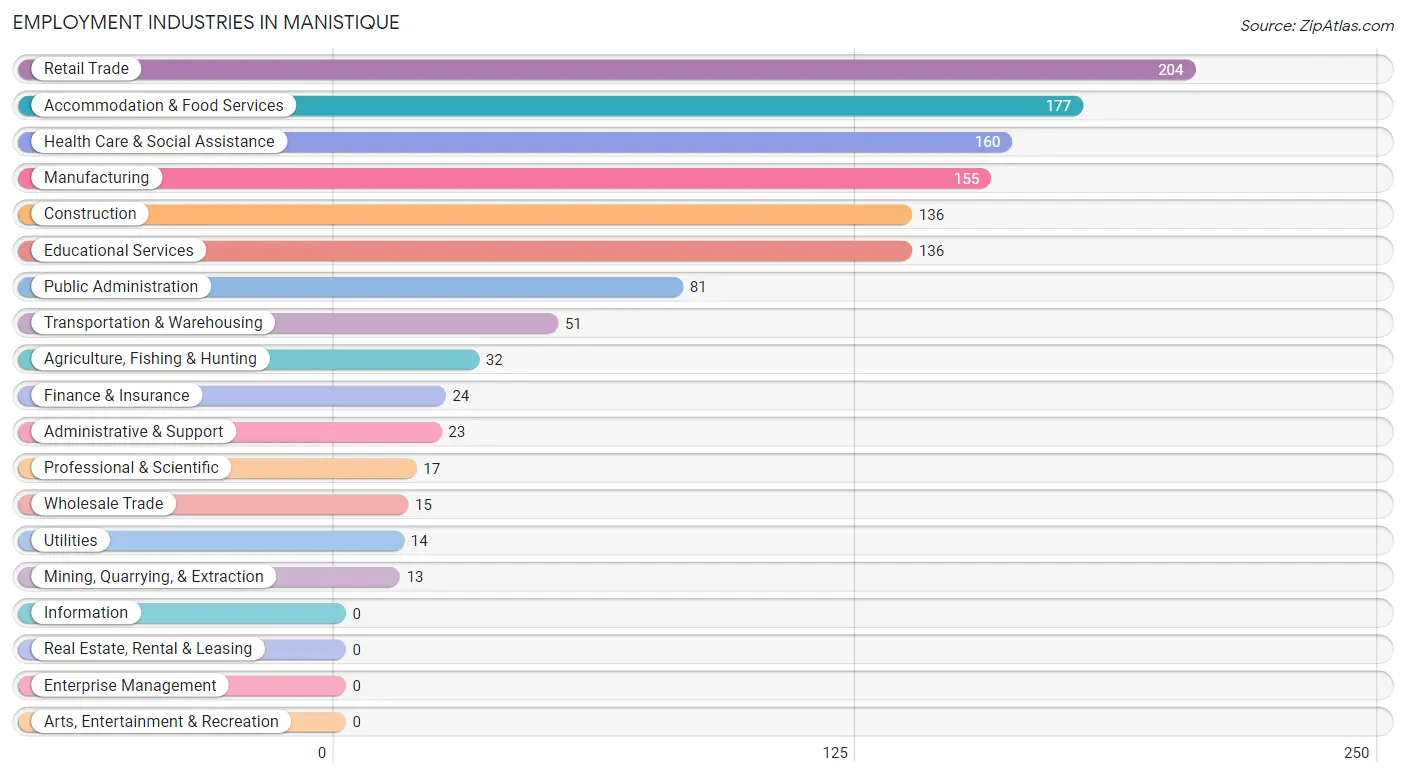
Employment Industries in Manistique
The major employment industries in Manistique include Retail Trade (204 | 15.9%), Accommodation & Food Services (177 | 13.8%), Health Care & Social Assistance (160 | 12.4%), Manufacturing (155 | 12.1%), and Construction (136 | 10.6%).
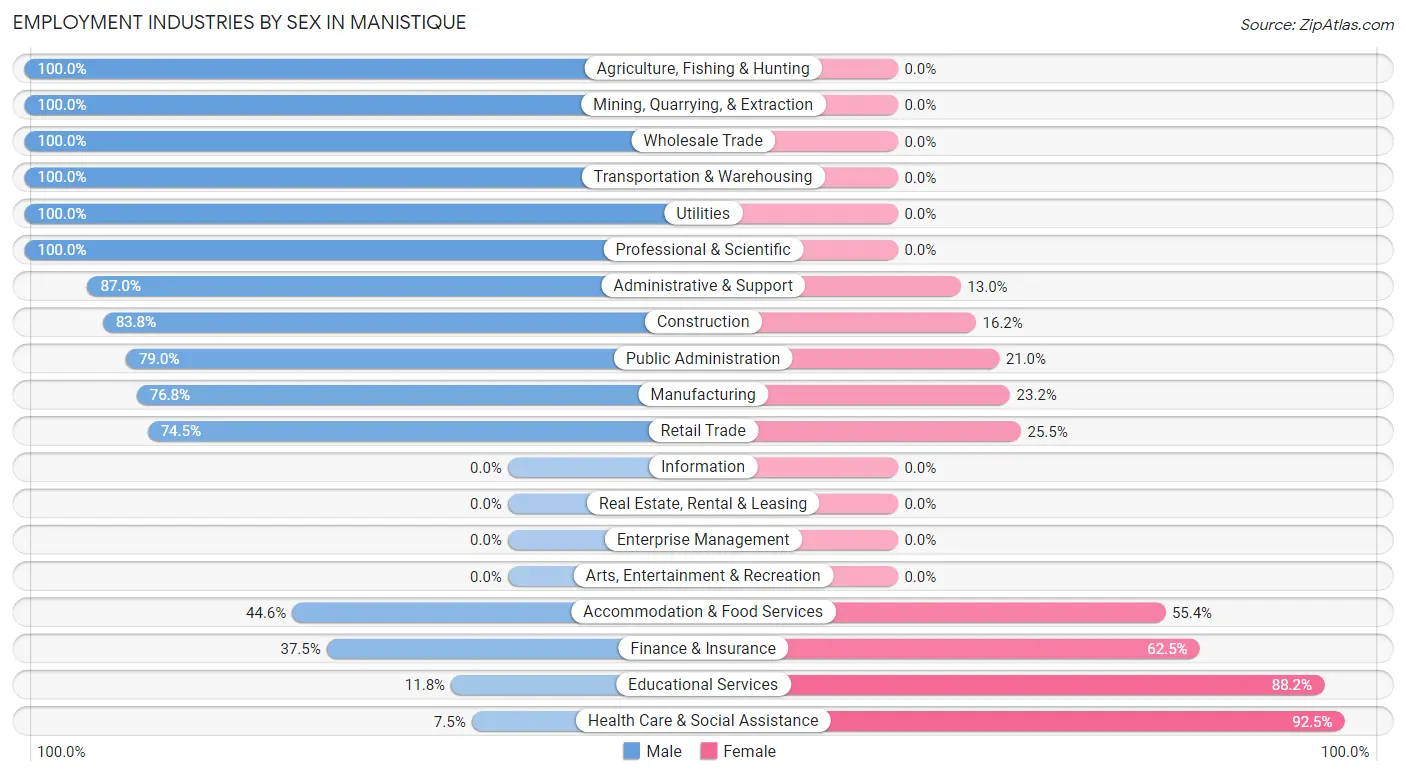
Employment Industries by Sex in Manistique
The Manistique industries that see more men than women are Agriculture, Fishing & Hunting (100.0%), Mining, Quarrying, & Extraction (100.0%), and Wholesale Trade (100.0%), whereas the industries that tend to have a higher number of women are Health Care & Social Assistance (92.5%), Educational Services (88.2%), and Finance & Insurance (62.5%).
| Industry | Male | Female |
| Agriculture, Fishing & Hunting | 32 (100.0%) | 0 (0.0%) |
| Mining, Quarrying, & Extraction | 13 (100.0%) | 0 (0.0%) |
| Construction | 114 (83.8%) | 22 (16.2%) |
| Manufacturing | 119 (76.8%) | 36 (23.2%) |
| Wholesale Trade | 15 (100.0%) | 0 (0.0%) |
| Retail Trade | 152 (74.5%) | 52 (25.5%) |
| Transportation & Warehousing | 51 (100.0%) | 0 (0.0%) |
| Utilities | 14 (100.0%) | 0 (0.0%) |
| Information | 0 (0.0%) | 0 (0.0%) |
| Finance & Insurance | 9 (37.5%) | 15 (62.5%) |
| Real Estate, Rental & Leasing | 0 (0.0%) | 0 (0.0%) |
| Professional & Scientific | 17 (100.0%) | 0 (0.0%) |
| Enterprise Management | 0 (0.0%) | 0 (0.0%) |
| Administrative & Support | 20 (87.0%) | 3 (13.0%) |
| Educational Services | 16 (11.8%) | 120 (88.2%) |
| Health Care & Social Assistance | 12 (7.5%) | 148 (92.5%) |
| Arts, Entertainment & Recreation | 0 (0.0%) | 0 (0.0%) |
| Accommodation & Food Services | 79 (44.6%) | 98 (55.4%) |
| Public Administration | 64 (79.0%) | 17 (21.0%) |
| Total | 738 (57.4%) | 547 (42.6%) |
Education in Manistique
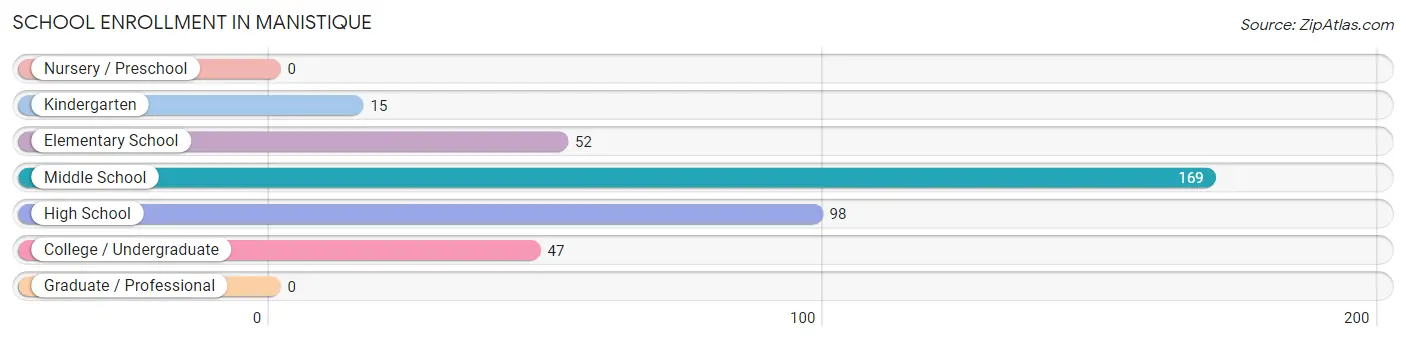
School Enrollment in Manistique
The most common levels of schooling among the 381 students in Manistique are middle school (169 | 44.4%), high school (98 | 25.7%), and elementary school (52 | 13.7%).
| School Level | # Students | % Students |
| Nursery / Preschool | 0 | 0.0% |
| Kindergarten | 15 | 3.9% |
| Elementary School | 52 | 13.7% |
| Middle School | 169 | 44.4% |
| High School | 98 | 25.7% |
| College / Undergraduate | 47 | 12.3% |
| Graduate / Professional | 0 | 0.0% |
| Total | 381 | 100.0% |
School Enrollment by Age by Funding Source in Manistique
Out of a total of 381 students who are enrolled in schools in Manistique, 91 (23.9%) attend a private institution, while the remaining 290 (76.1%) are enrolled in public schools. The age group of 10 to 14 year olds has the highest likelihood of being enrolled in private schools, with 61 (36.1% in the age bracket) enrolled. Conversely, the age group of 15 to 17 year olds has the lowest likelihood of being enrolled in a private school, with 81 (100.0% in the age bracket) attending a public institution.
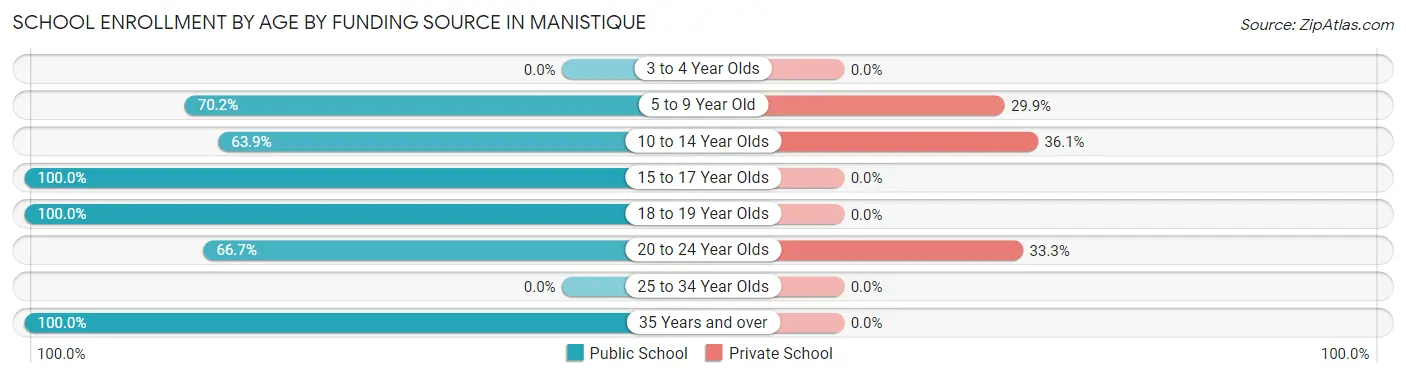
| Age Bracket | Public School | Private School |
| 3 to 4 Year Olds | 0 (0.0%) | 0 (0.0%) |
| 5 to 9 Year Old | 47 (70.2%) | 20 (29.8%) |
| 10 to 14 Year Olds | 108 (63.9%) | 61 (36.1%) |
| 15 to 17 Year Olds | 81 (100.0%) | 0 (0.0%) |
| 18 to 19 Year Olds | 23 (100.0%) | 0 (0.0%) |
| 20 to 24 Year Olds | 20 (66.7%) | 10 (33.3%) |
| 25 to 34 Year Olds | 0 (0.0%) | 0 (0.0%) |
| 35 Years and over | 11 (100.0%) | 0 (0.0%) |
| Total | 290 (76.1%) | 91 (23.9%) |
Educational Attainment by Field of Study in Manistique
Science & technology (99 | 31.9%), education (96 | 31.0%), business (36 | 11.6%), physical & health sciences (27 | 8.7%), and arts & humanities (18 | 5.8%) are the most common fields of study among 310 individuals in Manistique who have obtained a bachelor's degree or higher.
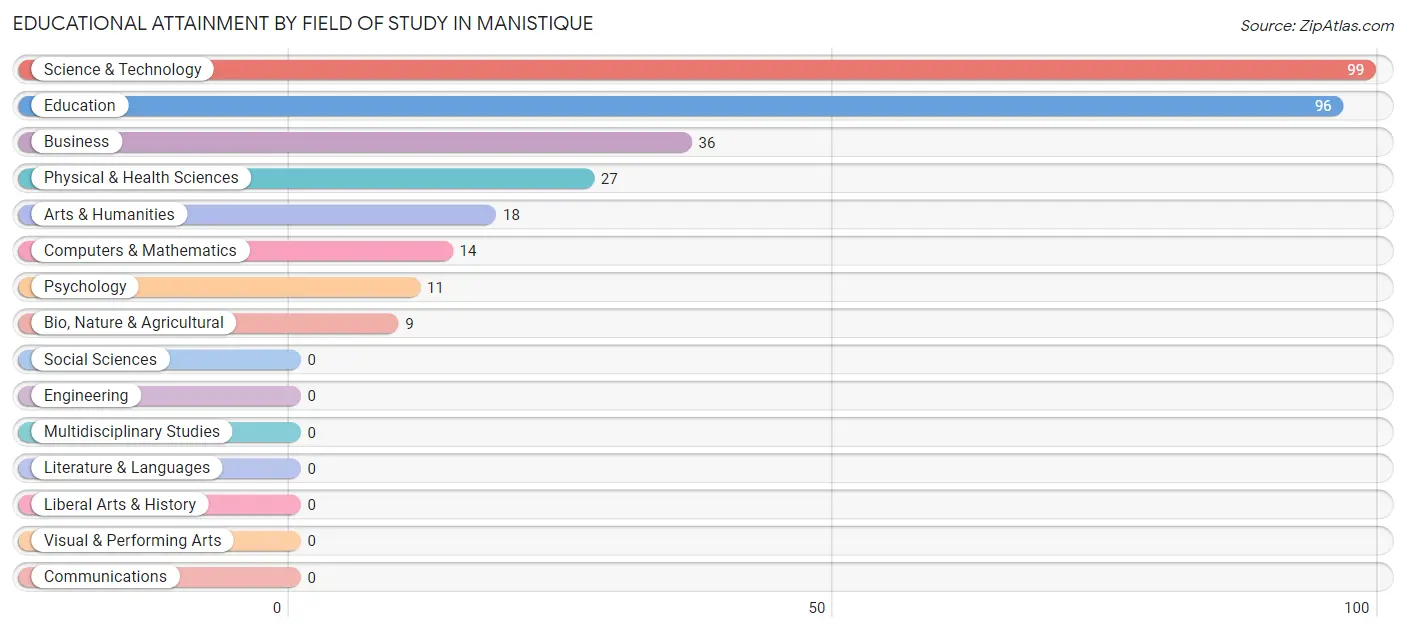
| Field of Study | # Graduates | % Graduates |
| Computers & Mathematics | 14 | 4.5% |
| Bio, Nature & Agricultural | 9 | 2.9% |
| Physical & Health Sciences | 27 | 8.7% |
| Psychology | 11 | 3.5% |
| Social Sciences | 0 | 0.0% |
| Engineering | 0 | 0.0% |
| Multidisciplinary Studies | 0 | 0.0% |
| Science & Technology | 99 | 31.9% |
| Business | 36 | 11.6% |
| Education | 96 | 31.0% |
| Literature & Languages | 0 | 0.0% |
| Liberal Arts & History | 0 | 0.0% |
| Visual & Performing Arts | 0 | 0.0% |
| Communications | 0 | 0.0% |
| Arts & Humanities | 18 | 5.8% |
| Total | 310 | 100.0% |
Transportation & Commute in Manistique
Vehicle Availability by Sex in Manistique
The most prevalent vehicle ownership categories in Manistique are males with 2 vehicles (302, accounting for 41.1%) and females with 2 vehicles (196, making up 55.2%).
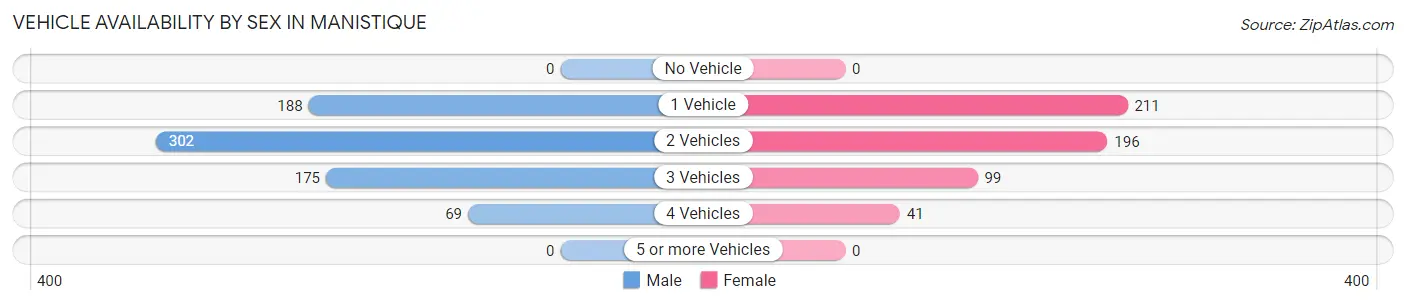
| Vehicles Available | Male | Female |
| No Vehicle | 0 (0.0%) | 0 (0.0%) |
| 1 Vehicle | 188 (25.6%) | 211 (38.6%) |
| 2 Vehicles | 302 (41.1%) | 196 (35.8%) |
| 3 Vehicles | 175 (23.8%) | 99 (18.1%) |
| 4 Vehicles | 69 (9.4%) | 41 (7.5%) |
| 5 or more Vehicles | 0 (0.0%) | 0 (0.0%) |
| Total | 734 (100.0%) | 547 (100.0%) |
Commute Time in Manistique
The most frequently occuring commute durations in Manistique are 5 to 9 minutes (413 commuters, 33.0%), less than 5 minutes (289 commuters, 23.1%), and 10 to 14 minutes (170 commuters, 13.6%).
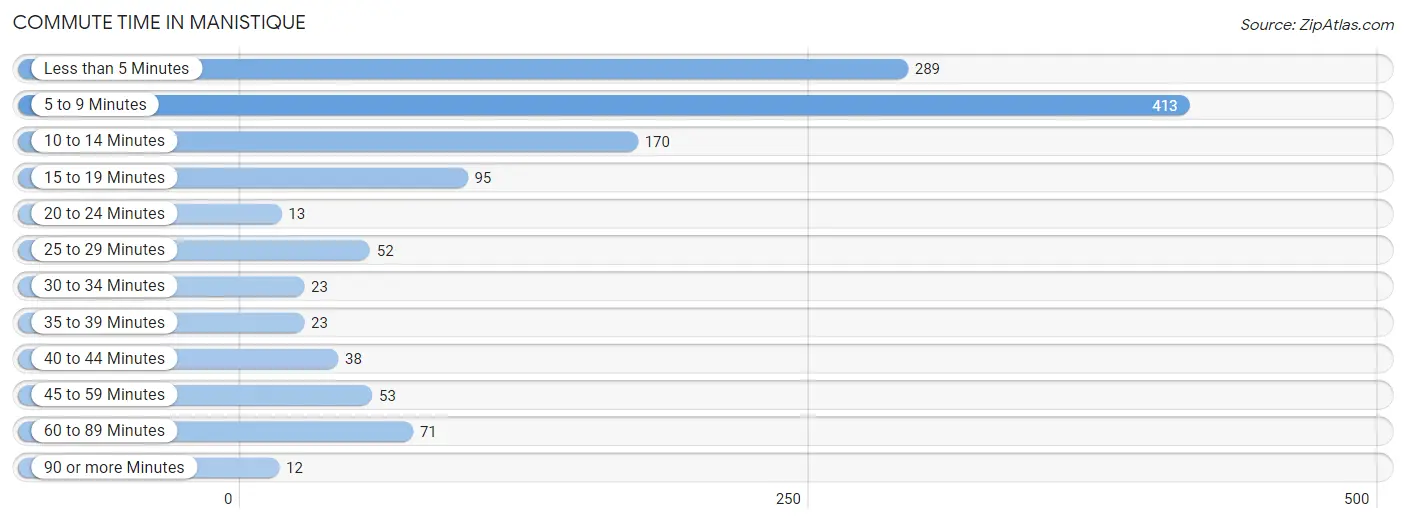
| Commute Time | # Commuters | % Commuters |
| Less than 5 Minutes | 289 | 23.1% |
| 5 to 9 Minutes | 413 | 33.0% |
| 10 to 14 Minutes | 170 | 13.6% |
| 15 to 19 Minutes | 95 | 7.6% |
| 20 to 24 Minutes | 13 | 1.0% |
| 25 to 29 Minutes | 52 | 4.2% |
| 30 to 34 Minutes | 23 | 1.8% |
| 35 to 39 Minutes | 23 | 1.8% |
| 40 to 44 Minutes | 38 | 3.0% |
| 45 to 59 Minutes | 53 | 4.2% |
| 60 to 89 Minutes | 71 | 5.7% |
| 90 or more Minutes | 12 | 1.0% |
Commute Time by Sex in Manistique
The most common commute times in Manistique are 5 to 9 minutes (219 commuters, 29.7%) for males and 5 to 9 minutes (194 commuters, 37.7%) for females.
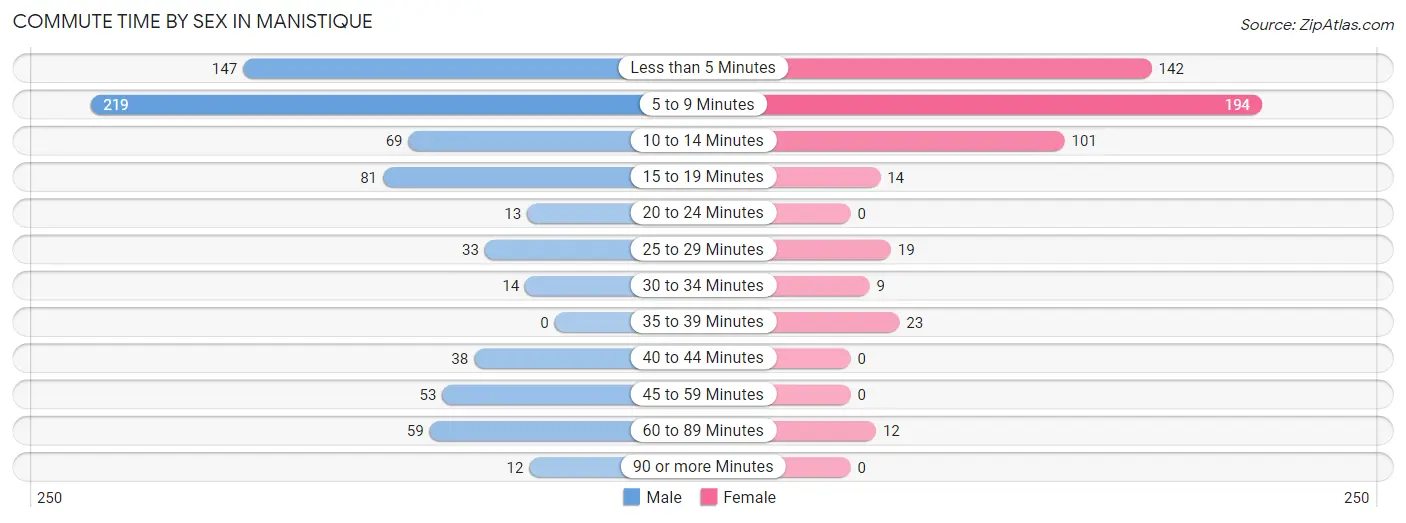
| Commute Time | Male | Female |
| Less than 5 Minutes | 147 (19.9%) | 142 (27.6%) |
| 5 to 9 Minutes | 219 (29.7%) | 194 (37.7%) |
| 10 to 14 Minutes | 69 (9.3%) | 101 (19.7%) |
| 15 to 19 Minutes | 81 (11.0%) | 14 (2.7%) |
| 20 to 24 Minutes | 13 (1.8%) | 0 (0.0%) |
| 25 to 29 Minutes | 33 (4.5%) | 19 (3.7%) |
| 30 to 34 Minutes | 14 (1.9%) | 9 (1.8%) |
| 35 to 39 Minutes | 0 (0.0%) | 23 (4.5%) |
| 40 to 44 Minutes | 38 (5.1%) | 0 (0.0%) |
| 45 to 59 Minutes | 53 (7.2%) | 0 (0.0%) |
| 60 to 89 Minutes | 59 (8.0%) | 12 (2.3%) |
| 90 or more Minutes | 12 (1.6%) | 0 (0.0%) |
Time of Departure to Work by Sex in Manistique
The most frequent times of departure to work in Manistique are 12:00 AM to 4:59 AM (131, 17.7%) for males and 7:30 AM to 7:59 AM (185, 36.0%) for females.
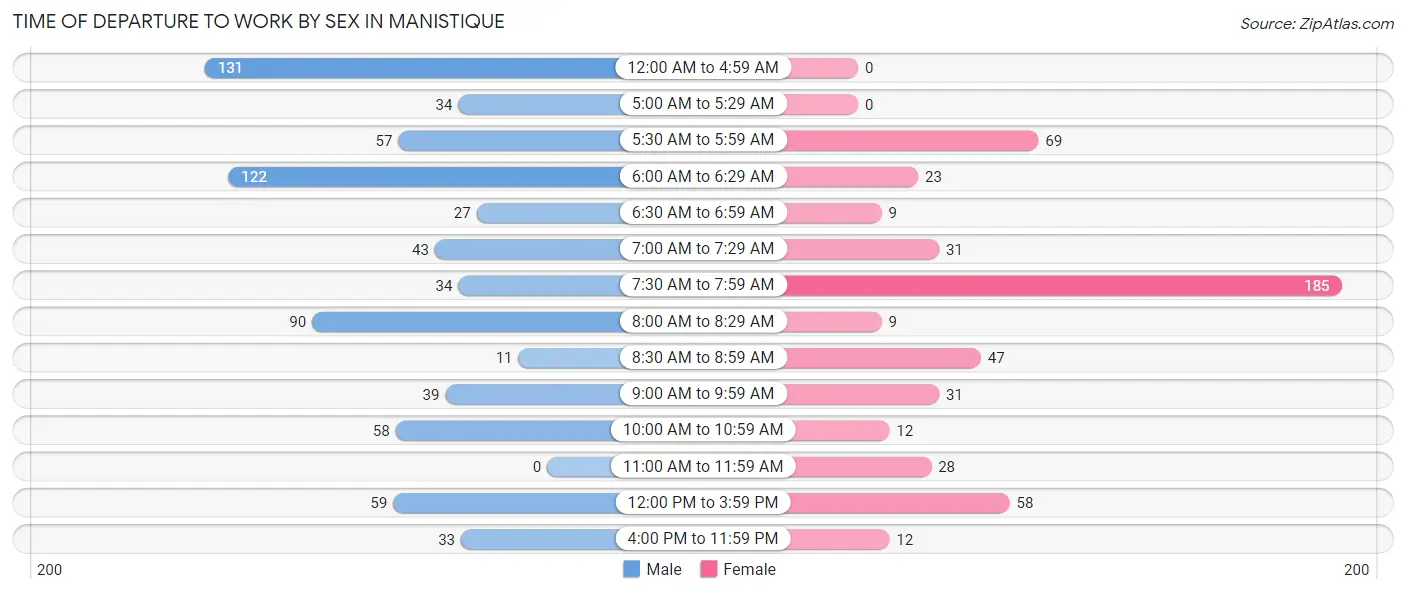
| Time of Departure | Male | Female |
| 12:00 AM to 4:59 AM | 131 (17.7%) | 0 (0.0%) |
| 5:00 AM to 5:29 AM | 34 (4.6%) | 0 (0.0%) |
| 5:30 AM to 5:59 AM | 57 (7.7%) | 69 (13.4%) |
| 6:00 AM to 6:29 AM | 122 (16.5%) | 23 (4.5%) |
| 6:30 AM to 6:59 AM | 27 (3.7%) | 9 (1.8%) |
| 7:00 AM to 7:29 AM | 43 (5.8%) | 31 (6.0%) |
| 7:30 AM to 7:59 AM | 34 (4.6%) | 185 (36.0%) |
| 8:00 AM to 8:29 AM | 90 (12.2%) | 9 (1.8%) |
| 8:30 AM to 8:59 AM | 11 (1.5%) | 47 (9.1%) |
| 9:00 AM to 9:59 AM | 39 (5.3%) | 31 (6.0%) |
| 10:00 AM to 10:59 AM | 58 (7.9%) | 12 (2.3%) |
| 11:00 AM to 11:59 AM | 0 (0.0%) | 28 (5.4%) |
| 12:00 PM to 3:59 PM | 59 (8.0%) | 58 (11.3%) |
| 4:00 PM to 11:59 PM | 33 (4.5%) | 12 (2.3%) |
| Total | 738 (100.0%) | 514 (100.0%) |
Housing Occupancy in Manistique
Occupancy by Ownership in Manistique
Of the total 1,444 dwellings in Manistique, owner-occupied units account for 1,004 (69.5%), while renter-occupied units make up 440 (30.5%).
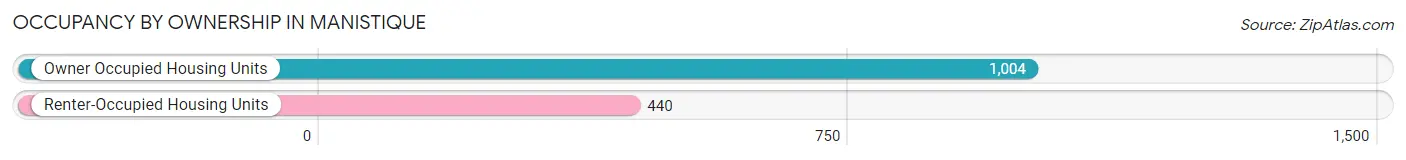
| Occupancy | # Housing Units | % Housing Units |
| Owner Occupied Housing Units | 1,004 | 69.5% |
| Renter-Occupied Housing Units | 440 | 30.5% |
| Total Occupied Housing Units | 1,444 | 100.0% |
Occupancy by Household Size in Manistique
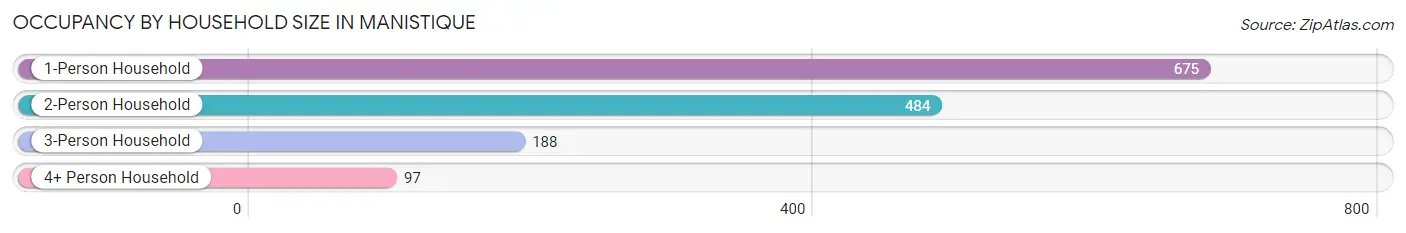
| Household Size | # Housing Units | % Housing Units |
| 1-Person Household | 675 | 46.8% |
| 2-Person Household | 484 | 33.5% |
| 3-Person Household | 188 | 13.0% |
| 4+ Person Household | 97 | 6.7% |
| Total Housing Units | 1,444 | 100.0% |
Occupancy by Ownership by Household Size in Manistique
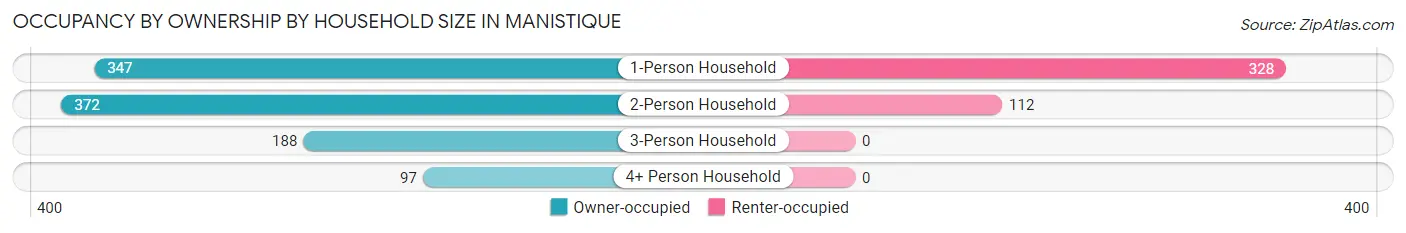
| Household Size | Owner-occupied | Renter-occupied |
| 1-Person Household | 347 (51.4%) | 328 (48.6%) |
| 2-Person Household | 372 (76.9%) | 112 (23.1%) |
| 3-Person Household | 188 (100.0%) | 0 (0.0%) |
| 4+ Person Household | 97 (100.0%) | 0 (0.0%) |
| Total Housing Units | 1,004 (69.5%) | 440 (30.5%) |
Occupancy by Educational Attainment in Manistique
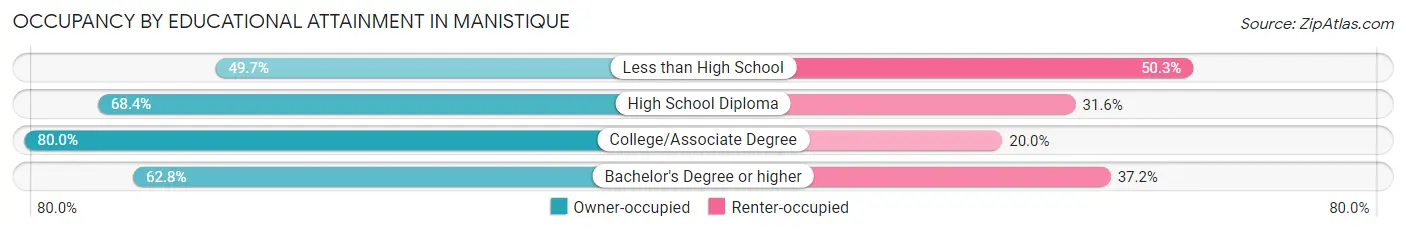
| Household Size | Owner-occupied | Renter-occupied |
| Less than High School | 89 (49.7%) | 90 (50.3%) |
| High School Diploma | 361 (68.4%) | 167 (31.6%) |
| College/Associate Degree | 424 (80.0%) | 106 (20.0%) |
| Bachelor's Degree or higher | 130 (62.8%) | 77 (37.2%) |
Occupancy by Age of Householder in Manistique
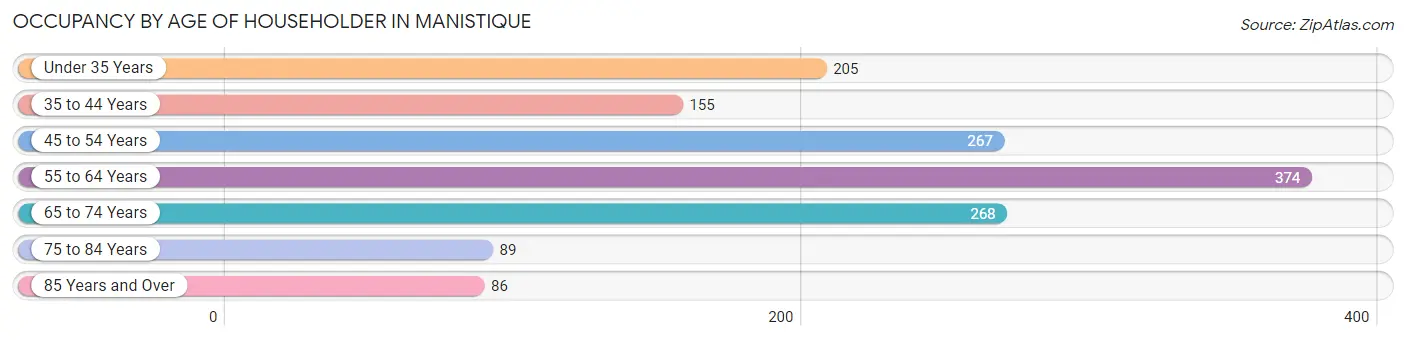
| Age Bracket | # Households | % Households |
| Under 35 Years | 205 | 14.2% |
| 35 to 44 Years | 155 | 10.7% |
| 45 to 54 Years | 267 | 18.5% |
| 55 to 64 Years | 374 | 25.9% |
| 65 to 74 Years | 268 | 18.6% |
| 75 to 84 Years | 89 | 6.2% |
| 85 Years and Over | 86 | 6.0% |
| Total | 1,444 | 100.0% |
Housing Finances in Manistique
Median Income by Occupancy in Manistique
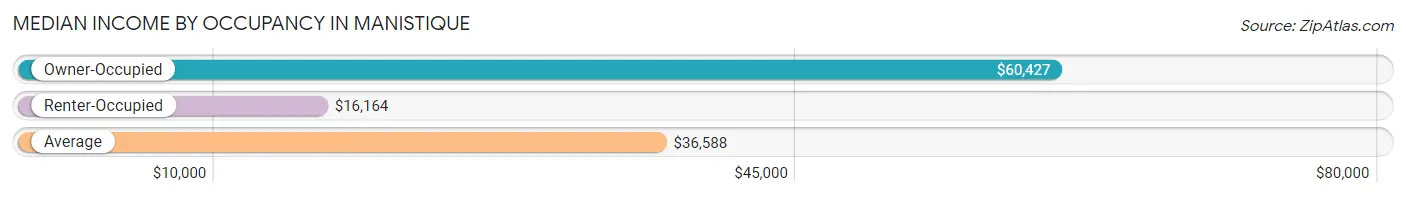
| Occupancy Type | # Households | Median Income |
| Owner-Occupied | 1,004 (69.5%) | $60,427 |
| Renter-Occupied | 440 (30.5%) | $16,164 |
| Average | 1,444 (100.0%) | $36,588 |
Occupancy by Householder Income Bracket in Manistique
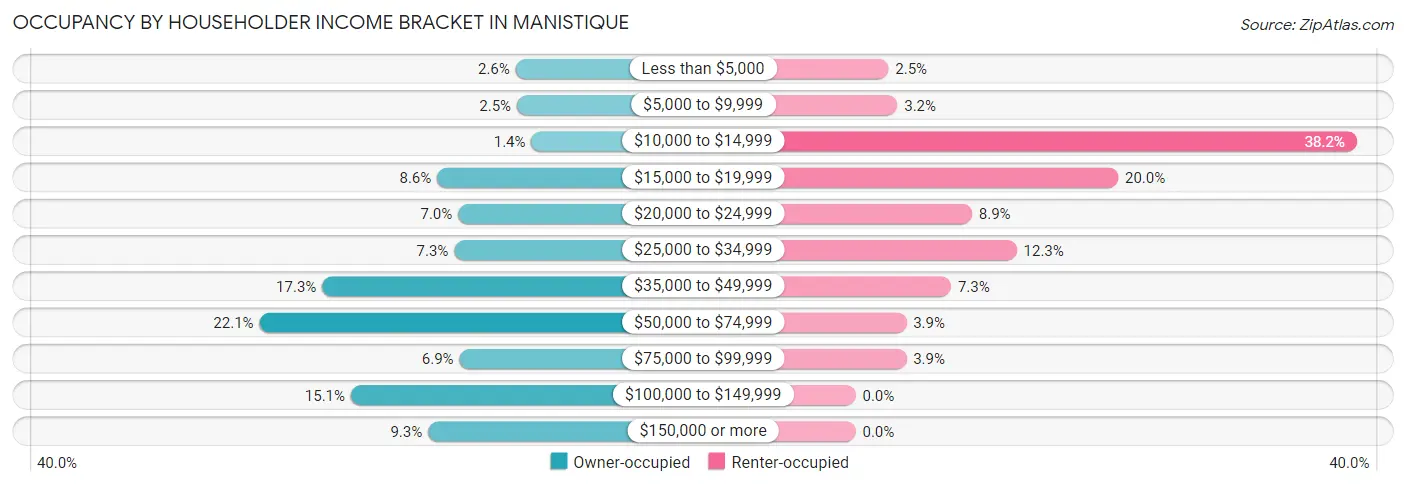
| Income Bracket | Owner-occupied | Renter-occupied |
| Less than $5,000 | 26 (2.6%) | 11 (2.5%) |
| $5,000 to $9,999 | 25 (2.5%) | 14 (3.2%) |
| $10,000 to $14,999 | 14 (1.4%) | 168 (38.2%) |
| $15,000 to $19,999 | 86 (8.6%) | 88 (20.0%) |
| $20,000 to $24,999 | 70 (7.0%) | 39 (8.9%) |
| $25,000 to $34,999 | 73 (7.3%) | 54 (12.3%) |
| $35,000 to $49,999 | 174 (17.3%) | 32 (7.3%) |
| $50,000 to $74,999 | 222 (22.1%) | 17 (3.9%) |
| $75,000 to $99,999 | 69 (6.9%) | 17 (3.9%) |
| $100,000 to $149,999 | 152 (15.1%) | 0 (0.0%) |
| $150,000 or more | 93 (9.3%) | 0 (0.0%) |
| Total | 1,004 (100.0%) | 440 (100.0%) |
Monthly Housing Cost Tiers in Manistique
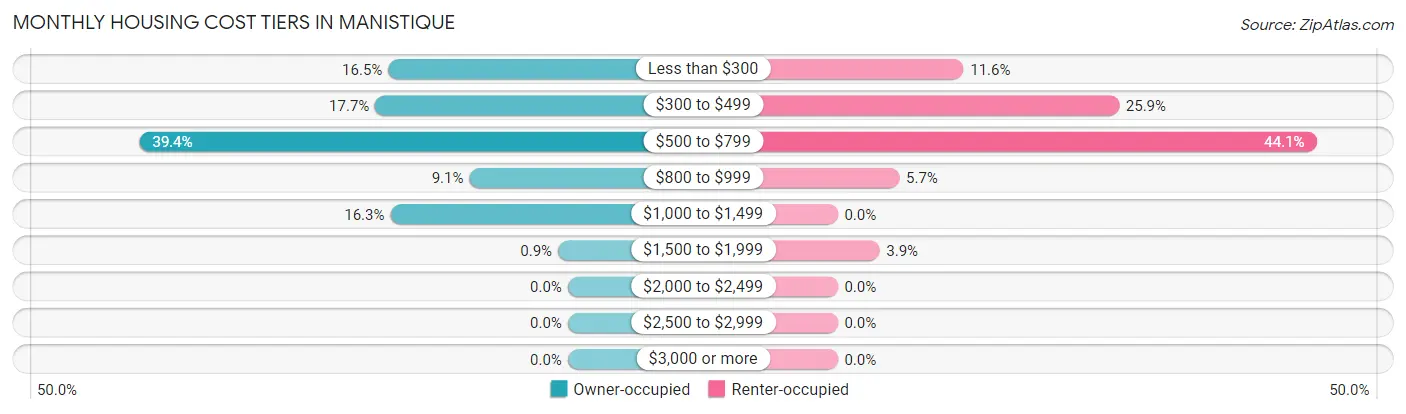
| Monthly Cost | Owner-occupied | Renter-occupied |
| Less than $300 | 166 (16.5%) | 51 (11.6%) |
| $300 to $499 | 178 (17.7%) | 114 (25.9%) |
| $500 to $799 | 396 (39.4%) | 194 (44.1%) |
| $800 to $999 | 91 (9.1%) | 25 (5.7%) |
| $1,000 to $1,499 | 164 (16.3%) | 0 (0.0%) |
| $1,500 to $1,999 | 9 (0.9%) | 17 (3.9%) |
| $2,000 to $2,499 | 0 (0.0%) | 0 (0.0%) |
| $2,500 to $2,999 | 0 (0.0%) | 0 (0.0%) |
| $3,000 or more | 0 (0.0%) | 0 (0.0%) |
| Total | 1,004 (100.0%) | 440 (100.0%) |
Physical Housing Characteristics in Manistique
Housing Structures in Manistique
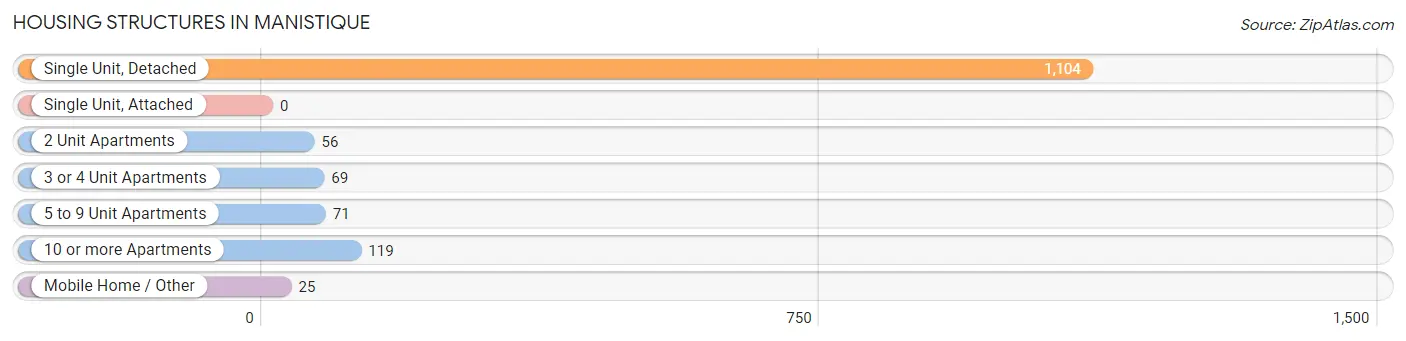
| Structure Type | # Housing Units | % Housing Units |
| Single Unit, Detached | 1,104 | 76.4% |
| Single Unit, Attached | 0 | 0.0% |
| 2 Unit Apartments | 56 | 3.9% |
| 3 or 4 Unit Apartments | 69 | 4.8% |
| 5 to 9 Unit Apartments | 71 | 4.9% |
| 10 or more Apartments | 119 | 8.2% |
| Mobile Home / Other | 25 | 1.7% |
| Total | 1,444 | 100.0% |
Housing Structures by Occupancy in Manistique
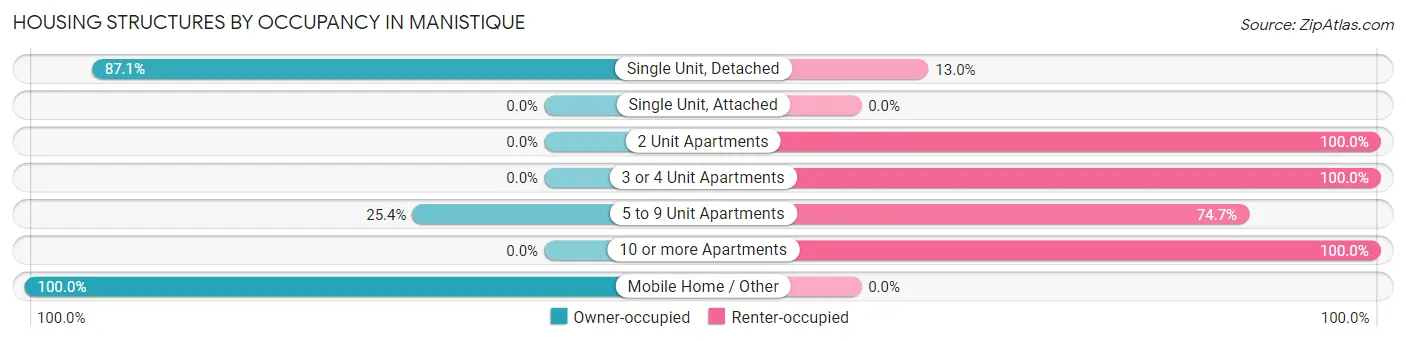
| Structure Type | Owner-occupied | Renter-occupied |
| Single Unit, Detached | 961 (87.1%) | 143 (13.0%) |
| Single Unit, Attached | 0 (0.0%) | 0 (0.0%) |
| 2 Unit Apartments | 0 (0.0%) | 56 (100.0%) |
| 3 or 4 Unit Apartments | 0 (0.0%) | 69 (100.0%) |
| 5 to 9 Unit Apartments | 18 (25.4%) | 53 (74.7%) |
| 10 or more Apartments | 0 (0.0%) | 119 (100.0%) |
| Mobile Home / Other | 25 (100.0%) | 0 (0.0%) |
| Total | 1,004 (69.5%) | 440 (30.5%) |
Housing Structures by Number of Rooms in Manistique
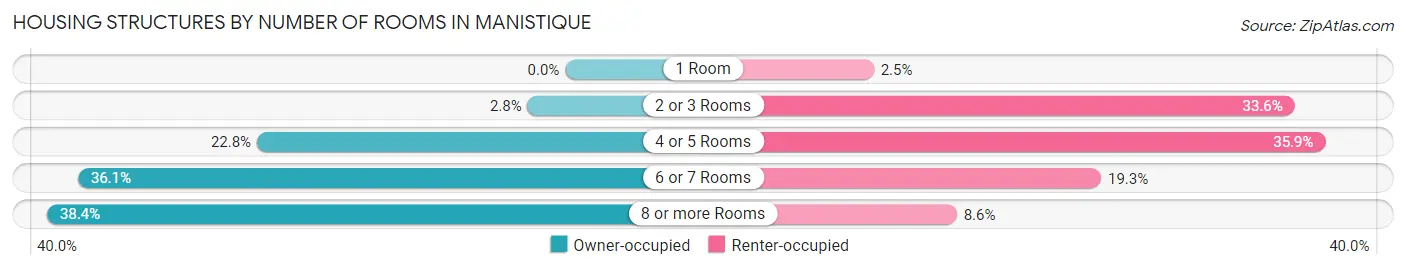
| Number of Rooms | Owner-occupied | Renter-occupied |
| 1 Room | 0 (0.0%) | 11 (2.5%) |
| 2 or 3 Rooms | 28 (2.8%) | 148 (33.6%) |
| 4 or 5 Rooms | 229 (22.8%) | 158 (35.9%) |
| 6 or 7 Rooms | 362 (36.1%) | 85 (19.3%) |
| 8 or more Rooms | 385 (38.4%) | 38 (8.6%) |
| Total | 1,004 (100.0%) | 440 (100.0%) |
Housing Structure by Heating Type in Manistique
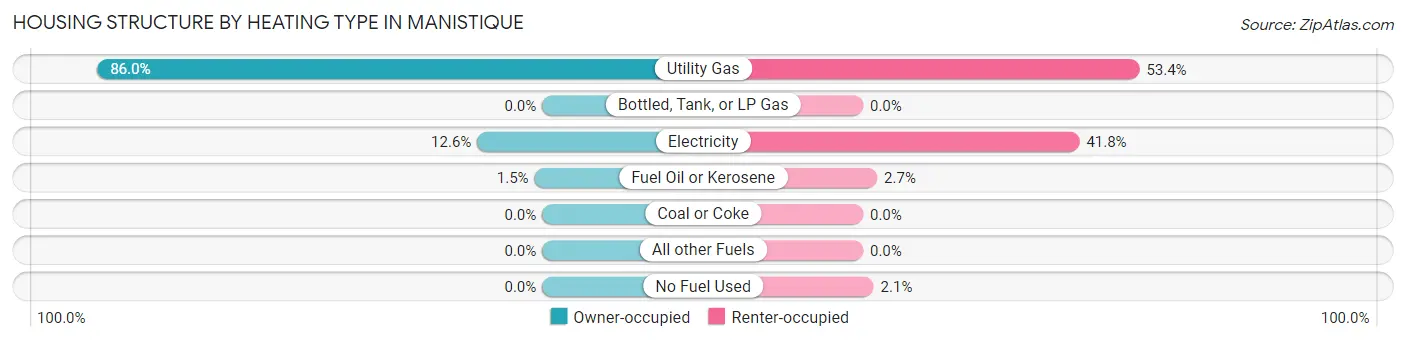
| Heating Type | Owner-occupied | Renter-occupied |
| Utility Gas | 863 (86.0%) | 235 (53.4%) |
| Bottled, Tank, or LP Gas | 0 (0.0%) | 0 (0.0%) |
| Electricity | 126 (12.6%) | 184 (41.8%) |
| Fuel Oil or Kerosene | 15 (1.5%) | 12 (2.7%) |
| Coal or Coke | 0 (0.0%) | 0 (0.0%) |
| All other Fuels | 0 (0.0%) | 0 (0.0%) |
| No Fuel Used | 0 (0.0%) | 9 (2.1%) |
| Total | 1,004 (100.0%) | 440 (100.0%) |
Household Vehicle Usage in Manistique
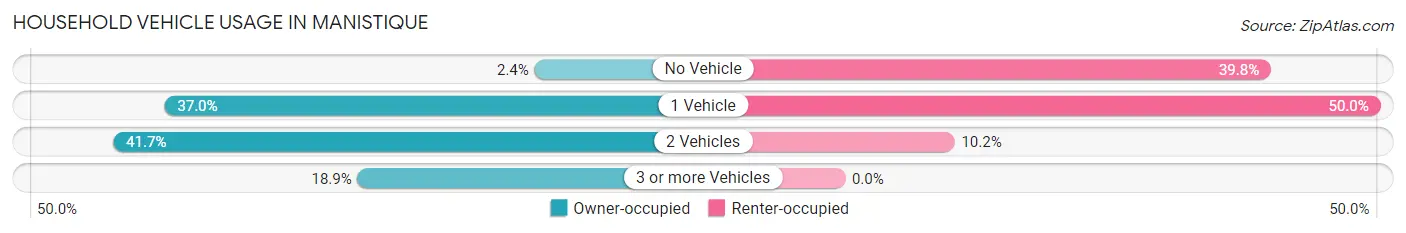
| Vehicles per Household | Owner-occupied | Renter-occupied |
| No Vehicle | 24 (2.4%) | 175 (39.8%) |
| 1 Vehicle | 371 (36.9%) | 220 (50.0%) |
| 2 Vehicles | 419 (41.7%) | 45 (10.2%) |
| 3 or more Vehicles | 190 (18.9%) | 0 (0.0%) |
| Total | 1,004 (100.0%) | 440 (100.0%) |
Real Estate & Mortgages in Manistique
Real Estate and Mortgage Overview in Manistique
| Characteristic | Without Mortgage | With Mortgage |
| Housing Units | 476 | 528 |
| Median Property Value | $58,800 | $84,200 |
| Median Household Income | $40,313 | $38 |
| Monthly Housing Costs | $331 | $0 |
| Real Estate Taxes | $967 | $9 |
Property Value by Mortgage Status in Manistique
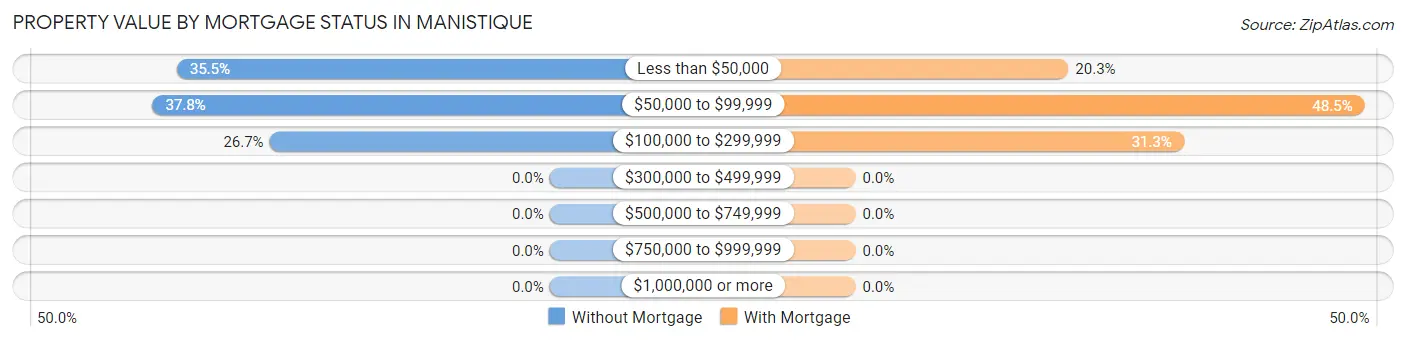
| Property Value | Without Mortgage | With Mortgage |
| Less than $50,000 | 169 (35.5%) | 107 (20.3%) |
| $50,000 to $99,999 | 180 (37.8%) | 256 (48.5%) |
| $100,000 to $299,999 | 127 (26.7%) | 165 (31.2%) |
| $300,000 to $499,999 | 0 (0.0%) | 0 (0.0%) |
| $500,000 to $749,999 | 0 (0.0%) | 0 (0.0%) |
| $750,000 to $999,999 | 0 (0.0%) | 0 (0.0%) |
| $1,000,000 or more | 0 (0.0%) | 0 (0.0%) |
| Total | 476 (100.0%) | 528 (100.0%) |
Household Income by Mortgage Status in Manistique
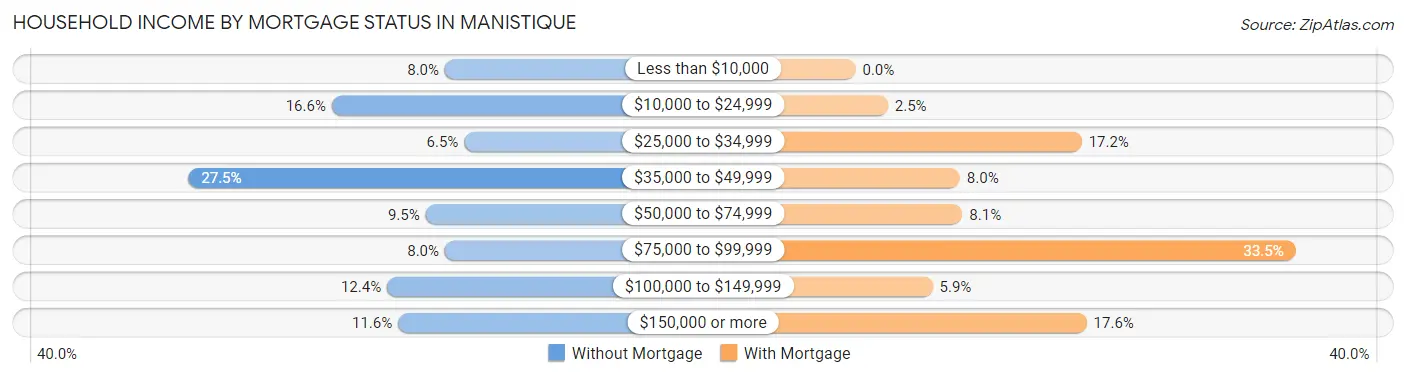
| Household Income | Without Mortgage | With Mortgage |
| Less than $10,000 | 38 (8.0%) | 0 (0.0%) |
| $10,000 to $24,999 | 79 (16.6%) | 13 (2.5%) |
| $25,000 to $34,999 | 31 (6.5%) | 91 (17.2%) |
| $35,000 to $49,999 | 131 (27.5%) | 42 (8.0%) |
| $50,000 to $74,999 | 45 (9.5%) | 43 (8.1%) |
| $75,000 to $99,999 | 38 (8.0%) | 177 (33.5%) |
| $100,000 to $149,999 | 59 (12.4%) | 31 (5.9%) |
| $150,000 or more | 55 (11.6%) | 93 (17.6%) |
| Total | 476 (100.0%) | 528 (100.0%) |
Property Value to Household Income Ratio in Manistique
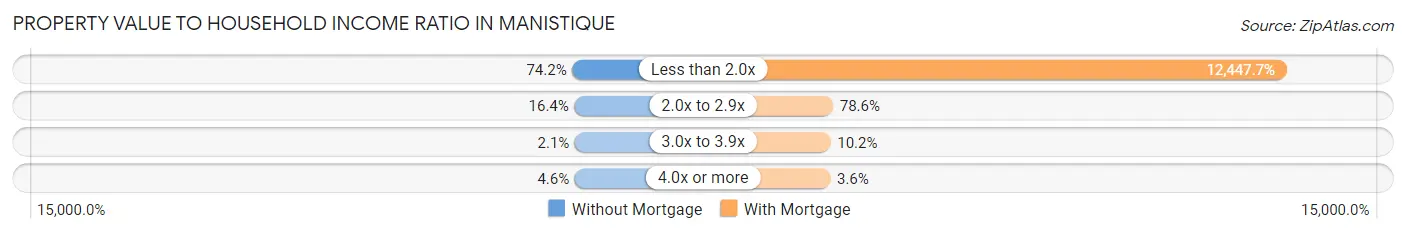
| Value-to-Income Ratio | Without Mortgage | With Mortgage |
| Less than 2.0x | 353 (74.2%) | 65,724 (12,447.7%) |
| 2.0x to 2.9x | 78 (16.4%) | 415 (78.6%) |
| 3.0x to 3.9x | 10 (2.1%) | 54 (10.2%) |
| 4.0x or more | 22 (4.6%) | 19 (3.6%) |
| Total | 476 (100.0%) | 528 (100.0%) |
Real Estate Taxes by Mortgage Status in Manistique
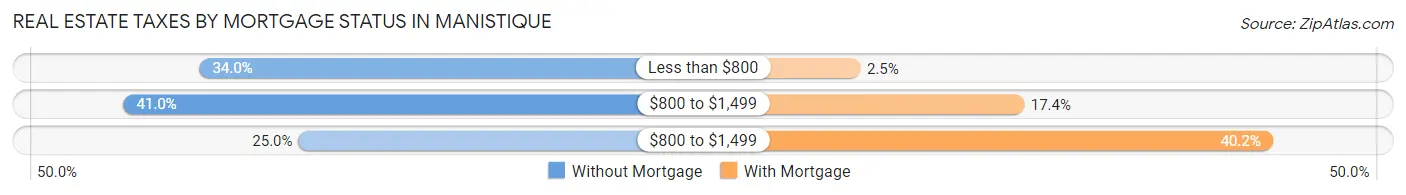
| Property Taxes | Without Mortgage | With Mortgage |
| Less than $800 | 162 (34.0%) | 13 (2.5%) |
| $800 to $1,499 | 195 (41.0%) | 92 (17.4%) |
| $800 to $1,499 | 119 (25.0%) | 212 (40.2%) |
| Total | 476 (100.0%) | 528 (100.0%) |
Health & Disability in Manistique
Health Insurance Coverage by Age in Manistique
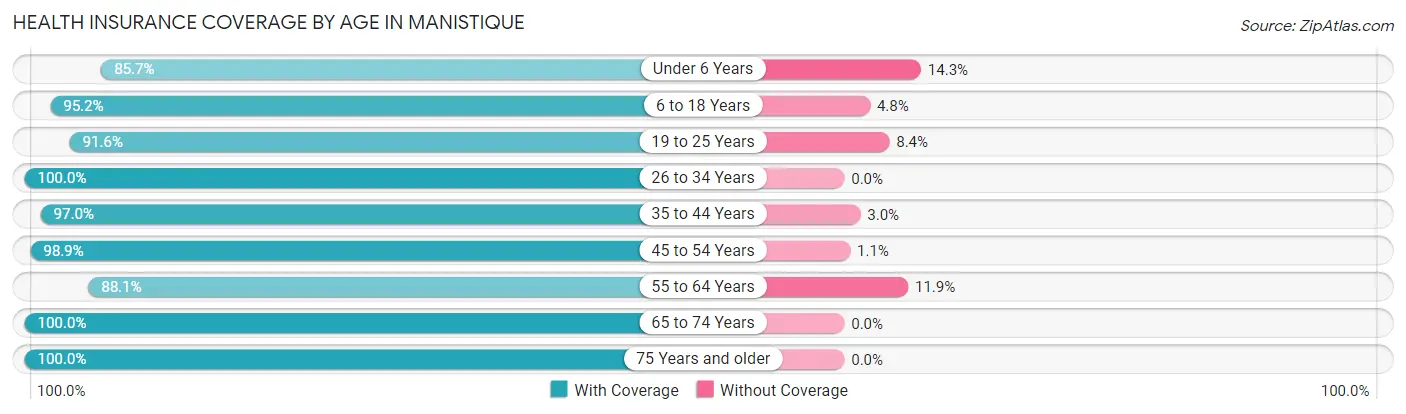
| Age Bracket | With Coverage | Without Coverage |
| Under 6 Years | 90 (85.7%) | 15 (14.3%) |
| 6 to 18 Years | 298 (95.2%) | 15 (4.8%) |
| 19 to 25 Years | 251 (91.6%) | 23 (8.4%) |
| 26 to 34 Years | 181 (100.0%) | 0 (0.0%) |
| 35 to 44 Years | 291 (97.0%) | 9 (3.0%) |
| 45 to 54 Years | 456 (98.9%) | 5 (1.1%) |
| 55 to 64 Years | 489 (88.1%) | 66 (11.9%) |
| 65 to 74 Years | 335 (100.0%) | 0 (0.0%) |
| 75 Years and older | 219 (100.0%) | 0 (0.0%) |
| Total | 2,610 (95.2%) | 133 (4.9%) |
Health Insurance Coverage by Citizenship Status in Manistique
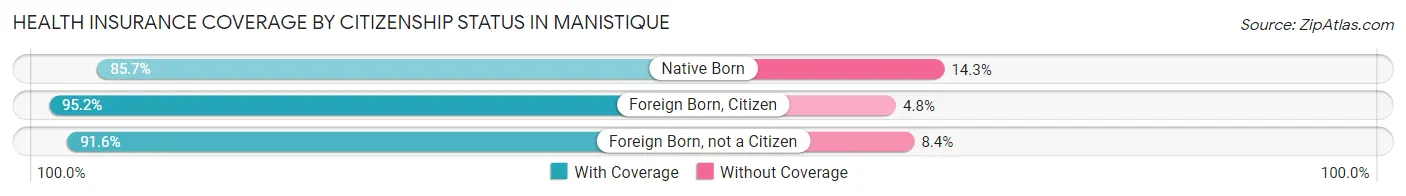
| Citizenship Status | With Coverage | Without Coverage |
| Native Born | 90 (85.7%) | 15 (14.3%) |
| Foreign Born, Citizen | 298 (95.2%) | 15 (4.8%) |
| Foreign Born, not a Citizen | 251 (91.6%) | 23 (8.4%) |
Health Insurance Coverage by Household Income in Manistique
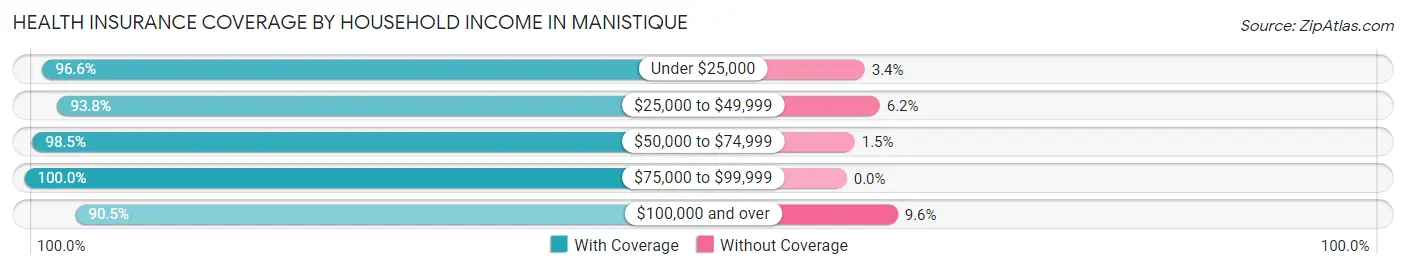
| Household Income | With Coverage | Without Coverage |
| Under $25,000 | 717 (96.6%) | 25 (3.4%) |
| $25,000 to $49,999 | 410 (93.8%) | 27 (6.2%) |
| $50,000 to $74,999 | 593 (98.5%) | 9 (1.5%) |
| $75,000 to $99,999 | 190 (100.0%) | 0 (0.0%) |
| $100,000 and over | 682 (90.4%) | 72 (9.6%) |
Public vs Private Health Insurance Coverage by Age in Manistique
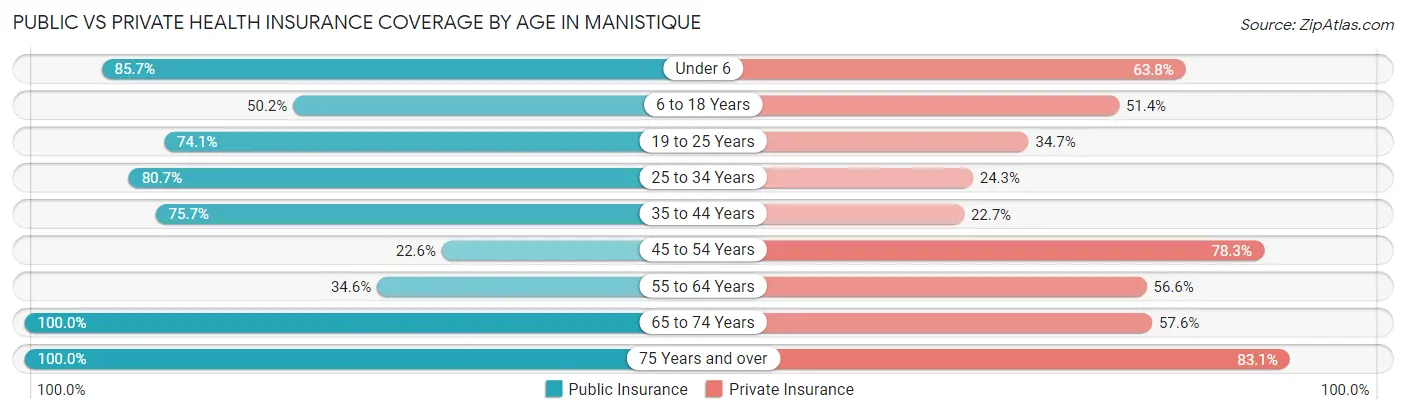
| Age Bracket | Public Insurance | Private Insurance |
| Under 6 | 90 (85.7%) | 67 (63.8%) |
| 6 to 18 Years | 157 (50.2%) | 161 (51.4%) |
| 19 to 25 Years | 203 (74.1%) | 95 (34.7%) |
| 25 to 34 Years | 146 (80.7%) | 44 (24.3%) |
| 35 to 44 Years | 227 (75.7%) | 68 (22.7%) |
| 45 to 54 Years | 104 (22.6%) | 361 (78.3%) |
| 55 to 64 Years | 192 (34.6%) | 314 (56.6%) |
| 65 to 74 Years | 335 (100.0%) | 193 (57.6%) |
| 75 Years and over | 219 (100.0%) | 182 (83.1%) |
| Total | 1,673 (61.0%) | 1,485 (54.1%) |
Disability Status by Sex by Age in Manistique
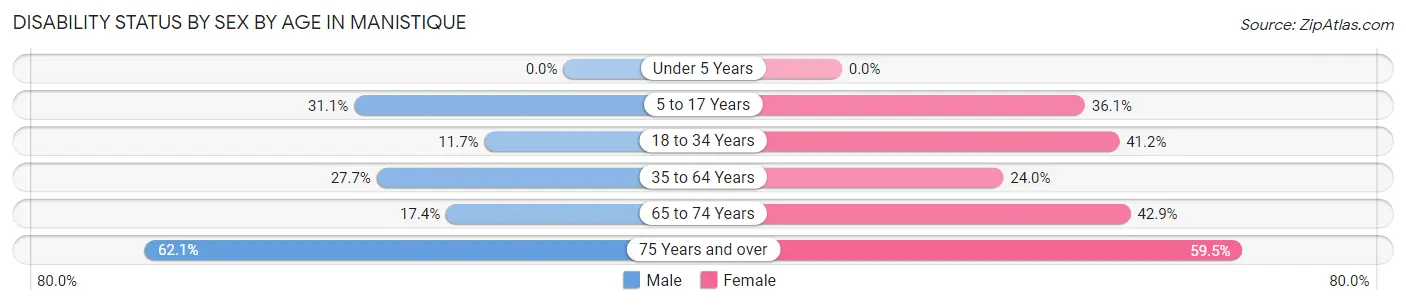
| Age Bracket | Male | Female |
| Under 5 Years | 0 (0.0%) | 0 (0.0%) |
| 5 to 17 Years | 46 (31.1%) | 61 (36.1%) |
| 18 to 34 Years | 28 (11.7%) | 89 (41.2%) |
| 35 to 64 Years | 173 (27.7%) | 166 (24.0%) |
| 65 to 74 Years | 23 (17.4%) | 87 (42.9%) |
| 75 Years and over | 41 (62.1%) | 91 (59.5%) |
Disability Class by Sex by Age in Manistique
Disability Class: Hearing Difficulty
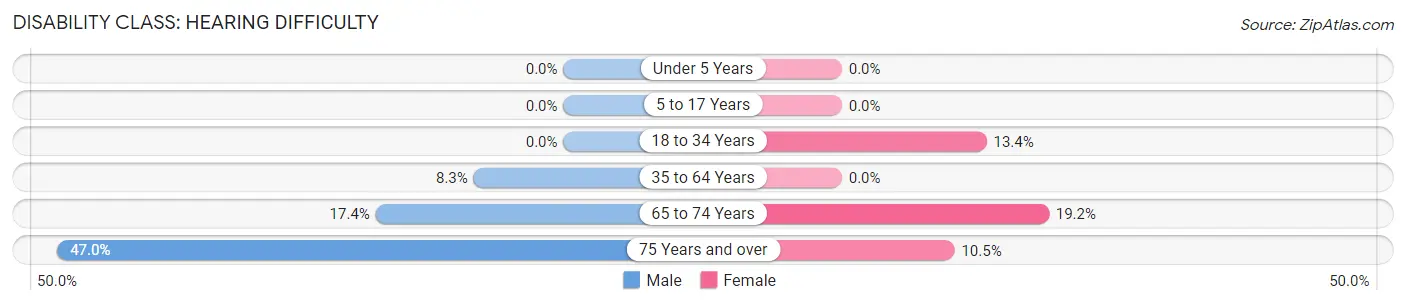
| Age Bracket | Male | Female |
| Under 5 Years | 0 (0.0%) | 0 (0.0%) |
| 5 to 17 Years | 0 (0.0%) | 0 (0.0%) |
| 18 to 34 Years | 0 (0.0%) | 29 (13.4%) |
| 35 to 64 Years | 52 (8.3%) | 0 (0.0%) |
| 65 to 74 Years | 23 (17.4%) | 39 (19.2%) |
| 75 Years and over | 31 (47.0%) | 16 (10.5%) |
Disability Class: Vision Difficulty
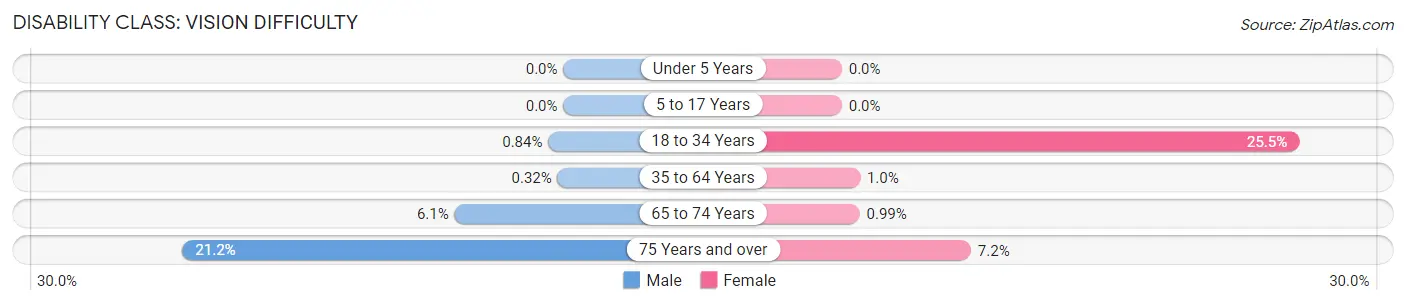
| Age Bracket | Male | Female |
| Under 5 Years | 0 (0.0%) | 0 (0.0%) |
| 5 to 17 Years | 0 (0.0%) | 0 (0.0%) |
| 18 to 34 Years | 2 (0.8%) | 55 (25.5%) |
| 35 to 64 Years | 2 (0.3%) | 7 (1.0%) |
| 65 to 74 Years | 8 (6.1%) | 2 (1.0%) |
| 75 Years and over | 14 (21.2%) | 11 (7.2%) |
Disability Class: Cognitive Difficulty
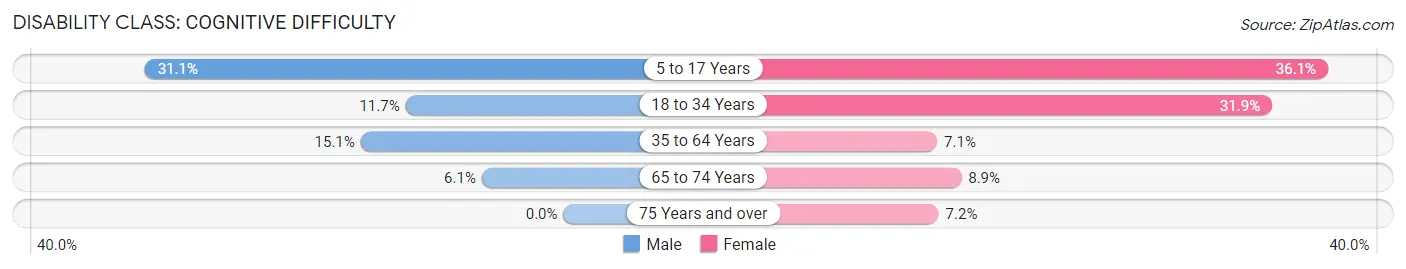
| Age Bracket | Male | Female |
| 5 to 17 Years | 46 (31.1%) | 61 (36.1%) |
| 18 to 34 Years | 28 (11.7%) | 69 (31.9%) |
| 35 to 64 Years | 94 (15.1%) | 49 (7.1%) |
| 65 to 74 Years | 8 (6.1%) | 18 (8.9%) |
| 75 Years and over | 0 (0.0%) | 11 (7.2%) |
Disability Class: Ambulatory Difficulty
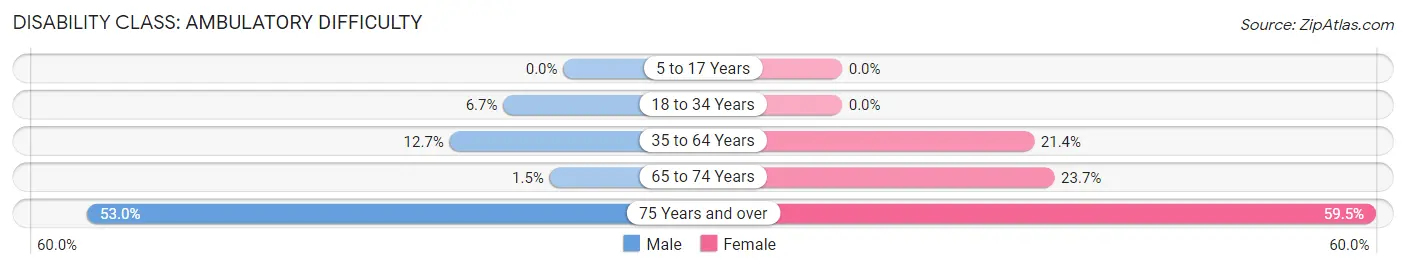
| Age Bracket | Male | Female |
| 5 to 17 Years | 0 (0.0%) | 0 (0.0%) |
| 18 to 34 Years | 16 (6.7%) | 0 (0.0%) |
| 35 to 64 Years | 79 (12.7%) | 148 (21.4%) |
| 65 to 74 Years | 2 (1.5%) | 48 (23.6%) |
| 75 Years and over | 35 (53.0%) | 91 (59.5%) |
Disability Class: Self-Care Difficulty
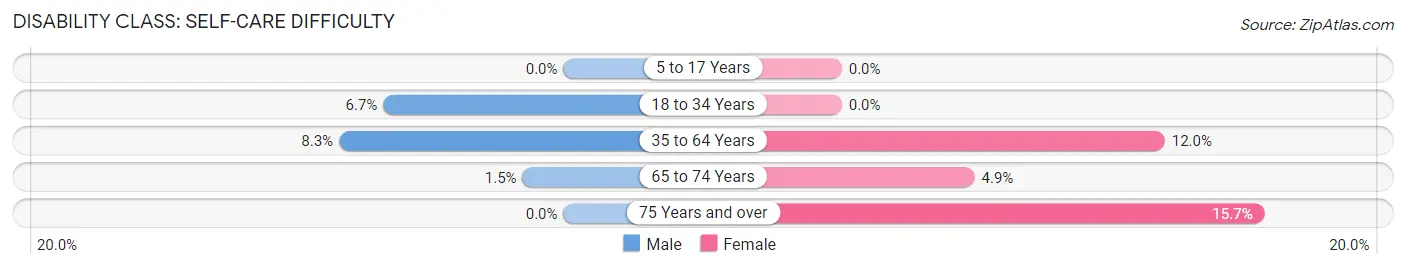
| Age Bracket | Male | Female |
| 5 to 17 Years | 0 (0.0%) | 0 (0.0%) |
| 18 to 34 Years | 16 (6.7%) | 0 (0.0%) |
| 35 to 64 Years | 52 (8.3%) | 83 (12.0%) |
| 65 to 74 Years | 2 (1.5%) | 10 (4.9%) |
| 75 Years and over | 0 (0.0%) | 24 (15.7%) |
Technology Access in Manistique
Computing Device Access in Manistique
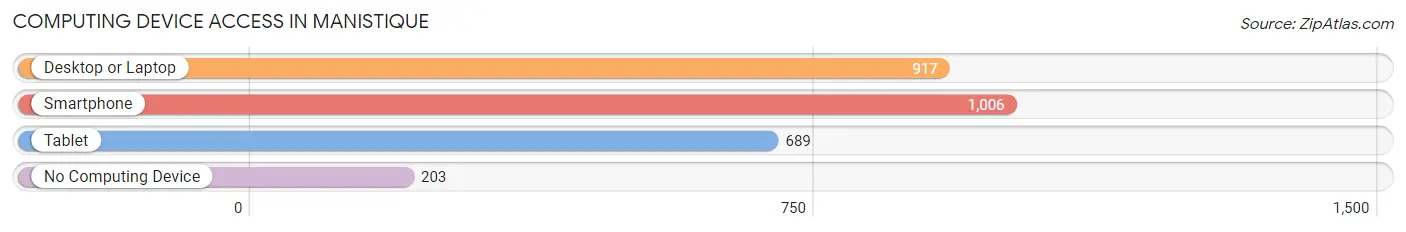
| Device Type | # Households | % Households |
| Desktop or Laptop | 917 | 63.5% |
| Smartphone | 1,006 | 69.7% |
| Tablet | 689 | 47.7% |
| No Computing Device | 203 | 14.1% |
| Total | 1,444 | 100.0% |
Internet Access in Manistique
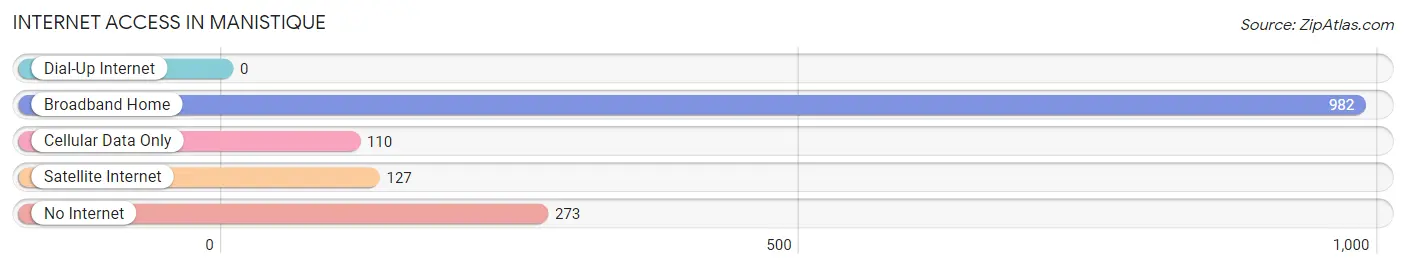
| Internet Type | # Households | % Households |
| Dial-Up Internet | 0 | 0.0% |
| Broadband Home | 982 | 68.0% |
| Cellular Data Only | 110 | 7.6% |
| Satellite Internet | 127 | 8.8% |
| No Internet | 273 | 18.9% |
| Total | 1,444 | 100.0% |
Manistique Summary
Manistique, Michigan is a small city located in the Upper Peninsula of Michigan. It is the county seat of Schoolcraft County and is situated on the shores of Lake Michigan. The city has a population of 3,079 as of the 2010 census.
Manistique was first settled in 1877 by a group of lumberjacks and fishermen. The city was incorporated in 1883 and was named after the Manistique River, which flows through the city. The city was originally a lumber town, but it has since diversified its economy to include tourism, manufacturing, and retail.
Geography
Manistique is located in the Upper Peninsula of Michigan, on the shores of Lake Michigan. The city is situated on the Manistique River, which flows through the city and empties into the lake. The city is surrounded by forests and lakes, making it a popular destination for outdoor recreation. The city is located about 30 miles south of the Mackinac Bridge, which connects the Upper and Lower Peninsulas of Michigan.
The city has a total area of 4.2 square miles, of which 4.1 square miles is land and 0.1 square miles is water. The city is located in a humid continental climate zone, with cold winters and warm summers.
Economy
Manistique’s economy is largely based on tourism, manufacturing, and retail. The city is home to several tourist attractions, including the Manistique Boardwalk, the Manistique Marina, and the Manistique Riverwalk. The city is also home to several manufacturing companies, including Manistique Papers, Inc., which produces paper products, and Manistique Foundry, which produces castings for the automotive industry. The city also has several retail stores, including grocery stores, clothing stores, and home improvement stores.
Demographics
As of the 2010 census, Manistique had a population of 3,079. The racial makeup of the city was 95.2% White, 0.7% African American, 0.7% Native American, 0.3% Asian, 0.1% Pacific Islander, 0.9% from other races, and 2.1% from two or more races. Hispanic or Latino of any race were 2.3% of the population.
The median income for a household in Manistique was $31,944, and the median income for a family was $41,250. The per capita income for the city was $17,845. About 16.2% of families and 20.2% of the population were below the poverty line, including 28.2% of those under age 18 and 8.2% of those age 65 or over.
Manistique is a small city with a rich history and a diverse economy. The city is home to several tourist attractions, manufacturing companies, and retail stores, making it a great place to live and work. The city has a diverse population and a strong sense of community, making it a great place to call home.
Common Questions
What is Per Capita Income in Manistique?
Per Capita income in Manistique is $31,643.
What is the Median Family Income in Manistique?
Median Family Income in Manistique is $67,319.
What is the Median Household income in Manistique?
Median Household Income in Manistique is $36,588.
What is Income or Wage Gap in Manistique?
Income or Wage Gap in Manistique is 50.8%.
Women in Manistique earn 49.2 cents for every dollar earned by a man.
What is Inequality or Gini Index in Manistique?
Inequality or Gini Index in Manistique is 0.53.
What is the Total Population of Manistique?
Total Population of Manistique is 2,838.
What is the Total Male Population of Manistique?
Total Male Population of Manistique is 1,298.
What is the Total Female Population of Manistique?
Total Female Population of Manistique is 1,540.
What is the Ratio of Males per 100 Females in Manistique?
There are 84.29 Males per 100 Females in Manistique.
What is the Ratio of Females per 100 Males in Manistique?
There are 118.64 Females per 100 Males in Manistique.
What is the Median Population Age in Manistique?
Median Population Age in Manistique is 50.6 Years.
What is the Average Family Size in Manistique
Average Family Size in Manistique is 2.8 People.
What is the Average Household Size in Manistique
Average Household Size in Manistique is 1.9 People.
How Large is the Labor Force in Manistique?
There are 1,407 People in the Labor Forcein in Manistique.
What is the Percentage of People in the Labor Force in Manistique?
56.9% of People are in the Labor Force in Manistique.
What is the Unemployment Rate in Manistique?
Unemployment Rate in Manistique is 8.6%.