Belcourt, ND Map & Demographics
Belcourt Map
Belcourt Overview
$20,909
PER CAPITA INCOME
$85,469
AVG FAMILY INCOME
$61,250
AVG HOUSEHOLD INCOME
28.8%
WAGE / INCOME GAP [ % ]
71.2¢/ $1
WAGE / INCOME GAP [ $ ]
0.41
INEQUALITY / GINI INDEX
1,772
TOTAL POPULATION
761
MALE POPULATION
1,011
FEMALE POPULATION
75.27
MALES / 100 FEMALES
132.85
FEMALES / 100 MALES
26.8
MEDIAN AGE
3.7
AVG FAMILY SIZE
3.4
AVG HOUSEHOLD SIZE
689
LABOR FORCE [ PEOPLE ]
63.3%
PERCENT IN LABOR FORCE
8.0%
UNEMPLOYMENT RATE
Belcourt Zip Codes
Belcourt Area Codes
Income in Belcourt
Income Overview in Belcourt
Per Capita Income in Belcourt is $20,909, while median incomes of families and households are $85,469 and $61,250 respectively.
| Characteristic | Number | Measure |
| Per Capita Income | 1,772 | $20,909 |
| Median Family Income | 391 | $85,469 |
| Mean Family Income | 391 | $81,575 |
| Median Household Income | 503 | $61,250 |
| Mean Household Income | 503 | $71,563 |
| Income Deficit | 391 | $0 |
| Wage / Income Gap (%) | 1,772 | 28.84% |
| Wage / Income Gap ($) | 1,772 | 71.16¢ per $1 |
| Gini / Inequality Index | 1,772 | 0.41 |
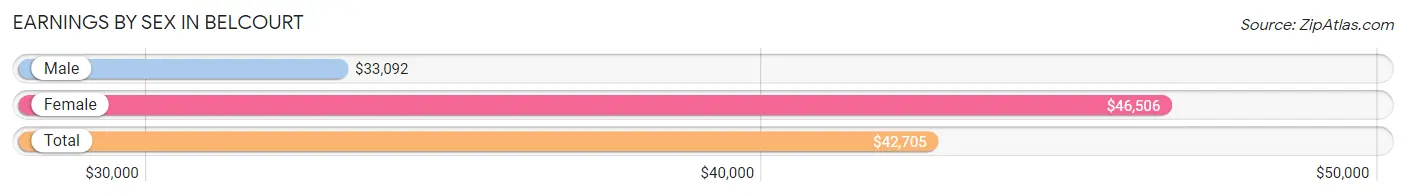
Earnings by Sex in Belcourt
Average Earnings in Belcourt are $42,705, $33,092 for men and $46,506 for women, a difference of 28.8%.
| Sex | Number | Average Earnings |
| Male | 279 (39.7%) | $33,092 |
| Female | 423 (60.3%) | $46,506 |
| Total | 702 (100.0%) | $42,705 |
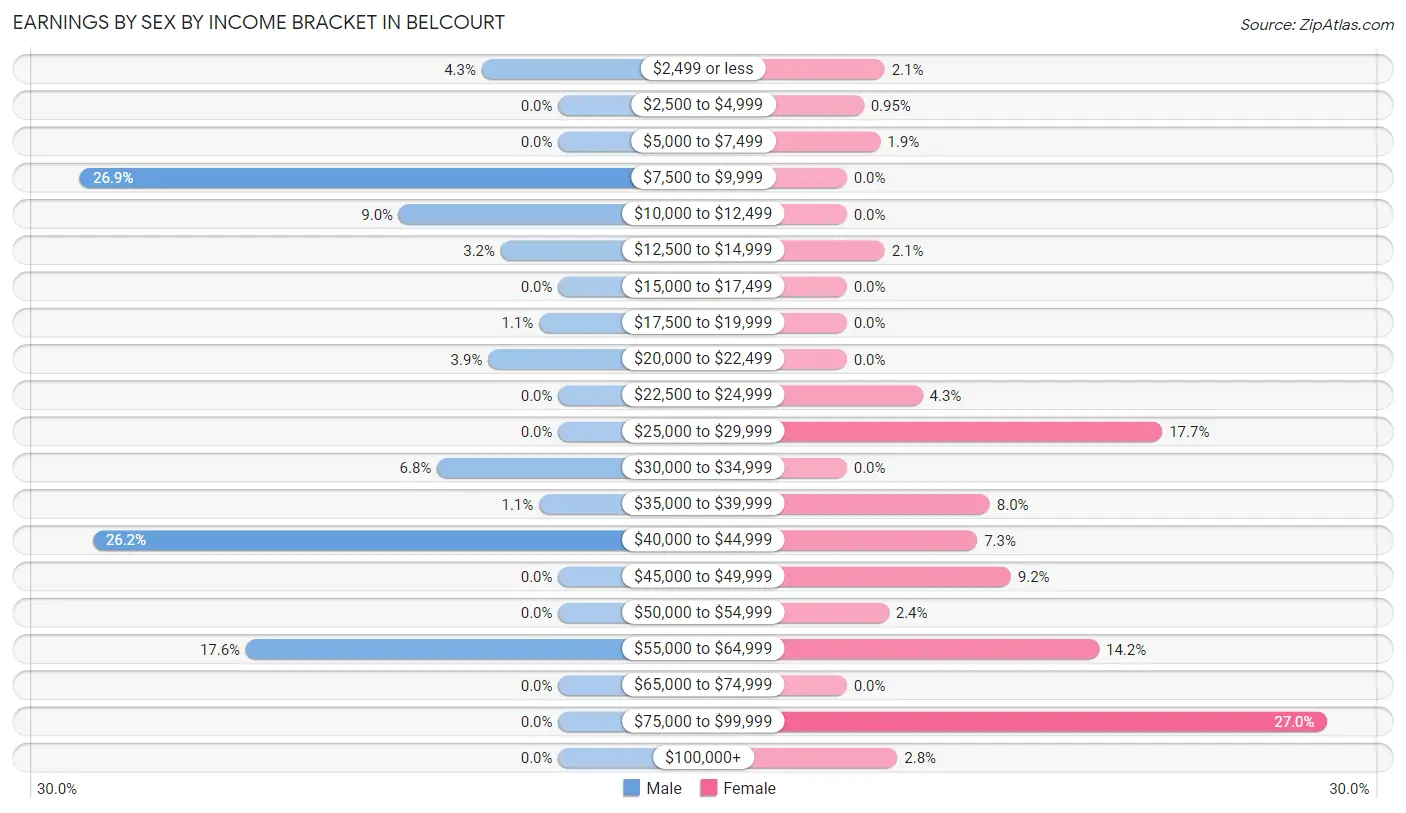
Earnings by Sex by Income Bracket in Belcourt
The most common earnings brackets in Belcourt are $7,500 to $9,999 for men (75 | 26.9%) and $75,000 to $99,999 for women (114 | 27.0%).
| Income | Male | Female |
| $2,499 or less | 12 (4.3%) | 9 (2.1%) |
| $2,500 to $4,999 | 0 (0.0%) | 4 (0.9%) |
| $5,000 to $7,499 | 0 (0.0%) | 8 (1.9%) |
| $7,500 to $9,999 | 75 (26.9%) | 0 (0.0%) |
| $10,000 to $12,499 | 25 (9.0%) | 0 (0.0%) |
| $12,500 to $14,999 | 9 (3.2%) | 9 (2.1%) |
| $15,000 to $17,499 | 0 (0.0%) | 0 (0.0%) |
| $17,500 to $19,999 | 3 (1.1%) | 0 (0.0%) |
| $20,000 to $22,499 | 11 (3.9%) | 0 (0.0%) |
| $22,500 to $24,999 | 0 (0.0%) | 18 (4.3%) |
| $25,000 to $29,999 | 0 (0.0%) | 75 (17.7%) |
| $30,000 to $34,999 | 19 (6.8%) | 0 (0.0%) |
| $35,000 to $39,999 | 3 (1.1%) | 34 (8.0%) |
| $40,000 to $44,999 | 73 (26.2%) | 31 (7.3%) |
| $45,000 to $49,999 | 0 (0.0%) | 39 (9.2%) |
| $50,000 to $54,999 | 0 (0.0%) | 10 (2.4%) |
| $55,000 to $64,999 | 49 (17.6%) | 60 (14.2%) |
| $65,000 to $74,999 | 0 (0.0%) | 0 (0.0%) |
| $75,000 to $99,999 | 0 (0.0%) | 114 (27.0%) |
| $100,000+ | 0 (0.0%) | 12 (2.8%) |
| Total | 279 (100.0%) | 423 (100.0%) |
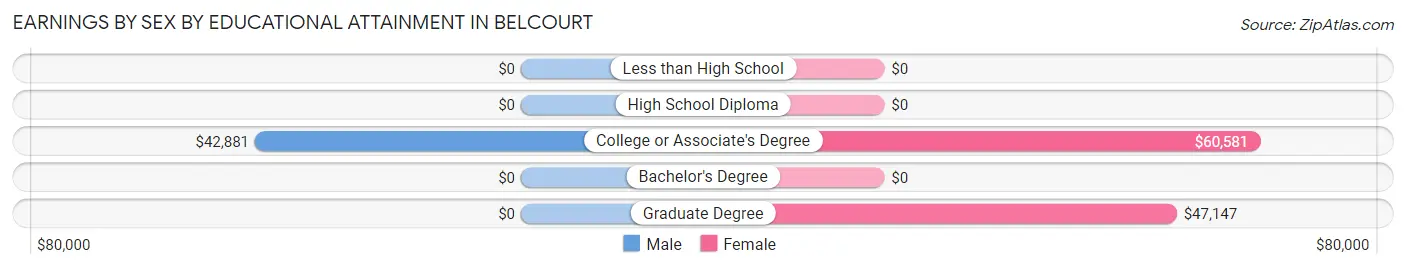
Earnings by Sex by Educational Attainment in Belcourt
Average earnings in Belcourt are $34,079 for men and $46,795 for women, a difference of 27.2%. Men with an educational attainment of college or associate's degree enjoy the highest average annual earnings of $42,881, while those with college or associate's degree education earn the least with $42,881. Women with an educational attainment of college or associate's degree earn the most with the average annual earnings of $60,581, while those with graduate degree education have the smallest earnings of $47,147.
| Educational Attainment | Male Income | Female Income |
| Less than High School | - | - |
| High School Diploma | - | - |
| College or Associate's Degree | $42,881 | $60,581 |
| Bachelor's Degree | - | - |
| Graduate Degree | - | - |
| Total | $34,079 | $46,795 |
Family Income in Belcourt
Family Income Brackets in Belcourt
According to the Belcourt family income data, there are 102 families falling into the $35,000 to $49,999 income range, which is the most common income bracket and makes up 26.1% of all families.
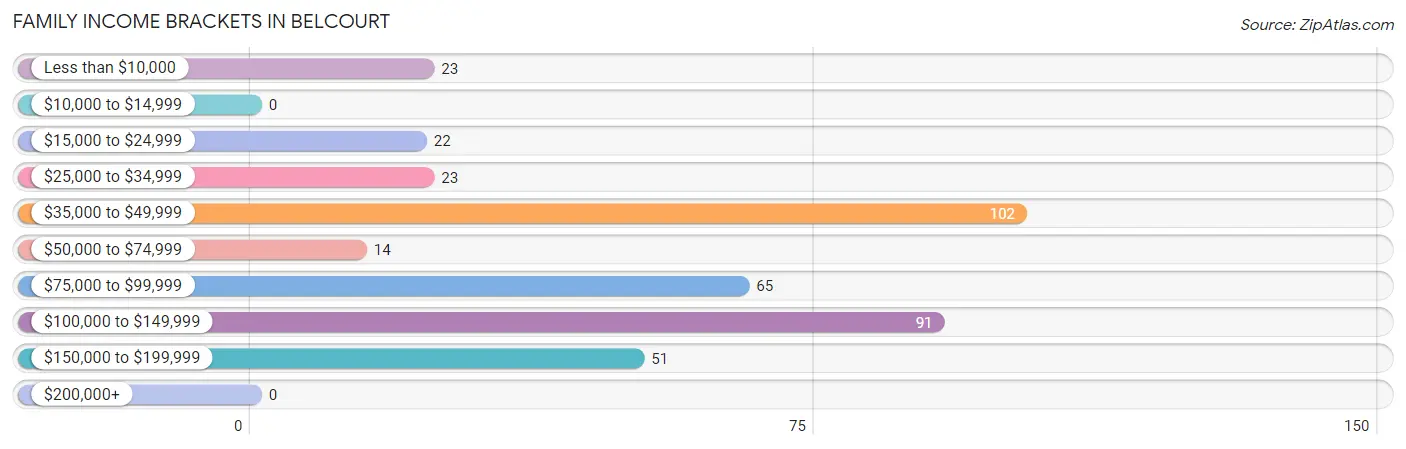
| Income Bracket | # Families | % Families |
| Less than $10,000 | 23 | 5.9% |
| $10,000 to $14,999 | 0 | 0.0% |
| $15,000 to $24,999 | 22 | 5.6% |
| $25,000 to $34,999 | 23 | 5.9% |
| $35,000 to $49,999 | 102 | 26.1% |
| $50,000 to $74,999 | 14 | 3.6% |
| $75,000 to $99,999 | 65 | 16.6% |
| $100,000 to $149,999 | 91 | 23.3% |
| $150,000 to $199,999 | 51 | 13.0% |
| $200,000+ | 0 | 0.0% |
Family Income by Famaliy Size in Belcourt
4-person families (72 | 18.4%) account for the highest median family income in Belcourt with $153,235 per family, while 4-person families (72 | 18.4%) have the highest median income of $38,309 per family member.
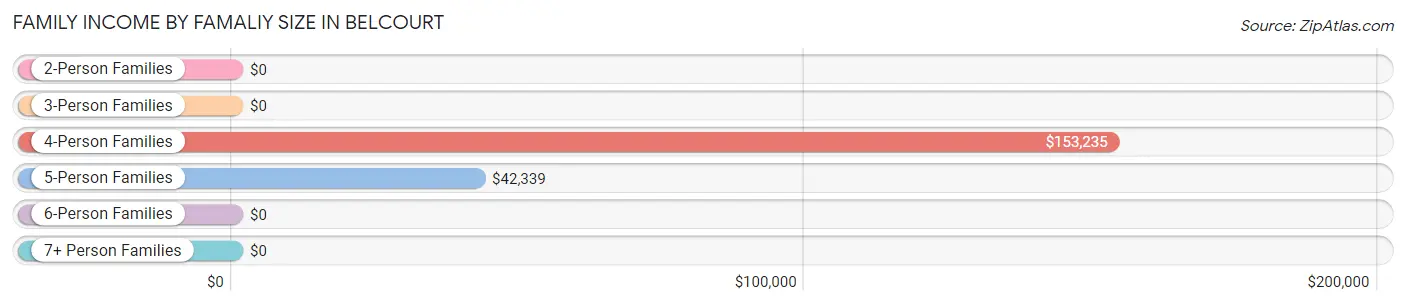
| Income Bracket | # Families | Median Income |
| 2-Person Families | 150 (38.4%) | $0 |
| 3-Person Families | 58 (14.8%) | $0 |
| 4-Person Families | 72 (18.4%) | $153,235 |
| 5-Person Families | 58 (14.8%) | $42,339 |
| 6-Person Families | 41 (10.5%) | $0 |
| 7+ Person Families | 12 (3.1%) | $0 |
| Total | 391 (100.0%) | $85,469 |
Family Income by Number of Earners in Belcourt
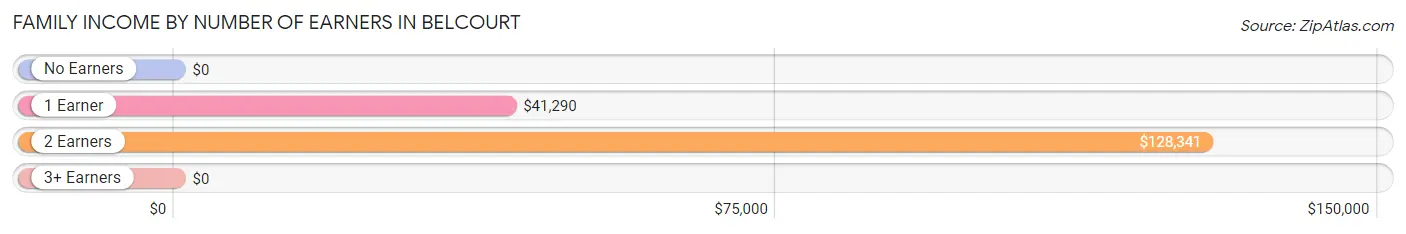
| Number of Earners | # Families | Median Income |
| No Earners | 28 (7.2%) | $0 |
| 1 Earner | 136 (34.8%) | $41,290 |
| 2 Earners | 227 (58.1%) | $128,341 |
| 3+ Earners | 0 (0.0%) | $0 |
| Total | 391 (100.0%) | $85,469 |
Household Income in Belcourt
Household Income Brackets in Belcourt
With 103 households falling in the category, the $100,000 to $149,999 income range is the most frequent in Belcourt, accounting for 20.5% of all households.
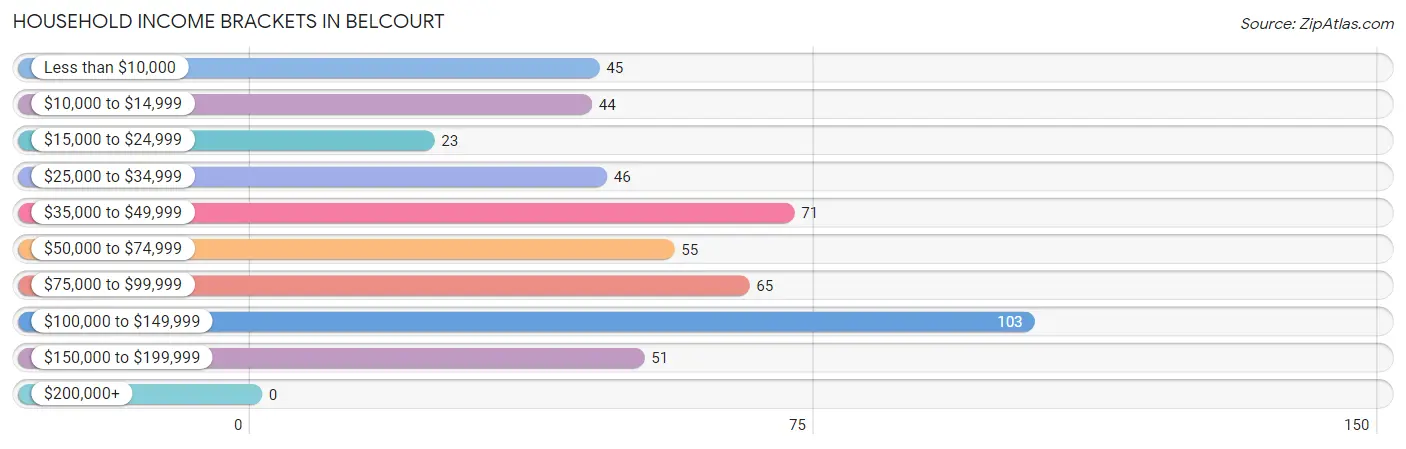
| Income Bracket | # Households | % Households |
| Less than $10,000 | 45 | 8.9% |
| $10,000 to $14,999 | 44 | 8.7% |
| $15,000 to $24,999 | 23 | 4.6% |
| $25,000 to $34,999 | 46 | 9.1% |
| $35,000 to $49,999 | 71 | 14.1% |
| $50,000 to $74,999 | 55 | 10.9% |
| $75,000 to $99,999 | 65 | 12.9% |
| $100,000 to $149,999 | 103 | 20.5% |
| $150,000 to $199,999 | 51 | 10.1% |
| $200,000+ | 0 | 0.0% |
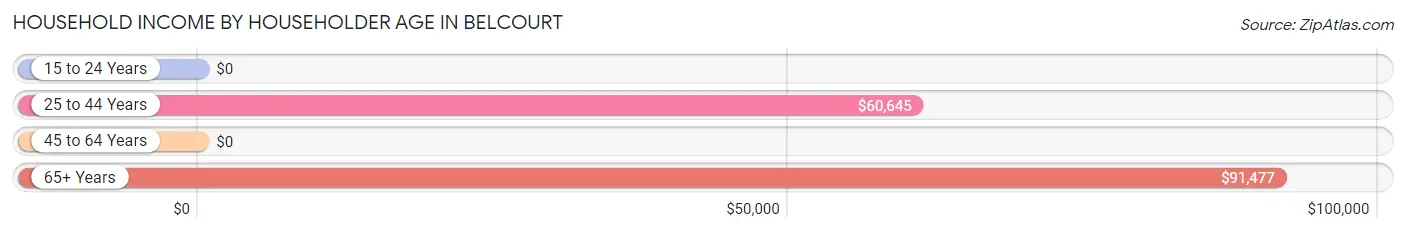
Household Income by Householder Age in Belcourt
The median household income in Belcourt is $61,250, with the highest median household income of $91,477 found in the 65+ years age bracket for the primary householder. A total of 122 households (24.2%) fall into this category. Meanwhile, the 15 to 24 years age bracket for the primary householder has the lowest median household income of $0, with 9 households (1.8%) in this group.
| Income Bracket | # Households | Median Income |
| 15 to 24 Years | 9 (1.8%) | $0 |
| 25 to 44 Years | 214 (42.5%) | $60,645 |
| 45 to 64 Years | 158 (31.4%) | $0 |
| 65+ Years | 122 (24.2%) | $91,477 |
| Total | 503 (100.0%) | $61,250 |
Poverty in Belcourt
Income Below Poverty by Sex and Age in Belcourt
With 32.6% poverty level for males and 22.5% for females among the residents of Belcourt, 15 year old males and under 5 year old females are the most vulnerable to poverty, with 11 males (100.0%) and 32 females (100.0%) in their respective age groups living below the poverty level.
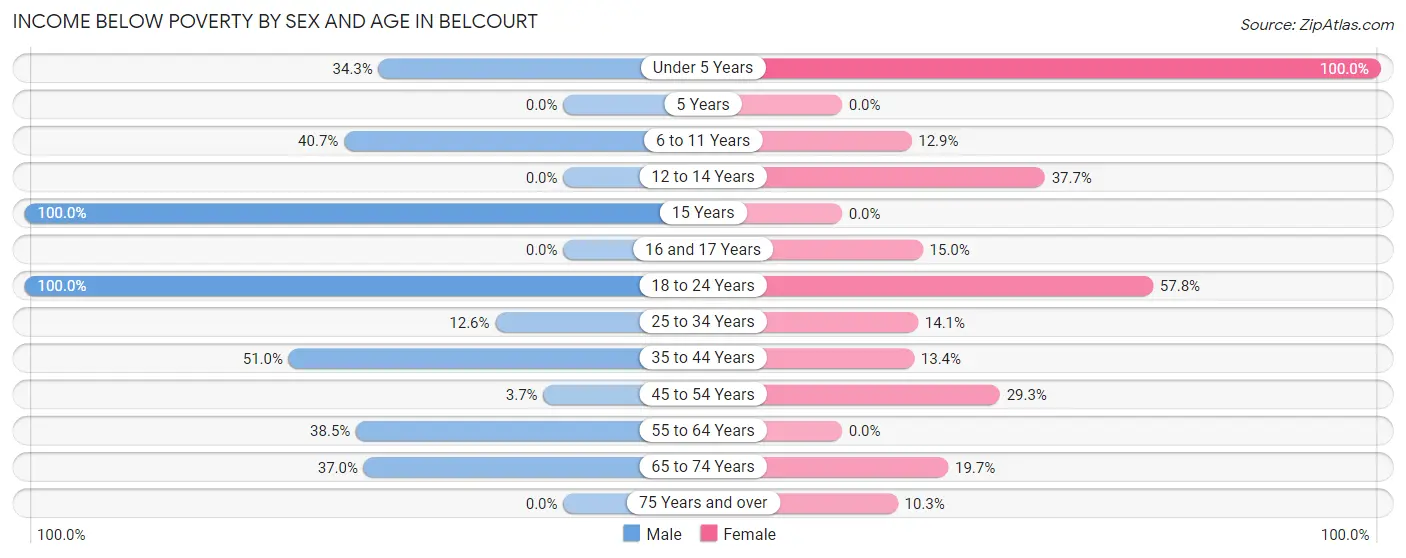
| Age Bracket | Male | Female |
| Under 5 Years | 24 (34.3%) | 32 (100.0%) |
| 5 Years | 0 (0.0%) | 0 (0.0%) |
| 6 to 11 Years | 59 (40.7%) | 24 (12.9%) |
| 12 to 14 Years | 0 (0.0%) | 29 (37.7%) |
| 15 Years | 11 (100.0%) | 0 (0.0%) |
| 16 and 17 Years | 0 (0.0%) | 9 (15.0%) |
| 18 to 24 Years | 25 (100.0%) | 41 (57.8%) |
| 25 to 34 Years | 13 (12.6%) | 12 (14.1%) |
| 35 to 44 Years | 53 (51.0%) | 19 (13.4%) |
| 45 to 54 Years | 3 (3.7%) | 34 (29.3%) |
| 55 to 64 Years | 20 (38.5%) | 0 (0.0%) |
| 65 to 74 Years | 10 (37.0%) | 14 (19.7%) |
| 75 Years and over | 0 (0.0%) | 6 (10.3%) |
| Total | 218 (32.6%) | 220 (22.5%) |
Income Above Poverty by Sex and Age in Belcourt
According to the poverty statistics in Belcourt, males aged 5 years and females aged 5 years are the age groups that are most secure financially, with 100.0% of males and 100.0% of females in these age groups living above the poverty line.
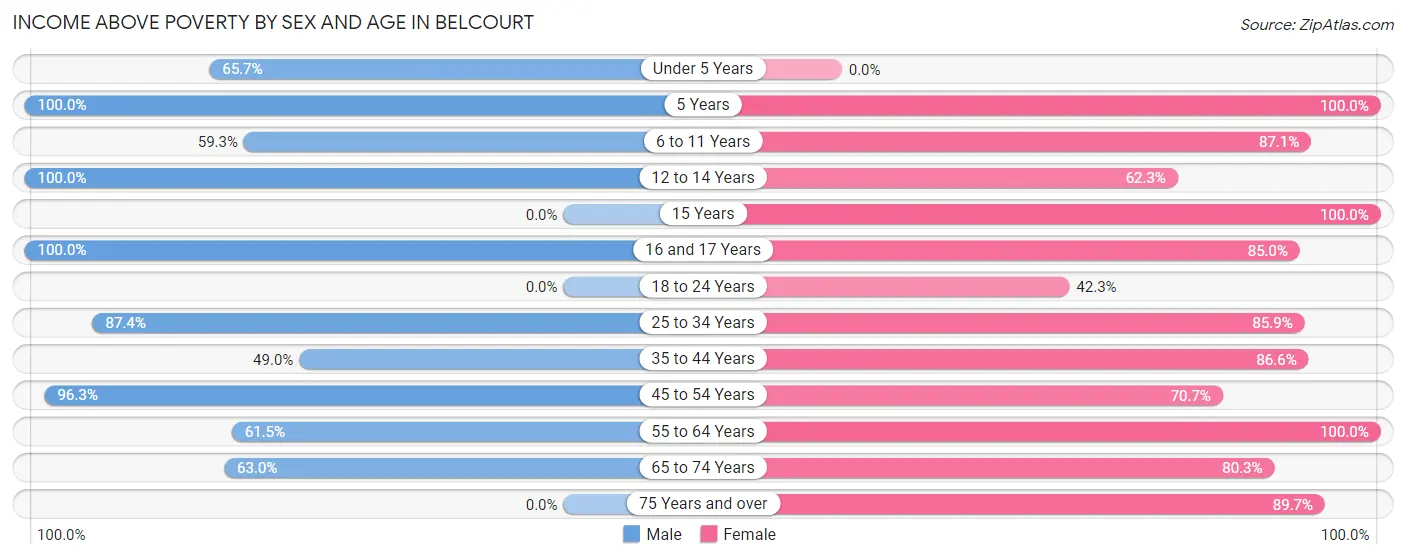
| Age Bracket | Male | Female |
| Under 5 Years | 46 (65.7%) | 0 (0.0%) |
| 5 Years | 9 (100.0%) | 13 (100.0%) |
| 6 to 11 Years | 86 (59.3%) | 162 (87.1%) |
| 12 to 14 Years | 32 (100.0%) | 48 (62.3%) |
| 15 Years | 0 (0.0%) | 12 (100.0%) |
| 16 and 17 Years | 9 (100.0%) | 51 (85.0%) |
| 18 to 24 Years | 0 (0.0%) | 30 (42.2%) |
| 25 to 34 Years | 90 (87.4%) | 73 (85.9%) |
| 35 to 44 Years | 51 (49.0%) | 123 (86.6%) |
| 45 to 54 Years | 78 (96.3%) | 82 (70.7%) |
| 55 to 64 Years | 32 (61.5%) | 54 (100.0%) |
| 65 to 74 Years | 17 (63.0%) | 57 (80.3%) |
| 75 Years and over | 0 (0.0%) | 52 (89.7%) |
| Total | 450 (67.4%) | 757 (77.5%) |
Income Below Poverty Among Married-Couple Families in Belcourt
The poverty statistics for married-couple families in Belcourt show that 8.0% or 12 of the total 151 families live below the poverty line. Families with 5 or more children have the highest poverty rate of 100.0%, comprising of 12 families. On the other hand, families with no children have the lowest poverty rate of 0.0%, which includes 0 families.
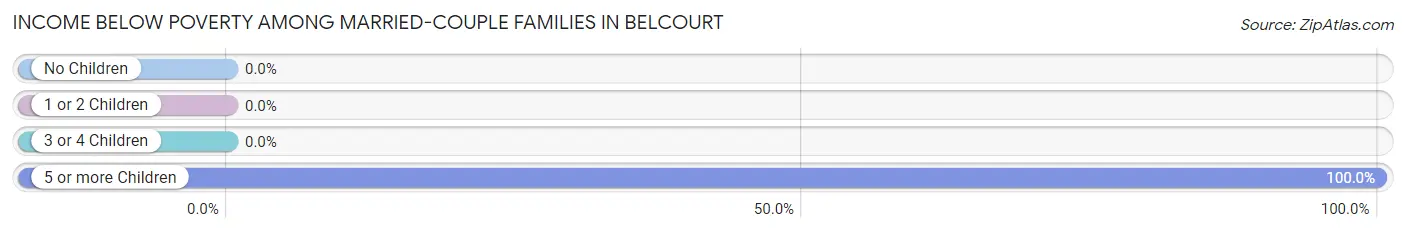
| Children | Above Poverty | Below Poverty |
| No Children | 29 (100.0%) | 0 (0.0%) |
| 1 or 2 Children | 69 (100.0%) | 0 (0.0%) |
| 3 or 4 Children | 41 (100.0%) | 0 (0.0%) |
| 5 or more Children | 0 (0.0%) | 12 (100.0%) |
| Total | 139 (92.0%) | 12 (8.0%) |
Income Below Poverty Among Single-Parent Households in Belcourt
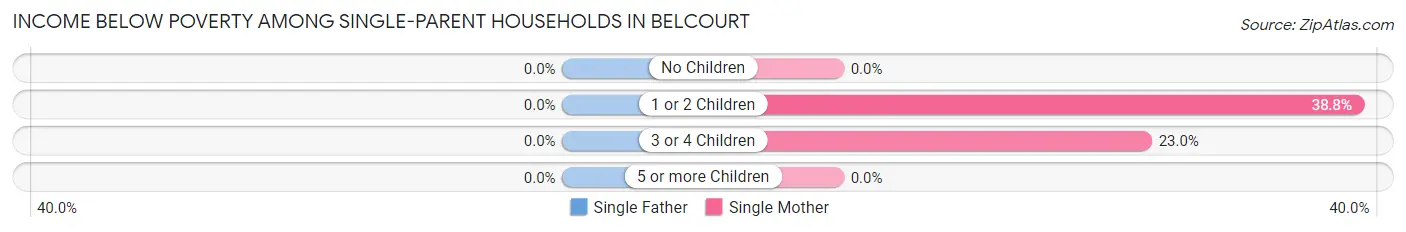
| Children | Single Father | Single Mother |
| No Children | 0 (0.0%) | 0 (0.0%) |
| 1 or 2 Children | 0 (0.0%) | 31 (38.8%) |
| 3 or 4 Children | 0 (0.0%) | 14 (23.0%) |
| 5 or more Children | 0 (0.0%) | 0 (0.0%) |
| Total | 0 (0.0%) | 45 (20.9%) |
Income Below Poverty Among Married-Couple vs Single-Parent Households in Belcourt
The poverty data for Belcourt shows that 12 of the married-couple family households (8.0%) and 45 of the single-parent households (18.8%) are living below the poverty level. Within the married-couple family households, those with 5 or more children have the highest poverty rate, with 12 households (100.0%) falling below the poverty line. Among the single-parent households, those with 1 or 2 children have the highest poverty rate, with 31 household (33.0%) living below poverty.
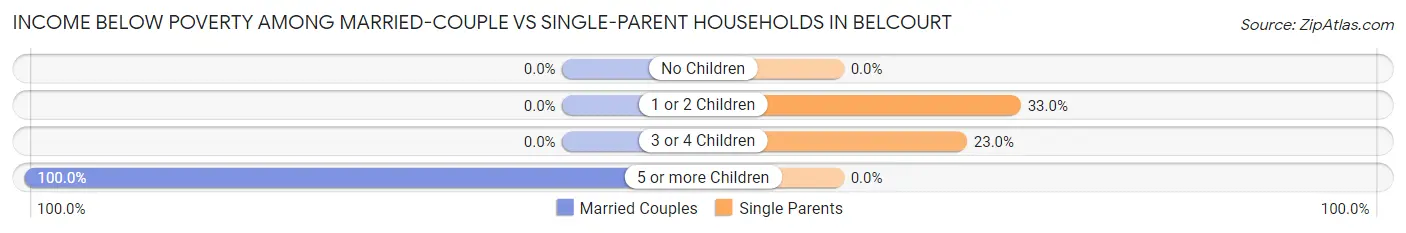
| Children | Married-Couple Families | Single-Parent Households |
| No Children | 0 (0.0%) | 0 (0.0%) |
| 1 or 2 Children | 0 (0.0%) | 31 (33.0%) |
| 3 or 4 Children | 0 (0.0%) | 14 (23.0%) |
| 5 or more Children | 12 (100.0%) | 0 (0.0%) |
| Total | 12 (8.0%) | 45 (18.8%) |
Race in Belcourt
The most populous races in Belcourt are Native / Alaskan (1,665 | 94.0%), White / Caucasian (59 | 3.3%), and Two or more Races (35 | 2.0%).
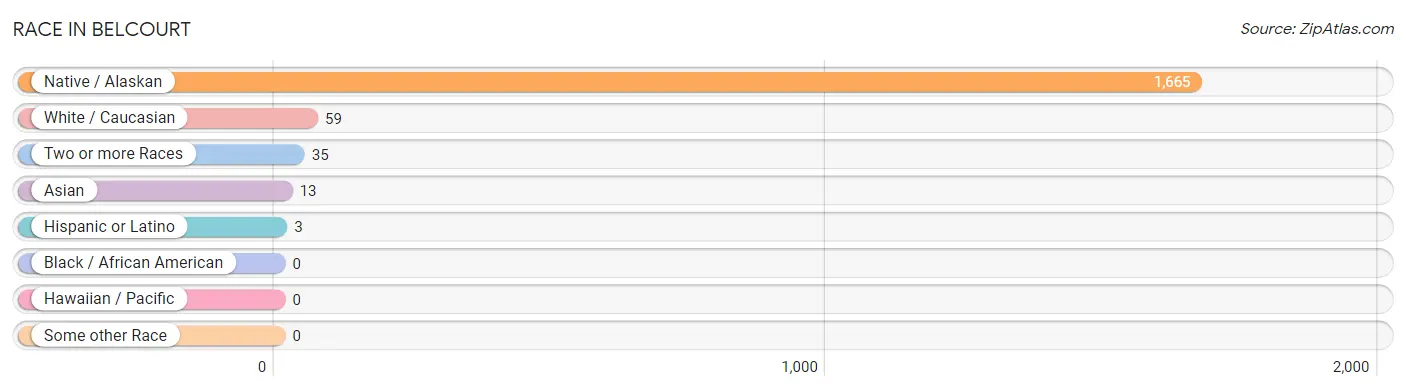
| Race | # Population | % Population |
| Asian | 13 | 0.7% |
| Black / African American | 0 | 0.0% |
| Hawaiian / Pacific | 0 | 0.0% |
| Hispanic or Latino | 3 | 0.2% |
| Native / Alaskan | 1,665 | 94.0% |
| White / Caucasian | 59 | 3.3% |
| Two or more Races | 35 | 2.0% |
| Some other Race | 0 | 0.0% |
| Total | 1,772 | 100.0% |
Ancestry in Belcourt
The most populous ancestries reported in Belcourt are Chippewa (1,549 | 87.4%), Sioux (162 | 9.1%), Norwegian (14 | 0.8%), Thai (12 | 0.7%), and German (9 | 0.5%), together accounting for 98.5% of all Belcourt residents.
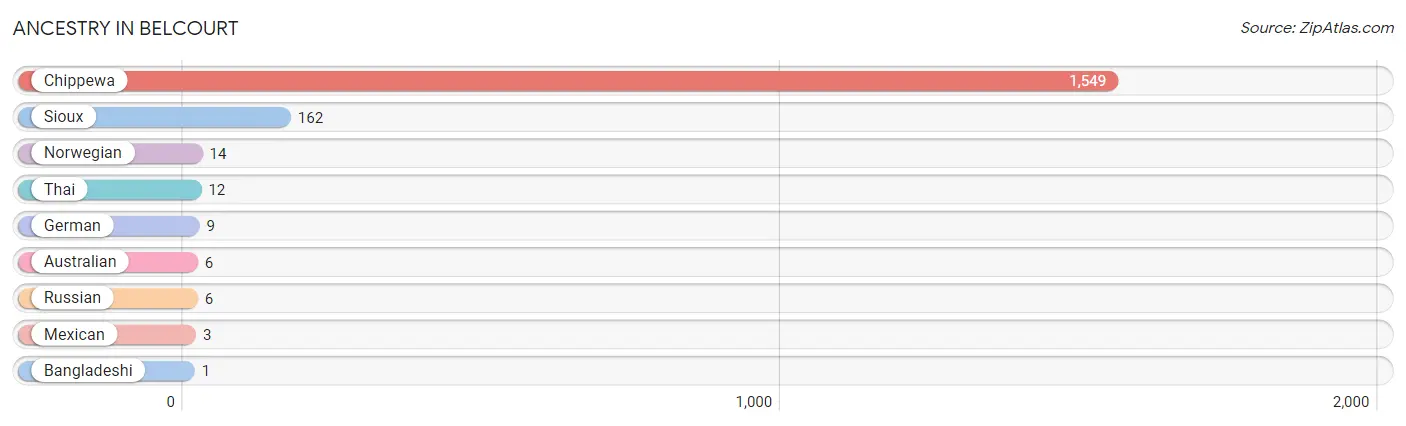
| Ancestry | # Population | % Population |
| Australian | 6 | 0.3% |
| Bangladeshi | 1 | 0.1% |
| Chippewa | 1,549 | 87.4% |
| German | 9 | 0.5% |
| Mexican | 3 | 0.2% |
| Norwegian | 14 | 0.8% |
| Russian | 6 | 0.3% |
| Sioux | 162 | 9.1% |
| Thai | 12 | 0.7% | View All 9 Rows |
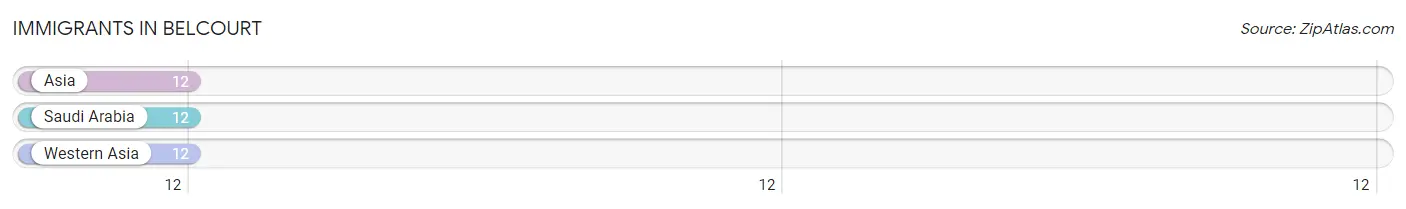
Immigrants in Belcourt
The most numerous immigrant groups reported in Belcourt came from Asia (12 | 0.7%), Saudi Arabia (12 | 0.7%), and Western Asia (12 | 0.7%), together accounting for 2.0% of all Belcourt residents.
| Immigration Origin | # Population | % Population |
| Asia | 12 | 0.7% |
| Saudi Arabia | 12 | 0.7% |
| Western Asia | 12 | 0.7% | View All 3 Rows |
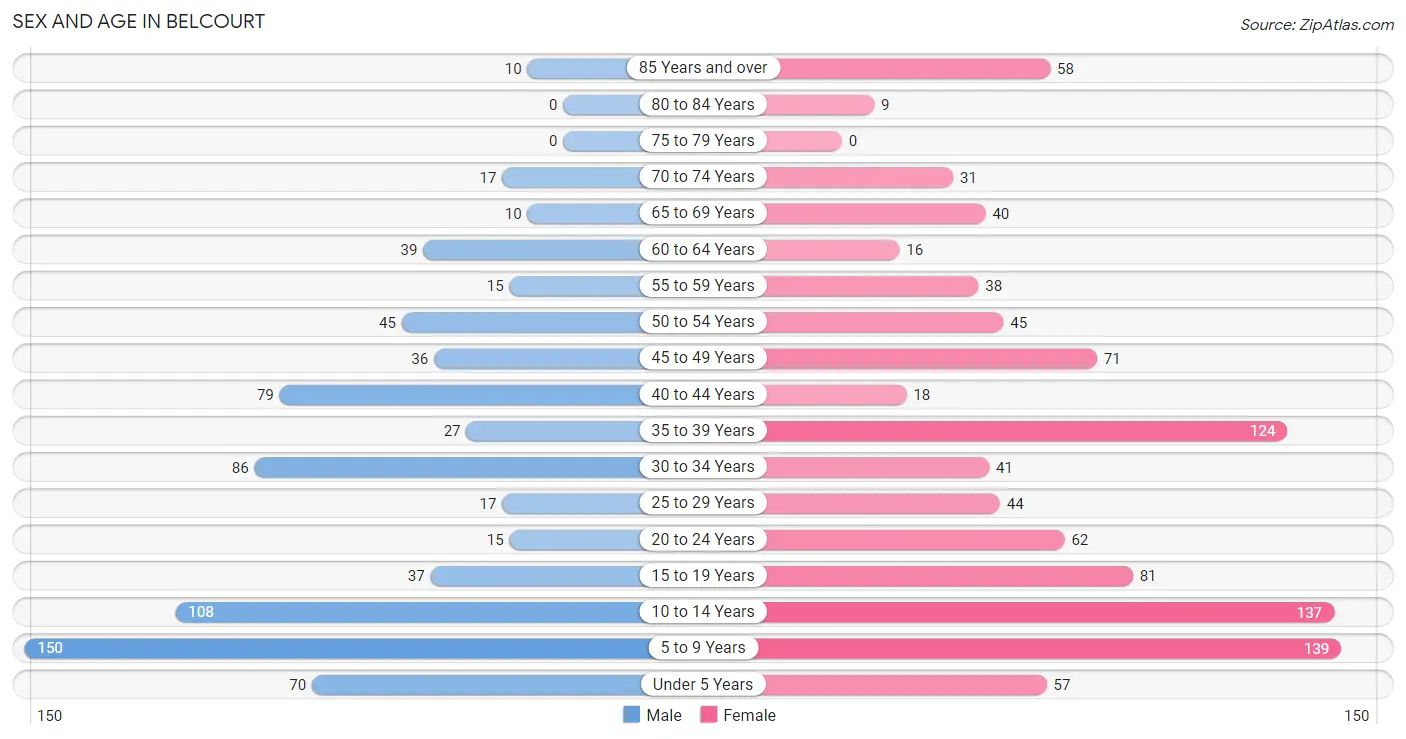
Sex and Age in Belcourt
Sex and Age in Belcourt
The most populous age groups in Belcourt are 5 to 9 Years (150 | 19.7%) for men and 5 to 9 Years (139 | 13.8%) for women.
| Age Bracket | Male | Female |
| Under 5 Years | 70 (9.2%) | 57 (5.6%) |
| 5 to 9 Years | 150 (19.7%) | 139 (13.8%) |
| 10 to 14 Years | 108 (14.2%) | 137 (13.6%) |
| 15 to 19 Years | 37 (4.9%) | 81 (8.0%) |
| 20 to 24 Years | 15 (2.0%) | 62 (6.1%) |
| 25 to 29 Years | 17 (2.2%) | 44 (4.3%) |
| 30 to 34 Years | 86 (11.3%) | 41 (4.1%) |
| 35 to 39 Years | 27 (3.5%) | 124 (12.3%) |
| 40 to 44 Years | 79 (10.4%) | 18 (1.8%) |
| 45 to 49 Years | 36 (4.7%) | 71 (7.0%) |
| 50 to 54 Years | 45 (5.9%) | 45 (4.4%) |
| 55 to 59 Years | 15 (2.0%) | 38 (3.8%) |
| 60 to 64 Years | 39 (5.1%) | 16 (1.6%) |
| 65 to 69 Years | 10 (1.3%) | 40 (4.0%) |
| 70 to 74 Years | 17 (2.2%) | 31 (3.1%) |
| 75 to 79 Years | 0 (0.0%) | 0 (0.0%) |
| 80 to 84 Years | 0 (0.0%) | 9 (0.9%) |
| 85 Years and over | 10 (1.3%) | 58 (5.7%) |
| Total | 761 (100.0%) | 1,011 (100.0%) |
Families and Households in Belcourt
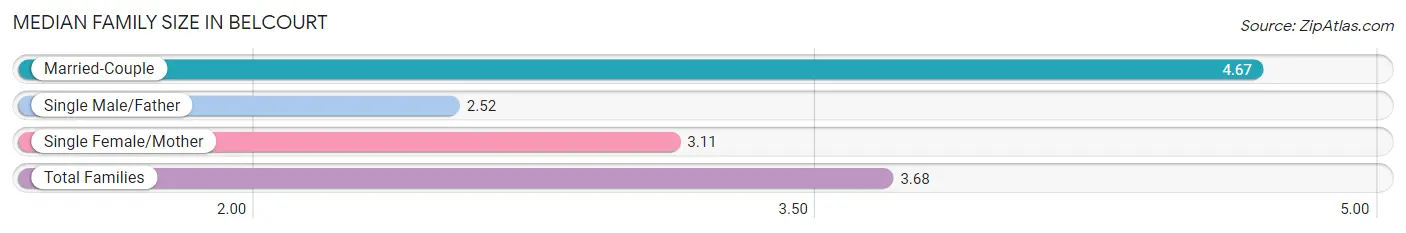
Median Family Size in Belcourt
The median family size in Belcourt is 3.68 persons per family, with married-couple families (151 | 38.6%) accounting for the largest median family size of 4.67 persons per family. On the other hand, single male/father families (25 | 6.4%) represent the smallest median family size with 2.52 persons per family.
| Family Type | # Families | Family Size |
| Married-Couple | 151 (38.6%) | 4.67 |
| Single Male/Father | 25 (6.4%) | 2.52 |
| Single Female/Mother | 215 (55.0%) | 3.11 |
| Total Families | 391 (100.0%) | 3.68 |
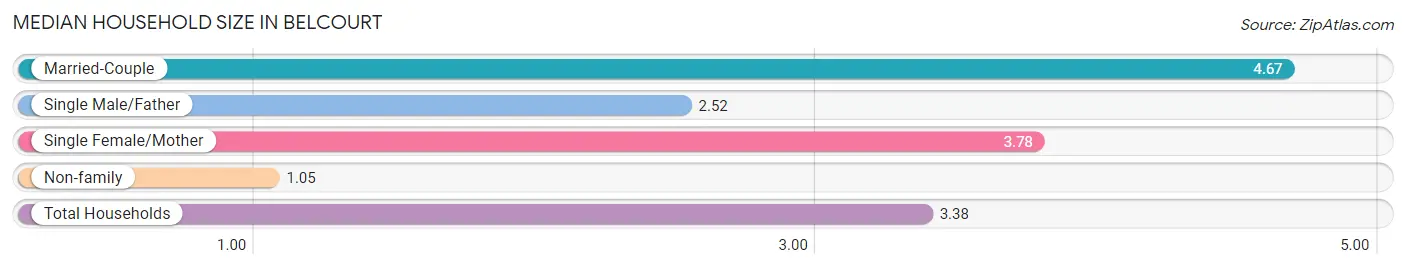
Median Household Size in Belcourt
The median household size in Belcourt is 3.38 persons per household, with married-couple households (151 | 30.0%) accounting for the largest median household size of 4.67 persons per household. non-family households (112 | 22.3%) represent the smallest median household size with 1.05 persons per household.
| Household Type | # Households | Household Size |
| Married-Couple | 151 (30.0%) | 4.67 |
| Single Male/Father | 25 (5.0%) | 2.52 |
| Single Female/Mother | 215 (42.7%) | 3.78 |
| Non-family | 112 (22.3%) | 1.05 |
| Total Households | 503 (100.0%) | 3.38 |
Household Size by Marriage Status in Belcourt
Out of a total of 503 households in Belcourt, 391 (77.7%) are family households, while 112 (22.3%) are nonfamily households. The most numerous type of family households are 4-person households, comprising 94, and the most common type of nonfamily households are 1-person households, comprising 102.
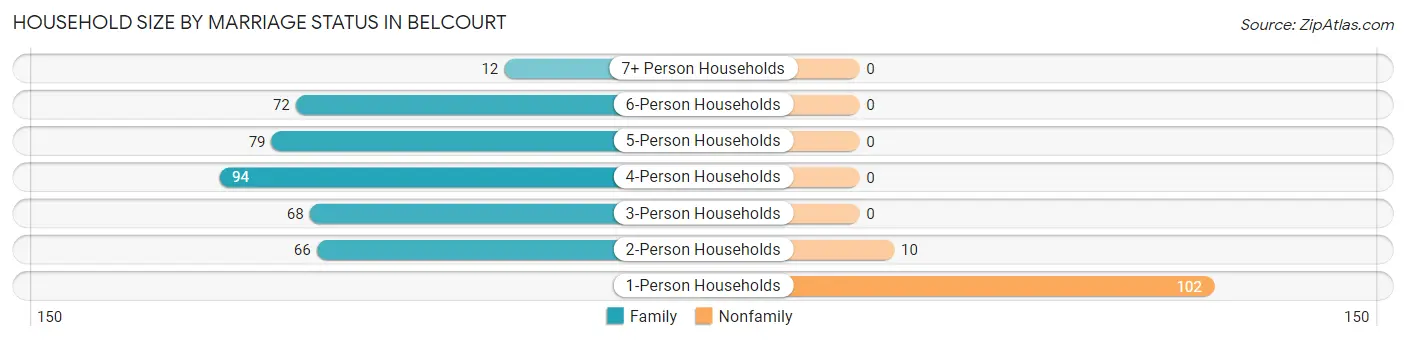
| Household Size | Family Households | Nonfamily Households |
| 1-Person Households | - | 102 (20.3%) |
| 2-Person Households | 66 (13.1%) | 10 (2.0%) |
| 3-Person Households | 68 (13.5%) | 0 (0.0%) |
| 4-Person Households | 94 (18.7%) | 0 (0.0%) |
| 5-Person Households | 79 (15.7%) | 0 (0.0%) |
| 6-Person Households | 72 (14.3%) | 0 (0.0%) |
| 7+ Person Households | 12 (2.4%) | 0 (0.0%) |
| Total | 391 (77.7%) | 112 (22.3%) |
Female Fertility in Belcourt
Fertility by Age in Belcourt
Average fertility rate in Belcourt is 102.0 births per 1,000 women. Women in the age bracket of 20 to 34 years have the highest fertility rate with 245.0 births per 1,000 women. Women in the age bracket of 20 to 34 years acount for 80.0% of all women with births.
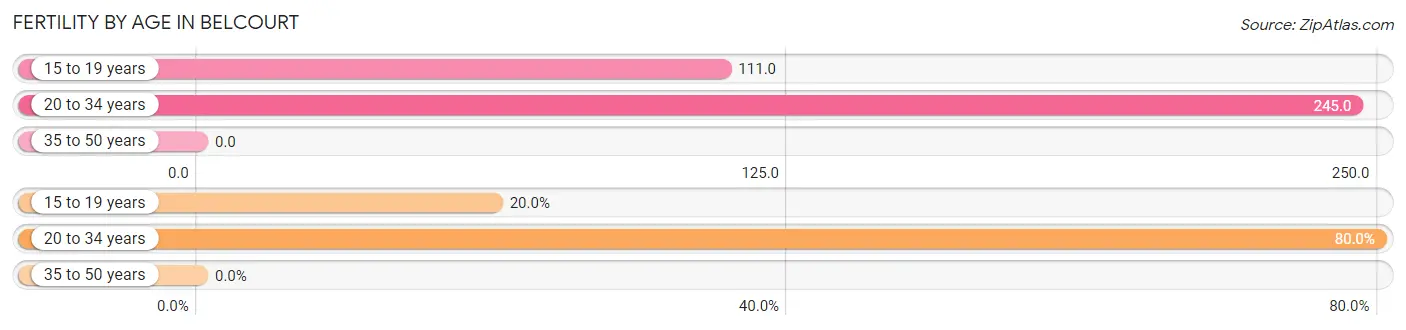
| Age Bracket | Women with Births | Births / 1,000 Women |
| 15 to 19 years | 9 (20.0%) | 111.0 |
| 20 to 34 years | 36 (80.0%) | 245.0 |
| 35 to 50 years | 0 (0.0%) | 0.0 |
| Total | 45 (100.0%) | 102.0 |
Fertility by Age by Marriage Status in Belcourt
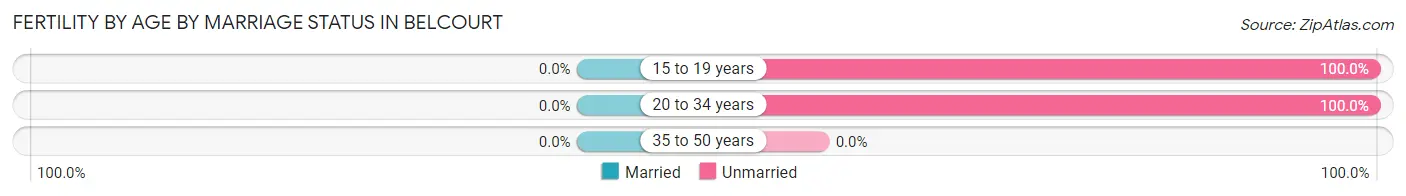
| Age Bracket | Married | Unmarried |
| 15 to 19 years | 0 (0.0%) | 9 (100.0%) |
| 20 to 34 years | 0 (0.0%) | 36 (100.0%) |
| 35 to 50 years | 0 (0.0%) | 0 (0.0%) |
| Total | 0 (0.0%) | 45 (100.0%) |
Fertility by Education in Belcourt
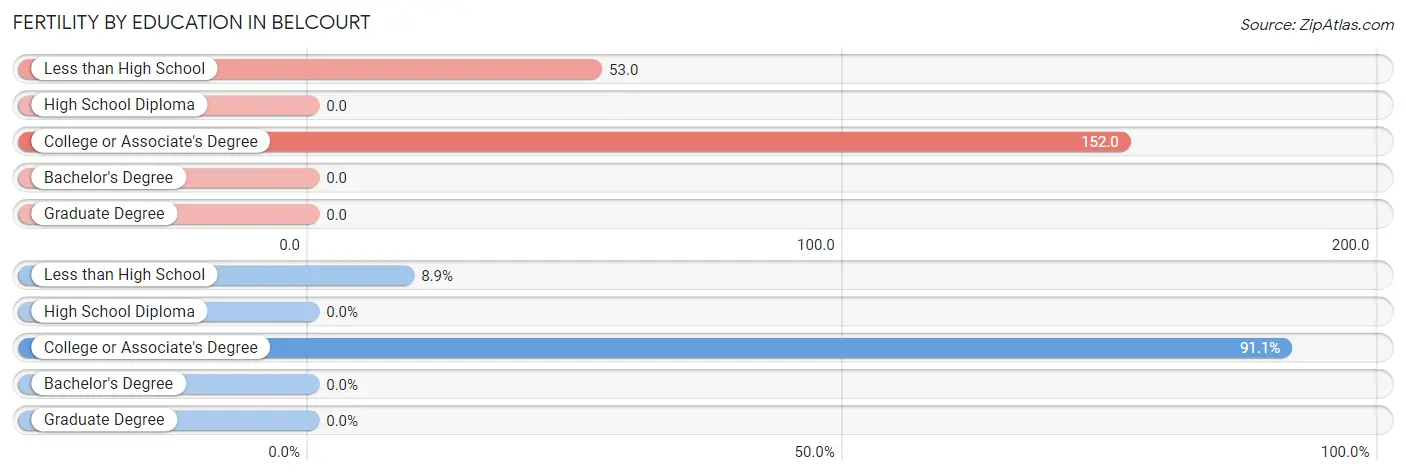
| Educational Attainment | Women with Births | Births / 1,000 Women |
| Less than High School | 4 (8.9%) | 53.0 |
| High School Diploma | 0 (0.0%) | 0.0 |
| College or Associate's Degree | 41 (91.1%) | 152.0 |
| Bachelor's Degree | 0 (0.0%) | 0.0 |
| Graduate Degree | 0 (0.0%) | 0.0 |
| Total | 45 (100.0%) | 102.0 |
Fertility by Education by Marriage Status in Belcourt
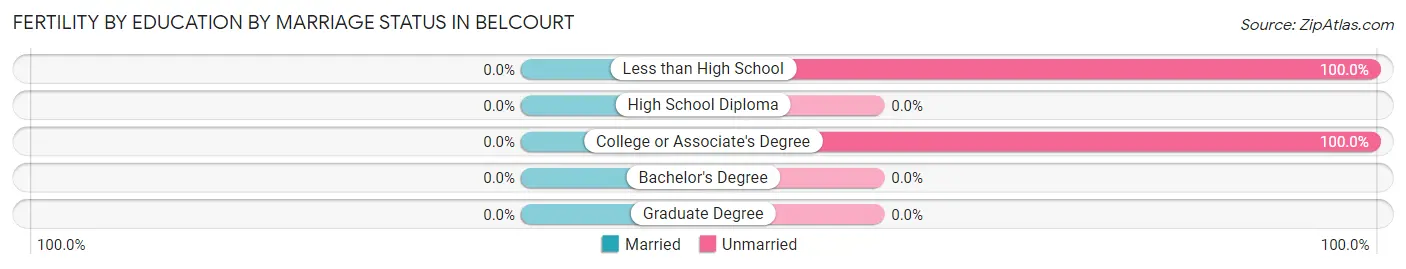
| Educational Attainment | Married | Unmarried |
| Less than High School | 0 (0.0%) | 4 (100.0%) |
| High School Diploma | 0 (0.0%) | 0 (0.0%) |
| College or Associate's Degree | 0 (0.0%) | 41 (100.0%) |
| Bachelor's Degree | 0 (0.0%) | 0 (0.0%) |
| Graduate Degree | 0 (0.0%) | 0 (0.0%) |
| Total | 0 (0.0%) | 45 (100.0%) |
Employment Characteristics in Belcourt
Employment by Class of Employer in Belcourt
Among the 621 employed individuals in Belcourt, federal government employees (250 | 40.3%), private company employees (141 | 22.7%), and local government employees (133 | 21.4%) make up the most common classes of employment.
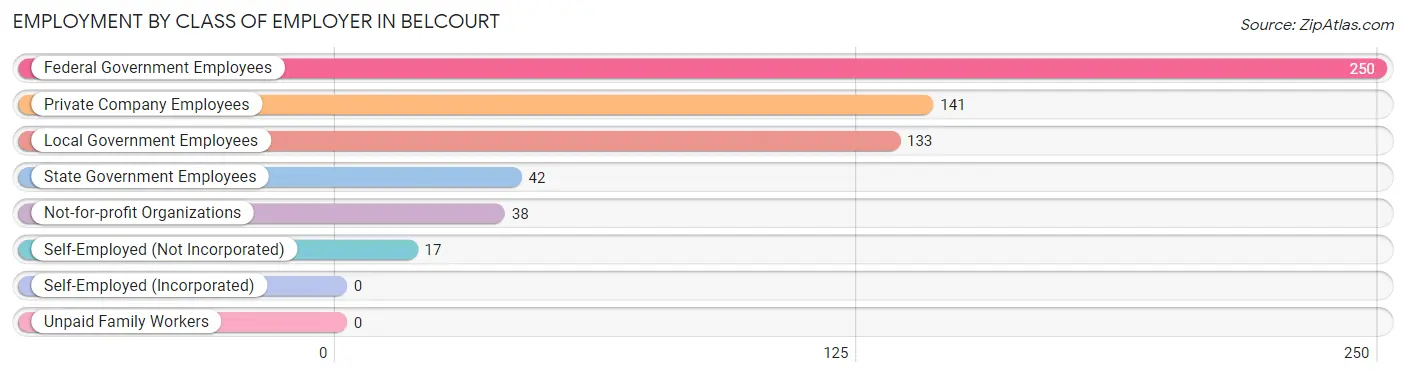
| Employer Class | # Employees | % Employees |
| Private Company Employees | 141 | 22.7% |
| Self-Employed (Incorporated) | 0 | 0.0% |
| Self-Employed (Not Incorporated) | 17 | 2.7% |
| Not-for-profit Organizations | 38 | 6.1% |
| Local Government Employees | 133 | 21.4% |
| State Government Employees | 42 | 6.8% |
| Federal Government Employees | 250 | 40.3% |
| Unpaid Family Workers | 0 | 0.0% |
| Total | 621 | 100.0% |
Employment Status by Age in Belcourt
According to the labor force statistics for Belcourt, out of the total population over 16 years of age (1,088), 63.3% or 689 individuals are in the labor force, with 8.0% or 55 of them unemployed. The age group with the highest labor force participation rate is 25 to 29 years, with 100.0% or 61 individuals in the labor force. Within the labor force, the 16 to 19 years age range has the highest percentage of unemployed individuals, with 41.9% or 13 of them being unemployed.
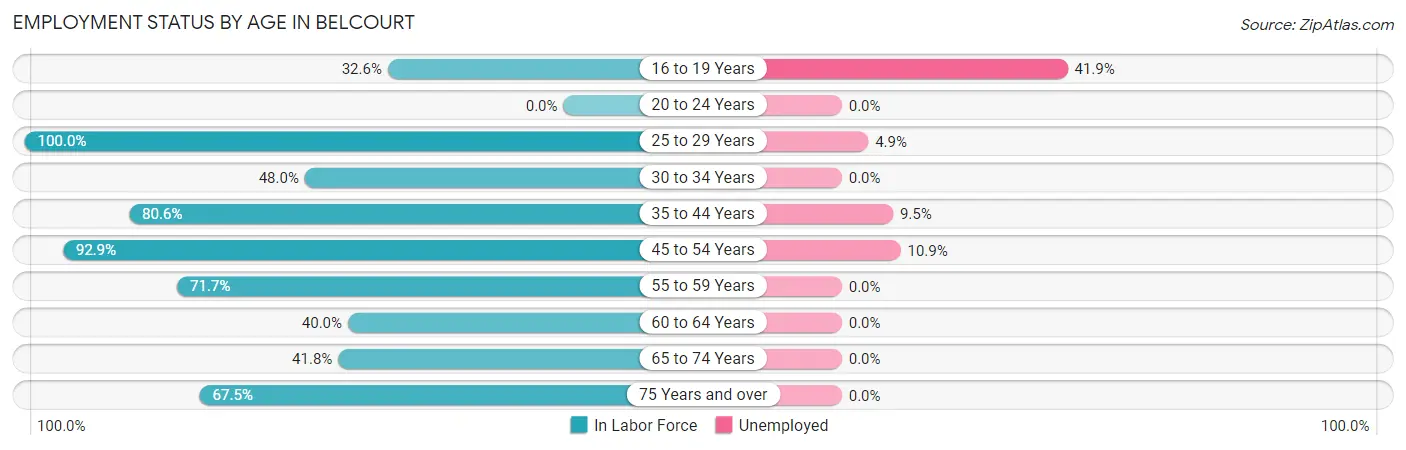
| Age Bracket | In Labor Force | Unemployed |
| 16 to 19 Years | 31 (32.6%) | 13 (41.9%) |
| 20 to 24 Years | 0 (0.0%) | 0 (0.0%) |
| 25 to 29 Years | 61 (100.0%) | 3 (4.9%) |
| 30 to 34 Years | 61 (48.0%) | 0 (0.0%) |
| 35 to 44 Years | 200 (80.6%) | 19 (9.5%) |
| 45 to 54 Years | 183 (92.9%) | 20 (10.9%) |
| 55 to 59 Years | 38 (71.7%) | 0 (0.0%) |
| 60 to 64 Years | 22 (40.0%) | 0 (0.0%) |
| 65 to 74 Years | 41 (41.8%) | 0 (0.0%) |
| 75 Years and over | 52 (67.5%) | 0 (0.0%) |
| Total | 689 (63.3%) | 55 (8.0%) |
Employment Status by Educational Attainment in Belcourt
According to labor force statistics for Belcourt, 76.2% of individuals (565) out of the total population between 25 and 64 years of age (741) are in the labor force, with 7.4% or 42 of them being unemployed. The group with the highest labor force participation rate are those with the educational attainment of bachelor's degree or higher, with 100.0% or 120 individuals in the labor force. Within the labor force, individuals with less than high school education have the highest percentage of unemployment, with 24.4% or 20 of them being unemployed.
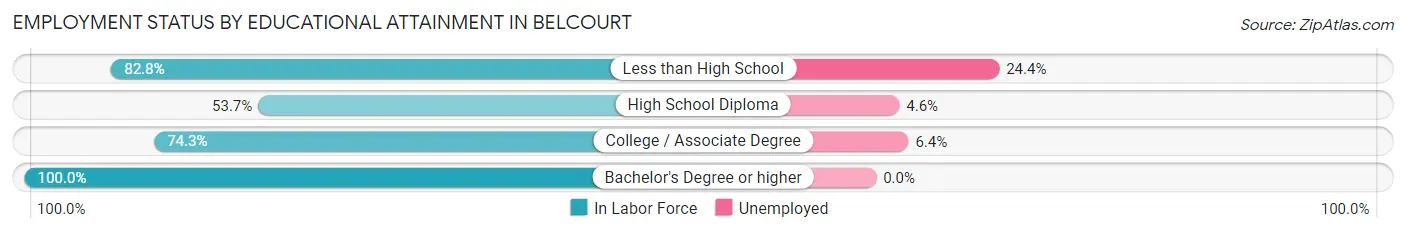
| Educational Attainment | In Labor Force | Unemployed |
| Less than High School | 82 (82.8%) | 24 (24.4%) |
| High School Diploma | 65 (53.7%) | 6 (4.6%) |
| College / Associate Degree | 298 (74.3%) | 26 (6.4%) |
| Bachelor's Degree or higher | 120 (100.0%) | 0 (0.0%) |
| Total | 565 (76.2%) | 55 (7.4%) |
Employment Occupations by Sex in Belcourt
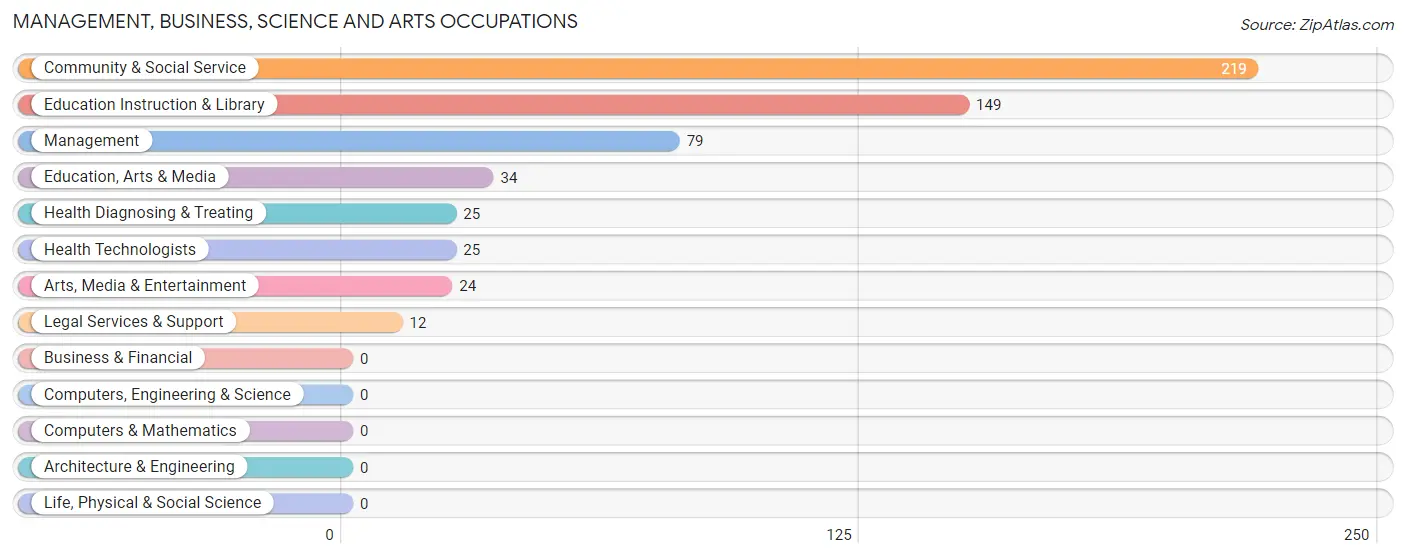
Management, Business, Science and Arts Occupations
The most common Management, Business, Science and Arts occupations in Belcourt are Community & Social Service (219 | 34.5%), Education Instruction & Library (149 | 23.5%), Management (79 | 12.5%), Education, Arts & Media (34 | 5.4%), and Health Diagnosing & Treating (25 | 3.9%).
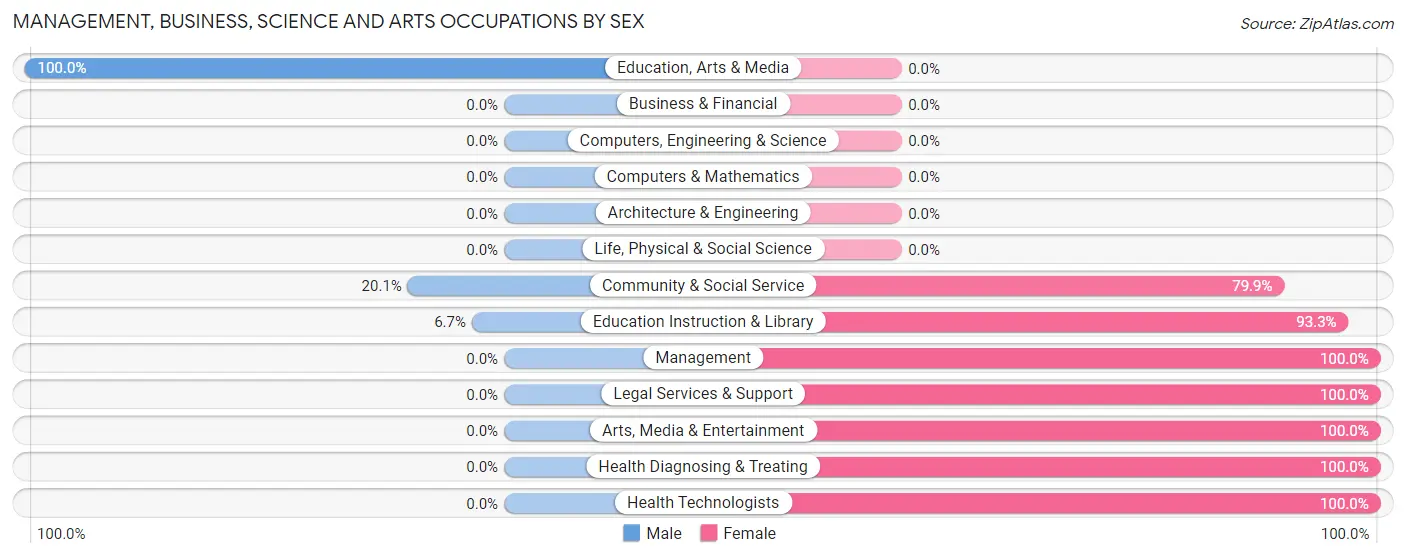
Management, Business, Science and Arts Occupations by Sex
Within the Management, Business, Science and Arts occupations in Belcourt, the most male-oriented occupations are Education, Arts & Media (100.0%), Community & Social Service (20.1%), and Education Instruction & Library (6.7%), while the most female-oriented occupations are Management (100.0%), Legal Services & Support (100.0%), and Arts, Media & Entertainment (100.0%).
| Occupation | Male | Female |
| Management | 0 (0.0%) | 79 (100.0%) |
| Business & Financial | 0 (0.0%) | 0 (0.0%) |
| Computers, Engineering & Science | 0 (0.0%) | 0 (0.0%) |
| Computers & Mathematics | 0 (0.0%) | 0 (0.0%) |
| Architecture & Engineering | 0 (0.0%) | 0 (0.0%) |
| Life, Physical & Social Science | 0 (0.0%) | 0 (0.0%) |
| Community & Social Service | 44 (20.1%) | 175 (79.9%) |
| Education, Arts & Media | 34 (100.0%) | 0 (0.0%) |
| Legal Services & Support | 0 (0.0%) | 12 (100.0%) |
| Education Instruction & Library | 10 (6.7%) | 139 (93.3%) |
| Arts, Media & Entertainment | 0 (0.0%) | 24 (100.0%) |
| Health Diagnosing & Treating | 0 (0.0%) | 25 (100.0%) |
| Health Technologists | 0 (0.0%) | 25 (100.0%) |
| Total (Category) | 44 (13.6%) | 279 (86.4%) |
| Total (Overall) | 211 (33.3%) | 423 (66.7%) |
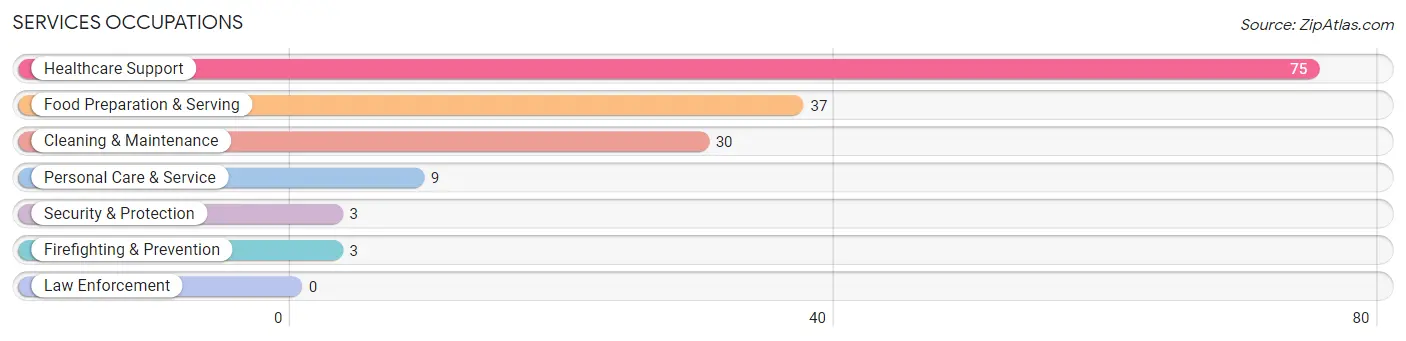
Services Occupations
The most common Services occupations in Belcourt are Healthcare Support (75 | 11.8%), Food Preparation & Serving (37 | 5.8%), Cleaning & Maintenance (30 | 4.7%), Personal Care & Service (9 | 1.4%), and Security & Protection (3 | 0.5%).
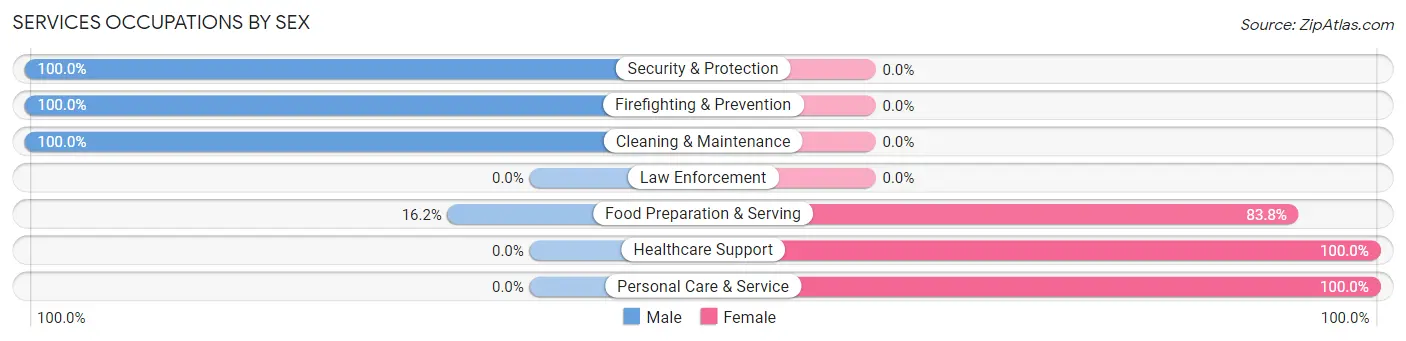
Services Occupations by Sex
Within the Services occupations in Belcourt, the most male-oriented occupations are Security & Protection (100.0%), Firefighting & Prevention (100.0%), and Cleaning & Maintenance (100.0%), while the most female-oriented occupations are Healthcare Support (100.0%), Personal Care & Service (100.0%), and Food Preparation & Serving (83.8%).
| Occupation | Male | Female |
| Healthcare Support | 0 (0.0%) | 75 (100.0%) |
| Security & Protection | 3 (100.0%) | 0 (0.0%) |
| Firefighting & Prevention | 3 (100.0%) | 0 (0.0%) |
| Law Enforcement | 0 (0.0%) | 0 (0.0%) |
| Food Preparation & Serving | 6 (16.2%) | 31 (83.8%) |
| Cleaning & Maintenance | 30 (100.0%) | 0 (0.0%) |
| Personal Care & Service | 0 (0.0%) | 9 (100.0%) |
| Total (Category) | 39 (25.3%) | 115 (74.7%) |
| Total (Overall) | 211 (33.3%) | 423 (66.7%) |
Sales and Office Occupations
The most common Sales and Office occupations in Belcourt are Sales & Related (32 | 5.1%), and Office & Administration (17 | 2.7%).
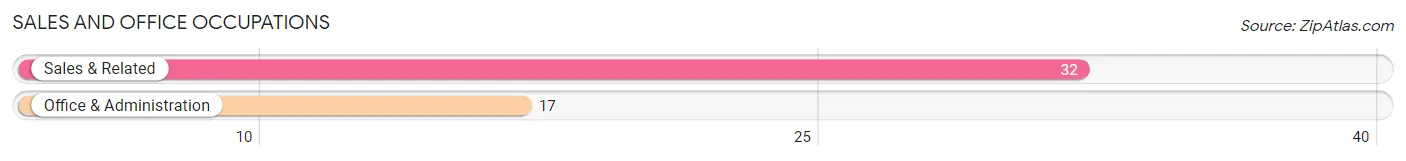
Sales and Office Occupations by Sex

| Occupation | Male | Female |
| Sales & Related | 11 (34.4%) | 21 (65.6%) |
| Office & Administration | 17 (100.0%) | 0 (0.0%) |
| Total (Category) | 28 (57.1%) | 21 (42.9%) |
| Total (Overall) | 211 (33.3%) | 423 (66.7%) |
Natural Resources, Construction and Maintenance Occupations
The most common Natural Resources, Construction and Maintenance occupations in Belcourt are Construction & Extraction (29 | 4.6%), Farming, Fishing & Forestry (19 | 3.0%), and Installation, Maintenance & Repair (12 | 1.9%).
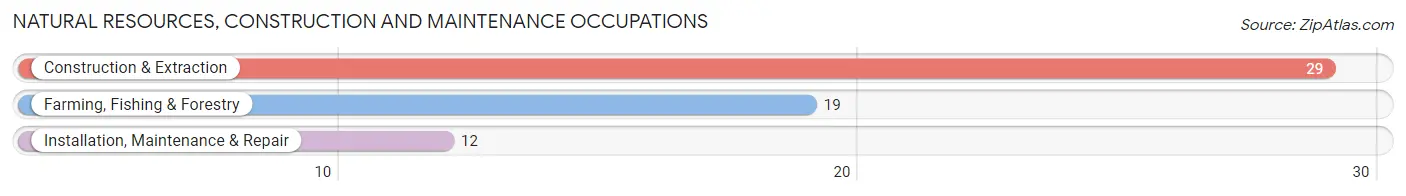
Natural Resources, Construction and Maintenance Occupations by Sex

| Occupation | Male | Female |
| Farming, Fishing & Forestry | 19 (100.0%) | 0 (0.0%) |
| Construction & Extraction | 29 (100.0%) | 0 (0.0%) |
| Installation, Maintenance & Repair | 12 (100.0%) | 0 (0.0%) |
| Total (Category) | 60 (100.0%) | 0 (0.0%) |
| Total (Overall) | 211 (33.3%) | 423 (66.7%) |
Production, Transportation and Moving Occupations
The most common Production, Transportation and Moving occupations in Belcourt are Transportation (26 | 4.1%), Material Moving (16 | 2.5%), and Production (6 | 0.9%).
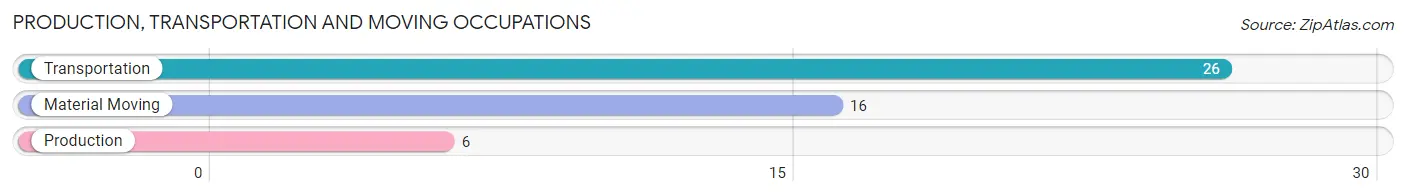
Production, Transportation and Moving Occupations by Sex
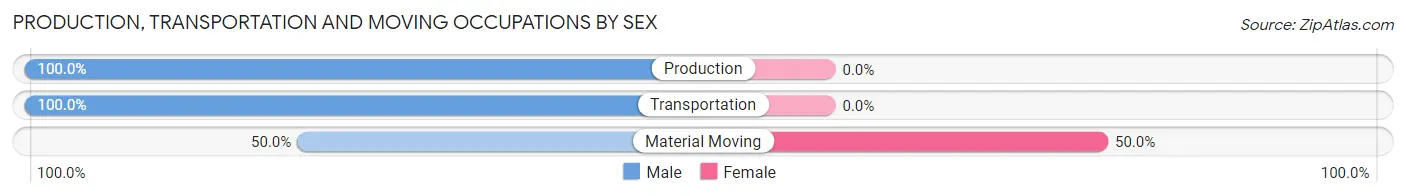
| Occupation | Male | Female |
| Production | 6 (100.0%) | 0 (0.0%) |
| Transportation | 26 (100.0%) | 0 (0.0%) |
| Material Moving | 8 (50.0%) | 8 (50.0%) |
| Total (Category) | 40 (83.3%) | 8 (16.7%) |
| Total (Overall) | 211 (33.3%) | 423 (66.7%) |
Employment Industries by Sex in Belcourt
Employment Industries in Belcourt
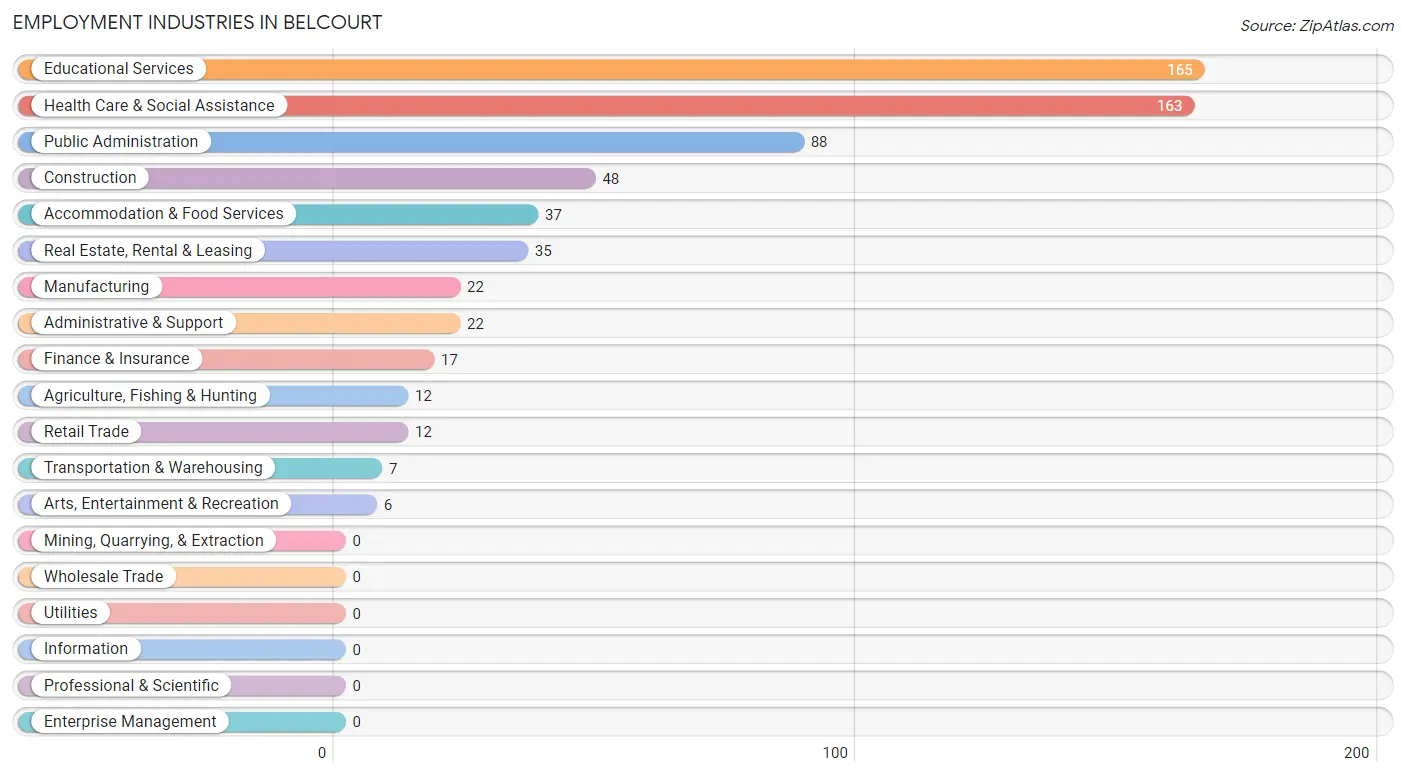
The major employment industries in Belcourt include Educational Services (165 | 26.0%), Health Care & Social Assistance (163 | 25.7%), Public Administration (88 | 13.9%), Construction (48 | 7.6%), and Accommodation & Food Services (37 | 5.8%).
Employment Industries by Sex in Belcourt
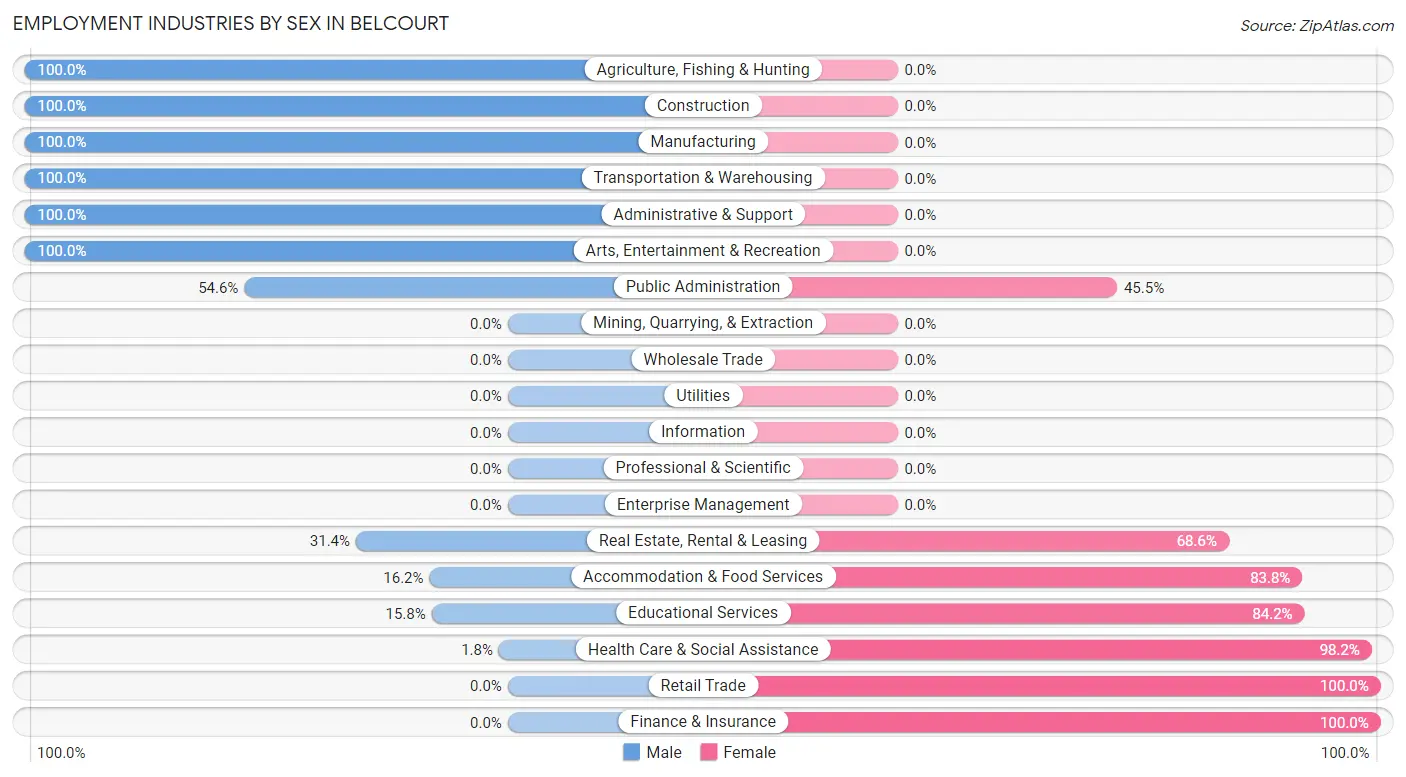
The Belcourt industries that see more men than women are Agriculture, Fishing & Hunting (100.0%), Construction (100.0%), and Manufacturing (100.0%), whereas the industries that tend to have a higher number of women are Retail Trade (100.0%), Finance & Insurance (100.0%), and Health Care & Social Assistance (98.2%).
| Industry | Male | Female |
| Agriculture, Fishing & Hunting | 12 (100.0%) | 0 (0.0%) |
| Mining, Quarrying, & Extraction | 0 (0.0%) | 0 (0.0%) |
| Construction | 48 (100.0%) | 0 (0.0%) |
| Manufacturing | 22 (100.0%) | 0 (0.0%) |
| Wholesale Trade | 0 (0.0%) | 0 (0.0%) |
| Retail Trade | 0 (0.0%) | 12 (100.0%) |
| Transportation & Warehousing | 7 (100.0%) | 0 (0.0%) |
| Utilities | 0 (0.0%) | 0 (0.0%) |
| Information | 0 (0.0%) | 0 (0.0%) |
| Finance & Insurance | 0 (0.0%) | 17 (100.0%) |
| Real Estate, Rental & Leasing | 11 (31.4%) | 24 (68.6%) |
| Professional & Scientific | 0 (0.0%) | 0 (0.0%) |
| Enterprise Management | 0 (0.0%) | 0 (0.0%) |
| Administrative & Support | 22 (100.0%) | 0 (0.0%) |
| Educational Services | 26 (15.8%) | 139 (84.2%) |
| Health Care & Social Assistance | 3 (1.8%) | 160 (98.2%) |
| Arts, Entertainment & Recreation | 6 (100.0%) | 0 (0.0%) |
| Accommodation & Food Services | 6 (16.2%) | 31 (83.8%) |
| Public Administration | 48 (54.5%) | 40 (45.5%) |
| Total | 211 (33.3%) | 423 (66.7%) |
Education in Belcourt
School Enrollment in Belcourt
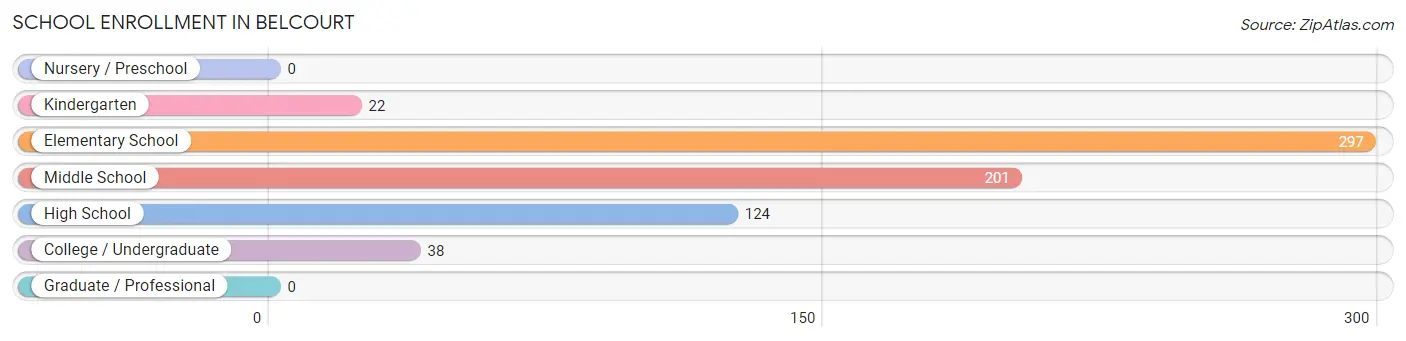
The most common levels of schooling among the 682 students in Belcourt are elementary school (297 | 43.5%), middle school (201 | 29.5%), and high school (124 | 18.2%).
| School Level | # Students | % Students |
| Nursery / Preschool | 0 | 0.0% |
| Kindergarten | 22 | 3.2% |
| Elementary School | 297 | 43.5% |
| Middle School | 201 | 29.5% |
| High School | 124 | 18.2% |
| College / Undergraduate | 38 | 5.6% |
| Graduate / Professional | 0 | 0.0% |
| Total | 682 | 100.0% |
School Enrollment by Age by Funding Source in Belcourt
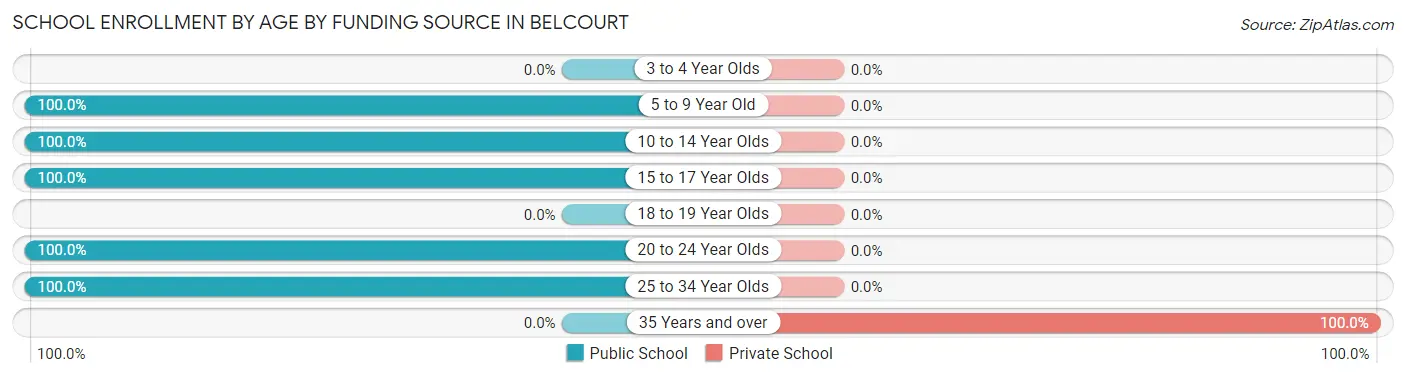
Out of a total of 682 students who are enrolled in schools in Belcourt, 10 (1.5%) attend a private institution, while the remaining 672 (98.5%) are enrolled in public schools. The age group of 35 years and over has the highest likelihood of being enrolled in private schools, with 10 (100.0% in the age bracket) enrolled. Conversely, the age group of 5 to 9 year old has the lowest likelihood of being enrolled in a private school, with 289 (100.0% in the age bracket) attending a public institution.
| Age Bracket | Public School | Private School |
| 3 to 4 Year Olds | 0 (0.0%) | 0 (0.0%) |
| 5 to 9 Year Old | 289 (100.0%) | 0 (0.0%) |
| 10 to 14 Year Olds | 245 (100.0%) | 0 (0.0%) |
| 15 to 17 Year Olds | 93 (100.0%) | 0 (0.0%) |
| 18 to 19 Year Olds | 0 (0.0%) | 0 (0.0%) |
| 20 to 24 Year Olds | 32 (100.0%) | 0 (0.0%) |
| 25 to 34 Year Olds | 13 (100.0%) | 0 (0.0%) |
| 35 Years and over | 0 (0.0%) | 10 (100.0%) |
| Total | 672 (98.5%) | 10 (1.5%) |
Educational Attainment by Field of Study in Belcourt
Education (87 | 42.0%), business (83 | 40.1%), science & technology (25 | 12.1%), and arts & humanities (12 | 5.8%) are the most common fields of study among 207 individuals in Belcourt who have obtained a bachelor's degree or higher.
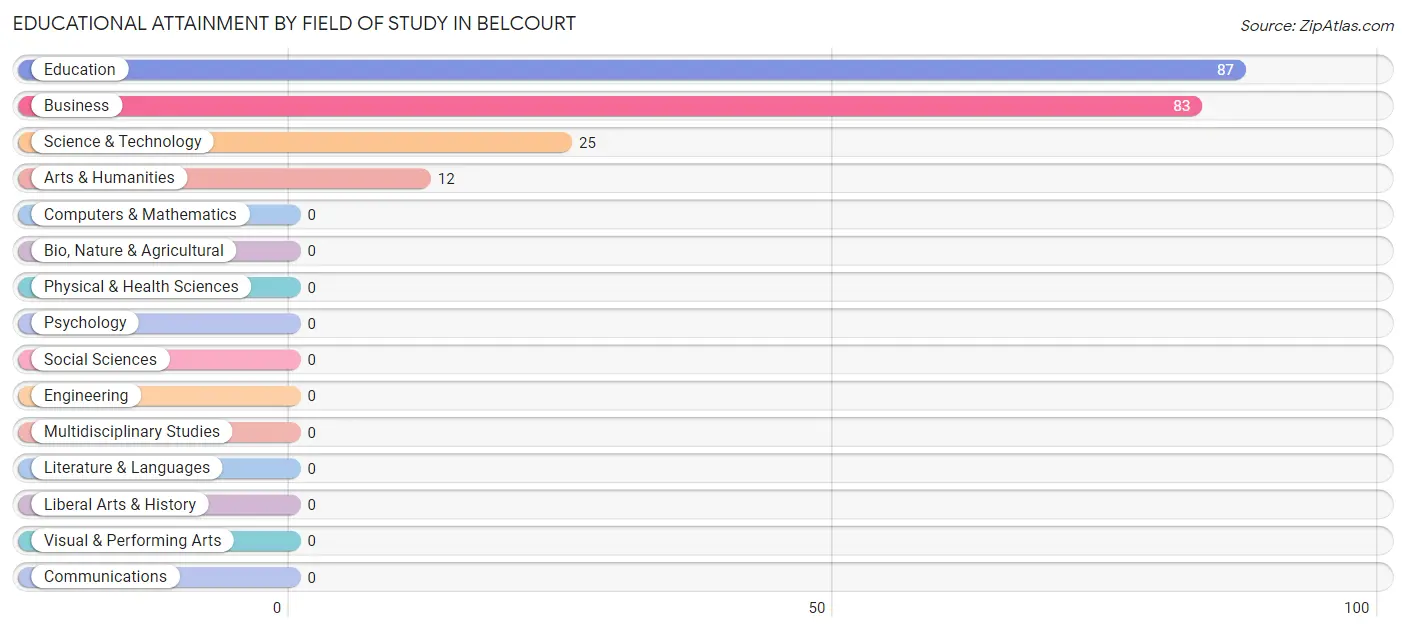
| Field of Study | # Graduates | % Graduates |
| Computers & Mathematics | 0 | 0.0% |
| Bio, Nature & Agricultural | 0 | 0.0% |
| Physical & Health Sciences | 0 | 0.0% |
| Psychology | 0 | 0.0% |
| Social Sciences | 0 | 0.0% |
| Engineering | 0 | 0.0% |
| Multidisciplinary Studies | 0 | 0.0% |
| Science & Technology | 25 | 12.1% |
| Business | 83 | 40.1% |
| Education | 87 | 42.0% |
| Literature & Languages | 0 | 0.0% |
| Liberal Arts & History | 0 | 0.0% |
| Visual & Performing Arts | 0 | 0.0% |
| Communications | 0 | 0.0% |
| Arts & Humanities | 12 | 5.8% |
| Total | 207 | 100.0% |
Transportation & Commute in Belcourt
Vehicle Availability by Sex in Belcourt
The most prevalent vehicle ownership categories in Belcourt are males with 5 or more vehicles (53, accounting for 28.6%) and females with 5 or more vehicles (67, making up 12.7%).
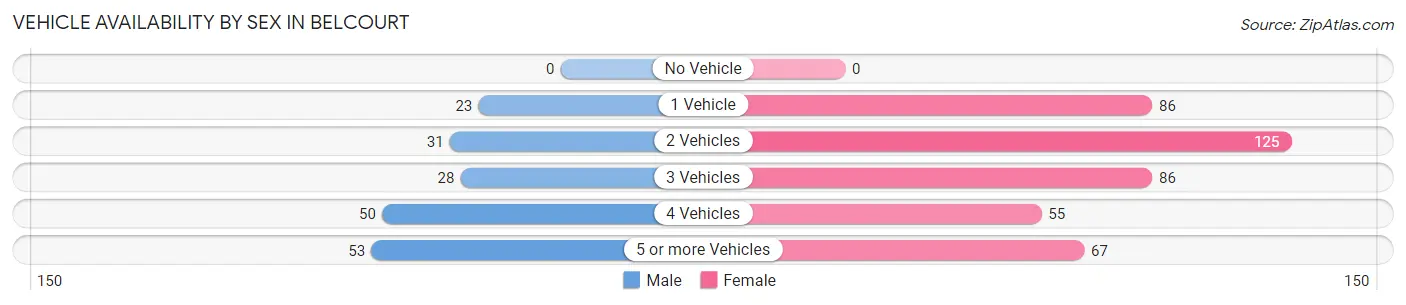
| Vehicles Available | Male | Female |
| No Vehicle | 0 (0.0%) | 0 (0.0%) |
| 1 Vehicle | 23 (12.4%) | 86 (20.5%) |
| 2 Vehicles | 31 (16.8%) | 125 (29.8%) |
| 3 Vehicles | 28 (15.1%) | 86 (20.5%) |
| 4 Vehicles | 50 (27.0%) | 55 (13.1%) |
| 5 or more Vehicles | 53 (28.6%) | 67 (16.0%) |
| Total | 185 (100.0%) | 419 (100.0%) |
Commute Time in Belcourt
The most frequently occuring commute durations in Belcourt are 5 to 9 minutes (185 commuters, 29.9%), 10 to 14 minutes (151 commuters, 24.4%), and less than 5 minutes (101 commuters, 16.3%).
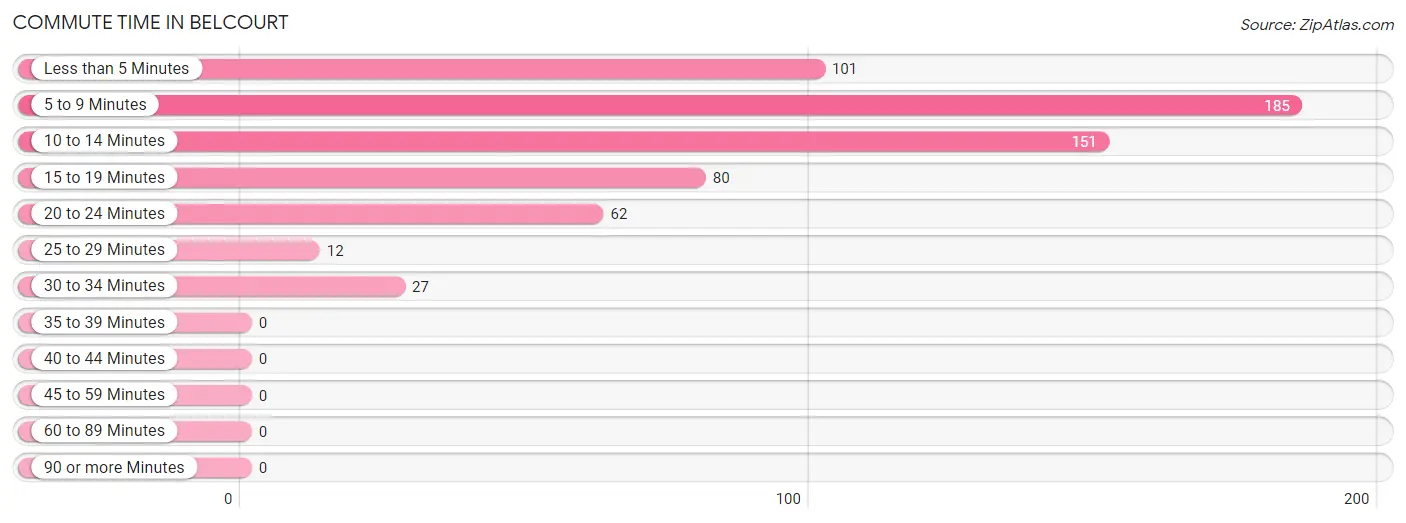
| Commute Time | # Commuters | % Commuters |
| Less than 5 Minutes | 101 | 16.3% |
| 5 to 9 Minutes | 185 | 29.9% |
| 10 to 14 Minutes | 151 | 24.4% |
| 15 to 19 Minutes | 80 | 12.9% |
| 20 to 24 Minutes | 62 | 10.0% |
| 25 to 29 Minutes | 12 | 1.9% |
| 30 to 34 Minutes | 27 | 4.4% |
| 35 to 39 Minutes | 0 | 0.0% |
| 40 to 44 Minutes | 0 | 0.0% |
| 45 to 59 Minutes | 0 | 0.0% |
| 60 to 89 Minutes | 0 | 0.0% |
| 90 or more Minutes | 0 | 0.0% |
Commute Time by Sex in Belcourt
The most common commute times in Belcourt are 10 to 14 minutes (70 commuters, 35.2%) for males and 5 to 9 minutes (155 commuters, 37.0%) for females.
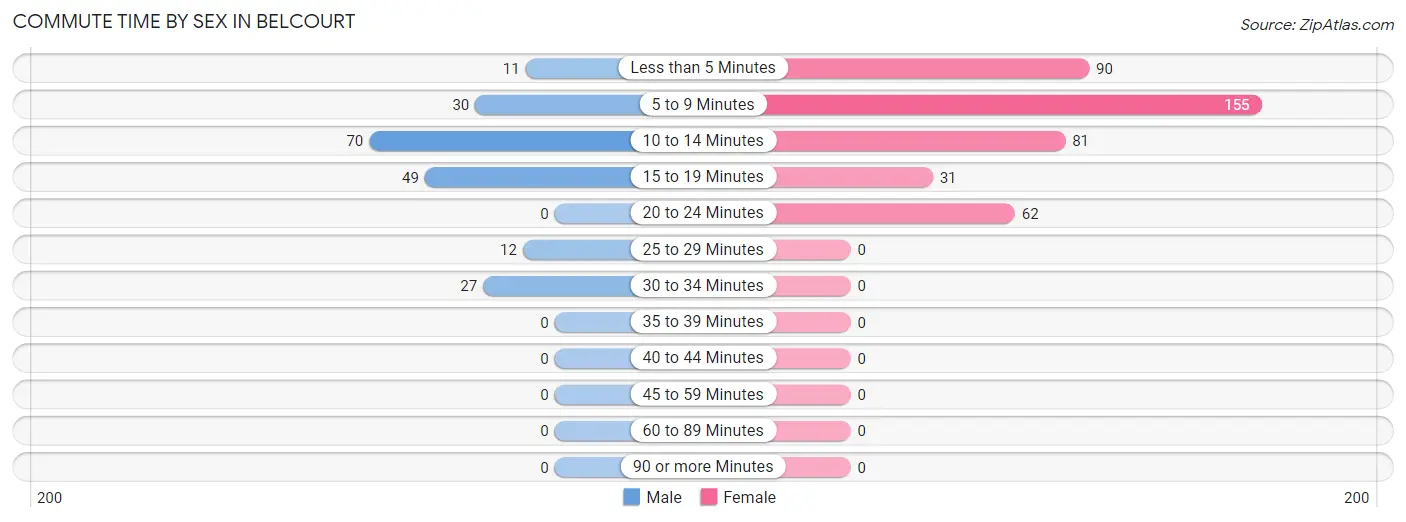
| Commute Time | Male | Female |
| Less than 5 Minutes | 11 (5.5%) | 90 (21.5%) |
| 5 to 9 Minutes | 30 (15.1%) | 155 (37.0%) |
| 10 to 14 Minutes | 70 (35.2%) | 81 (19.3%) |
| 15 to 19 Minutes | 49 (24.6%) | 31 (7.4%) |
| 20 to 24 Minutes | 0 (0.0%) | 62 (14.8%) |
| 25 to 29 Minutes | 12 (6.0%) | 0 (0.0%) |
| 30 to 34 Minutes | 27 (13.6%) | 0 (0.0%) |
| 35 to 39 Minutes | 0 (0.0%) | 0 (0.0%) |
| 40 to 44 Minutes | 0 (0.0%) | 0 (0.0%) |
| 45 to 59 Minutes | 0 (0.0%) | 0 (0.0%) |
| 60 to 89 Minutes | 0 (0.0%) | 0 (0.0%) |
| 90 or more Minutes | 0 (0.0%) | 0 (0.0%) |
Time of Departure to Work by Sex in Belcourt
The most frequent times of departure to work in Belcourt are 8:00 AM to 8:29 AM (46, 23.1%) for males and 7:30 AM to 7:59 AM (216, 51.5%) for females.
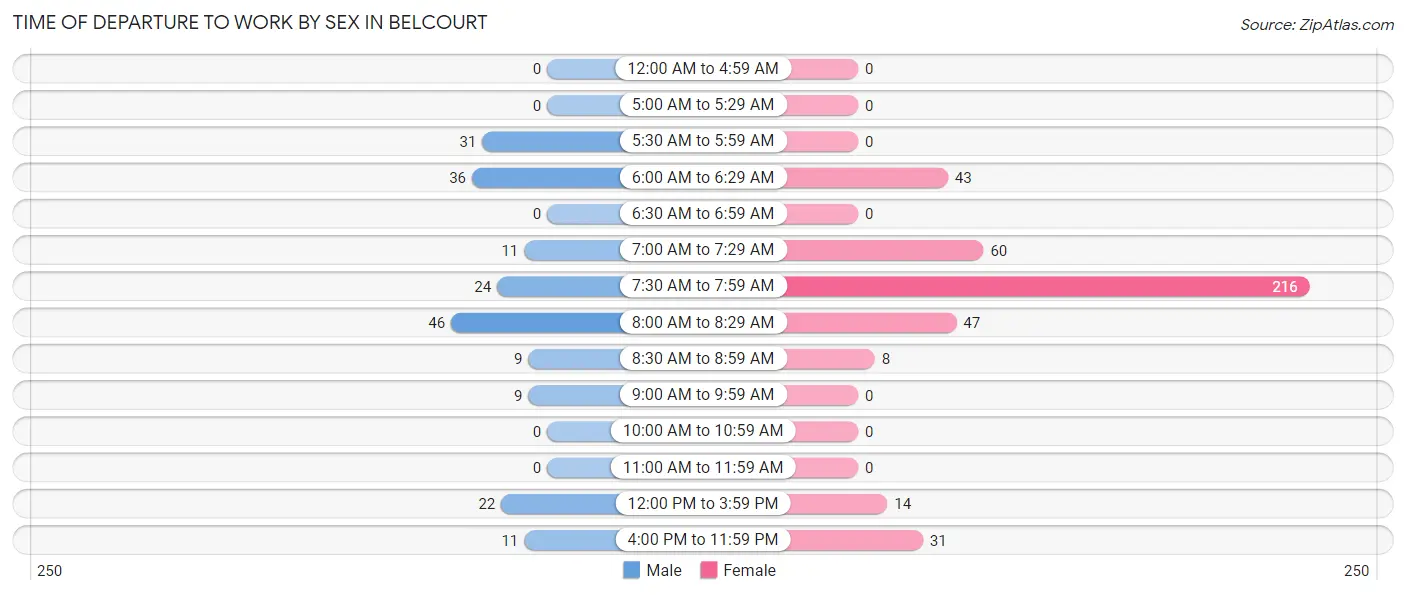
| Time of Departure | Male | Female |
| 12:00 AM to 4:59 AM | 0 (0.0%) | 0 (0.0%) |
| 5:00 AM to 5:29 AM | 0 (0.0%) | 0 (0.0%) |
| 5:30 AM to 5:59 AM | 31 (15.6%) | 0 (0.0%) |
| 6:00 AM to 6:29 AM | 36 (18.1%) | 43 (10.3%) |
| 6:30 AM to 6:59 AM | 0 (0.0%) | 0 (0.0%) |
| 7:00 AM to 7:29 AM | 11 (5.5%) | 60 (14.3%) |
| 7:30 AM to 7:59 AM | 24 (12.1%) | 216 (51.5%) |
| 8:00 AM to 8:29 AM | 46 (23.1%) | 47 (11.2%) |
| 8:30 AM to 8:59 AM | 9 (4.5%) | 8 (1.9%) |
| 9:00 AM to 9:59 AM | 9 (4.5%) | 0 (0.0%) |
| 10:00 AM to 10:59 AM | 0 (0.0%) | 0 (0.0%) |
| 11:00 AM to 11:59 AM | 0 (0.0%) | 0 (0.0%) |
| 12:00 PM to 3:59 PM | 22 (11.1%) | 14 (3.3%) |
| 4:00 PM to 11:59 PM | 11 (5.5%) | 31 (7.4%) |
| Total | 199 (100.0%) | 419 (100.0%) |
Housing Occupancy in Belcourt
Occupancy by Ownership in Belcourt
Of the total 503 dwellings in Belcourt, owner-occupied units account for 218 (43.3%), while renter-occupied units make up 285 (56.7%).
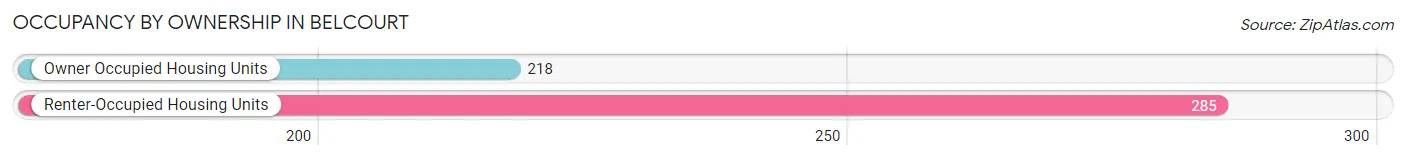
| Occupancy | # Housing Units | % Housing Units |
| Owner Occupied Housing Units | 218 | 43.3% |
| Renter-Occupied Housing Units | 285 | 56.7% |
| Total Occupied Housing Units | 503 | 100.0% |
Occupancy by Household Size in Belcourt
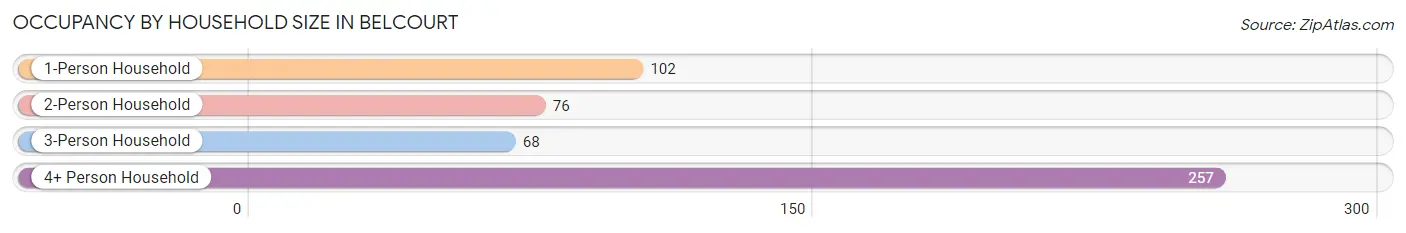
| Household Size | # Housing Units | % Housing Units |
| 1-Person Household | 102 | 20.3% |
| 2-Person Household | 76 | 15.1% |
| 3-Person Household | 68 | 13.5% |
| 4+ Person Household | 257 | 51.1% |
| Total Housing Units | 503 | 100.0% |
Occupancy by Ownership by Household Size in Belcourt
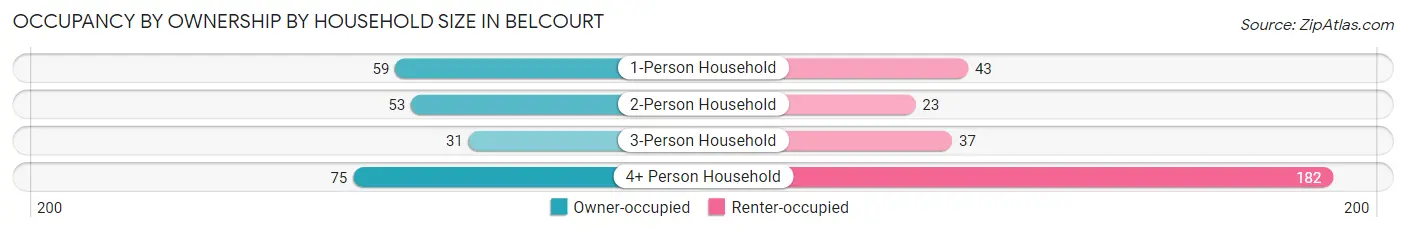
| Household Size | Owner-occupied | Renter-occupied |
| 1-Person Household | 59 (57.8%) | 43 (42.2%) |
| 2-Person Household | 53 (69.7%) | 23 (30.3%) |
| 3-Person Household | 31 (45.6%) | 37 (54.4%) |
| 4+ Person Household | 75 (29.2%) | 182 (70.8%) |
| Total Housing Units | 218 (43.3%) | 285 (56.7%) |
Occupancy by Educational Attainment in Belcourt
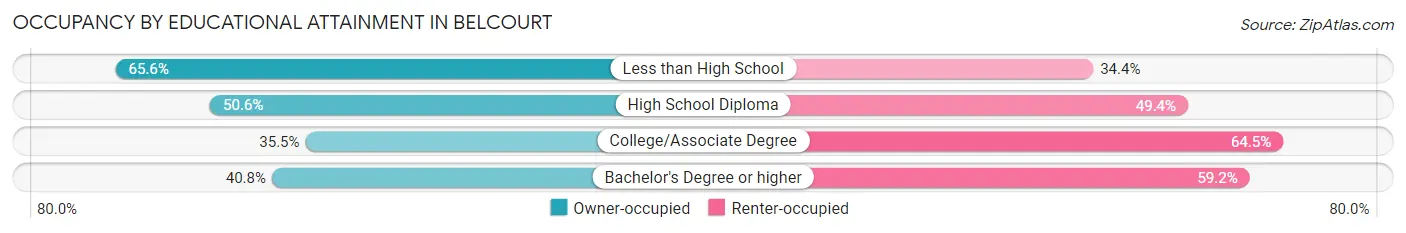
| Household Size | Owner-occupied | Renter-occupied |
| Less than High School | 40 (65.6%) | 21 (34.4%) |
| High School Diploma | 44 (50.6%) | 43 (49.4%) |
| College/Associate Degree | 72 (35.5%) | 131 (64.5%) |
| Bachelor's Degree or higher | 62 (40.8%) | 90 (59.2%) |
Occupancy by Age of Householder in Belcourt
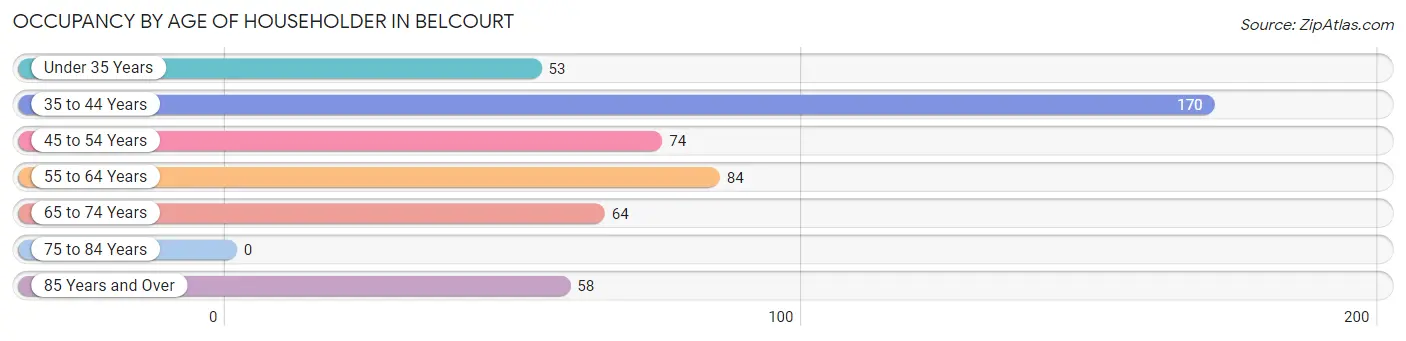
| Age Bracket | # Households | % Households |
| Under 35 Years | 53 | 10.5% |
| 35 to 44 Years | 170 | 33.8% |
| 45 to 54 Years | 74 | 14.7% |
| 55 to 64 Years | 84 | 16.7% |
| 65 to 74 Years | 64 | 12.7% |
| 75 to 84 Years | 0 | 0.0% |
| 85 Years and Over | 58 | 11.5% |
| Total | 503 | 100.0% |
Housing Finances in Belcourt
Median Income by Occupancy in Belcourt
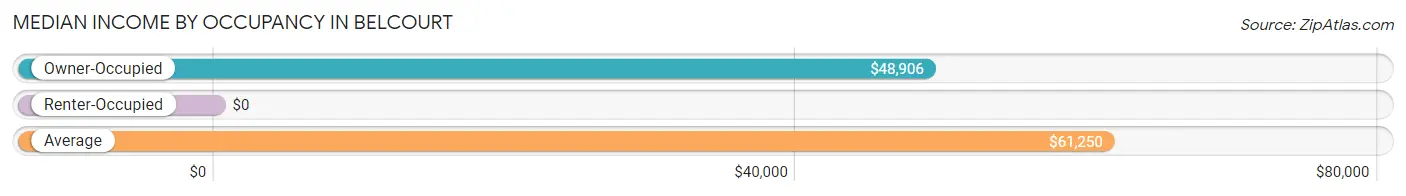
| Occupancy Type | # Households | Median Income |
| Owner-Occupied | 218 (43.3%) | $48,906 |
| Renter-Occupied | 285 (56.7%) | $0 |
| Average | 503 (100.0%) | $61,250 |
Occupancy by Householder Income Bracket in Belcourt
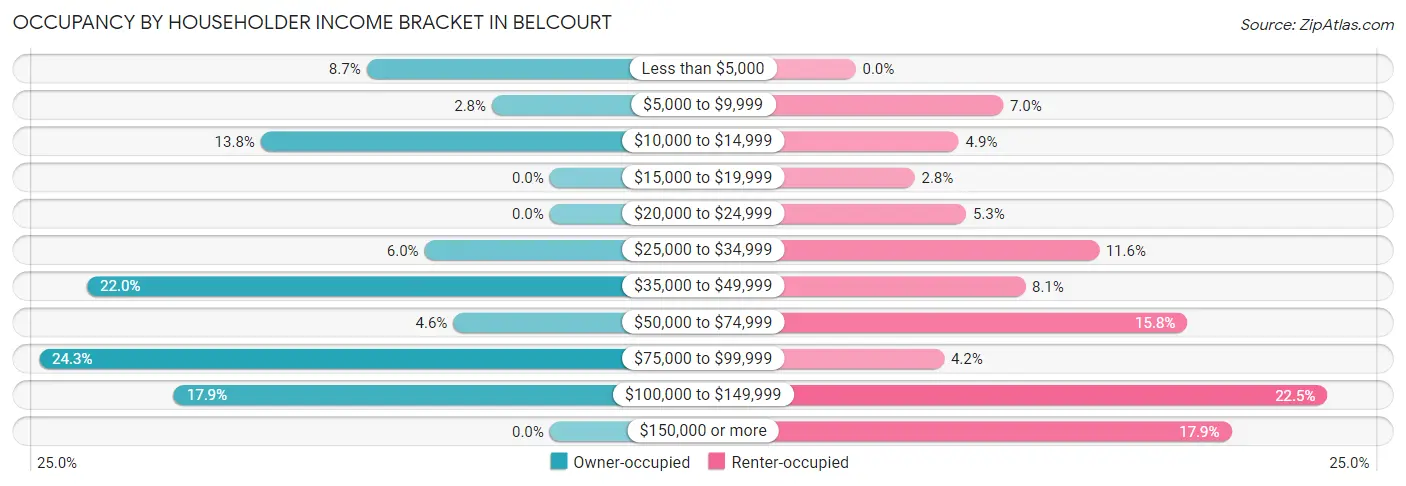
| Income Bracket | Owner-occupied | Renter-occupied |
| Less than $5,000 | 19 (8.7%) | 0 (0.0%) |
| $5,000 to $9,999 | 6 (2.8%) | 20 (7.0%) |
| $10,000 to $14,999 | 30 (13.8%) | 14 (4.9%) |
| $15,000 to $19,999 | 0 (0.0%) | 8 (2.8%) |
| $20,000 to $24,999 | 0 (0.0%) | 15 (5.3%) |
| $25,000 to $34,999 | 13 (6.0%) | 33 (11.6%) |
| $35,000 to $49,999 | 48 (22.0%) | 23 (8.1%) |
| $50,000 to $74,999 | 10 (4.6%) | 45 (15.8%) |
| $75,000 to $99,999 | 53 (24.3%) | 12 (4.2%) |
| $100,000 to $149,999 | 39 (17.9%) | 64 (22.5%) |
| $150,000 or more | 0 (0.0%) | 51 (17.9%) |
| Total | 218 (100.0%) | 285 (100.0%) |
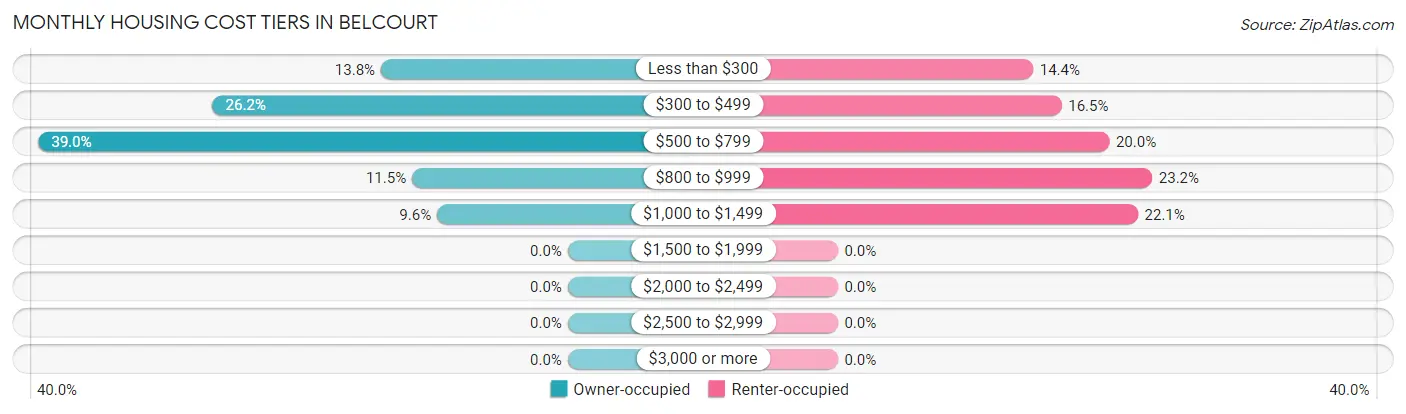
Monthly Housing Cost Tiers in Belcourt
| Monthly Cost | Owner-occupied | Renter-occupied |
| Less than $300 | 30 (13.8%) | 41 (14.4%) |
| $300 to $499 | 57 (26.2%) | 47 (16.5%) |
| $500 to $799 | 85 (39.0%) | 57 (20.0%) |
| $800 to $999 | 25 (11.5%) | 66 (23.2%) |
| $1,000 to $1,499 | 21 (9.6%) | 63 (22.1%) |
| $1,500 to $1,999 | 0 (0.0%) | 0 (0.0%) |
| $2,000 to $2,499 | 0 (0.0%) | 0 (0.0%) |
| $2,500 to $2,999 | 0 (0.0%) | 0 (0.0%) |
| $3,000 or more | 0 (0.0%) | 0 (0.0%) |
| Total | 218 (100.0%) | 285 (100.0%) |
Physical Housing Characteristics in Belcourt
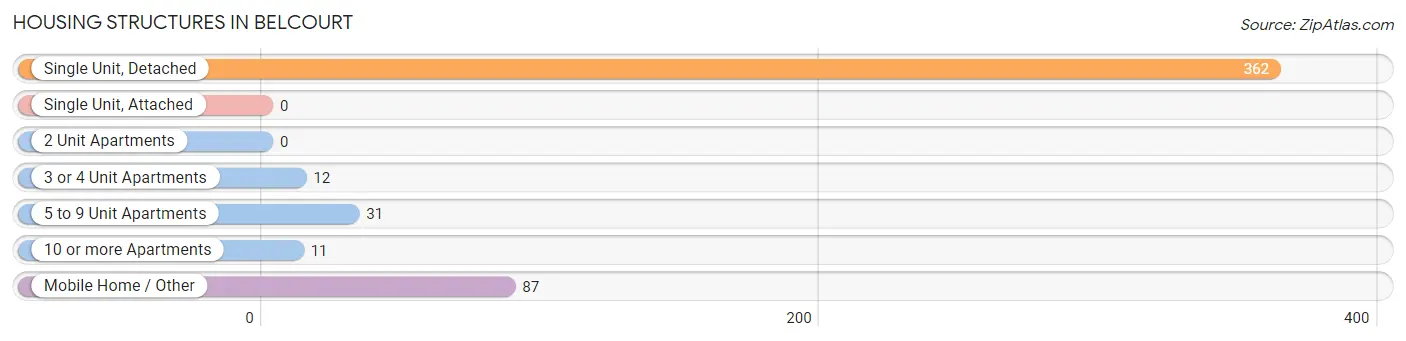
Housing Structures in Belcourt
| Structure Type | # Housing Units | % Housing Units |
| Single Unit, Detached | 362 | 72.0% |
| Single Unit, Attached | 0 | 0.0% |
| 2 Unit Apartments | 0 | 0.0% |
| 3 or 4 Unit Apartments | 12 | 2.4% |
| 5 to 9 Unit Apartments | 31 | 6.2% |
| 10 or more Apartments | 11 | 2.2% |
| Mobile Home / Other | 87 | 17.3% |
| Total | 503 | 100.0% |
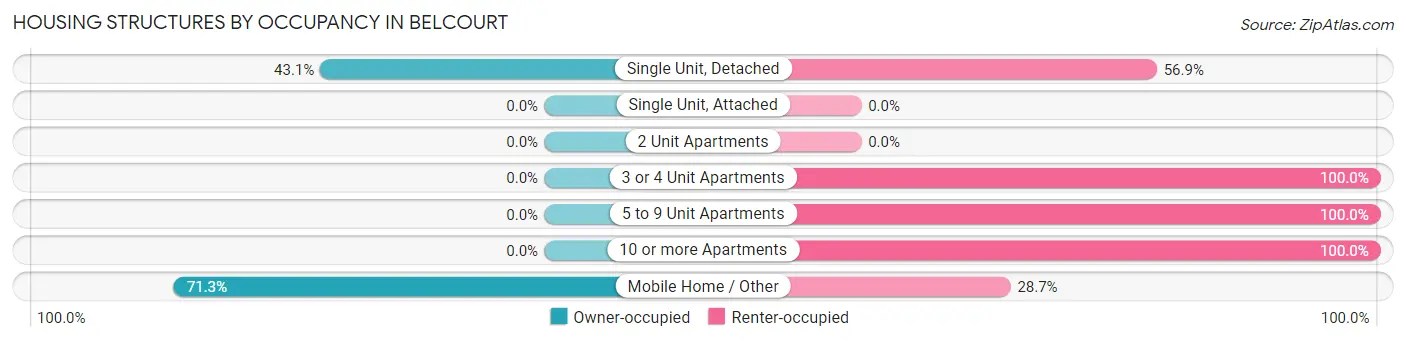
Housing Structures by Occupancy in Belcourt
| Structure Type | Owner-occupied | Renter-occupied |
| Single Unit, Detached | 156 (43.1%) | 206 (56.9%) |
| Single Unit, Attached | 0 (0.0%) | 0 (0.0%) |
| 2 Unit Apartments | 0 (0.0%) | 0 (0.0%) |
| 3 or 4 Unit Apartments | 0 (0.0%) | 12 (100.0%) |
| 5 to 9 Unit Apartments | 0 (0.0%) | 31 (100.0%) |
| 10 or more Apartments | 0 (0.0%) | 11 (100.0%) |
| Mobile Home / Other | 62 (71.3%) | 25 (28.7%) |
| Total | 218 (43.3%) | 285 (56.7%) |
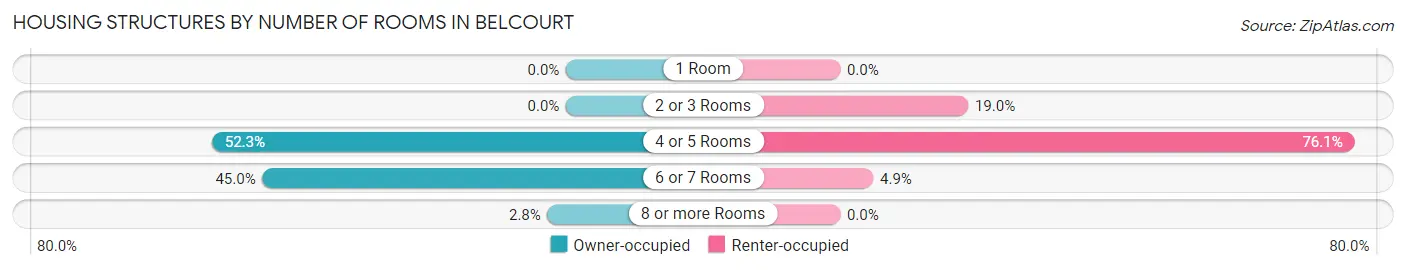
Housing Structures by Number of Rooms in Belcourt
| Number of Rooms | Owner-occupied | Renter-occupied |
| 1 Room | 0 (0.0%) | 0 (0.0%) |
| 2 or 3 Rooms | 0 (0.0%) | 54 (19.0%) |
| 4 or 5 Rooms | 114 (52.3%) | 217 (76.1%) |
| 6 or 7 Rooms | 98 (45.0%) | 14 (4.9%) |
| 8 or more Rooms | 6 (2.8%) | 0 (0.0%) |
| Total | 218 (100.0%) | 285 (100.0%) |
Housing Structure by Heating Type in Belcourt
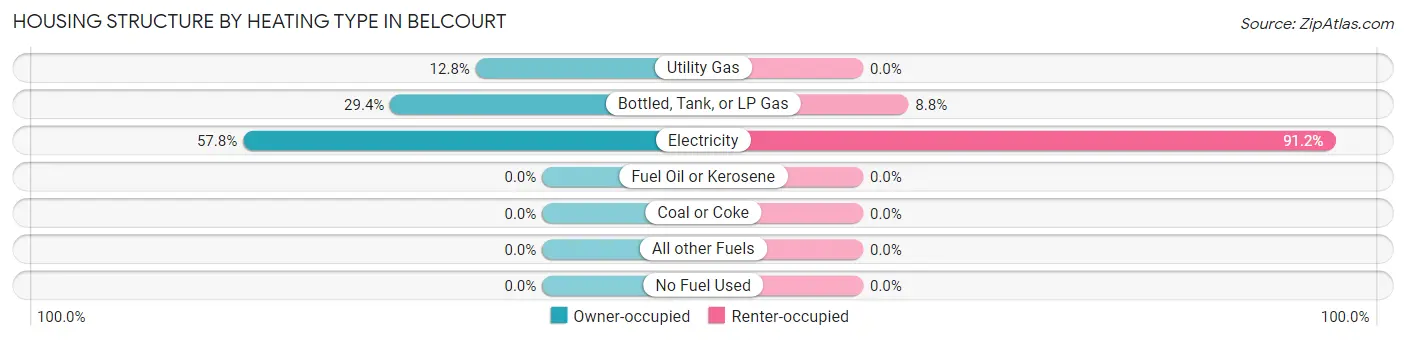
| Heating Type | Owner-occupied | Renter-occupied |
| Utility Gas | 28 (12.8%) | 0 (0.0%) |
| Bottled, Tank, or LP Gas | 64 (29.4%) | 25 (8.8%) |
| Electricity | 126 (57.8%) | 260 (91.2%) |
| Fuel Oil or Kerosene | 0 (0.0%) | 0 (0.0%) |
| Coal or Coke | 0 (0.0%) | 0 (0.0%) |
| All other Fuels | 0 (0.0%) | 0 (0.0%) |
| No Fuel Used | 0 (0.0%) | 0 (0.0%) |
| Total | 218 (100.0%) | 285 (100.0%) |
Household Vehicle Usage in Belcourt
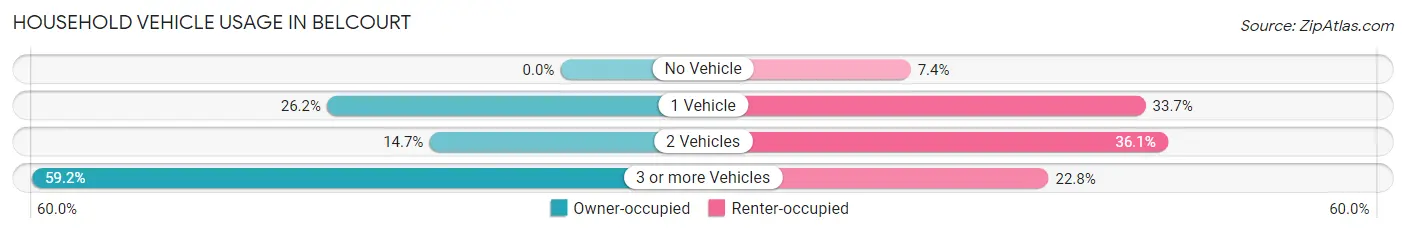
| Vehicles per Household | Owner-occupied | Renter-occupied |
| No Vehicle | 0 (0.0%) | 21 (7.4%) |
| 1 Vehicle | 57 (26.2%) | 96 (33.7%) |
| 2 Vehicles | 32 (14.7%) | 103 (36.1%) |
| 3 or more Vehicles | 129 (59.2%) | 65 (22.8%) |
| Total | 218 (100.0%) | 285 (100.0%) |
Real Estate & Mortgages in Belcourt
Real Estate and Mortgage Overview in Belcourt
| Characteristic | Without Mortgage | With Mortgage |
| Housing Units | 196 | 22 |
| Median Property Value | $94,500 | $0 |
| Median Household Income | $44,643 | $0 |
| Monthly Housing Costs | $517 | $0 |
| Real Estate Taxes | - | - |
Property Value by Mortgage Status in Belcourt
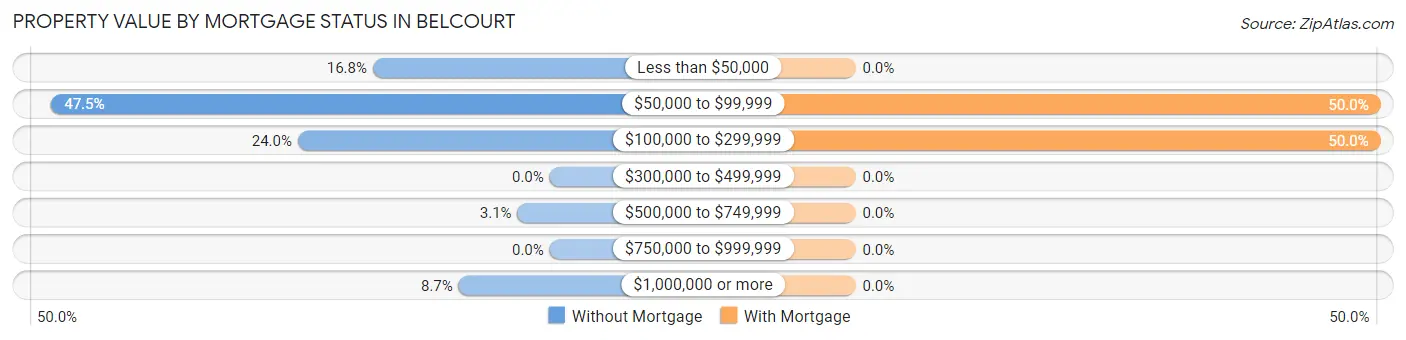
| Property Value | Without Mortgage | With Mortgage |
| Less than $50,000 | 33 (16.8%) | 0 (0.0%) |
| $50,000 to $99,999 | 93 (47.4%) | 11 (50.0%) |
| $100,000 to $299,999 | 47 (24.0%) | 11 (50.0%) |
| $300,000 to $499,999 | 0 (0.0%) | 0 (0.0%) |
| $500,000 to $749,999 | 6 (3.1%) | 0 (0.0%) |
| $750,000 to $999,999 | 0 (0.0%) | 0 (0.0%) |
| $1,000,000 or more | 17 (8.7%) | 0 (0.0%) |
| Total | 196 (100.0%) | 22 (100.0%) |
Household Income by Mortgage Status in Belcourt
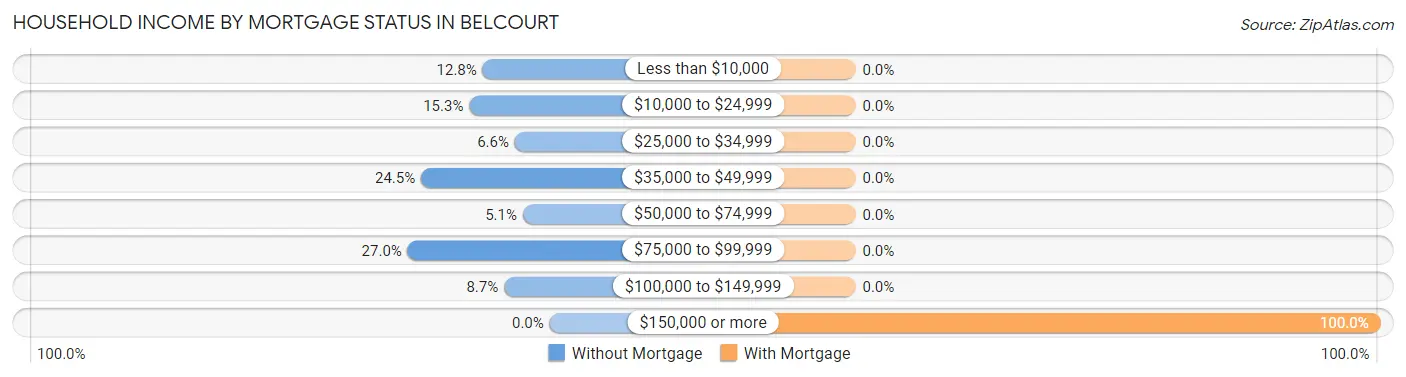
| Household Income | Without Mortgage | With Mortgage |
| Less than $10,000 | 25 (12.8%) | 0 (0.0%) |
| $10,000 to $24,999 | 30 (15.3%) | 0 (0.0%) |
| $25,000 to $34,999 | 13 (6.6%) | 0 (0.0%) |
| $35,000 to $49,999 | 48 (24.5%) | 0 (0.0%) |
| $50,000 to $74,999 | 10 (5.1%) | 0 (0.0%) |
| $75,000 to $99,999 | 53 (27.0%) | 0 (0.0%) |
| $100,000 to $149,999 | 17 (8.7%) | 0 (0.0%) |
| $150,000 or more | 0 (0.0%) | 22 (100.0%) |
| Total | 196 (100.0%) | 22 (100.0%) |
Property Value to Household Income Ratio in Belcourt
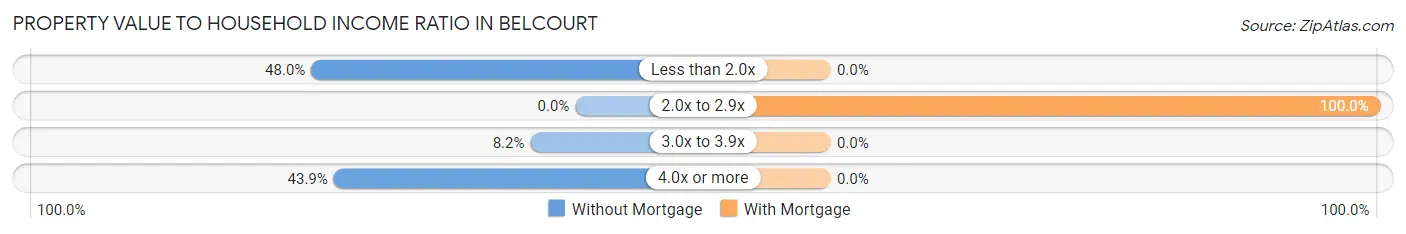
| Value-to-Income Ratio | Without Mortgage | With Mortgage |
| Less than 2.0x | 94 (48.0%) | 0 (0.0%) |
| 2.0x to 2.9x | 0 (0.0%) | 22 (100.0%) |
| 3.0x to 3.9x | 16 (8.2%) | 0 (0.0%) |
| 4.0x or more | 86 (43.9%) | 0 (0.0%) |
| Total | 196 (100.0%) | 22 (100.0%) |
Real Estate Taxes by Mortgage Status in Belcourt
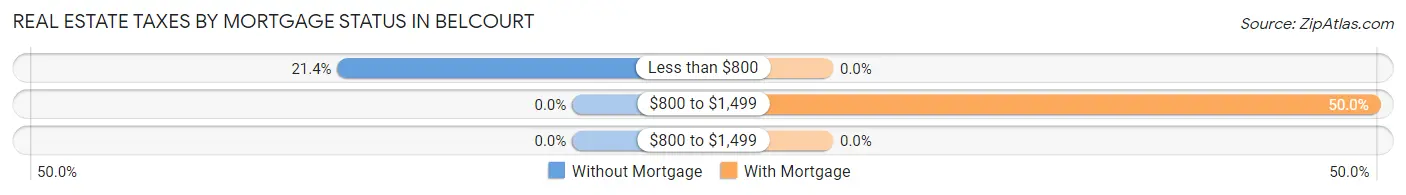
| Property Taxes | Without Mortgage | With Mortgage |
| Less than $800 | 42 (21.4%) | 0 (0.0%) |
| $800 to $1,499 | 0 (0.0%) | 11 (50.0%) |
| $800 to $1,499 | 0 (0.0%) | 0 (0.0%) |
| Total | 196 (100.0%) | 22 (100.0%) |
Health & Disability in Belcourt
Health Insurance Coverage by Age in Belcourt
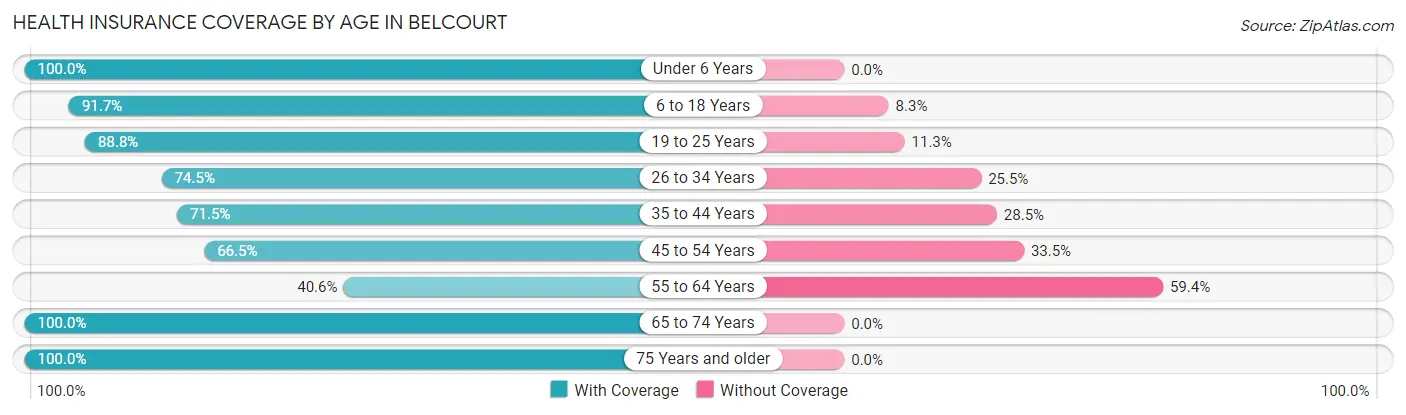
| Age Bracket | With Coverage | Without Coverage |
| Under 6 Years | 149 (100.0%) | 0 (0.0%) |
| 6 to 18 Years | 566 (91.7%) | 51 (8.3%) |
| 19 to 25 Years | 71 (88.7%) | 9 (11.3%) |
| 26 to 34 Years | 140 (74.5%) | 48 (25.5%) |
| 35 to 44 Years | 176 (71.5%) | 70 (28.5%) |
| 45 to 54 Years | 131 (66.5%) | 66 (33.5%) |
| 55 to 64 Years | 43 (40.6%) | 63 (59.4%) |
| 65 to 74 Years | 98 (100.0%) | 0 (0.0%) |
| 75 Years and older | 58 (100.0%) | 0 (0.0%) |
| Total | 1,432 (82.4%) | 307 (17.6%) |
Health Insurance Coverage by Citizenship Status in Belcourt
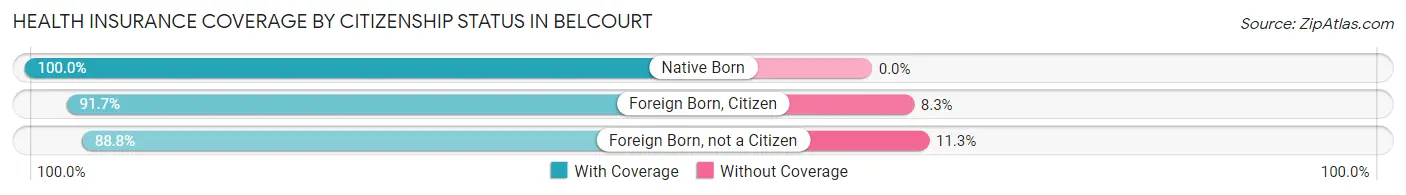
| Citizenship Status | With Coverage | Without Coverage |
| Native Born | 149 (100.0%) | 0 (0.0%) |
| Foreign Born, Citizen | 566 (91.7%) | 51 (8.3%) |
| Foreign Born, not a Citizen | 71 (88.7%) | 9 (11.3%) |
Health Insurance Coverage by Household Income in Belcourt
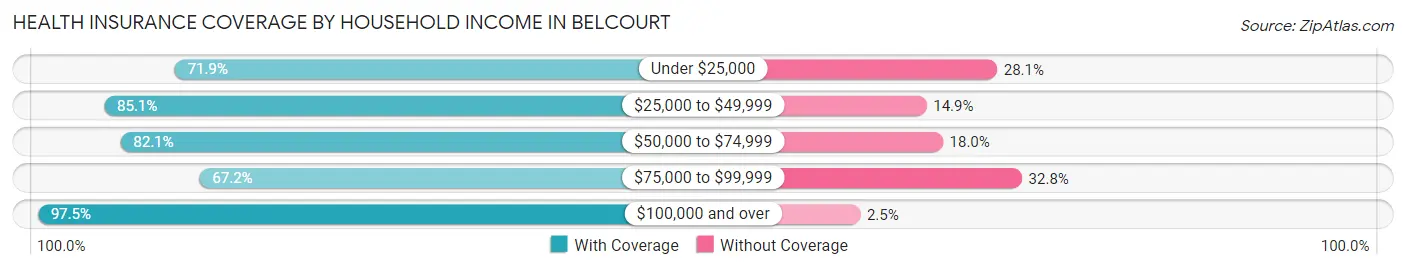
| Household Income | With Coverage | Without Coverage |
| Under $25,000 | 174 (71.9%) | 68 (28.1%) |
| $25,000 to $49,999 | 377 (85.1%) | 66 (14.9%) |
| $50,000 to $74,999 | 160 (82.1%) | 35 (17.9%) |
| $75,000 to $99,999 | 195 (67.2%) | 95 (32.8%) |
| $100,000 and over | 516 (97.5%) | 13 (2.5%) |
Public vs Private Health Insurance Coverage by Age in Belcourt
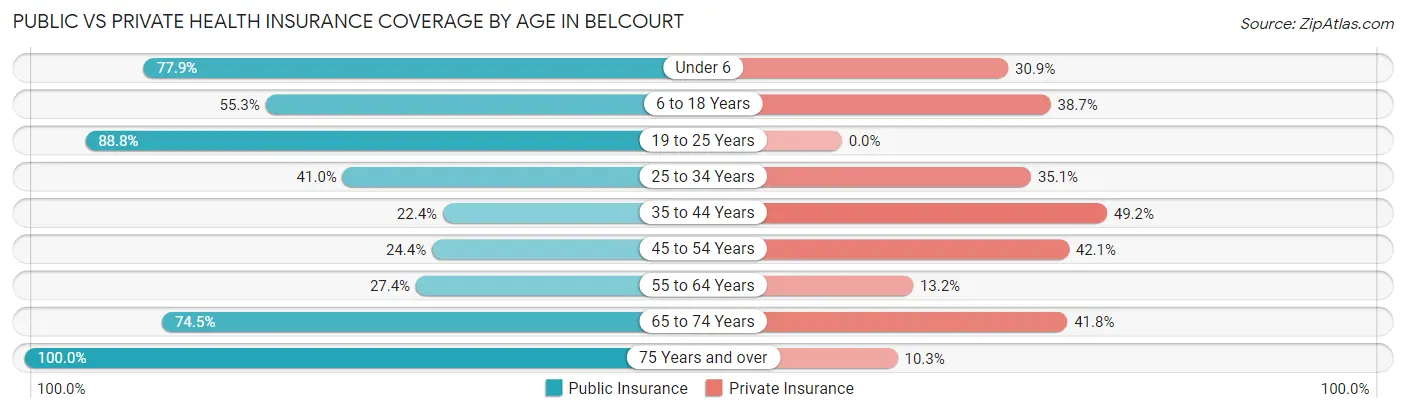
| Age Bracket | Public Insurance | Private Insurance |
| Under 6 | 116 (77.8%) | 46 (30.9%) |
| 6 to 18 Years | 341 (55.3%) | 239 (38.7%) |
| 19 to 25 Years | 71 (88.7%) | 0 (0.0%) |
| 25 to 34 Years | 77 (41.0%) | 66 (35.1%) |
| 35 to 44 Years | 55 (22.4%) | 121 (49.2%) |
| 45 to 54 Years | 48 (24.4%) | 83 (42.1%) |
| 55 to 64 Years | 29 (27.4%) | 14 (13.2%) |
| 65 to 74 Years | 73 (74.5%) | 41 (41.8%) |
| 75 Years and over | 58 (100.0%) | 6 (10.3%) |
| Total | 868 (49.9%) | 616 (35.4%) |
Disability Status by Sex by Age in Belcourt
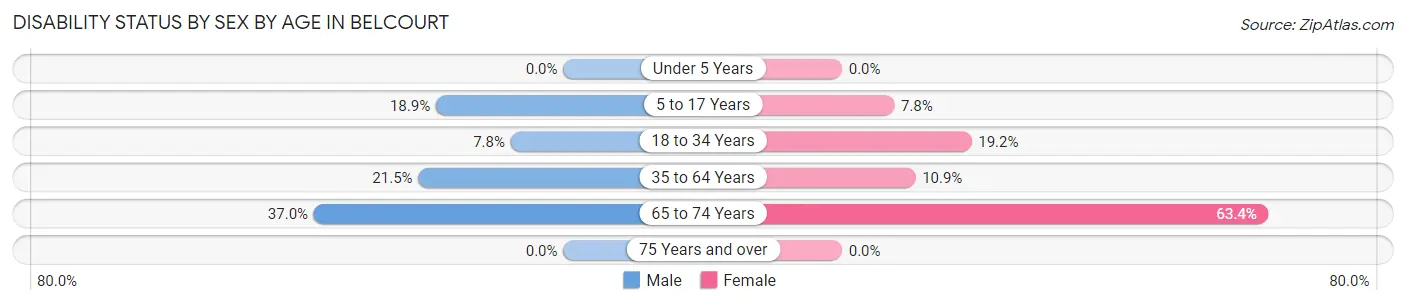
| Age Bracket | Male | Female |
| Under 5 Years | 0 (0.0%) | 0 (0.0%) |
| 5 to 17 Years | 52 (18.9%) | 27 (7.8%) |
| 18 to 34 Years | 10 (7.8%) | 30 (19.2%) |
| 35 to 64 Years | 51 (21.5%) | 34 (10.9%) |
| 65 to 74 Years | 10 (37.0%) | 45 (63.4%) |
| 75 Years and over | 0 (0.0%) | 0 (0.0%) |
Disability Class by Sex by Age in Belcourt
Disability Class: Hearing Difficulty
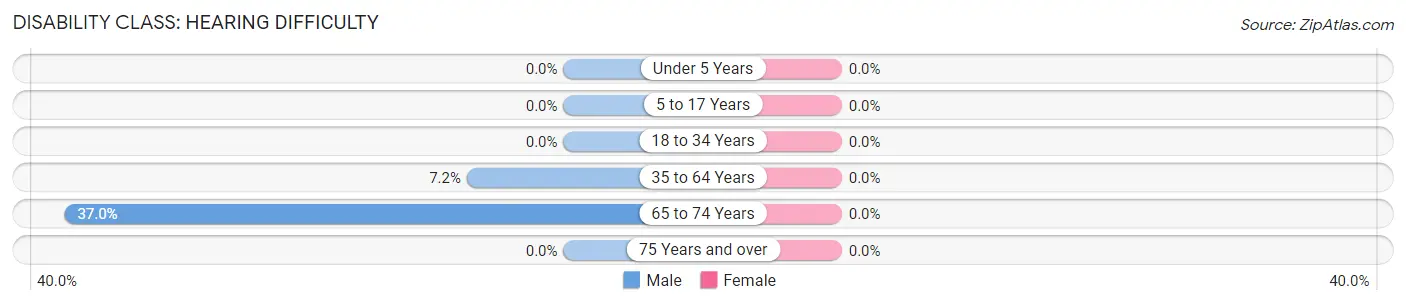
| Age Bracket | Male | Female |
| Under 5 Years | 0 (0.0%) | 0 (0.0%) |
| 5 to 17 Years | 0 (0.0%) | 0 (0.0%) |
| 18 to 34 Years | 0 (0.0%) | 0 (0.0%) |
| 35 to 64 Years | 17 (7.2%) | 0 (0.0%) |
| 65 to 74 Years | 10 (37.0%) | 0 (0.0%) |
| 75 Years and over | 0 (0.0%) | 0 (0.0%) |
Disability Class: Vision Difficulty
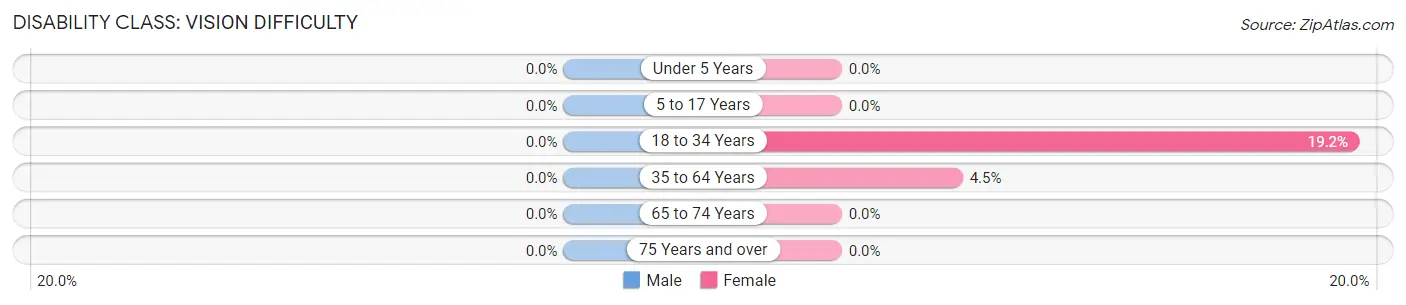
| Age Bracket | Male | Female |
| Under 5 Years | 0 (0.0%) | 0 (0.0%) |
| 5 to 17 Years | 0 (0.0%) | 0 (0.0%) |
| 18 to 34 Years | 0 (0.0%) | 30 (19.2%) |
| 35 to 64 Years | 0 (0.0%) | 14 (4.5%) |
| 65 to 74 Years | 0 (0.0%) | 0 (0.0%) |
| 75 Years and over | 0 (0.0%) | 0 (0.0%) |
Disability Class: Cognitive Difficulty
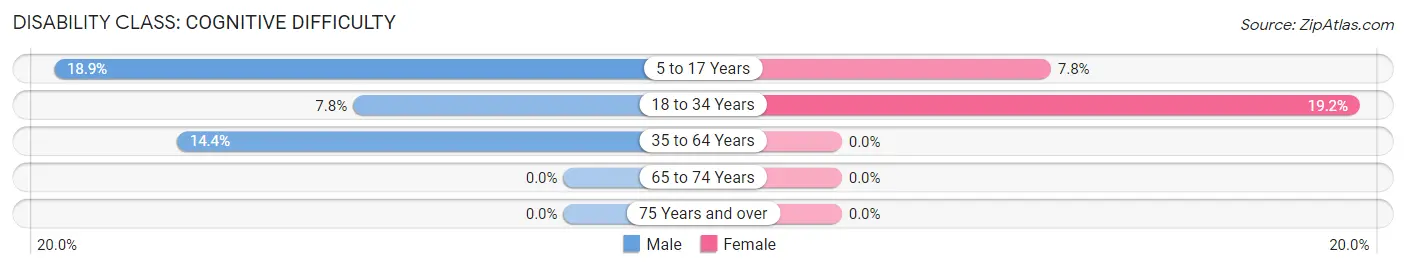
| Age Bracket | Male | Female |
| 5 to 17 Years | 52 (18.9%) | 27 (7.8%) |
| 18 to 34 Years | 10 (7.8%) | 30 (19.2%) |
| 35 to 64 Years | 34 (14.3%) | 0 (0.0%) |
| 65 to 74 Years | 0 (0.0%) | 0 (0.0%) |
| 75 Years and over | 0 (0.0%) | 0 (0.0%) |
Disability Class: Ambulatory Difficulty
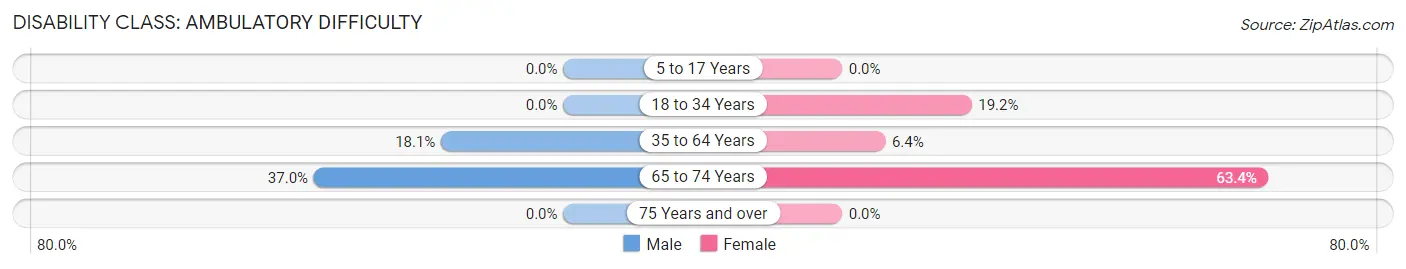
| Age Bracket | Male | Female |
| 5 to 17 Years | 0 (0.0%) | 0 (0.0%) |
| 18 to 34 Years | 0 (0.0%) | 30 (19.2%) |
| 35 to 64 Years | 43 (18.1%) | 20 (6.4%) |
| 65 to 74 Years | 10 (37.0%) | 45 (63.4%) |
| 75 Years and over | 0 (0.0%) | 0 (0.0%) |
Disability Class: Self-Care Difficulty
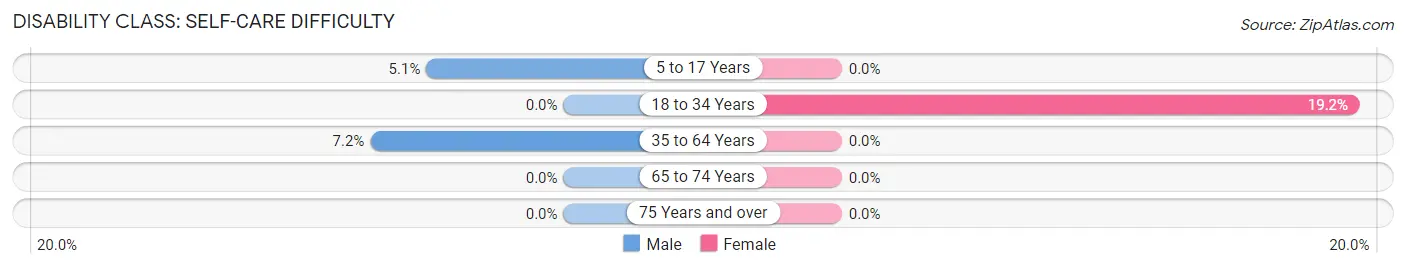
| Age Bracket | Male | Female |
| 5 to 17 Years | 14 (5.1%) | 0 (0.0%) |
| 18 to 34 Years | 0 (0.0%) | 30 (19.2%) |
| 35 to 64 Years | 17 (7.2%) | 0 (0.0%) |
| 65 to 74 Years | 0 (0.0%) | 0 (0.0%) |
| 75 Years and over | 0 (0.0%) | 0 (0.0%) |
Technology Access in Belcourt
Computing Device Access in Belcourt
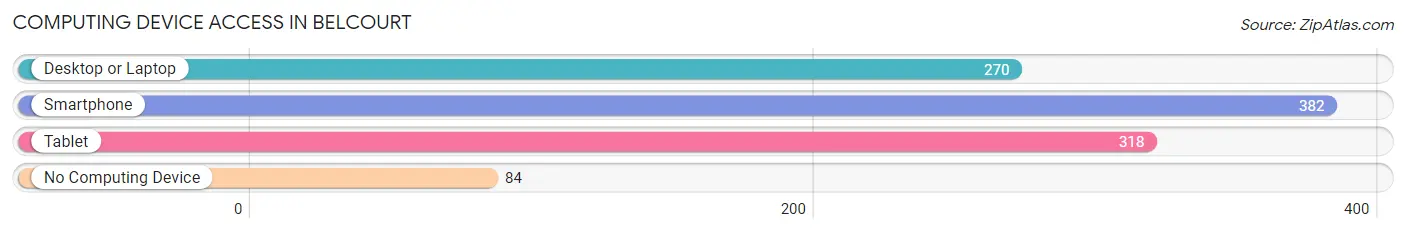
| Device Type | # Households | % Households |
| Desktop or Laptop | 270 | 53.7% |
| Smartphone | 382 | 75.9% |
| Tablet | 318 | 63.2% |
| No Computing Device | 84 | 16.7% |
| Total | 503 | 100.0% |
Internet Access in Belcourt
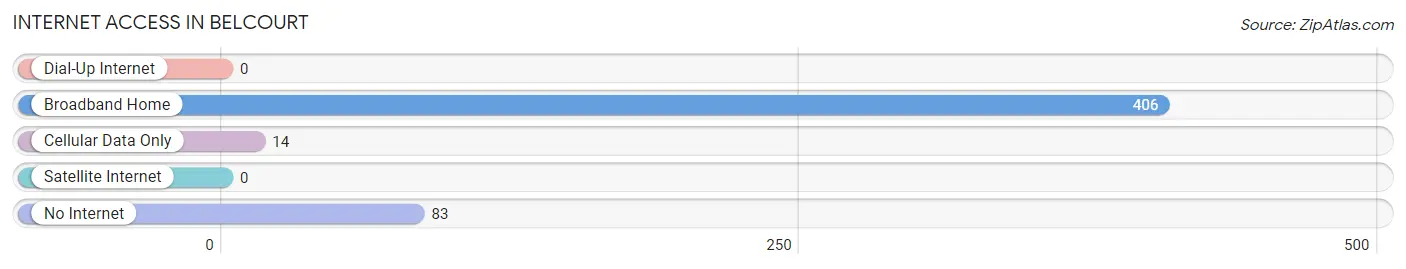
| Internet Type | # Households | % Households |
| Dial-Up Internet | 0 | 0.0% |
| Broadband Home | 406 | 80.7% |
| Cellular Data Only | 14 | 2.8% |
| Satellite Internet | 0 | 0.0% |
| No Internet | 83 | 16.5% |
| Total | 503 | 100.0% |
Belcourt Summary
Belcourt is a city located in the Turtle Mountain Indian Reservation in Rolette County, North Dakota. It is the county seat of Rolette County and is the largest city in the Turtle Mountain Indian Reservation. The city is located on the Turtle Mountain Indian Reservation, which is home to the Turtle Mountain Band of Chippewa Indians. The population of Belcourt was 1,876 at the 2010 census.
History
Belcourt was founded in 1884 by French-Canadian settlers. The city was named after the French word for “beautiful court”. The city was originally a trading post and was the first permanent settlement in the Turtle Mountain Indian Reservation. The city was incorporated in 1891 and was the first city in the Turtle Mountain Indian Reservation.
In the early 1900s, Belcourt was a bustling city with a variety of businesses, including a hotel, a bank, a post office, a general store, a blacksmith shop, and a livery stable. The city was also home to a number of churches, including the Catholic Church of the Immaculate Conception, which was built in 1908.
In the early 1900s, Belcourt was a popular destination for tourists, who came to enjoy the area’s natural beauty and to take part in the city’s many festivals and events. The city was also home to a number of cultural events, including the annual Turtle Mountain Powwow, which is still held today.
Geography
Belcourt is located in the Turtle Mountain Indian Reservation in Rolette County, North Dakota. The city is located on the Turtle Mountain Indian Reservation, which is home to the Turtle Mountain Band of Chippewa Indians. The city is located at the intersection of U.S. Route 281 and North Dakota Highway 5.
The city has a total area of 1.2 square miles, all of which is land. The city is located in a flat, open area with rolling hills and is surrounded by farmland. The city is located near the Turtle Mountain State Forest and the Turtle Mountain Wildlife Management Area.
Economy
Belcourt’s economy is largely based on agriculture and tourism. The city is home to a number of businesses, including a hotel, a bank, a post office, a general store, a blacksmith shop, and a livery stable. The city is also home to a number of cultural events, including the annual Turtle Mountain Powwow.
The city is also home to a number of manufacturing and industrial businesses, including a furniture factory, a printing company, and a plastics factory. The city is also home to a number of retail businesses, including a grocery store, a hardware store, and a variety of other shops.
Demographics
As of the 2010 census, the population of Belcourt was 1,876. The city has a population density of 1,541 people per square mile. The median age of the city’s population is 33.7 years. The median household income in Belcourt is $30,938. The city’s population is predominantly Native American, with 94.3% of the population identifying as Native American. The city’s population is also predominantly Catholic, with 78.3% of the population identifying as Catholic.
Common Questions
What is Per Capita Income in Belcourt?
Per Capita income in Belcourt is $20,909.
What is the Median Family Income in Belcourt?
Median Family Income in Belcourt is $85,469.
What is the Median Household income in Belcourt?
Median Household Income in Belcourt is $61,250.
What is Income or Wage Gap in Belcourt?
Income or Wage Gap in Belcourt is 28.8%.
Women in Belcourt earn 71.2 cents for every dollar earned by a man.
What is Inequality or Gini Index in Belcourt?
Inequality or Gini Index in Belcourt is 0.41.
What is the Total Population of Belcourt?
Total Population of Belcourt is 1,772.
What is the Total Male Population of Belcourt?
Total Male Population of Belcourt is 761.
What is the Total Female Population of Belcourt?
Total Female Population of Belcourt is 1,011.
What is the Ratio of Males per 100 Females in Belcourt?
There are 75.27 Males per 100 Females in Belcourt.
What is the Ratio of Females per 100 Males in Belcourt?
There are 132.85 Females per 100 Males in Belcourt.
What is the Median Population Age in Belcourt?
Median Population Age in Belcourt is 26.8 Years.
What is the Average Family Size in Belcourt
Average Family Size in Belcourt is 3.7 People.
What is the Average Household Size in Belcourt
Average Household Size in Belcourt is 3.4 People.
How Large is the Labor Force in Belcourt?
There are 689 People in the Labor Forcein in Belcourt.
What is the Percentage of People in the Labor Force in Belcourt?
63.3% of People are in the Labor Force in Belcourt.
What is the Unemployment Rate in Belcourt?
Unemployment Rate in Belcourt is 8.0%.