Grand Rapids, MN Map & Demographics
Grand Rapids Map
Grand Rapids Overview
$30,251
PER CAPITA INCOME
$80,000
AVG FAMILY INCOME
$53,317
AVG HOUSEHOLD INCOME
5.2%
WAGE / INCOME GAP [ % ]
94.8¢/ $1
WAGE / INCOME GAP [ $ ]
0.45
INEQUALITY / GINI INDEX
11,158
TOTAL POPULATION
5,209
MALE POPULATION
5,949
FEMALE POPULATION
87.56
MALES / 100 FEMALES
114.21
FEMALES / 100 MALES
43.2
MEDIAN AGE
3.1
AVG FAMILY SIZE
2.2
AVG HOUSEHOLD SIZE
4,953
LABOR FORCE [ PEOPLE ]
54.4%
PERCENT IN LABOR FORCE
7.1%
UNEMPLOYMENT RATE
Grand Rapids Zip Codes
Grand Rapids Area Codes
Income in Grand Rapids
Income Overview in Grand Rapids
Per Capita Income in Grand Rapids is $30,251, while median incomes of families and households are $80,000 and $53,317 respectively.
| Characteristic | Number | Measure |
| Per Capita Income | 11,158 | $30,251 |
| Median Family Income | 2,522 | $80,000 |
| Mean Family Income | 2,522 | $94,185 |
| Median Household Income | 4,618 | $53,317 |
| Mean Household Income | 4,618 | $68,665 |
| Income Deficit | 2,522 | $0 |
| Wage / Income Gap (%) | 11,158 | 5.18% |
| Wage / Income Gap ($) | 11,158 | 94.82¢ per $1 |
| Gini / Inequality Index | 11,158 | 0.45 |
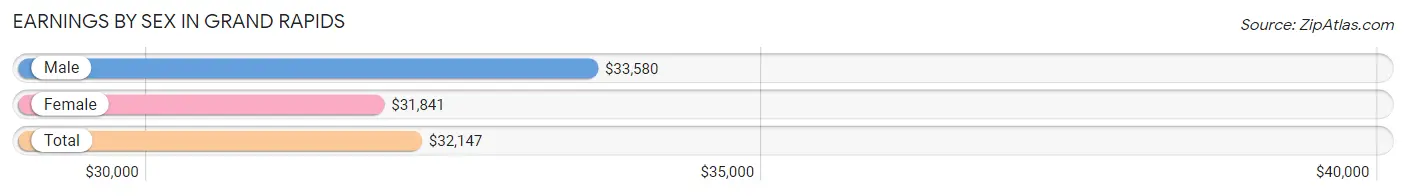
Earnings by Sex in Grand Rapids
Average Earnings in Grand Rapids are $32,147, $33,580 for men and $31,841 for women, a difference of 5.2%.
| Sex | Number | Average Earnings |
| Male | 2,809 (51.0%) | $33,580 |
| Female | 2,694 (49.0%) | $31,841 |
| Total | 5,503 (100.0%) | $32,147 |
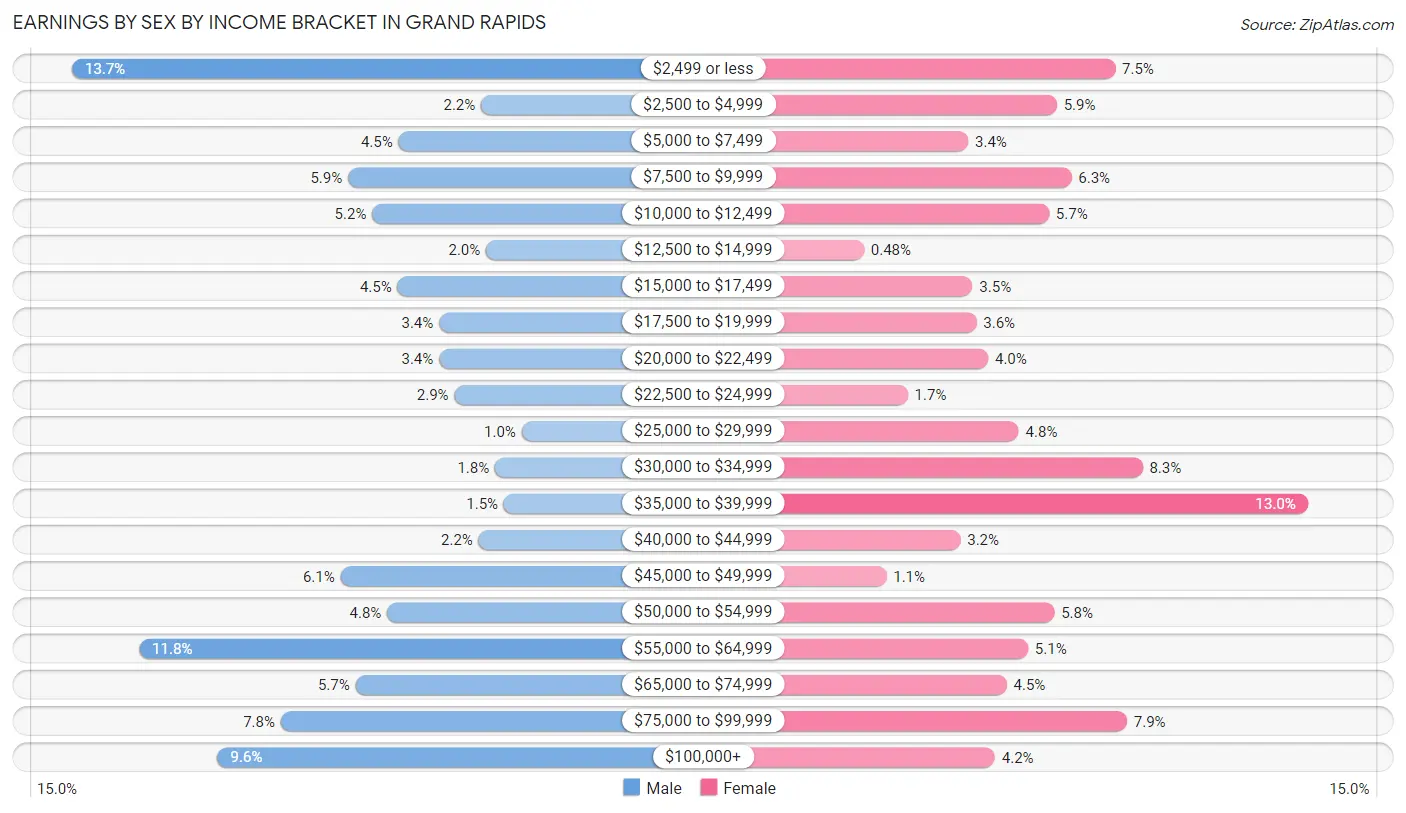
Earnings by Sex by Income Bracket in Grand Rapids
The most common earnings brackets in Grand Rapids are $2,499 or less for men (384 | 13.7%) and $35,000 to $39,999 for women (349 | 13.0%).
| Income | Male | Female |
| $2,499 or less | 384 (13.7%) | 203 (7.5%) |
| $2,500 to $4,999 | 61 (2.2%) | 159 (5.9%) |
| $5,000 to $7,499 | 126 (4.5%) | 92 (3.4%) |
| $7,500 to $9,999 | 166 (5.9%) | 170 (6.3%) |
| $10,000 to $12,499 | 147 (5.2%) | 153 (5.7%) |
| $12,500 to $14,999 | 57 (2.0%) | 13 (0.5%) |
| $15,000 to $17,499 | 127 (4.5%) | 95 (3.5%) |
| $17,500 to $19,999 | 94 (3.4%) | 98 (3.6%) |
| $20,000 to $22,499 | 94 (3.4%) | 107 (4.0%) |
| $22,500 to $24,999 | 82 (2.9%) | 46 (1.7%) |
| $25,000 to $29,999 | 29 (1.0%) | 130 (4.8%) |
| $30,000 to $34,999 | 50 (1.8%) | 224 (8.3%) |
| $35,000 to $39,999 | 43 (1.5%) | 349 (13.0%) |
| $40,000 to $44,999 | 63 (2.2%) | 86 (3.2%) |
| $45,000 to $49,999 | 172 (6.1%) | 30 (1.1%) |
| $50,000 to $54,999 | 135 (4.8%) | 157 (5.8%) |
| $55,000 to $64,999 | 331 (11.8%) | 137 (5.1%) |
| $65,000 to $74,999 | 160 (5.7%) | 121 (4.5%) |
| $75,000 to $99,999 | 219 (7.8%) | 212 (7.9%) |
| $100,000+ | 269 (9.6%) | 112 (4.2%) |
| Total | 2,809 (100.0%) | 2,694 (100.0%) |
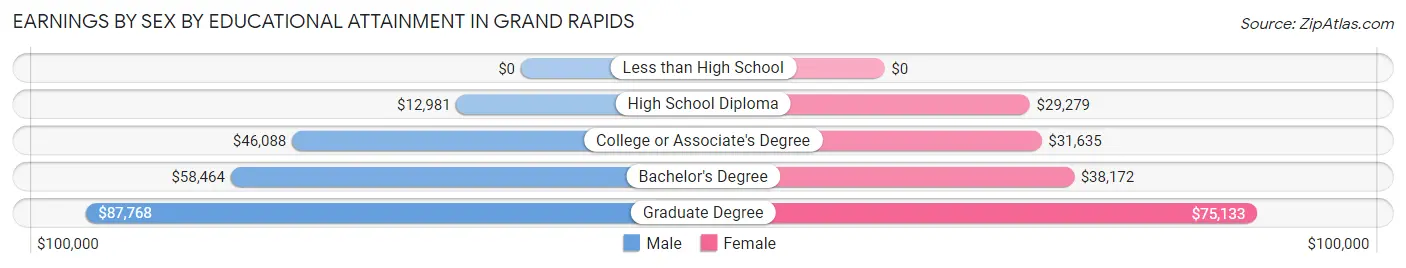
Earnings by Sex by Educational Attainment in Grand Rapids
Average earnings in Grand Rapids are $45,735 for men and $35,050 for women, a difference of 23.4%. Men with an educational attainment of graduate degree enjoy the highest average annual earnings of $87,768, while those with high school diploma education earn the least with $12,981. Women with an educational attainment of graduate degree earn the most with the average annual earnings of $75,133, while those with high school diploma education have the smallest earnings of $29,279.
| Educational Attainment | Male Income | Female Income |
| Less than High School | - | - |
| High School Diploma | $12,981 | $29,279 |
| College or Associate's Degree | $46,088 | $31,635 |
| Bachelor's Degree | $58,464 | $38,172 |
| Graduate Degree | $87,768 | $75,133 |
| Total | $45,735 | $35,050 |
Family Income in Grand Rapids
Family Income Brackets in Grand Rapids
According to the Grand Rapids family income data, there are 656 families falling into the $100,000 to $149,999 income range, which is the most common income bracket and makes up 26.0% of all families. Conversely, the $10,000 to $14,999 income bracket is the least frequent group with only 55 families (2.2%) belonging to this category.
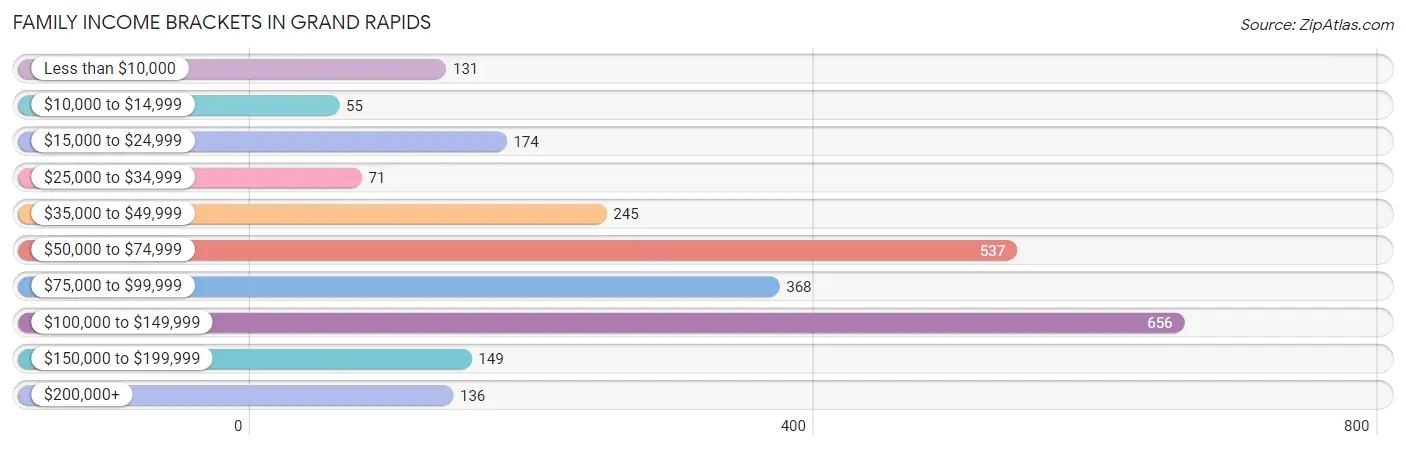
| Income Bracket | # Families | % Families |
| Less than $10,000 | 131 | 5.2% |
| $10,000 to $14,999 | 55 | 2.2% |
| $15,000 to $24,999 | 174 | 6.9% |
| $25,000 to $34,999 | 71 | 2.8% |
| $35,000 to $49,999 | 245 | 9.7% |
| $50,000 to $74,999 | 537 | 21.3% |
| $75,000 to $99,999 | 368 | 14.6% |
| $100,000 to $149,999 | 656 | 26.0% |
| $150,000 to $199,999 | 149 | 5.9% |
| $200,000+ | 136 | 5.4% |
Family Income by Famaliy Size in Grand Rapids
6-person families (114 | 4.5%) account for the highest median family income in Grand Rapids with $137,933 per family, while 2-person families (1,339 | 53.1%) have the highest median income of $36,836 per family member.
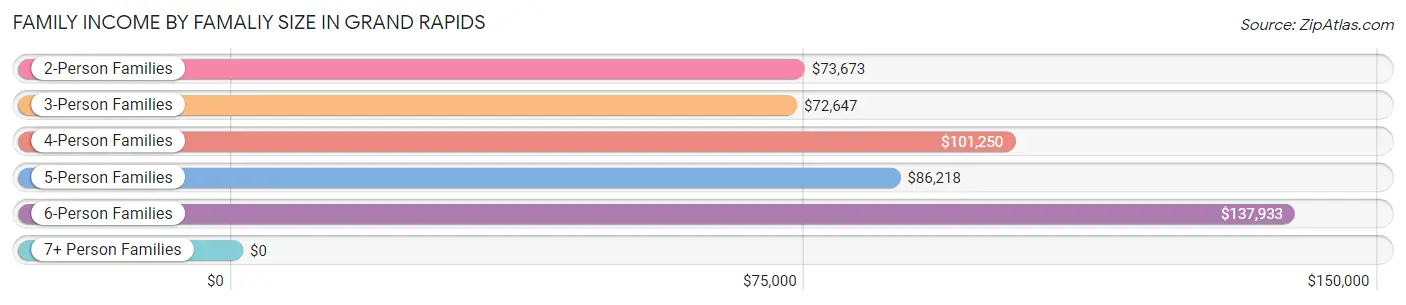
| Income Bracket | # Families | Median Income |
| 2-Person Families | 1,339 (53.1%) | $73,673 |
| 3-Person Families | 632 (25.1%) | $72,647 |
| 4-Person Families | 236 (9.4%) | $101,250 |
| 5-Person Families | 166 (6.6%) | $86,218 |
| 6-Person Families | 114 (4.5%) | $137,933 |
| 7+ Person Families | 35 (1.4%) | $0 |
| Total | 2,522 (100.0%) | $80,000 |
Family Income by Number of Earners in Grand Rapids
The median family income in Grand Rapids is $80,000, with families comprising 3+ earners (173) having the highest median family income of $139,928, while families with 1 earner (723) have the lowest median family income of $52,844, accounting for 6.9% and 28.7% of families, respectively.
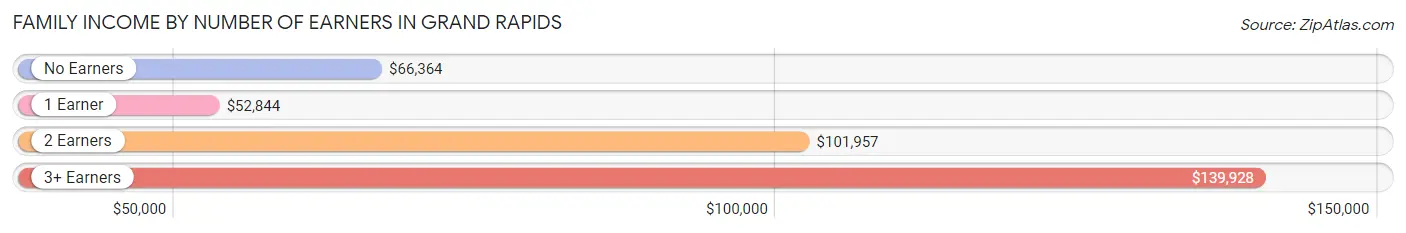
| Number of Earners | # Families | Median Income |
| No Earners | 514 (20.4%) | $66,364 |
| 1 Earner | 723 (28.7%) | $52,844 |
| 2 Earners | 1,112 (44.1%) | $101,957 |
| 3+ Earners | 173 (6.9%) | $139,928 |
| Total | 2,522 (100.0%) | $80,000 |
Household Income in Grand Rapids
Household Income Brackets in Grand Rapids
With 974 households falling in the category, the $50,000 to $74,999 income range is the most frequent in Grand Rapids, accounting for 21.1% of all households. In contrast, only 139 households (3.0%) fall into the $200,000+ income bracket, making it the least populous group.
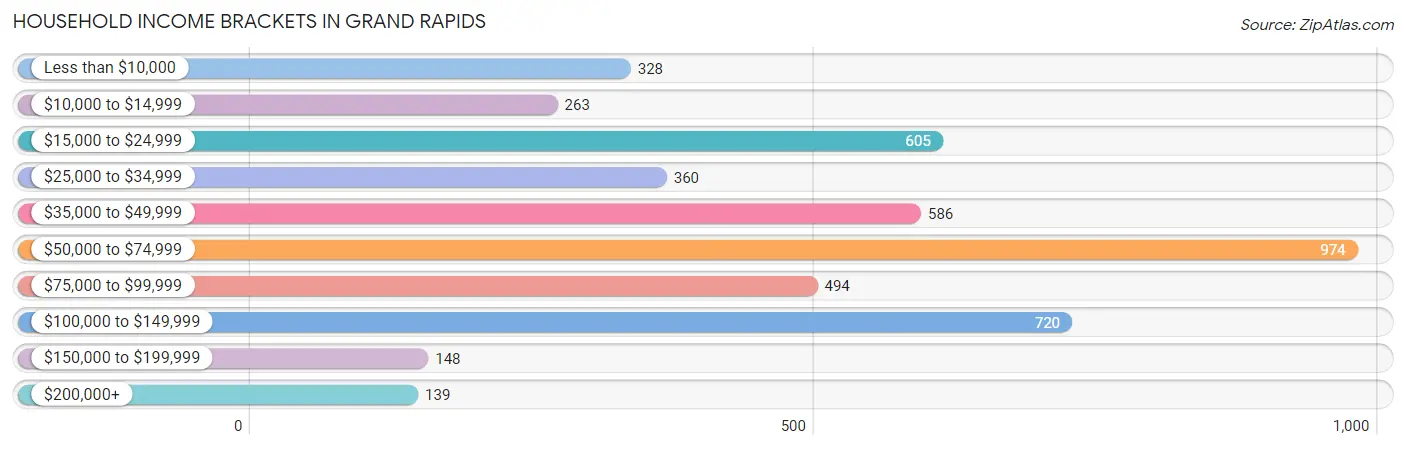
| Income Bracket | # Households | % Households |
| Less than $10,000 | 328 | 7.1% |
| $10,000 to $14,999 | 263 | 5.7% |
| $15,000 to $24,999 | 605 | 13.1% |
| $25,000 to $34,999 | 360 | 7.8% |
| $35,000 to $49,999 | 586 | 12.7% |
| $50,000 to $74,999 | 974 | 21.1% |
| $75,000 to $99,999 | 494 | 10.7% |
| $100,000 to $149,999 | 720 | 15.6% |
| $150,000 to $199,999 | 148 | 3.2% |
| $200,000+ | 139 | 3.0% |
Household Income by Householder Age in Grand Rapids
The median household income in Grand Rapids is $53,317, with the highest median household income of $61,400 found in the 25 to 44 years age bracket for the primary householder. A total of 1,426 households (30.9%) fall into this category. Meanwhile, the 15 to 24 years age bracket for the primary householder has the lowest median household income of $0, with 106 households (2.3%) in this group.
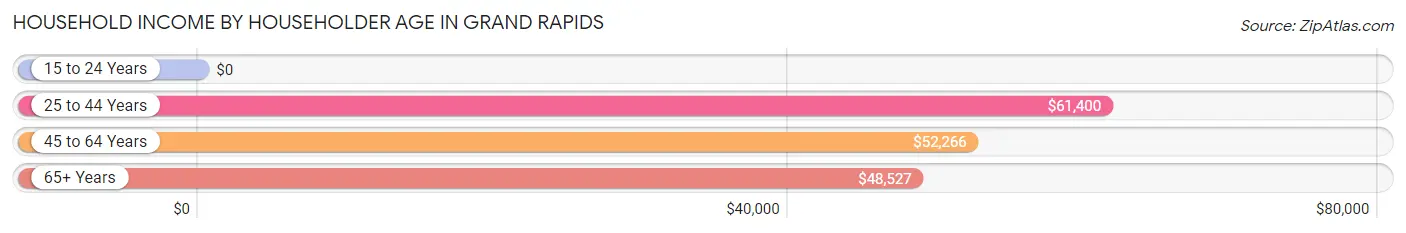
| Income Bracket | # Households | Median Income |
| 15 to 24 Years | 106 (2.3%) | $0 |
| 25 to 44 Years | 1,426 (30.9%) | $61,400 |
| 45 to 64 Years | 1,407 (30.5%) | $52,266 |
| 65+ Years | 1,679 (36.4%) | $48,527 |
| Total | 4,618 (100.0%) | $53,317 |
Poverty in Grand Rapids
Income Below Poverty by Sex and Age in Grand Rapids
With 14.6% poverty level for males and 19.0% for females among the residents of Grand Rapids, 15 year old males and under 5 year old females are the most vulnerable to poverty, with 27 males (39.1%) and 173 females (62.7%) in their respective age groups living below the poverty level.
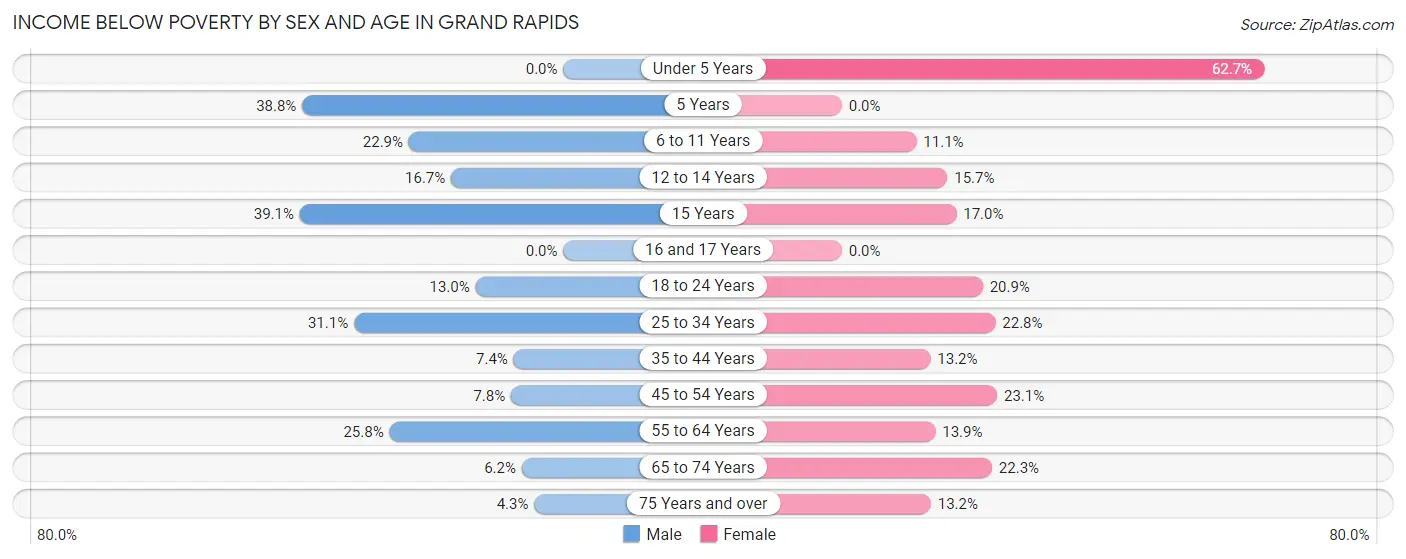
| Age Bracket | Male | Female |
| Under 5 Years | 0 (0.0%) | 173 (62.7%) |
| 5 Years | 19 (38.8%) | 0 (0.0%) |
| 6 to 11 Years | 114 (22.9%) | 39 (11.1%) |
| 12 to 14 Years | 13 (16.7%) | 55 (15.7%) |
| 15 Years | 27 (39.1%) | 17 (17.0%) |
| 16 and 17 Years | 0 (0.0%) | 0 (0.0%) |
| 18 to 24 Years | 45 (13.0%) | 50 (20.9%) |
| 25 to 34 Years | 194 (31.1%) | 119 (22.8%) |
| 35 to 44 Years | 64 (7.4%) | 99 (13.2%) |
| 45 to 54 Years | 40 (7.8%) | 142 (23.1%) |
| 55 to 64 Years | 149 (25.8%) | 113 (13.9%) |
| 65 to 74 Years | 37 (6.2%) | 171 (22.3%) |
| 75 Years and over | 16 (4.3%) | 92 (13.2%) |
| Total | 718 (14.6%) | 1,070 (19.0%) |
Income Above Poverty by Sex and Age in Grand Rapids
According to the poverty statistics in Grand Rapids, males aged under 5 years and females aged 5 years are the age groups that are most secure financially, with 100.0% of males and 100.0% of females in these age groups living above the poverty line.
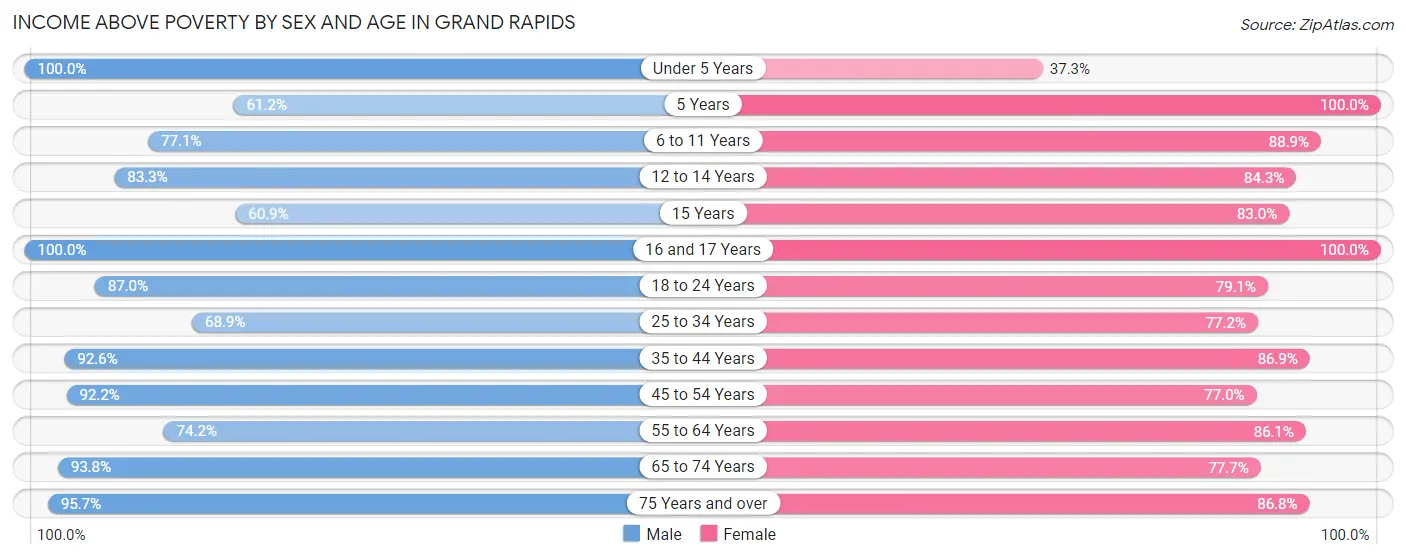
| Age Bracket | Male | Female |
| Under 5 Years | 203 (100.0%) | 103 (37.3%) |
| 5 Years | 30 (61.2%) | 12 (100.0%) |
| 6 to 11 Years | 383 (77.1%) | 313 (88.9%) |
| 12 to 14 Years | 65 (83.3%) | 296 (84.3%) |
| 15 Years | 42 (60.9%) | 83 (83.0%) |
| 16 and 17 Years | 110 (100.0%) | 137 (100.0%) |
| 18 to 24 Years | 300 (87.0%) | 189 (79.1%) |
| 25 to 34 Years | 430 (68.9%) | 403 (77.2%) |
| 35 to 44 Years | 803 (92.6%) | 654 (86.9%) |
| 45 to 54 Years | 475 (92.2%) | 474 (76.9%) |
| 55 to 64 Years | 428 (74.2%) | 701 (86.1%) |
| 65 to 74 Years | 563 (93.8%) | 596 (77.7%) |
| 75 Years and over | 355 (95.7%) | 604 (86.8%) |
| Total | 4,187 (85.4%) | 4,565 (81.0%) |
Income Below Poverty Among Married-Couple Families in Grand Rapids
The poverty statistics for married-couple families in Grand Rapids show that 8.1% or 157 of the total 1,931 families live below the poverty line. Families with 3 or 4 children have the highest poverty rate of 27.9%, comprising of 57 families. On the other hand, families with 5 or more children have the lowest poverty rate of 0.0%, which includes 0 families.
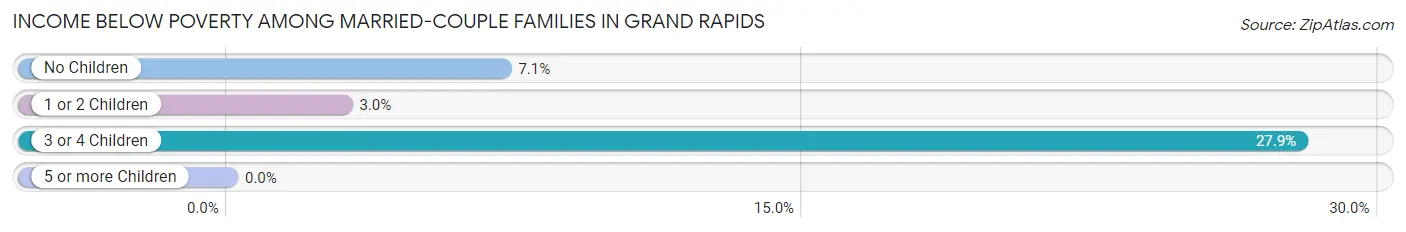
| Children | Above Poverty | Below Poverty |
| No Children | 1,105 (92.9%) | 85 (7.1%) |
| 1 or 2 Children | 487 (97.0%) | 15 (3.0%) |
| 3 or 4 Children | 147 (72.1%) | 57 (27.9%) |
| 5 or more Children | 35 (100.0%) | 0 (0.0%) |
| Total | 1,774 (91.9%) | 157 (8.1%) |
Income Below Poverty Among Single-Parent Households in Grand Rapids
According to the poverty data in Grand Rapids, 16.7% or 24 single-father households and 29.7% or 133 single-mother households are living below the poverty line. Among single-father households, those with no children have the highest poverty rate, with 24 households (66.7%) experiencing poverty. Likewise, among single-mother households, those with 1 or 2 children have the highest poverty rate, with 121 households (52.8%) falling below the poverty line.
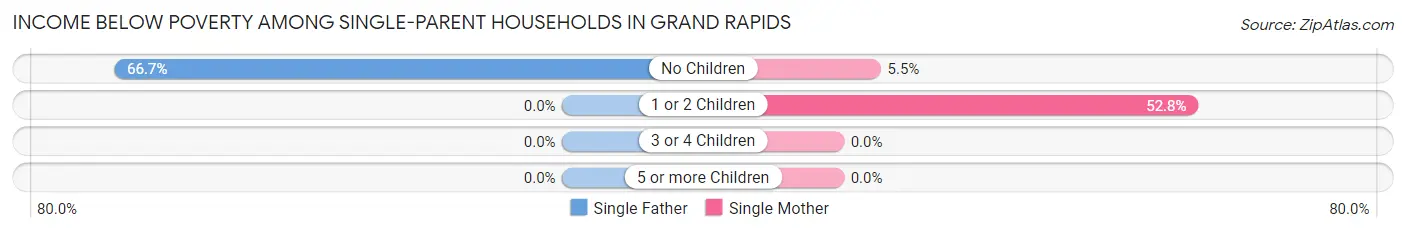
| Children | Single Father | Single Mother |
| No Children | 24 (66.7%) | 12 (5.5%) |
| 1 or 2 Children | 0 (0.0%) | 121 (52.8%) |
| 3 or 4 Children | 0 (0.0%) | 0 (0.0%) |
| 5 or more Children | 0 (0.0%) | 0 (0.0%) |
| Total | 24 (16.7%) | 133 (29.7%) |
Income Below Poverty Among Married-Couple vs Single-Parent Households in Grand Rapids
The poverty data for Grand Rapids shows that 157 of the married-couple family households (8.1%) and 157 of the single-parent households (26.6%) are living below the poverty level. Within the married-couple family households, those with 3 or 4 children have the highest poverty rate, with 57 households (27.9%) falling below the poverty line. Among the single-parent households, those with 1 or 2 children have the highest poverty rate, with 121 household (35.9%) living below poverty.

| Children | Married-Couple Families | Single-Parent Households |
| No Children | 85 (7.1%) | 36 (14.2%) |
| 1 or 2 Children | 15 (3.0%) | 121 (35.9%) |
| 3 or 4 Children | 57 (27.9%) | 0 (0.0%) |
| 5 or more Children | 0 (0.0%) | 0 (0.0%) |
| Total | 157 (8.1%) | 157 (26.6%) |
Race in Grand Rapids
The most populous races in Grand Rapids are White / Caucasian (10,138 | 90.9%), Two or more Races (568 | 5.1%), and Native / Alaskan (233 | 2.1%).
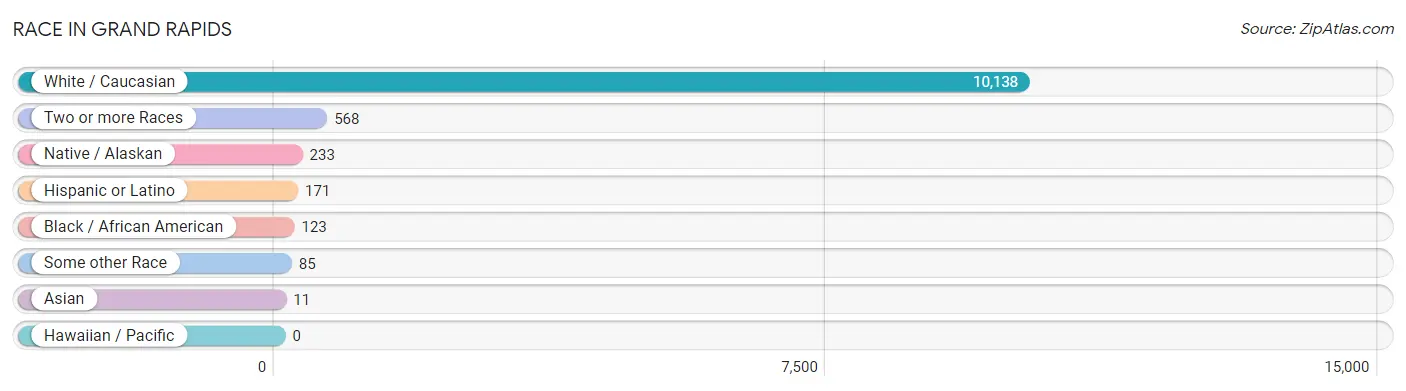
| Race | # Population | % Population |
| Asian | 11 | 0.1% |
| Black / African American | 123 | 1.1% |
| Hawaiian / Pacific | 0 | 0.0% |
| Hispanic or Latino | 171 | 1.5% |
| Native / Alaskan | 233 | 2.1% |
| White / Caucasian | 10,138 | 90.9% |
| Two or more Races | 568 | 5.1% |
| Some other Race | 85 | 0.8% |
| Total | 11,158 | 100.0% |
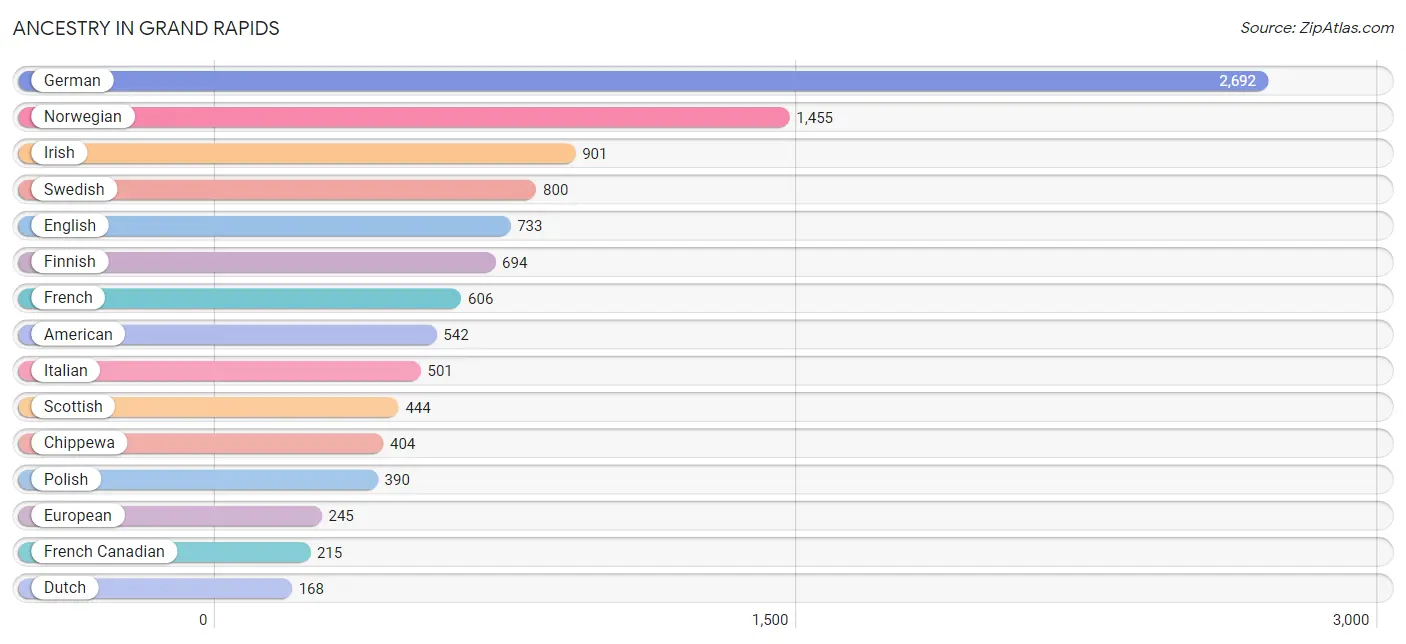
Ancestry in Grand Rapids
The most populous ancestries reported in Grand Rapids are German (2,692 | 24.1%), Norwegian (1,455 | 13.0%), Irish (901 | 8.1%), Swedish (800 | 7.2%), and English (733 | 6.6%), together accounting for 59.0% of all Grand Rapids residents.
| Ancestry | # Population | % Population |
| American | 542 | 4.9% |
| Austrian | 22 | 0.2% |
| Bangladeshi | 5 | 0.0% |
| Belgian | 111 | 1.0% |
| British | 93 | 0.8% |
| Canadian | 16 | 0.1% |
| Cherokee | 3 | 0.0% |
| Chippewa | 404 | 3.6% |
| Cree | 15 | 0.1% |
| Croatian | 70 | 0.6% |
| Czech | 133 | 1.2% |
| Danish | 146 | 1.3% |
| Dutch | 168 | 1.5% |
| Eastern European | 23 | 0.2% |
| Ecuadorian | 6 | 0.1% |
| English | 733 | 6.6% |
| European | 245 | 2.2% |
| Finnish | 694 | 6.2% |
| French | 606 | 5.4% |
| French Canadian | 215 | 1.9% |
| German | 2,692 | 24.1% |
| Irish | 901 | 8.1% |
| Italian | 501 | 4.5% |
| Korean | 58 | 0.5% |
| Latvian | 15 | 0.1% |
| Mexican | 67 | 0.6% |
| Northern European | 30 | 0.3% |
| Norwegian | 1,455 | 13.0% |
| Polish | 390 | 3.5% |
| Puerto Rican | 98 | 0.9% |
| Russian | 57 | 0.5% |
| Scandinavian | 142 | 1.3% |
| Scotch-Irish | 119 | 1.1% |
| Scottish | 444 | 4.0% |
| Serbian | 62 | 0.6% |
| Slavic | 6 | 0.1% |
| South American | 6 | 0.1% |
| Swedish | 800 | 7.2% |
| Swiss | 64 | 0.6% |
| Ukrainian | 6 | 0.1% |
| Welsh | 18 | 0.2% | View All 41 Rows |
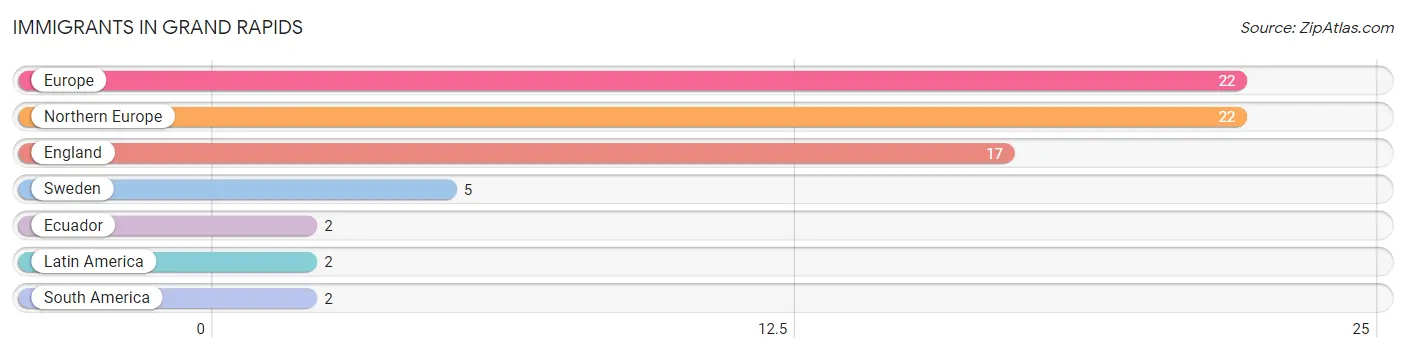
Immigrants in Grand Rapids
The most numerous immigrant groups reported in Grand Rapids came from Europe (22 | 0.2%), Northern Europe (22 | 0.2%), England (17 | 0.2%), Sweden (5 | 0.0%), and Ecuador (2 | 0.0%), together accounting for 0.6% of all Grand Rapids residents.
| Immigration Origin | # Population | % Population |
| Ecuador | 2 | 0.0% |
| England | 17 | 0.2% |
| Europe | 22 | 0.2% |
| Latin America | 2 | 0.0% |
| Northern Europe | 22 | 0.2% |
| South America | 2 | 0.0% |
| Sweden | 5 | 0.0% | View All 7 Rows |
Sex and Age in Grand Rapids
Sex and Age in Grand Rapids
The most populous age groups in Grand Rapids are 40 to 44 Years (505 | 9.7%) for men and 10 to 14 Years (515 | 8.7%) for women.
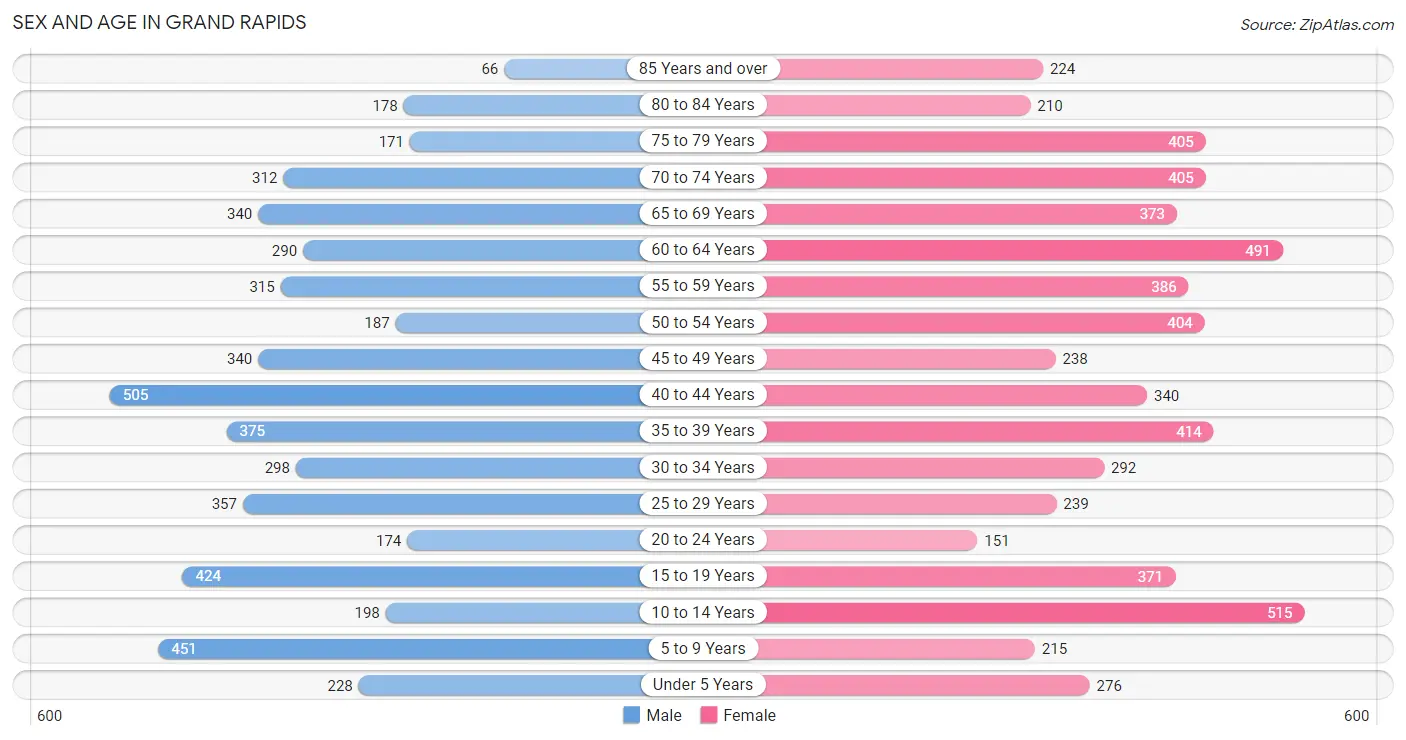
| Age Bracket | Male | Female |
| Under 5 Years | 228 (4.4%) | 276 (4.6%) |
| 5 to 9 Years | 451 (8.7%) | 215 (3.6%) |
| 10 to 14 Years | 198 (3.8%) | 515 (8.7%) |
| 15 to 19 Years | 424 (8.1%) | 371 (6.2%) |
| 20 to 24 Years | 174 (3.3%) | 151 (2.5%) |
| 25 to 29 Years | 357 (6.9%) | 239 (4.0%) |
| 30 to 34 Years | 298 (5.7%) | 292 (4.9%) |
| 35 to 39 Years | 375 (7.2%) | 414 (7.0%) |
| 40 to 44 Years | 505 (9.7%) | 340 (5.7%) |
| 45 to 49 Years | 340 (6.5%) | 238 (4.0%) |
| 50 to 54 Years | 187 (3.6%) | 404 (6.8%) |
| 55 to 59 Years | 315 (6.0%) | 386 (6.5%) |
| 60 to 64 Years | 290 (5.6%) | 491 (8.3%) |
| 65 to 69 Years | 340 (6.5%) | 373 (6.3%) |
| 70 to 74 Years | 312 (6.0%) | 405 (6.8%) |
| 75 to 79 Years | 171 (3.3%) | 405 (6.8%) |
| 80 to 84 Years | 178 (3.4%) | 210 (3.5%) |
| 85 Years and over | 66 (1.3%) | 224 (3.8%) |
| Total | 5,209 (100.0%) | 5,949 (100.0%) |
Families and Households in Grand Rapids
Median Family Size in Grand Rapids
The median family size in Grand Rapids is 3.08 persons per family, with married-couple families (1,931 | 76.6%) accounting for the largest median family size of 3.17 persons per family. On the other hand, single male/father families (144 | 5.7%) represent the smallest median family size with 2.53 persons per family.
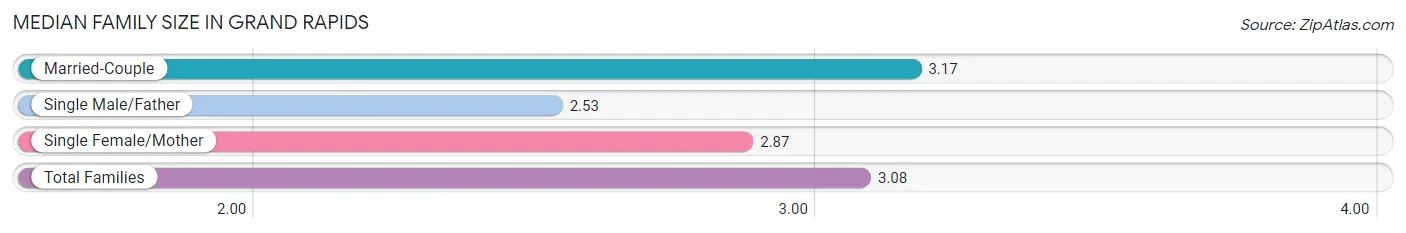
| Family Type | # Families | Family Size |
| Married-Couple | 1,931 (76.6%) | 3.17 |
| Single Male/Father | 144 (5.7%) | 2.53 |
| Single Female/Mother | 447 (17.7%) | 2.87 |
| Total Families | 2,522 (100.0%) | 3.08 |
Median Household Size in Grand Rapids
The median household size in Grand Rapids is 2.25 persons per household, with married-couple households (1,931 | 41.8%) accounting for the largest median household size of 3.19 persons per household. non-family households (2,096 | 45.4%) represent the smallest median household size with 1.18 persons per household.
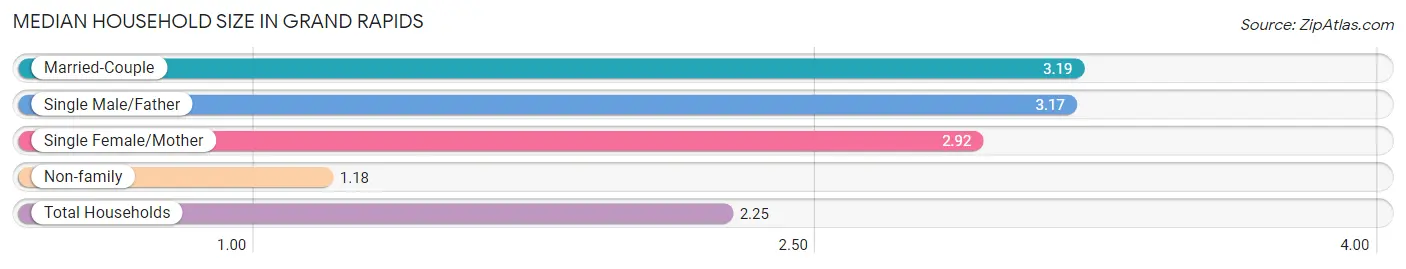
| Household Type | # Households | Household Size |
| Married-Couple | 1,931 (41.8%) | 3.19 |
| Single Male/Father | 144 (3.1%) | 3.17 |
| Single Female/Mother | 447 (9.7%) | 2.92 |
| Non-family | 2,096 (45.4%) | 1.18 |
| Total Households | 4,618 (100.0%) | 2.25 |
Household Size by Marriage Status in Grand Rapids
Out of a total of 4,618 households in Grand Rapids, 2,522 (54.6%) are family households, while 2,096 (45.4%) are nonfamily households. The most numerous type of family households are 2-person households, comprising 1,310, and the most common type of nonfamily households are 1-person households, comprising 1,848.
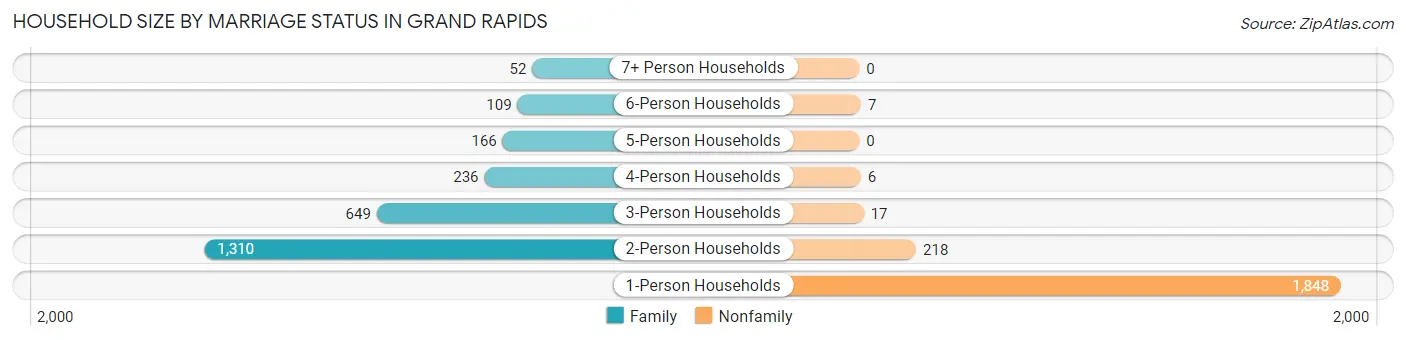
| Household Size | Family Households | Nonfamily Households |
| 1-Person Households | - | 1,848 (40.0%) |
| 2-Person Households | 1,310 (28.4%) | 218 (4.7%) |
| 3-Person Households | 649 (14.1%) | 17 (0.4%) |
| 4-Person Households | 236 (5.1%) | 6 (0.1%) |
| 5-Person Households | 166 (3.6%) | 0 (0.0%) |
| 6-Person Households | 109 (2.4%) | 7 (0.2%) |
| 7+ Person Households | 52 (1.1%) | 0 (0.0%) |
| Total | 2,522 (54.6%) | 2,096 (45.4%) |
Female Fertility in Grand Rapids
Fertility by Age in Grand Rapids
Average fertility rate in Grand Rapids is 45.0 births per 1,000 women. Women in the age bracket of 20 to 34 years have the highest fertility rate with 72.0 births per 1,000 women. Women in the age bracket of 20 to 34 years acount for 51.0% of all women with births.
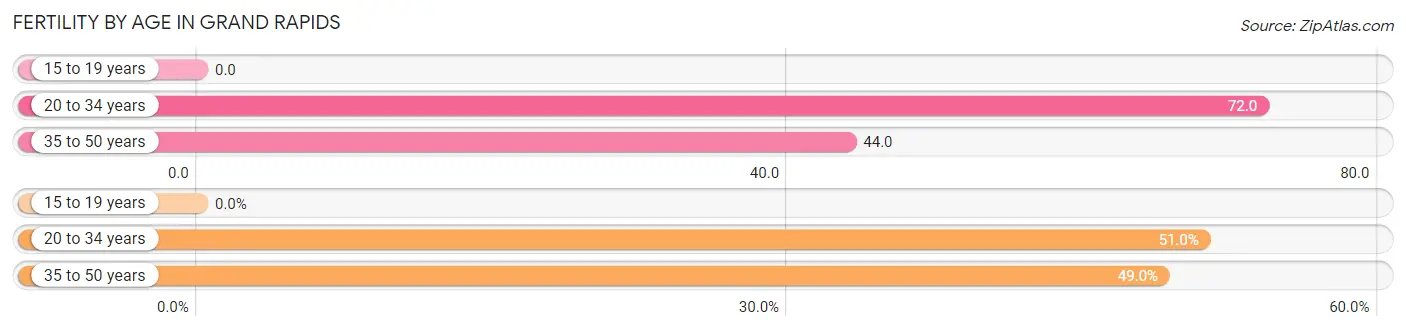
| Age Bracket | Women with Births | Births / 1,000 Women |
| 15 to 19 years | 0 (0.0%) | 0.0 |
| 20 to 34 years | 49 (51.0%) | 72.0 |
| 35 to 50 years | 47 (49.0%) | 44.0 |
| Total | 96 (100.0%) | 45.0 |
Fertility by Age by Marriage Status in Grand Rapids
67.7% of women with births (96) in Grand Rapids are married. The highest percentage of unmarried women with births falls into 35 to 50 years age bracket with 36.2% of them unmarried at the time of birth, while the lowest percentage of unmarried women with births belong to 20 to 34 years age bracket with 28.6% of them unmarried.
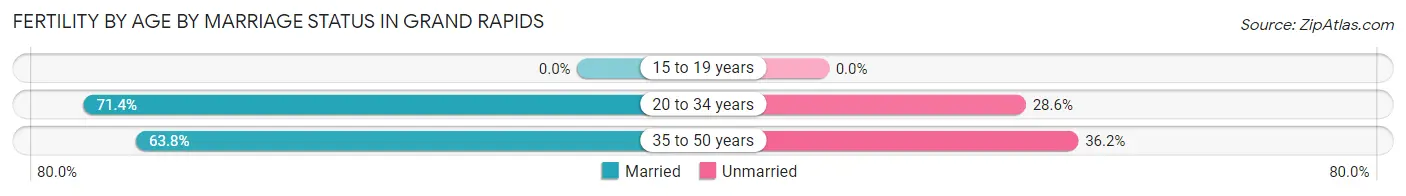
| Age Bracket | Married | Unmarried |
| 15 to 19 years | 0 (0.0%) | 0 (0.0%) |
| 20 to 34 years | 35 (71.4%) | 14 (28.6%) |
| 35 to 50 years | 30 (63.8%) | 17 (36.2%) |
| Total | 65 (67.7%) | 31 (32.3%) |
Fertility by Education in Grand Rapids
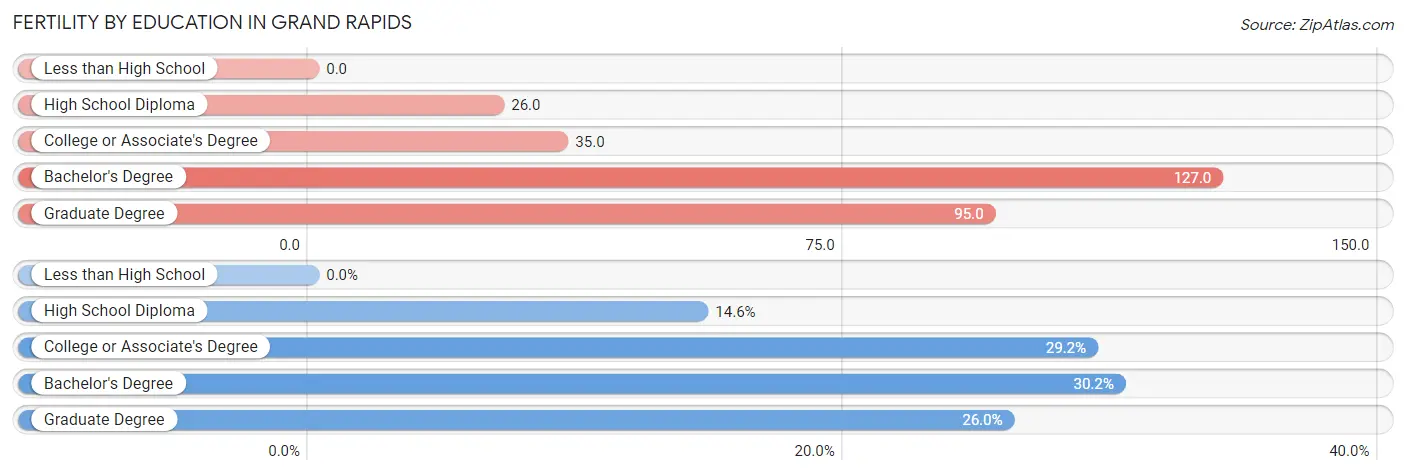
| Educational Attainment | Women with Births | Births / 1,000 Women |
| Less than High School | 0 (0.0%) | 0.0 |
| High School Diploma | 14 (14.6%) | 26.0 |
| College or Associate's Degree | 28 (29.2%) | 35.0 |
| Bachelor's Degree | 29 (30.2%) | 127.0 |
| Graduate Degree | 25 (26.0%) | 95.0 |
| Total | 96 (100.0%) | 45.0 |
Fertility by Education by Marriage Status in Grand Rapids
32.3% of women with births in Grand Rapids are unmarried. Women with the educational attainment of college or associate's degree are most likely to be married with 100.0% of them married at childbirth, while women with the educational attainment of high school diploma are least likely to be married with 100.0% of them unmarried at childbirth.
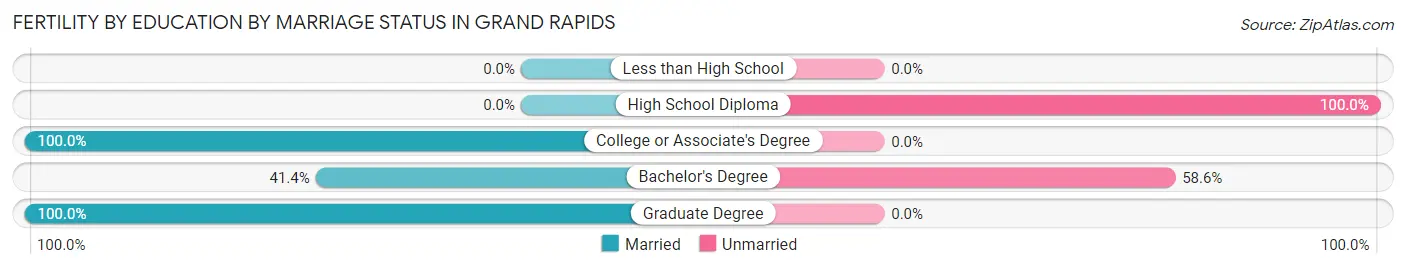
| Educational Attainment | Married | Unmarried |
| Less than High School | 0 (0.0%) | 0 (0.0%) |
| High School Diploma | 0 (0.0%) | 14 (100.0%) |
| College or Associate's Degree | 28 (100.0%) | 0 (0.0%) |
| Bachelor's Degree | 12 (41.4%) | 17 (58.6%) |
| Graduate Degree | 25 (100.0%) | 0 (0.0%) |
| Total | 65 (67.7%) | 31 (32.3%) |
Employment Characteristics in Grand Rapids
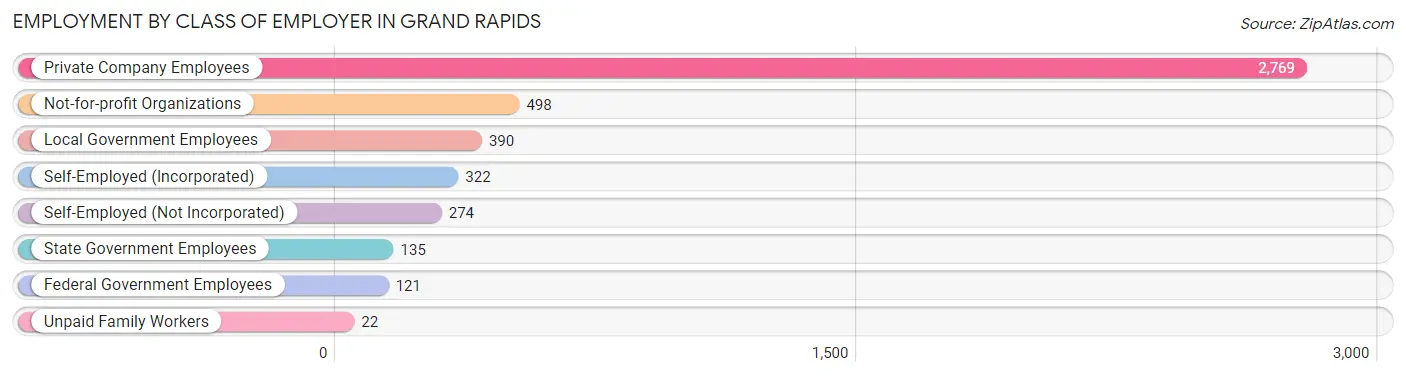
Employment by Class of Employer in Grand Rapids
Among the 4,531 employed individuals in Grand Rapids, private company employees (2,769 | 61.1%), not-for-profit organizations (498 | 11.0%), and local government employees (390 | 8.6%) make up the most common classes of employment.
| Employer Class | # Employees | % Employees |
| Private Company Employees | 2,769 | 61.1% |
| Self-Employed (Incorporated) | 322 | 7.1% |
| Self-Employed (Not Incorporated) | 274 | 6.0% |
| Not-for-profit Organizations | 498 | 11.0% |
| Local Government Employees | 390 | 8.6% |
| State Government Employees | 135 | 3.0% |
| Federal Government Employees | 121 | 2.7% |
| Unpaid Family Workers | 22 | 0.5% |
| Total | 4,531 | 100.0% |
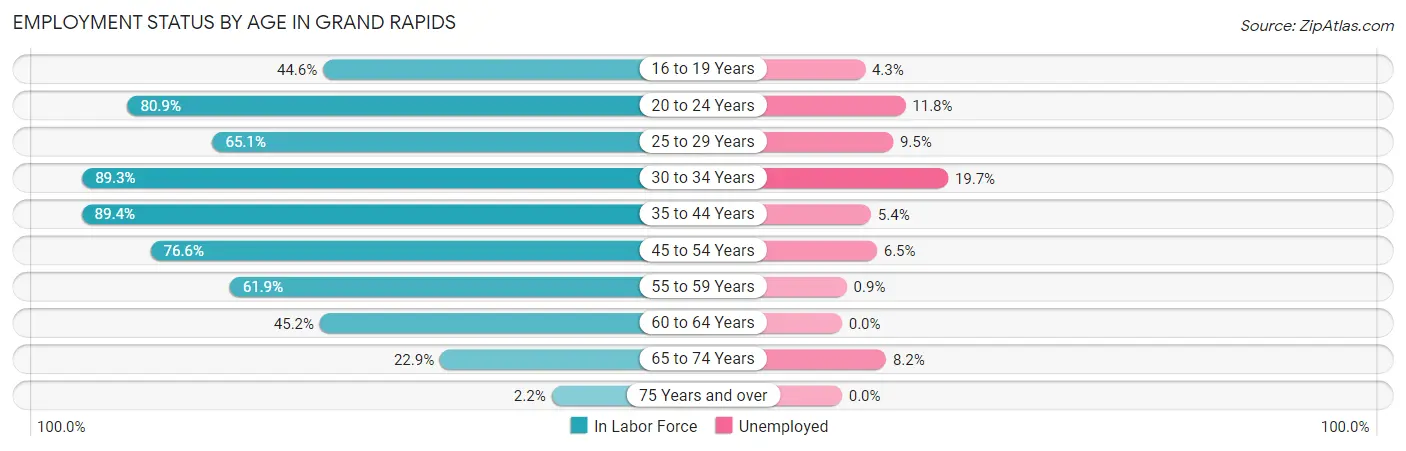
Employment Status by Age in Grand Rapids
According to the labor force statistics for Grand Rapids, out of the total population over 16 years of age (9,105), 54.4% or 4,953 individuals are in the labor force, with 7.1% or 352 of them unemployed. The age group with the highest labor force participation rate is 35 to 44 years, with 89.4% or 1,461 individuals in the labor force. Within the labor force, the 30 to 34 years age range has the highest percentage of unemployed individuals, with 19.7% or 104 of them being unemployed.
| Age Bracket | In Labor Force | Unemployed |
| 16 to 19 Years | 279 (44.6%) | 12 (4.3%) |
| 20 to 24 Years | 263 (80.9%) | 31 (11.8%) |
| 25 to 29 Years | 388 (65.1%) | 37 (9.5%) |
| 30 to 34 Years | 527 (89.3%) | 104 (19.7%) |
| 35 to 44 Years | 1,461 (89.4%) | 79 (5.4%) |
| 45 to 54 Years | 895 (76.6%) | 58 (6.5%) |
| 55 to 59 Years | 434 (61.9%) | 4 (0.9%) |
| 60 to 64 Years | 353 (45.2%) | 0 (0.0%) |
| 65 to 74 Years | 327 (22.9%) | 27 (8.2%) |
| 75 Years and over | 28 (2.2%) | 0 (0.0%) |
| Total | 4,953 (54.4%) | 352 (7.1%) |
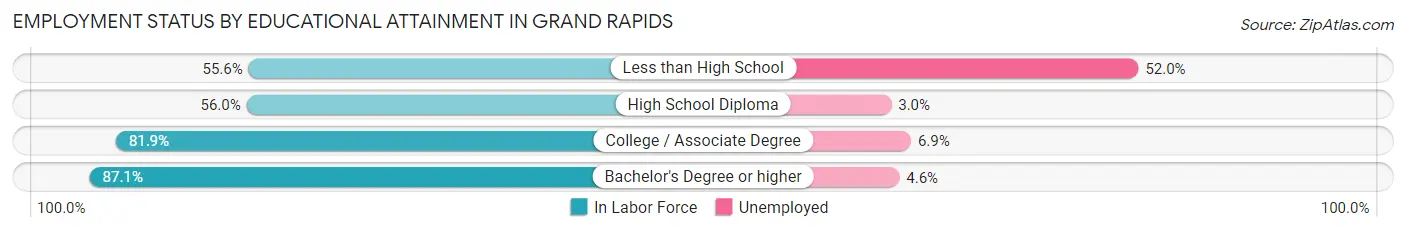
Employment Status by Educational Attainment in Grand Rapids
According to labor force statistics for Grand Rapids, 74.2% of individuals (4,059) out of the total population between 25 and 64 years of age (5,471) are in the labor force, with 6.9% or 280 of them being unemployed. The group with the highest labor force participation rate are those with the educational attainment of bachelor's degree or higher, with 87.1% or 1,317 individuals in the labor force. Within the labor force, individuals with less than high school education have the highest percentage of unemployment, with 52.0% or 78 of them being unemployed.
| Educational Attainment | In Labor Force | Unemployed |
| Less than High School | 150 (55.6%) | 140 (52.0%) |
| High School Diploma | 930 (56.0%) | 50 (3.0%) |
| College / Associate Degree | 1,661 (81.9%) | 140 (6.9%) |
| Bachelor's Degree or higher | 1,317 (87.1%) | 70 (4.6%) |
| Total | 4,059 (74.2%) | 377 (6.9%) |
Employment Occupations by Sex in Grand Rapids
Management, Business, Science and Arts Occupations
The most common Management, Business, Science and Arts occupations in Grand Rapids are Community & Social Service (504 | 11.0%), Management (323 | 7.0%), Health Diagnosing & Treating (322 | 7.0%), Health Technologists (284 | 6.2%), and Business & Financial (255 | 5.6%).
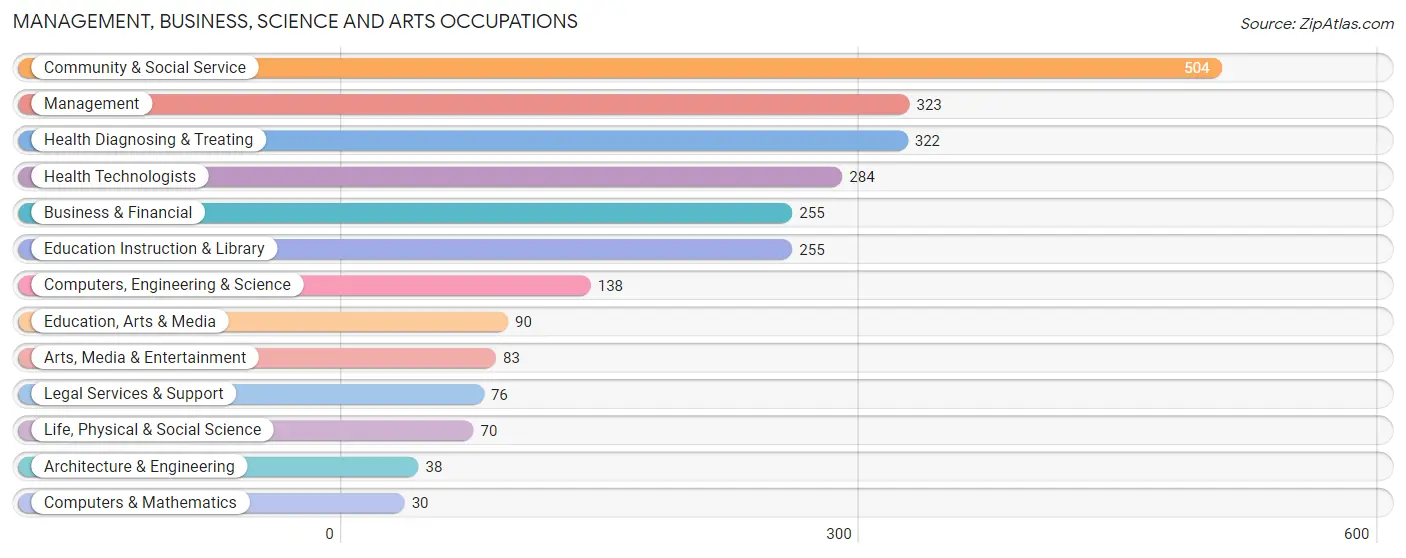
Management, Business, Science and Arts Occupations by Sex
Within the Management, Business, Science and Arts occupations in Grand Rapids, the most male-oriented occupations are Computers & Mathematics (100.0%), Life, Physical & Social Science (91.4%), and Computers, Engineering & Science (83.3%), while the most female-oriented occupations are Legal Services & Support (86.8%), Education Instruction & Library (83.5%), and Business & Financial (77.6%).
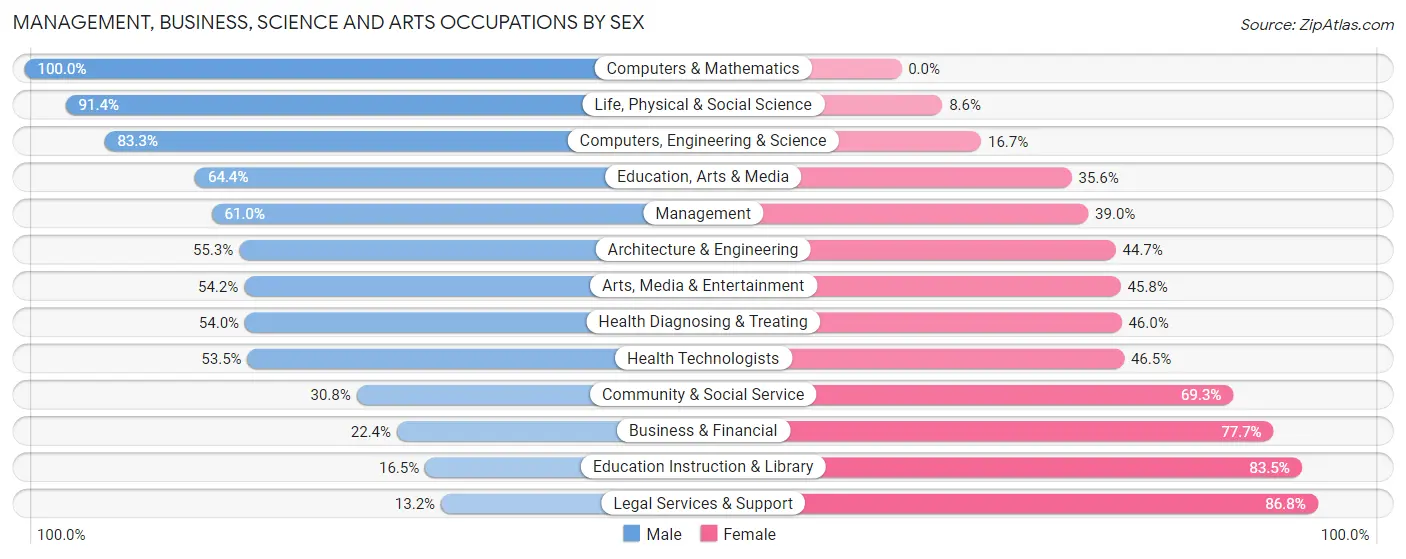
| Occupation | Male | Female |
| Management | 197 (61.0%) | 126 (39.0%) |
| Business & Financial | 57 (22.4%) | 198 (77.6%) |
| Computers, Engineering & Science | 115 (83.3%) | 23 (16.7%) |
| Computers & Mathematics | 30 (100.0%) | 0 (0.0%) |
| Architecture & Engineering | 21 (55.3%) | 17 (44.7%) |
| Life, Physical & Social Science | 64 (91.4%) | 6 (8.6%) |
| Community & Social Service | 155 (30.7%) | 349 (69.3%) |
| Education, Arts & Media | 58 (64.4%) | 32 (35.6%) |
| Legal Services & Support | 10 (13.2%) | 66 (86.8%) |
| Education Instruction & Library | 42 (16.5%) | 213 (83.5%) |
| Arts, Media & Entertainment | 45 (54.2%) | 38 (45.8%) |
| Health Diagnosing & Treating | 174 (54.0%) | 148 (46.0%) |
| Health Technologists | 152 (53.5%) | 132 (46.5%) |
| Total (Category) | 698 (45.3%) | 844 (54.7%) |
| Total (Overall) | 2,146 (46.7%) | 2,446 (53.3%) |
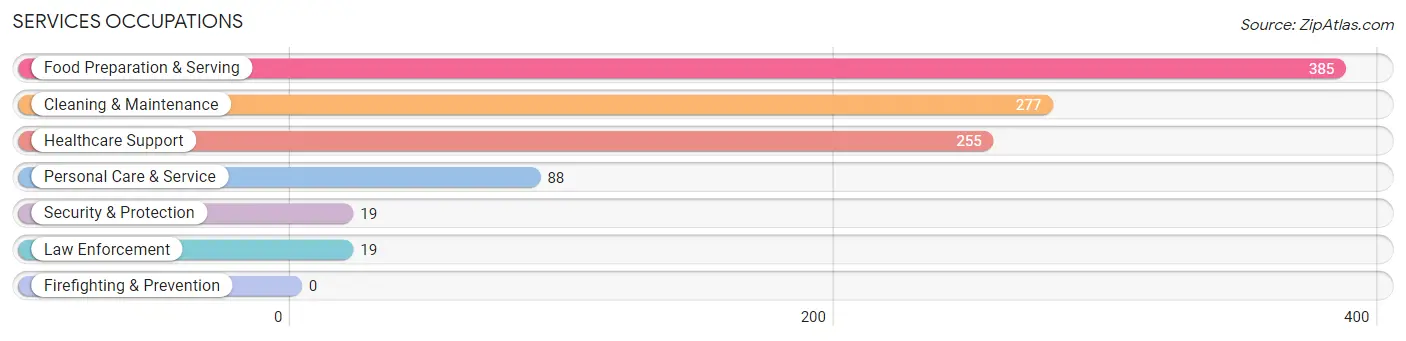
Services Occupations
The most common Services occupations in Grand Rapids are Food Preparation & Serving (385 | 8.4%), Cleaning & Maintenance (277 | 6.0%), Healthcare Support (255 | 5.6%), Personal Care & Service (88 | 1.9%), and Security & Protection (19 | 0.4%).
Services Occupations by Sex
Within the Services occupations in Grand Rapids, the most male-oriented occupations are Security & Protection (100.0%), Law Enforcement (100.0%), and Cleaning & Maintenance (48.0%), while the most female-oriented occupations are Healthcare Support (76.9%), Personal Care & Service (65.9%), and Food Preparation & Serving (52.7%).
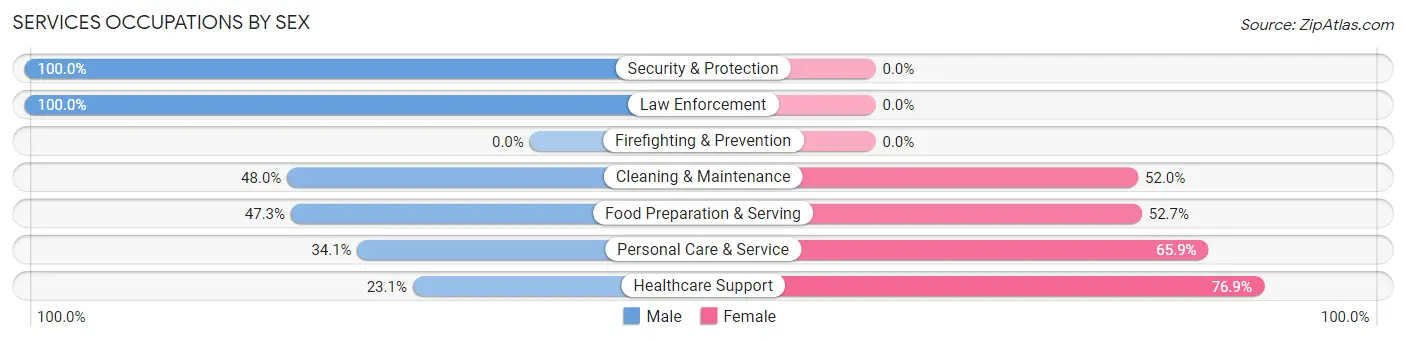
| Occupation | Male | Female |
| Healthcare Support | 59 (23.1%) | 196 (76.9%) |
| Security & Protection | 19 (100.0%) | 0 (0.0%) |
| Firefighting & Prevention | 0 (0.0%) | 0 (0.0%) |
| Law Enforcement | 19 (100.0%) | 0 (0.0%) |
| Food Preparation & Serving | 182 (47.3%) | 203 (52.7%) |
| Cleaning & Maintenance | 133 (48.0%) | 144 (52.0%) |
| Personal Care & Service | 30 (34.1%) | 58 (65.9%) |
| Total (Category) | 423 (41.3%) | 601 (58.7%) |
| Total (Overall) | 2,146 (46.7%) | 2,446 (53.3%) |
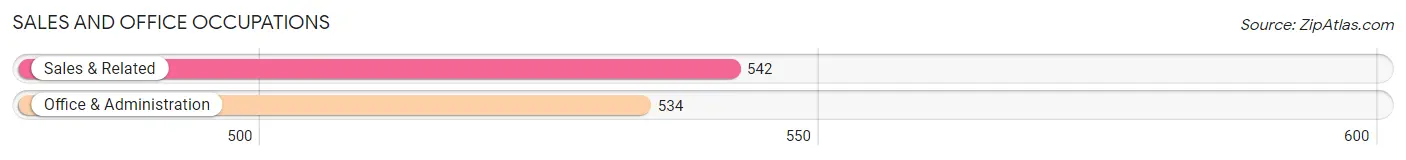
Sales and Office Occupations
The most common Sales and Office occupations in Grand Rapids are Sales & Related (542 | 11.8%), and Office & Administration (534 | 11.6%).
Sales and Office Occupations by Sex
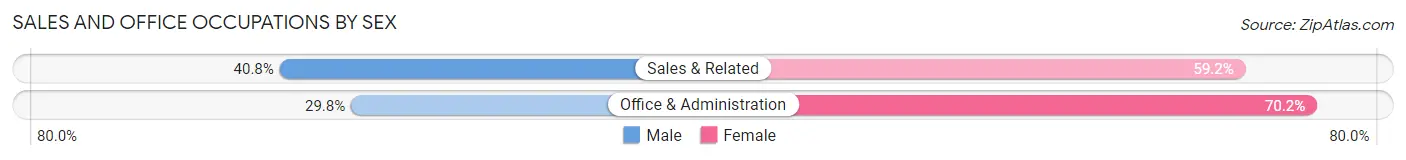
| Occupation | Male | Female |
| Sales & Related | 221 (40.8%) | 321 (59.2%) |
| Office & Administration | 159 (29.8%) | 375 (70.2%) |
| Total (Category) | 380 (35.3%) | 696 (64.7%) |
| Total (Overall) | 2,146 (46.7%) | 2,446 (53.3%) |
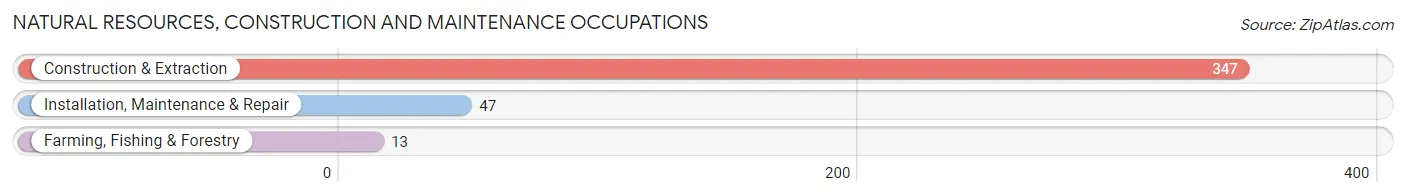
Natural Resources, Construction and Maintenance Occupations
The most common Natural Resources, Construction and Maintenance occupations in Grand Rapids are Construction & Extraction (347 | 7.6%), Installation, Maintenance & Repair (47 | 1.0%), and Farming, Fishing & Forestry (13 | 0.3%).
Natural Resources, Construction and Maintenance Occupations by Sex
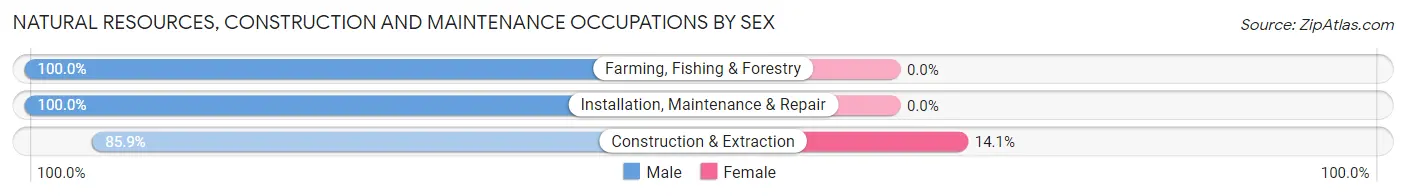
| Occupation | Male | Female |
| Farming, Fishing & Forestry | 13 (100.0%) | 0 (0.0%) |
| Construction & Extraction | 298 (85.9%) | 49 (14.1%) |
| Installation, Maintenance & Repair | 47 (100.0%) | 0 (0.0%) |
| Total (Category) | 358 (88.0%) | 49 (12.0%) |
| Total (Overall) | 2,146 (46.7%) | 2,446 (53.3%) |
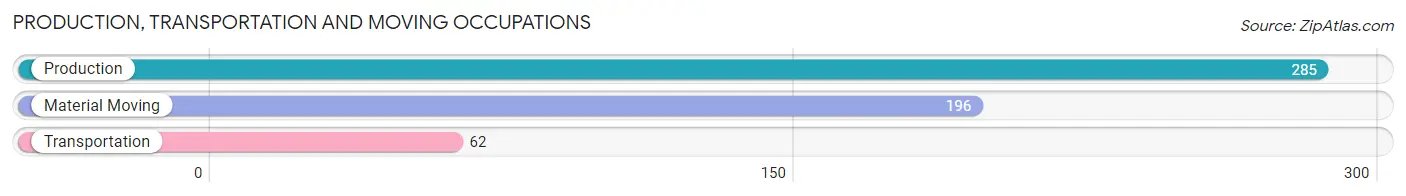
Production, Transportation and Moving Occupations
The most common Production, Transportation and Moving occupations in Grand Rapids are Production (285 | 6.2%), Material Moving (196 | 4.3%), and Transportation (62 | 1.3%).
Production, Transportation and Moving Occupations by Sex
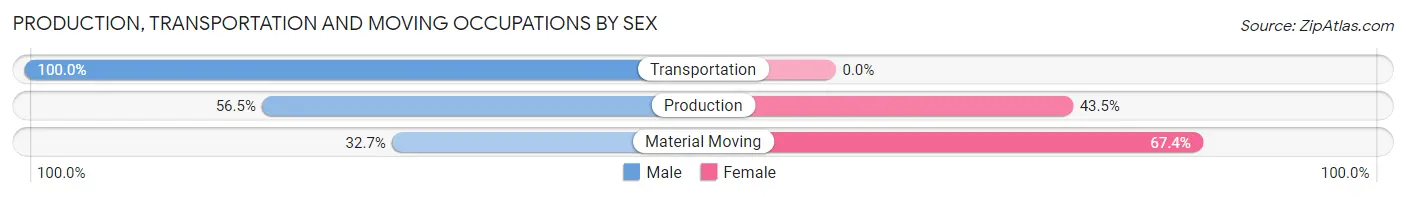
| Occupation | Male | Female |
| Production | 161 (56.5%) | 124 (43.5%) |
| Transportation | 62 (100.0%) | 0 (0.0%) |
| Material Moving | 64 (32.7%) | 132 (67.3%) |
| Total (Category) | 287 (52.8%) | 256 (47.1%) |
| Total (Overall) | 2,146 (46.7%) | 2,446 (53.3%) |
Employment Industries by Sex in Grand Rapids
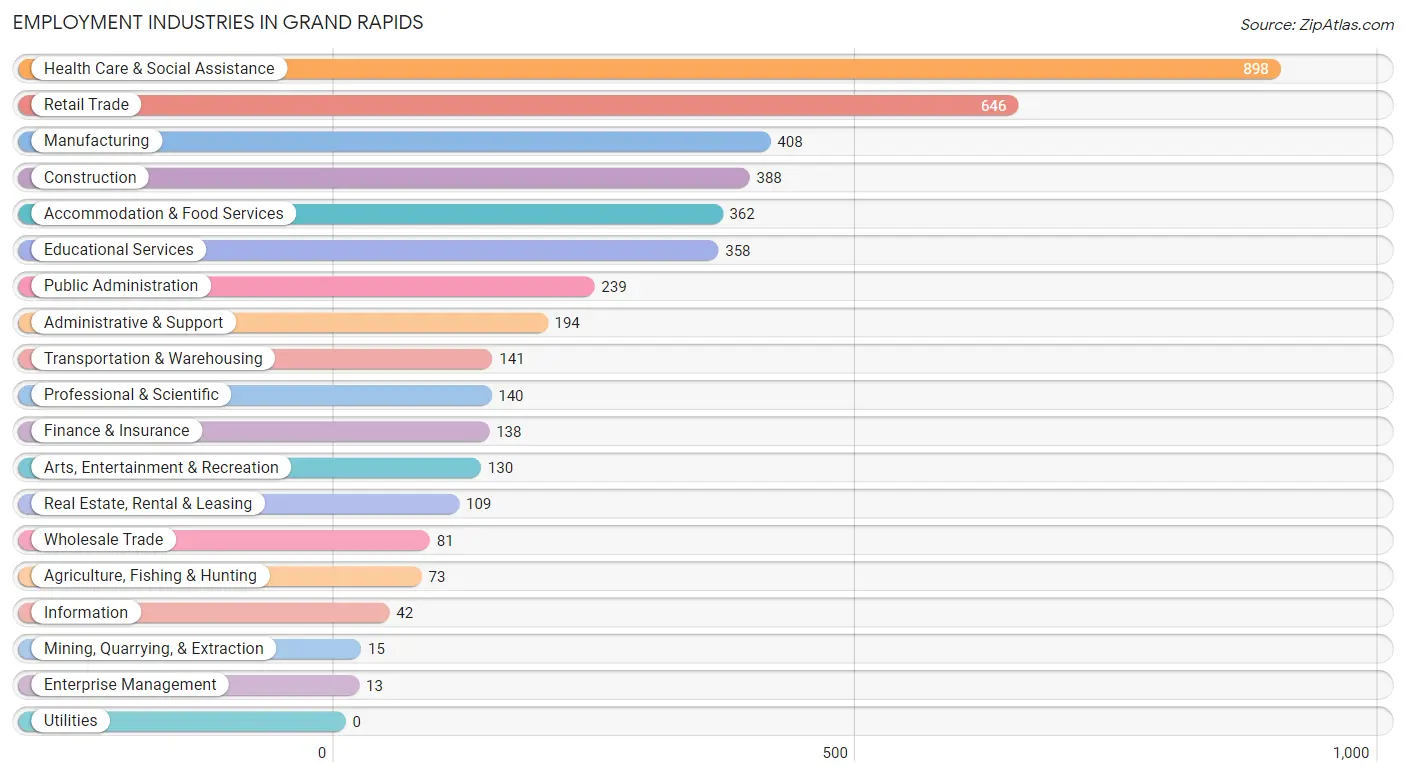
Employment Industries in Grand Rapids
The major employment industries in Grand Rapids include Health Care & Social Assistance (898 | 19.6%), Retail Trade (646 | 14.1%), Manufacturing (408 | 8.9%), Construction (388 | 8.5%), and Accommodation & Food Services (362 | 7.9%).
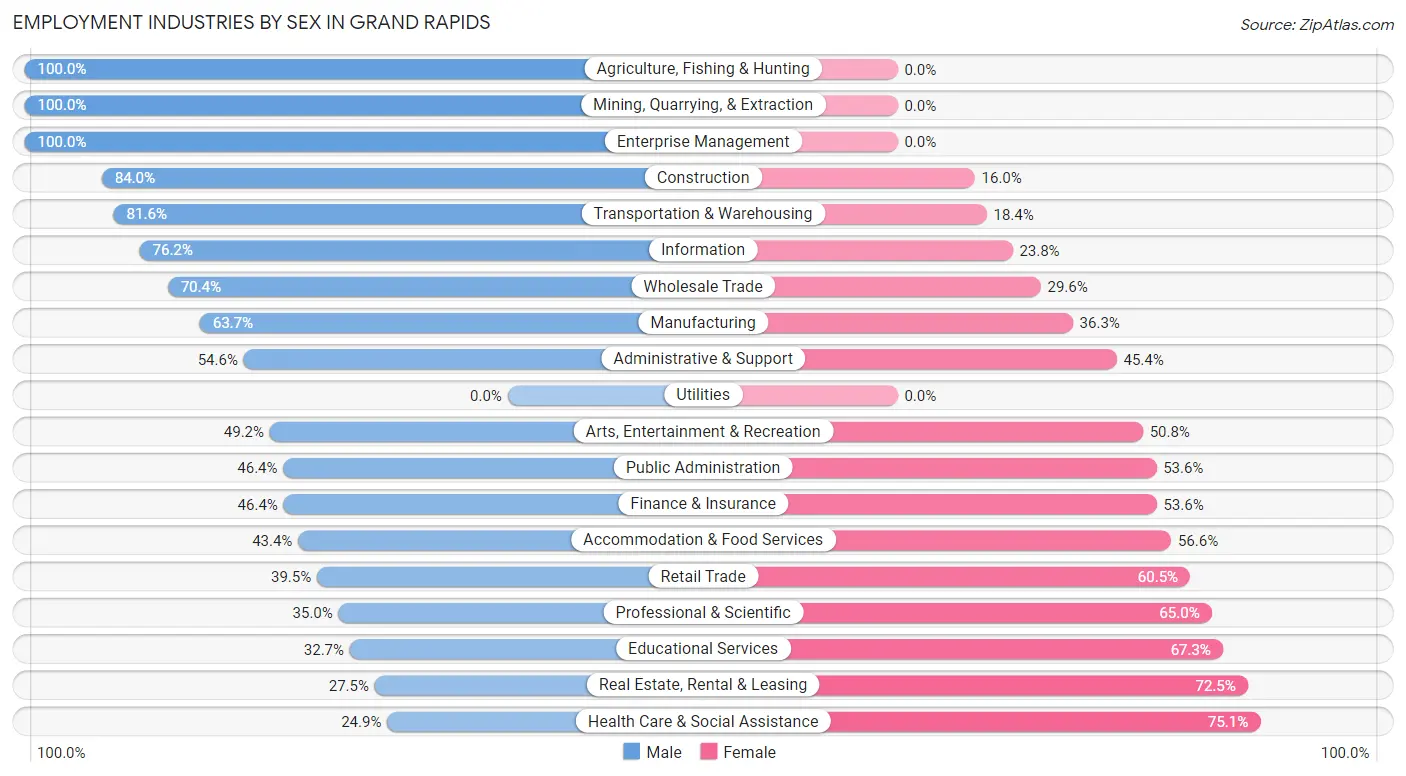
Employment Industries by Sex in Grand Rapids
The Grand Rapids industries that see more men than women are Agriculture, Fishing & Hunting (100.0%), Mining, Quarrying, & Extraction (100.0%), and Enterprise Management (100.0%), whereas the industries that tend to have a higher number of women are Health Care & Social Assistance (75.1%), Real Estate, Rental & Leasing (72.5%), and Educational Services (67.3%).
| Industry | Male | Female |
| Agriculture, Fishing & Hunting | 73 (100.0%) | 0 (0.0%) |
| Mining, Quarrying, & Extraction | 15 (100.0%) | 0 (0.0%) |
| Construction | 326 (84.0%) | 62 (16.0%) |
| Manufacturing | 260 (63.7%) | 148 (36.3%) |
| Wholesale Trade | 57 (70.4%) | 24 (29.6%) |
| Retail Trade | 255 (39.5%) | 391 (60.5%) |
| Transportation & Warehousing | 115 (81.6%) | 26 (18.4%) |
| Utilities | 0 (0.0%) | 0 (0.0%) |
| Information | 32 (76.2%) | 10 (23.8%) |
| Finance & Insurance | 64 (46.4%) | 74 (53.6%) |
| Real Estate, Rental & Leasing | 30 (27.5%) | 79 (72.5%) |
| Professional & Scientific | 49 (35.0%) | 91 (65.0%) |
| Enterprise Management | 13 (100.0%) | 0 (0.0%) |
| Administrative & Support | 106 (54.6%) | 88 (45.4%) |
| Educational Services | 117 (32.7%) | 241 (67.3%) |
| Health Care & Social Assistance | 224 (24.9%) | 674 (75.1%) |
| Arts, Entertainment & Recreation | 64 (49.2%) | 66 (50.8%) |
| Accommodation & Food Services | 157 (43.4%) | 205 (56.6%) |
| Public Administration | 111 (46.4%) | 128 (53.6%) |
| Total | 2,146 (46.7%) | 2,446 (53.3%) |
Education in Grand Rapids
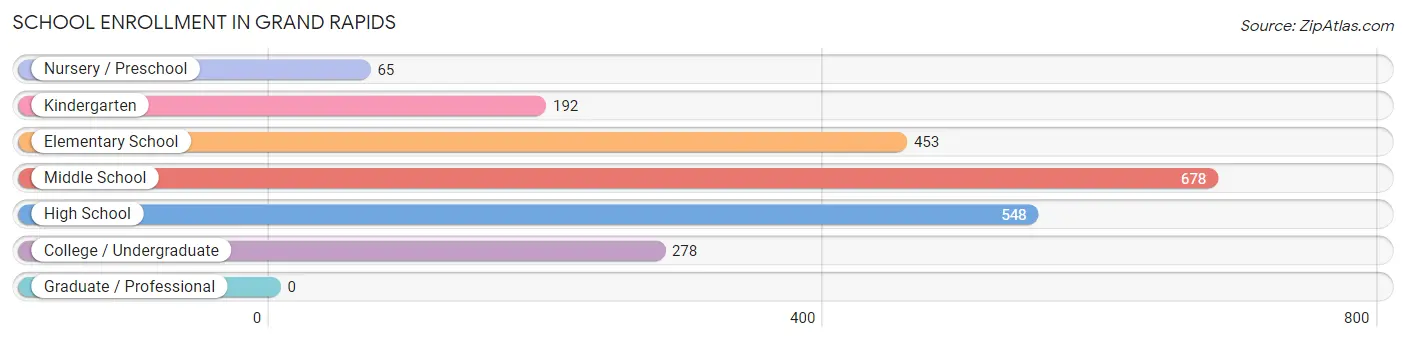
School Enrollment in Grand Rapids
The most common levels of schooling among the 2,214 students in Grand Rapids are middle school (678 | 30.6%), high school (548 | 24.7%), and elementary school (453 | 20.5%).
| School Level | # Students | % Students |
| Nursery / Preschool | 65 | 2.9% |
| Kindergarten | 192 | 8.7% |
| Elementary School | 453 | 20.5% |
| Middle School | 678 | 30.6% |
| High School | 548 | 24.7% |
| College / Undergraduate | 278 | 12.6% |
| Graduate / Professional | 0 | 0.0% |
| Total | 2,214 | 100.0% |
School Enrollment by Age by Funding Source in Grand Rapids
Out of a total of 2,214 students who are enrolled in schools in Grand Rapids, 237 (10.7%) attend a private institution, while the remaining 1,977 (89.3%) are enrolled in public schools. The age group of 35 years and over has the highest likelihood of being enrolled in private schools, with 15 (22.7% in the age bracket) enrolled. Conversely, the age group of 3 to 4 year olds has the lowest likelihood of being enrolled in a private school, with 33 (100.0% in the age bracket) attending a public institution.
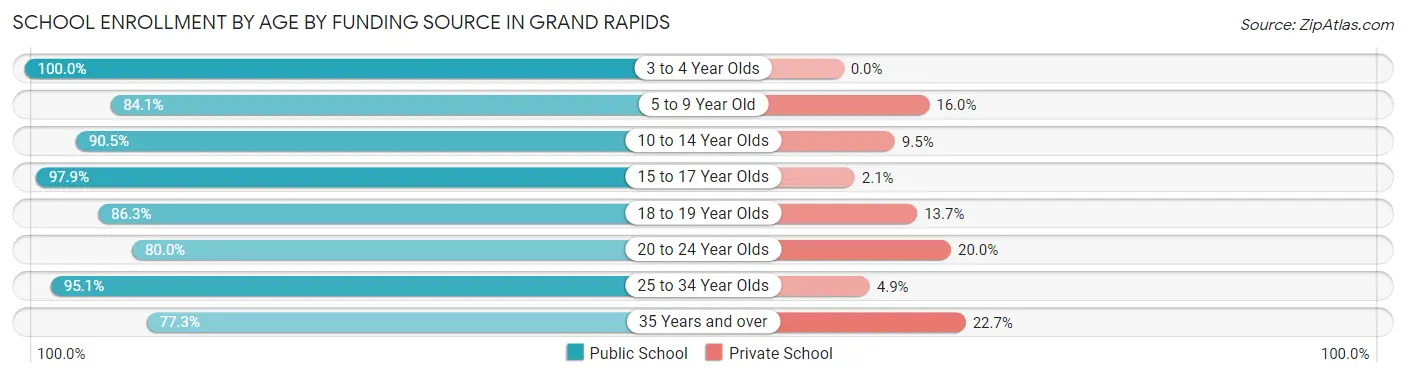
| Age Bracket | Public School | Private School |
| 3 to 4 Year Olds | 33 (100.0%) | 0 (0.0%) |
| 5 to 9 Year Old | 511 (84.1%) | 97 (16.0%) |
| 10 to 14 Year Olds | 645 (90.5%) | 68 (9.5%) |
| 15 to 17 Year Olds | 424 (97.9%) | 9 (2.1%) |
| 18 to 19 Year Olds | 233 (86.3%) | 37 (13.7%) |
| 20 to 24 Year Olds | 40 (80.0%) | 10 (20.0%) |
| 25 to 34 Year Olds | 39 (95.1%) | 2 (4.9%) |
| 35 Years and over | 51 (77.3%) | 15 (22.7%) |
| Total | 1,977 (89.3%) | 237 (10.7%) |
Educational Attainment by Field of Study in Grand Rapids
Education (679 | 27.1%), business (240 | 9.6%), science & technology (221 | 8.8%), visual & performing arts (219 | 8.7%), and bio, nature & agricultural (194 | 7.7%) are the most common fields of study among 2,504 individuals in Grand Rapids who have obtained a bachelor's degree or higher.
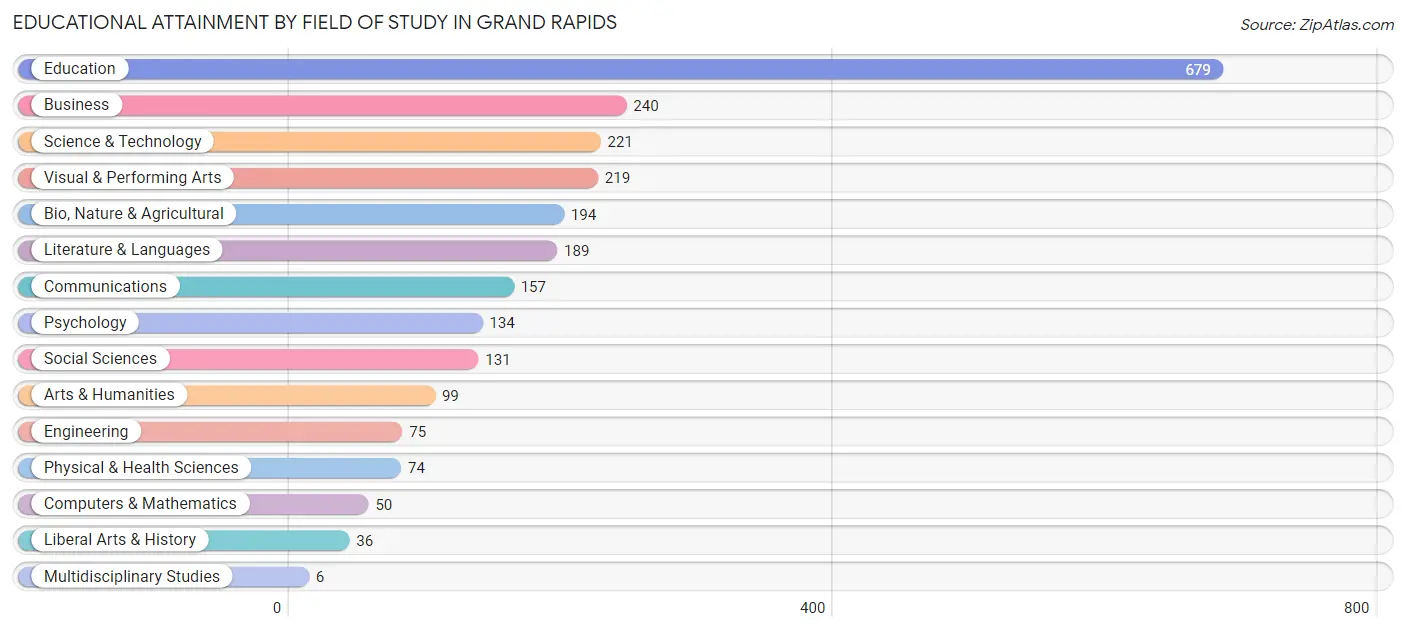
| Field of Study | # Graduates | % Graduates |
| Computers & Mathematics | 50 | 2.0% |
| Bio, Nature & Agricultural | 194 | 7.7% |
| Physical & Health Sciences | 74 | 3.0% |
| Psychology | 134 | 5.3% |
| Social Sciences | 131 | 5.2% |
| Engineering | 75 | 3.0% |
| Multidisciplinary Studies | 6 | 0.2% |
| Science & Technology | 221 | 8.8% |
| Business | 240 | 9.6% |
| Education | 679 | 27.1% |
| Literature & Languages | 189 | 7.5% |
| Liberal Arts & History | 36 | 1.4% |
| Visual & Performing Arts | 219 | 8.7% |
| Communications | 157 | 6.3% |
| Arts & Humanities | 99 | 4.0% |
| Total | 2,504 | 100.0% |
Transportation & Commute in Grand Rapids
Vehicle Availability by Sex in Grand Rapids
The most prevalent vehicle ownership categories in Grand Rapids are males with 2 vehicles (891, accounting for 42.8%) and females with 2 vehicles (1,090, making up 37.5%).
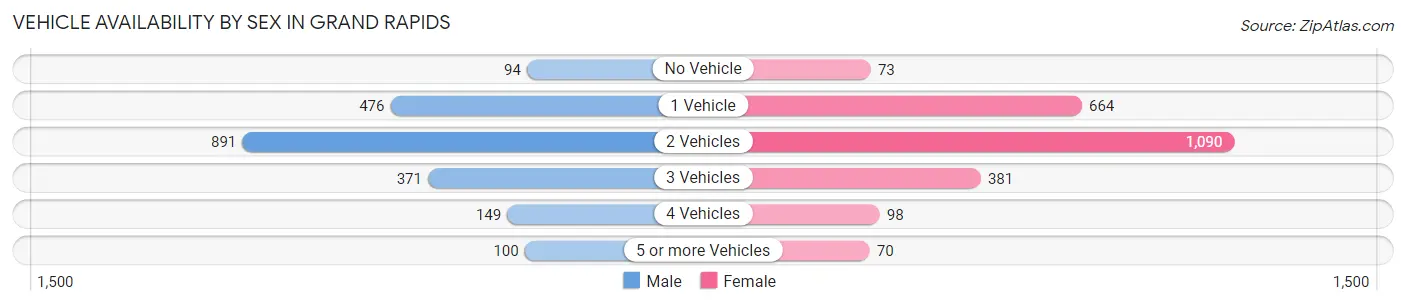
| Vehicles Available | Male | Female |
| No Vehicle | 94 (4.5%) | 73 (3.1%) |
| 1 Vehicle | 476 (22.9%) | 664 (28.0%) |
| 2 Vehicles | 891 (42.8%) | 1,090 (45.9%) |
| 3 Vehicles | 371 (17.8%) | 381 (16.0%) |
| 4 Vehicles | 149 (7.2%) | 98 (4.1%) |
| 5 or more Vehicles | 100 (4.8%) | 70 (2.9%) |
| Total | 2,081 (100.0%) | 2,376 (100.0%) |
Commute Time in Grand Rapids
The most frequently occuring commute durations in Grand Rapids are 5 to 9 minutes (1,427 commuters, 34.9%), 10 to 14 minutes (1,130 commuters, 27.6%), and 15 to 19 minutes (388 commuters, 9.5%).
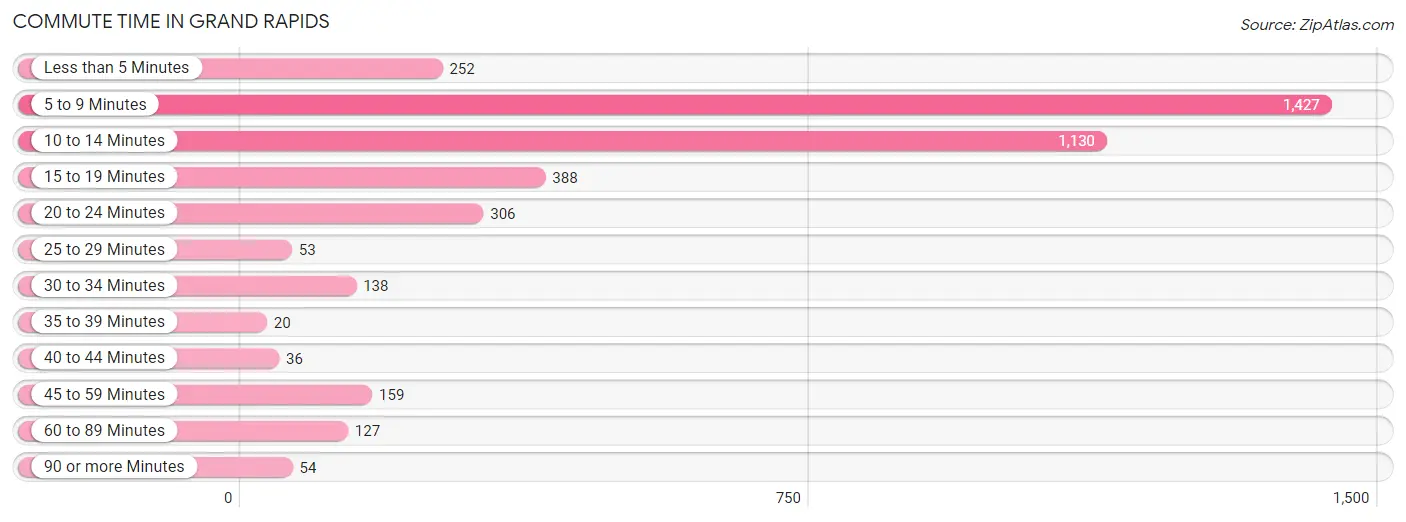
| Commute Time | # Commuters | % Commuters |
| Less than 5 Minutes | 252 | 6.2% |
| 5 to 9 Minutes | 1,427 | 34.9% |
| 10 to 14 Minutes | 1,130 | 27.6% |
| 15 to 19 Minutes | 388 | 9.5% |
| 20 to 24 Minutes | 306 | 7.5% |
| 25 to 29 Minutes | 53 | 1.3% |
| 30 to 34 Minutes | 138 | 3.4% |
| 35 to 39 Minutes | 20 | 0.5% |
| 40 to 44 Minutes | 36 | 0.9% |
| 45 to 59 Minutes | 159 | 3.9% |
| 60 to 89 Minutes | 127 | 3.1% |
| 90 or more Minutes | 54 | 1.3% |
Commute Time by Sex in Grand Rapids
The most common commute times in Grand Rapids are 5 to 9 minutes (635 commuters, 31.9%) for males and 5 to 9 minutes (792 commuters, 37.8%) for females.
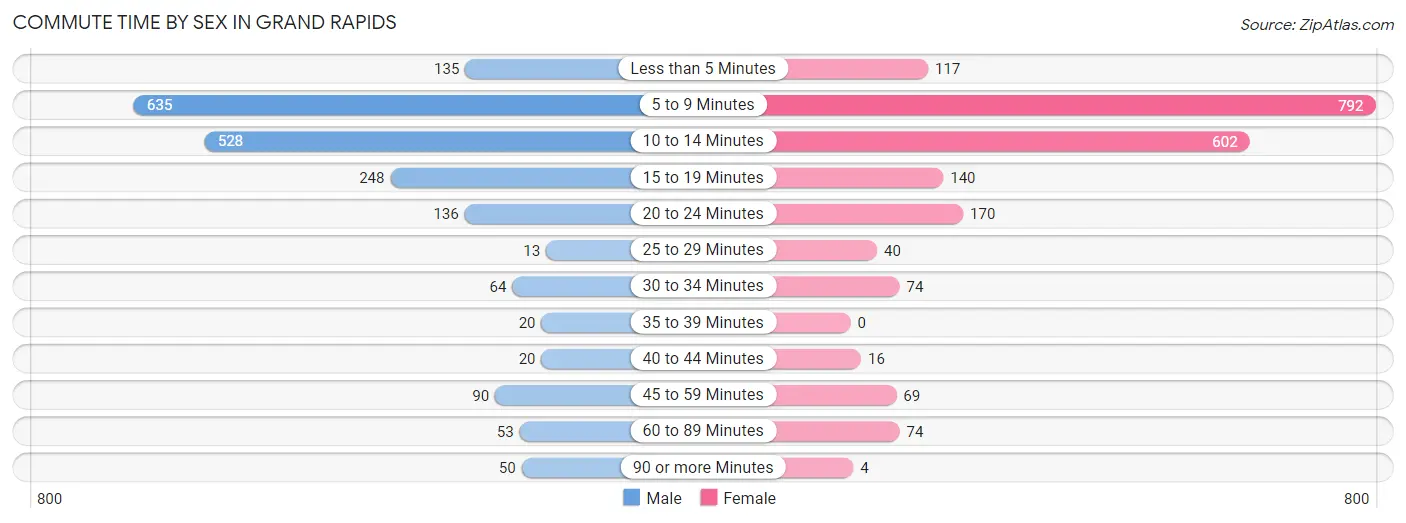
| Commute Time | Male | Female |
| Less than 5 Minutes | 135 (6.8%) | 117 (5.6%) |
| 5 to 9 Minutes | 635 (31.9%) | 792 (37.8%) |
| 10 to 14 Minutes | 528 (26.5%) | 602 (28.7%) |
| 15 to 19 Minutes | 248 (12.4%) | 140 (6.7%) |
| 20 to 24 Minutes | 136 (6.8%) | 170 (8.1%) |
| 25 to 29 Minutes | 13 (0.6%) | 40 (1.9%) |
| 30 to 34 Minutes | 64 (3.2%) | 74 (3.5%) |
| 35 to 39 Minutes | 20 (1.0%) | 0 (0.0%) |
| 40 to 44 Minutes | 20 (1.0%) | 16 (0.8%) |
| 45 to 59 Minutes | 90 (4.5%) | 69 (3.3%) |
| 60 to 89 Minutes | 53 (2.7%) | 74 (3.5%) |
| 90 or more Minutes | 50 (2.5%) | 4 (0.2%) |
Time of Departure to Work by Sex in Grand Rapids
The most frequent times of departure to work in Grand Rapids are 7:30 AM to 7:59 AM (259, 13.0%) for males and 7:30 AM to 7:59 AM (470, 22.4%) for females.
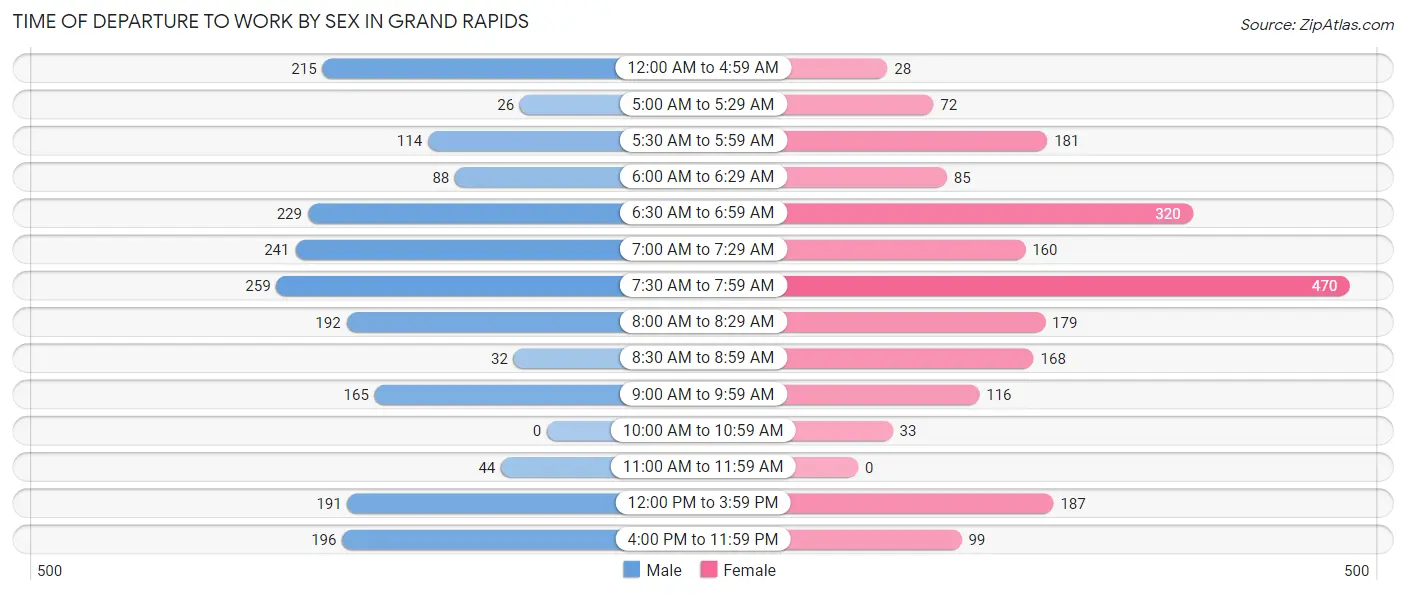
| Time of Departure | Male | Female |
| 12:00 AM to 4:59 AM | 215 (10.8%) | 28 (1.3%) |
| 5:00 AM to 5:29 AM | 26 (1.3%) | 72 (3.4%) |
| 5:30 AM to 5:59 AM | 114 (5.7%) | 181 (8.6%) |
| 6:00 AM to 6:29 AM | 88 (4.4%) | 85 (4.1%) |
| 6:30 AM to 6:59 AM | 229 (11.5%) | 320 (15.2%) |
| 7:00 AM to 7:29 AM | 241 (12.1%) | 160 (7.6%) |
| 7:30 AM to 7:59 AM | 259 (13.0%) | 470 (22.4%) |
| 8:00 AM to 8:29 AM | 192 (9.6%) | 179 (8.5%) |
| 8:30 AM to 8:59 AM | 32 (1.6%) | 168 (8.0%) |
| 9:00 AM to 9:59 AM | 165 (8.3%) | 116 (5.5%) |
| 10:00 AM to 10:59 AM | 0 (0.0%) | 33 (1.6%) |
| 11:00 AM to 11:59 AM | 44 (2.2%) | 0 (0.0%) |
| 12:00 PM to 3:59 PM | 191 (9.6%) | 187 (8.9%) |
| 4:00 PM to 11:59 PM | 196 (9.8%) | 99 (4.7%) |
| Total | 1,992 (100.0%) | 2,098 (100.0%) |
Housing Occupancy in Grand Rapids
Occupancy by Ownership in Grand Rapids
Of the total 4,618 dwellings in Grand Rapids, owner-occupied units account for 2,828 (61.2%), while renter-occupied units make up 1,790 (38.8%).
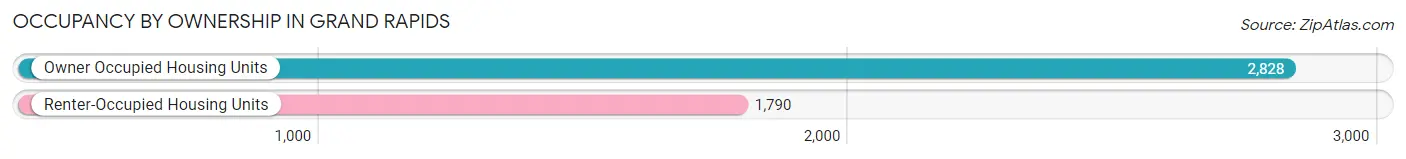
| Occupancy | # Housing Units | % Housing Units |
| Owner Occupied Housing Units | 2,828 | 61.2% |
| Renter-Occupied Housing Units | 1,790 | 38.8% |
| Total Occupied Housing Units | 4,618 | 100.0% |
Occupancy by Household Size in Grand Rapids
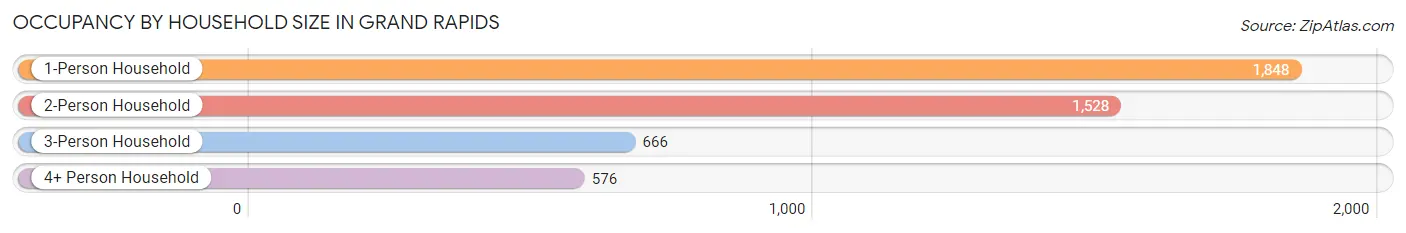
| Household Size | # Housing Units | % Housing Units |
| 1-Person Household | 1,848 | 40.0% |
| 2-Person Household | 1,528 | 33.1% |
| 3-Person Household | 666 | 14.4% |
| 4+ Person Household | 576 | 12.5% |
| Total Housing Units | 4,618 | 100.0% |
Occupancy by Ownership by Household Size in Grand Rapids
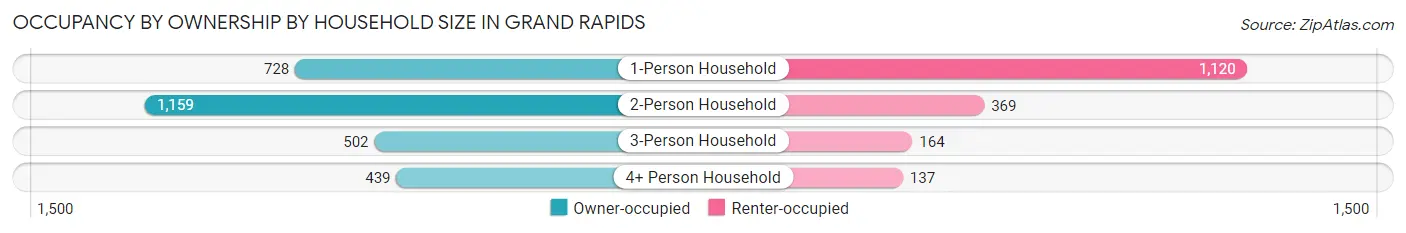
| Household Size | Owner-occupied | Renter-occupied |
| 1-Person Household | 728 (39.4%) | 1,120 (60.6%) |
| 2-Person Household | 1,159 (75.8%) | 369 (24.1%) |
| 3-Person Household | 502 (75.4%) | 164 (24.6%) |
| 4+ Person Household | 439 (76.2%) | 137 (23.8%) |
| Total Housing Units | 2,828 (61.2%) | 1,790 (38.8%) |
Occupancy by Educational Attainment in Grand Rapids
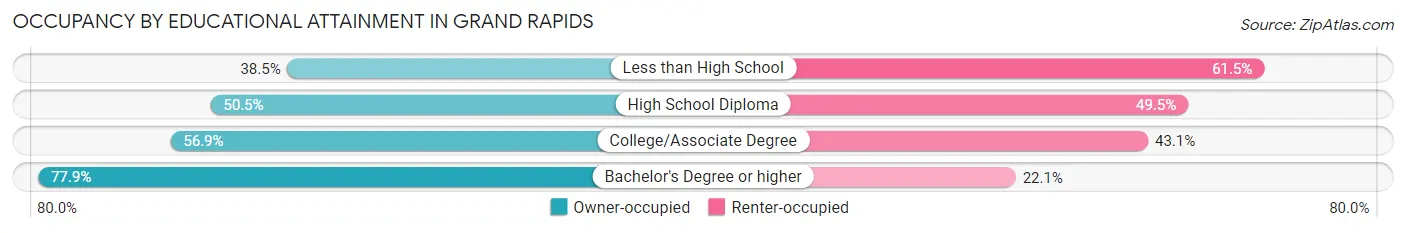
| Household Size | Owner-occupied | Renter-occupied |
| Less than High School | 30 (38.5%) | 48 (61.5%) |
| High School Diploma | 616 (50.5%) | 603 (49.5%) |
| College/Associate Degree | 1,095 (56.9%) | 830 (43.1%) |
| Bachelor's Degree or higher | 1,087 (77.9%) | 309 (22.1%) |
Occupancy by Age of Householder in Grand Rapids
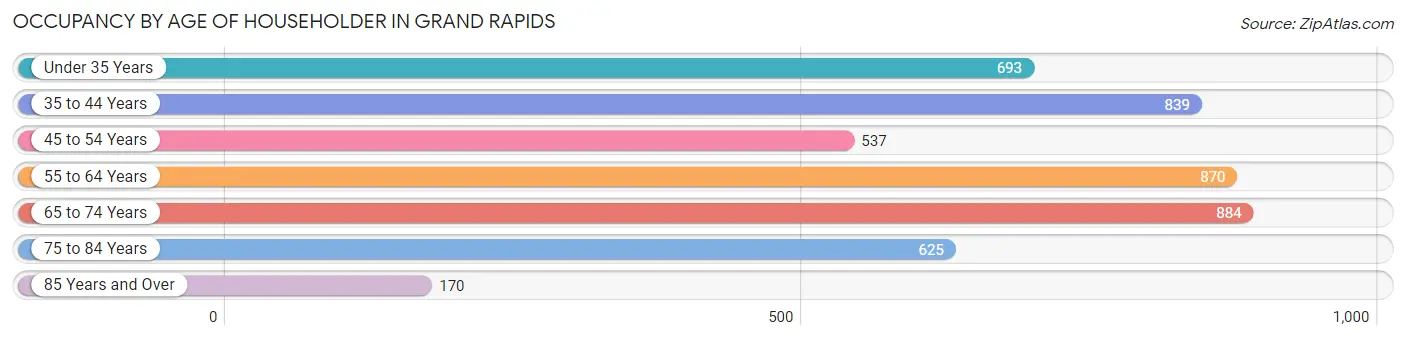
| Age Bracket | # Households | % Households |
| Under 35 Years | 693 | 15.0% |
| 35 to 44 Years | 839 | 18.2% |
| 45 to 54 Years | 537 | 11.6% |
| 55 to 64 Years | 870 | 18.8% |
| 65 to 74 Years | 884 | 19.1% |
| 75 to 84 Years | 625 | 13.5% |
| 85 Years and Over | 170 | 3.7% |
| Total | 4,618 | 100.0% |
Housing Finances in Grand Rapids
Median Income by Occupancy in Grand Rapids
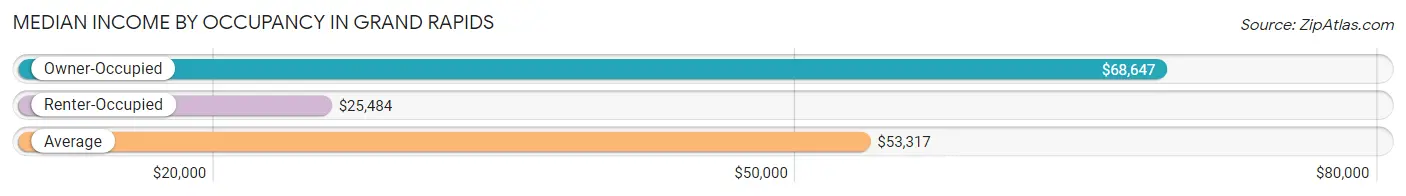
| Occupancy Type | # Households | Median Income |
| Owner-Occupied | 2,828 (61.2%) | $68,647 |
| Renter-Occupied | 1,790 (38.8%) | $25,484 |
| Average | 4,618 (100.0%) | $53,317 |
Occupancy by Householder Income Bracket in Grand Rapids
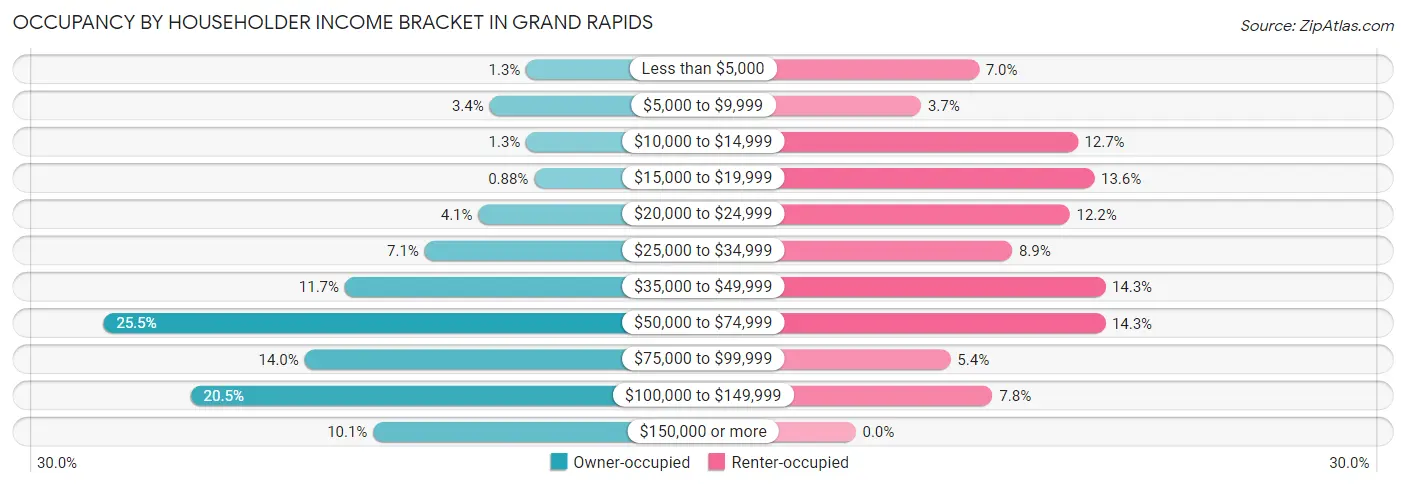
| Income Bracket | Owner-occupied | Renter-occupied |
| Less than $5,000 | 38 (1.3%) | 126 (7.0%) |
| $5,000 to $9,999 | 97 (3.4%) | 67 (3.7%) |
| $10,000 to $14,999 | 38 (1.3%) | 227 (12.7%) |
| $15,000 to $19,999 | 25 (0.9%) | 244 (13.6%) |
| $20,000 to $24,999 | 115 (4.1%) | 219 (12.2%) |
| $25,000 to $34,999 | 202 (7.1%) | 160 (8.9%) |
| $35,000 to $49,999 | 331 (11.7%) | 255 (14.2%) |
| $50,000 to $74,999 | 721 (25.5%) | 255 (14.2%) |
| $75,000 to $99,999 | 396 (14.0%) | 97 (5.4%) |
| $100,000 to $149,999 | 580 (20.5%) | 140 (7.8%) |
| $150,000 or more | 285 (10.1%) | 0 (0.0%) |
| Total | 2,828 (100.0%) | 1,790 (100.0%) |
Monthly Housing Cost Tiers in Grand Rapids
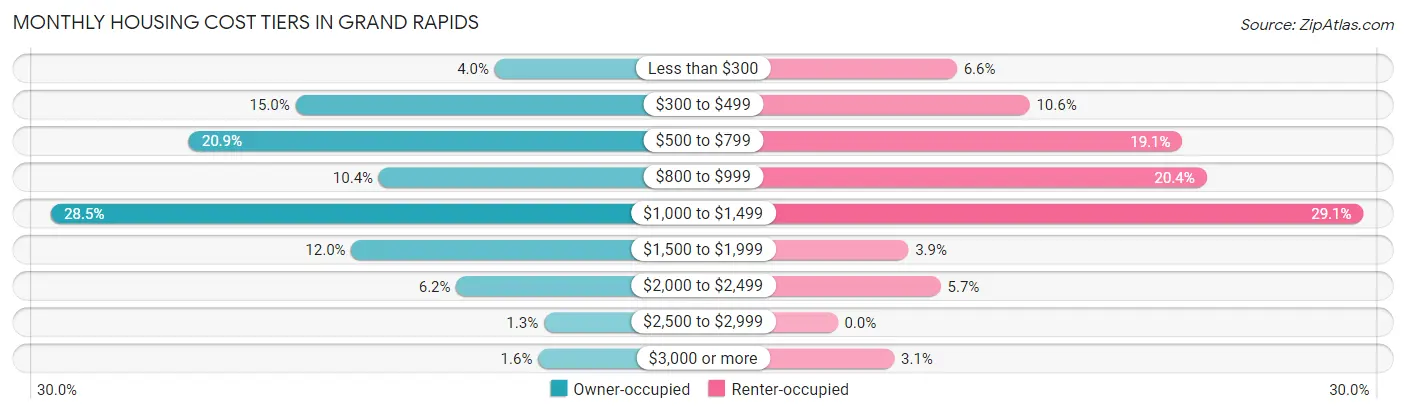
| Monthly Cost | Owner-occupied | Renter-occupied |
| Less than $300 | 114 (4.0%) | 118 (6.6%) |
| $300 to $499 | 425 (15.0%) | 190 (10.6%) |
| $500 to $799 | 592 (20.9%) | 341 (19.1%) |
| $800 to $999 | 295 (10.4%) | 365 (20.4%) |
| $1,000 to $1,499 | 807 (28.5%) | 520 (29.0%) |
| $1,500 to $1,999 | 338 (11.9%) | 70 (3.9%) |
| $2,000 to $2,499 | 174 (6.1%) | 102 (5.7%) |
| $2,500 to $2,999 | 37 (1.3%) | 0 (0.0%) |
| $3,000 or more | 46 (1.6%) | 56 (3.1%) |
| Total | 2,828 (100.0%) | 1,790 (100.0%) |
Physical Housing Characteristics in Grand Rapids
Housing Structures in Grand Rapids
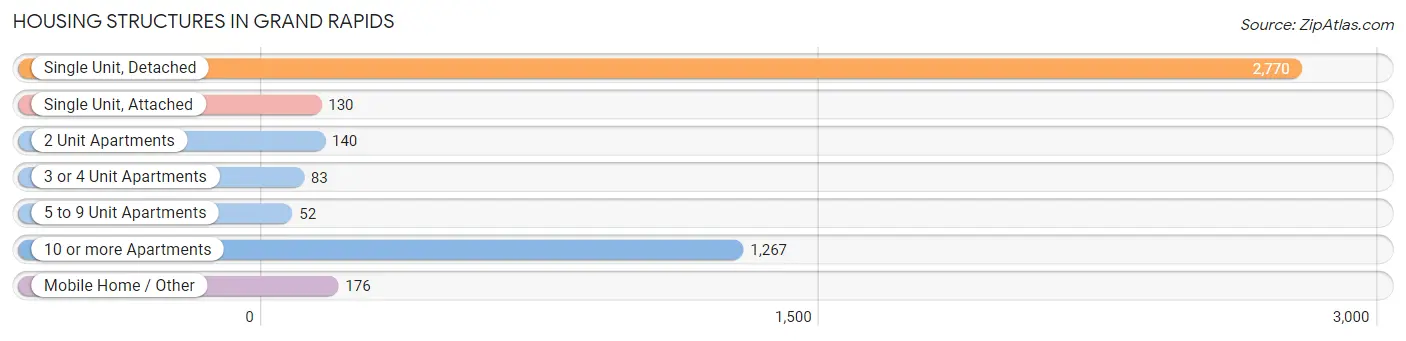
| Structure Type | # Housing Units | % Housing Units |
| Single Unit, Detached | 2,770 | 60.0% |
| Single Unit, Attached | 130 | 2.8% |
| 2 Unit Apartments | 140 | 3.0% |
| 3 or 4 Unit Apartments | 83 | 1.8% |
| 5 to 9 Unit Apartments | 52 | 1.1% |
| 10 or more Apartments | 1,267 | 27.4% |
| Mobile Home / Other | 176 | 3.8% |
| Total | 4,618 | 100.0% |
Housing Structures by Occupancy in Grand Rapids
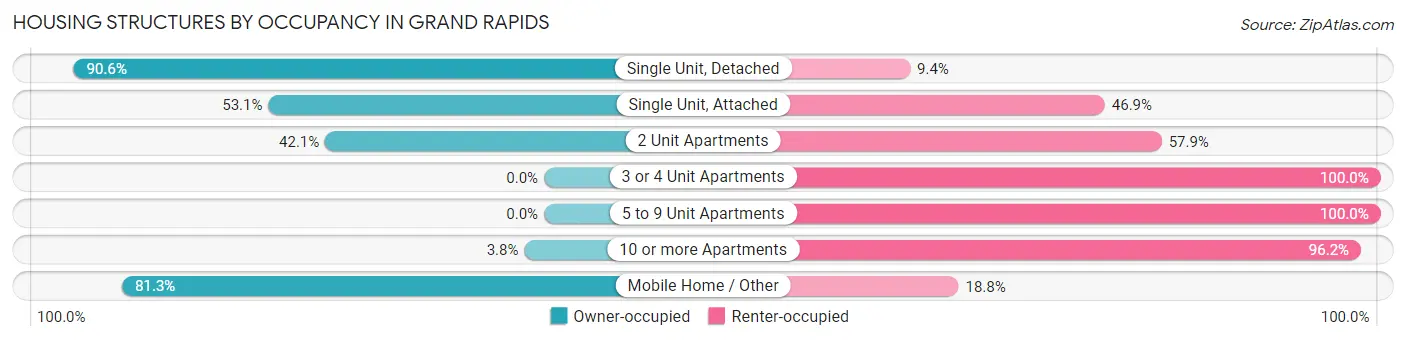
| Structure Type | Owner-occupied | Renter-occupied |
| Single Unit, Detached | 2,509 (90.6%) | 261 (9.4%) |
| Single Unit, Attached | 69 (53.1%) | 61 (46.9%) |
| 2 Unit Apartments | 59 (42.1%) | 81 (57.9%) |
| 3 or 4 Unit Apartments | 0 (0.0%) | 83 (100.0%) |
| 5 to 9 Unit Apartments | 0 (0.0%) | 52 (100.0%) |
| 10 or more Apartments | 48 (3.8%) | 1,219 (96.2%) |
| Mobile Home / Other | 143 (81.2%) | 33 (18.8%) |
| Total | 2,828 (61.2%) | 1,790 (38.8%) |
Housing Structures by Number of Rooms in Grand Rapids
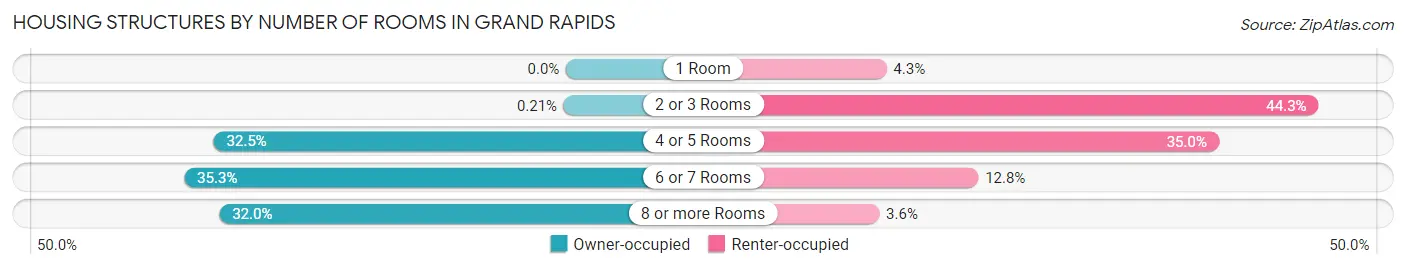
| Number of Rooms | Owner-occupied | Renter-occupied |
| 1 Room | 0 (0.0%) | 77 (4.3%) |
| 2 or 3 Rooms | 6 (0.2%) | 792 (44.3%) |
| 4 or 5 Rooms | 920 (32.5%) | 627 (35.0%) |
| 6 or 7 Rooms | 997 (35.2%) | 229 (12.8%) |
| 8 or more Rooms | 905 (32.0%) | 65 (3.6%) |
| Total | 2,828 (100.0%) | 1,790 (100.0%) |
Housing Structure by Heating Type in Grand Rapids
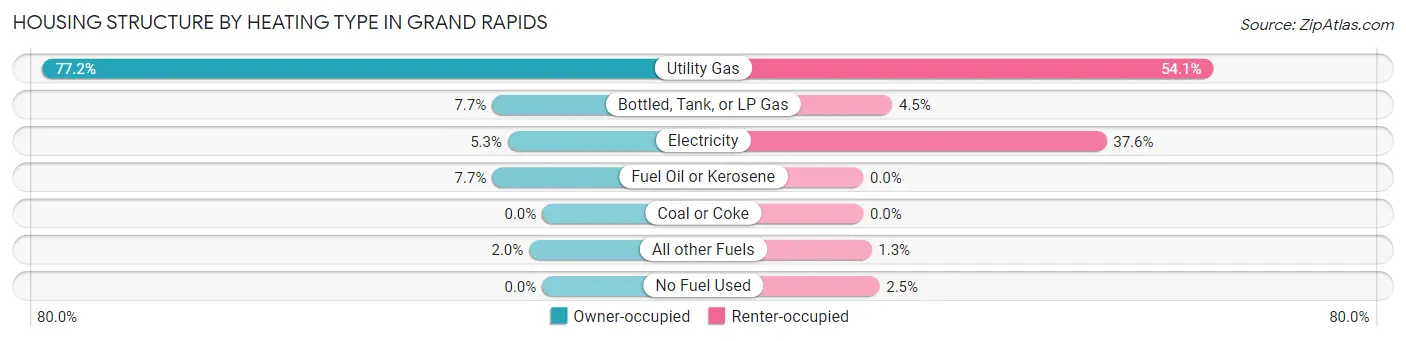
| Heating Type | Owner-occupied | Renter-occupied |
| Utility Gas | 2,184 (77.2%) | 969 (54.1%) |
| Bottled, Tank, or LP Gas | 219 (7.7%) | 80 (4.5%) |
| Electricity | 150 (5.3%) | 673 (37.6%) |
| Fuel Oil or Kerosene | 218 (7.7%) | 0 (0.0%) |
| Coal or Coke | 0 (0.0%) | 0 (0.0%) |
| All other Fuels | 57 (2.0%) | 23 (1.3%) |
| No Fuel Used | 0 (0.0%) | 45 (2.5%) |
| Total | 2,828 (100.0%) | 1,790 (100.0%) |
Household Vehicle Usage in Grand Rapids
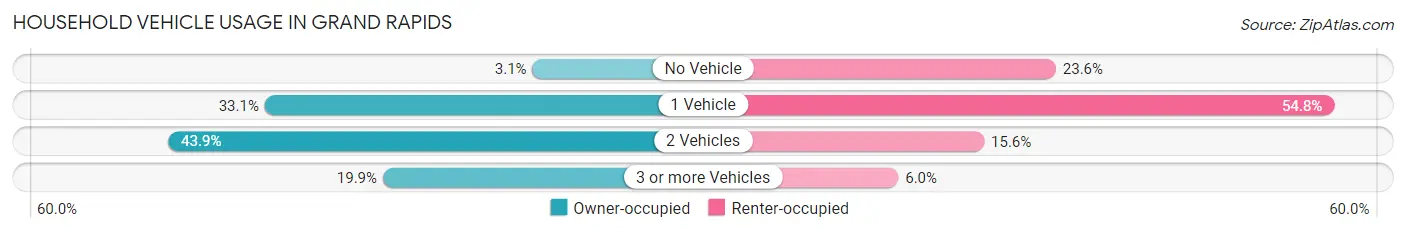
| Vehicles per Household | Owner-occupied | Renter-occupied |
| No Vehicle | 88 (3.1%) | 423 (23.6%) |
| 1 Vehicle | 936 (33.1%) | 981 (54.8%) |
| 2 Vehicles | 1,242 (43.9%) | 279 (15.6%) |
| 3 or more Vehicles | 562 (19.9%) | 107 (6.0%) |
| Total | 2,828 (100.0%) | 1,790 (100.0%) |
Real Estate & Mortgages in Grand Rapids
Real Estate and Mortgage Overview in Grand Rapids
| Characteristic | Without Mortgage | With Mortgage |
| Housing Units | 1,141 | 1,687 |
| Median Property Value | $193,400 | $182,500 |
| Median Household Income | $67,031 | $252 |
| Monthly Housing Costs | $517 | $46 |
| Real Estate Taxes | $2,269 | $32 |
Property Value by Mortgage Status in Grand Rapids
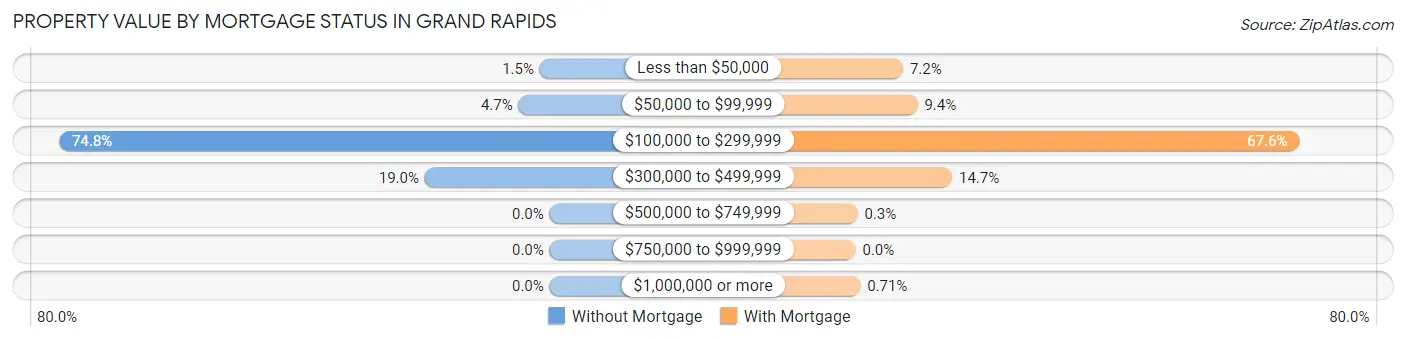
| Property Value | Without Mortgage | With Mortgage |
| Less than $50,000 | 17 (1.5%) | 122 (7.2%) |
| $50,000 to $99,999 | 54 (4.7%) | 159 (9.4%) |
| $100,000 to $299,999 | 853 (74.8%) | 1,141 (67.6%) |
| $300,000 to $499,999 | 217 (19.0%) | 248 (14.7%) |
| $500,000 to $749,999 | 0 (0.0%) | 5 (0.3%) |
| $750,000 to $999,999 | 0 (0.0%) | 0 (0.0%) |
| $1,000,000 or more | 0 (0.0%) | 12 (0.7%) |
| Total | 1,141 (100.0%) | 1,687 (100.0%) |
Household Income by Mortgage Status in Grand Rapids
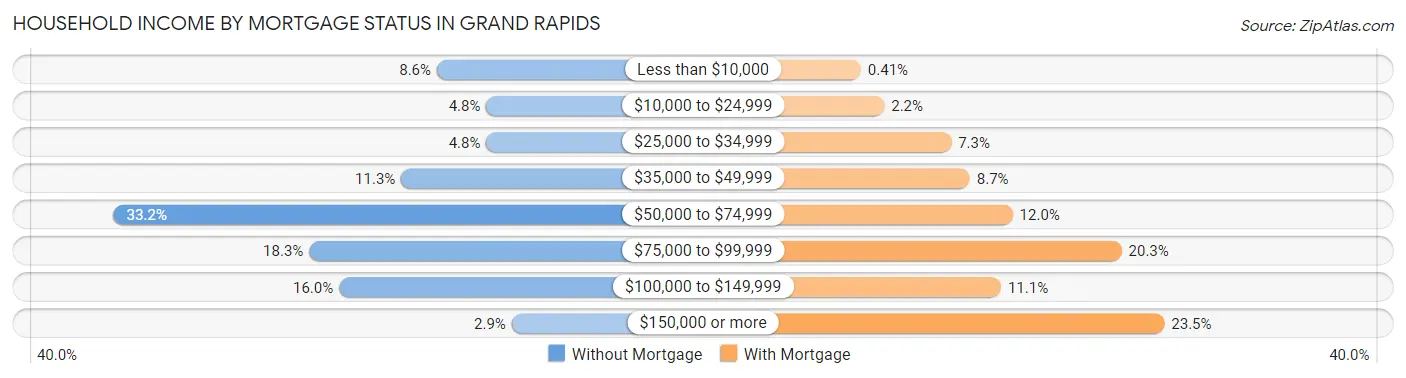
| Household Income | Without Mortgage | With Mortgage |
| Less than $10,000 | 98 (8.6%) | 7 (0.4%) |
| $10,000 to $24,999 | 55 (4.8%) | 37 (2.2%) |
| $25,000 to $34,999 | 55 (4.8%) | 123 (7.3%) |
| $35,000 to $49,999 | 129 (11.3%) | 147 (8.7%) |
| $50,000 to $74,999 | 379 (33.2%) | 202 (12.0%) |
| $75,000 to $99,999 | 209 (18.3%) | 342 (20.3%) |
| $100,000 to $149,999 | 183 (16.0%) | 187 (11.1%) |
| $150,000 or more | 33 (2.9%) | 397 (23.5%) |
| Total | 1,141 (100.0%) | 1,687 (100.0%) |
Property Value to Household Income Ratio in Grand Rapids
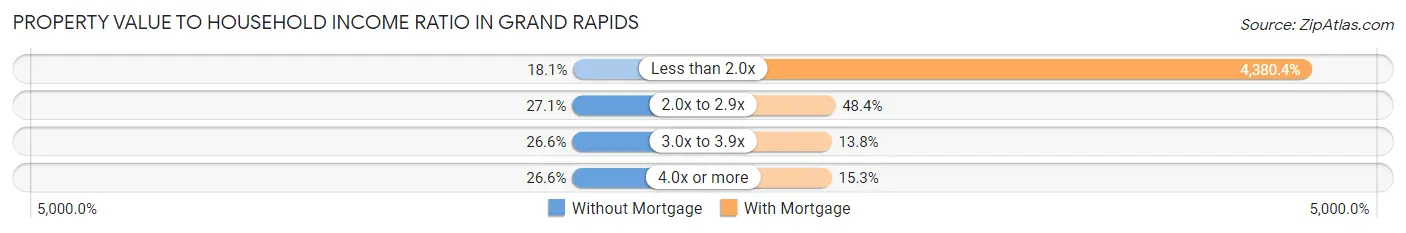
| Value-to-Income Ratio | Without Mortgage | With Mortgage |
| Less than 2.0x | 207 (18.1%) | 73,897 (4,380.4%) |
| 2.0x to 2.9x | 309 (27.1%) | 816 (48.4%) |
| 3.0x to 3.9x | 303 (26.6%) | 232 (13.8%) |
| 4.0x or more | 304 (26.6%) | 258 (15.3%) |
| Total | 1,141 (100.0%) | 1,687 (100.0%) |
Real Estate Taxes by Mortgage Status in Grand Rapids
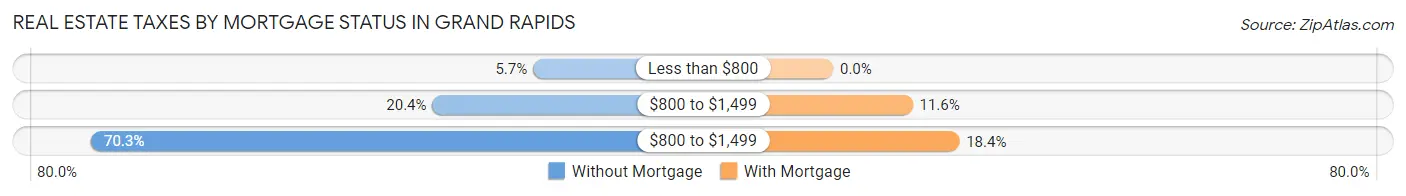
| Property Taxes | Without Mortgage | With Mortgage |
| Less than $800 | 65 (5.7%) | 0 (0.0%) |
| $800 to $1,499 | 233 (20.4%) | 196 (11.6%) |
| $800 to $1,499 | 802 (70.3%) | 311 (18.4%) |
| Total | 1,141 (100.0%) | 1,687 (100.0%) |
Health & Disability in Grand Rapids
Health Insurance Coverage by Age in Grand Rapids
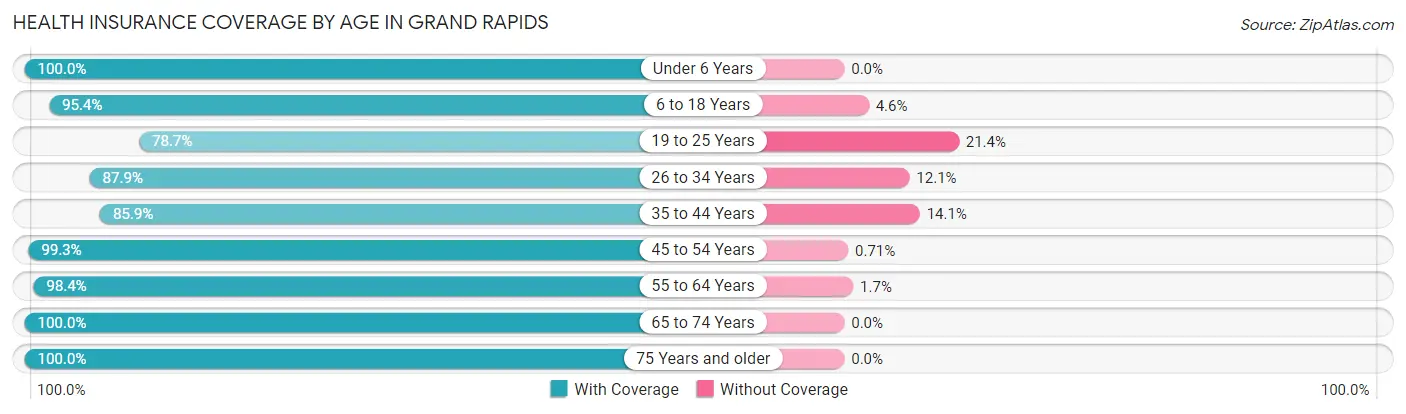
| Age Bracket | With Coverage | Without Coverage |
| Under 6 Years | 572 (100.0%) | 0 (0.0%) |
| 6 to 18 Years | 1,778 (95.4%) | 85 (4.6%) |
| 19 to 25 Years | 490 (78.6%) | 133 (21.3%) |
| 26 to 34 Years | 934 (87.9%) | 129 (12.1%) |
| 35 to 44 Years | 1,381 (85.9%) | 226 (14.1%) |
| 45 to 54 Years | 1,123 (99.3%) | 8 (0.7%) |
| 55 to 64 Years | 1,368 (98.4%) | 23 (1.7%) |
| 65 to 74 Years | 1,367 (100.0%) | 0 (0.0%) |
| 75 Years and older | 1,067 (100.0%) | 0 (0.0%) |
| Total | 10,080 (94.4%) | 604 (5.7%) |
Health Insurance Coverage by Citizenship Status in Grand Rapids
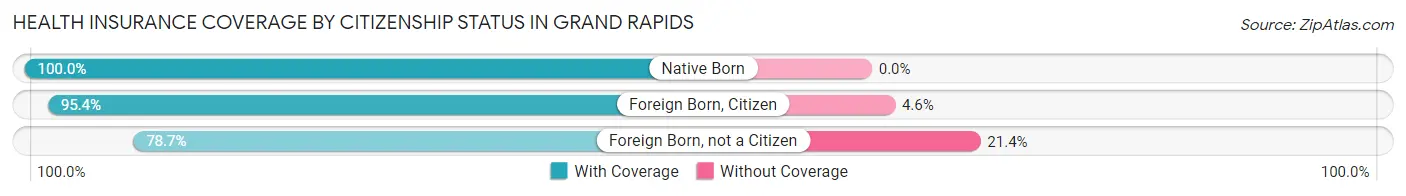
| Citizenship Status | With Coverage | Without Coverage |
| Native Born | 572 (100.0%) | 0 (0.0%) |
| Foreign Born, Citizen | 1,778 (95.4%) | 85 (4.6%) |
| Foreign Born, not a Citizen | 490 (78.6%) | 133 (21.3%) |
Health Insurance Coverage by Household Income in Grand Rapids
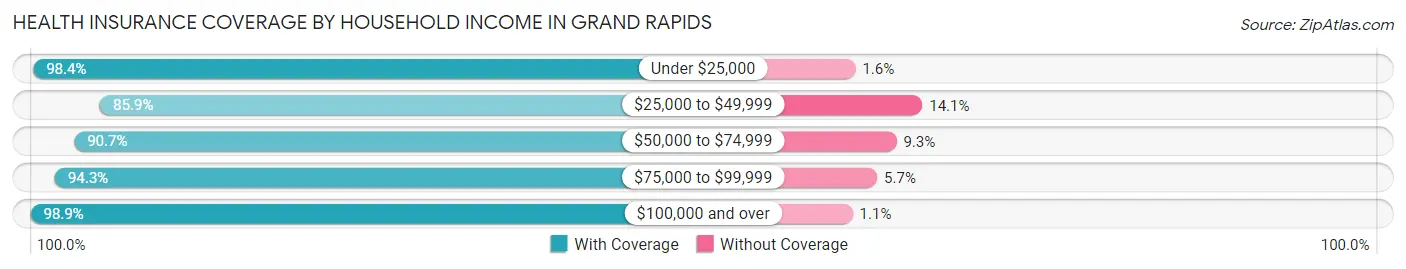
| Household Income | With Coverage | Without Coverage |
| Under $25,000 | 1,947 (98.4%) | 32 (1.6%) |
| $25,000 to $49,999 | 1,476 (85.9%) | 243 (14.1%) |
| $50,000 to $74,999 | 1,951 (90.7%) | 200 (9.3%) |
| $75,000 to $99,999 | 1,193 (94.3%) | 72 (5.7%) |
| $100,000 and over | 3,233 (98.9%) | 36 (1.1%) |
Public vs Private Health Insurance Coverage by Age in Grand Rapids
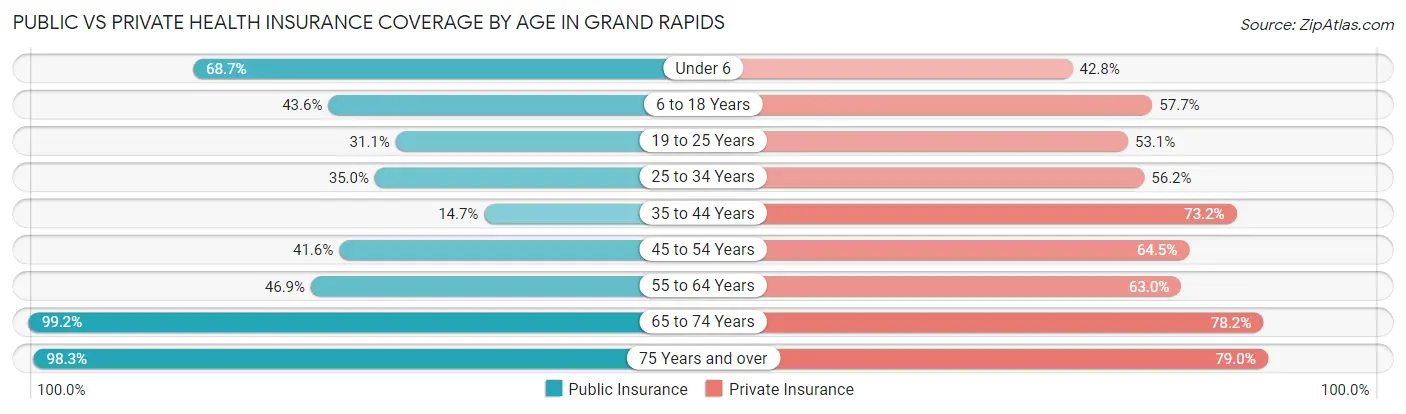
| Age Bracket | Public Insurance | Private Insurance |
| Under 6 | 393 (68.7%) | 245 (42.8%) |
| 6 to 18 Years | 813 (43.6%) | 1,074 (57.7%) |
| 19 to 25 Years | 194 (31.1%) | 331 (53.1%) |
| 25 to 34 Years | 372 (35.0%) | 597 (56.2%) |
| 35 to 44 Years | 236 (14.7%) | 1,177 (73.2%) |
| 45 to 54 Years | 471 (41.6%) | 729 (64.5%) |
| 55 to 64 Years | 652 (46.9%) | 876 (63.0%) |
| 65 to 74 Years | 1,356 (99.2%) | 1,069 (78.2%) |
| 75 Years and over | 1,049 (98.3%) | 843 (79.0%) |
| Total | 5,536 (51.8%) | 6,941 (65.0%) |
Disability Status by Sex by Age in Grand Rapids
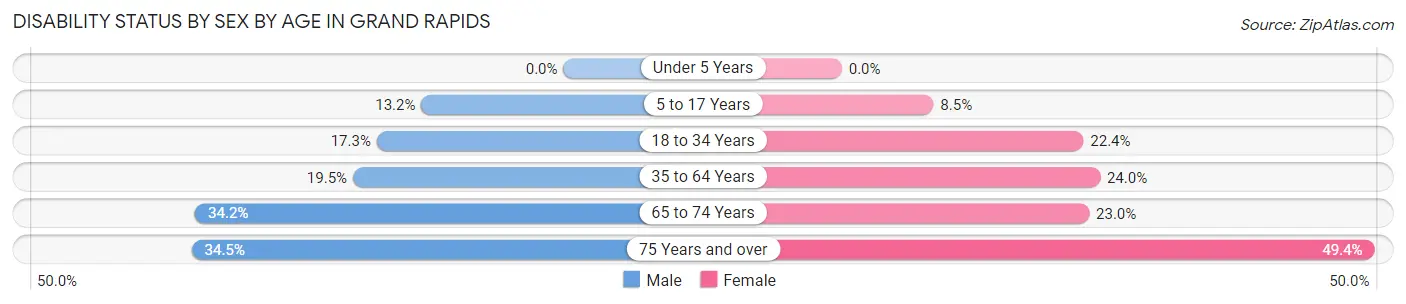
| Age Bracket | Male | Female |
| Under 5 Years | 0 (0.0%) | 0 (0.0%) |
| 5 to 17 Years | 109 (13.2%) | 82 (8.5%) |
| 18 to 34 Years | 177 (17.3%) | 180 (22.4%) |
| 35 to 64 Years | 380 (19.5%) | 523 (24.0%) |
| 65 to 74 Years | 205 (34.2%) | 176 (23.0%) |
| 75 Years and over | 128 (34.5%) | 344 (49.4%) |
Disability Class by Sex by Age in Grand Rapids
Disability Class: Hearing Difficulty
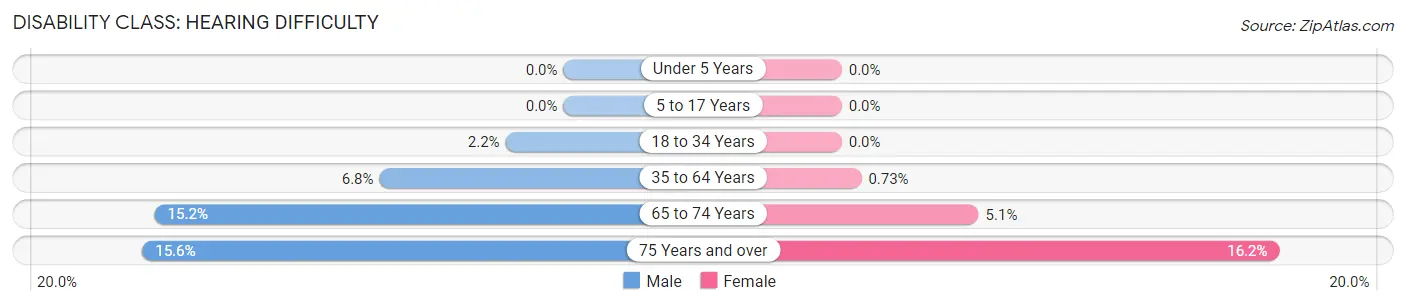
| Age Bracket | Male | Female |
| Under 5 Years | 0 (0.0%) | 0 (0.0%) |
| 5 to 17 Years | 0 (0.0%) | 0 (0.0%) |
| 18 to 34 Years | 22 (2.1%) | 0 (0.0%) |
| 35 to 64 Years | 133 (6.8%) | 16 (0.7%) |
| 65 to 74 Years | 91 (15.2%) | 39 (5.1%) |
| 75 Years and over | 58 (15.6%) | 113 (16.2%) |
Disability Class: Vision Difficulty
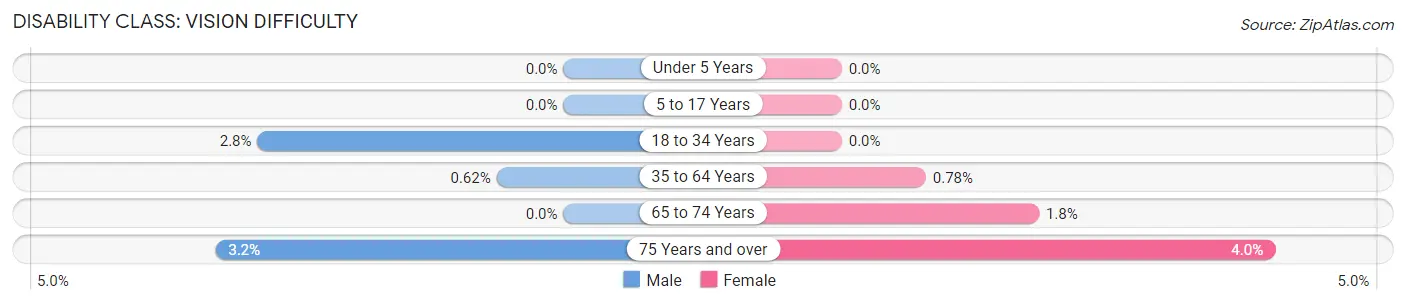
| Age Bracket | Male | Female |
| Under 5 Years | 0 (0.0%) | 0 (0.0%) |
| 5 to 17 Years | 0 (0.0%) | 0 (0.0%) |
| 18 to 34 Years | 29 (2.8%) | 0 (0.0%) |
| 35 to 64 Years | 12 (0.6%) | 17 (0.8%) |
| 65 to 74 Years | 0 (0.0%) | 14 (1.8%) |
| 75 Years and over | 12 (3.2%) | 28 (4.0%) |
Disability Class: Cognitive Difficulty
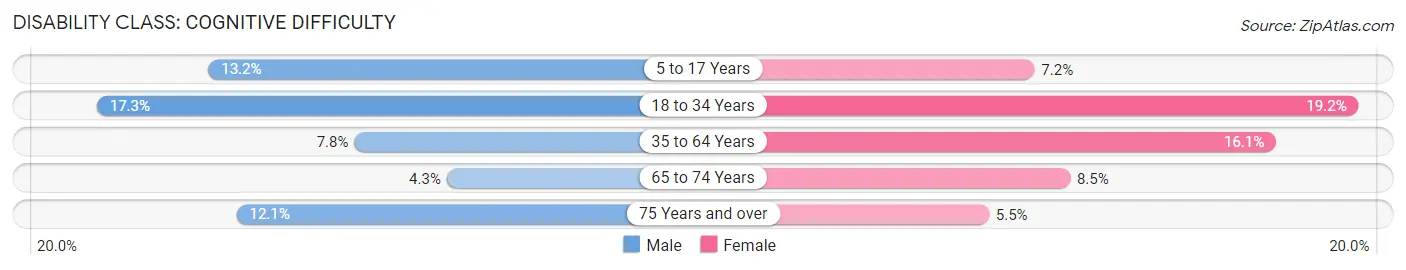
| Age Bracket | Male | Female |
| 5 to 17 Years | 109 (13.2%) | 69 (7.1%) |
| 18 to 34 Years | 177 (17.3%) | 154 (19.2%) |
| 35 to 64 Years | 151 (7.8%) | 352 (16.1%) |
| 65 to 74 Years | 26 (4.3%) | 65 (8.5%) |
| 75 Years and over | 45 (12.1%) | 38 (5.5%) |
Disability Class: Ambulatory Difficulty
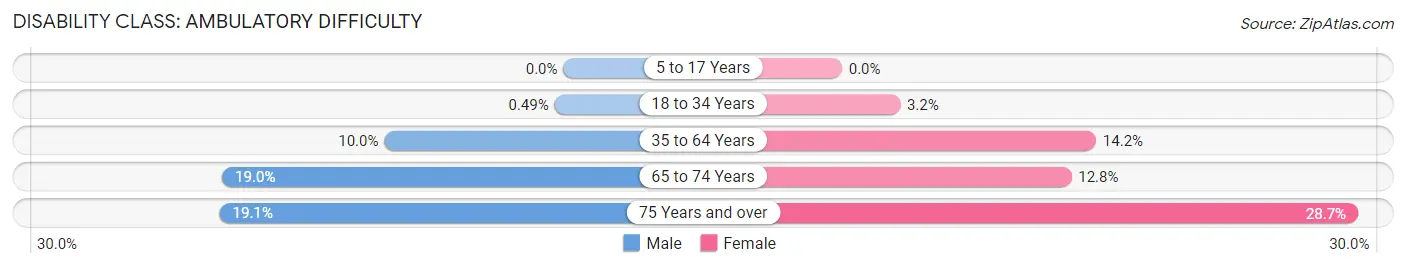
| Age Bracket | Male | Female |
| 5 to 17 Years | 0 (0.0%) | 0 (0.0%) |
| 18 to 34 Years | 5 (0.5%) | 26 (3.2%) |
| 35 to 64 Years | 194 (10.0%) | 309 (14.1%) |
| 65 to 74 Years | 114 (19.0%) | 98 (12.8%) |
| 75 Years and over | 71 (19.1%) | 200 (28.7%) |
Disability Class: Self-Care Difficulty
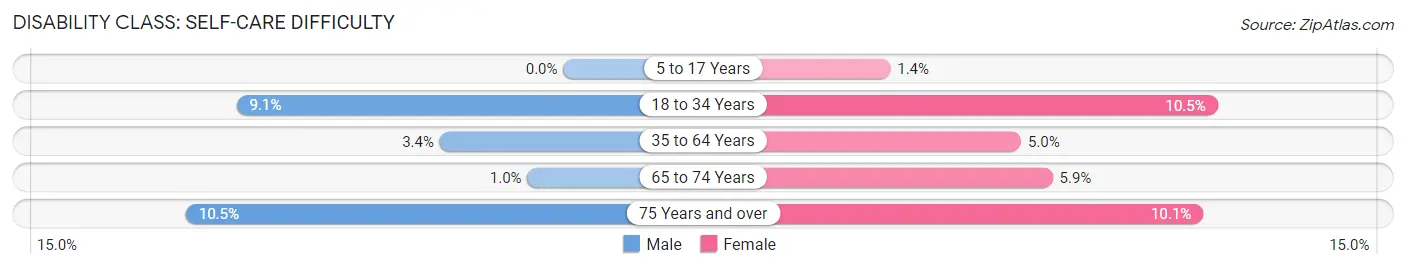
| Age Bracket | Male | Female |
| 5 to 17 Years | 0 (0.0%) | 13 (1.3%) |
| 18 to 34 Years | 93 (9.1%) | 84 (10.5%) |
| 35 to 64 Years | 67 (3.4%) | 109 (5.0%) |
| 65 to 74 Years | 6 (1.0%) | 45 (5.9%) |
| 75 Years and over | 39 (10.5%) | 70 (10.1%) |
Technology Access in Grand Rapids
Computing Device Access in Grand Rapids
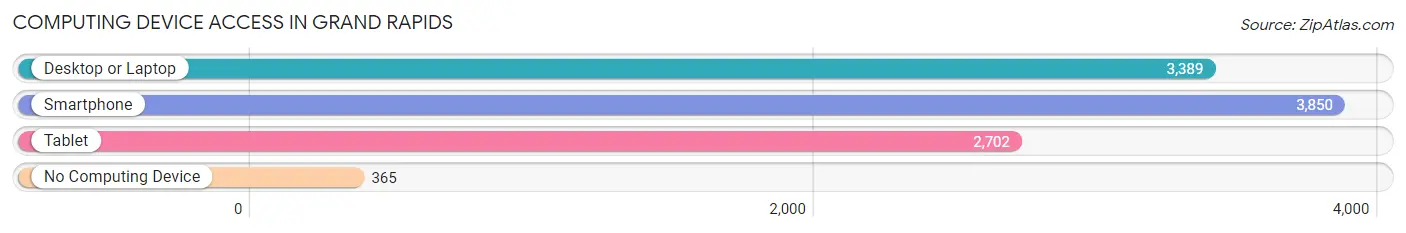
| Device Type | # Households | % Households |
| Desktop or Laptop | 3,389 | 73.4% |
| Smartphone | 3,850 | 83.4% |
| Tablet | 2,702 | 58.5% |
| No Computing Device | 365 | 7.9% |
| Total | 4,618 | 100.0% |
Internet Access in Grand Rapids
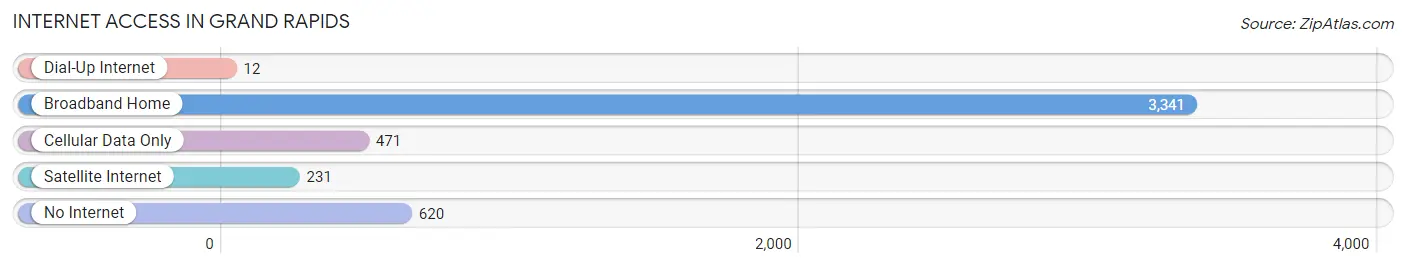
| Internet Type | # Households | % Households |
| Dial-Up Internet | 12 | 0.3% |
| Broadband Home | 3,341 | 72.4% |
| Cellular Data Only | 471 | 10.2% |
| Satellite Internet | 231 | 5.0% |
| No Internet | 620 | 13.4% |
| Total | 4,618 | 100.0% |
Grand Rapids Summary
Grand Rapids, Minnesota is a city located in Itasca County, Minnesota, United States. The population was 10,869 at the 2010 census. It is the county seat of Itasca County. Grand Rapids is located on the western edge of the Mesabi Range, and is known for its paper and logging industries.
History
Grand Rapids was founded in 1882 by three lumbermen, John B. Culver, George B. Wright, and William A. Forbes. The city was named after the Grand Rapids of the Mississippi River, which flows through the city. The city was incorporated in 1901.
In the early 1900s, Grand Rapids was a major lumbering center. The city was home to several large sawmills, and the lumber industry was the main source of employment for the city. The city also had a thriving paper industry, with several paper mills located in the city.
In the 1950s, the city began to diversify its economy, and the paper industry began to decline. The city began to focus on tourism, and the city's economy began to shift towards tourism and recreation.
Geography
Grand Rapids is located at 47°11′N 93°35′W (47.1833, -93.5833). According to the United States Census Bureau, the city has a total area of 8.2 square miles (21.2 km2), of which 8.1 square miles (21.0 km2) is land and 0.1 square miles (0.2 km2) is water.
The city is located on the western edge of the Mesabi Range, and is surrounded by several lakes, including Pokegama Lake, Trout Lake, and Lake Pokegama. The city is also located near the Mississippi River.
Economy
Grand Rapids is a major tourist destination in Minnesota. The city is home to several attractions, including the Grand Rapids Art Museum, the Grand Rapids Historical Society, and the Grand Rapids Symphony Orchestra. The city is also home to several outdoor recreation areas, including the Grand Rapids State Park, the Grand Rapids Nature Center, and the Grand Rapids Golf Course.
The city is also home to several major employers, including the Grand Rapids Public Schools, the Grand Rapids Community College, and the Grand Rapids Medical Center. The city is also home to several manufacturing companies, including the Grand Rapids Paper Company, the Grand Rapids Steel Company, and the Grand Rapids Wood Products Company.
Demographics
As of the 2010 census, there were 10,869 people, 4,541 households, and 2,717 families residing in the city. The population density was 1,334.3 people per square mile (515.7/km2). There were 4,945 housing units at an average density of 609.3 per square mile (235.2/km2). The racial makeup of the city was 94.2% White, 0.7% African American, 0.7% Native American, 0.7% Asian, 0.1% Pacific Islander, 1.7% from other races, and 2.0% from two or more races. Hispanic or Latino of any race were 4.2% of the population.
There were 4,541 households, out of which 28.2% had children under the age of 18 living with them, 43.2% were married couples living together, 12.7% had a female householder with no husband present, and 39.3% were non-families. 33.2% of all households were made up of individuals, and 14.2% had someone living alone who was 65 years of age or older. The average household size was 2.33 and the average family size was 2.97.
In the city, the population was spread out, with 24.2% under the age of 18, 8.7% from 18 to 24, 25.7% from 25 to 44, 22.7% from 45 to 64, and 18.7% who were 65 years of age or older. The median age was 38 years. For every 100 females, there were 91.2 males. For every 100 females age 18 and over, there were 87.3 males.
The median income for a household in the city was $35,938, and the median income for a family was $45,938. Males had a median income of $35,938 versus $25,938 for females. The per capita income for the city was $19,938. About 8.7% of families and 11.7% of the population were below the poverty line, including 15.7% of those under age 18 and 8.7% of those age 65 or over.
Common Questions
What is Per Capita Income in Grand Rapids?
Per Capita income in Grand Rapids is $30,251.
What is the Median Family Income in Grand Rapids?
Median Family Income in Grand Rapids is $80,000.
What is the Median Household income in Grand Rapids?
Median Household Income in Grand Rapids is $53,317.
What is Income or Wage Gap in Grand Rapids?
Income or Wage Gap in Grand Rapids is 5.2%.
Women in Grand Rapids earn 94.8 cents for every dollar earned by a man.
What is Inequality or Gini Index in Grand Rapids?
Inequality or Gini Index in Grand Rapids is 0.45.
What is the Total Population of Grand Rapids?
Total Population of Grand Rapids is 11,158.
What is the Total Male Population of Grand Rapids?
Total Male Population of Grand Rapids is 5,209.
What is the Total Female Population of Grand Rapids?
Total Female Population of Grand Rapids is 5,949.
What is the Ratio of Males per 100 Females in Grand Rapids?
There are 87.56 Males per 100 Females in Grand Rapids.
What is the Ratio of Females per 100 Males in Grand Rapids?
There are 114.21 Females per 100 Males in Grand Rapids.
What is the Median Population Age in Grand Rapids?
Median Population Age in Grand Rapids is 43.2 Years.
What is the Average Family Size in Grand Rapids
Average Family Size in Grand Rapids is 3.1 People.
What is the Average Household Size in Grand Rapids
Average Household Size in Grand Rapids is 2.2 People.
How Large is the Labor Force in Grand Rapids?
There are 4,953 People in the Labor Forcein in Grand Rapids.
What is the Percentage of People in the Labor Force in Grand Rapids?
54.4% of People are in the Labor Force in Grand Rapids.
What is the Unemployment Rate in Grand Rapids?
Unemployment Rate in Grand Rapids is 7.1%.