Blaine, MN Map & Demographics
Blaine Map
Blaine Overview
$44,013
PER CAPITA INCOME
$116,256
AVG FAMILY INCOME
$100,659
AVG HOUSEHOLD INCOME
29.7%
WAGE / INCOME GAP [ % ]
70.3¢/ $1
WAGE / INCOME GAP [ $ ]
$11,215
FAMILY INCOME DEFICIT
0.40
INEQUALITY / GINI INDEX
70,047
TOTAL POPULATION
34,928
MALE POPULATION
35,119
FEMALE POPULATION
99.46
MALES / 100 FEMALES
100.55
FEMALES / 100 MALES
37.6
MEDIAN AGE
3.3
AVG FAMILY SIZE
2.8
AVG HOUSEHOLD SIZE
38,495
LABOR FORCE [ PEOPLE ]
71.1%
PERCENT IN LABOR FORCE
4.4%
UNEMPLOYMENT RATE
Income in Blaine
Income Overview in Blaine
Per Capita Income in Blaine is $44,013, while median incomes of families and households are $116,256 and $100,659 respectively.
| Characteristic | Number | Measure |
| Per Capita Income | 70,047 | $44,013 |
| Median Family Income | 17,675 | $116,256 |
| Mean Family Income | 17,675 | $136,511 |
| Median Household Income | 25,049 | $100,659 |
| Mean Household Income | 25,049 | $120,365 |
| Income Deficit | 17,675 | $11,215 |
| Wage / Income Gap (%) | 70,047 | 29.75% |
| Wage / Income Gap ($) | 70,047 | 70.25¢ per $1 |
| Gini / Inequality Index | 70,047 | 0.40 |
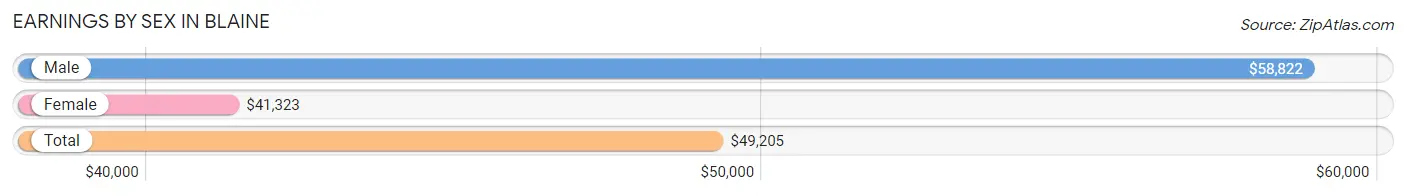
Earnings by Sex in Blaine
Average Earnings in Blaine are $49,205, $58,822 for men and $41,323 for women, a difference of 29.7%.
| Sex | Number | Average Earnings |
| Male | 20,655 (50.8%) | $58,822 |
| Female | 19,976 (49.2%) | $41,323 |
| Total | 40,631 (100.0%) | $49,205 |
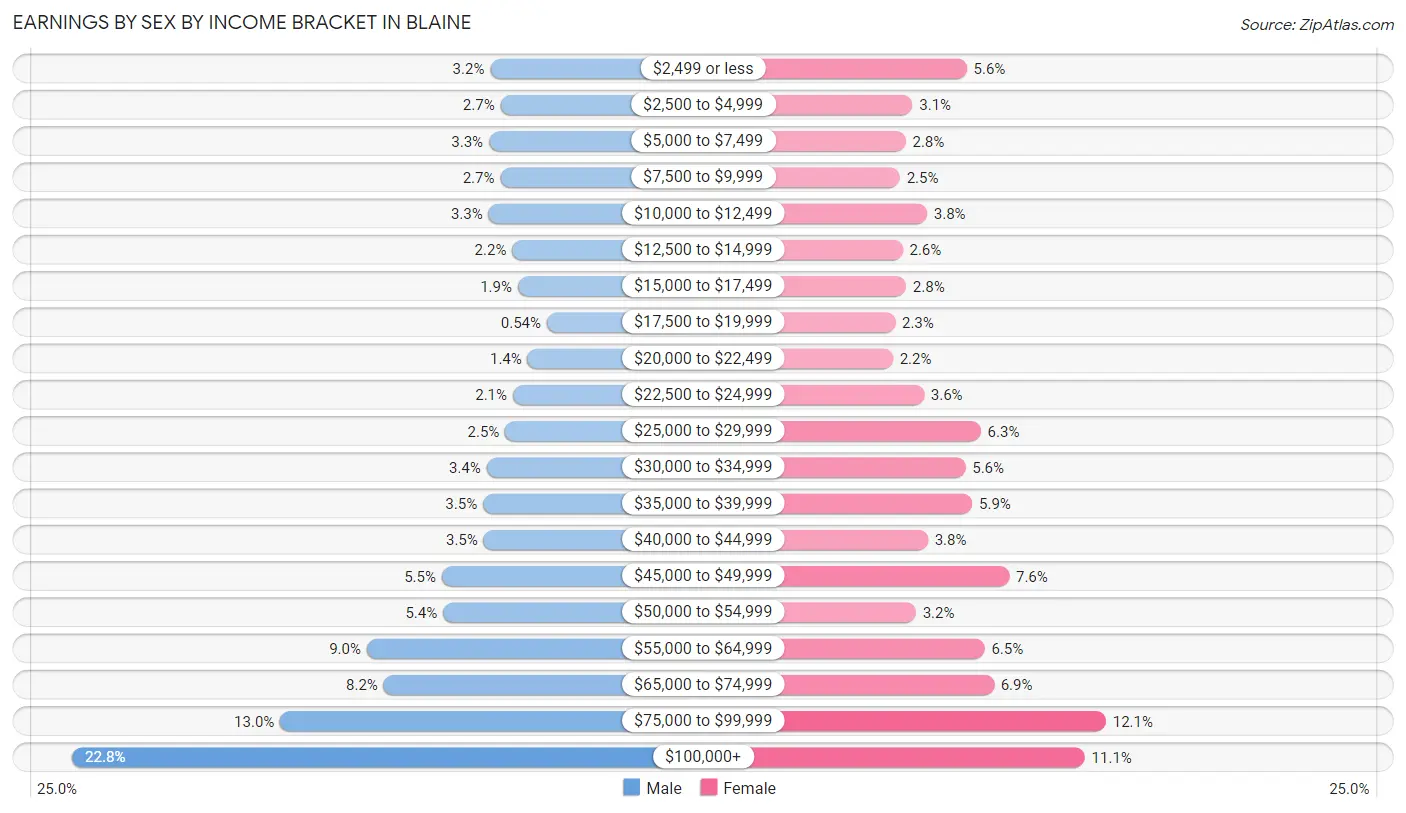
Earnings by Sex by Income Bracket in Blaine
The most common earnings brackets in Blaine are $100,000+ for men (4,704 | 22.8%) and $75,000 to $99,999 for women (2,424 | 12.1%).
| Income | Male | Female |
| $2,499 or less | 659 (3.2%) | 1,121 (5.6%) |
| $2,500 to $4,999 | 560 (2.7%) | 614 (3.1%) |
| $5,000 to $7,499 | 671 (3.3%) | 549 (2.8%) |
| $7,500 to $9,999 | 562 (2.7%) | 496 (2.5%) |
| $10,000 to $12,499 | 675 (3.3%) | 750 (3.7%) |
| $12,500 to $14,999 | 447 (2.2%) | 522 (2.6%) |
| $15,000 to $17,499 | 393 (1.9%) | 553 (2.8%) |
| $17,500 to $19,999 | 111 (0.5%) | 452 (2.3%) |
| $20,000 to $22,499 | 297 (1.4%) | 429 (2.1%) |
| $22,500 to $24,999 | 440 (2.1%) | 721 (3.6%) |
| $25,000 to $29,999 | 514 (2.5%) | 1,253 (6.3%) |
| $30,000 to $34,999 | 694 (3.4%) | 1,109 (5.6%) |
| $35,000 to $39,999 | 730 (3.5%) | 1,173 (5.9%) |
| $40,000 to $44,999 | 722 (3.5%) | 758 (3.8%) |
| $45,000 to $49,999 | 1,128 (5.5%) | 1,519 (7.6%) |
| $50,000 to $54,999 | 1,115 (5.4%) | 645 (3.2%) |
| $55,000 to $64,999 | 1,852 (9.0%) | 1,288 (6.5%) |
| $65,000 to $74,999 | 1,690 (8.2%) | 1,374 (6.9%) |
| $75,000 to $99,999 | 2,691 (13.0%) | 2,424 (12.1%) |
| $100,000+ | 4,704 (22.8%) | 2,226 (11.1%) |
| Total | 20,655 (100.0%) | 19,976 (100.0%) |
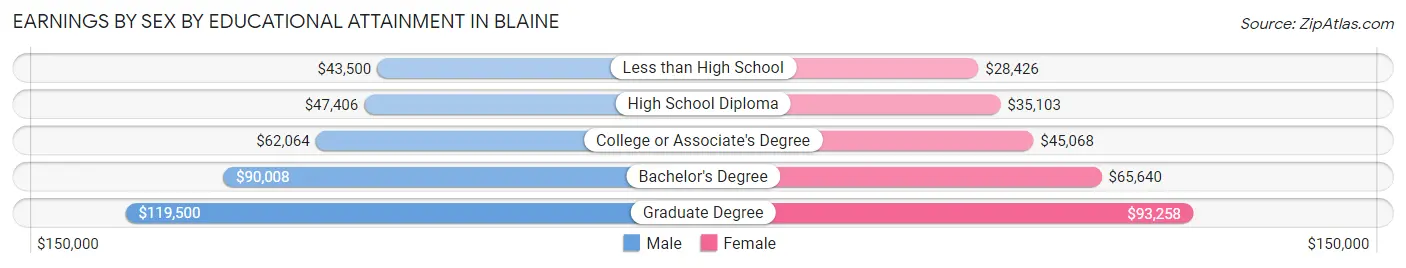
Earnings by Sex by Educational Attainment in Blaine
Average earnings in Blaine are $65,473 for men and $47,449 for women, a difference of 27.5%. Men with an educational attainment of graduate degree enjoy the highest average annual earnings of $119,500, while those with less than high school education earn the least with $43,500. Women with an educational attainment of graduate degree earn the most with the average annual earnings of $93,258, while those with less than high school education have the smallest earnings of $28,426.
| Educational Attainment | Male Income | Female Income |
| Less than High School | $43,500 | $28,426 |
| High School Diploma | $47,406 | $35,103 |
| College or Associate's Degree | $62,064 | $45,068 |
| Bachelor's Degree | $90,008 | $65,640 |
| Graduate Degree | $119,500 | $93,258 |
| Total | $65,473 | $47,449 |
Family Income in Blaine
Family Income Brackets in Blaine
According to the Blaine family income data, there are 4,984 families falling into the $100,000 to $149,999 income range, which is the most common income bracket and makes up 28.2% of all families. Conversely, the $10,000 to $14,999 income bracket is the least frequent group with only 124 families (0.7%) belonging to this category.
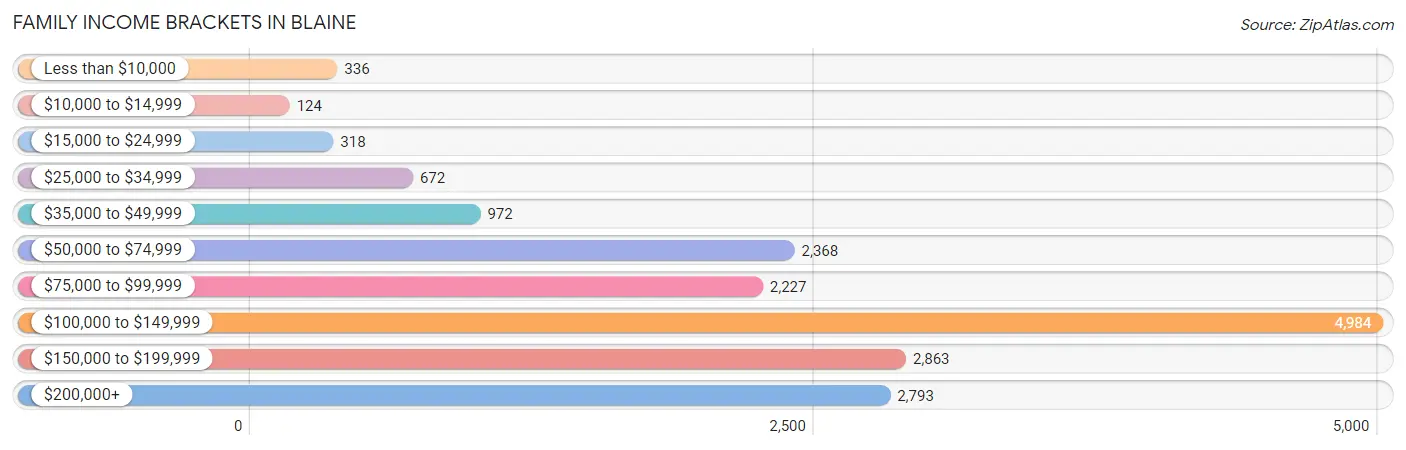
| Income Bracket | # Families | % Families |
| Less than $10,000 | 336 | 1.9% |
| $10,000 to $14,999 | 124 | 0.7% |
| $15,000 to $24,999 | 318 | 1.8% |
| $25,000 to $34,999 | 672 | 3.8% |
| $35,000 to $49,999 | 972 | 5.5% |
| $50,000 to $74,999 | 2,368 | 13.4% |
| $75,000 to $99,999 | 2,227 | 12.6% |
| $100,000 to $149,999 | 4,984 | 28.2% |
| $150,000 to $199,999 | 2,863 | 16.2% |
| $200,000+ | 2,793 | 15.8% |
Family Income by Famaliy Size in Blaine
7+ person families (597 | 3.4%) account for the highest median family income in Blaine with $166,840 per family, while 2-person families (7,693 | 43.5%) have the highest median income of $48,546 per family member.
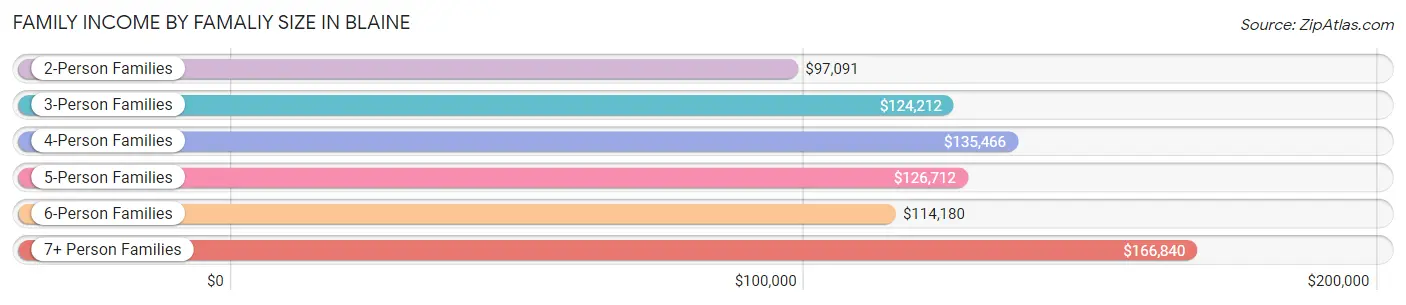
| Income Bracket | # Families | Median Income |
| 2-Person Families | 7,693 (43.5%) | $97,091 |
| 3-Person Families | 3,101 (17.5%) | $124,212 |
| 4-Person Families | 3,912 (22.1%) | $135,466 |
| 5-Person Families | 1,779 (10.1%) | $126,712 |
| 6-Person Families | 593 (3.4%) | $114,180 |
| 7+ Person Families | 597 (3.4%) | $166,840 |
| Total | 17,675 (100.0%) | $116,256 |
Family Income by Number of Earners in Blaine
The median family income in Blaine is $116,256, with families comprising 3+ earners (3,077) having the highest median family income of $136,211, while families with no earners (2,004) have the lowest median family income of $66,065, accounting for 17.4% and 11.3% of families, respectively.
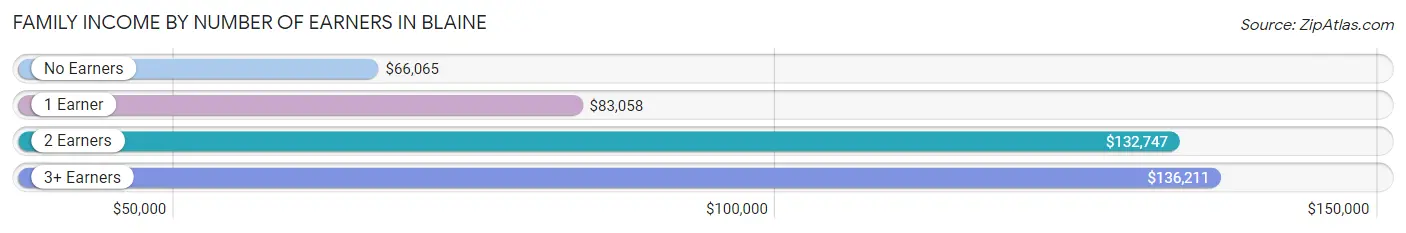
| Number of Earners | # Families | Median Income |
| No Earners | 2,004 (11.3%) | $66,065 |
| 1 Earner | 4,292 (24.3%) | $83,058 |
| 2 Earners | 8,302 (47.0%) | $132,747 |
| 3+ Earners | 3,077 (17.4%) | $136,211 |
| Total | 17,675 (100.0%) | $116,256 |
Household Income in Blaine
Household Income Brackets in Blaine
With 6,337 households falling in the category, the $100,000 to $149,999 income range is the most frequent in Blaine, accounting for 25.3% of all households. In contrast, only 326 households (1.3%) fall into the $10,000 to $14,999 income bracket, making it the least populous group.
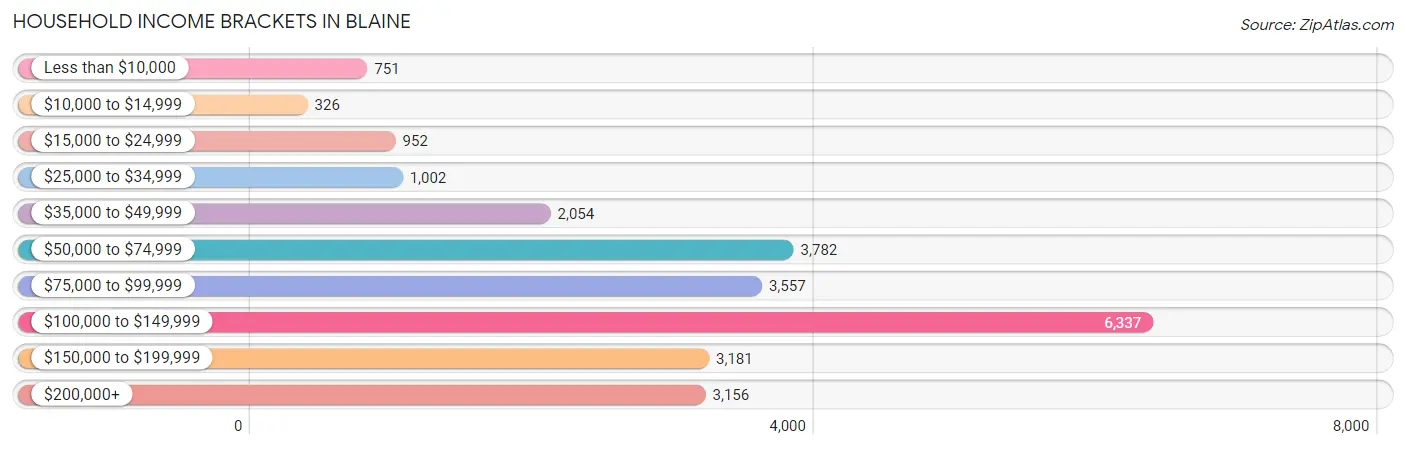
| Income Bracket | # Households | % Households |
| Less than $10,000 | 751 | 3.0% |
| $10,000 to $14,999 | 326 | 1.3% |
| $15,000 to $24,999 | 952 | 3.8% |
| $25,000 to $34,999 | 1,002 | 4.0% |
| $35,000 to $49,999 | 2,054 | 8.2% |
| $50,000 to $74,999 | 3,782 | 15.1% |
| $75,000 to $99,999 | 3,557 | 14.2% |
| $100,000 to $149,999 | 6,337 | 25.3% |
| $150,000 to $199,999 | 3,181 | 12.7% |
| $200,000+ | 3,156 | 12.6% |
Household Income by Householder Age in Blaine
The median household income in Blaine is $100,659, with the highest median household income of $118,304 found in the 25 to 44 years age bracket for the primary householder. A total of 8,744 households (34.9%) fall into this category. Meanwhile, the 65+ years age bracket for the primary householder has the lowest median household income of $57,856, with 5,533 households (22.1%) in this group.
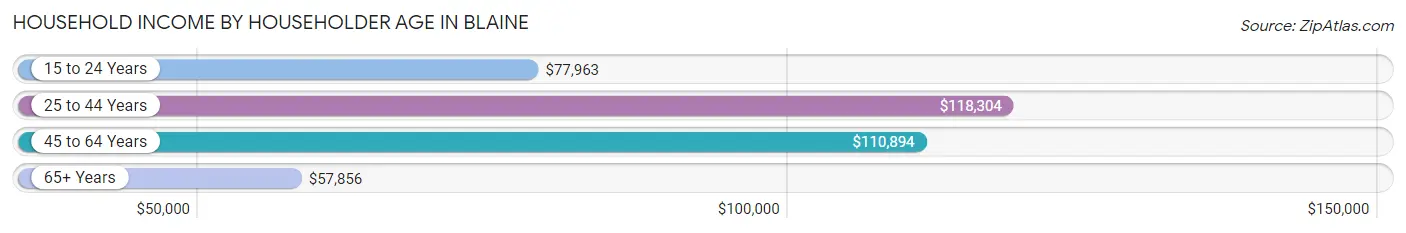
| Income Bracket | # Households | Median Income |
| 15 to 24 Years | 516 (2.1%) | $77,963 |
| 25 to 44 Years | 8,744 (34.9%) | $118,304 |
| 45 to 64 Years | 10,256 (40.9%) | $110,894 |
| 65+ Years | 5,533 (22.1%) | $57,856 |
| Total | 25,049 (100.0%) | $100,659 |
Poverty in Blaine
Income Below Poverty by Sex and Age in Blaine
With 6.2% poverty level for males and 6.0% for females among the residents of Blaine, 18 to 24 year old males and 75 year old and over females are the most vulnerable to poverty, with 344 males (12.2%) and 256 females (14.2%) in their respective age groups living below the poverty level.
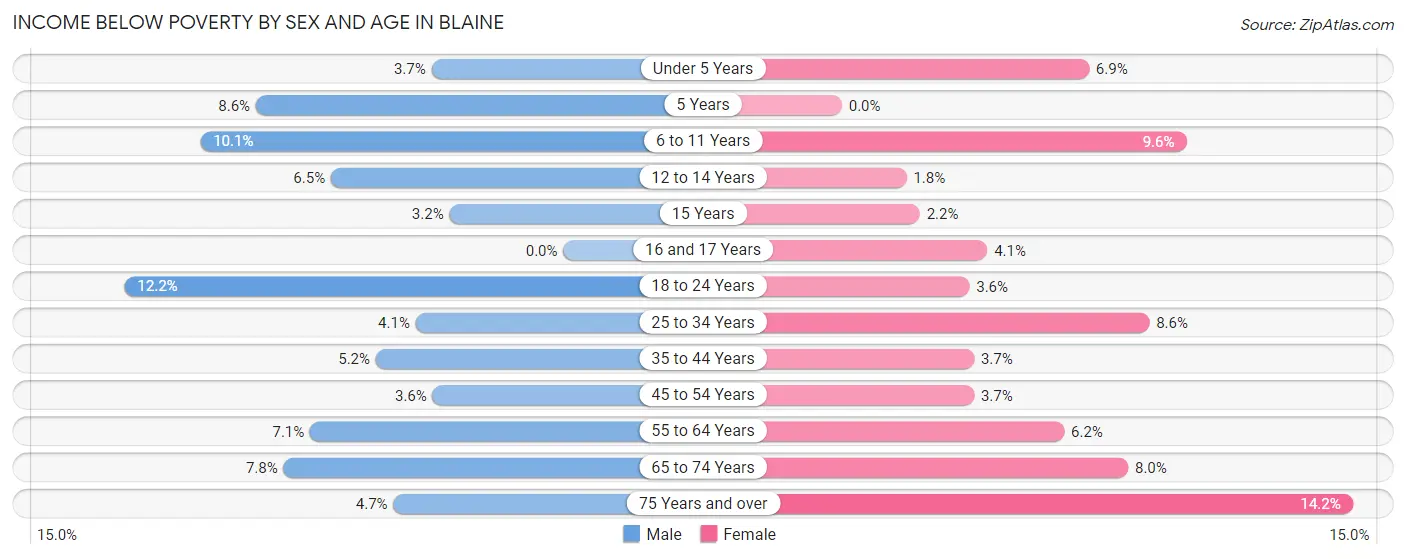
| Age Bracket | Male | Female |
| Under 5 Years | 77 (3.7%) | 164 (6.9%) |
| 5 Years | 37 (8.6%) | 0 (0.0%) |
| 6 to 11 Years | 325 (10.1%) | 241 (9.6%) |
| 12 to 14 Years | 110 (6.5%) | 30 (1.8%) |
| 15 Years | 18 (3.2%) | 11 (2.2%) |
| 16 and 17 Years | 0 (0.0%) | 48 (4.1%) |
| 18 to 24 Years | 344 (12.2%) | 92 (3.5%) |
| 25 to 34 Years | 163 (4.1%) | 379 (8.6%) |
| 35 to 44 Years | 279 (5.2%) | 190 (3.7%) |
| 45 to 54 Years | 165 (3.6%) | 167 (3.7%) |
| 55 to 64 Years | 322 (7.0%) | 301 (6.2%) |
| 65 to 74 Years | 242 (7.8%) | 228 (8.0%) |
| 75 Years and over | 56 (4.7%) | 256 (14.2%) |
| Total | 2,138 (6.2%) | 2,107 (6.0%) |
Income Above Poverty by Sex and Age in Blaine
According to the poverty statistics in Blaine, males aged 16 and 17 years and females aged 5 years are the age groups that are most secure financially, with 100.0% of males and 100.0% of females in these age groups living above the poverty line.
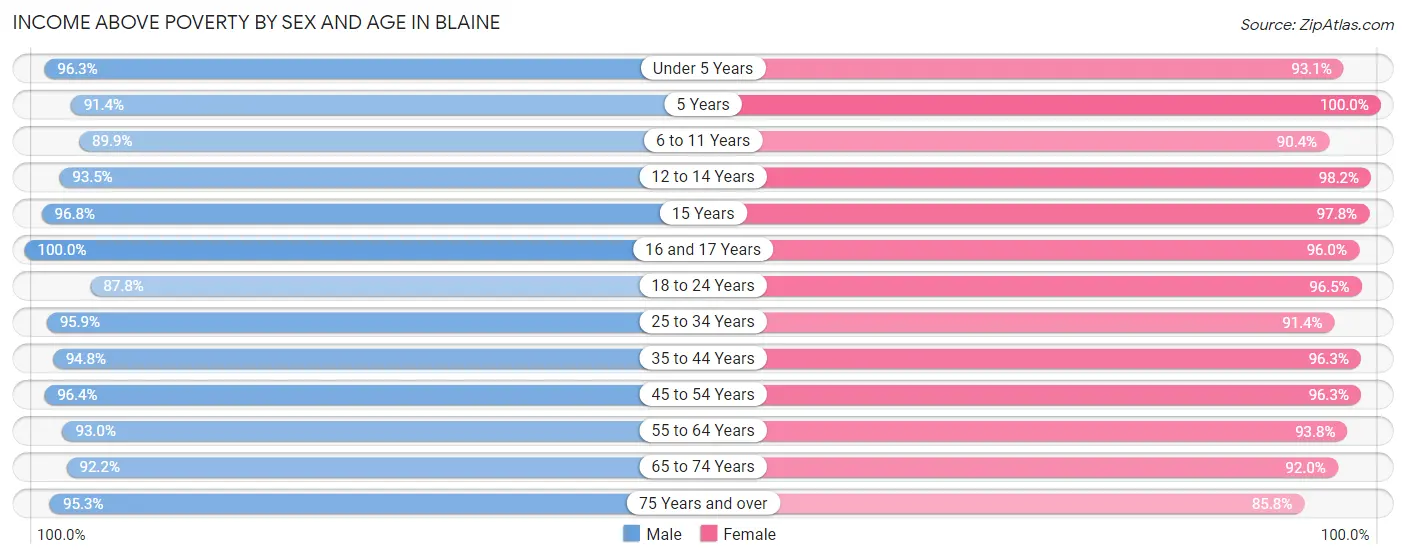
| Age Bracket | Male | Female |
| Under 5 Years | 2,020 (96.3%) | 2,219 (93.1%) |
| 5 Years | 395 (91.4%) | 430 (100.0%) |
| 6 to 11 Years | 2,889 (89.9%) | 2,271 (90.4%) |
| 12 to 14 Years | 1,590 (93.5%) | 1,637 (98.2%) |
| 15 Years | 549 (96.8%) | 496 (97.8%) |
| 16 and 17 Years | 1,153 (100.0%) | 1,136 (96.0%) |
| 18 to 24 Years | 2,470 (87.8%) | 2,497 (96.5%) |
| 25 to 34 Years | 3,803 (95.9%) | 4,046 (91.4%) |
| 35 to 44 Years | 5,062 (94.8%) | 4,979 (96.3%) |
| 45 to 54 Years | 4,367 (96.4%) | 4,372 (96.3%) |
| 55 to 64 Years | 4,247 (92.9%) | 4,559 (93.8%) |
| 65 to 74 Years | 2,865 (92.2%) | 2,633 (92.0%) |
| 75 Years and over | 1,128 (95.3%) | 1,544 (85.8%) |
| Total | 32,538 (93.8%) | 32,819 (94.0%) |
Income Below Poverty Among Married-Couple Families in Blaine
The poverty statistics for married-couple families in Blaine show that 2.5% or 351 of the total 14,117 families live below the poverty line. Families with 3 or 4 children have the highest poverty rate of 5.8%, comprising of 92 families. On the other hand, families with 5 or more children have the lowest poverty rate of 0.0%, which includes 0 families.
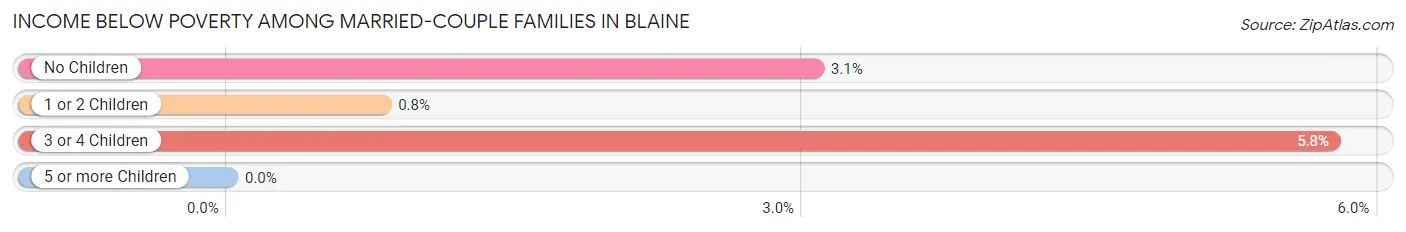
| Children | Above Poverty | Below Poverty |
| No Children | 6,844 (96.9%) | 216 (3.1%) |
| 1 or 2 Children | 5,303 (99.2%) | 43 (0.8%) |
| 3 or 4 Children | 1,506 (94.2%) | 92 (5.8%) |
| 5 or more Children | 113 (100.0%) | 0 (0.0%) |
| Total | 13,766 (97.5%) | 351 (2.5%) |
Income Below Poverty Among Single-Parent Households in Blaine
According to the poverty data in Blaine, 10.1% or 105 single-father households and 13.0% or 327 single-mother households are living below the poverty line. Among single-father households, those with 3 or 4 children have the highest poverty rate, with 57 households (25.5%) experiencing poverty. Likewise, among single-mother households, those with 5 or more children have the highest poverty rate, with 29 households (35.4%) falling below the poverty line.
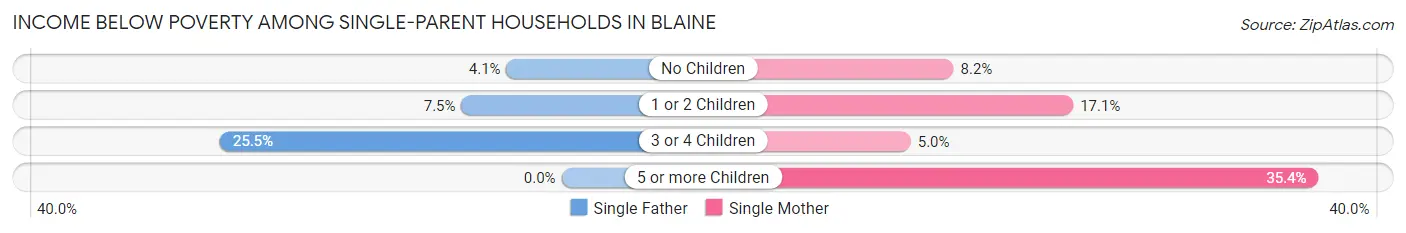
| Children | Single Father | Single Mother |
| No Children | 16 (4.1%) | 84 (8.2%) |
| 1 or 2 Children | 32 (7.5%) | 203 (17.1%) |
| 3 or 4 Children | 57 (25.5%) | 11 (5.0%) |
| 5 or more Children | 0 (0.0%) | 29 (35.4%) |
| Total | 105 (10.1%) | 327 (13.0%) |
Income Below Poverty Among Married-Couple vs Single-Parent Households in Blaine
The poverty data for Blaine shows that 351 of the married-couple family households (2.5%) and 432 of the single-parent households (12.1%) are living below the poverty level. Within the married-couple family households, those with 3 or 4 children have the highest poverty rate, with 92 households (5.8%) falling below the poverty line. Among the single-parent households, those with 5 or more children have the highest poverty rate, with 29 household (35.4%) living below poverty.
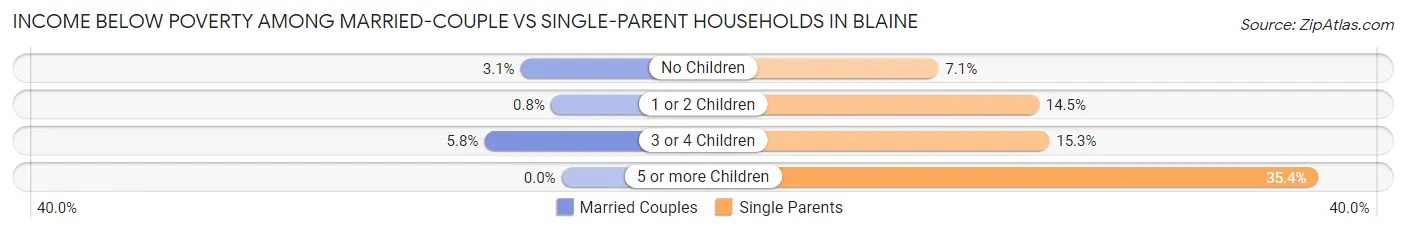
| Children | Married-Couple Families | Single-Parent Households |
| No Children | 216 (3.1%) | 100 (7.1%) |
| 1 or 2 Children | 43 (0.8%) | 235 (14.5%) |
| 3 or 4 Children | 92 (5.8%) | 68 (15.3%) |
| 5 or more Children | 0 (0.0%) | 29 (35.4%) |
| Total | 351 (2.5%) | 432 (12.1%) |
Race in Blaine
The most populous races in Blaine are White / Caucasian (53,196 | 75.9%), Asian (6,453 | 9.2%), and Black / African American (5,065 | 7.2%).
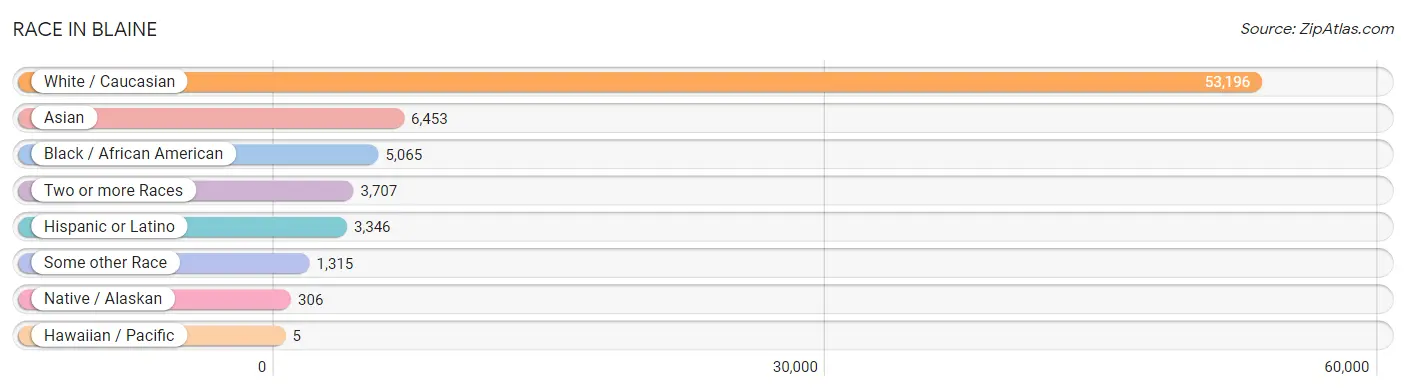
| Race | # Population | % Population |
| Asian | 6,453 | 9.2% |
| Black / African American | 5,065 | 7.2% |
| Hawaiian / Pacific | 5 | 0.0% |
| Hispanic or Latino | 3,346 | 4.8% |
| Native / Alaskan | 306 | 0.4% |
| White / Caucasian | 53,196 | 75.9% |
| Two or more Races | 3,707 | 5.3% |
| Some other Race | 1,315 | 1.9% |
| Total | 70,047 | 100.0% |
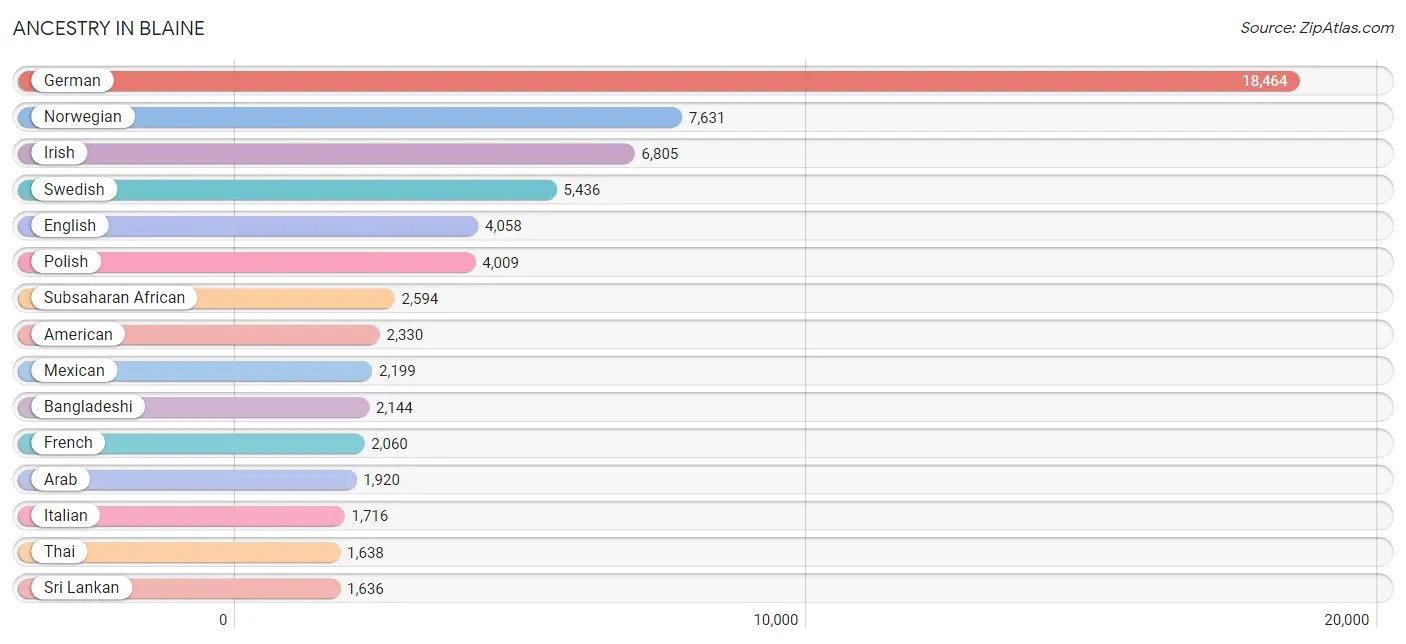
Ancestry in Blaine
The most populous ancestries reported in Blaine are German (18,464 | 26.4%), Norwegian (7,631 | 10.9%), Irish (6,805 | 9.7%), Swedish (5,436 | 7.8%), and English (4,058 | 5.8%), together accounting for 60.5% of all Blaine residents.
| Ancestry | # Population | % Population |
| African | 496 | 0.7% |
| American | 2,330 | 3.3% |
| Arab | 1,920 | 2.7% |
| Armenian | 142 | 0.2% |
| Austrian | 315 | 0.4% |
| Bangladeshi | 2,144 | 3.1% |
| Belgian | 28 | 0.0% |
| Bhutanese | 111 | 0.2% |
| British | 217 | 0.3% |
| Bulgarian | 49 | 0.1% |
| Burmese | 211 | 0.3% |
| Canadian | 140 | 0.2% |
| Central American | 410 | 0.6% |
| Cherokee | 52 | 0.1% |
| Chippewa | 437 | 0.6% |
| Colombian | 83 | 0.1% |
| Costa Rican | 105 | 0.2% |
| Croatian | 114 | 0.2% |
| Crow | 13 | 0.0% |
| Cuban | 39 | 0.1% |
| Czech | 900 | 1.3% |
| Czechoslovakian | 86 | 0.1% |
| Danish | 660 | 0.9% |
| Dutch | 773 | 1.1% |
| Eastern European | 269 | 0.4% |
| Ecuadorian | 86 | 0.1% |
| Egyptian | 344 | 0.5% |
| English | 4,058 | 5.8% |
| Ethiopian | 1,122 | 1.6% |
| European | 1,360 | 1.9% |
| Finnish | 1,117 | 1.6% |
| French | 2,060 | 2.9% |
| French American Indian | 160 | 0.2% |
| French Canadian | 539 | 0.8% |
| German | 18,464 | 26.4% |
| Ghanaian | 32 | 0.1% |
| Greek | 76 | 0.1% |
| Guamanian / Chamorro | 8 | 0.0% |
| Guatemalan | 33 | 0.1% |
| Guyanese | 57 | 0.1% |
| Haitian | 8 | 0.0% |
| Honduran | 5 | 0.0% |
| Hungarian | 185 | 0.3% |
| Icelander | 22 | 0.0% |
| Indian (Asian) | 529 | 0.8% |
| Inupiat | 20 | 0.0% |
| Iraqi | 441 | 0.6% |
| Irish | 6,805 | 9.7% |
| Iroquois | 16 | 0.0% |
| Italian | 1,716 | 2.5% |
| Jamaican | 55 | 0.1% |
| Japanese | 72 | 0.1% |
| Jordanian | 203 | 0.3% |
| Kenyan | 173 | 0.3% |
| Kiowa | 9 | 0.0% |
| Korean | 598 | 0.9% |
| Latvian | 41 | 0.1% |
| Lebanese | 302 | 0.4% |
| Liberian | 99 | 0.1% |
| Lithuanian | 71 | 0.1% |
| Luxembourger | 6 | 0.0% |
| Malaysian | 399 | 0.6% |
| Mexican | 2,199 | 3.1% |
| Mexican American Indian | 48 | 0.1% |
| Mongolian | 9 | 0.0% |
| Native Hawaiian | 11 | 0.0% |
| Nicaraguan | 145 | 0.2% |
| Nigerian | 59 | 0.1% |
| Northern European | 144 | 0.2% |
| Norwegian | 7,631 | 10.9% |
| Pakistani | 55 | 0.1% |
| Palestinian | 235 | 0.3% |
| Panamanian | 8 | 0.0% |
| Paraguayan | 7 | 0.0% |
| Peruvian | 85 | 0.1% |
| Polish | 4,009 | 5.7% |
| Portuguese | 21 | 0.0% |
| Puerto Rican | 170 | 0.2% |
| Romanian | 102 | 0.2% |
| Russian | 335 | 0.5% |
| Salvadoran | 114 | 0.2% |
| Scandinavian | 1,198 | 1.7% |
| Scotch-Irish | 318 | 0.4% |
| Scottish | 662 | 0.9% |
| Serbian | 7 | 0.0% |
| Sierra Leonean | 12 | 0.0% |
| Sioux | 78 | 0.1% |
| Slavic | 61 | 0.1% |
| Slovak | 40 | 0.1% |
| Slovene | 118 | 0.2% |
| Somali | 445 | 0.6% |
| South American | 413 | 0.6% |
| Spaniard | 17 | 0.0% |
| Sri Lankan | 1,636 | 2.3% |
| Subsaharan African | 2,594 | 3.7% |
| Swedish | 5,436 | 7.8% |
| Swiss | 42 | 0.1% |
| Syrian | 15 | 0.0% |
| Thai | 1,638 | 2.3% |
| Tongan | 16 | 0.0% |
| Ukrainian | 238 | 0.3% |
| Welsh | 254 | 0.4% |
| West Indian | 145 | 0.2% |
| Yugoslavian | 327 | 0.5% | View All 104 Rows |
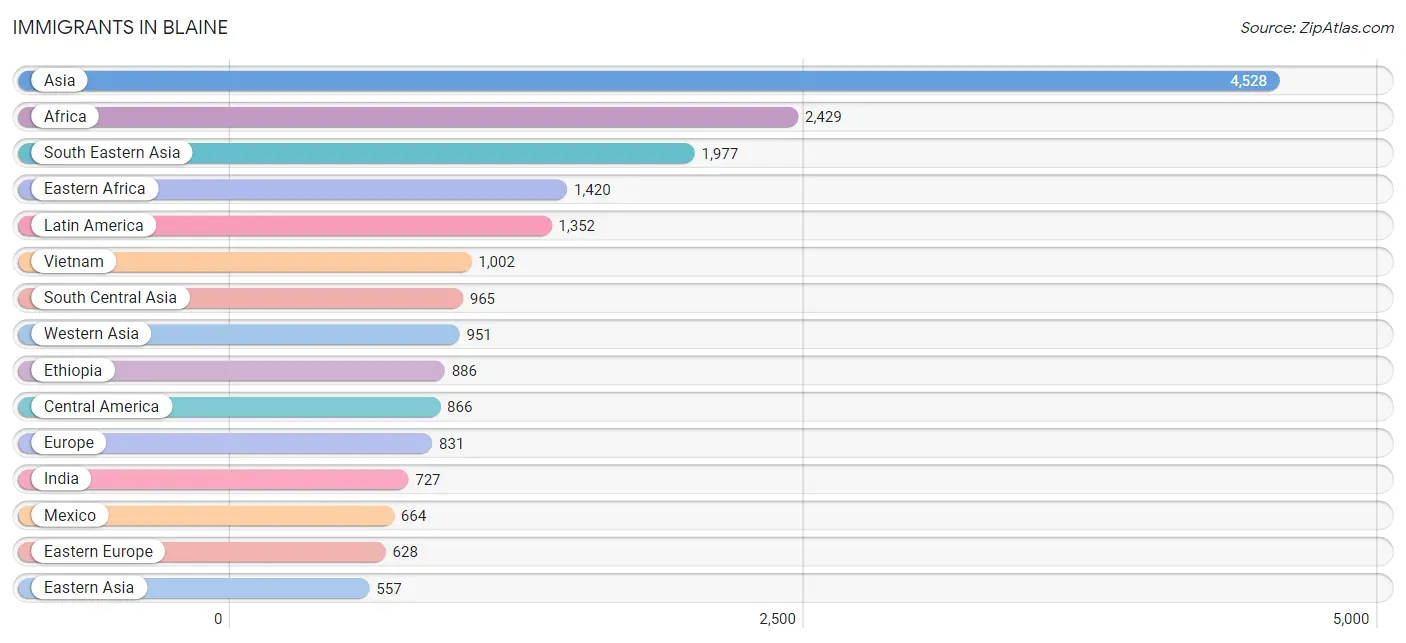
Immigrants in Blaine
The most numerous immigrant groups reported in Blaine came from Asia (4,528 | 6.5%), Africa (2,429 | 3.5%), South Eastern Asia (1,977 | 2.8%), Eastern Africa (1,420 | 2.0%), and Latin America (1,352 | 1.9%), together accounting for 16.7% of all Blaine residents.
| Immigration Origin | # Population | % Population |
| Africa | 2,429 | 3.5% |
| Asia | 4,528 | 6.5% |
| Australia | 6 | 0.0% |
| Belarus | 34 | 0.1% |
| Bosnia and Herzegovina | 189 | 0.3% |
| Cameroon | 191 | 0.3% |
| Canada | 127 | 0.2% |
| Central America | 866 | 1.2% |
| China | 368 | 0.5% |
| Colombia | 61 | 0.1% |
| Croatia | 12 | 0.0% |
| Eastern Africa | 1,420 | 2.0% |
| Eastern Asia | 557 | 0.8% |
| Eastern Europe | 628 | 0.9% |
| Ecuador | 103 | 0.2% |
| Egypt | 219 | 0.3% |
| El Salvador | 101 | 0.1% |
| England | 35 | 0.1% |
| Eritrea | 168 | 0.2% |
| Ethiopia | 886 | 1.3% |
| Europe | 831 | 1.2% |
| Germany | 115 | 0.2% |
| Ghana | 21 | 0.0% |
| Guatemala | 27 | 0.0% |
| Guyana | 264 | 0.4% |
| Honduras | 5 | 0.0% |
| Hong Kong | 9 | 0.0% |
| Hungary | 35 | 0.1% |
| India | 727 | 1.0% |
| Iraq | 480 | 0.7% |
| Italy | 28 | 0.0% |
| Japan | 18 | 0.0% |
| Jordan | 174 | 0.3% |
| Kenya | 142 | 0.2% |
| Korea | 171 | 0.2% |
| Kuwait | 51 | 0.1% |
| Laos | 357 | 0.5% |
| Latin America | 1,352 | 1.9% |
| Latvia | 36 | 0.1% |
| Lebanon | 91 | 0.1% |
| Liberia | 256 | 0.4% |
| Malaysia | 9 | 0.0% |
| Mexico | 664 | 0.9% |
| Middle Africa | 207 | 0.3% |
| Moldova | 80 | 0.1% |
| Morocco | 12 | 0.0% |
| Nepal | 13 | 0.0% |
| Nicaragua | 69 | 0.1% |
| Nigeria | 36 | 0.1% |
| Northern Africa | 240 | 0.3% |
| Northern Europe | 60 | 0.1% |
| Oceania | 6 | 0.0% |
| Pakistan | 225 | 0.3% |
| Peru | 51 | 0.1% |
| Philippines | 235 | 0.3% |
| Poland | 83 | 0.1% |
| Romania | 27 | 0.0% |
| Russia | 35 | 0.1% |
| Saudi Arabia | 108 | 0.2% |
| Serbia | 29 | 0.0% |
| Sierra Leone | 12 | 0.0% |
| Somalia | 141 | 0.2% |
| South America | 486 | 0.7% |
| South Central Asia | 965 | 1.4% |
| South Eastern Asia | 1,977 | 2.8% |
| Southern Europe | 28 | 0.0% |
| Syria | 11 | 0.0% |
| Thailand | 374 | 0.5% |
| Ukraine | 39 | 0.1% |
| Vietnam | 1,002 | 1.4% |
| Western Africa | 325 | 0.5% |
| Western Asia | 951 | 1.4% |
| Western Europe | 115 | 0.2% |
| Zaire | 16 | 0.0% | View All 74 Rows |
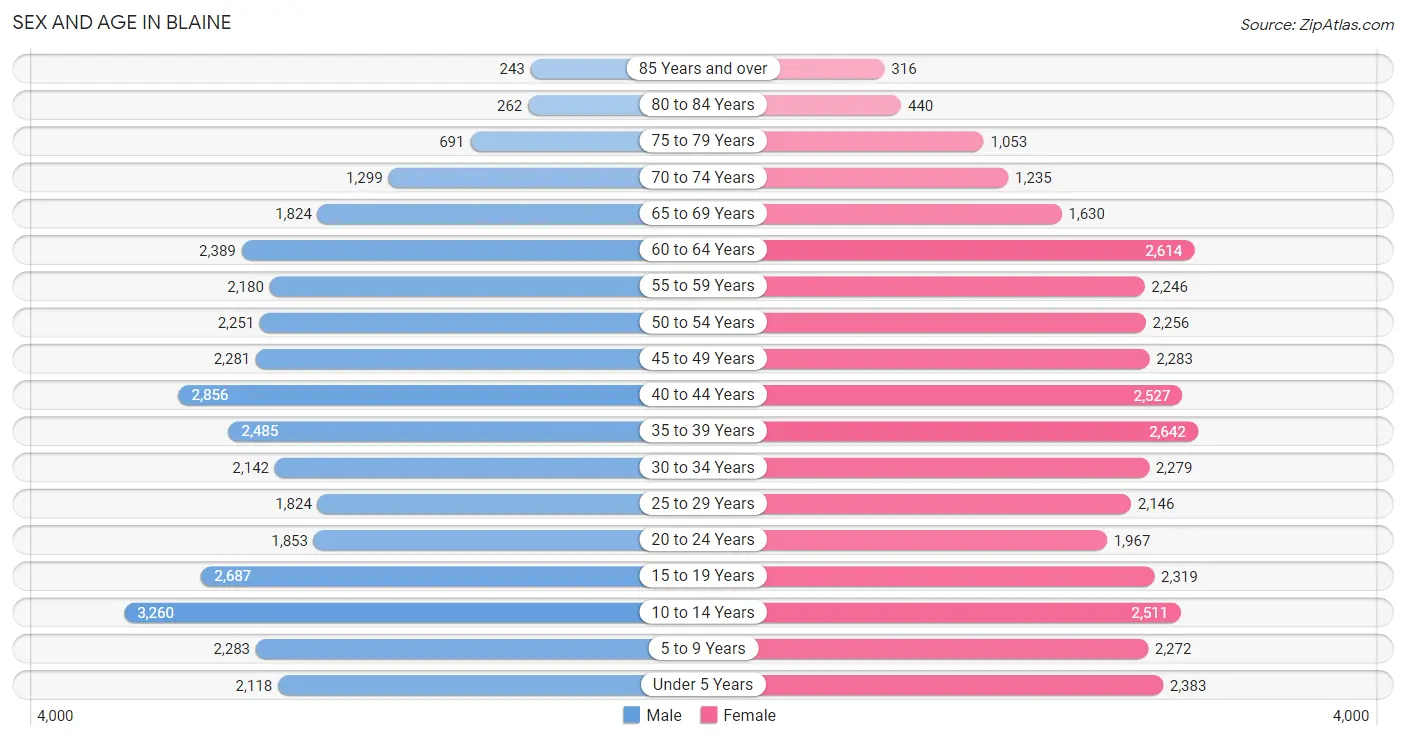
Sex and Age in Blaine
Sex and Age in Blaine
The most populous age groups in Blaine are 10 to 14 Years (3,260 | 9.3%) for men and 35 to 39 Years (2,642 | 7.5%) for women.
| Age Bracket | Male | Female |
| Under 5 Years | 2,118 (6.1%) | 2,383 (6.8%) |
| 5 to 9 Years | 2,283 (6.5%) | 2,272 (6.5%) |
| 10 to 14 Years | 3,260 (9.3%) | 2,511 (7.1%) |
| 15 to 19 Years | 2,687 (7.7%) | 2,319 (6.6%) |
| 20 to 24 Years | 1,853 (5.3%) | 1,967 (5.6%) |
| 25 to 29 Years | 1,824 (5.2%) | 2,146 (6.1%) |
| 30 to 34 Years | 2,142 (6.1%) | 2,279 (6.5%) |
| 35 to 39 Years | 2,485 (7.1%) | 2,642 (7.5%) |
| 40 to 44 Years | 2,856 (8.2%) | 2,527 (7.2%) |
| 45 to 49 Years | 2,281 (6.5%) | 2,283 (6.5%) |
| 50 to 54 Years | 2,251 (6.4%) | 2,256 (6.4%) |
| 55 to 59 Years | 2,180 (6.2%) | 2,246 (6.4%) |
| 60 to 64 Years | 2,389 (6.8%) | 2,614 (7.4%) |
| 65 to 69 Years | 1,824 (5.2%) | 1,630 (4.6%) |
| 70 to 74 Years | 1,299 (3.7%) | 1,235 (3.5%) |
| 75 to 79 Years | 691 (2.0%) | 1,053 (3.0%) |
| 80 to 84 Years | 262 (0.7%) | 440 (1.3%) |
| 85 Years and over | 243 (0.7%) | 316 (0.9%) |
| Total | 34,928 (100.0%) | 35,119 (100.0%) |
Families and Households in Blaine
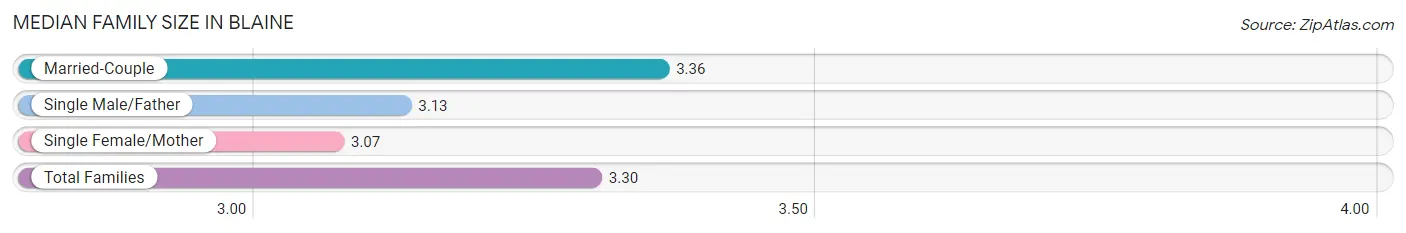
Median Family Size in Blaine
The median family size in Blaine is 3.30 persons per family, with married-couple families (14,117 | 79.9%) accounting for the largest median family size of 3.36 persons per family. On the other hand, single female/mother families (2,515 | 14.2%) represent the smallest median family size with 3.07 persons per family.
| Family Type | # Families | Family Size |
| Married-Couple | 14,117 (79.9%) | 3.36 |
| Single Male/Father | 1,043 (5.9%) | 3.13 |
| Single Female/Mother | 2,515 (14.2%) | 3.07 |
| Total Families | 17,675 (100.0%) | 3.30 |
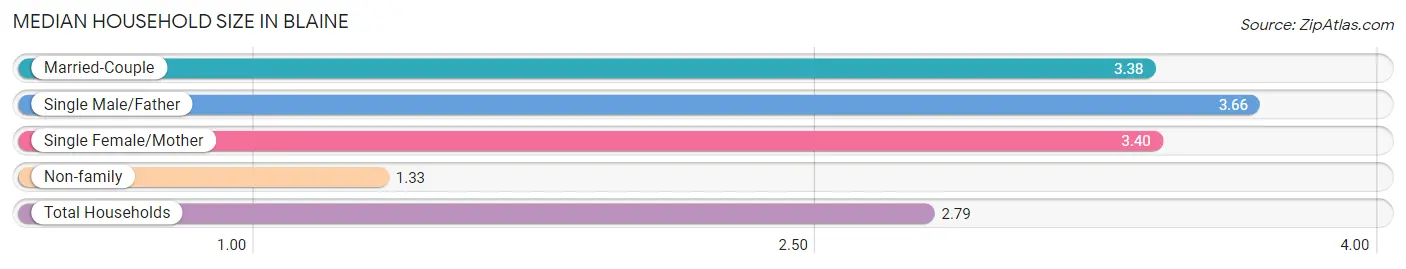
Median Household Size in Blaine
The median household size in Blaine is 2.79 persons per household, with single male/father households (1,043 | 4.2%) accounting for the largest median household size of 3.66 persons per household. non-family households (7,374 | 29.4%) represent the smallest median household size with 1.33 persons per household.
| Household Type | # Households | Household Size |
| Married-Couple | 14,117 (56.4%) | 3.38 |
| Single Male/Father | 1,043 (4.2%) | 3.66 |
| Single Female/Mother | 2,515 (10.0%) | 3.40 |
| Non-family | 7,374 (29.4%) | 1.33 |
| Total Households | 25,049 (100.0%) | 2.79 |
Household Size by Marriage Status in Blaine
Out of a total of 25,049 households in Blaine, 17,675 (70.6%) are family households, while 7,374 (29.4%) are nonfamily households. The most numerous type of family households are 2-person households, comprising 7,209, and the most common type of nonfamily households are 1-person households, comprising 5,546.
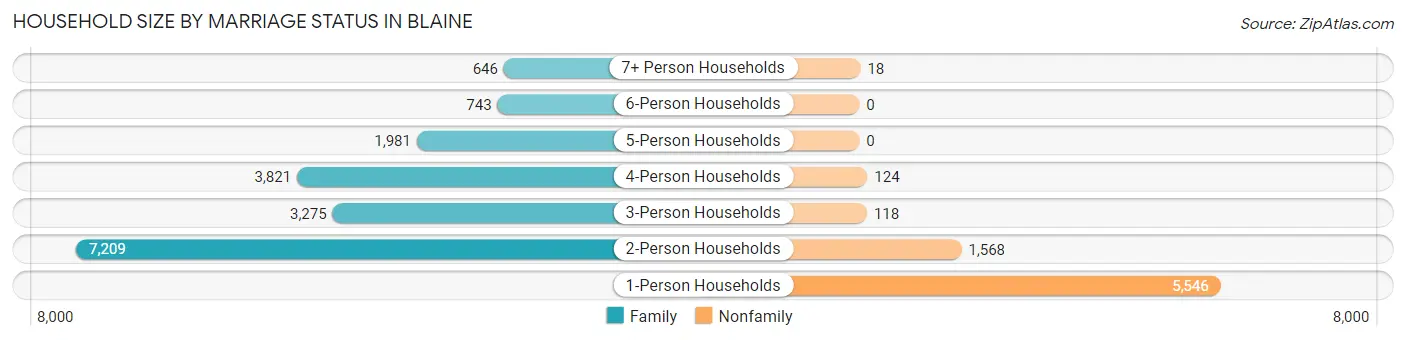
| Household Size | Family Households | Nonfamily Households |
| 1-Person Households | - | 5,546 (22.1%) |
| 2-Person Households | 7,209 (28.8%) | 1,568 (6.3%) |
| 3-Person Households | 3,275 (13.1%) | 118 (0.5%) |
| 4-Person Households | 3,821 (15.2%) | 124 (0.5%) |
| 5-Person Households | 1,981 (7.9%) | 0 (0.0%) |
| 6-Person Households | 743 (3.0%) | 0 (0.0%) |
| 7+ Person Households | 646 (2.6%) | 18 (0.1%) |
| Total | 17,675 (70.6%) | 7,374 (29.4%) |
Female Fertility in Blaine
Fertility by Age in Blaine
Average fertility rate in Blaine is 67.0 births per 1,000 women. Women in the age bracket of 20 to 34 years have the highest fertility rate with 96.0 births per 1,000 women. Women in the age bracket of 20 to 34 years acount for 55.3% of all women with births.
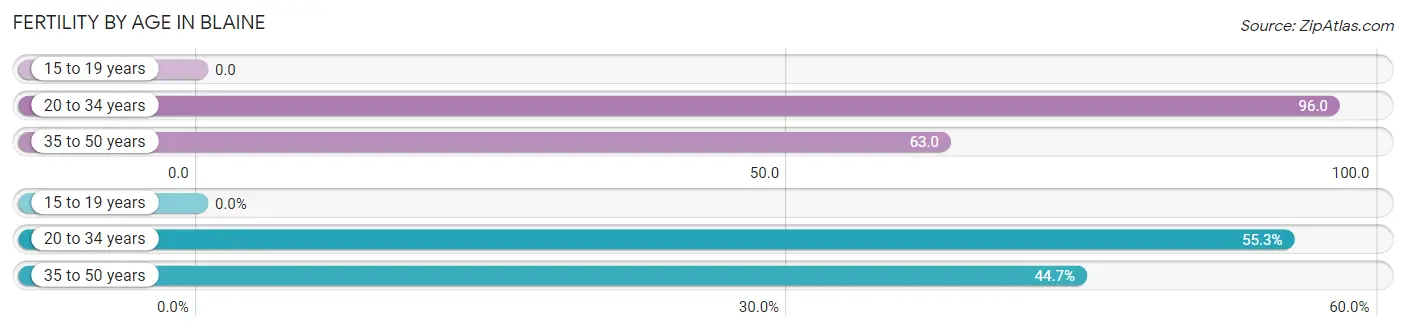
| Age Bracket | Women with Births | Births / 1,000 Women |
| 15 to 19 years | 0 (0.0%) | 0.0 |
| 20 to 34 years | 612 (55.3%) | 96.0 |
| 35 to 50 years | 495 (44.7%) | 63.0 |
| Total | 1,107 (100.0%) | 67.0 |
Fertility by Age by Marriage Status in Blaine
92.8% of women with births (1,107) in Blaine are married. The highest percentage of unmarried women with births falls into 20 to 34 years age bracket with 10.0% of them unmarried at the time of birth, while the lowest percentage of unmarried women with births belong to 35 to 50 years age bracket with 3.8% of them unmarried.
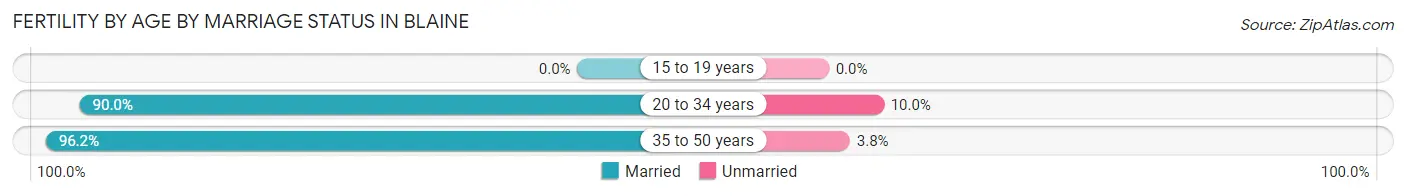
| Age Bracket | Married | Unmarried |
| 15 to 19 years | 0 (0.0%) | 0 (0.0%) |
| 20 to 34 years | 551 (90.0%) | 61 (10.0%) |
| 35 to 50 years | 476 (96.2%) | 19 (3.8%) |
| Total | 1,027 (92.8%) | 80 (7.2%) |
Fertility by Education in Blaine
Average fertility rate in Blaine is 67.0 births per 1,000 women. Women with the education attainment of bachelor's degree have the highest fertility rate of 94.0 births per 1,000 women, while women with the education attainment of less than high school have the lowest fertility at 12.0 births per 1,000 women. Women with the education attainment of bachelor's degree represent 36.1% of all women with births.
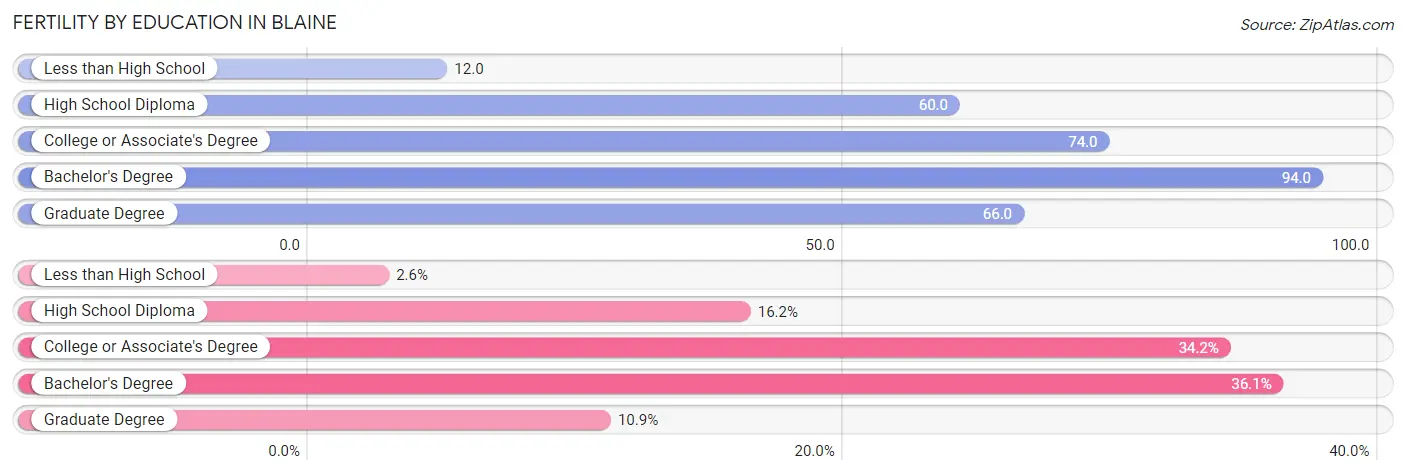
| Educational Attainment | Women with Births | Births / 1,000 Women |
| Less than High School | 29 (2.6%) | 12.0 |
| High School Diploma | 179 (16.2%) | 60.0 |
| College or Associate's Degree | 378 (34.2%) | 74.0 |
| Bachelor's Degree | 400 (36.1%) | 94.0 |
| Graduate Degree | 121 (10.9%) | 66.0 |
| Total | 1,107 (100.0%) | 67.0 |
Fertility by Education by Marriage Status in Blaine
7.2% of women with births in Blaine are unmarried. Women with the educational attainment of bachelor's degree are most likely to be married with 100.0% of them married at childbirth, while women with the educational attainment of less than high school are least likely to be married with 65.5% of them unmarried at childbirth.
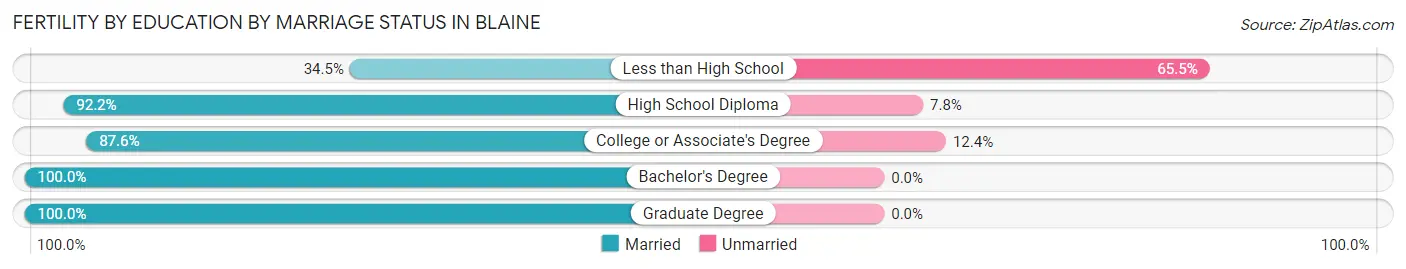
| Educational Attainment | Married | Unmarried |
| Less than High School | 10 (34.5%) | 19 (65.5%) |
| High School Diploma | 165 (92.2%) | 14 (7.8%) |
| College or Associate's Degree | 331 (87.6%) | 47 (12.4%) |
| Bachelor's Degree | 400 (100.0%) | 0 (0.0%) |
| Graduate Degree | 121 (100.0%) | 0 (0.0%) |
| Total | 1,027 (92.8%) | 80 (7.2%) |
Employment Characteristics in Blaine
Employment by Class of Employer in Blaine
Among the 35,758 employed individuals in Blaine, private company employees (25,280 | 70.7%), not-for-profit organizations (3,041 | 8.5%), and local government employees (2,683 | 7.5%) make up the most common classes of employment.
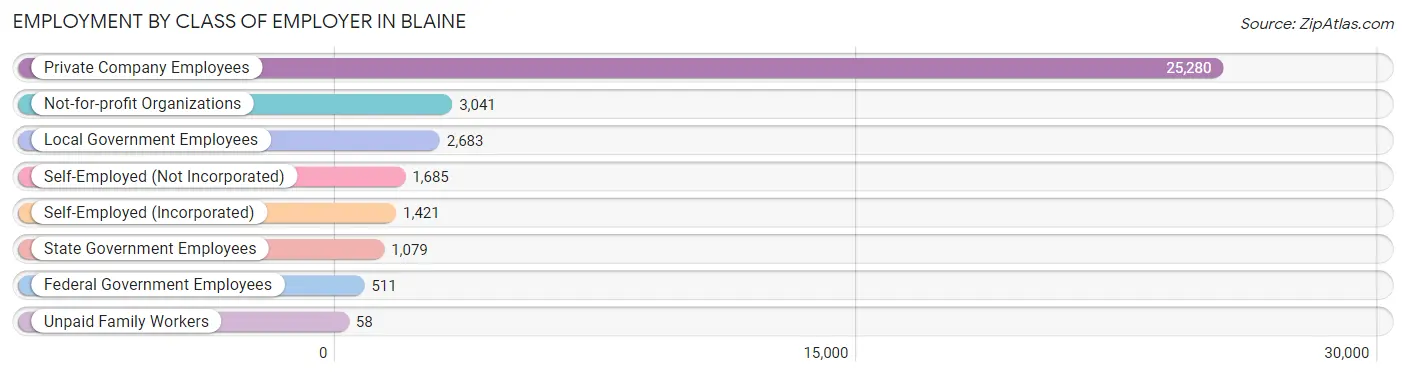
| Employer Class | # Employees | % Employees |
| Private Company Employees | 25,280 | 70.7% |
| Self-Employed (Incorporated) | 1,421 | 4.0% |
| Self-Employed (Not Incorporated) | 1,685 | 4.7% |
| Not-for-profit Organizations | 3,041 | 8.5% |
| Local Government Employees | 2,683 | 7.5% |
| State Government Employees | 1,079 | 3.0% |
| Federal Government Employees | 511 | 1.4% |
| Unpaid Family Workers | 58 | 0.2% |
| Total | 35,758 | 100.0% |
Employment Status by Age in Blaine
According to the labor force statistics for Blaine, out of the total population over 16 years of age (54,142), 71.1% or 38,495 individuals are in the labor force, with 4.4% or 1,694 of them unemployed. The age group with the highest labor force participation rate is 20 to 24 years, with 91.6% or 3,499 individuals in the labor force. Within the labor force, the 16 to 19 years age range has the highest percentage of unemployed individuals, with 15.6% or 300 of them being unemployed.
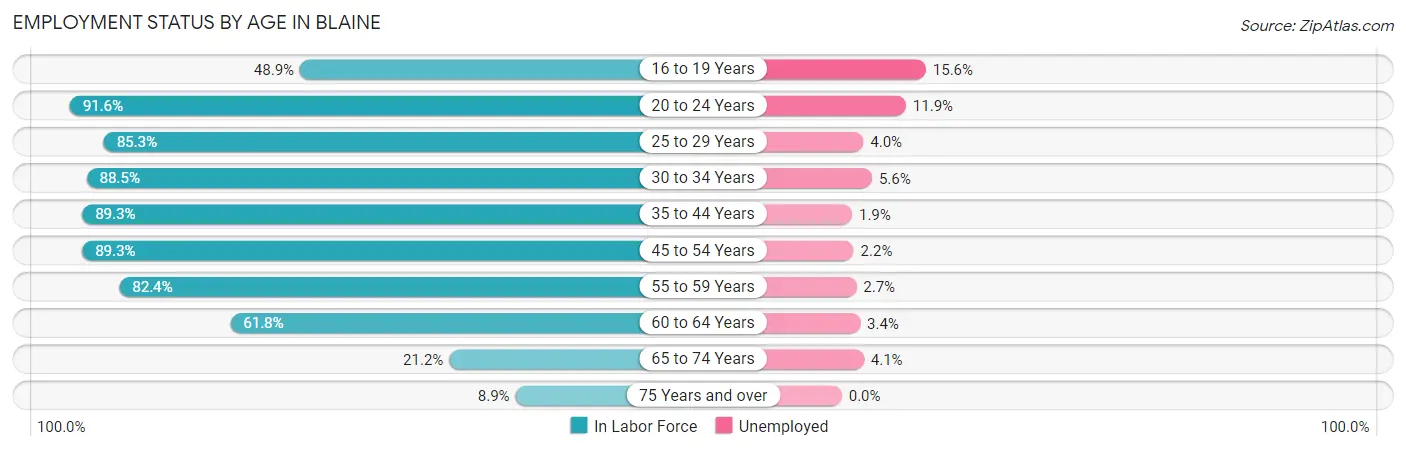
| Age Bracket | In Labor Force | Unemployed |
| 16 to 19 Years | 1,921 (48.9%) | 300 (15.6%) |
| 20 to 24 Years | 3,499 (91.6%) | 416 (11.9%) |
| 25 to 29 Years | 3,386 (85.3%) | 135 (4.0%) |
| 30 to 34 Years | 3,913 (88.5%) | 219 (5.6%) |
| 35 to 44 Years | 9,385 (89.3%) | 178 (1.9%) |
| 45 to 54 Years | 8,100 (89.3%) | 178 (2.2%) |
| 55 to 59 Years | 3,647 (82.4%) | 98 (2.7%) |
| 60 to 64 Years | 3,092 (61.8%) | 105 (3.4%) |
| 65 to 74 Years | 1,269 (21.2%) | 52 (4.1%) |
| 75 Years and over | 267 (8.9%) | 0 (0.0%) |
| Total | 38,495 (71.1%) | 1,694 (4.4%) |
Employment Status by Educational Attainment in Blaine
According to labor force statistics for Blaine, 84.3% of individuals (31,529) out of the total population between 25 and 64 years of age (37,401) are in the labor force, with 2.9% or 914 of them being unemployed. The group with the highest labor force participation rate are those with the educational attainment of bachelor's degree or higher, with 89.6% or 12,898 individuals in the labor force. Within the labor force, individuals with high school diploma education have the highest percentage of unemployment, with 5.7% or 398 of them being unemployed.
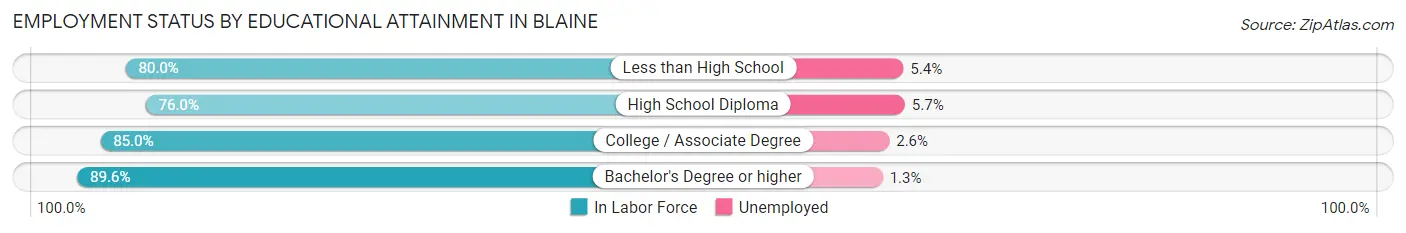
| Educational Attainment | In Labor Force | Unemployed |
| Less than High School | 1,586 (80.0%) | 107 (5.4%) |
| High School Diploma | 6,983 (76.0%) | 524 (5.7%) |
| College / Associate Degree | 10,061 (85.0%) | 308 (2.6%) |
| Bachelor's Degree or higher | 12,898 (89.6%) | 187 (1.3%) |
| Total | 31,529 (84.3%) | 1,085 (2.9%) |
Employment Occupations by Sex in Blaine
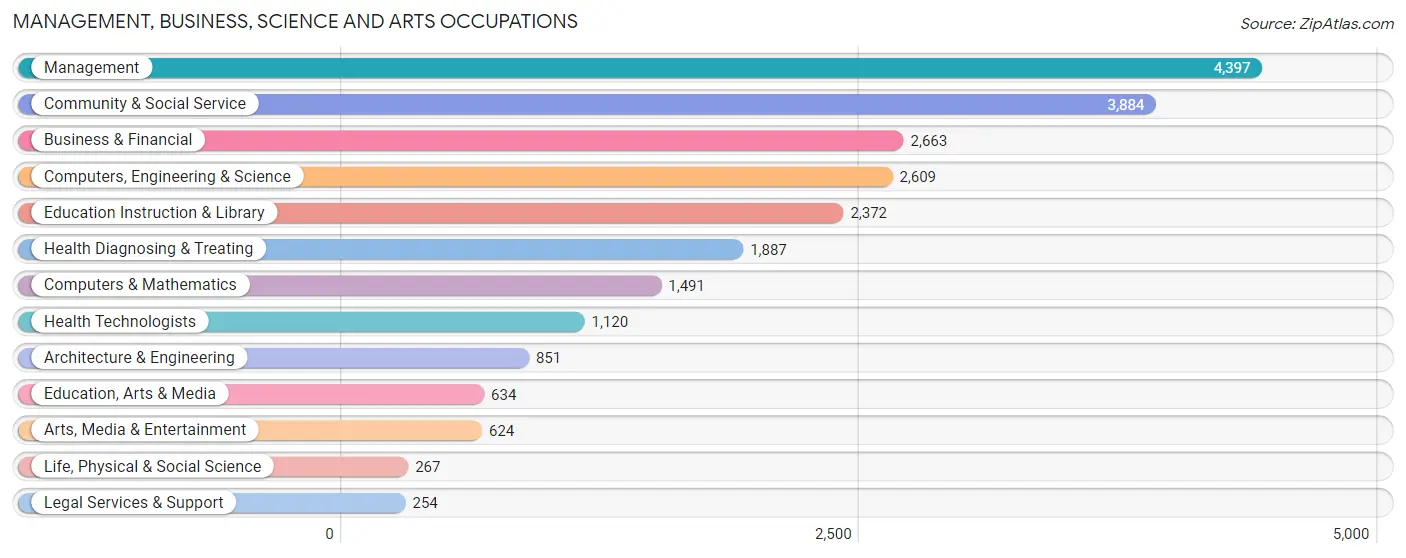
Management, Business, Science and Arts Occupations
The most common Management, Business, Science and Arts occupations in Blaine are Management (4,397 | 12.0%), Community & Social Service (3,884 | 10.6%), Business & Financial (2,663 | 7.2%), Computers, Engineering & Science (2,609 | 7.1%), and Education Instruction & Library (2,372 | 6.5%).
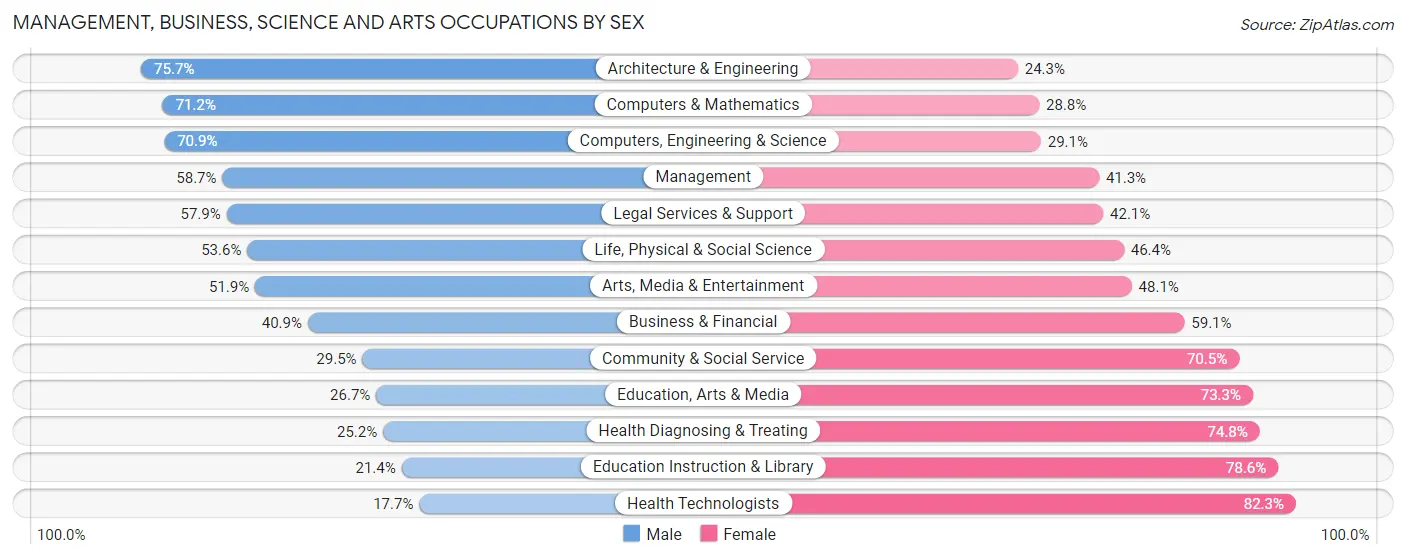
Management, Business, Science and Arts Occupations by Sex
Within the Management, Business, Science and Arts occupations in Blaine, the most male-oriented occupations are Architecture & Engineering (75.7%), Computers & Mathematics (71.2%), and Computers, Engineering & Science (70.9%), while the most female-oriented occupations are Health Technologists (82.3%), Education Instruction & Library (78.6%), and Health Diagnosing & Treating (74.8%).
| Occupation | Male | Female |
| Management | 2,583 (58.7%) | 1,814 (41.3%) |
| Business & Financial | 1,090 (40.9%) | 1,573 (59.1%) |
| Computers, Engineering & Science | 1,849 (70.9%) | 760 (29.1%) |
| Computers & Mathematics | 1,062 (71.2%) | 429 (28.8%) |
| Architecture & Engineering | 644 (75.7%) | 207 (24.3%) |
| Life, Physical & Social Science | 143 (53.6%) | 124 (46.4%) |
| Community & Social Service | 1,147 (29.5%) | 2,737 (70.5%) |
| Education, Arts & Media | 169 (26.7%) | 465 (73.3%) |
| Legal Services & Support | 147 (57.9%) | 107 (42.1%) |
| Education Instruction & Library | 507 (21.4%) | 1,865 (78.6%) |
| Arts, Media & Entertainment | 324 (51.9%) | 300 (48.1%) |
| Health Diagnosing & Treating | 476 (25.2%) | 1,411 (74.8%) |
| Health Technologists | 198 (17.7%) | 922 (82.3%) |
| Total (Category) | 7,145 (46.3%) | 8,295 (53.7%) |
| Total (Overall) | 18,700 (50.9%) | 18,049 (49.1%) |
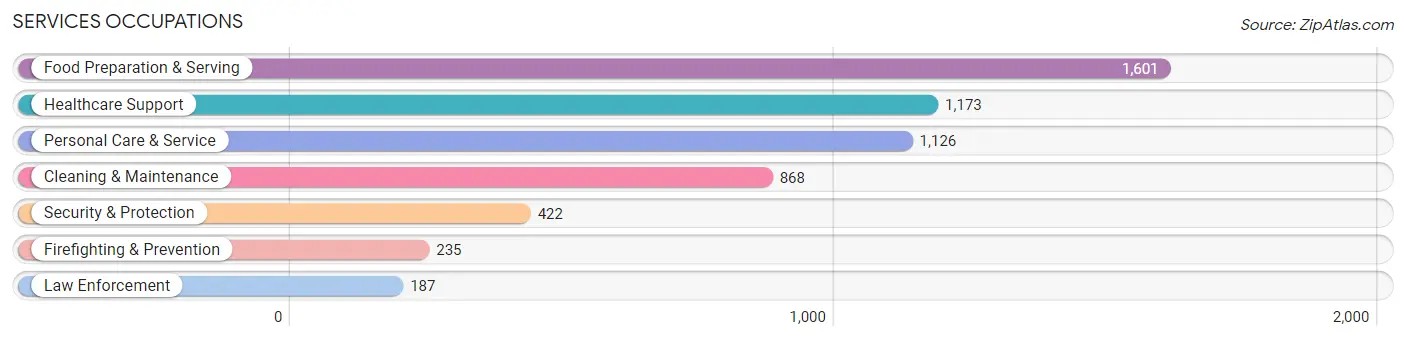
Services Occupations
The most common Services occupations in Blaine are Food Preparation & Serving (1,601 | 4.4%), Healthcare Support (1,173 | 3.2%), Personal Care & Service (1,126 | 3.1%), Cleaning & Maintenance (868 | 2.4%), and Security & Protection (422 | 1.1%).
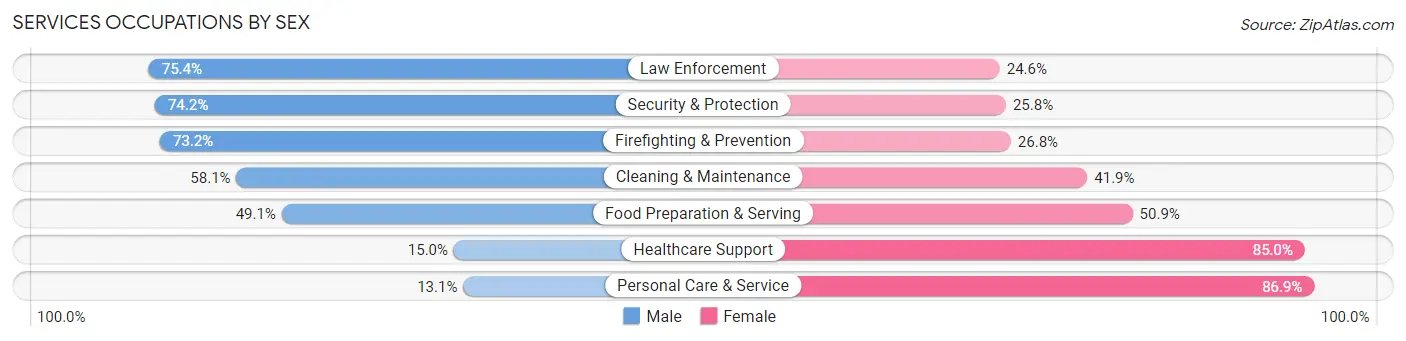
Services Occupations by Sex
Within the Services occupations in Blaine, the most male-oriented occupations are Law Enforcement (75.4%), Security & Protection (74.2%), and Firefighting & Prevention (73.2%), while the most female-oriented occupations are Personal Care & Service (86.9%), Healthcare Support (85.0%), and Food Preparation & Serving (50.9%).
| Occupation | Male | Female |
| Healthcare Support | 176 (15.0%) | 997 (85.0%) |
| Security & Protection | 313 (74.2%) | 109 (25.8%) |
| Firefighting & Prevention | 172 (73.2%) | 63 (26.8%) |
| Law Enforcement | 141 (75.4%) | 46 (24.6%) |
| Food Preparation & Serving | 786 (49.1%) | 815 (50.9%) |
| Cleaning & Maintenance | 504 (58.1%) | 364 (41.9%) |
| Personal Care & Service | 148 (13.1%) | 978 (86.9%) |
| Total (Category) | 1,927 (37.1%) | 3,263 (62.9%) |
| Total (Overall) | 18,700 (50.9%) | 18,049 (49.1%) |
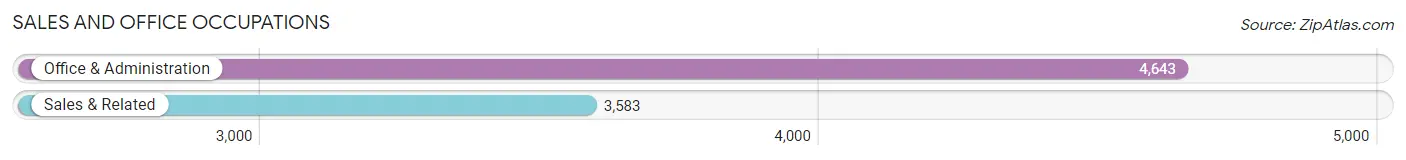
Sales and Office Occupations
The most common Sales and Office occupations in Blaine are Office & Administration (4,643 | 12.6%), and Sales & Related (3,583 | 9.8%).
Sales and Office Occupations by Sex
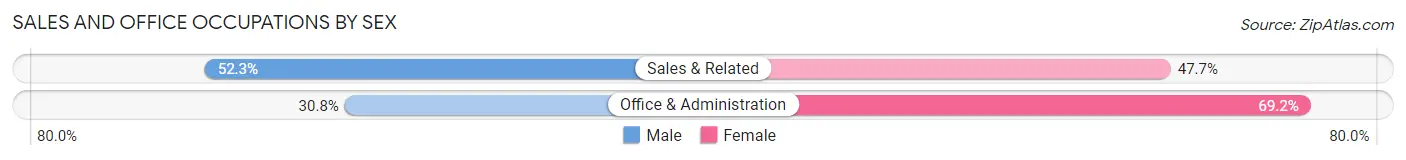
| Occupation | Male | Female |
| Sales & Related | 1,873 (52.3%) | 1,710 (47.7%) |
| Office & Administration | 1,428 (30.8%) | 3,215 (69.2%) |
| Total (Category) | 3,301 (40.1%) | 4,925 (59.9%) |
| Total (Overall) | 18,700 (50.9%) | 18,049 (49.1%) |
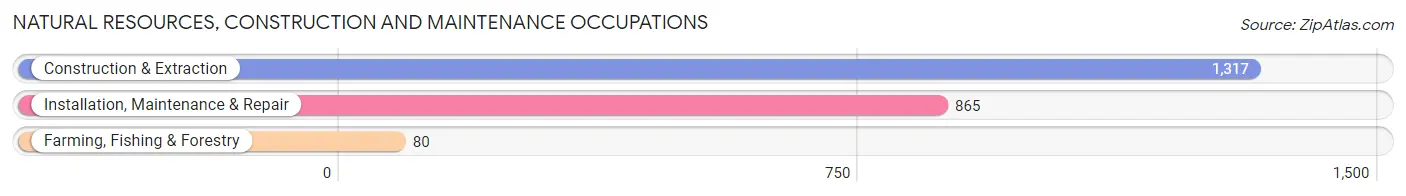
Natural Resources, Construction and Maintenance Occupations
The most common Natural Resources, Construction and Maintenance occupations in Blaine are Construction & Extraction (1,317 | 3.6%), Installation, Maintenance & Repair (865 | 2.4%), and Farming, Fishing & Forestry (80 | 0.2%).
Natural Resources, Construction and Maintenance Occupations by Sex
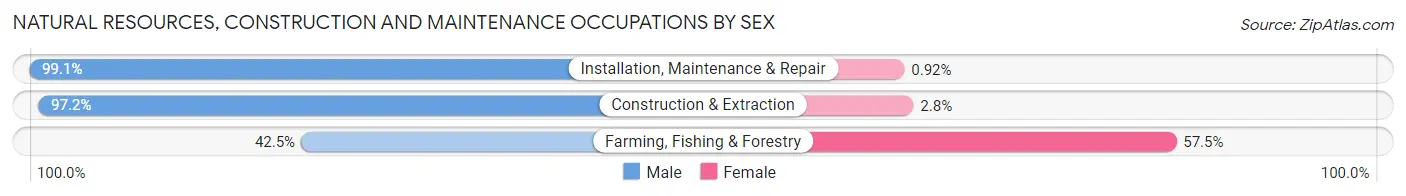
| Occupation | Male | Female |
| Farming, Fishing & Forestry | 34 (42.5%) | 46 (57.5%) |
| Construction & Extraction | 1,280 (97.2%) | 37 (2.8%) |
| Installation, Maintenance & Repair | 857 (99.1%) | 8 (0.9%) |
| Total (Category) | 2,171 (96.0%) | 91 (4.0%) |
| Total (Overall) | 18,700 (50.9%) | 18,049 (49.1%) |
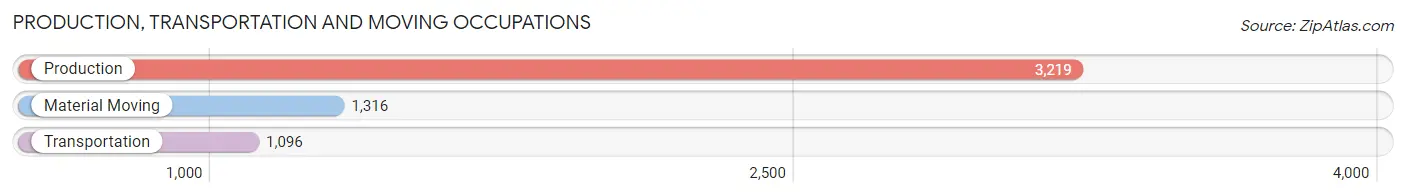
Production, Transportation and Moving Occupations
The most common Production, Transportation and Moving occupations in Blaine are Production (3,219 | 8.8%), Material Moving (1,316 | 3.6%), and Transportation (1,096 | 3.0%).
Production, Transportation and Moving Occupations by Sex
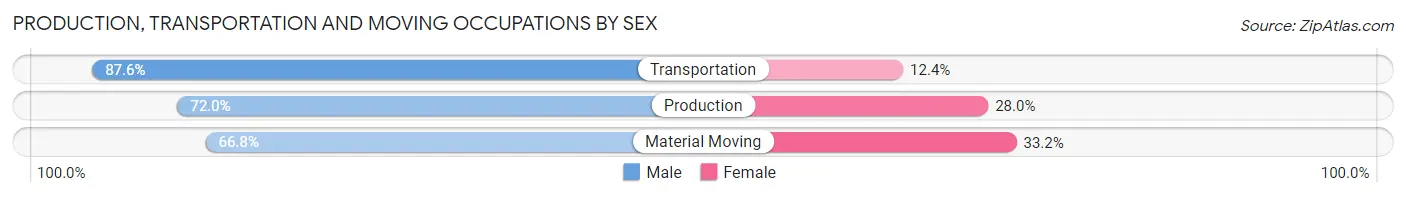
| Occupation | Male | Female |
| Production | 2,317 (72.0%) | 902 (28.0%) |
| Transportation | 960 (87.6%) | 136 (12.4%) |
| Material Moving | 879 (66.8%) | 437 (33.2%) |
| Total (Category) | 4,156 (73.8%) | 1,475 (26.2%) |
| Total (Overall) | 18,700 (50.9%) | 18,049 (49.1%) |
Employment Industries by Sex in Blaine
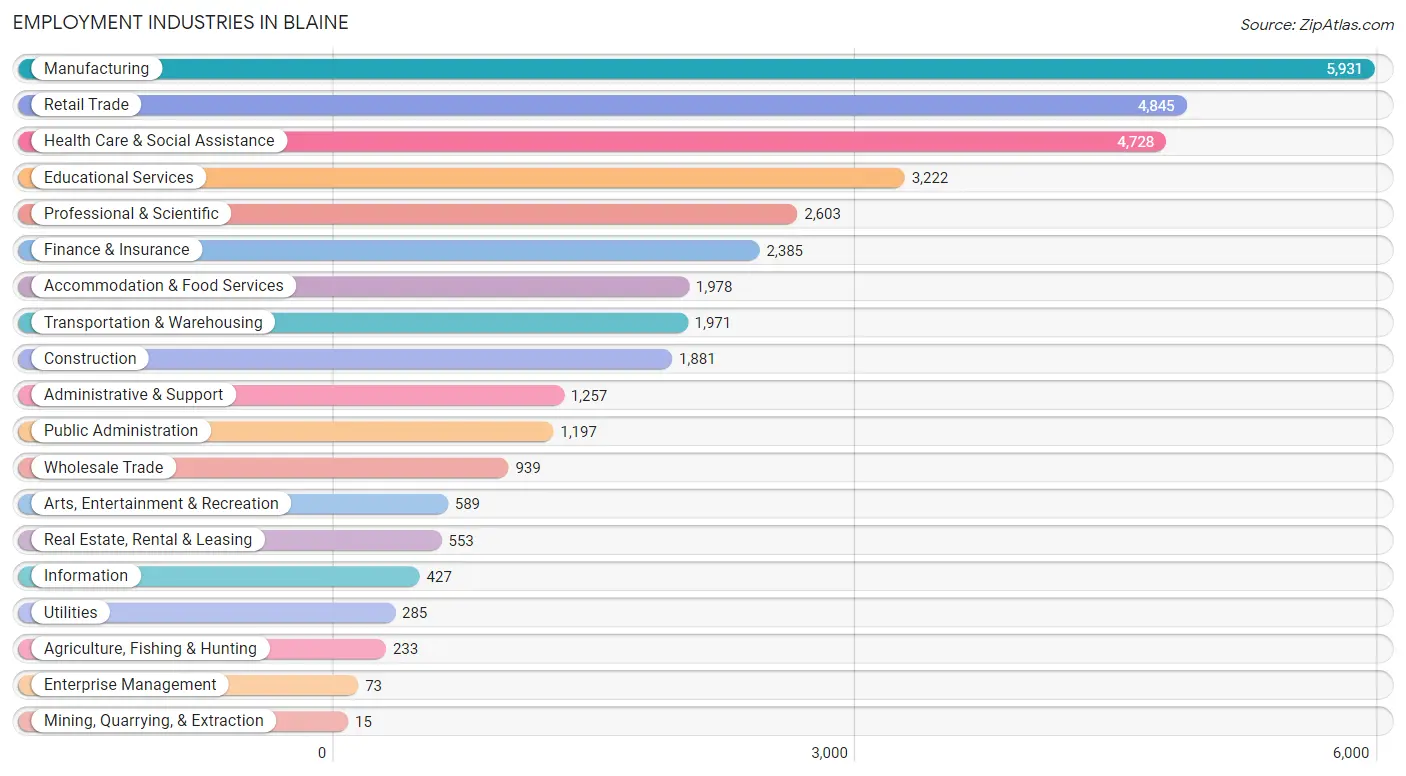
Employment Industries in Blaine
The major employment industries in Blaine include Manufacturing (5,931 | 16.1%), Retail Trade (4,845 | 13.2%), Health Care & Social Assistance (4,728 | 12.9%), Educational Services (3,222 | 8.8%), and Professional & Scientific (2,603 | 7.1%).
Employment Industries by Sex in Blaine
The Blaine industries that see more men than women are Mining, Quarrying, & Extraction (100.0%), Utilities (92.6%), and Construction (90.1%), whereas the industries that tend to have a higher number of women are Health Care & Social Assistance (84.6%), Educational Services (74.1%), and Information (59.7%).

| Industry | Male | Female |
| Agriculture, Fishing & Hunting | 118 (50.6%) | 115 (49.4%) |
| Mining, Quarrying, & Extraction | 15 (100.0%) | 0 (0.0%) |
| Construction | 1,694 (90.1%) | 187 (9.9%) |
| Manufacturing | 3,990 (67.3%) | 1,941 (32.7%) |
| Wholesale Trade | 620 (66.0%) | 319 (34.0%) |
| Retail Trade | 2,470 (51.0%) | 2,375 (49.0%) |
| Transportation & Warehousing | 1,497 (75.9%) | 474 (24.0%) |
| Utilities | 264 (92.6%) | 21 (7.4%) |
| Information | 172 (40.3%) | 255 (59.7%) |
| Finance & Insurance | 1,302 (54.6%) | 1,083 (45.4%) |
| Real Estate, Rental & Leasing | 264 (47.7%) | 289 (52.3%) |
| Professional & Scientific | 1,473 (56.6%) | 1,130 (43.4%) |
| Enterprise Management | 30 (41.1%) | 43 (58.9%) |
| Administrative & Support | 619 (49.2%) | 638 (50.8%) |
| Educational Services | 834 (25.9%) | 2,388 (74.1%) |
| Health Care & Social Assistance | 726 (15.4%) | 4,002 (84.6%) |
| Arts, Entertainment & Recreation | 301 (51.1%) | 288 (48.9%) |
| Accommodation & Food Services | 1,019 (51.5%) | 959 (48.5%) |
| Public Administration | 508 (42.4%) | 689 (57.6%) |
| Total | 18,700 (50.9%) | 18,049 (49.1%) |
Education in Blaine
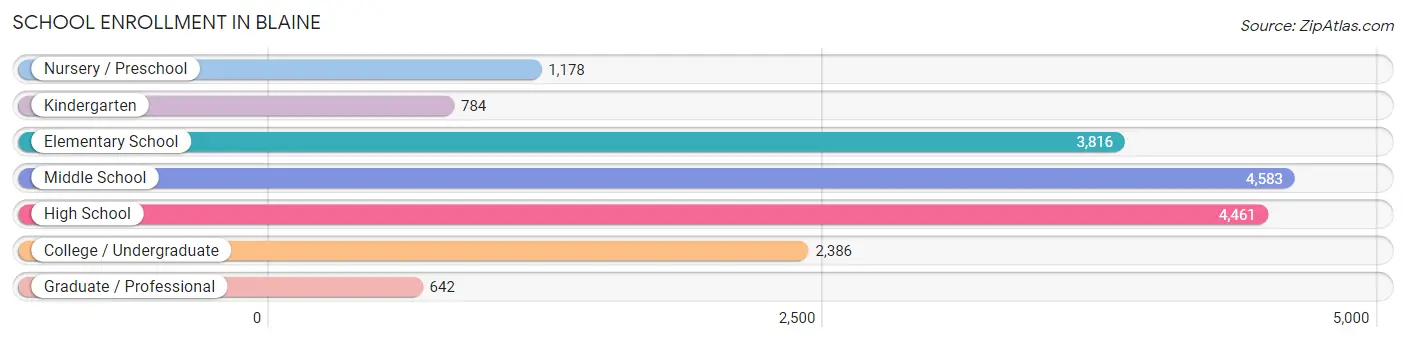
School Enrollment in Blaine
The most common levels of schooling among the 17,850 students in Blaine are middle school (4,583 | 25.7%), high school (4,461 | 25.0%), and elementary school (3,816 | 21.4%).
| School Level | # Students | % Students |
| Nursery / Preschool | 1,178 | 6.6% |
| Kindergarten | 784 | 4.4% |
| Elementary School | 3,816 | 21.4% |
| Middle School | 4,583 | 25.7% |
| High School | 4,461 | 25.0% |
| College / Undergraduate | 2,386 | 13.4% |
| Graduate / Professional | 642 | 3.6% |
| Total | 17,850 | 100.0% |
School Enrollment by Age by Funding Source in Blaine
Out of a total of 17,850 students who are enrolled in schools in Blaine, 2,088 (11.7%) attend a private institution, while the remaining 15,762 (88.3%) are enrolled in public schools. The age group of 25 to 34 year olds has the highest likelihood of being enrolled in private schools, with 477 (57.8% in the age bracket) enrolled. Conversely, the age group of 5 to 9 year old has the lowest likelihood of being enrolled in a private school, with 4,106 (95.9% in the age bracket) attending a public institution.
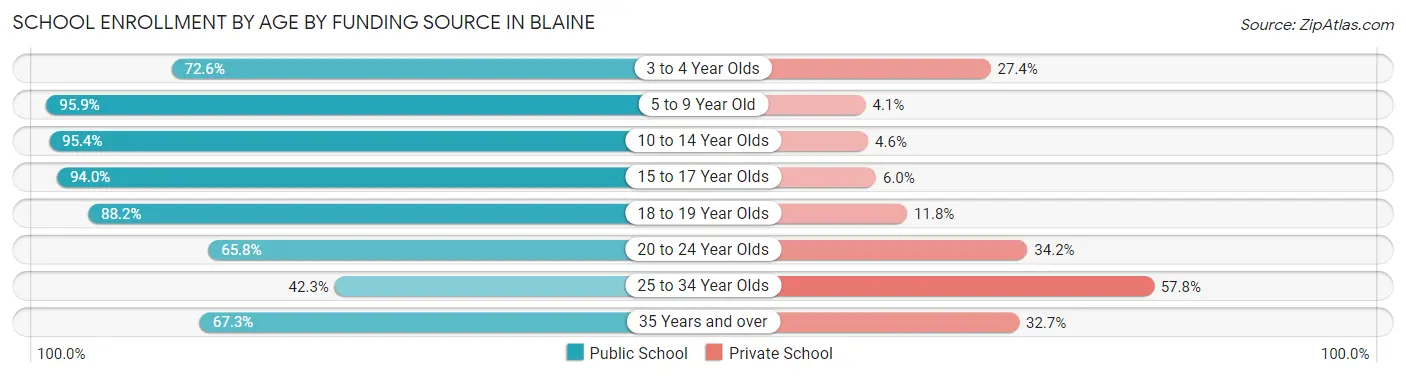
| Age Bracket | Public School | Private School |
| 3 to 4 Year Olds | 682 (72.6%) | 257 (27.4%) |
| 5 to 9 Year Old | 4,106 (95.9%) | 174 (4.1%) |
| 10 to 14 Year Olds | 5,377 (95.4%) | 257 (4.6%) |
| 15 to 17 Year Olds | 3,115 (94.0%) | 200 (6.0%) |
| 18 to 19 Year Olds | 970 (88.2%) | 130 (11.8%) |
| 20 to 24 Year Olds | 696 (65.8%) | 362 (34.2%) |
| 25 to 34 Year Olds | 349 (42.2%) | 477 (57.8%) |
| 35 Years and over | 470 (67.3%) | 228 (32.7%) |
| Total | 15,762 (88.3%) | 2,088 (11.7%) |
Educational Attainment by Field of Study in Blaine
Business (4,332 | 24.5%), education (1,845 | 10.4%), science & technology (1,635 | 9.3%), engineering (1,594 | 9.0%), and communications (1,220 | 6.9%) are the most common fields of study among 17,651 individuals in Blaine who have obtained a bachelor's degree or higher.
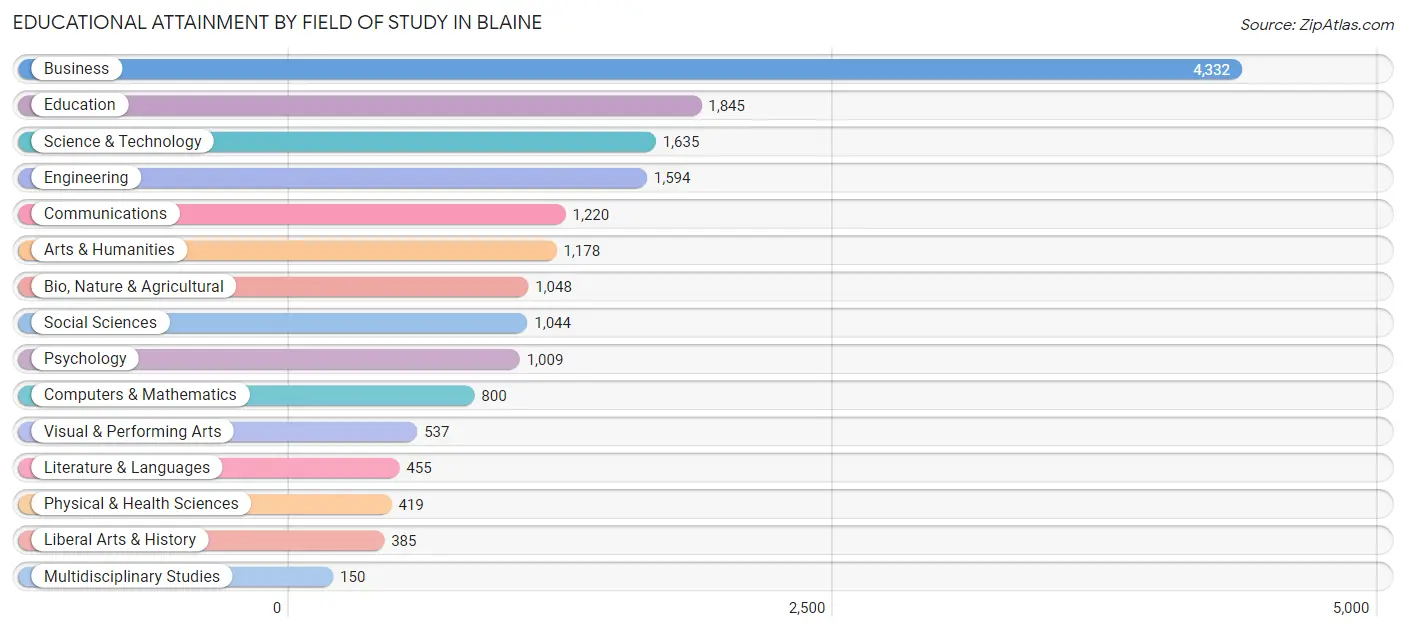
| Field of Study | # Graduates | % Graduates |
| Computers & Mathematics | 800 | 4.5% |
| Bio, Nature & Agricultural | 1,048 | 5.9% |
| Physical & Health Sciences | 419 | 2.4% |
| Psychology | 1,009 | 5.7% |
| Social Sciences | 1,044 | 5.9% |
| Engineering | 1,594 | 9.0% |
| Multidisciplinary Studies | 150 | 0.9% |
| Science & Technology | 1,635 | 9.3% |
| Business | 4,332 | 24.5% |
| Education | 1,845 | 10.4% |
| Literature & Languages | 455 | 2.6% |
| Liberal Arts & History | 385 | 2.2% |
| Visual & Performing Arts | 537 | 3.0% |
| Communications | 1,220 | 6.9% |
| Arts & Humanities | 1,178 | 6.7% |
| Total | 17,651 | 100.0% |
Transportation & Commute in Blaine
Vehicle Availability by Sex in Blaine
The most prevalent vehicle ownership categories in Blaine are males with 2 vehicles (9,792, accounting for 53.4%) and females with 2 vehicles (8,651, making up 56.4%).
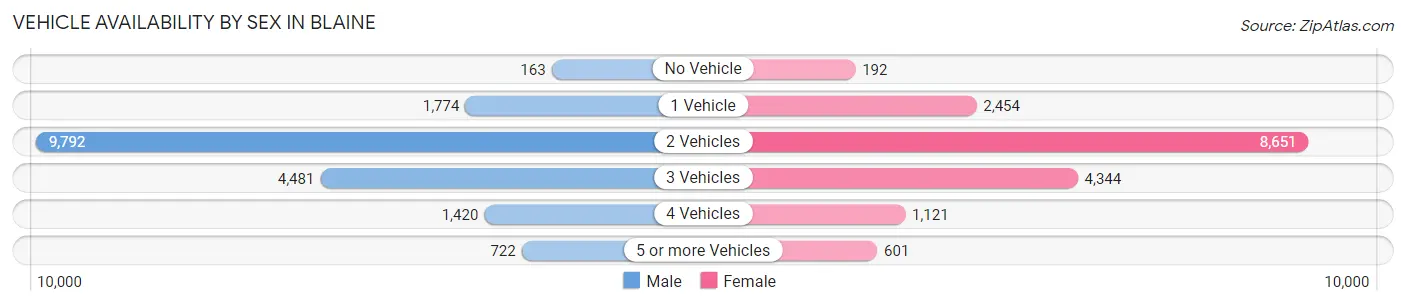
| Vehicles Available | Male | Female |
| No Vehicle | 163 (0.9%) | 192 (1.1%) |
| 1 Vehicle | 1,774 (9.7%) | 2,454 (14.1%) |
| 2 Vehicles | 9,792 (53.4%) | 8,651 (49.8%) |
| 3 Vehicles | 4,481 (24.4%) | 4,344 (25.0%) |
| 4 Vehicles | 1,420 (7.7%) | 1,121 (6.5%) |
| 5 or more Vehicles | 722 (3.9%) | 601 (3.5%) |
| Total | 18,352 (100.0%) | 17,363 (100.0%) |
Commute Time in Blaine
The most frequently occuring commute durations in Blaine are 20 to 24 minutes (5,322 commuters, 18.0%), 30 to 34 minutes (4,885 commuters, 16.5%), and 15 to 19 minutes (4,704 commuters, 15.9%).
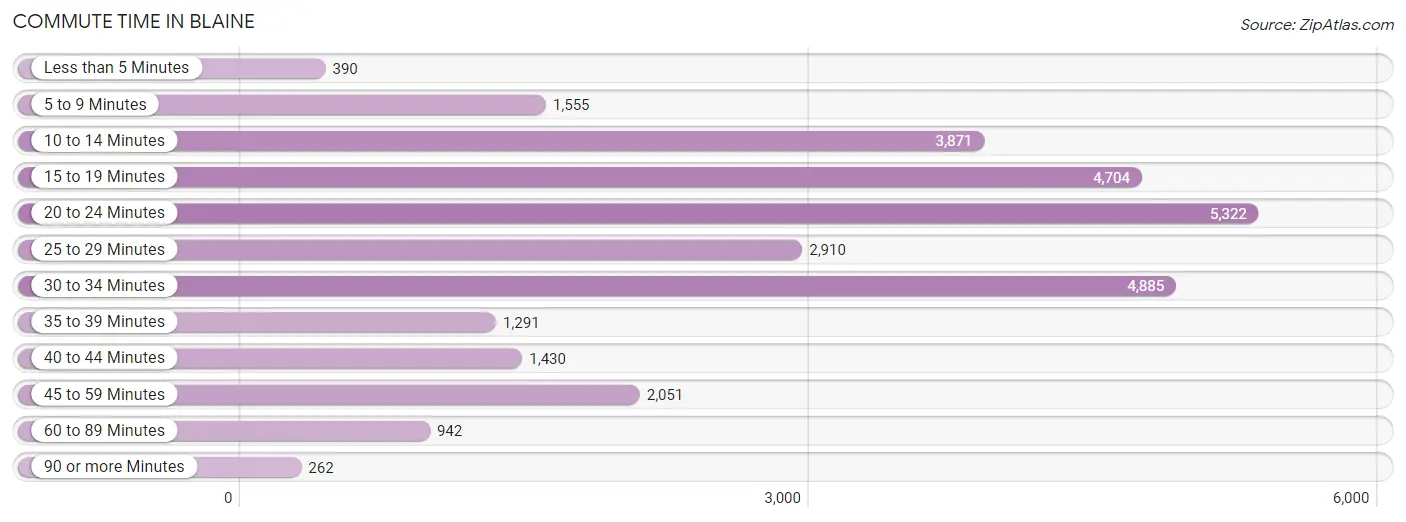
| Commute Time | # Commuters | % Commuters |
| Less than 5 Minutes | 390 | 1.3% |
| 5 to 9 Minutes | 1,555 | 5.2% |
| 10 to 14 Minutes | 3,871 | 13.1% |
| 15 to 19 Minutes | 4,704 | 15.9% |
| 20 to 24 Minutes | 5,322 | 18.0% |
| 25 to 29 Minutes | 2,910 | 9.8% |
| 30 to 34 Minutes | 4,885 | 16.5% |
| 35 to 39 Minutes | 1,291 | 4.4% |
| 40 to 44 Minutes | 1,430 | 4.8% |
| 45 to 59 Minutes | 2,051 | 6.9% |
| 60 to 89 Minutes | 942 | 3.2% |
| 90 or more Minutes | 262 | 0.9% |
Commute Time by Sex in Blaine
The most common commute times in Blaine are 30 to 34 minutes (2,864 commuters, 18.0%) for males and 20 to 24 minutes (2,661 commuters, 19.4%) for females.
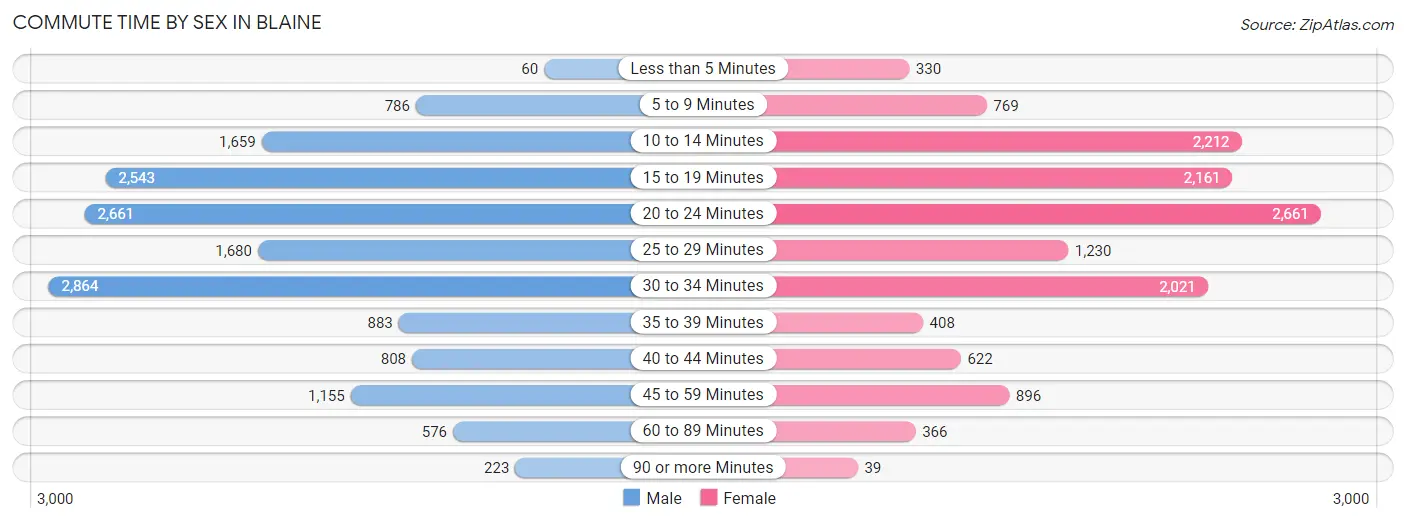
| Commute Time | Male | Female |
| Less than 5 Minutes | 60 (0.4%) | 330 (2.4%) |
| 5 to 9 Minutes | 786 (4.9%) | 769 (5.6%) |
| 10 to 14 Minutes | 1,659 (10.4%) | 2,212 (16.1%) |
| 15 to 19 Minutes | 2,543 (16.0%) | 2,161 (15.8%) |
| 20 to 24 Minutes | 2,661 (16.7%) | 2,661 (19.4%) |
| 25 to 29 Minutes | 1,680 (10.6%) | 1,230 (9.0%) |
| 30 to 34 Minutes | 2,864 (18.0%) | 2,021 (14.7%) |
| 35 to 39 Minutes | 883 (5.6%) | 408 (3.0%) |
| 40 to 44 Minutes | 808 (5.1%) | 622 (4.5%) |
| 45 to 59 Minutes | 1,155 (7.3%) | 896 (6.5%) |
| 60 to 89 Minutes | 576 (3.6%) | 366 (2.7%) |
| 90 or more Minutes | 223 (1.4%) | 39 (0.3%) |
Time of Departure to Work by Sex in Blaine
The most frequent times of departure to work in Blaine are 7:00 AM to 7:29 AM (2,217, 14.0%) for males and 7:00 AM to 7:29 AM (2,246, 16.4%) for females.
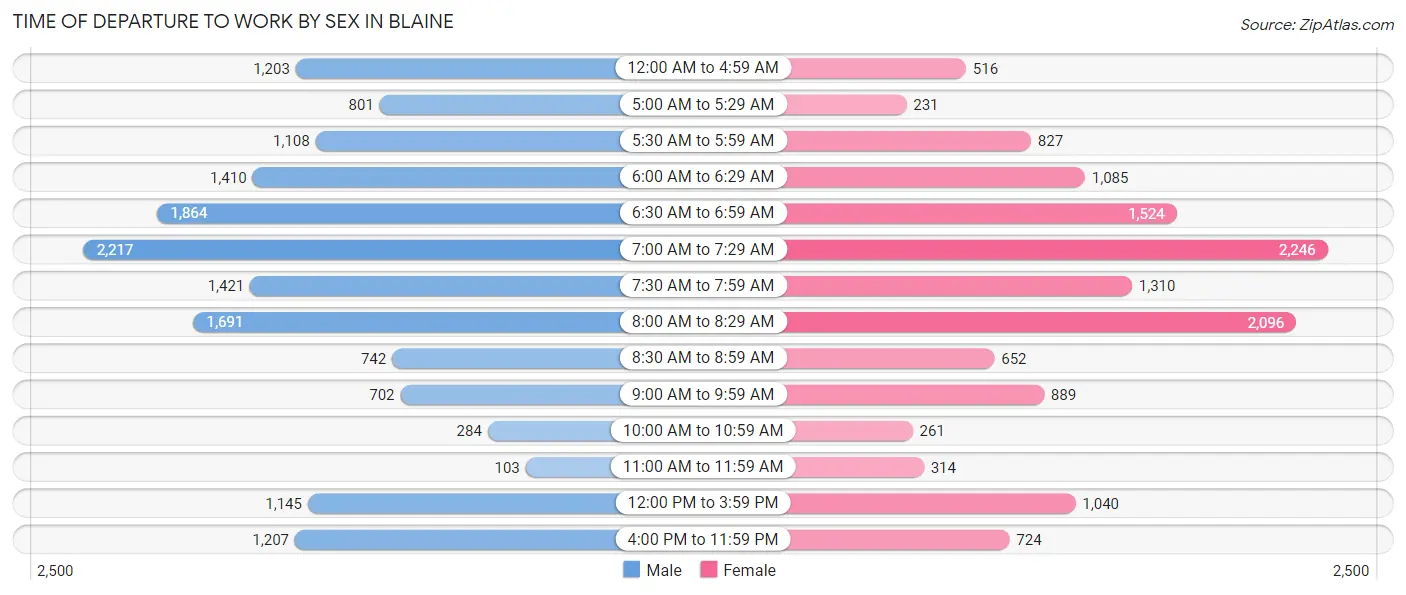
| Time of Departure | Male | Female |
| 12:00 AM to 4:59 AM | 1,203 (7.6%) | 516 (3.8%) |
| 5:00 AM to 5:29 AM | 801 (5.0%) | 231 (1.7%) |
| 5:30 AM to 5:59 AM | 1,108 (7.0%) | 827 (6.0%) |
| 6:00 AM to 6:29 AM | 1,410 (8.9%) | 1,085 (7.9%) |
| 6:30 AM to 6:59 AM | 1,864 (11.7%) | 1,524 (11.1%) |
| 7:00 AM to 7:29 AM | 2,217 (14.0%) | 2,246 (16.4%) |
| 7:30 AM to 7:59 AM | 1,421 (8.9%) | 1,310 (9.6%) |
| 8:00 AM to 8:29 AM | 1,691 (10.6%) | 2,096 (15.3%) |
| 8:30 AM to 8:59 AM | 742 (4.7%) | 652 (4.8%) |
| 9:00 AM to 9:59 AM | 702 (4.4%) | 889 (6.5%) |
| 10:00 AM to 10:59 AM | 284 (1.8%) | 261 (1.9%) |
| 11:00 AM to 11:59 AM | 103 (0.6%) | 314 (2.3%) |
| 12:00 PM to 3:59 PM | 1,145 (7.2%) | 1,040 (7.6%) |
| 4:00 PM to 11:59 PM | 1,207 (7.6%) | 724 (5.3%) |
| Total | 15,898 (100.0%) | 13,715 (100.0%) |
Housing Occupancy in Blaine
Occupancy by Ownership in Blaine
Of the total 25,049 dwellings in Blaine, owner-occupied units account for 21,368 (85.3%), while renter-occupied units make up 3,681 (14.7%).
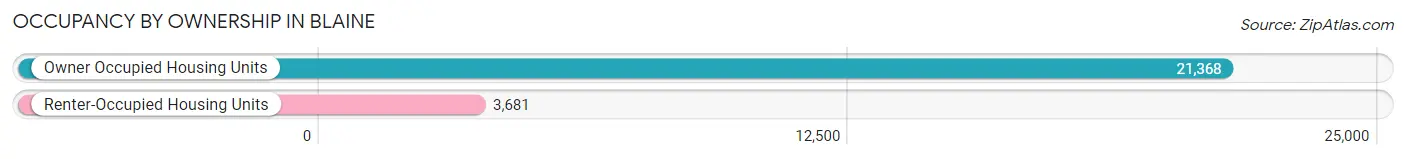
| Occupancy | # Housing Units | % Housing Units |
| Owner Occupied Housing Units | 21,368 | 85.3% |
| Renter-Occupied Housing Units | 3,681 | 14.7% |
| Total Occupied Housing Units | 25,049 | 100.0% |
Occupancy by Household Size in Blaine
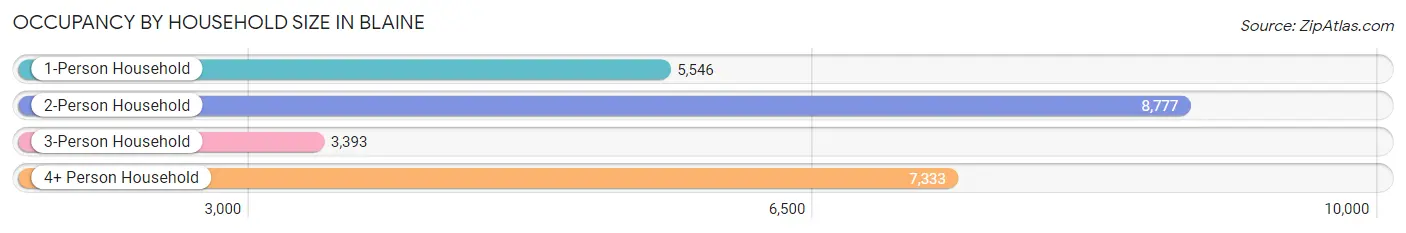
| Household Size | # Housing Units | % Housing Units |
| 1-Person Household | 5,546 | 22.1% |
| 2-Person Household | 8,777 | 35.0% |
| 3-Person Household | 3,393 | 13.6% |
| 4+ Person Household | 7,333 | 29.3% |
| Total Housing Units | 25,049 | 100.0% |
Occupancy by Ownership by Household Size in Blaine
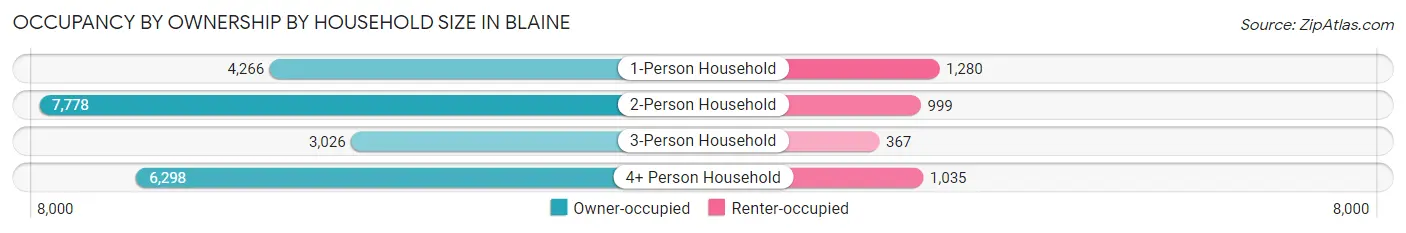
| Household Size | Owner-occupied | Renter-occupied |
| 1-Person Household | 4,266 (76.9%) | 1,280 (23.1%) |
| 2-Person Household | 7,778 (88.6%) | 999 (11.4%) |
| 3-Person Household | 3,026 (89.2%) | 367 (10.8%) |
| 4+ Person Household | 6,298 (85.9%) | 1,035 (14.1%) |
| Total Housing Units | 21,368 (85.3%) | 3,681 (14.7%) |
Occupancy by Educational Attainment in Blaine
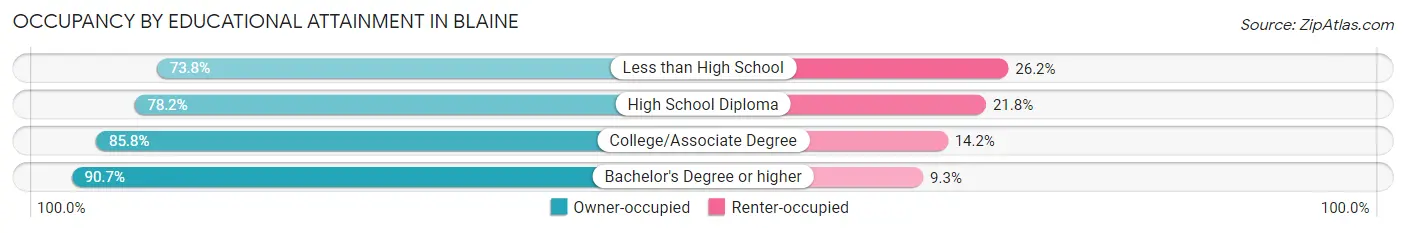
| Household Size | Owner-occupied | Renter-occupied |
| Less than High School | 760 (73.8%) | 270 (26.2%) |
| High School Diploma | 4,809 (78.2%) | 1,338 (21.8%) |
| College/Associate Degree | 7,195 (85.8%) | 1,189 (14.2%) |
| Bachelor's Degree or higher | 8,604 (90.7%) | 884 (9.3%) |
Occupancy by Age of Householder in Blaine
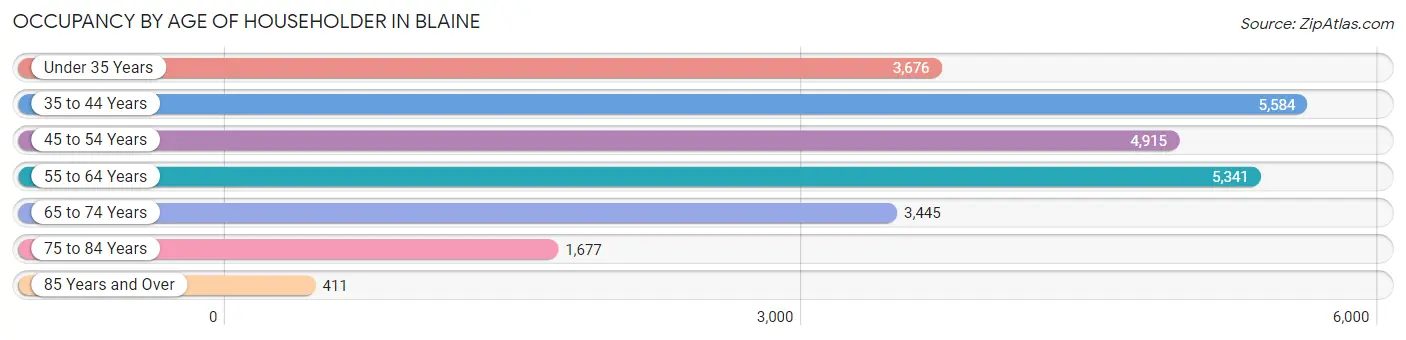
| Age Bracket | # Households | % Households |
| Under 35 Years | 3,676 | 14.7% |
| 35 to 44 Years | 5,584 | 22.3% |
| 45 to 54 Years | 4,915 | 19.6% |
| 55 to 64 Years | 5,341 | 21.3% |
| 65 to 74 Years | 3,445 | 13.8% |
| 75 to 84 Years | 1,677 | 6.7% |
| 85 Years and Over | 411 | 1.6% |
| Total | 25,049 | 100.0% |
Housing Finances in Blaine
Median Income by Occupancy in Blaine
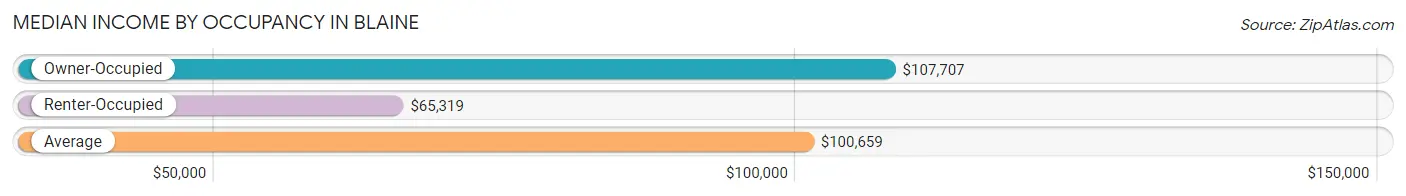
| Occupancy Type | # Households | Median Income |
| Owner-Occupied | 21,368 (85.3%) | $107,707 |
| Renter-Occupied | 3,681 (14.7%) | $65,319 |
| Average | 25,049 (100.0%) | $100,659 |
Occupancy by Householder Income Bracket in Blaine
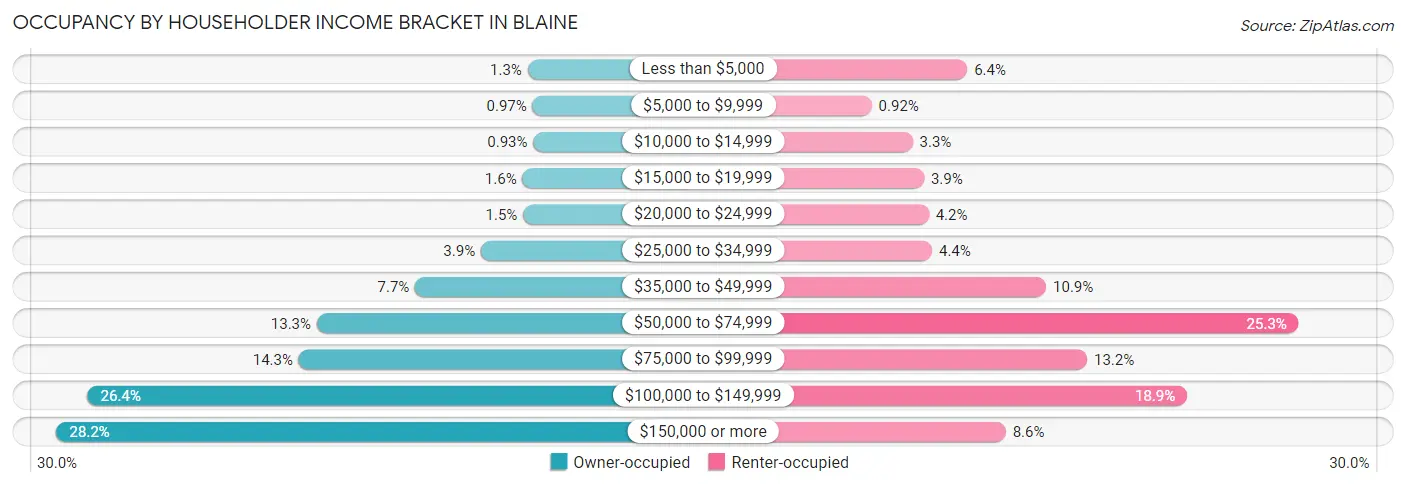
| Income Bracket | Owner-occupied | Renter-occupied |
| Less than $5,000 | 267 (1.3%) | 235 (6.4%) |
| $5,000 to $9,999 | 207 (1.0%) | 34 (0.9%) |
| $10,000 to $14,999 | 198 (0.9%) | 120 (3.3%) |
| $15,000 to $19,999 | 331 (1.5%) | 144 (3.9%) |
| $20,000 to $24,999 | 322 (1.5%) | 154 (4.2%) |
| $25,000 to $34,999 | 837 (3.9%) | 161 (4.4%) |
| $35,000 to $49,999 | 1,641 (7.7%) | 401 (10.9%) |
| $50,000 to $74,999 | 2,841 (13.3%) | 932 (25.3%) |
| $75,000 to $99,999 | 3,061 (14.3%) | 487 (13.2%) |
| $100,000 to $149,999 | 5,642 (26.4%) | 697 (18.9%) |
| $150,000 or more | 6,021 (28.2%) | 316 (8.6%) |
| Total | 21,368 (100.0%) | 3,681 (100.0%) |
Monthly Housing Cost Tiers in Blaine
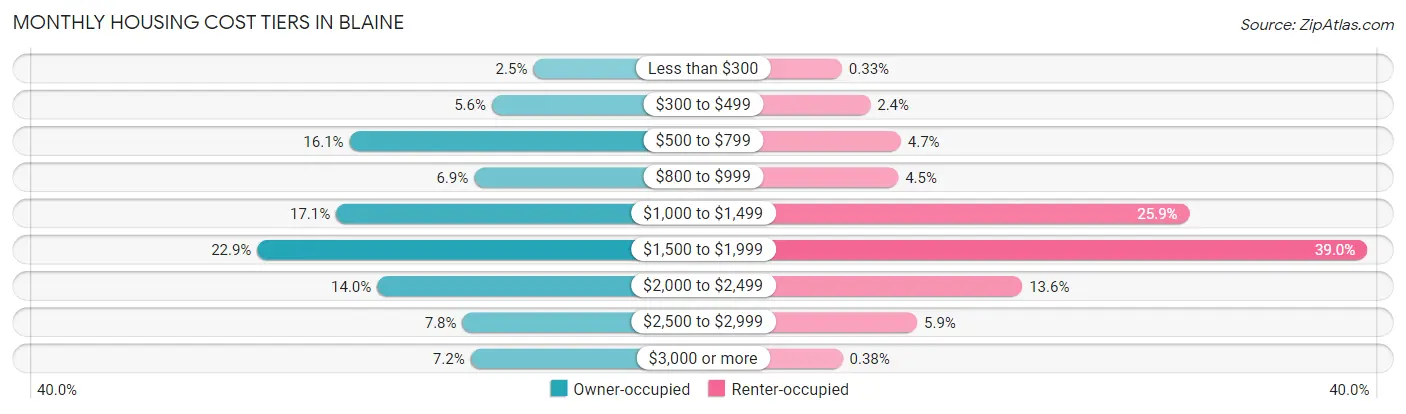
| Monthly Cost | Owner-occupied | Renter-occupied |
| Less than $300 | 542 (2.5%) | 12 (0.3%) |
| $300 to $499 | 1,195 (5.6%) | 89 (2.4%) |
| $500 to $799 | 3,435 (16.1%) | 172 (4.7%) |
| $800 to $999 | 1,474 (6.9%) | 165 (4.5%) |
| $1,000 to $1,499 | 3,646 (17.1%) | 954 (25.9%) |
| $1,500 to $1,999 | 4,887 (22.9%) | 1,436 (39.0%) |
| $2,000 to $2,499 | 3,000 (14.0%) | 501 (13.6%) |
| $2,500 to $2,999 | 1,659 (7.8%) | 216 (5.9%) |
| $3,000 or more | 1,530 (7.2%) | 14 (0.4%) |
| Total | 21,368 (100.0%) | 3,681 (100.0%) |
Physical Housing Characteristics in Blaine
Housing Structures in Blaine
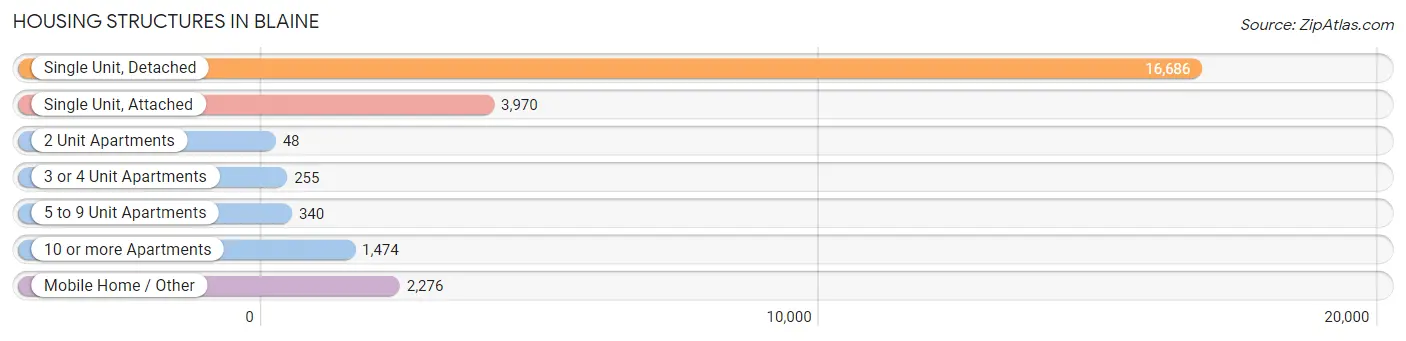
| Structure Type | # Housing Units | % Housing Units |
| Single Unit, Detached | 16,686 | 66.6% |
| Single Unit, Attached | 3,970 | 15.9% |
| 2 Unit Apartments | 48 | 0.2% |
| 3 or 4 Unit Apartments | 255 | 1.0% |
| 5 to 9 Unit Apartments | 340 | 1.4% |
| 10 or more Apartments | 1,474 | 5.9% |
| Mobile Home / Other | 2,276 | 9.1% |
| Total | 25,049 | 100.0% |
Housing Structures by Occupancy in Blaine
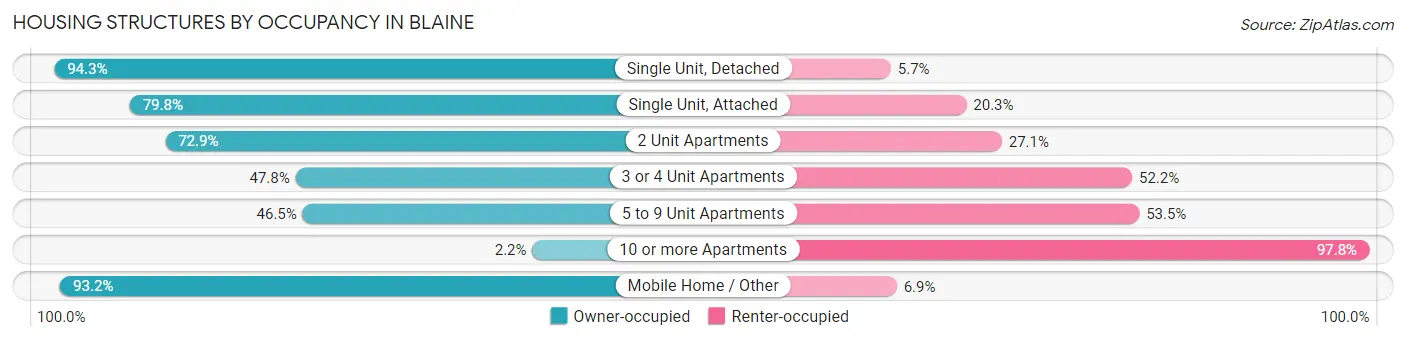
| Structure Type | Owner-occupied | Renter-occupied |
| Single Unit, Detached | 15,734 (94.3%) | 952 (5.7%) |
| Single Unit, Attached | 3,166 (79.7%) | 804 (20.3%) |
| 2 Unit Apartments | 35 (72.9%) | 13 (27.1%) |
| 3 or 4 Unit Apartments | 122 (47.8%) | 133 (52.2%) |
| 5 to 9 Unit Apartments | 158 (46.5%) | 182 (53.5%) |
| 10 or more Apartments | 33 (2.2%) | 1,441 (97.8%) |
| Mobile Home / Other | 2,120 (93.1%) | 156 (6.9%) |
| Total | 21,368 (85.3%) | 3,681 (14.7%) |
Housing Structures by Number of Rooms in Blaine
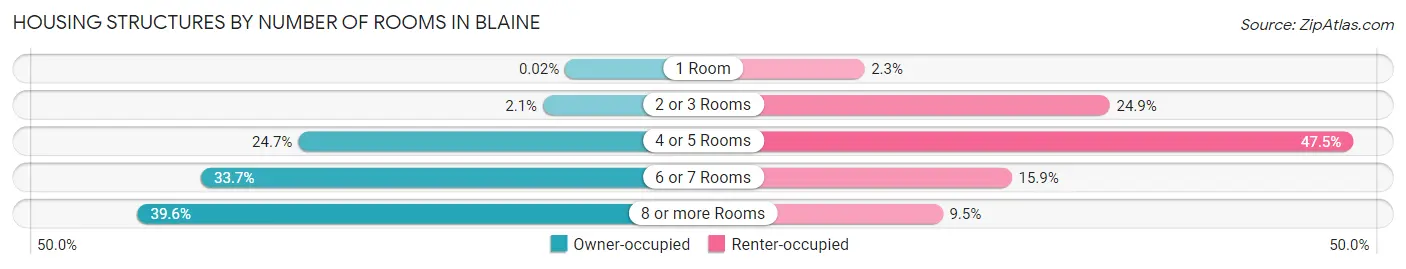
| Number of Rooms | Owner-occupied | Renter-occupied |
| 1 Room | 5 (0.0%) | 83 (2.2%) |
| 2 or 3 Rooms | 440 (2.1%) | 918 (24.9%) |
| 4 or 5 Rooms | 5,277 (24.7%) | 1,747 (47.5%) |
| 6 or 7 Rooms | 7,196 (33.7%) | 584 (15.9%) |
| 8 or more Rooms | 8,450 (39.6%) | 349 (9.5%) |
| Total | 21,368 (100.0%) | 3,681 (100.0%) |
Housing Structure by Heating Type in Blaine
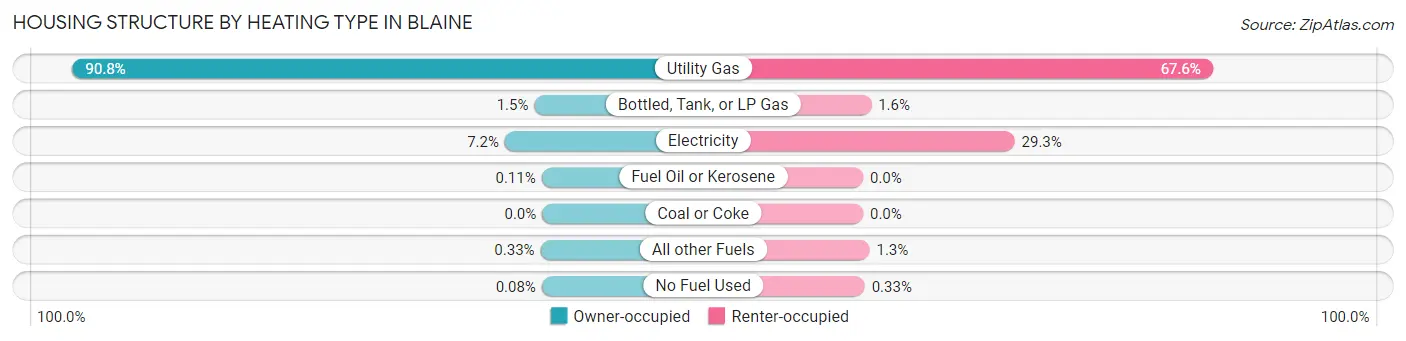
| Heating Type | Owner-occupied | Renter-occupied |
| Utility Gas | 19,393 (90.8%) | 2,487 (67.6%) |
| Bottled, Tank, or LP Gas | 323 (1.5%) | 58 (1.6%) |
| Electricity | 1,541 (7.2%) | 1,078 (29.3%) |
| Fuel Oil or Kerosene | 23 (0.1%) | 0 (0.0%) |
| Coal or Coke | 0 (0.0%) | 0 (0.0%) |
| All other Fuels | 70 (0.3%) | 46 (1.3%) |
| No Fuel Used | 18 (0.1%) | 12 (0.3%) |
| Total | 21,368 (100.0%) | 3,681 (100.0%) |
Household Vehicle Usage in Blaine
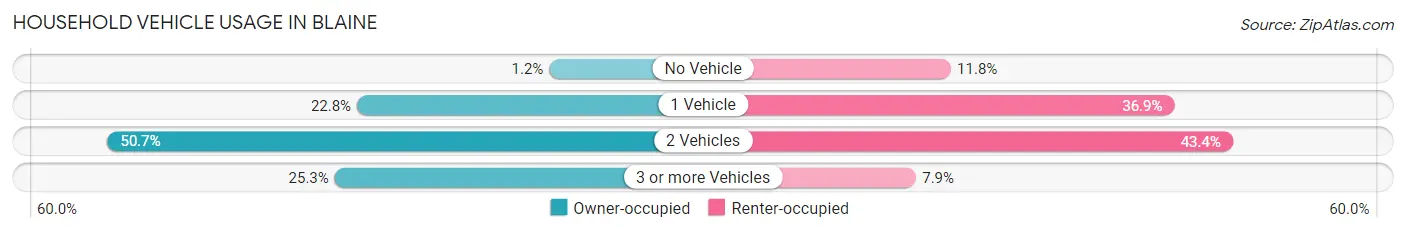
| Vehicles per Household | Owner-occupied | Renter-occupied |
| No Vehicle | 264 (1.2%) | 434 (11.8%) |
| 1 Vehicle | 4,866 (22.8%) | 1,358 (36.9%) |
| 2 Vehicles | 10,839 (50.7%) | 1,599 (43.4%) |
| 3 or more Vehicles | 5,399 (25.3%) | 290 (7.9%) |
| Total | 21,368 (100.0%) | 3,681 (100.0%) |
Real Estate & Mortgages in Blaine
Real Estate and Mortgage Overview in Blaine
| Characteristic | Without Mortgage | With Mortgage |
| Housing Units | 6,494 | 14,874 |
| Median Property Value | $260,100 | $323,900 |
| Median Household Income | $71,974 | $5,033 |
| Monthly Housing Costs | $638 | $1,530 |
| Real Estate Taxes | $2,508 | $201 |
Property Value by Mortgage Status in Blaine
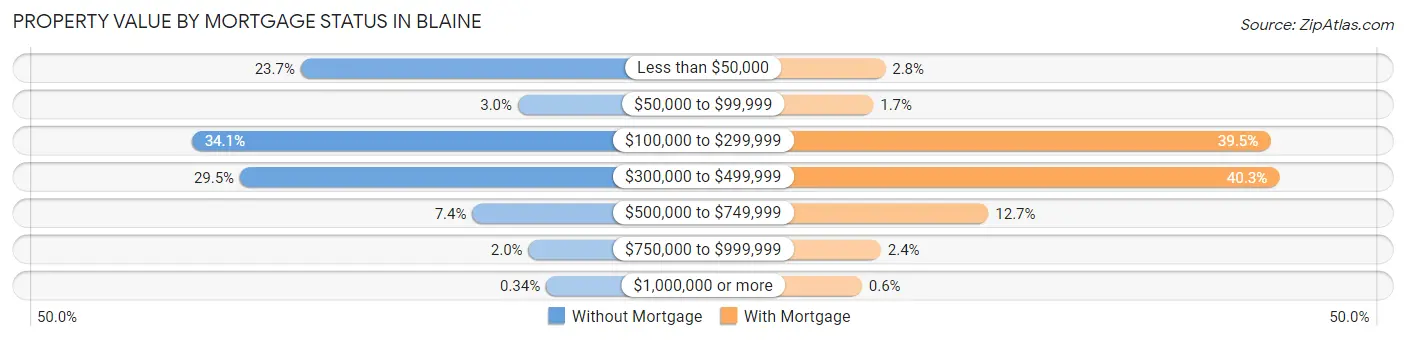
| Property Value | Without Mortgage | With Mortgage |
| Less than $50,000 | 1,539 (23.7%) | 421 (2.8%) |
| $50,000 to $99,999 | 196 (3.0%) | 251 (1.7%) |
| $100,000 to $299,999 | 2,213 (34.1%) | 5,872 (39.5%) |
| $300,000 to $499,999 | 1,915 (29.5%) | 6,000 (40.3%) |
| $500,000 to $749,999 | 478 (7.4%) | 1,882 (12.7%) |
| $750,000 to $999,999 | 131 (2.0%) | 359 (2.4%) |
| $1,000,000 or more | 22 (0.3%) | 89 (0.6%) |
| Total | 6,494 (100.0%) | 14,874 (100.0%) |
Household Income by Mortgage Status in Blaine
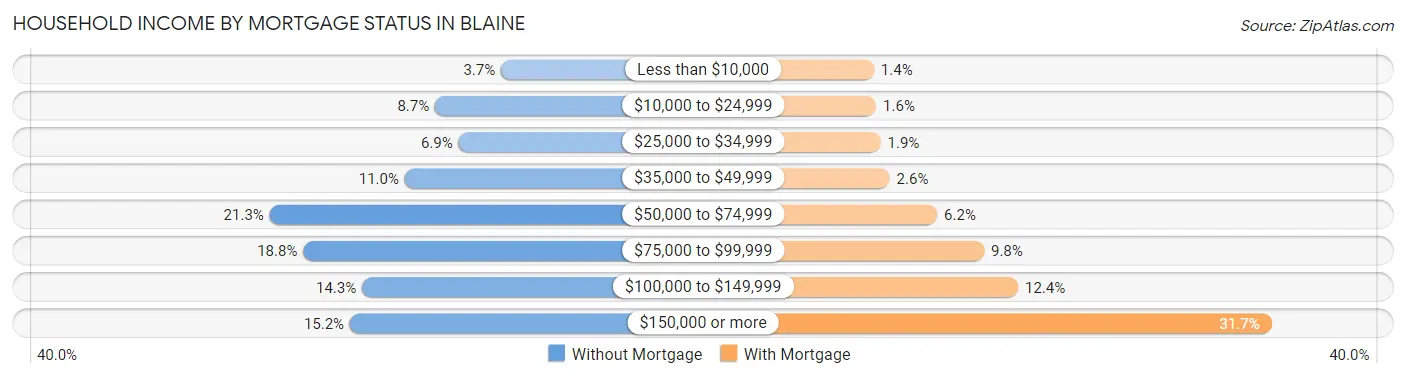
| Household Income | Without Mortgage | With Mortgage |
| Less than $10,000 | 240 (3.7%) | 208 (1.4%) |
| $10,000 to $24,999 | 567 (8.7%) | 234 (1.6%) |
| $25,000 to $34,999 | 451 (6.9%) | 284 (1.9%) |
| $35,000 to $49,999 | 716 (11.0%) | 386 (2.6%) |
| $50,000 to $74,999 | 1,385 (21.3%) | 925 (6.2%) |
| $75,000 to $99,999 | 1,219 (18.8%) | 1,456 (9.8%) |
| $100,000 to $149,999 | 928 (14.3%) | 1,842 (12.4%) |
| $150,000 or more | 988 (15.2%) | 4,714 (31.7%) |
| Total | 6,494 (100.0%) | 14,874 (100.0%) |
Property Value to Household Income Ratio in Blaine
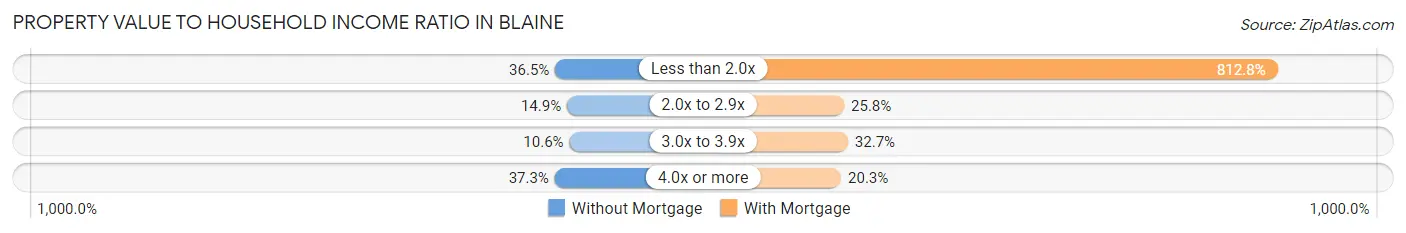
| Value-to-Income Ratio | Without Mortgage | With Mortgage |
| Less than 2.0x | 2,368 (36.5%) | 120,897 (812.8%) |
| 2.0x to 2.9x | 970 (14.9%) | 3,837 (25.8%) |
| 3.0x to 3.9x | 686 (10.6%) | 4,857 (32.7%) |
| 4.0x or more | 2,423 (37.3%) | 3,025 (20.3%) |
| Total | 6,494 (100.0%) | 14,874 (100.0%) |
Real Estate Taxes by Mortgage Status in Blaine
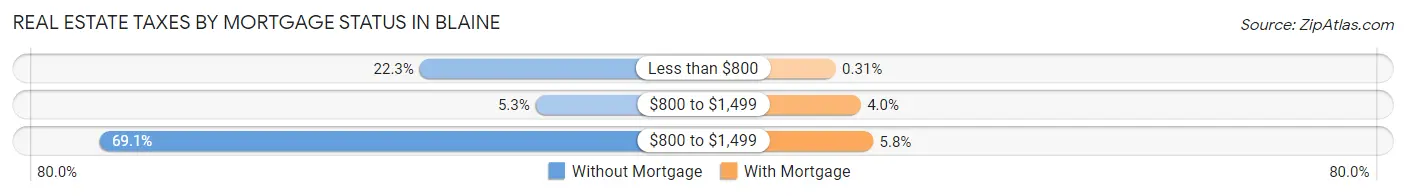
| Property Taxes | Without Mortgage | With Mortgage |
| Less than $800 | 1,447 (22.3%) | 46 (0.3%) |
| $800 to $1,499 | 347 (5.3%) | 591 (4.0%) |
| $800 to $1,499 | 4,489 (69.1%) | 860 (5.8%) |
| Total | 6,494 (100.0%) | 14,874 (100.0%) |
Health & Disability in Blaine
Health Insurance Coverage by Age in Blaine
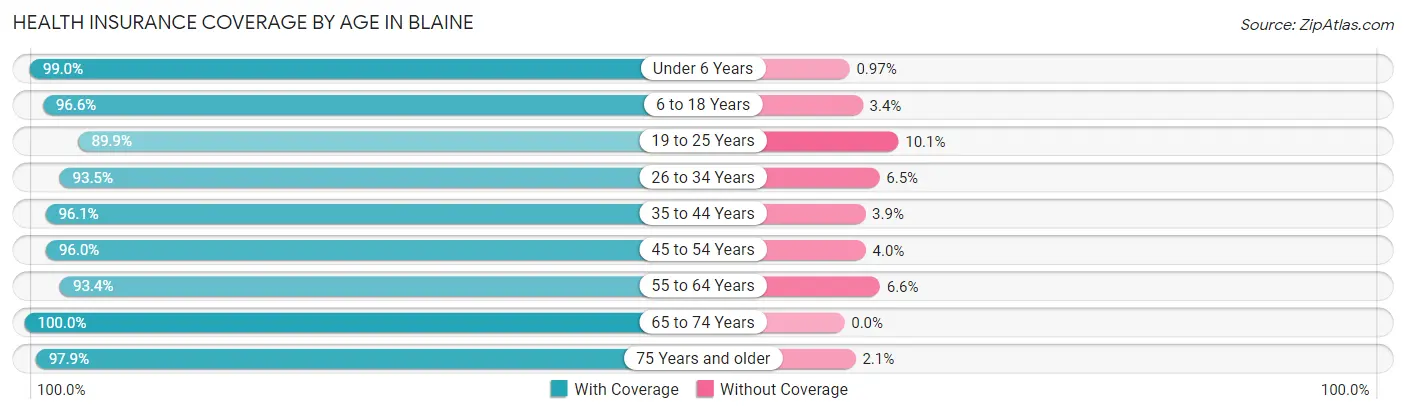
| Age Bracket | With Coverage | Without Coverage |
| Under 6 Years | 5,311 (99.0%) | 52 (1.0%) |
| 6 to 18 Years | 13,369 (96.6%) | 474 (3.4%) |
| 19 to 25 Years | 4,619 (89.9%) | 517 (10.1%) |
| 26 to 34 Years | 7,147 (93.5%) | 500 (6.5%) |
| 35 to 44 Years | 10,077 (96.1%) | 408 (3.9%) |
| 45 to 54 Years | 8,710 (96.0%) | 361 (4.0%) |
| 55 to 64 Years | 8,805 (93.4%) | 624 (6.6%) |
| 65 to 74 Years | 5,968 (100.0%) | 0 (0.0%) |
| 75 Years and older | 2,922 (97.9%) | 62 (2.1%) |
| Total | 66,928 (95.7%) | 2,998 (4.3%) |
Health Insurance Coverage by Citizenship Status in Blaine
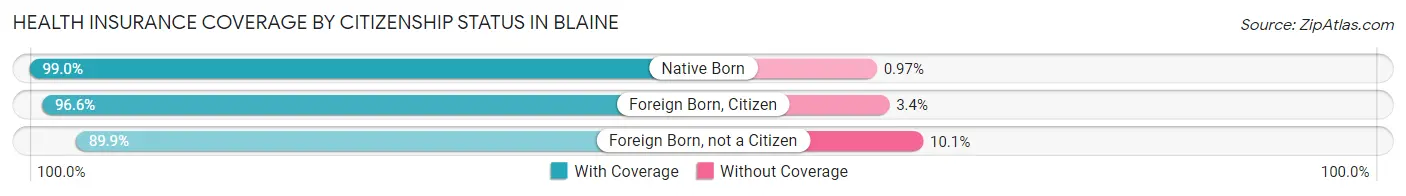
| Citizenship Status | With Coverage | Without Coverage |
| Native Born | 5,311 (99.0%) | 52 (1.0%) |
| Foreign Born, Citizen | 13,369 (96.6%) | 474 (3.4%) |
| Foreign Born, not a Citizen | 4,619 (89.9%) | 517 (10.1%) |
Health Insurance Coverage by Household Income in Blaine
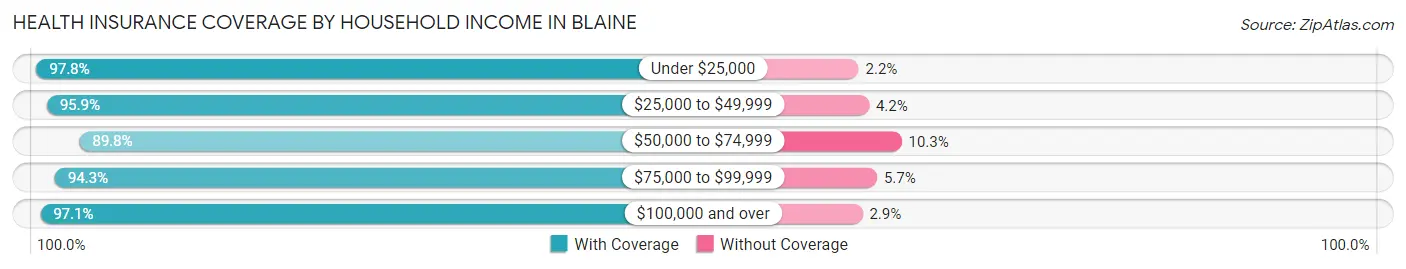
| Household Income | With Coverage | Without Coverage |
| Under $25,000 | 3,231 (97.8%) | 73 (2.2%) |
| $25,000 to $49,999 | 5,631 (95.9%) | 244 (4.2%) |
| $50,000 to $74,999 | 8,109 (89.7%) | 926 (10.2%) |
| $75,000 to $99,999 | 8,385 (94.3%) | 503 (5.7%) |
| $100,000 and over | 41,483 (97.1%) | 1,251 (2.9%) |
Public vs Private Health Insurance Coverage by Age in Blaine
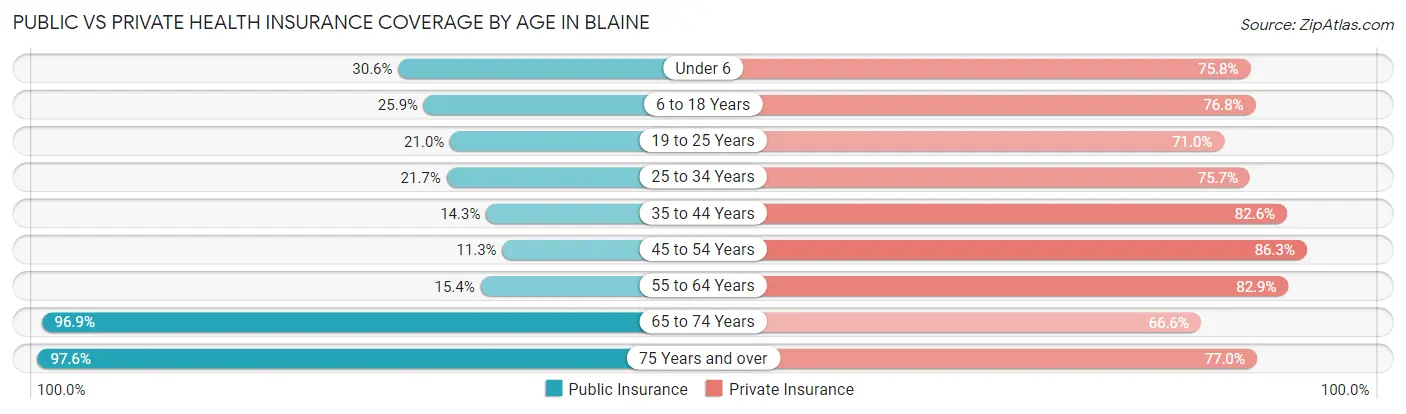
| Age Bracket | Public Insurance | Private Insurance |
| Under 6 | 1,642 (30.6%) | 4,067 (75.8%) |
| 6 to 18 Years | 3,582 (25.9%) | 10,627 (76.8%) |
| 19 to 25 Years | 1,079 (21.0%) | 3,645 (71.0%) |
| 25 to 34 Years | 1,657 (21.7%) | 5,790 (75.7%) |
| 35 to 44 Years | 1,500 (14.3%) | 8,662 (82.6%) |
| 45 to 54 Years | 1,026 (11.3%) | 7,827 (86.3%) |
| 55 to 64 Years | 1,449 (15.4%) | 7,814 (82.9%) |
| 65 to 74 Years | 5,780 (96.9%) | 3,977 (66.6%) |
| 75 Years and over | 2,912 (97.6%) | 2,299 (77.0%) |
| Total | 20,627 (29.5%) | 54,708 (78.2%) |
Disability Status by Sex by Age in Blaine
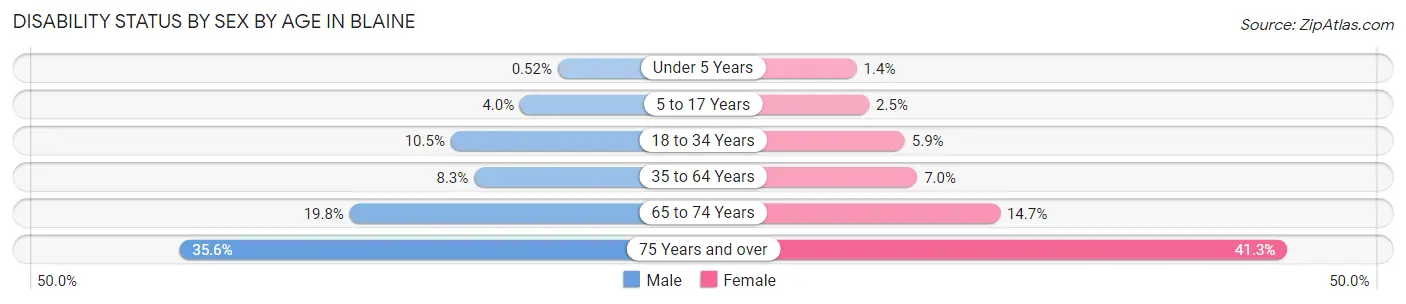
| Age Bracket | Male | Female |
| Under 5 Years | 11 (0.5%) | 33 (1.4%) |
| 5 to 17 Years | 292 (4.0%) | 164 (2.5%) |
| 18 to 34 Years | 705 (10.4%) | 410 (5.9%) |
| 35 to 64 Years | 1,195 (8.3%) | 1,019 (7.0%) |
| 65 to 74 Years | 616 (19.8%) | 420 (14.7%) |
| 75 Years and over | 422 (35.6%) | 744 (41.3%) |
Disability Class by Sex by Age in Blaine
Disability Class: Hearing Difficulty
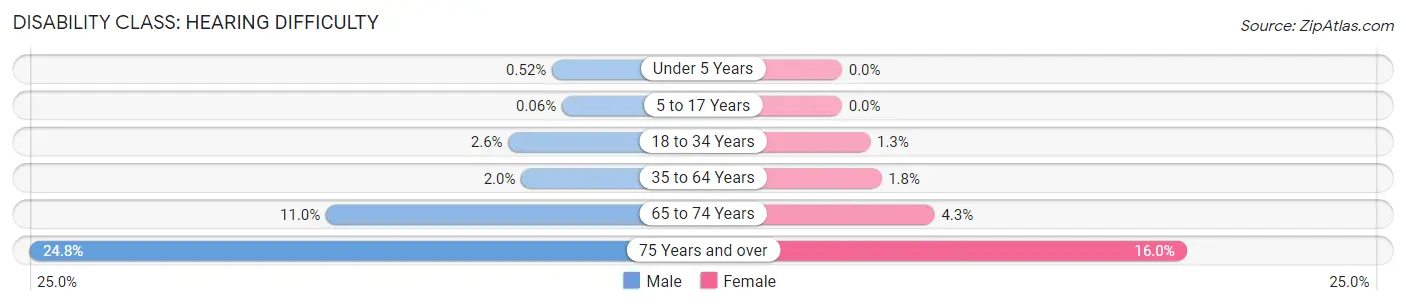
| Age Bracket | Male | Female |
| Under 5 Years | 11 (0.5%) | 0 (0.0%) |
| 5 to 17 Years | 4 (0.1%) | 0 (0.0%) |
| 18 to 34 Years | 172 (2.5%) | 92 (1.3%) |
| 35 to 64 Years | 281 (1.9%) | 266 (1.8%) |
| 65 to 74 Years | 342 (11.0%) | 123 (4.3%) |
| 75 Years and over | 293 (24.7%) | 288 (16.0%) |
Disability Class: Vision Difficulty
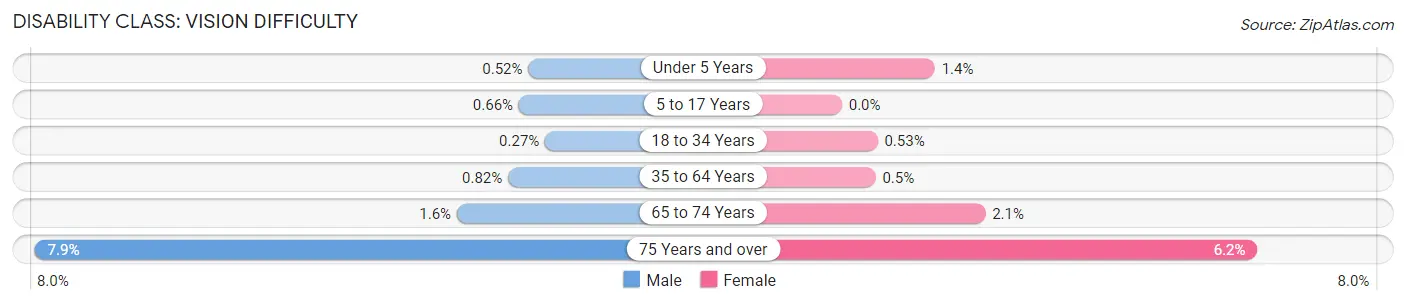
| Age Bracket | Male | Female |
| Under 5 Years | 11 (0.5%) | 33 (1.4%) |
| 5 to 17 Years | 48 (0.7%) | 0 (0.0%) |
| 18 to 34 Years | 18 (0.3%) | 37 (0.5%) |
| 35 to 64 Years | 119 (0.8%) | 73 (0.5%) |
| 65 to 74 Years | 49 (1.6%) | 61 (2.1%) |
| 75 Years and over | 93 (7.9%) | 111 (6.2%) |
Disability Class: Cognitive Difficulty
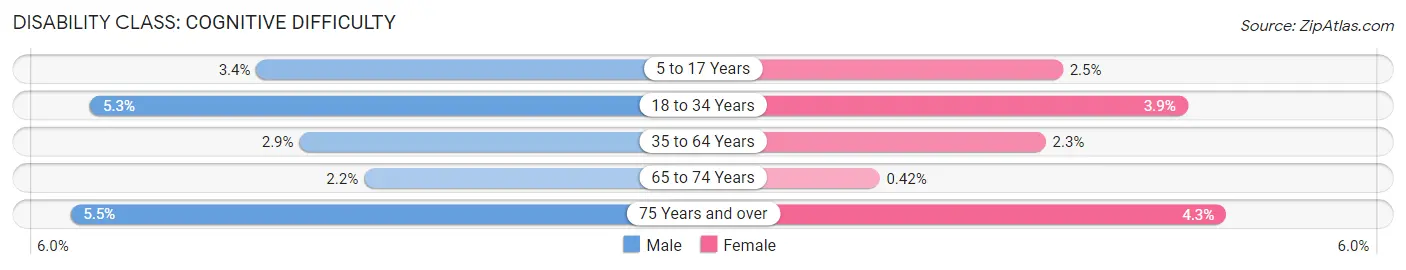
| Age Bracket | Male | Female |
| 5 to 17 Years | 248 (3.4%) | 159 (2.5%) |
| 18 to 34 Years | 356 (5.3%) | 270 (3.8%) |
| 35 to 64 Years | 425 (2.9%) | 330 (2.3%) |
| 65 to 74 Years | 69 (2.2%) | 12 (0.4%) |
| 75 Years and over | 65 (5.5%) | 77 (4.3%) |
Disability Class: Ambulatory Difficulty
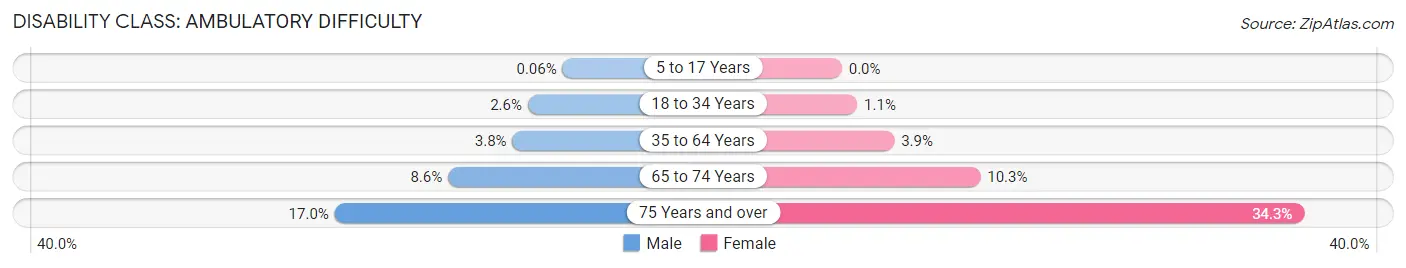
| Age Bracket | Male | Female |
| 5 to 17 Years | 4 (0.1%) | 0 (0.0%) |
| 18 to 34 Years | 178 (2.6%) | 80 (1.1%) |
| 35 to 64 Years | 545 (3.8%) | 566 (3.9%) |
| 65 to 74 Years | 266 (8.6%) | 294 (10.3%) |
| 75 Years and over | 201 (17.0%) | 618 (34.3%) |
Disability Class: Self-Care Difficulty
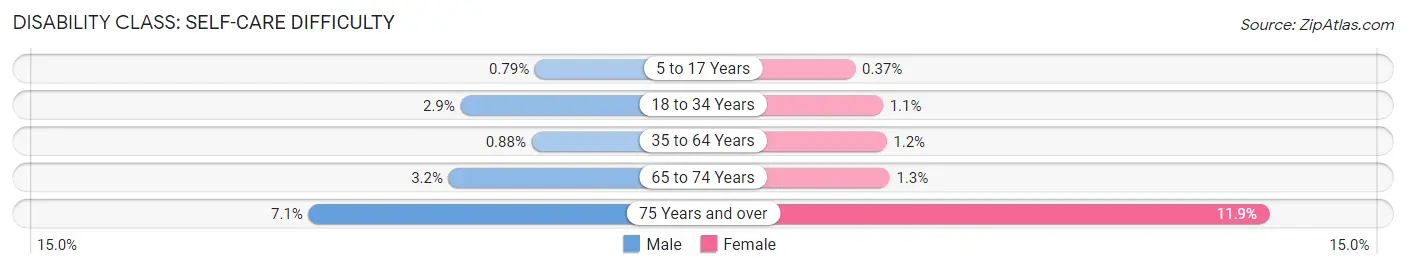
| Age Bracket | Male | Female |
| 5 to 17 Years | 57 (0.8%) | 24 (0.4%) |
| 18 to 34 Years | 193 (2.9%) | 80 (1.1%) |
| 35 to 64 Years | 127 (0.9%) | 180 (1.2%) |
| 65 to 74 Years | 99 (3.2%) | 38 (1.3%) |
| 75 Years and over | 84 (7.1%) | 214 (11.9%) |
Technology Access in Blaine
Computing Device Access in Blaine
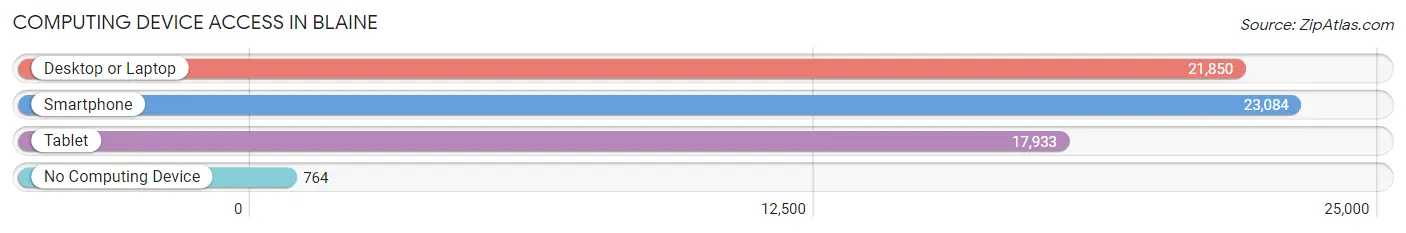
| Device Type | # Households | % Households |
| Desktop or Laptop | 21,850 | 87.2% |
| Smartphone | 23,084 | 92.2% |
| Tablet | 17,933 | 71.6% |
| No Computing Device | 764 | 3.0% |
| Total | 25,049 | 100.0% |
Internet Access in Blaine
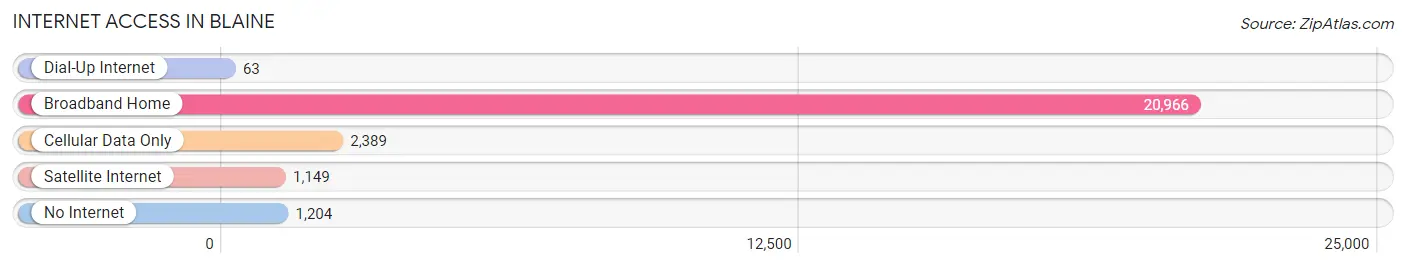
| Internet Type | # Households | % Households |
| Dial-Up Internet | 63 | 0.3% |
| Broadband Home | 20,966 | 83.7% |
| Cellular Data Only | 2,389 | 9.5% |
| Satellite Internet | 1,149 | 4.6% |
| No Internet | 1,204 | 4.8% |
| Total | 25,049 | 100.0% |
Blaine Summary
Blaine, Minnesota is a city located in Anoka County, Minnesota, United States. It is part of the Twin Cities metropolitan area and is located just north of Minneapolis. The city is bordered by the cities of Coon Rapids, Spring Lake Park, and Fridley. As of the 2010 census, the population of Blaine was 57,186, making it the tenth largest city in Minnesota.
History
The area that is now Blaine was first settled in the mid-1800s by European immigrants. The first settlers were mostly German and Swedish immigrants who were attracted to the area by its fertile soil and abundant natural resources. The first post office in the area was established in 1857 and the first school was built in 1868.
In 1877, the area was officially incorporated as the village of Blaine. The village was named after James G. Blaine, a prominent politician and statesman of the time. The village grew slowly but steadily over the next few decades, and in 1949 it was officially incorporated as a city.
Geography
Blaine is located in Anoka County, Minnesota, and is part of the Twin Cities metropolitan area. It is bordered by the cities of Coon Rapids, Spring Lake Park, and Fridley. The city has a total area of 24.2 square miles, of which 23.9 square miles is land and 0.3 square miles is water.
The city is located on the northern edge of the Anoka Sand Plain, a flat, sandy area that was formed by glacial activity during the last ice age. The city is also located on the banks of the Mississippi River, which forms the western border of the city.
Economy
The economy of Blaine is largely based on retail and services. The city is home to several large retail stores, including Target, Walmart, and Home Depot. The city is also home to several smaller businesses, including restaurants, banks, and other service-oriented businesses.
The city is also home to several large employers, including the Anoka County government, the Anoka-Hennepin School District, and the University of Minnesota. The city is also home to several manufacturing companies, including 3M, Medtronic, and Andersen Windows.
Demographics
As of the 2010 census, the population of Blaine was 57,186. The racial makeup of the city was 79.2% White, 8.3% African American, 0.5% Native American, 5.2% Asian, 0.1% Pacific Islander, 3.3% from other races, and 3.4% from two or more races. Hispanic or Latino of any race were 8.2% of the population.
The median income for a household in the city was $63,945, and the median income for a family was $76,945. The per capita income for the city was $30,945. About 4.2% of families and 6.2% of the population were below the poverty line, including 8.2% of those under age 18 and 4.2% of those age 65 or over.
Common Questions
What is Per Capita Income in Blaine?
Per Capita income in Blaine is $44,013.
What is the Median Family Income in Blaine?
Median Family Income in Blaine is $116,256.
What is the Median Household income in Blaine?
Median Household Income in Blaine is $100,659.
What is Income or Wage Gap in Blaine?
Income or Wage Gap in Blaine is 29.7%.
Women in Blaine earn 70.3 cents for every dollar earned by a man.
What is Family Income Deficit in Blaine?
Family Income Deficit in Blaine is $11,215.
Families that are below poverty line in Blaine earn $11,215 less on average than the poverty threshold level.
What is Inequality or Gini Index in Blaine?
Inequality or Gini Index in Blaine is 0.40.
What is the Total Population of Blaine?
Total Population of Blaine is 70,047.
What is the Total Male Population of Blaine?
Total Male Population of Blaine is 34,928.
What is the Total Female Population of Blaine?
Total Female Population of Blaine is 35,119.
What is the Ratio of Males per 100 Females in Blaine?
There are 99.46 Males per 100 Females in Blaine.
What is the Ratio of Females per 100 Males in Blaine?
There are 100.55 Females per 100 Males in Blaine.
What is the Median Population Age in Blaine?
Median Population Age in Blaine is 37.6 Years.
What is the Average Family Size in Blaine
Average Family Size in Blaine is 3.3 People.
What is the Average Household Size in Blaine
Average Household Size in Blaine is 2.8 People.
How Large is the Labor Force in Blaine?
There are 38,495 People in the Labor Forcein in Blaine.
What is the Percentage of People in the Labor Force in Blaine?
71.1% of People are in the Labor Force in Blaine.
What is the Unemployment Rate in Blaine?
Unemployment Rate in Blaine is 4.4%.