Escanaba, MI Map & Demographics
Escanaba Map
Escanaba Overview
$29,138
PER CAPITA INCOME
$57,595
AVG FAMILY INCOME
$38,457
AVG HOUSEHOLD INCOME
27.2%
WAGE / INCOME GAP [ % ]
72.8¢/ $1
WAGE / INCOME GAP [ $ ]
$12,406
FAMILY INCOME DEFICIT
0.51
INEQUALITY / GINI INDEX
12,403
TOTAL POPULATION
5,965
MALE POPULATION
6,438
FEMALE POPULATION
92.65
MALES / 100 FEMALES
107.93
FEMALES / 100 MALES
42.9
MEDIAN AGE
2.9
AVG FAMILY SIZE
2.1
AVG HOUSEHOLD SIZE
5,257
LABOR FORCE [ PEOPLE ]
51.6%
PERCENT IN LABOR FORCE
7.2%
UNEMPLOYMENT RATE
Escanaba Zip Codes
Escanaba Area Codes
Income in Escanaba
Income Overview in Escanaba
Per Capita Income in Escanaba is $29,138, while median incomes of families and households are $57,595 and $38,457 respectively.
| Characteristic | Number | Measure |
| Per Capita Income | 12,403 | $29,138 |
| Median Family Income | 2,832 | $57,595 |
| Mean Family Income | 2,832 | $78,859 |
| Median Household Income | 5,756 | $38,457 |
| Mean Household Income | 5,756 | $59,688 |
| Income Deficit | 2,832 | $12,406 |
| Wage / Income Gap (%) | 12,403 | 27.19% |
| Wage / Income Gap ($) | 12,403 | 72.81¢ per $1 |
| Gini / Inequality Index | 12,403 | 0.51 |
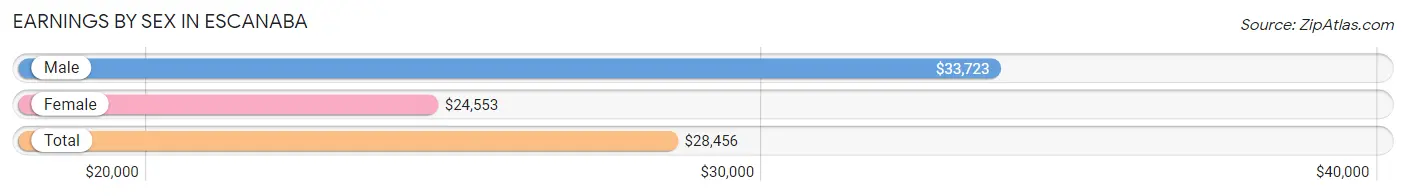
Earnings by Sex in Escanaba
Average Earnings in Escanaba are $28,456, $33,723 for men and $24,553 for women, a difference of 27.2%.
| Sex | Number | Average Earnings |
| Male | 2,675 (48.9%) | $33,723 |
| Female | 2,794 (51.1%) | $24,553 |
| Total | 5,469 (100.0%) | $28,456 |
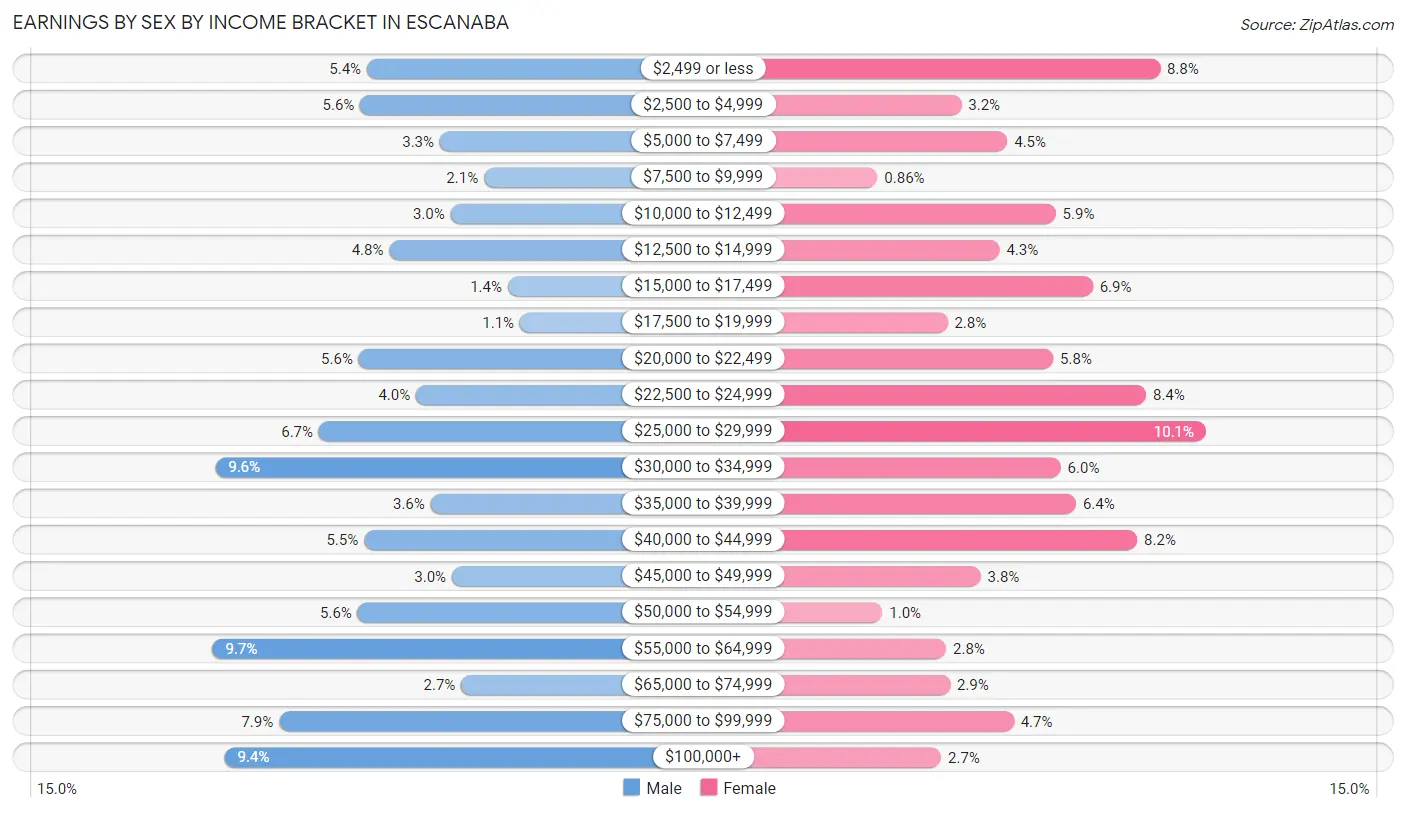
Earnings by Sex by Income Bracket in Escanaba
The most common earnings brackets in Escanaba are $55,000 to $64,999 for men (260 | 9.7%) and $25,000 to $29,999 for women (282 | 10.1%).
| Income | Male | Female |
| $2,499 or less | 144 (5.4%) | 246 (8.8%) |
| $2,500 to $4,999 | 149 (5.6%) | 90 (3.2%) |
| $5,000 to $7,499 | 89 (3.3%) | 126 (4.5%) |
| $7,500 to $9,999 | 56 (2.1%) | 24 (0.9%) |
| $10,000 to $12,499 | 81 (3.0%) | 164 (5.9%) |
| $12,500 to $14,999 | 127 (4.8%) | 120 (4.3%) |
| $15,000 to $17,499 | 38 (1.4%) | 193 (6.9%) |
| $17,500 to $19,999 | 29 (1.1%) | 79 (2.8%) |
| $20,000 to $22,499 | 150 (5.6%) | 162 (5.8%) |
| $22,500 to $24,999 | 107 (4.0%) | 235 (8.4%) |
| $25,000 to $29,999 | 180 (6.7%) | 282 (10.1%) |
| $30,000 to $34,999 | 258 (9.6%) | 168 (6.0%) |
| $35,000 to $39,999 | 96 (3.6%) | 180 (6.4%) |
| $40,000 to $44,999 | 146 (5.5%) | 228 (8.2%) |
| $45,000 to $49,999 | 80 (3.0%) | 105 (3.8%) |
| $50,000 to $54,999 | 151 (5.6%) | 28 (1.0%) |
| $55,000 to $64,999 | 260 (9.7%) | 78 (2.8%) |
| $65,000 to $74,999 | 73 (2.7%) | 81 (2.9%) |
| $75,000 to $99,999 | 210 (7.9%) | 131 (4.7%) |
| $100,000+ | 251 (9.4%) | 74 (2.6%) |
| Total | 2,675 (100.0%) | 2,794 (100.0%) |
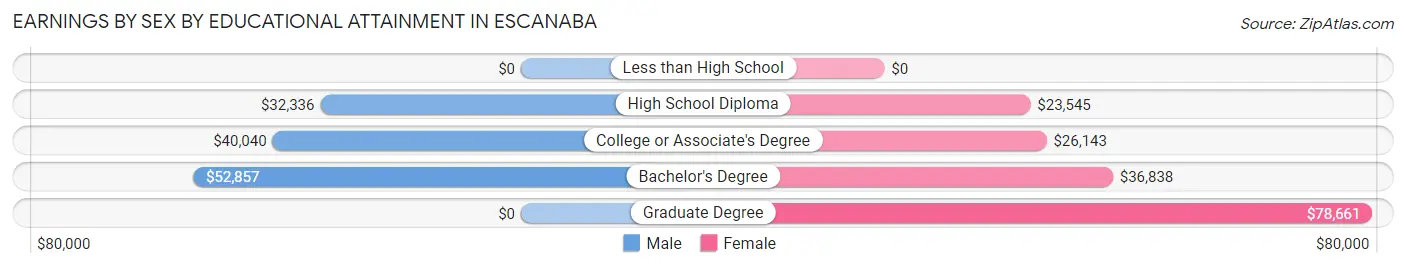
Earnings by Sex by Educational Attainment in Escanaba
Average earnings in Escanaba are $40,012 for men and $26,323 for women, a difference of 34.2%. Men with an educational attainment of bachelor's degree enjoy the highest average annual earnings of $52,857, while those with high school diploma education earn the least with $32,336. Women with an educational attainment of graduate degree earn the most with the average annual earnings of $78,661, while those with high school diploma education have the smallest earnings of $23,545.
| Educational Attainment | Male Income | Female Income |
| Less than High School | - | - |
| High School Diploma | $32,336 | $23,545 |
| College or Associate's Degree | $40,040 | $26,143 |
| Bachelor's Degree | $52,857 | $36,838 |
| Graduate Degree | - | - |
| Total | $40,012 | $26,323 |
Family Income in Escanaba
Family Income Brackets in Escanaba
According to the Escanaba family income data, there are 632 families falling into the $35,000 to $49,999 income range, which is the most common income bracket and makes up 22.3% of all families. Conversely, the less than $10,000 income bracket is the least frequent group with only 93 families (3.3%) belonging to this category.
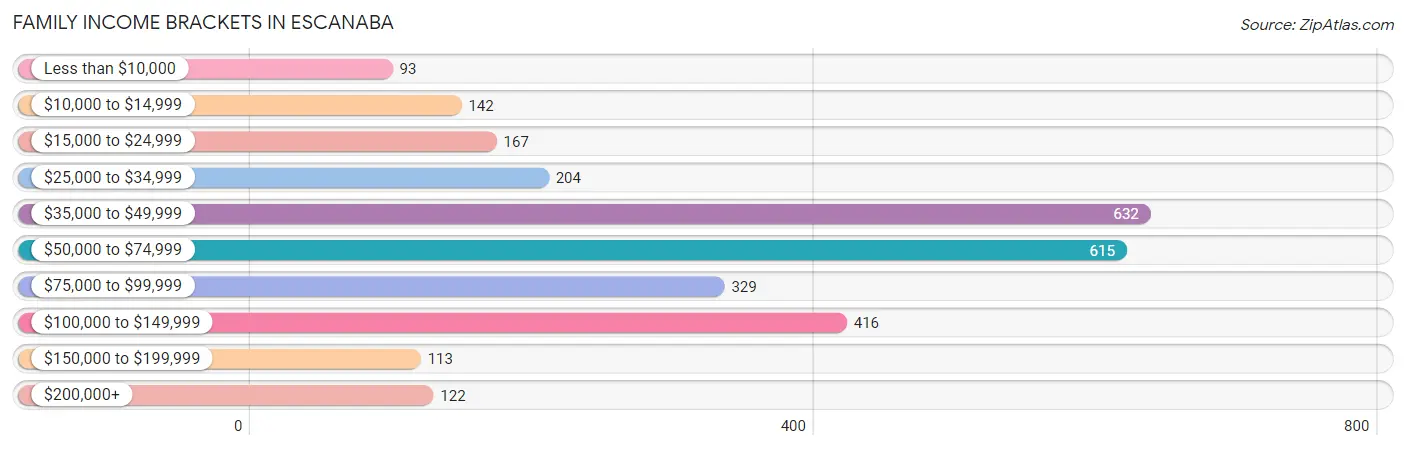
| Income Bracket | # Families | % Families |
| Less than $10,000 | 93 | 3.3% |
| $10,000 to $14,999 | 142 | 5.0% |
| $15,000 to $24,999 | 167 | 5.9% |
| $25,000 to $34,999 | 204 | 7.2% |
| $35,000 to $49,999 | 632 | 22.3% |
| $50,000 to $74,999 | 615 | 21.7% |
| $75,000 to $99,999 | 329 | 11.6% |
| $100,000 to $149,999 | 416 | 14.7% |
| $150,000 to $199,999 | 113 | 4.0% |
| $200,000+ | 122 | 4.3% |
Family Income by Famaliy Size in Escanaba
5-person families (173 | 6.1%) account for the highest median family income in Escanaba with $79,219 per family, while 2-person families (1,609 | 56.8%) have the highest median income of $25,662 per family member.
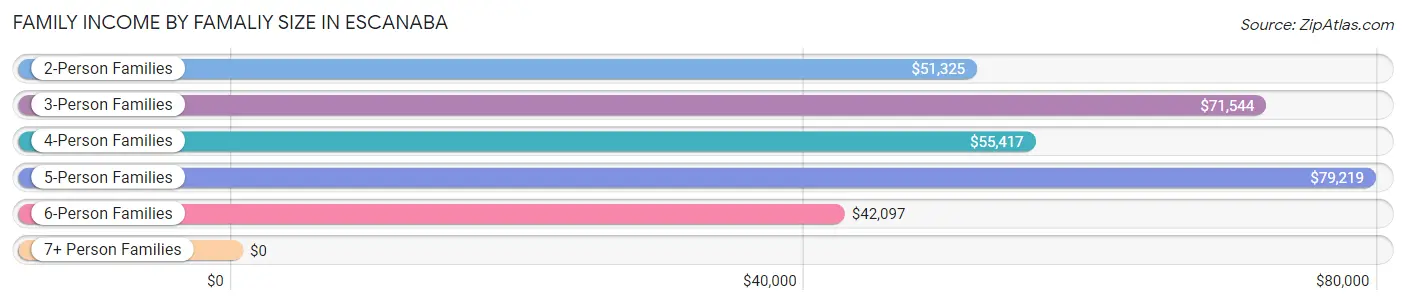
| Income Bracket | # Families | Median Income |
| 2-Person Families | 1,609 (56.8%) | $51,325 |
| 3-Person Families | 532 (18.8%) | $71,544 |
| 4-Person Families | 377 (13.3%) | $55,417 |
| 5-Person Families | 173 (6.1%) | $79,219 |
| 6-Person Families | 126 (4.4%) | $42,097 |
| 7+ Person Families | 15 (0.5%) | $0 |
| Total | 2,832 (100.0%) | $57,595 |
Family Income by Number of Earners in Escanaba
The median family income in Escanaba is $57,595, with families comprising 3+ earners (135) having the highest median family income of $94,861, while families with no earners (793) have the lowest median family income of $40,605, accounting for 4.8% and 28.0% of families, respectively.
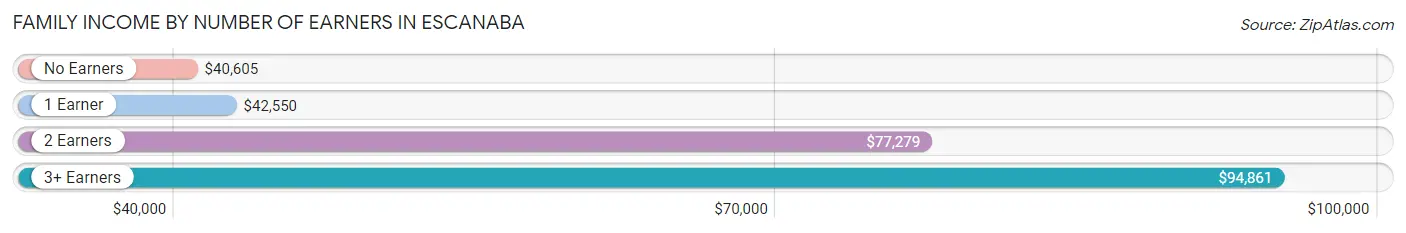
| Number of Earners | # Families | Median Income |
| No Earners | 793 (28.0%) | $40,605 |
| 1 Earner | 945 (33.4%) | $42,550 |
| 2 Earners | 959 (33.9%) | $77,279 |
| 3+ Earners | 135 (4.8%) | $94,861 |
| Total | 2,832 (100.0%) | $57,595 |
Household Income in Escanaba
Household Income Brackets in Escanaba
With 927 households falling in the category, the $50,000 to $74,999 income range is the most frequent in Escanaba, accounting for 16.1% of all households. In contrast, only 138 households (2.4%) fall into the $150,000 to $199,999 income bracket, making it the least populous group.
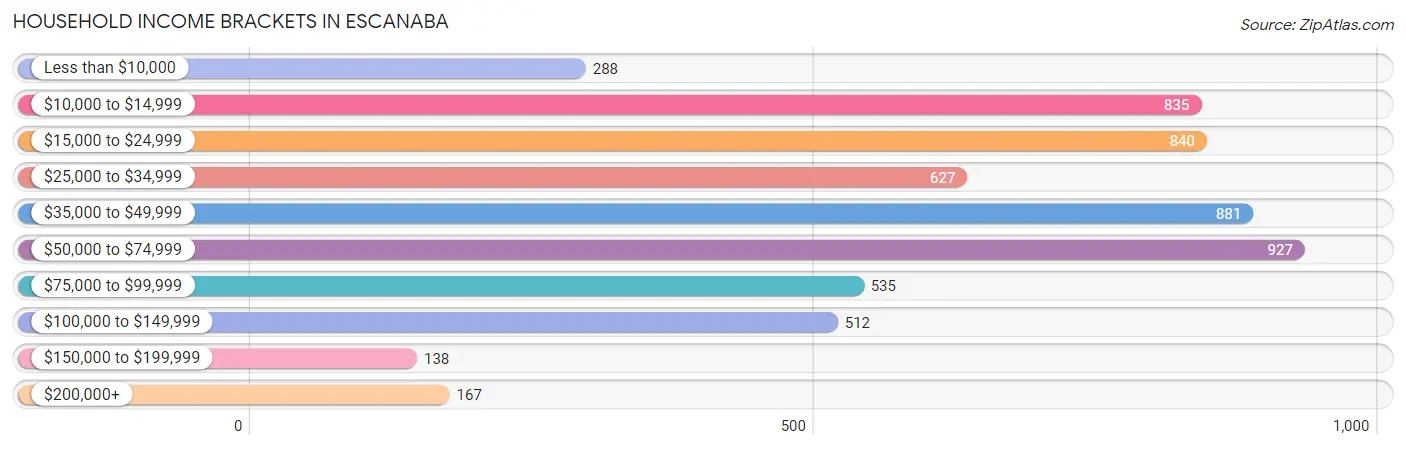
| Income Bracket | # Households | % Households |
| Less than $10,000 | 288 | 5.0% |
| $10,000 to $14,999 | 835 | 14.5% |
| $15,000 to $24,999 | 840 | 14.6% |
| $25,000 to $34,999 | 627 | 10.9% |
| $35,000 to $49,999 | 881 | 15.3% |
| $50,000 to $74,999 | 927 | 16.1% |
| $75,000 to $99,999 | 535 | 9.3% |
| $100,000 to $149,999 | 512 | 8.9% |
| $150,000 to $199,999 | 138 | 2.4% |
| $200,000+ | 167 | 2.9% |
Household Income by Householder Age in Escanaba
The median household income in Escanaba is $38,457, with the highest median household income of $51,645 found in the 25 to 44 years age bracket for the primary householder. A total of 1,636 households (28.4%) fall into this category. Meanwhile, the 65+ years age bracket for the primary householder has the lowest median household income of $26,635, with 1,820 households (31.6%) in this group.
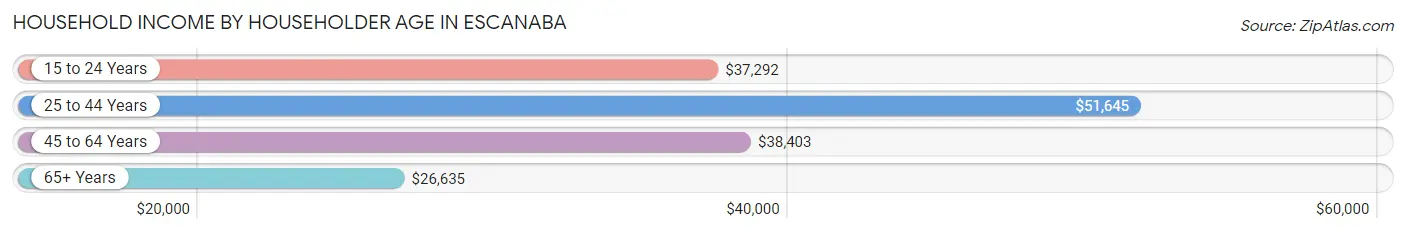
| Income Bracket | # Households | Median Income |
| 15 to 24 Years | 162 (2.8%) | $37,292 |
| 25 to 44 Years | 1,636 (28.4%) | $51,645 |
| 45 to 64 Years | 2,138 (37.1%) | $38,403 |
| 65+ Years | 1,820 (31.6%) | $26,635 |
| Total | 5,756 (100.0%) | $38,457 |
Poverty in Escanaba
Income Below Poverty by Sex and Age in Escanaba
With 18.1% poverty level for males and 19.9% for females among the residents of Escanaba, 16 and 17 year old males and 5 year old females are the most vulnerable to poverty, with 54 males (45.0%) and 24 females (72.7%) in their respective age groups living below the poverty level.
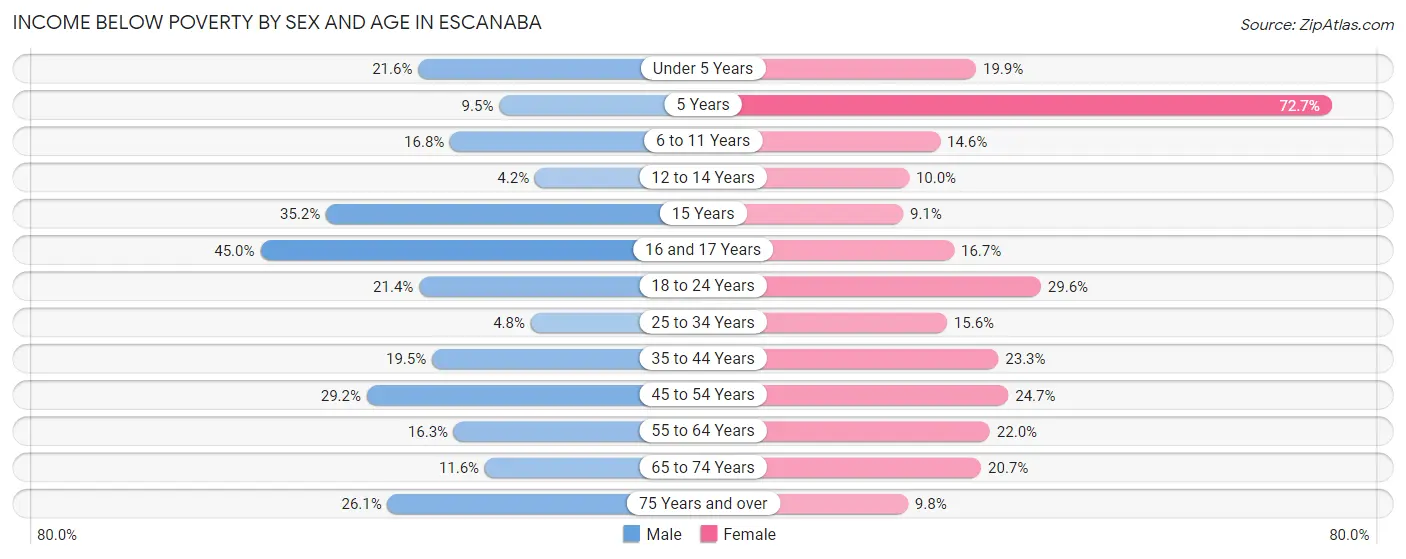
| Age Bracket | Male | Female |
| Under 5 Years | 64 (21.5%) | 69 (19.9%) |
| 5 Years | 10 (9.5%) | 24 (72.7%) |
| 6 to 11 Years | 100 (16.8%) | 41 (14.6%) |
| 12 to 14 Years | 4 (4.2%) | 30 (10.0%) |
| 15 Years | 31 (35.2%) | 2 (9.1%) |
| 16 and 17 Years | 54 (45.0%) | 35 (16.7%) |
| 18 to 24 Years | 79 (21.4%) | 139 (29.6%) |
| 25 to 34 Years | 37 (4.8%) | 96 (15.6%) |
| 35 to 44 Years | 164 (19.5%) | 179 (23.3%) |
| 45 to 54 Years | 169 (29.2%) | 178 (24.7%) |
| 55 to 64 Years | 137 (16.3%) | 208 (22.0%) |
| 65 to 74 Years | 68 (11.6%) | 169 (20.7%) |
| 75 Years and over | 123 (26.1%) | 66 (9.8%) |
| Total | 1,040 (18.1%) | 1,236 (19.9%) |
Income Above Poverty by Sex and Age in Escanaba
According to the poverty statistics in Escanaba, males aged 12 to 14 years and females aged 15 years are the age groups that are most secure financially, with 95.8% of males and 90.9% of females in these age groups living above the poverty line.
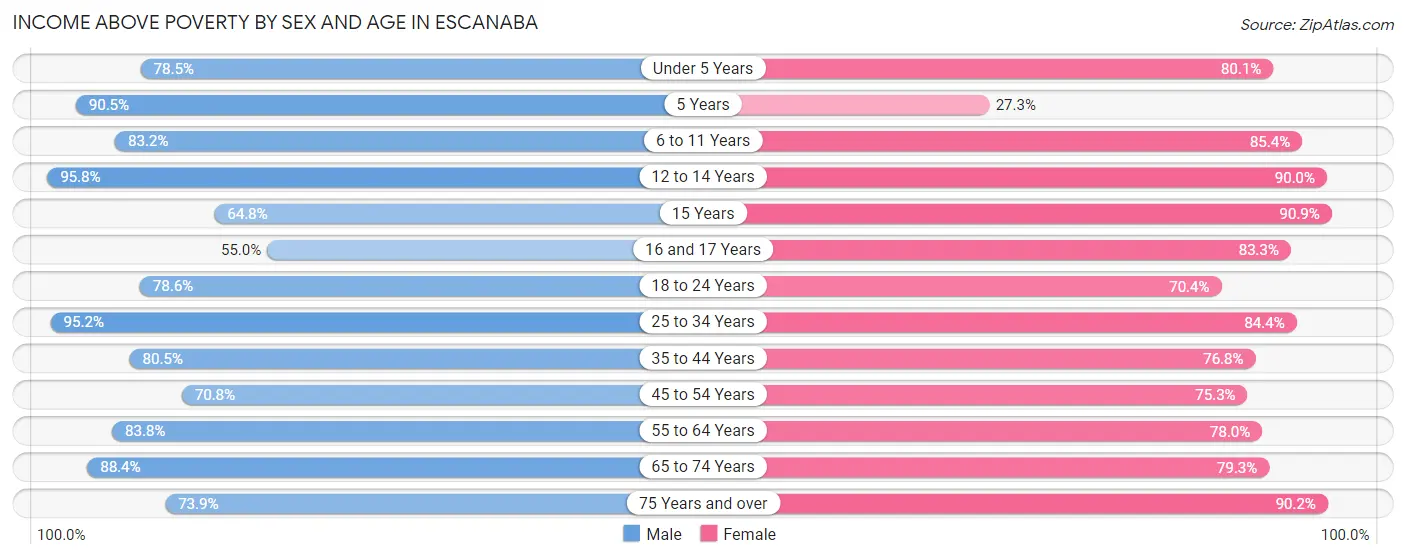
| Age Bracket | Male | Female |
| Under 5 Years | 233 (78.4%) | 277 (80.1%) |
| 5 Years | 95 (90.5%) | 9 (27.3%) |
| 6 to 11 Years | 495 (83.2%) | 240 (85.4%) |
| 12 to 14 Years | 91 (95.8%) | 271 (90.0%) |
| 15 Years | 57 (64.8%) | 20 (90.9%) |
| 16 and 17 Years | 66 (55.0%) | 175 (83.3%) |
| 18 to 24 Years | 290 (78.6%) | 331 (70.4%) |
| 25 to 34 Years | 727 (95.2%) | 519 (84.4%) |
| 35 to 44 Years | 677 (80.5%) | 591 (76.7%) |
| 45 to 54 Years | 410 (70.8%) | 542 (75.3%) |
| 55 to 64 Years | 706 (83.8%) | 738 (78.0%) |
| 65 to 74 Years | 516 (88.4%) | 648 (79.3%) |
| 75 Years and over | 348 (73.9%) | 606 (90.2%) |
| Total | 4,711 (81.9%) | 4,967 (80.1%) |
Income Below Poverty Among Married-Couple Families in Escanaba
The poverty statistics for married-couple families in Escanaba show that 8.8% or 167 of the total 1,888 families live below the poverty line. Families with 1 or 2 children have the highest poverty rate of 23.9%, comprising of 115 families. On the other hand, families with 5 or more children have the lowest poverty rate of 0.0%, which includes 0 families.
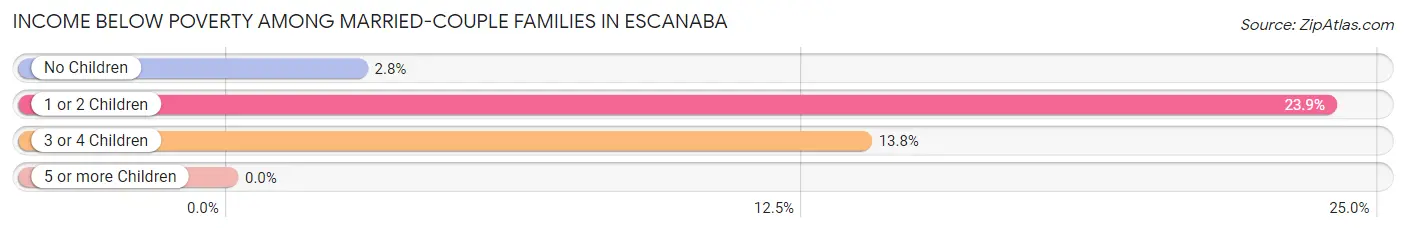
| Children | Above Poverty | Below Poverty |
| No Children | 1,240 (97.2%) | 36 (2.8%) |
| 1 or 2 Children | 366 (76.1%) | 115 (23.9%) |
| 3 or 4 Children | 100 (86.2%) | 16 (13.8%) |
| 5 or more Children | 15 (100.0%) | 0 (0.0%) |
| Total | 1,721 (91.1%) | 167 (8.8%) |
Income Below Poverty Among Single-Parent Households in Escanaba
According to the poverty data in Escanaba, 22.2% or 71 single-father households and 18.4% or 115 single-mother households are living below the poverty line. Among single-father households, those with 3 or 4 children have the highest poverty rate, with 13 households (56.5%) experiencing poverty. Likewise, among single-mother households, those with 3 or 4 children have the highest poverty rate, with 50 households (54.3%) falling below the poverty line.
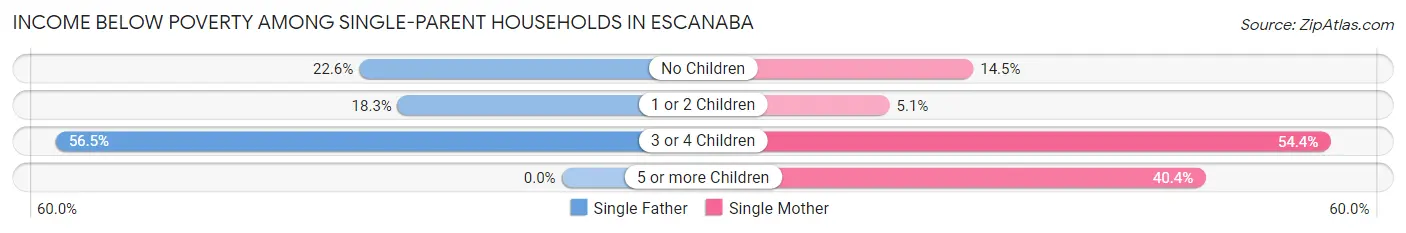
| Children | Single Father | Single Mother |
| No Children | 19 (22.6%) | 30 (14.5%) |
| 1 or 2 Children | 39 (18.3%) | 14 (5.1%) |
| 3 or 4 Children | 13 (56.5%) | 50 (54.3%) |
| 5 or more Children | 0 (0.0%) | 21 (40.4%) |
| Total | 71 (22.2%) | 115 (18.4%) |
Income Below Poverty Among Married-Couple vs Single-Parent Households in Escanaba
The poverty data for Escanaba shows that 167 of the married-couple family households (8.8%) and 186 of the single-parent households (19.7%) are living below the poverty level. Within the married-couple family households, those with 1 or 2 children have the highest poverty rate, with 115 households (23.9%) falling below the poverty line. Among the single-parent households, those with 3 or 4 children have the highest poverty rate, with 63 household (54.8%) living below poverty.
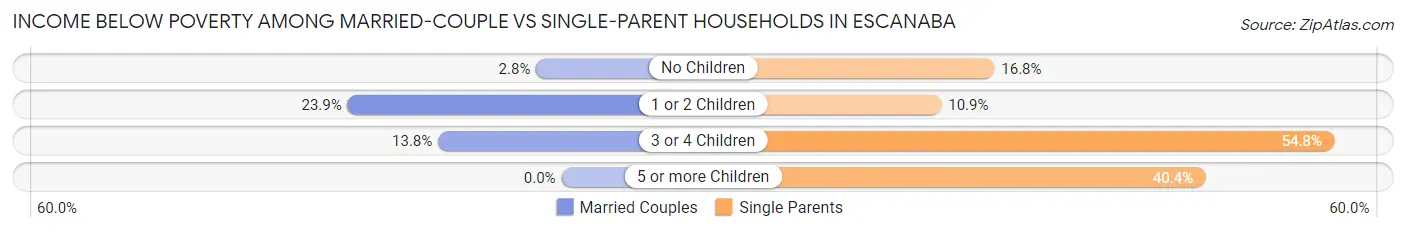
| Children | Married-Couple Families | Single-Parent Households |
| No Children | 36 (2.8%) | 49 (16.8%) |
| 1 or 2 Children | 115 (23.9%) | 53 (10.9%) |
| 3 or 4 Children | 16 (13.8%) | 63 (54.8%) |
| 5 or more Children | 0 (0.0%) | 21 (40.4%) |
| Total | 167 (8.8%) | 186 (19.7%) |
Race in Escanaba
The most populous races in Escanaba are White / Caucasian (10,988 | 88.6%), Two or more Races (1,013 | 8.2%), and Native / Alaskan (294 | 2.4%).
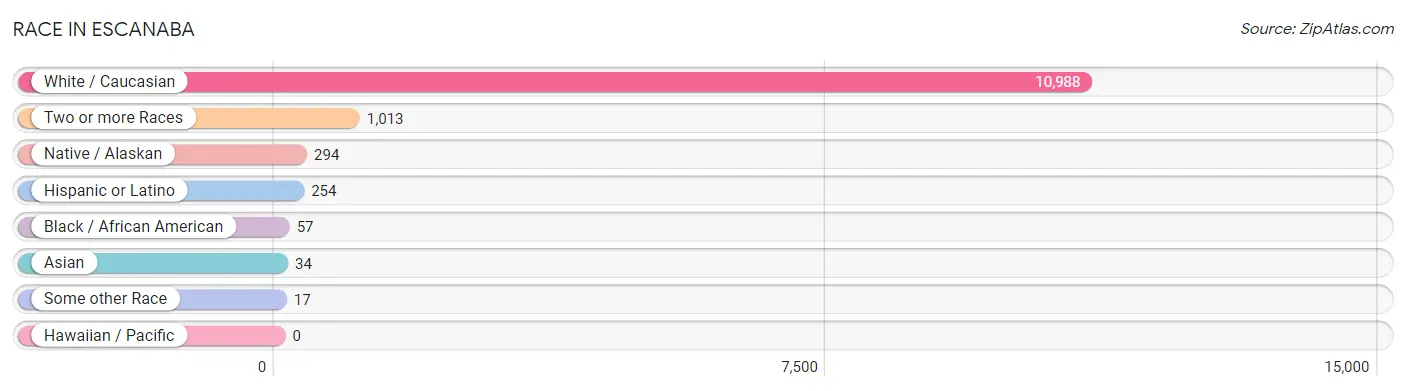
| Race | # Population | % Population |
| Asian | 34 | 0.3% |
| Black / African American | 57 | 0.5% |
| Hawaiian / Pacific | 0 | 0.0% |
| Hispanic or Latino | 254 | 2.1% |
| Native / Alaskan | 294 | 2.4% |
| White / Caucasian | 10,988 | 88.6% |
| Two or more Races | 1,013 | 8.2% |
| Some other Race | 17 | 0.1% |
| Total | 12,403 | 100.0% |
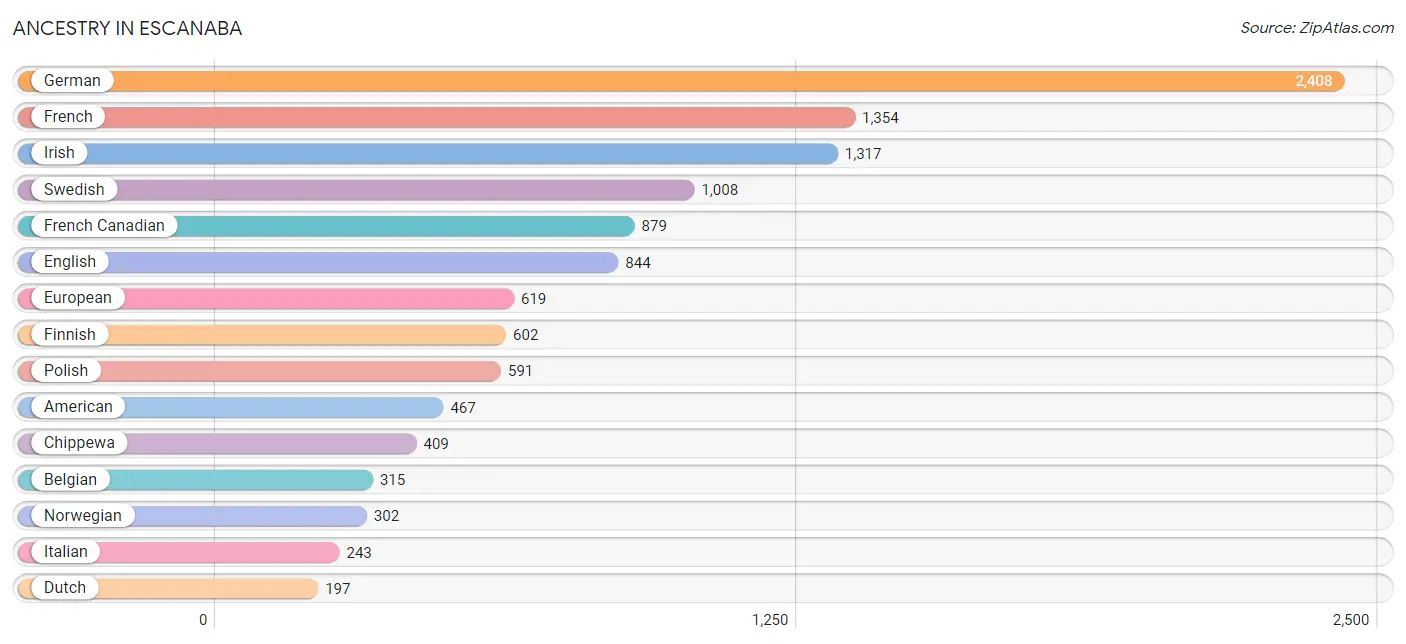
Ancestry in Escanaba
The most populous ancestries reported in Escanaba are German (2,408 | 19.4%), French (1,354 | 10.9%), Irish (1,317 | 10.6%), Swedish (1,008 | 8.1%), and French Canadian (879 | 7.1%), together accounting for 56.2% of all Escanaba residents.
| Ancestry | # Population | % Population |
| African | 6 | 0.1% |
| American | 467 | 3.8% |
| Arab | 17 | 0.1% |
| Armenian | 4 | 0.0% |
| Australian | 13 | 0.1% |
| Austrian | 31 | 0.3% |
| Belgian | 315 | 2.5% |
| Blackfeet | 25 | 0.2% |
| British | 36 | 0.3% |
| Burmese | 16 | 0.1% |
| Canadian | 18 | 0.2% |
| Chippewa | 409 | 3.3% |
| Croatian | 183 | 1.5% |
| Cuban | 52 | 0.4% |
| Czech | 112 | 0.9% |
| Danish | 72 | 0.6% |
| Dutch | 197 | 1.6% |
| Eastern European | 20 | 0.2% |
| English | 844 | 6.8% |
| European | 619 | 5.0% |
| Finnish | 602 | 4.9% |
| French | 1,354 | 10.9% |
| French American Indian | 45 | 0.4% |
| French Canadian | 879 | 7.1% |
| German | 2,408 | 19.4% |
| Hungarian | 77 | 0.6% |
| Indian (Asian) | 29 | 0.2% |
| Irish | 1,317 | 10.6% |
| Italian | 243 | 2.0% |
| Korean | 36 | 0.3% |
| Lebanese | 17 | 0.1% |
| Lithuanian | 48 | 0.4% |
| Luxembourger | 23 | 0.2% |
| Malaysian | 33 | 0.3% |
| Mexican | 119 | 1.0% |
| Northern European | 43 | 0.4% |
| Norwegian | 302 | 2.4% |
| Ottawa | 17 | 0.1% |
| Pakistani | 24 | 0.2% |
| Pennsylvania German | 23 | 0.2% |
| Polish | 591 | 4.8% |
| Potawatomi | 8 | 0.1% |
| Puerto Rican | 36 | 0.3% |
| Romanian | 16 | 0.1% |
| Russian | 27 | 0.2% |
| Scandinavian | 73 | 0.6% |
| Scotch-Irish | 45 | 0.4% |
| Scottish | 168 | 1.3% |
| Serbian | 4 | 0.0% |
| Spaniard | 21 | 0.2% |
| Spanish | 26 | 0.2% |
| Subsaharan African | 6 | 0.1% |
| Swedish | 1,008 | 8.1% |
| Swiss | 24 | 0.2% |
| Turkish | 1 | 0.0% |
| Welsh | 72 | 0.6% | View All 56 Rows |
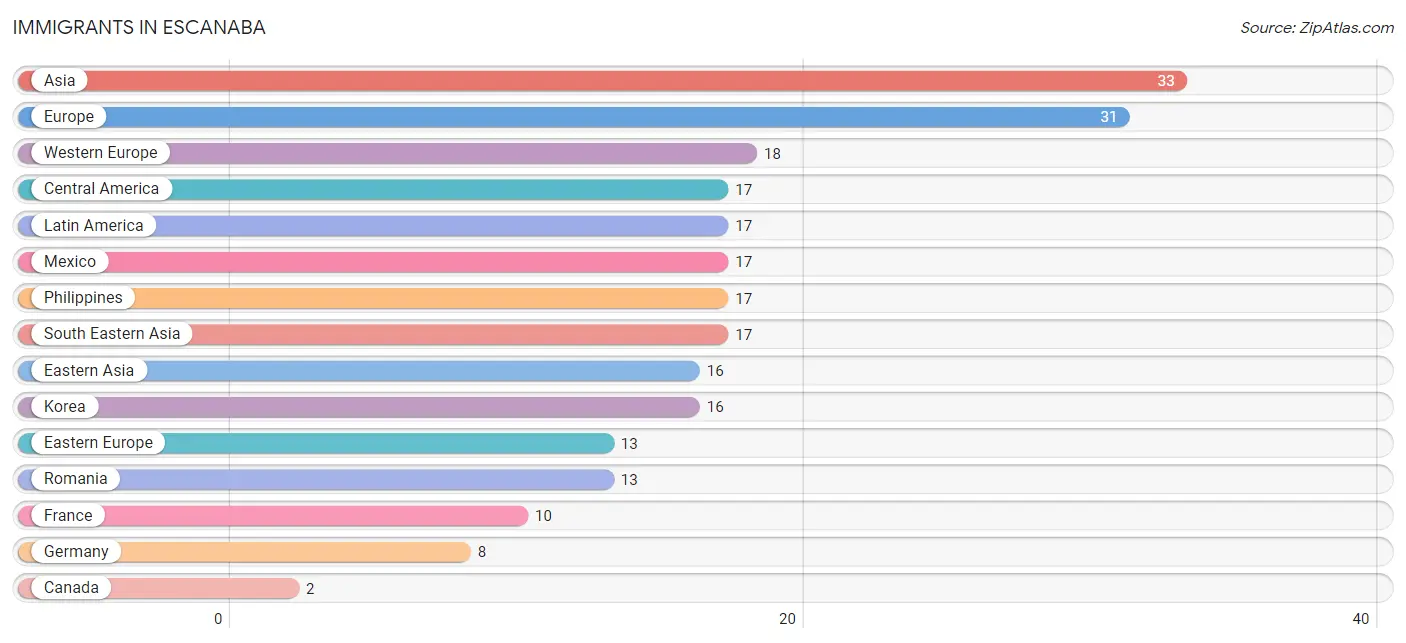
Immigrants in Escanaba
The most numerous immigrant groups reported in Escanaba came from Asia (33 | 0.3%), Europe (31 | 0.3%), Western Europe (18 | 0.2%), Central America (17 | 0.1%), and Latin America (17 | 0.1%), together accounting for 0.9% of all Escanaba residents.
| Immigration Origin | # Population | % Population |
| Asia | 33 | 0.3% |
| Canada | 2 | 0.0% |
| Central America | 17 | 0.1% |
| Eastern Asia | 16 | 0.1% |
| Eastern Europe | 13 | 0.1% |
| Europe | 31 | 0.3% |
| France | 10 | 0.1% |
| Germany | 8 | 0.1% |
| Korea | 16 | 0.1% |
| Latin America | 17 | 0.1% |
| Mexico | 17 | 0.1% |
| Philippines | 17 | 0.1% |
| Romania | 13 | 0.1% |
| South Eastern Asia | 17 | 0.1% |
| Western Europe | 18 | 0.2% | View All 15 Rows |
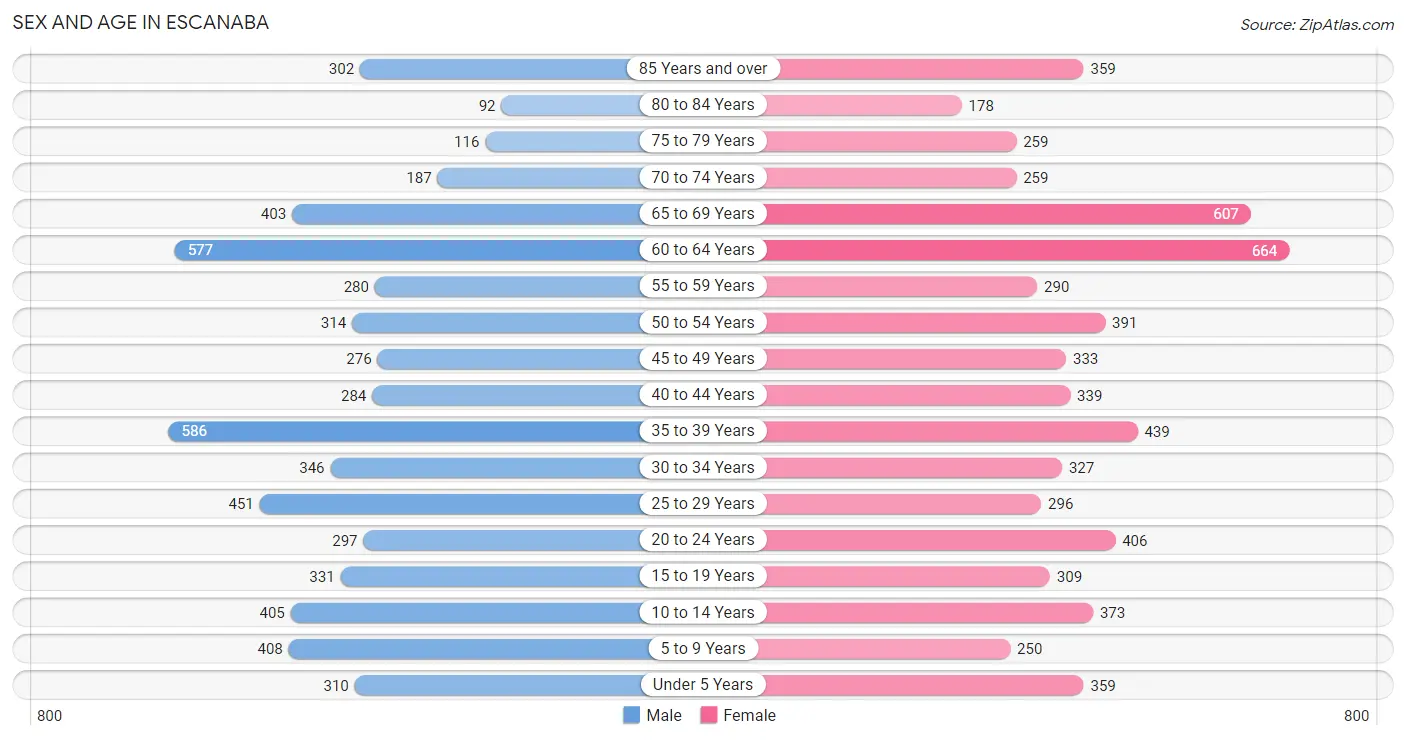
Sex and Age in Escanaba
Sex and Age in Escanaba
The most populous age groups in Escanaba are 35 to 39 Years (586 | 9.8%) for men and 60 to 64 Years (664 | 10.3%) for women.
| Age Bracket | Male | Female |
| Under 5 Years | 310 (5.2%) | 359 (5.6%) |
| 5 to 9 Years | 408 (6.8%) | 250 (3.9%) |
| 10 to 14 Years | 405 (6.8%) | 373 (5.8%) |
| 15 to 19 Years | 331 (5.6%) | 309 (4.8%) |
| 20 to 24 Years | 297 (5.0%) | 406 (6.3%) |
| 25 to 29 Years | 451 (7.6%) | 296 (4.6%) |
| 30 to 34 Years | 346 (5.8%) | 327 (5.1%) |
| 35 to 39 Years | 586 (9.8%) | 439 (6.8%) |
| 40 to 44 Years | 284 (4.8%) | 339 (5.3%) |
| 45 to 49 Years | 276 (4.6%) | 333 (5.2%) |
| 50 to 54 Years | 314 (5.3%) | 391 (6.1%) |
| 55 to 59 Years | 280 (4.7%) | 290 (4.5%) |
| 60 to 64 Years | 577 (9.7%) | 664 (10.3%) |
| 65 to 69 Years | 403 (6.8%) | 607 (9.4%) |
| 70 to 74 Years | 187 (3.1%) | 259 (4.0%) |
| 75 to 79 Years | 116 (1.9%) | 259 (4.0%) |
| 80 to 84 Years | 92 (1.5%) | 178 (2.8%) |
| 85 Years and over | 302 (5.1%) | 359 (5.6%) |
| Total | 5,965 (100.0%) | 6,438 (100.0%) |
Families and Households in Escanaba
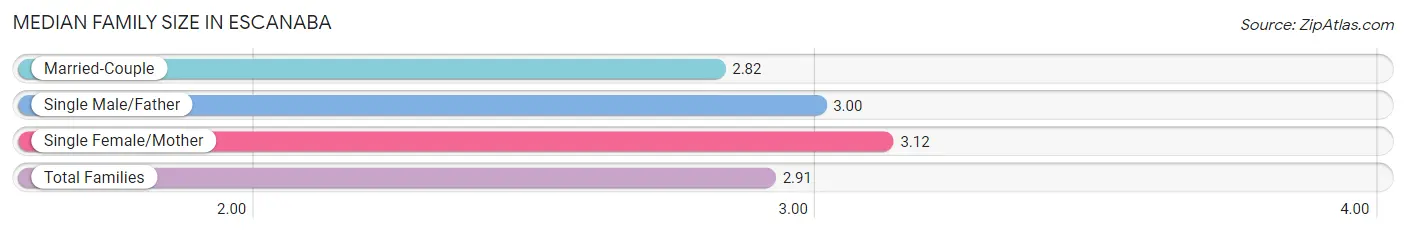
Median Family Size in Escanaba
The median family size in Escanaba is 2.91 persons per family, with single female/mother families (624 | 22.0%) accounting for the largest median family size of 3.12 persons per family. On the other hand, married-couple families (1,888 | 66.7%) represent the smallest median family size with 2.82 persons per family.
| Family Type | # Families | Family Size |
| Married-Couple | 1,888 (66.7%) | 2.82 |
| Single Male/Father | 320 (11.3%) | 3.00 |
| Single Female/Mother | 624 (22.0%) | 3.12 |
| Total Families | 2,832 (100.0%) | 2.91 |
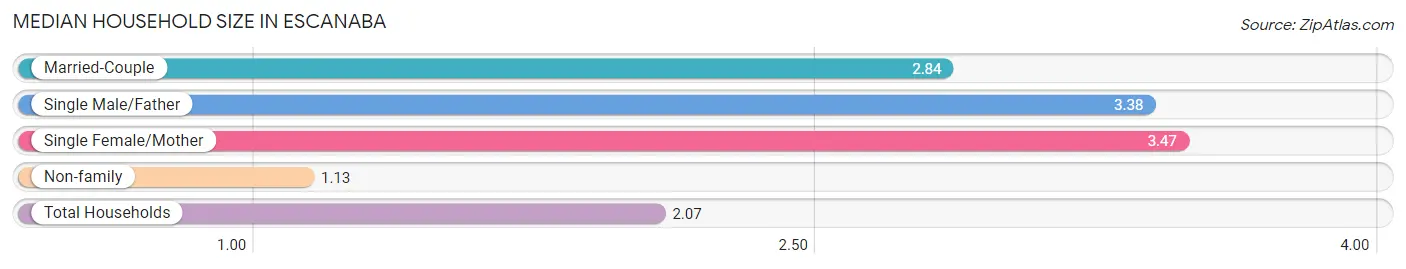
Median Household Size in Escanaba
The median household size in Escanaba is 2.07 persons per household, with single female/mother households (624 | 10.8%) accounting for the largest median household size of 3.47 persons per household. non-family households (2,924 | 50.8%) represent the smallest median household size with 1.13 persons per household.
| Household Type | # Households | Household Size |
| Married-Couple | 1,888 (32.8%) | 2.84 |
| Single Male/Father | 320 (5.6%) | 3.38 |
| Single Female/Mother | 624 (10.8%) | 3.47 |
| Non-family | 2,924 (50.8%) | 1.13 |
| Total Households | 5,756 (100.0%) | 2.07 |
Household Size by Marriage Status in Escanaba
Out of a total of 5,756 households in Escanaba, 2,832 (49.2%) are family households, while 2,924 (50.8%) are nonfamily households. The most numerous type of family households are 2-person households, comprising 1,493, and the most common type of nonfamily households are 1-person households, comprising 2,557.
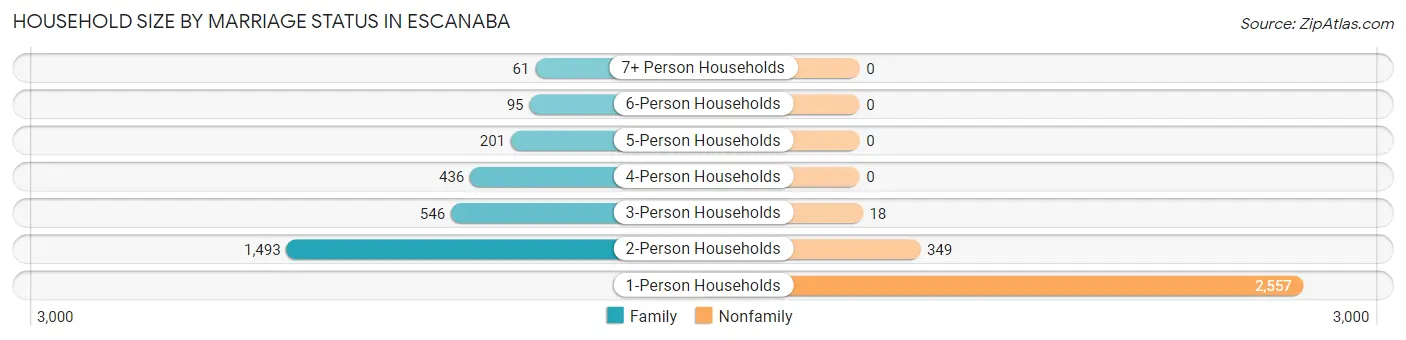
| Household Size | Family Households | Nonfamily Households |
| 1-Person Households | - | 2,557 (44.4%) |
| 2-Person Households | 1,493 (25.9%) | 349 (6.1%) |
| 3-Person Households | 546 (9.5%) | 18 (0.3%) |
| 4-Person Households | 436 (7.6%) | 0 (0.0%) |
| 5-Person Households | 201 (3.5%) | 0 (0.0%) |
| 6-Person Households | 95 (1.7%) | 0 (0.0%) |
| 7+ Person Households | 61 (1.1%) | 0 (0.0%) |
| Total | 2,832 (49.2%) | 2,924 (50.8%) |
Female Fertility in Escanaba
Fertility by Age in Escanaba
Average fertility rate in Escanaba is 38.0 births per 1,000 women. Women in the age bracket of 20 to 34 years have the highest fertility rate with 92.0 births per 1,000 women. Women in the age bracket of 20 to 34 years acount for 100.0% of all women with births.
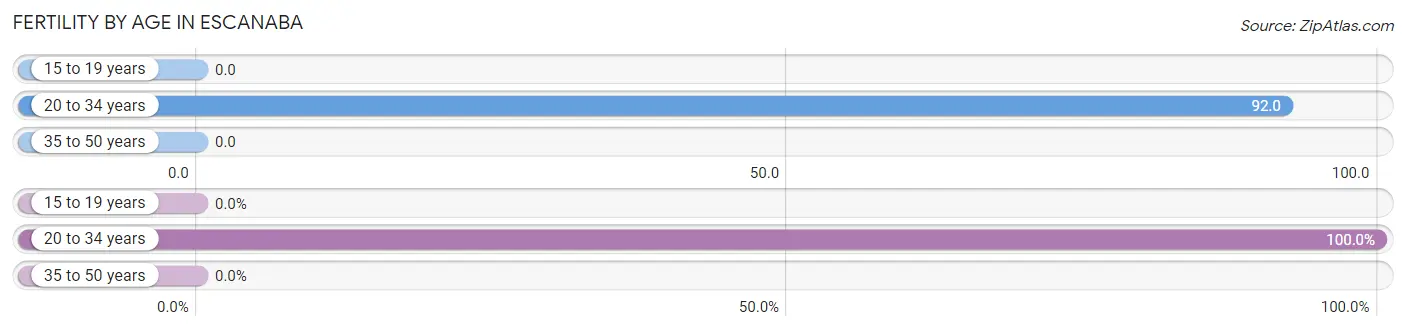
| Age Bracket | Women with Births | Births / 1,000 Women |
| 15 to 19 years | 0 (0.0%) | 0.0 |
| 20 to 34 years | 95 (100.0%) | 92.0 |
| 35 to 50 years | 0 (0.0%) | 0.0 |
| Total | 95 (100.0%) | 38.0 |
Fertility by Age by Marriage Status in Escanaba
82.1% of women with births (95) in Escanaba are married. The highest percentage of unmarried women with births falls into 20 to 34 years age bracket with 17.9% of them unmarried at the time of birth, while the lowest percentage of unmarried women with births belong to 20 to 34 years age bracket with 17.9% of them unmarried.
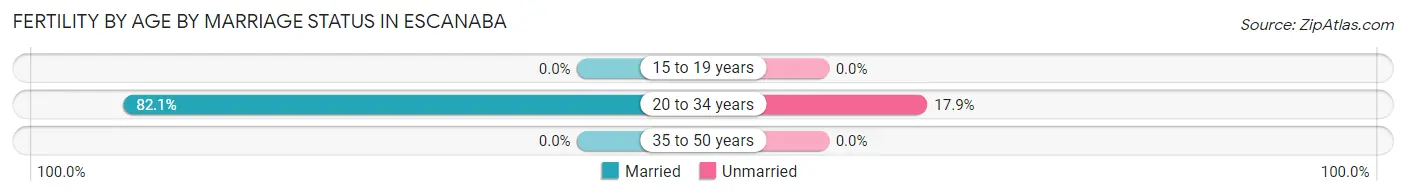
| Age Bracket | Married | Unmarried |
| 15 to 19 years | 0 (0.0%) | 0 (0.0%) |
| 20 to 34 years | 78 (82.1%) | 17 (17.9%) |
| 35 to 50 years | 0 (0.0%) | 0 (0.0%) |
| Total | 78 (82.1%) | 17 (17.9%) |
Fertility by Education in Escanaba
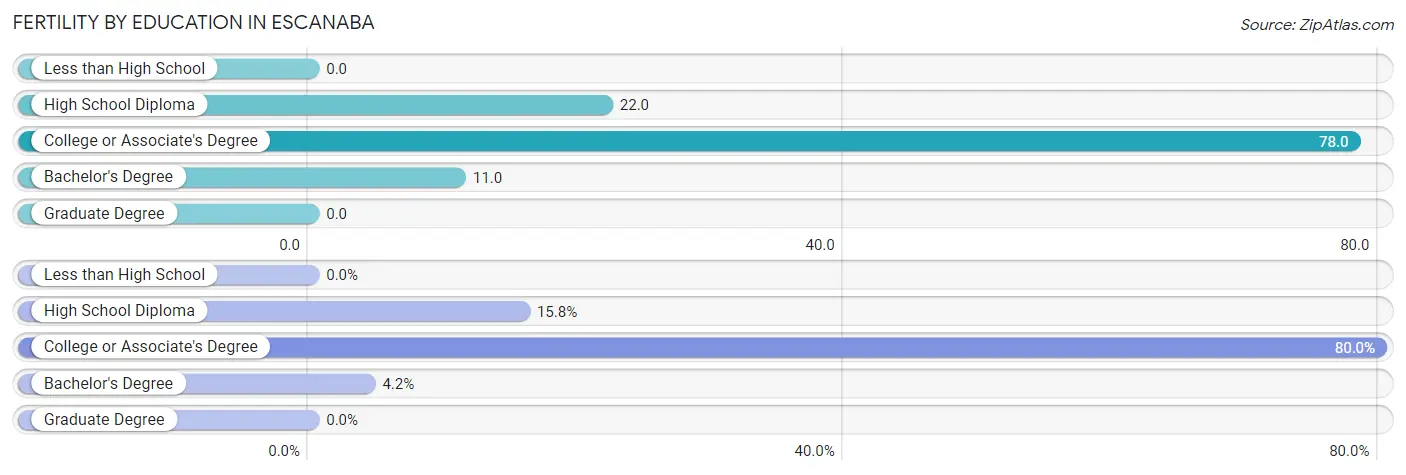
| Educational Attainment | Women with Births | Births / 1,000 Women |
| Less than High School | 0 (0.0%) | 0.0 |
| High School Diploma | 15 (15.8%) | 22.0 |
| College or Associate's Degree | 76 (80.0%) | 78.0 |
| Bachelor's Degree | 4 (4.2%) | 11.0 |
| Graduate Degree | 0 (0.0%) | 0.0 |
| Total | 95 (100.0%) | 38.0 |
Fertility by Education by Marriage Status in Escanaba
17.9% of women with births in Escanaba are unmarried. Women with the educational attainment of bachelor's degree are most likely to be married with 100.0% of them married at childbirth, while women with the educational attainment of high school diploma are least likely to be married with 100.0% of them unmarried at childbirth.
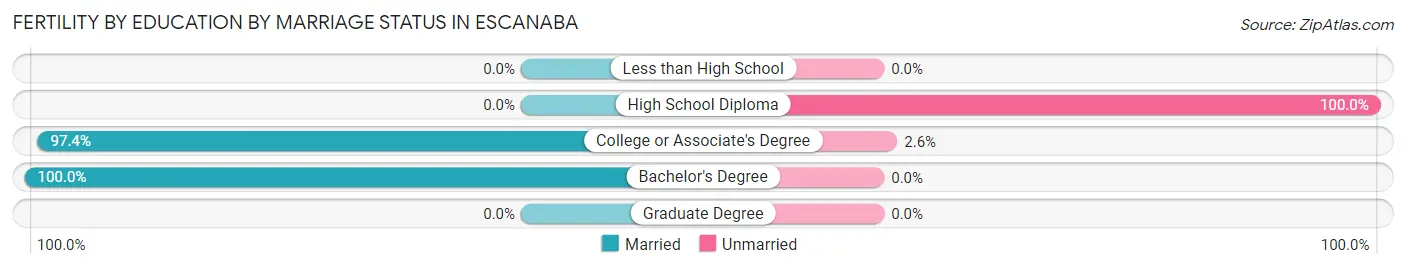
| Educational Attainment | Married | Unmarried |
| Less than High School | 0 (0.0%) | 0 (0.0%) |
| High School Diploma | 0 (0.0%) | 15 (100.0%) |
| College or Associate's Degree | 74 (97.4%) | 2 (2.6%) |
| Bachelor's Degree | 4 (100.0%) | 0 (0.0%) |
| Graduate Degree | 0 (0.0%) | 0 (0.0%) |
| Total | 78 (82.1%) | 17 (17.9%) |
Employment Characteristics in Escanaba
Employment by Class of Employer in Escanaba
Among the 4,786 employed individuals in Escanaba, private company employees (3,434 | 71.8%), not-for-profit organizations (466 | 9.7%), and local government employees (271 | 5.7%) make up the most common classes of employment.
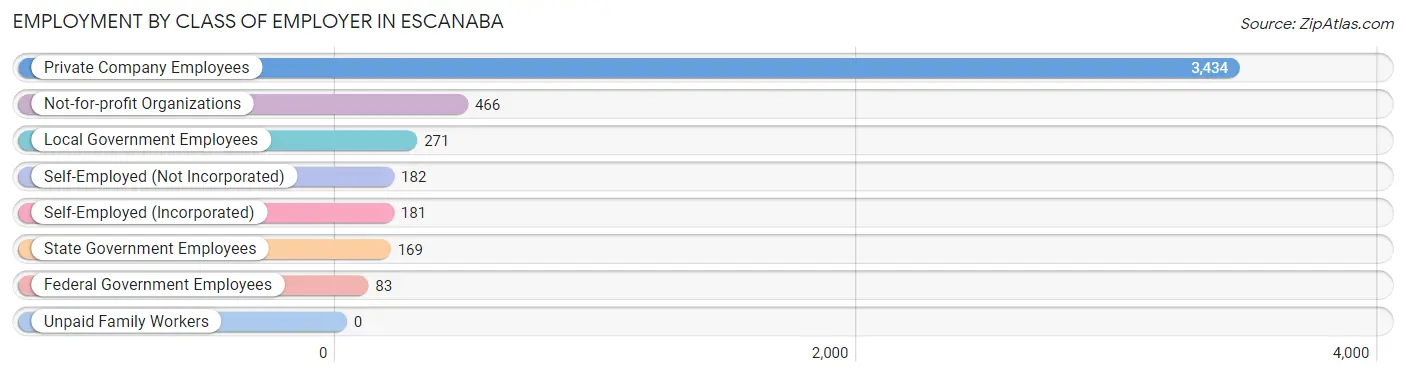
| Employer Class | # Employees | % Employees |
| Private Company Employees | 3,434 | 71.8% |
| Self-Employed (Incorporated) | 181 | 3.8% |
| Self-Employed (Not Incorporated) | 182 | 3.8% |
| Not-for-profit Organizations | 466 | 9.7% |
| Local Government Employees | 271 | 5.7% |
| State Government Employees | 169 | 3.5% |
| Federal Government Employees | 83 | 1.7% |
| Unpaid Family Workers | 0 | 0.0% |
| Total | 4,786 | 100.0% |
Employment Status by Age in Escanaba
According to the labor force statistics for Escanaba, out of the total population over 16 years of age (10,188), 51.6% or 5,257 individuals are in the labor force, with 7.2% or 379 of them unemployed. The age group with the highest labor force participation rate is 20 to 24 years, with 86.5% or 608 individuals in the labor force. Within the labor force, the 55 to 59 years age range has the highest percentage of unemployed individuals, with 21.4% or 72 of them being unemployed.
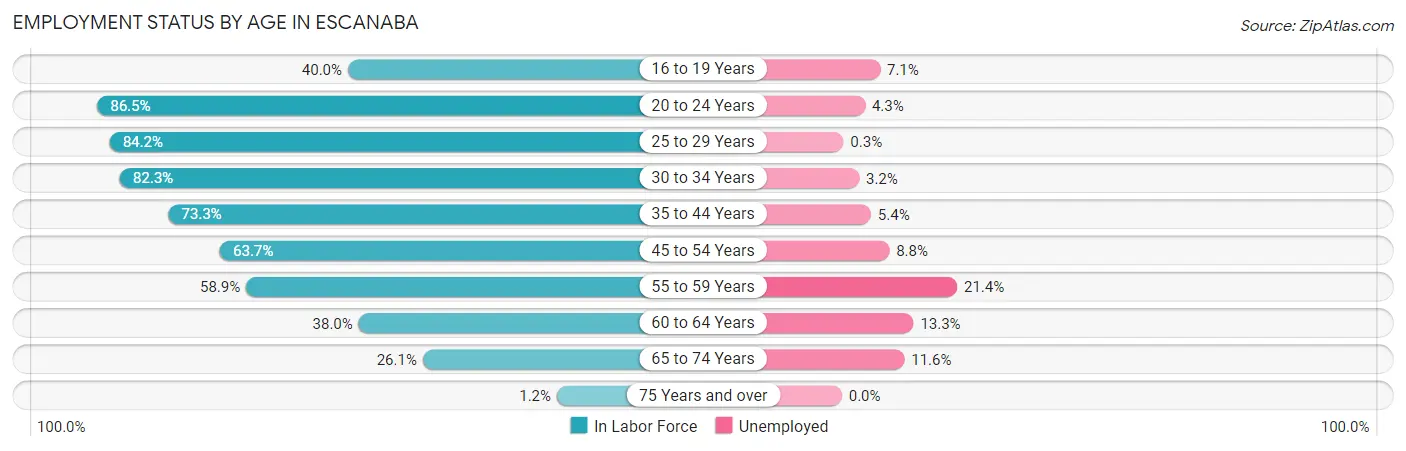
| Age Bracket | In Labor Force | Unemployed |
| 16 to 19 Years | 212 (40.0%) | 15 (7.1%) |
| 20 to 24 Years | 608 (86.5%) | 26 (4.3%) |
| 25 to 29 Years | 629 (84.2%) | 2 (0.3%) |
| 30 to 34 Years | 554 (82.3%) | 18 (3.2%) |
| 35 to 44 Years | 1,208 (73.3%) | 65 (5.4%) |
| 45 to 54 Years | 837 (63.7%) | 74 (8.8%) |
| 55 to 59 Years | 336 (58.9%) | 72 (21.4%) |
| 60 to 64 Years | 472 (38.0%) | 63 (13.3%) |
| 65 to 74 Years | 380 (26.1%) | 44 (11.6%) |
| 75 Years and over | 16 (1.2%) | 0 (0.0%) |
| Total | 5,257 (51.6%) | 379 (7.2%) |
Employment Status by Educational Attainment in Escanaba
According to labor force statistics for Escanaba, 65.2% of individuals (4,038) out of the total population between 25 and 64 years of age (6,193) are in the labor force, with 7.3% or 295 of them being unemployed. The group with the highest labor force participation rate are those with the educational attainment of bachelor's degree or higher, with 80.0% or 966 individuals in the labor force. Within the labor force, individuals with bachelor's degree or higher education have the highest percentage of unemployment, with 12.0% or 116 of them being unemployed.
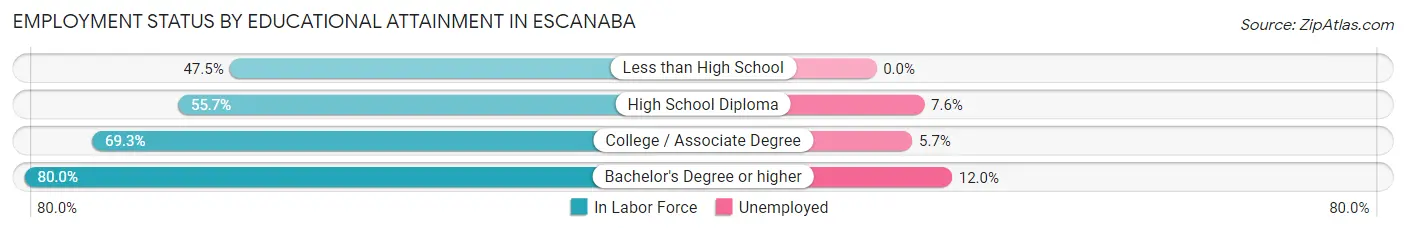
| Educational Attainment | In Labor Force | Unemployed |
| Less than High School | 289 (47.5%) | 0 (0.0%) |
| High School Diploma | 1,029 (55.7%) | 140 (7.6%) |
| College / Associate Degree | 1,753 (69.3%) | 144 (5.7%) |
| Bachelor's Degree or higher | 966 (80.0%) | 145 (12.0%) |
| Total | 4,038 (65.2%) | 452 (7.3%) |
Employment Occupations by Sex in Escanaba
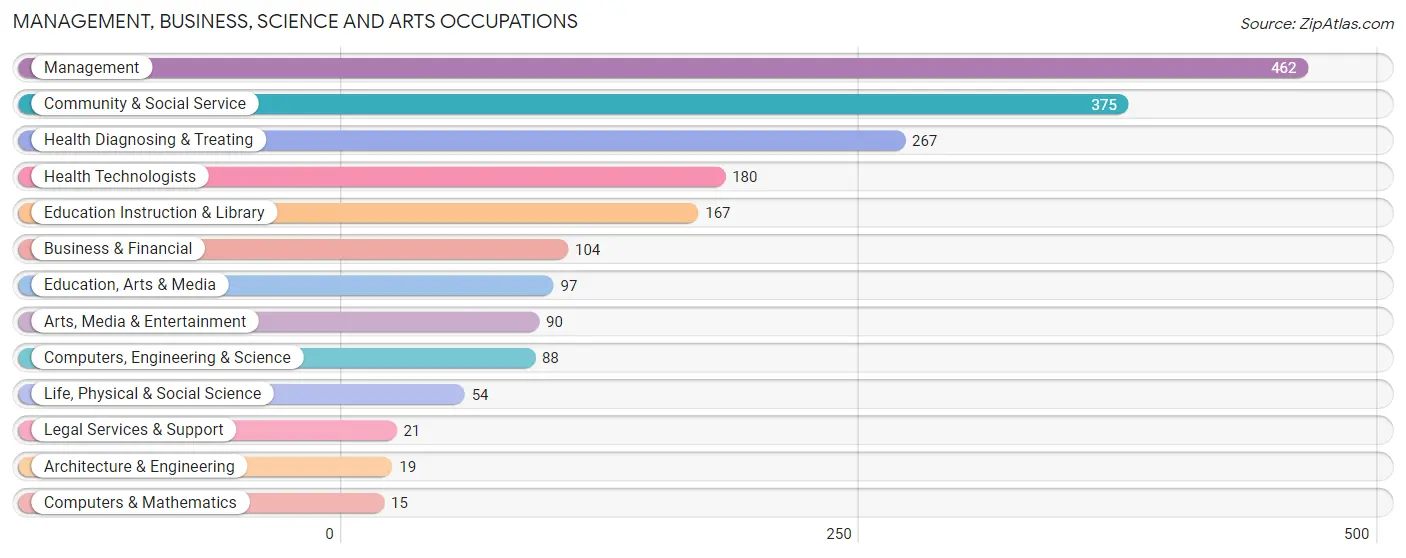
Management, Business, Science and Arts Occupations
The most common Management, Business, Science and Arts occupations in Escanaba are Management (462 | 9.5%), Community & Social Service (375 | 7.7%), Health Diagnosing & Treating (267 | 5.5%), Health Technologists (180 | 3.7%), and Education Instruction & Library (167 | 3.4%).
Management, Business, Science and Arts Occupations by Sex
Within the Management, Business, Science and Arts occupations in Escanaba, the most male-oriented occupations are Computers & Mathematics (100.0%), Architecture & Engineering (100.0%), and Legal Services & Support (76.2%), while the most female-oriented occupations are Business & Financial (91.3%), Education, Arts & Media (86.6%), and Education Instruction & Library (86.2%).

| Occupation | Male | Female |
| Management | 225 (48.7%) | 237 (51.3%) |
| Business & Financial | 9 (8.6%) | 95 (91.3%) |
| Computers, Engineering & Science | 47 (53.4%) | 41 (46.6%) |
| Computers & Mathematics | 15 (100.0%) | 0 (0.0%) |
| Architecture & Engineering | 19 (100.0%) | 0 (0.0%) |
| Life, Physical & Social Science | 13 (24.1%) | 41 (75.9%) |
| Community & Social Service | 78 (20.8%) | 297 (79.2%) |
| Education, Arts & Media | 13 (13.4%) | 84 (86.6%) |
| Legal Services & Support | 16 (76.2%) | 5 (23.8%) |
| Education Instruction & Library | 23 (13.8%) | 144 (86.2%) |
| Arts, Media & Entertainment | 26 (28.9%) | 64 (71.1%) |
| Health Diagnosing & Treating | 47 (17.6%) | 220 (82.4%) |
| Health Technologists | 41 (22.8%) | 139 (77.2%) |
| Total (Category) | 406 (31.3%) | 890 (68.7%) |
| Total (Overall) | 2,335 (47.9%) | 2,538 (52.1%) |
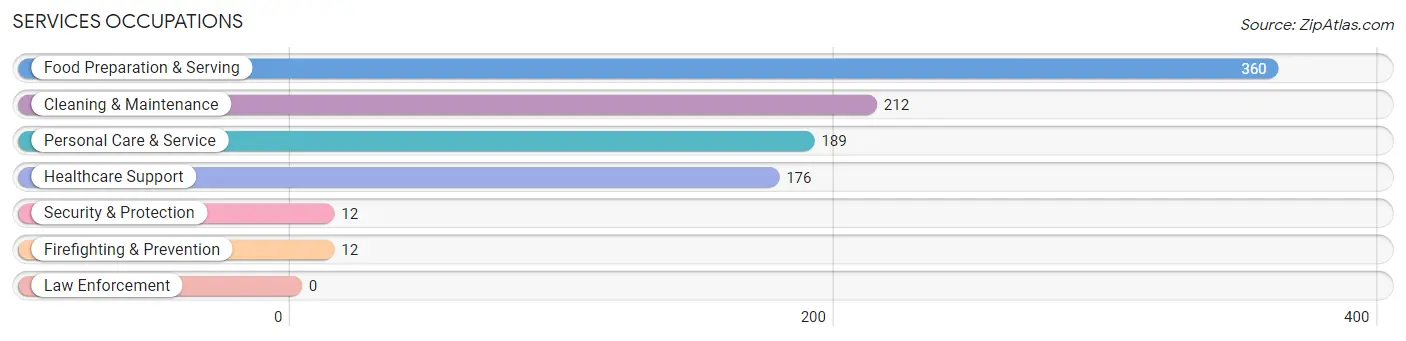
Services Occupations
The most common Services occupations in Escanaba are Food Preparation & Serving (360 | 7.4%), Cleaning & Maintenance (212 | 4.3%), Personal Care & Service (189 | 3.9%), Healthcare Support (176 | 3.6%), and Security & Protection (12 | 0.3%).
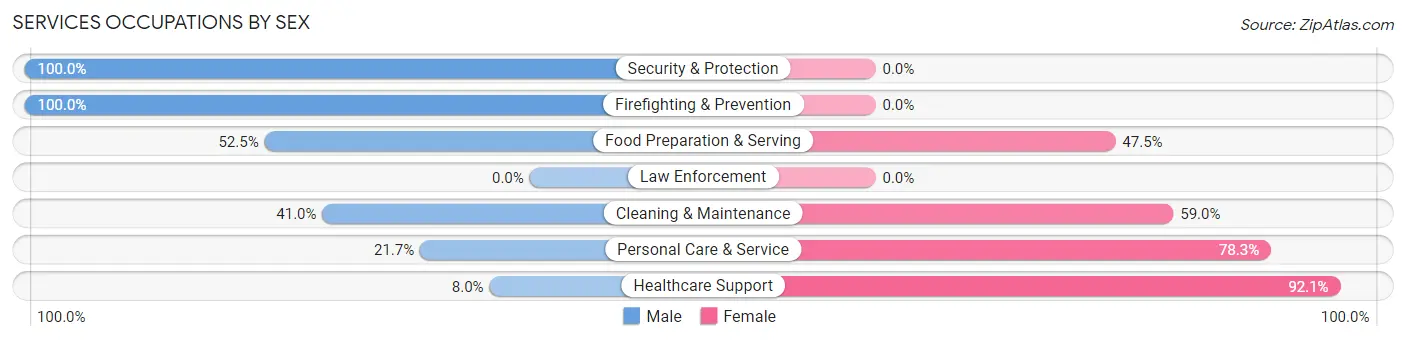
Services Occupations by Sex
Within the Services occupations in Escanaba, the most male-oriented occupations are Security & Protection (100.0%), Firefighting & Prevention (100.0%), and Food Preparation & Serving (52.5%), while the most female-oriented occupations are Healthcare Support (92.0%), Personal Care & Service (78.3%), and Cleaning & Maintenance (59.0%).
| Occupation | Male | Female |
| Healthcare Support | 14 (8.0%) | 162 (92.0%) |
| Security & Protection | 12 (100.0%) | 0 (0.0%) |
| Firefighting & Prevention | 12 (100.0%) | 0 (0.0%) |
| Law Enforcement | 0 (0.0%) | 0 (0.0%) |
| Food Preparation & Serving | 189 (52.5%) | 171 (47.5%) |
| Cleaning & Maintenance | 87 (41.0%) | 125 (59.0%) |
| Personal Care & Service | 41 (21.7%) | 148 (78.3%) |
| Total (Category) | 343 (36.1%) | 606 (63.9%) |
| Total (Overall) | 2,335 (47.9%) | 2,538 (52.1%) |
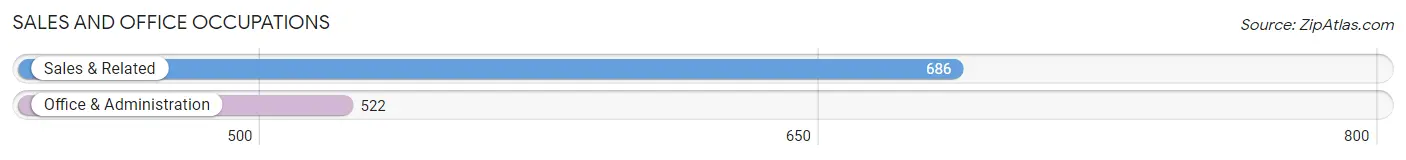
Sales and Office Occupations
The most common Sales and Office occupations in Escanaba are Sales & Related (686 | 14.1%), and Office & Administration (522 | 10.7%).
Sales and Office Occupations by Sex
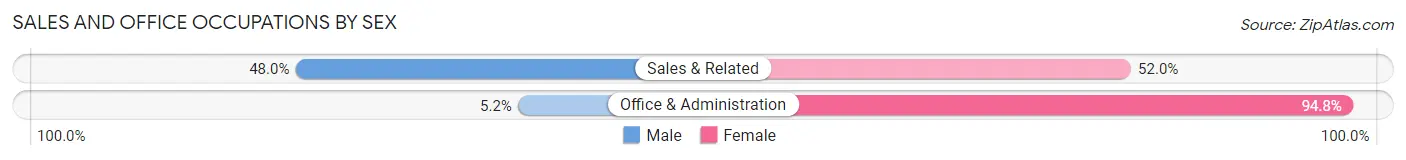
| Occupation | Male | Female |
| Sales & Related | 329 (48.0%) | 357 (52.0%) |
| Office & Administration | 27 (5.2%) | 495 (94.8%) |
| Total (Category) | 356 (29.5%) | 852 (70.5%) |
| Total (Overall) | 2,335 (47.9%) | 2,538 (52.1%) |
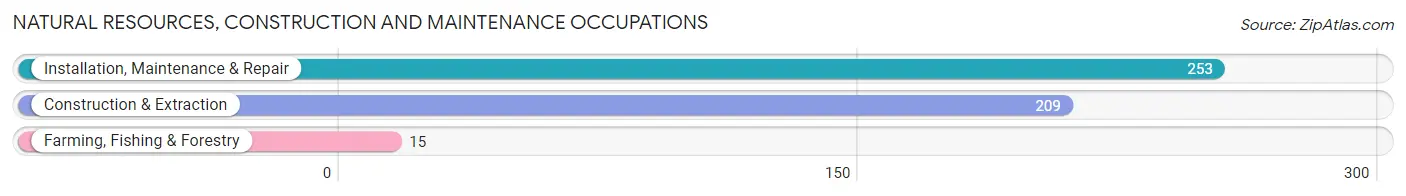
Natural Resources, Construction and Maintenance Occupations
The most common Natural Resources, Construction and Maintenance occupations in Escanaba are Installation, Maintenance & Repair (253 | 5.2%), Construction & Extraction (209 | 4.3%), and Farming, Fishing & Forestry (15 | 0.3%).
Natural Resources, Construction and Maintenance Occupations by Sex
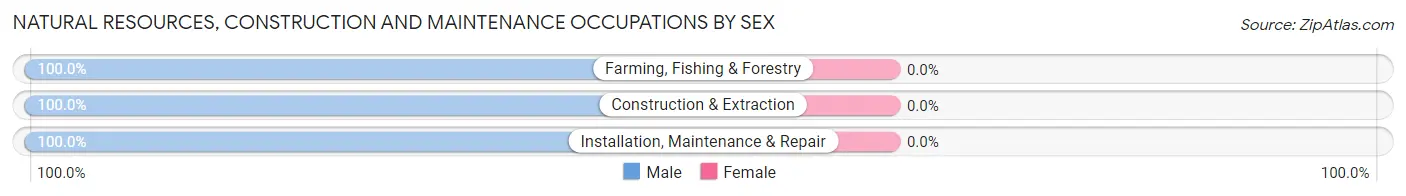
| Occupation | Male | Female |
| Farming, Fishing & Forestry | 15 (100.0%) | 0 (0.0%) |
| Construction & Extraction | 209 (100.0%) | 0 (0.0%) |
| Installation, Maintenance & Repair | 253 (100.0%) | 0 (0.0%) |
| Total (Category) | 477 (100.0%) | 0 (0.0%) |
| Total (Overall) | 2,335 (47.9%) | 2,538 (52.1%) |
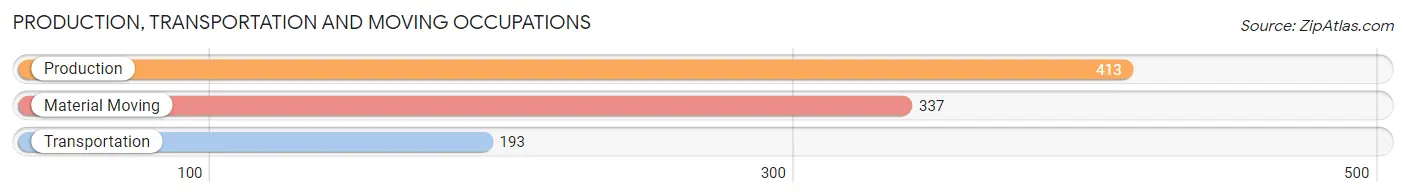
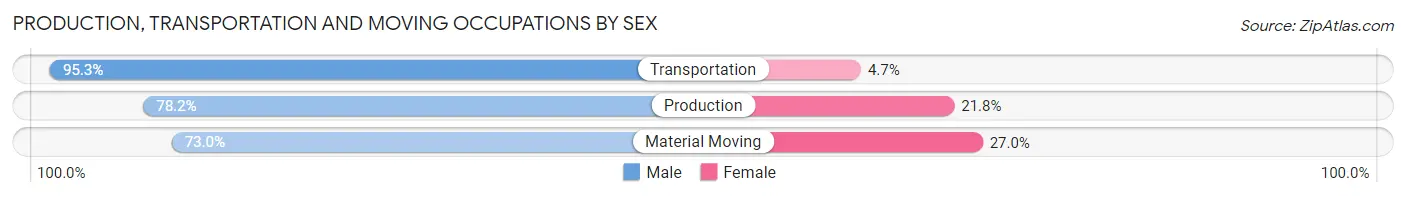
Production, Transportation and Moving Occupations
The most common Production, Transportation and Moving occupations in Escanaba are Production (413 | 8.5%), Material Moving (337 | 6.9%), and Transportation (193 | 4.0%).
Production, Transportation and Moving Occupations by Sex
| Occupation | Male | Female |
| Production | 323 (78.2%) | 90 (21.8%) |
| Transportation | 184 (95.3%) | 9 (4.7%) |
| Material Moving | 246 (73.0%) | 91 (27.0%) |
| Total (Category) | 753 (79.8%) | 190 (20.2%) |
| Total (Overall) | 2,335 (47.9%) | 2,538 (52.1%) |
Employment Industries by Sex in Escanaba
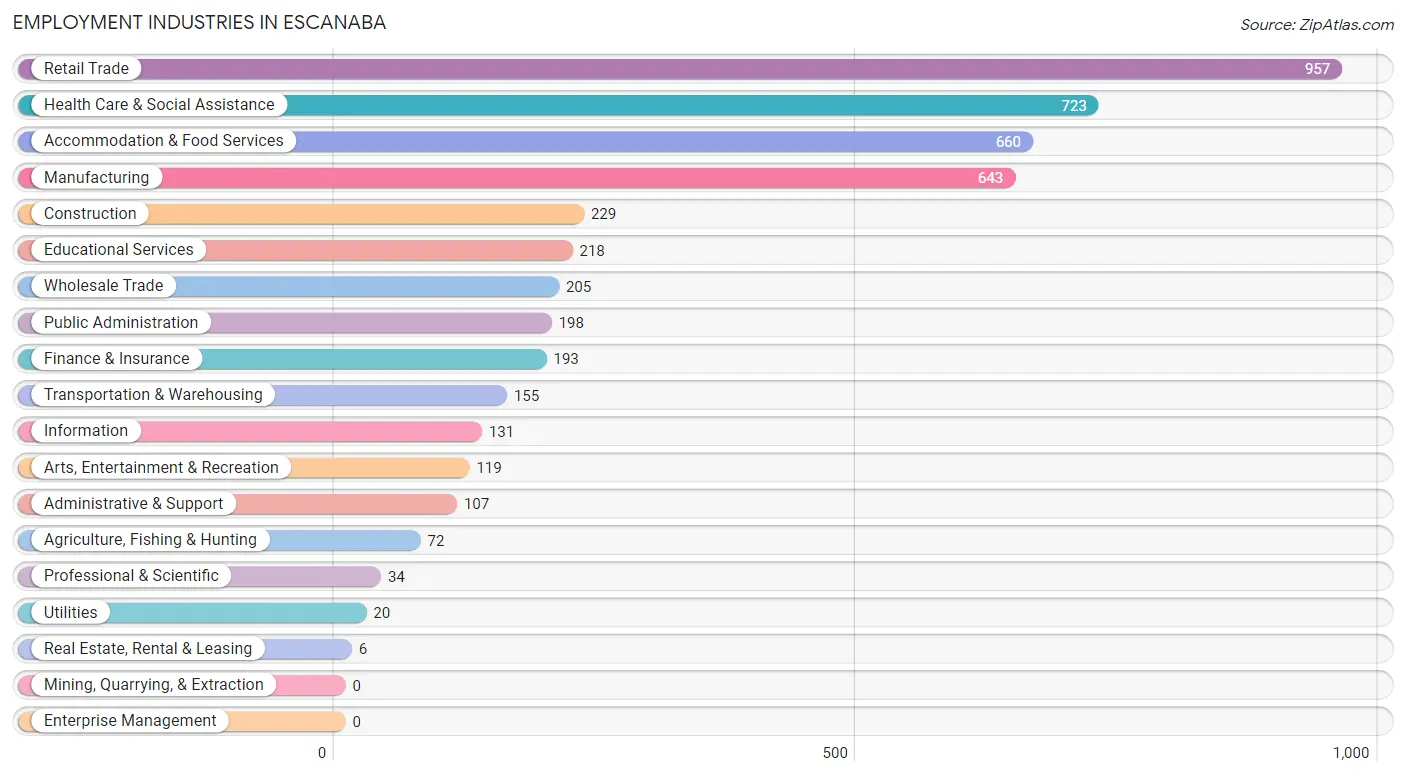
Employment Industries in Escanaba
The major employment industries in Escanaba include Retail Trade (957 | 19.6%), Health Care & Social Assistance (723 | 14.8%), Accommodation & Food Services (660 | 13.5%), Manufacturing (643 | 13.2%), and Construction (229 | 4.7%).
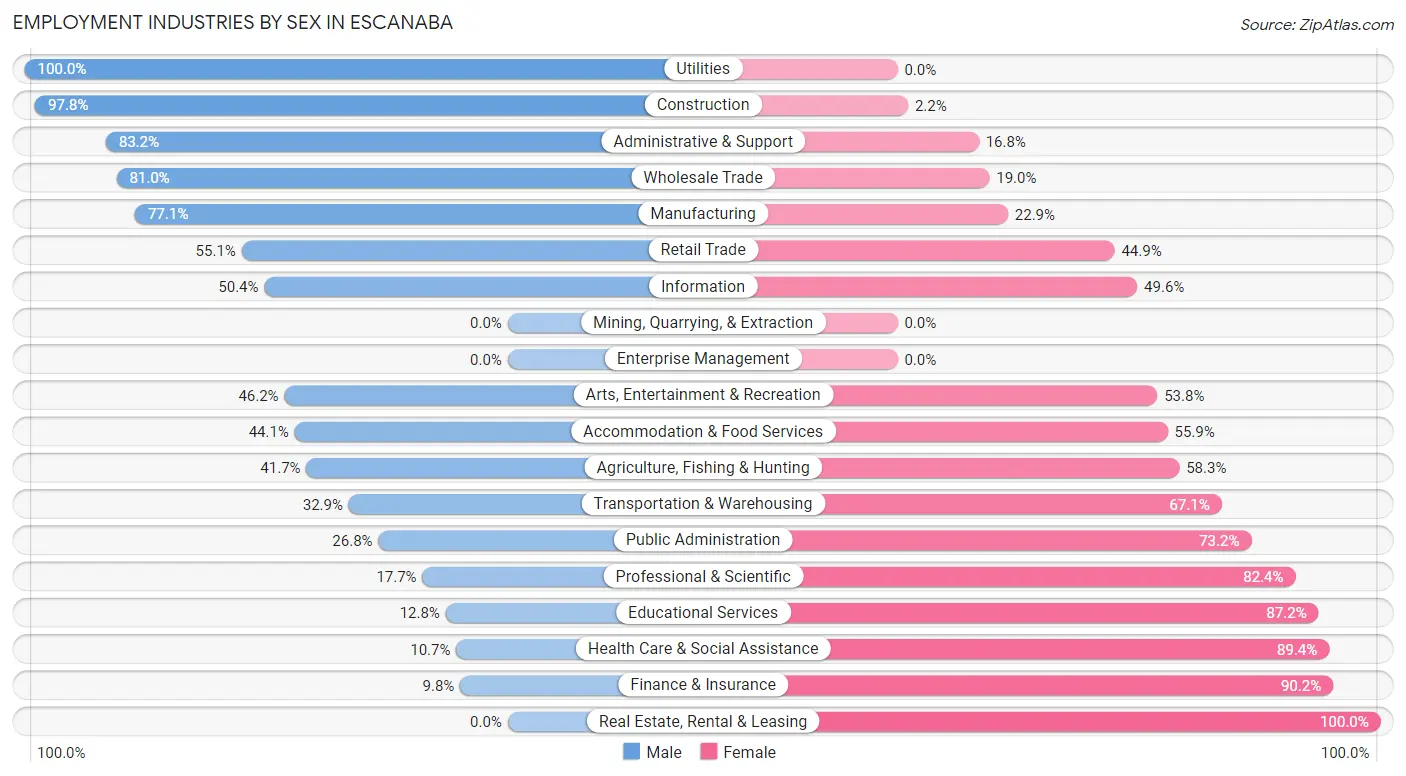
Employment Industries by Sex in Escanaba
The Escanaba industries that see more men than women are Utilities (100.0%), Construction (97.8%), and Administrative & Support (83.2%), whereas the industries that tend to have a higher number of women are Real Estate, Rental & Leasing (100.0%), Finance & Insurance (90.2%), and Health Care & Social Assistance (89.3%).
| Industry | Male | Female |
| Agriculture, Fishing & Hunting | 30 (41.7%) | 42 (58.3%) |
| Mining, Quarrying, & Extraction | 0 (0.0%) | 0 (0.0%) |
| Construction | 224 (97.8%) | 5 (2.2%) |
| Manufacturing | 496 (77.1%) | 147 (22.9%) |
| Wholesale Trade | 166 (81.0%) | 39 (19.0%) |
| Retail Trade | 527 (55.1%) | 430 (44.9%) |
| Transportation & Warehousing | 51 (32.9%) | 104 (67.1%) |
| Utilities | 20 (100.0%) | 0 (0.0%) |
| Information | 66 (50.4%) | 65 (49.6%) |
| Finance & Insurance | 19 (9.8%) | 174 (90.2%) |
| Real Estate, Rental & Leasing | 0 (0.0%) | 6 (100.0%) |
| Professional & Scientific | 6 (17.6%) | 28 (82.4%) |
| Enterprise Management | 0 (0.0%) | 0 (0.0%) |
| Administrative & Support | 89 (83.2%) | 18 (16.8%) |
| Educational Services | 28 (12.8%) | 190 (87.2%) |
| Health Care & Social Assistance | 77 (10.6%) | 646 (89.3%) |
| Arts, Entertainment & Recreation | 55 (46.2%) | 64 (53.8%) |
| Accommodation & Food Services | 291 (44.1%) | 369 (55.9%) |
| Public Administration | 53 (26.8%) | 145 (73.2%) |
| Total | 2,335 (47.9%) | 2,538 (52.1%) |
Education in Escanaba
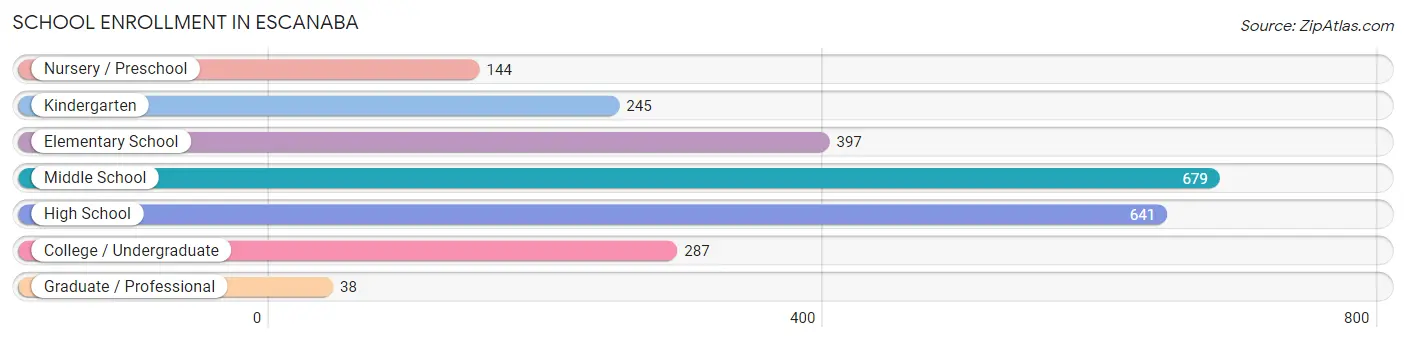
School Enrollment in Escanaba
The most common levels of schooling among the 2,431 students in Escanaba are middle school (679 | 27.9%), high school (641 | 26.4%), and elementary school (397 | 16.3%).
| School Level | # Students | % Students |
| Nursery / Preschool | 144 | 5.9% |
| Kindergarten | 245 | 10.1% |
| Elementary School | 397 | 16.3% |
| Middle School | 679 | 27.9% |
| High School | 641 | 26.4% |
| College / Undergraduate | 287 | 11.8% |
| Graduate / Professional | 38 | 1.6% |
| Total | 2,431 | 100.0% |
School Enrollment by Age by Funding Source in Escanaba
Out of a total of 2,431 students who are enrolled in schools in Escanaba, 321 (13.2%) attend a private institution, while the remaining 2,110 (86.8%) are enrolled in public schools. The age group of 3 to 4 year olds has the highest likelihood of being enrolled in private schools, with 53 (44.5% in the age bracket) enrolled. Conversely, the age group of 15 to 17 year olds has the lowest likelihood of being enrolled in a private school, with 447 (100.0% in the age bracket) attending a public institution.
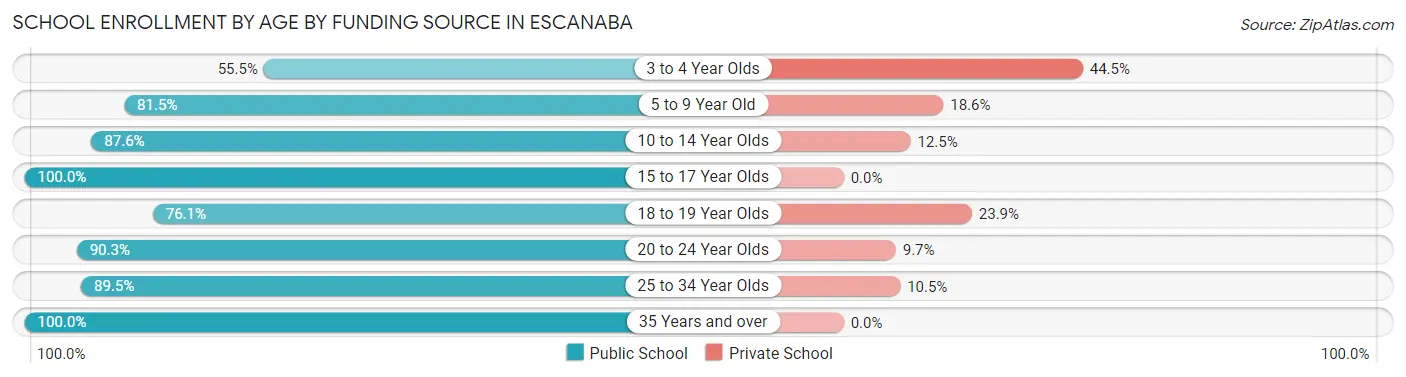
| Age Bracket | Public School | Private School |
| 3 to 4 Year Olds | 66 (55.5%) | 53 (44.5%) |
| 5 to 9 Year Old | 505 (81.5%) | 115 (18.5%) |
| 10 to 14 Year Olds | 661 (87.5%) | 94 (12.4%) |
| 15 to 17 Year Olds | 447 (100.0%) | 0 (0.0%) |
| 18 to 19 Year Olds | 102 (76.1%) | 32 (23.9%) |
| 20 to 24 Year Olds | 158 (90.3%) | 17 (9.7%) |
| 25 to 34 Year Olds | 85 (89.5%) | 10 (10.5%) |
| 35 Years and over | 86 (100.0%) | 0 (0.0%) |
| Total | 2,110 (86.8%) | 321 (13.2%) |
Educational Attainment by Field of Study in Escanaba
Education (380 | 20.6%), science & technology (295 | 16.0%), business (250 | 13.6%), arts & humanities (238 | 12.9%), and bio, nature & agricultural (102 | 5.5%) are the most common fields of study among 1,844 individuals in Escanaba who have obtained a bachelor's degree or higher.
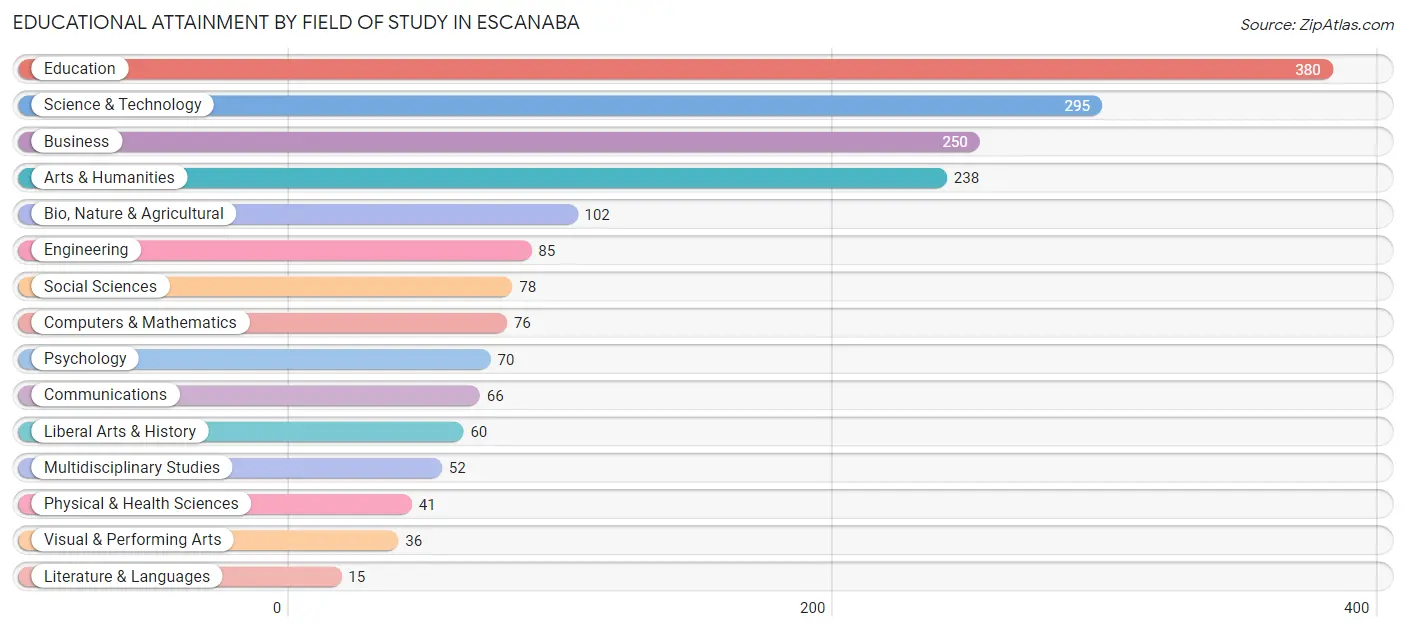
| Field of Study | # Graduates | % Graduates |
| Computers & Mathematics | 76 | 4.1% |
| Bio, Nature & Agricultural | 102 | 5.5% |
| Physical & Health Sciences | 41 | 2.2% |
| Psychology | 70 | 3.8% |
| Social Sciences | 78 | 4.2% |
| Engineering | 85 | 4.6% |
| Multidisciplinary Studies | 52 | 2.8% |
| Science & Technology | 295 | 16.0% |
| Business | 250 | 13.6% |
| Education | 380 | 20.6% |
| Literature & Languages | 15 | 0.8% |
| Liberal Arts & History | 60 | 3.3% |
| Visual & Performing Arts | 36 | 1.9% |
| Communications | 66 | 3.6% |
| Arts & Humanities | 238 | 12.9% |
| Total | 1,844 | 100.0% |
Transportation & Commute in Escanaba
Vehicle Availability by Sex in Escanaba
The most prevalent vehicle ownership categories in Escanaba are males with 2 vehicles (1,325, accounting for 58.6%) and females with 2 vehicles (970, making up 53.0%).
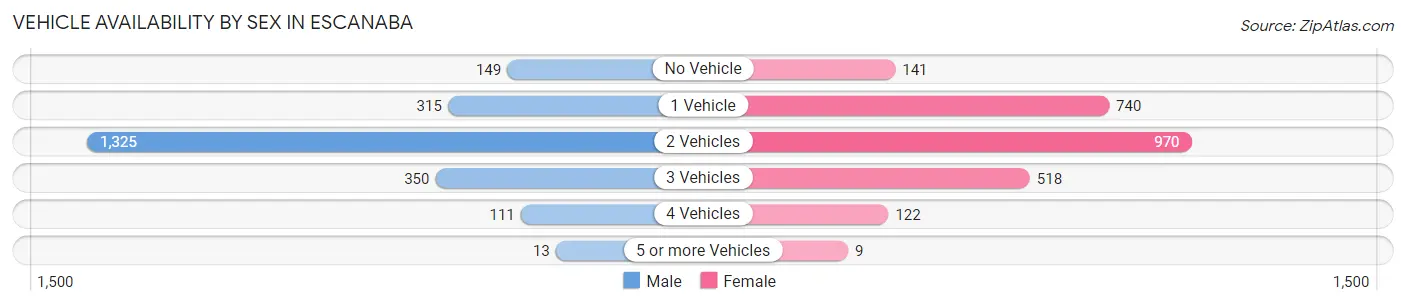
| Vehicles Available | Male | Female |
| No Vehicle | 149 (6.6%) | 141 (5.6%) |
| 1 Vehicle | 315 (13.9%) | 740 (29.6%) |
| 2 Vehicles | 1,325 (58.6%) | 970 (38.8%) |
| 3 Vehicles | 350 (15.5%) | 518 (20.7%) |
| 4 Vehicles | 111 (4.9%) | 122 (4.9%) |
| 5 or more Vehicles | 13 (0.6%) | 9 (0.4%) |
| Total | 2,263 (100.0%) | 2,500 (100.0%) |
Commute Time in Escanaba
The most frequently occuring commute durations in Escanaba are 5 to 9 minutes (1,776 commuters, 38.5%), 10 to 14 minutes (1,105 commuters, 23.9%), and less than 5 minutes (750 commuters, 16.3%).
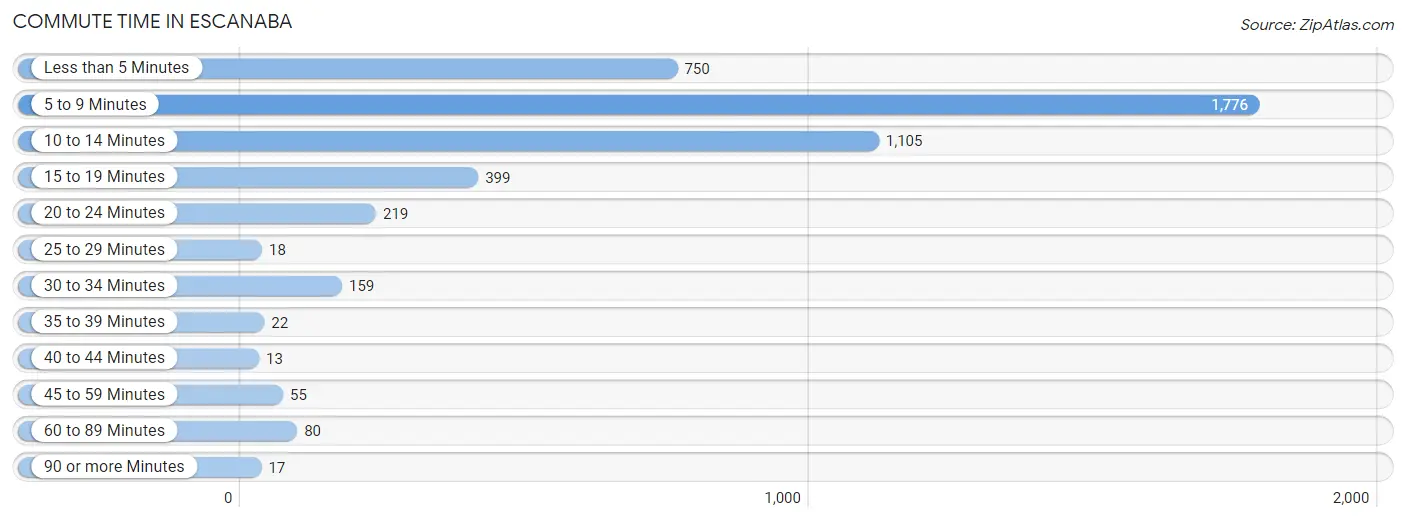
| Commute Time | # Commuters | % Commuters |
| Less than 5 Minutes | 750 | 16.3% |
| 5 to 9 Minutes | 1,776 | 38.5% |
| 10 to 14 Minutes | 1,105 | 23.9% |
| 15 to 19 Minutes | 399 | 8.6% |
| 20 to 24 Minutes | 219 | 4.8% |
| 25 to 29 Minutes | 18 | 0.4% |
| 30 to 34 Minutes | 159 | 3.5% |
| 35 to 39 Minutes | 22 | 0.5% |
| 40 to 44 Minutes | 13 | 0.3% |
| 45 to 59 Minutes | 55 | 1.2% |
| 60 to 89 Minutes | 80 | 1.7% |
| 90 or more Minutes | 17 | 0.4% |
Commute Time by Sex in Escanaba
The most common commute times in Escanaba are 5 to 9 minutes (754 commuters, 34.6%) for males and 5 to 9 minutes (1,022 commuters, 42.0%) for females.

| Commute Time | Male | Female |
| Less than 5 Minutes | 293 (13.5%) | 457 (18.8%) |
| 5 to 9 Minutes | 754 (34.6%) | 1,022 (42.0%) |
| 10 to 14 Minutes | 570 (26.2%) | 535 (22.0%) |
| 15 to 19 Minutes | 272 (12.5%) | 127 (5.2%) |
| 20 to 24 Minutes | 61 (2.8%) | 158 (6.5%) |
| 25 to 29 Minutes | 0 (0.0%) | 18 (0.7%) |
| 30 to 34 Minutes | 113 (5.2%) | 46 (1.9%) |
| 35 to 39 Minutes | 22 (1.0%) | 0 (0.0%) |
| 40 to 44 Minutes | 0 (0.0%) | 13 (0.5%) |
| 45 to 59 Minutes | 31 (1.4%) | 24 (1.0%) |
| 60 to 89 Minutes | 46 (2.1%) | 34 (1.4%) |
| 90 or more Minutes | 17 (0.8%) | 0 (0.0%) |
Time of Departure to Work by Sex in Escanaba
The most frequent times of departure to work in Escanaba are 12:00 AM to 4:59 AM (308, 14.1%) for males and 12:00 PM to 3:59 PM (370, 15.2%) for females.
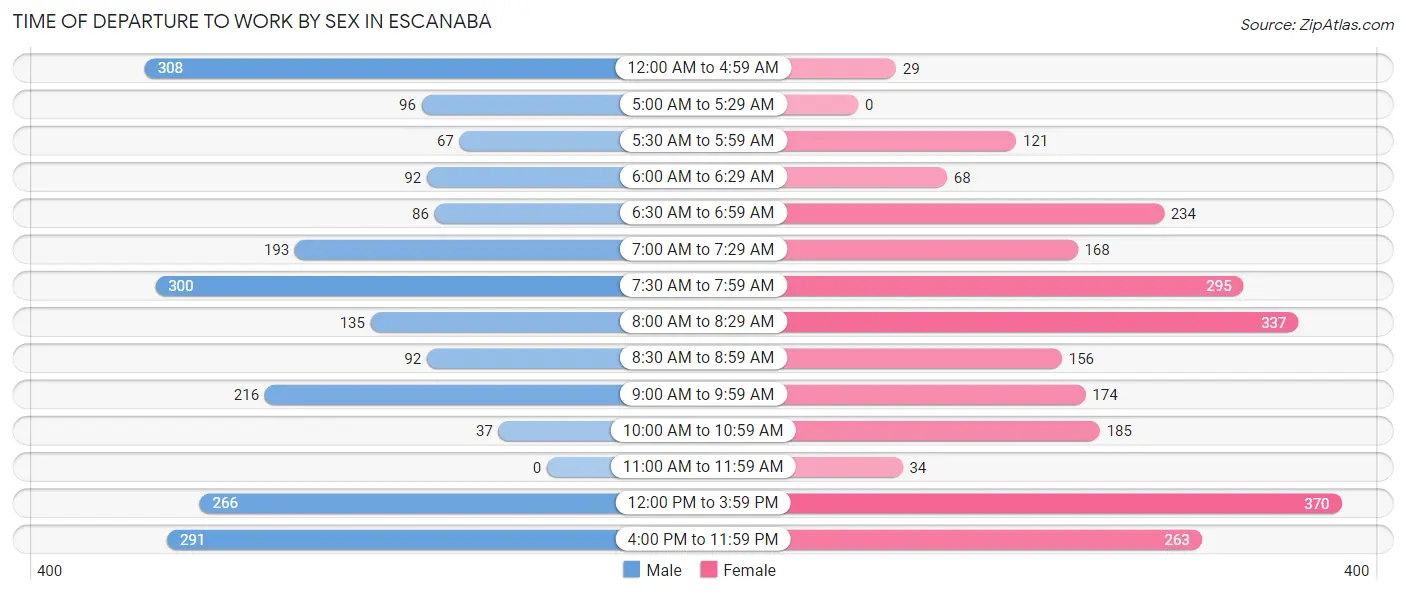
| Time of Departure | Male | Female |
| 12:00 AM to 4:59 AM | 308 (14.1%) | 29 (1.2%) |
| 5:00 AM to 5:29 AM | 96 (4.4%) | 0 (0.0%) |
| 5:30 AM to 5:59 AM | 67 (3.1%) | 121 (5.0%) |
| 6:00 AM to 6:29 AM | 92 (4.2%) | 68 (2.8%) |
| 6:30 AM to 6:59 AM | 86 (4.0%) | 234 (9.6%) |
| 7:00 AM to 7:29 AM | 193 (8.9%) | 168 (6.9%) |
| 7:30 AM to 7:59 AM | 300 (13.8%) | 295 (12.1%) |
| 8:00 AM to 8:29 AM | 135 (6.2%) | 337 (13.9%) |
| 8:30 AM to 8:59 AM | 92 (4.2%) | 156 (6.4%) |
| 9:00 AM to 9:59 AM | 216 (9.9%) | 174 (7.1%) |
| 10:00 AM to 10:59 AM | 37 (1.7%) | 185 (7.6%) |
| 11:00 AM to 11:59 AM | 0 (0.0%) | 34 (1.4%) |
| 12:00 PM to 3:59 PM | 266 (12.2%) | 370 (15.2%) |
| 4:00 PM to 11:59 PM | 291 (13.4%) | 263 (10.8%) |
| Total | 2,179 (100.0%) | 2,434 (100.0%) |
Housing Occupancy in Escanaba
Occupancy by Ownership in Escanaba
Of the total 5,756 dwellings in Escanaba, owner-occupied units account for 3,461 (60.1%), while renter-occupied units make up 2,295 (39.9%).
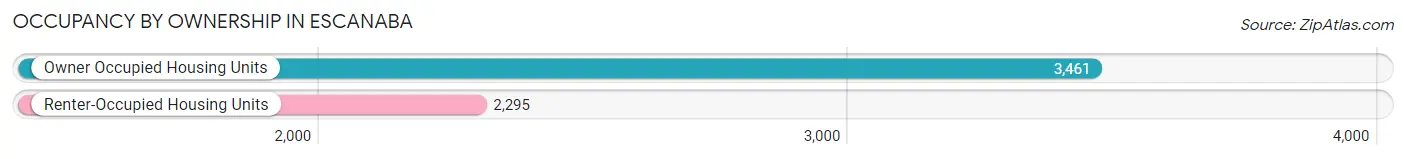
| Occupancy | # Housing Units | % Housing Units |
| Owner Occupied Housing Units | 3,461 | 60.1% |
| Renter-Occupied Housing Units | 2,295 | 39.9% |
| Total Occupied Housing Units | 5,756 | 100.0% |
Occupancy by Household Size in Escanaba
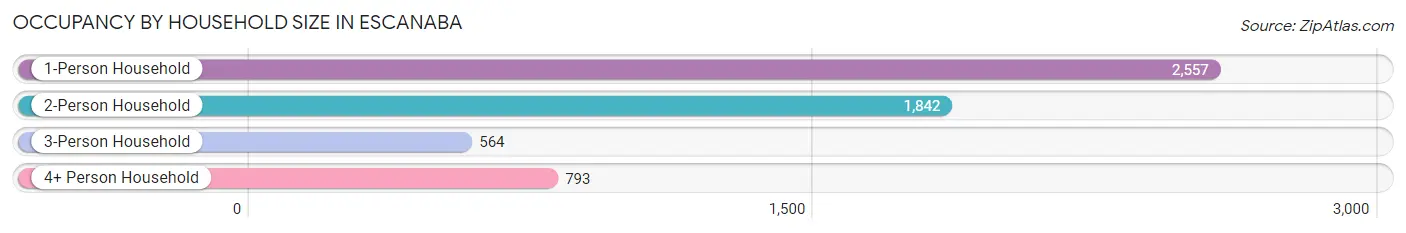
| Household Size | # Housing Units | % Housing Units |
| 1-Person Household | 2,557 | 44.4% |
| 2-Person Household | 1,842 | 32.0% |
| 3-Person Household | 564 | 9.8% |
| 4+ Person Household | 793 | 13.8% |
| Total Housing Units | 5,756 | 100.0% |
Occupancy by Ownership by Household Size in Escanaba
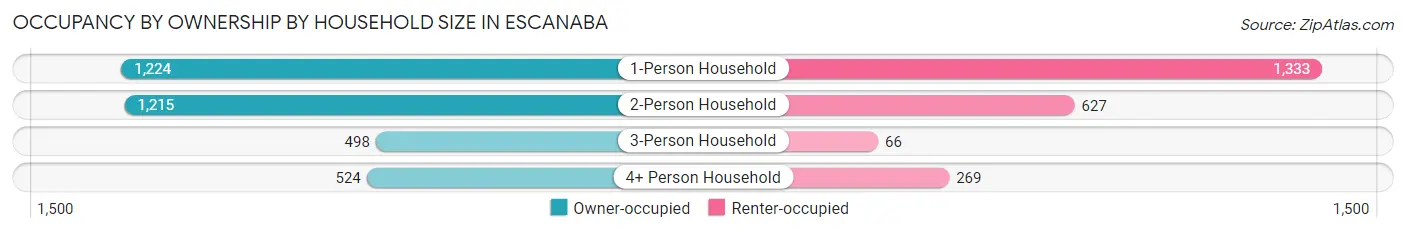
| Household Size | Owner-occupied | Renter-occupied |
| 1-Person Household | 1,224 (47.9%) | 1,333 (52.1%) |
| 2-Person Household | 1,215 (66.0%) | 627 (34.0%) |
| 3-Person Household | 498 (88.3%) | 66 (11.7%) |
| 4+ Person Household | 524 (66.1%) | 269 (33.9%) |
| Total Housing Units | 3,461 (60.1%) | 2,295 (39.9%) |
Occupancy by Educational Attainment in Escanaba
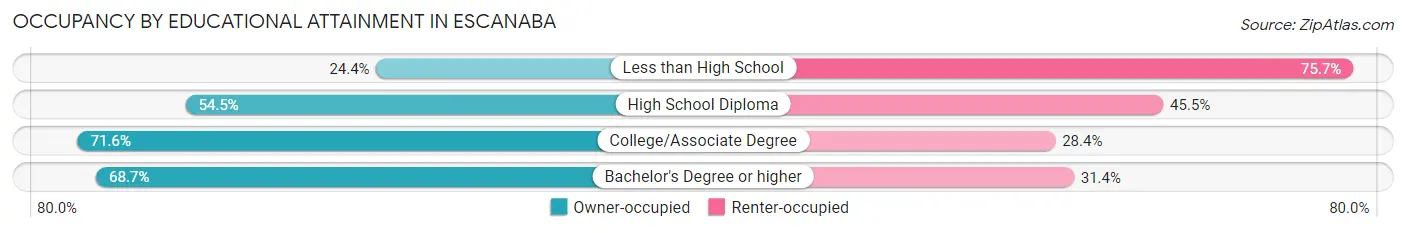
| Household Size | Owner-occupied | Renter-occupied |
| Less than High School | 158 (24.3%) | 491 (75.6%) |
| High School Diploma | 1,016 (54.5%) | 849 (45.5%) |
| College/Associate Degree | 1,490 (71.6%) | 591 (28.4%) |
| Bachelor's Degree or higher | 797 (68.6%) | 364 (31.4%) |
Occupancy by Age of Householder in Escanaba
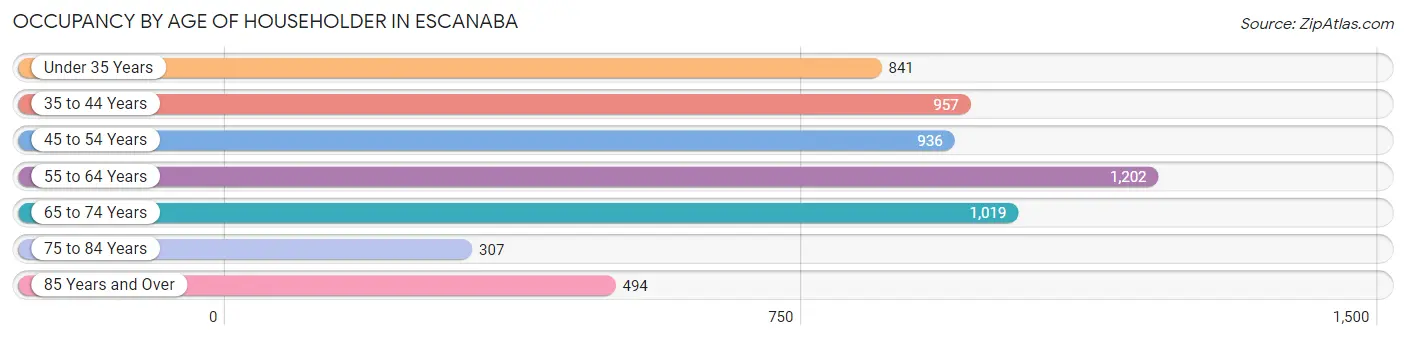
| Age Bracket | # Households | % Households |
| Under 35 Years | 841 | 14.6% |
| 35 to 44 Years | 957 | 16.6% |
| 45 to 54 Years | 936 | 16.3% |
| 55 to 64 Years | 1,202 | 20.9% |
| 65 to 74 Years | 1,019 | 17.7% |
| 75 to 84 Years | 307 | 5.3% |
| 85 Years and Over | 494 | 8.6% |
| Total | 5,756 | 100.0% |
Housing Finances in Escanaba
Median Income by Occupancy in Escanaba
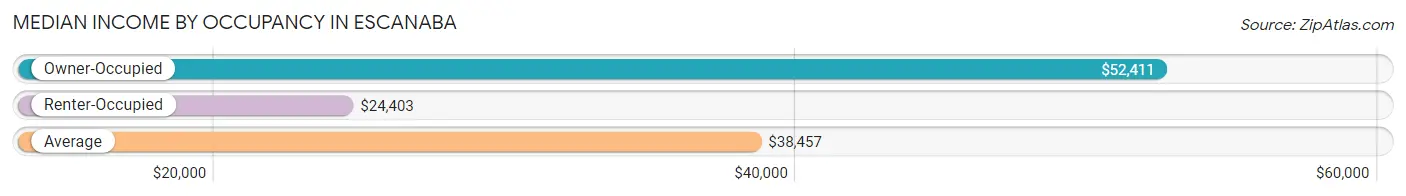
| Occupancy Type | # Households | Median Income |
| Owner-Occupied | 3,461 (60.1%) | $52,411 |
| Renter-Occupied | 2,295 (39.9%) | $24,403 |
| Average | 5,756 (100.0%) | $38,457 |
Occupancy by Householder Income Bracket in Escanaba
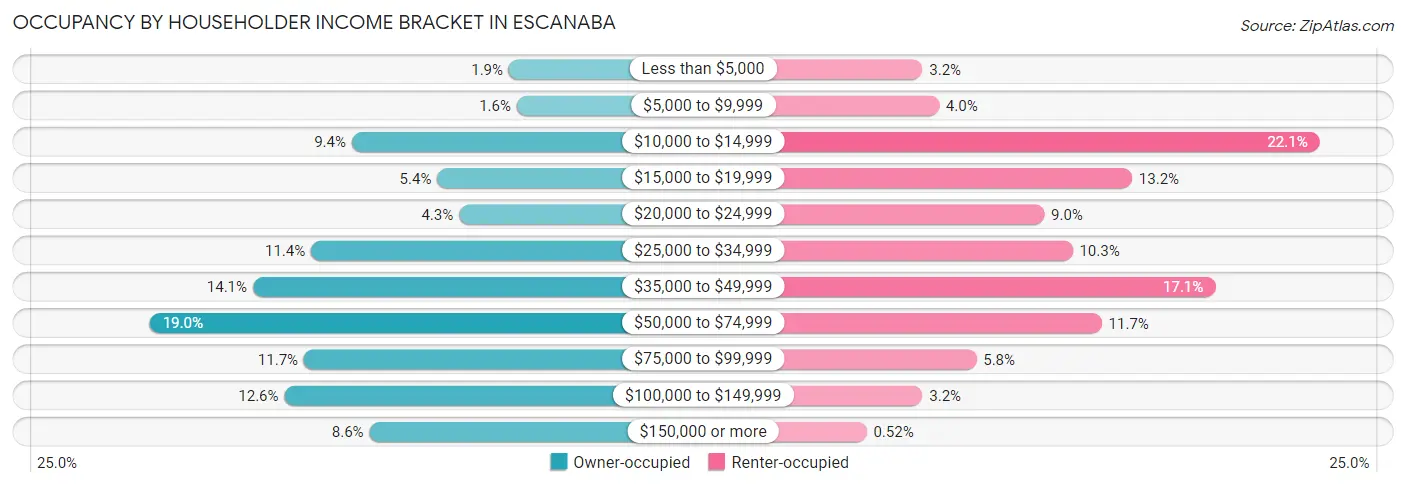
| Income Bracket | Owner-occupied | Renter-occupied |
| Less than $5,000 | 67 (1.9%) | 73 (3.2%) |
| $5,000 to $9,999 | 54 (1.6%) | 91 (4.0%) |
| $10,000 to $14,999 | 326 (9.4%) | 507 (22.1%) |
| $15,000 to $19,999 | 185 (5.3%) | 302 (13.2%) |
| $20,000 to $24,999 | 149 (4.3%) | 206 (9.0%) |
| $25,000 to $34,999 | 393 (11.4%) | 237 (10.3%) |
| $35,000 to $49,999 | 489 (14.1%) | 393 (17.1%) |
| $50,000 to $74,999 | 659 (19.0%) | 269 (11.7%) |
| $75,000 to $99,999 | 405 (11.7%) | 132 (5.8%) |
| $100,000 to $149,999 | 437 (12.6%) | 73 (3.2%) |
| $150,000 or more | 297 (8.6%) | 12 (0.5%) |
| Total | 3,461 (100.0%) | 2,295 (100.0%) |
Monthly Housing Cost Tiers in Escanaba
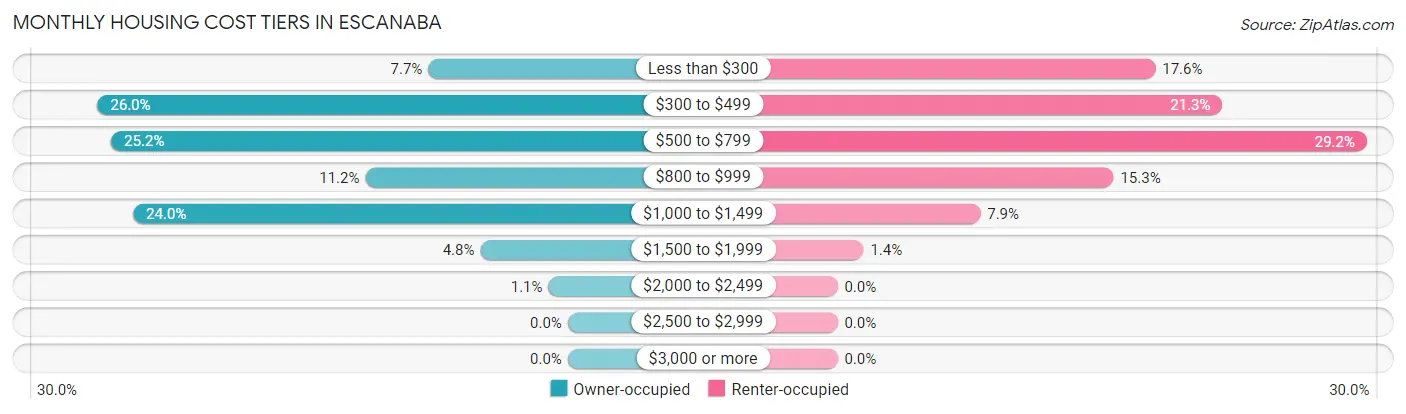
| Monthly Cost | Owner-occupied | Renter-occupied |
| Less than $300 | 267 (7.7%) | 403 (17.6%) |
| $300 to $499 | 899 (26.0%) | 488 (21.3%) |
| $500 to $799 | 873 (25.2%) | 671 (29.2%) |
| $800 to $999 | 387 (11.2%) | 350 (15.2%) |
| $1,000 to $1,499 | 831 (24.0%) | 181 (7.9%) |
| $1,500 to $1,999 | 167 (4.8%) | 33 (1.4%) |
| $2,000 to $2,499 | 37 (1.1%) | 0 (0.0%) |
| $2,500 to $2,999 | 0 (0.0%) | 0 (0.0%) |
| $3,000 or more | 0 (0.0%) | 0 (0.0%) |
| Total | 3,461 (100.0%) | 2,295 (100.0%) |
Physical Housing Characteristics in Escanaba
Housing Structures in Escanaba
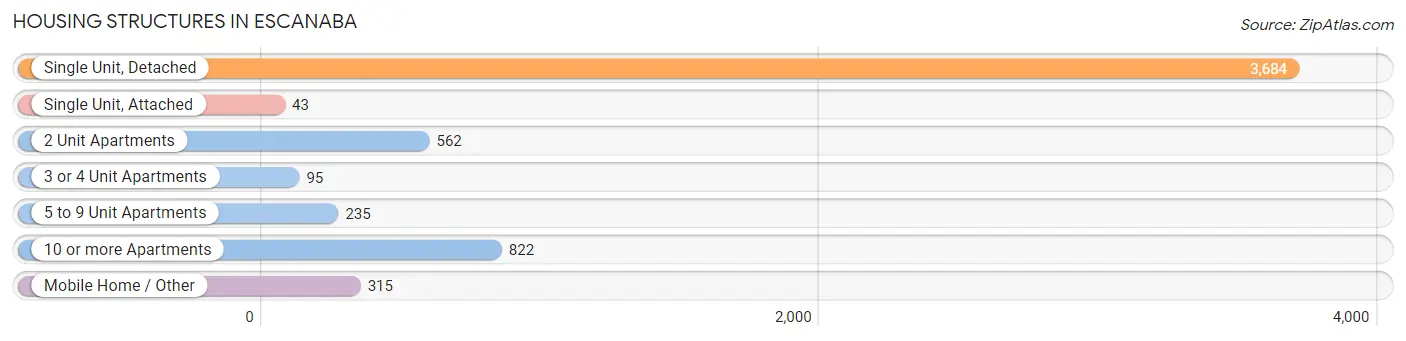
| Structure Type | # Housing Units | % Housing Units |
| Single Unit, Detached | 3,684 | 64.0% |
| Single Unit, Attached | 43 | 0.7% |
| 2 Unit Apartments | 562 | 9.8% |
| 3 or 4 Unit Apartments | 95 | 1.7% |
| 5 to 9 Unit Apartments | 235 | 4.1% |
| 10 or more Apartments | 822 | 14.3% |
| Mobile Home / Other | 315 | 5.5% |
| Total | 5,756 | 100.0% |
Housing Structures by Occupancy in Escanaba
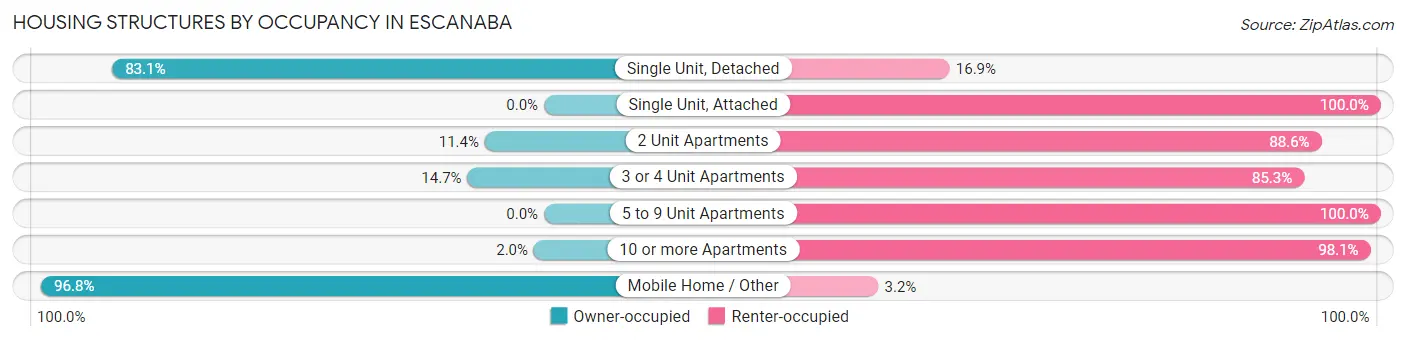
| Structure Type | Owner-occupied | Renter-occupied |
| Single Unit, Detached | 3,062 (83.1%) | 622 (16.9%) |
| Single Unit, Attached | 0 (0.0%) | 43 (100.0%) |
| 2 Unit Apartments | 64 (11.4%) | 498 (88.6%) |
| 3 or 4 Unit Apartments | 14 (14.7%) | 81 (85.3%) |
| 5 to 9 Unit Apartments | 0 (0.0%) | 235 (100.0%) |
| 10 or more Apartments | 16 (1.9%) | 806 (98.1%) |
| Mobile Home / Other | 305 (96.8%) | 10 (3.2%) |
| Total | 3,461 (60.1%) | 2,295 (39.9%) |
Housing Structures by Number of Rooms in Escanaba
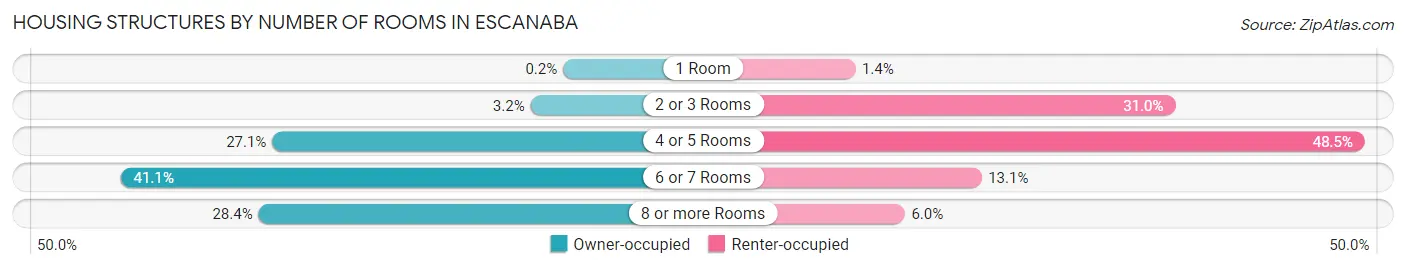
| Number of Rooms | Owner-occupied | Renter-occupied |
| 1 Room | 7 (0.2%) | 32 (1.4%) |
| 2 or 3 Rooms | 111 (3.2%) | 712 (31.0%) |
| 4 or 5 Rooms | 938 (27.1%) | 1,114 (48.5%) |
| 6 or 7 Rooms | 1,423 (41.1%) | 300 (13.1%) |
| 8 or more Rooms | 982 (28.4%) | 137 (6.0%) |
| Total | 3,461 (100.0%) | 2,295 (100.0%) |
Housing Structure by Heating Type in Escanaba
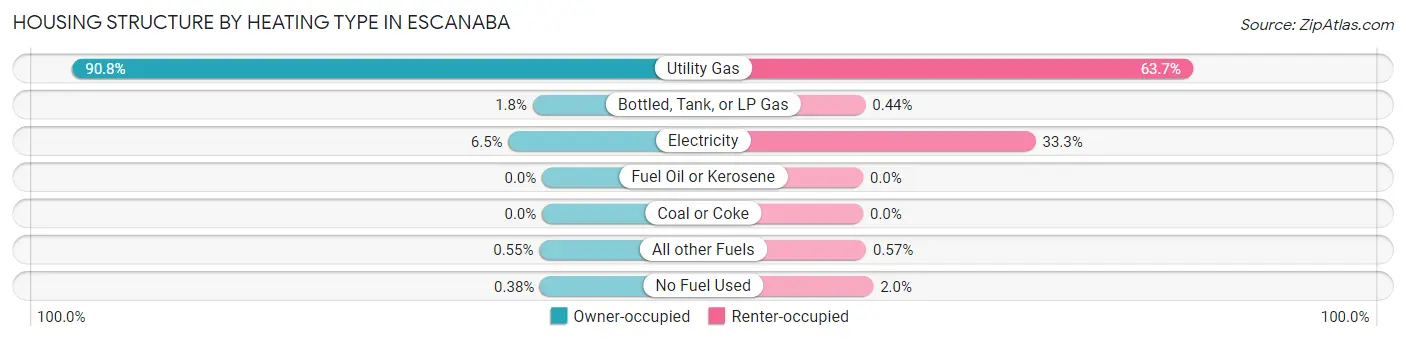
| Heating Type | Owner-occupied | Renter-occupied |
| Utility Gas | 3,142 (90.8%) | 1,462 (63.7%) |
| Bottled, Tank, or LP Gas | 62 (1.8%) | 10 (0.4%) |
| Electricity | 225 (6.5%) | 765 (33.3%) |
| Fuel Oil or Kerosene | 0 (0.0%) | 0 (0.0%) |
| Coal or Coke | 0 (0.0%) | 0 (0.0%) |
| All other Fuels | 19 (0.5%) | 13 (0.6%) |
| No Fuel Used | 13 (0.4%) | 45 (2.0%) |
| Total | 3,461 (100.0%) | 2,295 (100.0%) |
Household Vehicle Usage in Escanaba
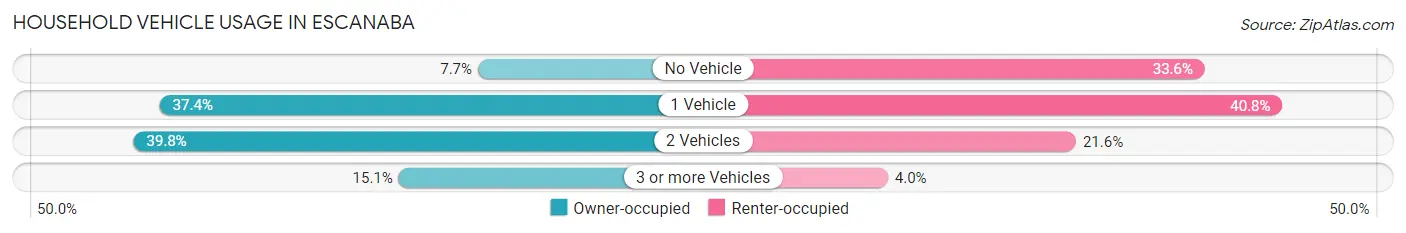
| Vehicles per Household | Owner-occupied | Renter-occupied |
| No Vehicle | 266 (7.7%) | 771 (33.6%) |
| 1 Vehicle | 1,294 (37.4%) | 937 (40.8%) |
| 2 Vehicles | 1,379 (39.8%) | 495 (21.6%) |
| 3 or more Vehicles | 522 (15.1%) | 92 (4.0%) |
| Total | 3,461 (100.0%) | 2,295 (100.0%) |
Real Estate & Mortgages in Escanaba
Real Estate and Mortgage Overview in Escanaba
| Characteristic | Without Mortgage | With Mortgage |
| Housing Units | 1,677 | 1,784 |
| Median Property Value | $97,400 | $113,200 |
| Median Household Income | $37,663 | $147 |
| Monthly Housing Costs | $425 | $0 |
| Real Estate Taxes | $1,571 | $125 |
Property Value by Mortgage Status in Escanaba
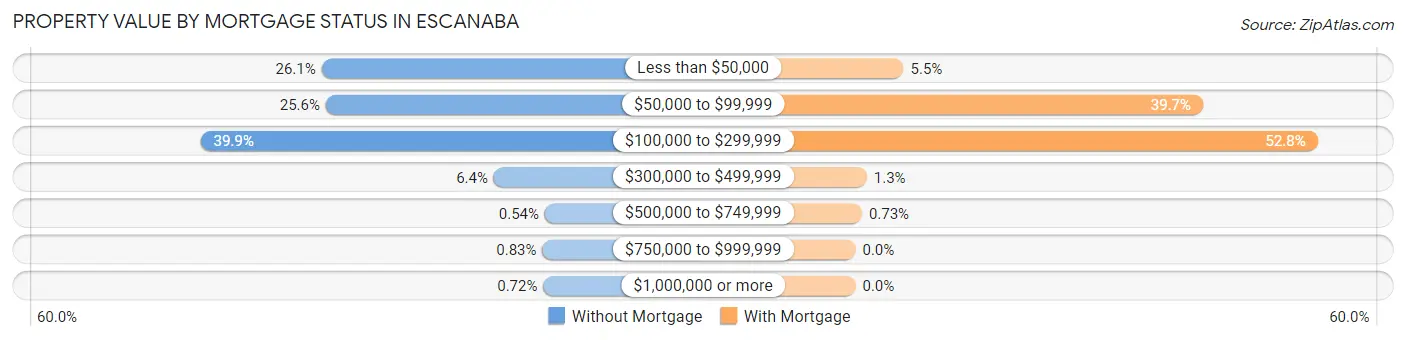
| Property Value | Without Mortgage | With Mortgage |
| Less than $50,000 | 437 (26.1%) | 98 (5.5%) |
| $50,000 to $99,999 | 429 (25.6%) | 708 (39.7%) |
| $100,000 to $299,999 | 669 (39.9%) | 942 (52.8%) |
| $300,000 to $499,999 | 107 (6.4%) | 23 (1.3%) |
| $500,000 to $749,999 | 9 (0.5%) | 13 (0.7%) |
| $750,000 to $999,999 | 14 (0.8%) | 0 (0.0%) |
| $1,000,000 or more | 12 (0.7%) | 0 (0.0%) |
| Total | 1,677 (100.0%) | 1,784 (100.0%) |
Household Income by Mortgage Status in Escanaba
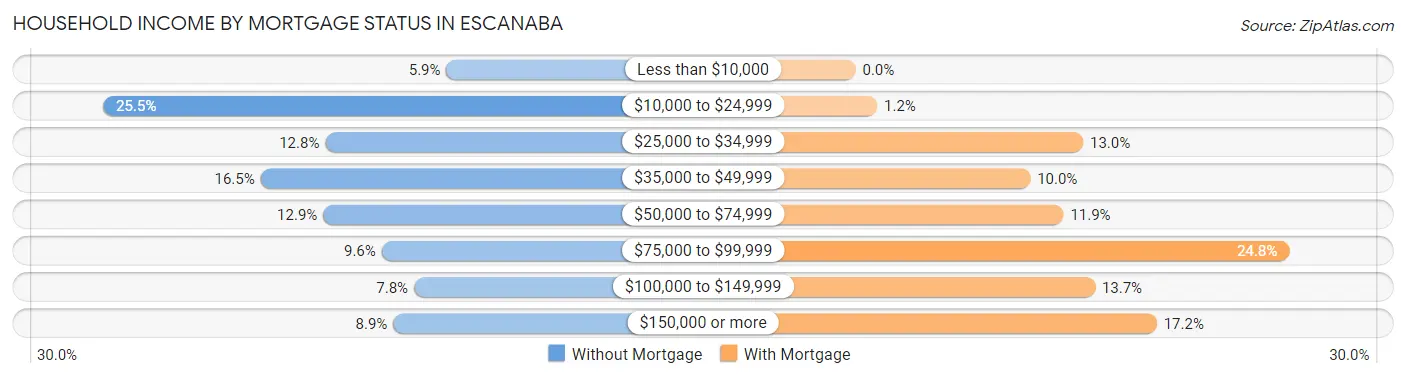
| Household Income | Without Mortgage | With Mortgage |
| Less than $10,000 | 99 (5.9%) | 0 (0.0%) |
| $10,000 to $24,999 | 428 (25.5%) | 22 (1.2%) |
| $25,000 to $34,999 | 215 (12.8%) | 232 (13.0%) |
| $35,000 to $49,999 | 277 (16.5%) | 178 (10.0%) |
| $50,000 to $74,999 | 217 (12.9%) | 212 (11.9%) |
| $75,000 to $99,999 | 161 (9.6%) | 442 (24.8%) |
| $100,000 to $149,999 | 130 (7.7%) | 244 (13.7%) |
| $150,000 or more | 150 (8.9%) | 307 (17.2%) |
| Total | 1,677 (100.0%) | 1,784 (100.0%) |
Property Value to Household Income Ratio in Escanaba
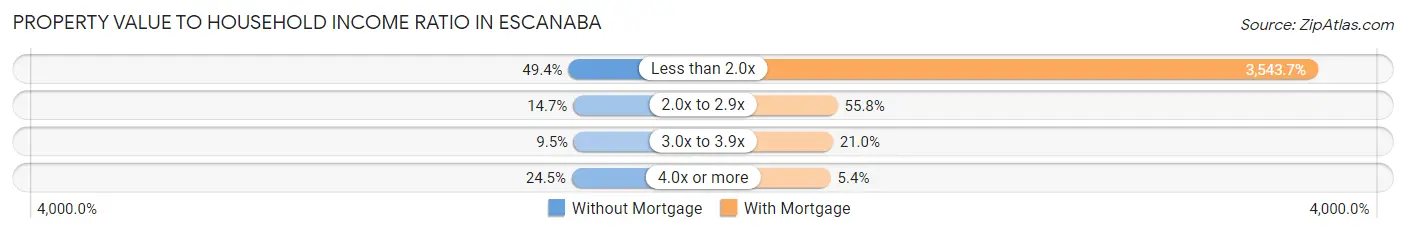
| Value-to-Income Ratio | Without Mortgage | With Mortgage |
| Less than 2.0x | 829 (49.4%) | 63,220 (3,543.7%) |
| 2.0x to 2.9x | 247 (14.7%) | 996 (55.8%) |
| 3.0x to 3.9x | 160 (9.5%) | 374 (21.0%) |
| 4.0x or more | 410 (24.4%) | 96 (5.4%) |
| Total | 1,677 (100.0%) | 1,784 (100.0%) |
Real Estate Taxes by Mortgage Status in Escanaba
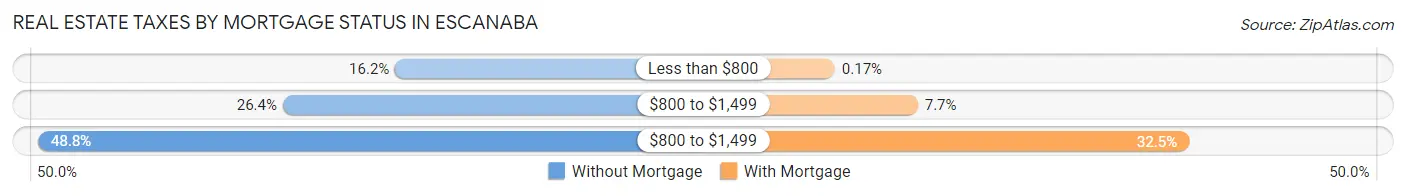
| Property Taxes | Without Mortgage | With Mortgage |
| Less than $800 | 271 (16.2%) | 3 (0.2%) |
| $800 to $1,499 | 443 (26.4%) | 138 (7.7%) |
| $800 to $1,499 | 818 (48.8%) | 580 (32.5%) |
| Total | 1,677 (100.0%) | 1,784 (100.0%) |
Health & Disability in Escanaba
Health Insurance Coverage by Age in Escanaba
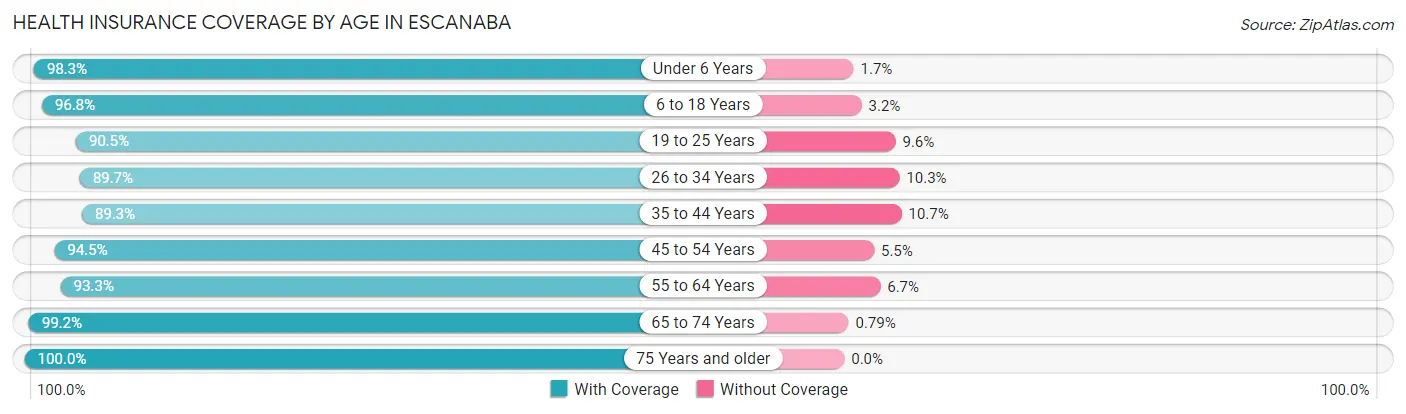
| Age Bracket | With Coverage | Without Coverage |
| Under 6 Years | 793 (98.3%) | 14 (1.7%) |
| 6 to 18 Years | 1,801 (96.8%) | 60 (3.2%) |
| 19 to 25 Years | 919 (90.4%) | 97 (9.6%) |
| 26 to 34 Years | 986 (89.7%) | 113 (10.3%) |
| 35 to 44 Years | 1,439 (89.3%) | 172 (10.7%) |
| 45 to 54 Years | 1,227 (94.5%) | 72 (5.5%) |
| 55 to 64 Years | 1,669 (93.3%) | 120 (6.7%) |
| 65 to 74 Years | 1,390 (99.2%) | 11 (0.8%) |
| 75 Years and older | 1,143 (100.0%) | 0 (0.0%) |
| Total | 11,367 (94.5%) | 659 (5.5%) |
Health Insurance Coverage by Citizenship Status in Escanaba
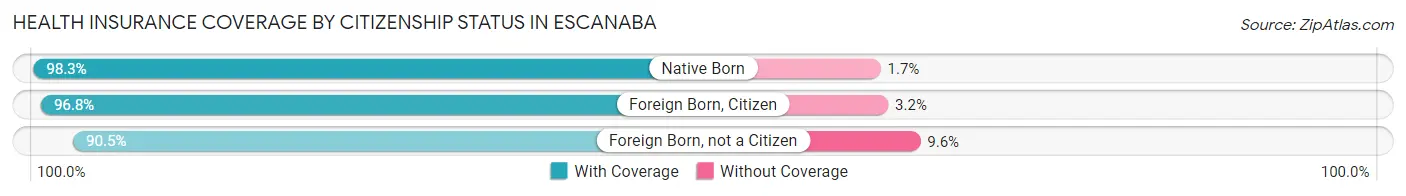
| Citizenship Status | With Coverage | Without Coverage |
| Native Born | 793 (98.3%) | 14 (1.7%) |
| Foreign Born, Citizen | 1,801 (96.8%) | 60 (3.2%) |
| Foreign Born, not a Citizen | 919 (90.4%) | 97 (9.6%) |
Health Insurance Coverage by Household Income in Escanaba
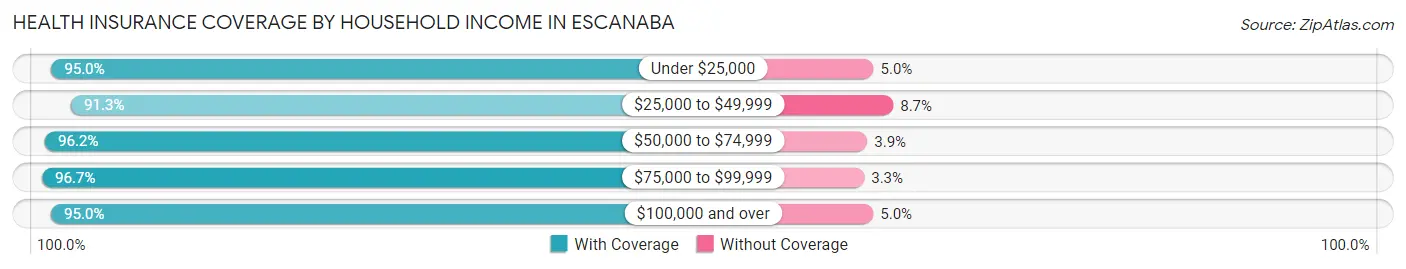
| Household Income | With Coverage | Without Coverage |
| Under $25,000 | 2,462 (95.0%) | 130 (5.0%) |
| $25,000 to $49,999 | 2,695 (91.3%) | 257 (8.7%) |
| $50,000 to $74,999 | 2,375 (96.2%) | 95 (3.8%) |
| $75,000 to $99,999 | 1,326 (96.7%) | 45 (3.3%) |
| $100,000 and over | 2,392 (95.0%) | 125 (5.0%) |
Public vs Private Health Insurance Coverage by Age in Escanaba
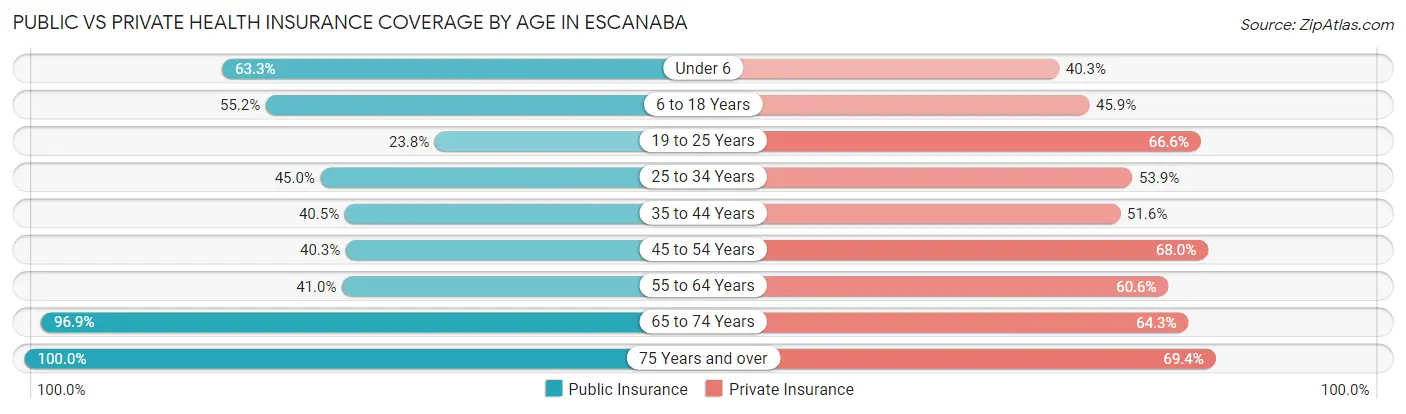
| Age Bracket | Public Insurance | Private Insurance |
| Under 6 | 511 (63.3%) | 325 (40.3%) |
| 6 to 18 Years | 1,027 (55.2%) | 854 (45.9%) |
| 19 to 25 Years | 242 (23.8%) | 677 (66.6%) |
| 25 to 34 Years | 495 (45.0%) | 592 (53.9%) |
| 35 to 44 Years | 653 (40.5%) | 832 (51.6%) |
| 45 to 54 Years | 524 (40.3%) | 883 (68.0%) |
| 55 to 64 Years | 734 (41.0%) | 1,084 (60.6%) |
| 65 to 74 Years | 1,358 (96.9%) | 901 (64.3%) |
| 75 Years and over | 1,143 (100.0%) | 793 (69.4%) |
| Total | 6,687 (55.6%) | 6,941 (57.7%) |
Disability Status by Sex by Age in Escanaba
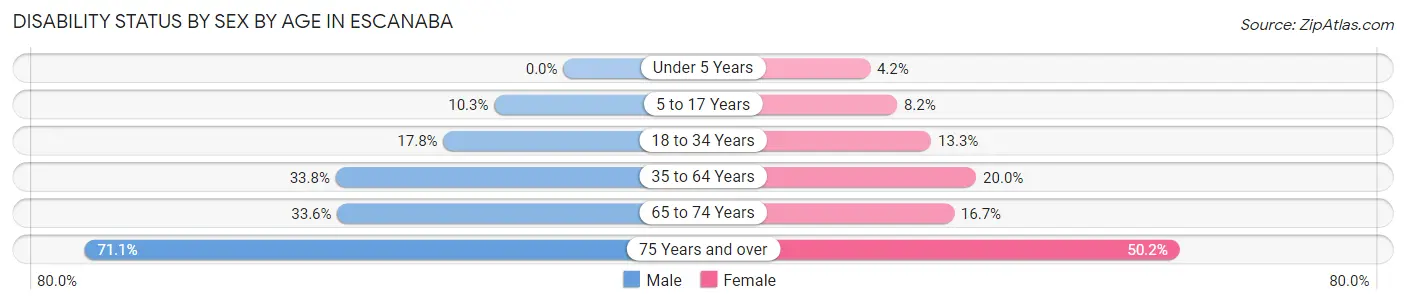
| Age Bracket | Male | Female |
| Under 5 Years | 0 (0.0%) | 15 (4.2%) |
| 5 to 17 Years | 104 (10.2%) | 70 (8.2%) |
| 18 to 34 Years | 205 (17.8%) | 145 (13.3%) |
| 35 to 64 Years | 765 (33.8%) | 486 (20.0%) |
| 65 to 74 Years | 196 (33.6%) | 136 (16.7%) |
| 75 Years and over | 335 (71.1%) | 337 (50.1%) |
Disability Class by Sex by Age in Escanaba
Disability Class: Hearing Difficulty
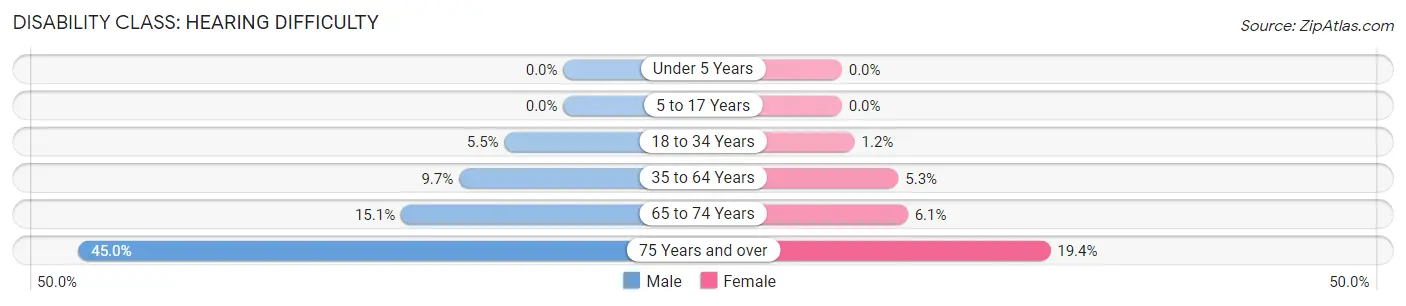
| Age Bracket | Male | Female |
| Under 5 Years | 0 (0.0%) | 0 (0.0%) |
| 5 to 17 Years | 0 (0.0%) | 0 (0.0%) |
| 18 to 34 Years | 63 (5.5%) | 13 (1.2%) |
| 35 to 64 Years | 219 (9.7%) | 128 (5.2%) |
| 65 to 74 Years | 88 (15.1%) | 50 (6.1%) |
| 75 Years and over | 212 (45.0%) | 130 (19.4%) |
Disability Class: Vision Difficulty
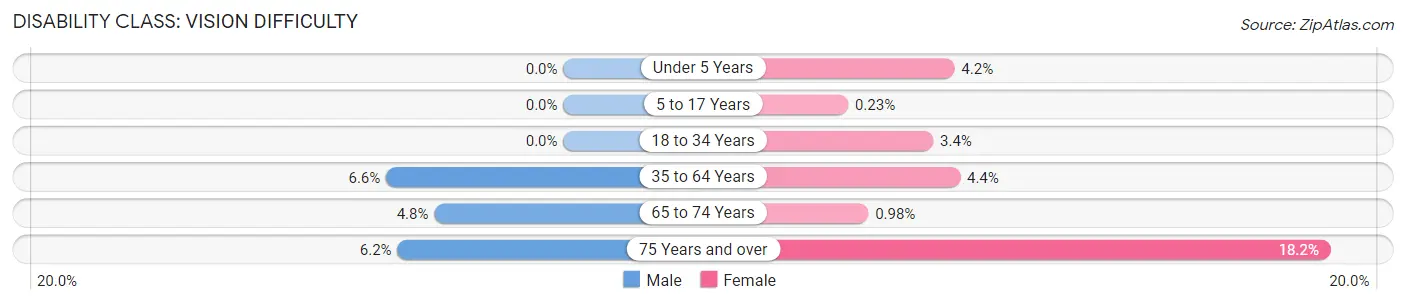
| Age Bracket | Male | Female |
| Under 5 Years | 0 (0.0%) | 15 (4.2%) |
| 5 to 17 Years | 0 (0.0%) | 2 (0.2%) |
| 18 to 34 Years | 0 (0.0%) | 37 (3.4%) |
| 35 to 64 Years | 149 (6.6%) | 107 (4.4%) |
| 65 to 74 Years | 28 (4.8%) | 8 (1.0%) |
| 75 Years and over | 29 (6.2%) | 122 (18.1%) |
Disability Class: Cognitive Difficulty
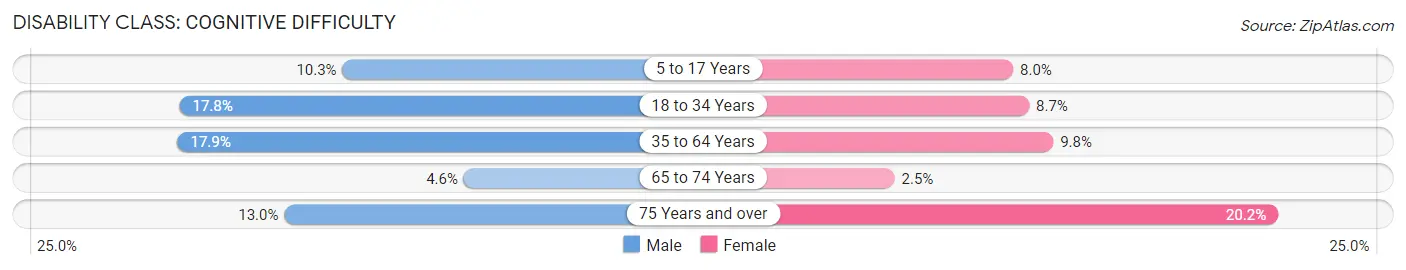
| Age Bracket | Male | Female |
| 5 to 17 Years | 104 (10.2%) | 68 (8.0%) |
| 18 to 34 Years | 205 (17.8%) | 95 (8.7%) |
| 35 to 64 Years | 405 (17.9%) | 239 (9.8%) |
| 65 to 74 Years | 27 (4.6%) | 20 (2.5%) |
| 75 Years and over | 61 (13.0%) | 136 (20.2%) |
Disability Class: Ambulatory Difficulty
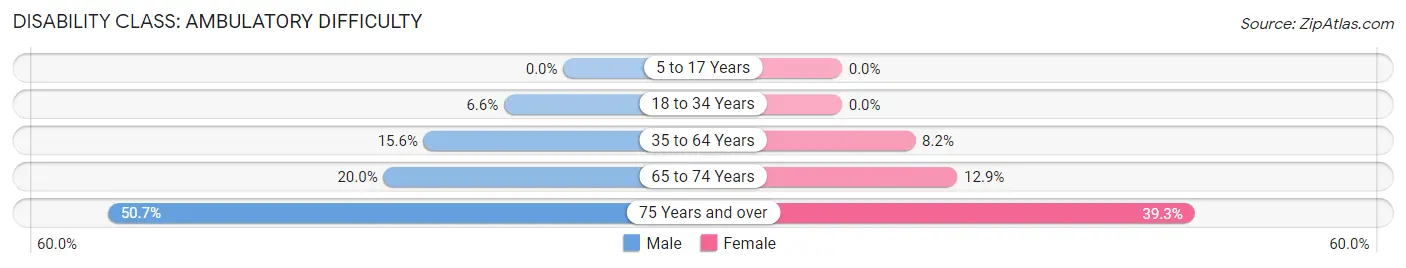
| Age Bracket | Male | Female |
| 5 to 17 Years | 0 (0.0%) | 0 (0.0%) |
| 18 to 34 Years | 76 (6.6%) | 0 (0.0%) |
| 35 to 64 Years | 352 (15.5%) | 199 (8.2%) |
| 65 to 74 Years | 117 (20.0%) | 105 (12.9%) |
| 75 Years and over | 239 (50.7%) | 264 (39.3%) |
Disability Class: Self-Care Difficulty
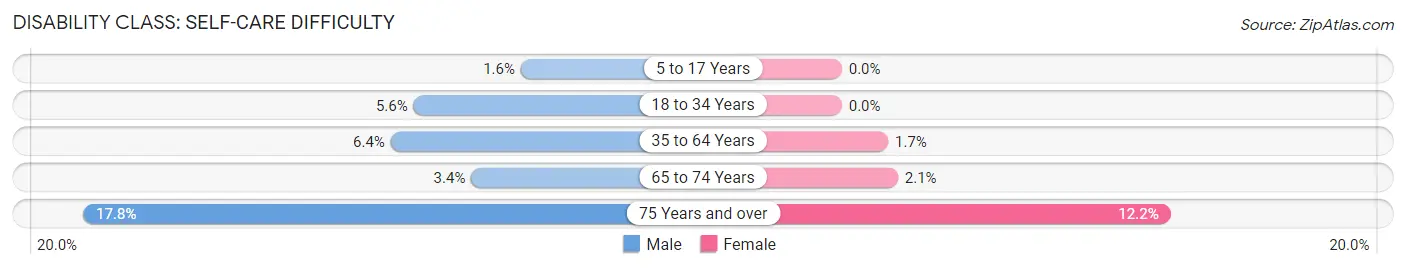
| Age Bracket | Male | Female |
| 5 to 17 Years | 16 (1.6%) | 0 (0.0%) |
| 18 to 34 Years | 64 (5.6%) | 0 (0.0%) |
| 35 to 64 Years | 145 (6.4%) | 42 (1.7%) |
| 65 to 74 Years | 20 (3.4%) | 17 (2.1%) |
| 75 Years and over | 84 (17.8%) | 82 (12.2%) |
Technology Access in Escanaba
Computing Device Access in Escanaba
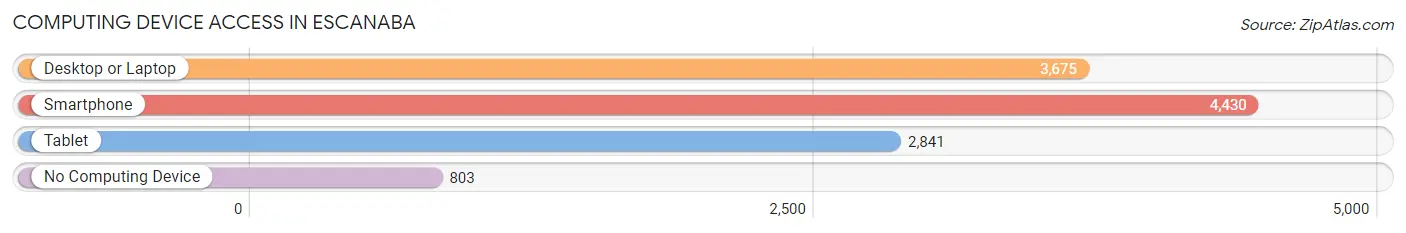
| Device Type | # Households | % Households |
| Desktop or Laptop | 3,675 | 63.8% |
| Smartphone | 4,430 | 77.0% |
| Tablet | 2,841 | 49.4% |
| No Computing Device | 803 | 14.0% |
| Total | 5,756 | 100.0% |
Internet Access in Escanaba
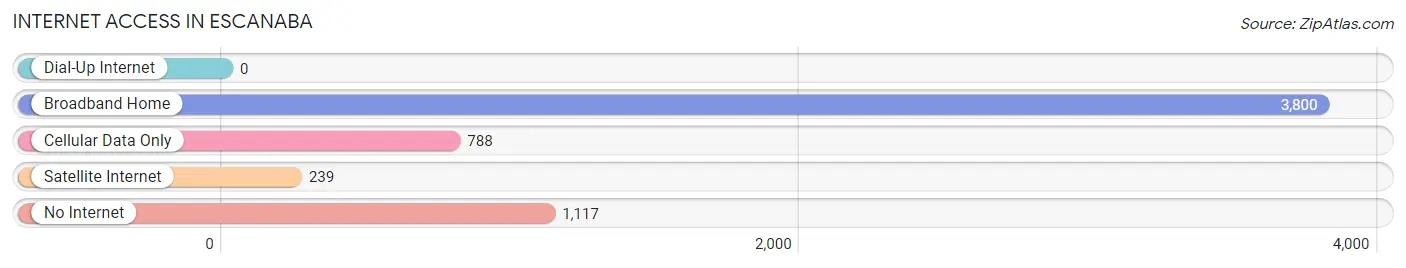
| Internet Type | # Households | % Households |
| Dial-Up Internet | 0 | 0.0% |
| Broadband Home | 3,800 | 66.0% |
| Cellular Data Only | 788 | 13.7% |
| Satellite Internet | 239 | 4.2% |
| No Internet | 1,117 | 19.4% |
| Total | 5,756 | 100.0% |
Escanaba Summary
Escanaba, Michigan is a city located in the Upper Peninsula of Michigan, on the shores of Little Bay de Noc. It is the county seat of Delta County and is the third largest city in the Upper Peninsula. The city is known for its strong Scandinavian heritage, its abundance of outdoor activities, and its vibrant economy.
History
The area that is now Escanaba was first inhabited by the Ojibwe people, who called the area “Escanawba”, meaning “flat rock”. The first European settlers arrived in the area in the early 1800s, and the city was officially founded in 1866. The city was named after the Ojibwe word for “flat rock”, and the name was later changed to Escanaba.
The city quickly grew in the late 1800s and early 1900s, due to its location on the shores of Little Bay de Noc and its proximity to the iron ore mines in the area. The city was also a major port for the lumber industry, and it was home to several large sawmills.
In the early 1900s, the city was a major hub for the Great Lakes shipping industry. The city was also home to several large manufacturing companies, including the Escanaba Paper Company and the Escanaba Iron Works.
Geography
Escanaba is located in the Upper Peninsula of Michigan, on the shores of Little Bay de Noc. The city is situated on the northern edge of the Bay de Noc, and is bordered by the cities of Gladstone and Menominee to the south, and the towns of Rapid River and Bark River to the north.
The city has a total area of 8.7 square miles, of which 8.3 square miles is land and 0.4 square miles is water. The city is located at an elevation of 602 feet above sea level.
Economy
Escanaba’s economy is largely based on the manufacturing and shipping industries. The city is home to several large manufacturing companies, including the Escanaba Paper Company and the Escanaba Iron Works. The city is also a major port for the Great Lakes shipping industry.
The city is also home to several large retail stores, including Walmart, Kmart, and Target. The city is also home to several restaurants, bars, and other businesses.
Demographics
As of the 2010 census, the city of Escanaba had a population of 12,616. The racial makeup of the city was 94.2% White, 0.7% African American, 0.7% Native American, 0.7% Asian, 0.1% Pacific Islander, 1.2% from other races, and 2.3% from two or more races. Hispanic or Latino of any race were 3.2% of the population.
The median income for a household in the city was $37,945, and the median income for a family was $45,945. The per capita income for the city was $20,845. About 11.2% of families and 14.2% of the population were below the poverty line, including 19.2% of those under age 18 and 8.2% of those age 65 or over.
Common Questions
What is Per Capita Income in Escanaba?
Per Capita income in Escanaba is $29,138.
What is the Median Family Income in Escanaba?
Median Family Income in Escanaba is $57,595.
What is the Median Household income in Escanaba?
Median Household Income in Escanaba is $38,457.
What is Income or Wage Gap in Escanaba?
Income or Wage Gap in Escanaba is 27.2%.
Women in Escanaba earn 72.8 cents for every dollar earned by a man.
What is Family Income Deficit in Escanaba?
Family Income Deficit in Escanaba is $12,406.
Families that are below poverty line in Escanaba earn $12,406 less on average than the poverty threshold level.
What is Inequality or Gini Index in Escanaba?
Inequality or Gini Index in Escanaba is 0.51.
What is the Total Population of Escanaba?
Total Population of Escanaba is 12,403.
What is the Total Male Population of Escanaba?
Total Male Population of Escanaba is 5,965.
What is the Total Female Population of Escanaba?
Total Female Population of Escanaba is 6,438.
What is the Ratio of Males per 100 Females in Escanaba?
There are 92.65 Males per 100 Females in Escanaba.
What is the Ratio of Females per 100 Males in Escanaba?
There are 107.93 Females per 100 Males in Escanaba.
What is the Median Population Age in Escanaba?
Median Population Age in Escanaba is 42.9 Years.
What is the Average Family Size in Escanaba
Average Family Size in Escanaba is 2.9 People.
What is the Average Household Size in Escanaba
Average Household Size in Escanaba is 2.1 People.
How Large is the Labor Force in Escanaba?
There are 5,257 People in the Labor Forcein in Escanaba.
What is the Percentage of People in the Labor Force in Escanaba?
51.6% of People are in the Labor Force in Escanaba.
What is the Unemployment Rate in Escanaba?
Unemployment Rate in Escanaba is 7.2%.