Detroit Lakes, MN Map & Demographics
Detroit Lakes Map
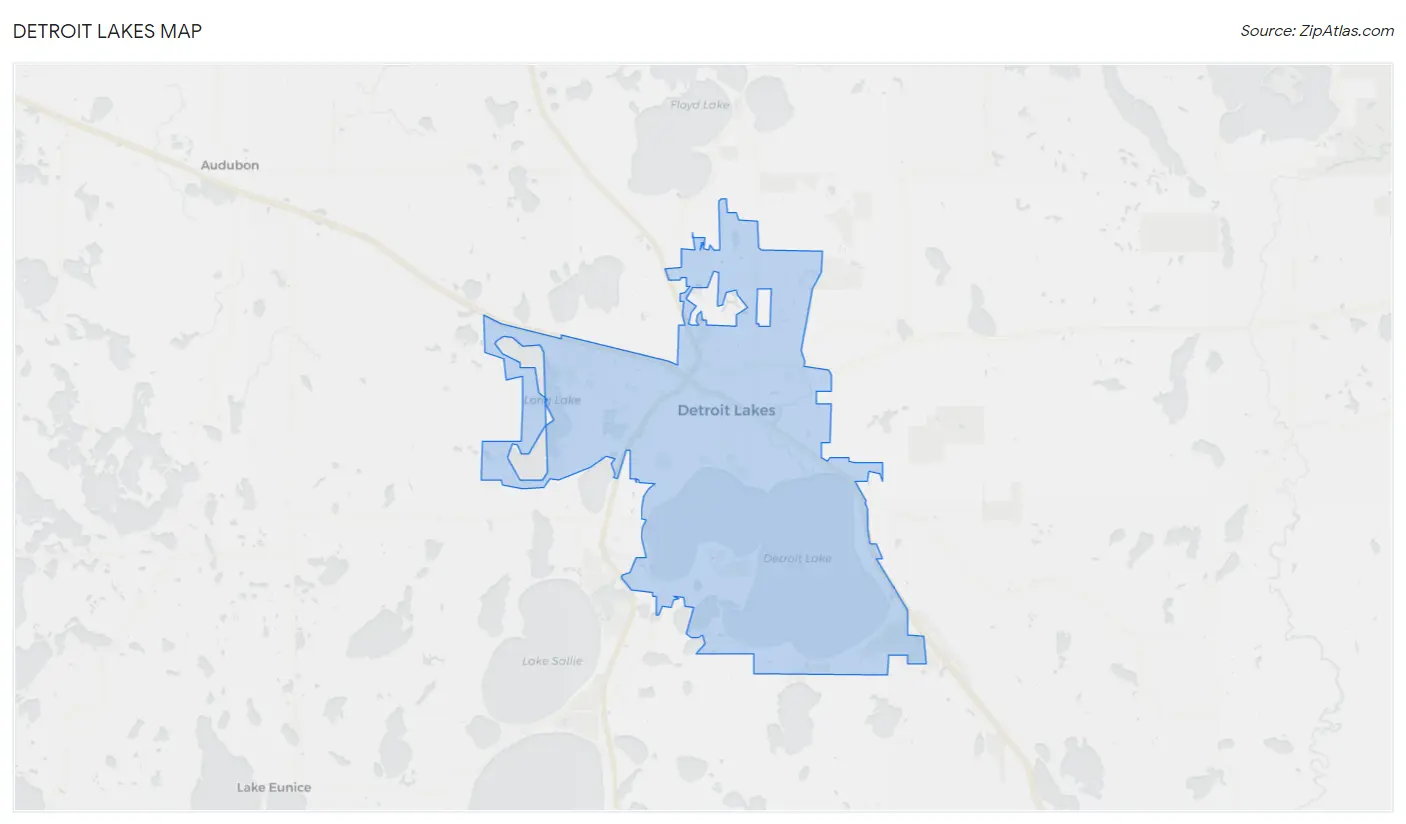
Detroit Lakes Overview
$42,588
PER CAPITA INCOME
$82,172
AVG FAMILY INCOME
$60,317
AVG HOUSEHOLD INCOME
13.4%
WAGE / INCOME GAP [ % ]
86.6¢/ $1
WAGE / INCOME GAP [ $ ]
$15,238
FAMILY INCOME DEFICIT
0.56
INEQUALITY / GINI INDEX
9,966
TOTAL POPULATION
4,868
MALE POPULATION
5,098
FEMALE POPULATION
95.49
MALES / 100 FEMALES
104.72
FEMALES / 100 MALES
40.2
MEDIAN AGE
3.0
AVG FAMILY SIZE
2.3
AVG HOUSEHOLD SIZE
4,867
LABOR FORCE [ PEOPLE ]
61.9%
PERCENT IN LABOR FORCE
4.7%
UNEMPLOYMENT RATE
Detroit Lakes Zip Codes
Detroit Lakes Area Codes
Income in Detroit Lakes
Income Overview in Detroit Lakes
Per Capita Income in Detroit Lakes is $42,588, while median incomes of families and households are $82,172 and $60,317 respectively.
| Characteristic | Number | Measure |
| Per Capita Income | 9,966 | $42,588 |
| Median Family Income | 2,321 | $82,172 |
| Mean Family Income | 2,321 | $136,509 |
| Median Household Income | 4,190 | $60,317 |
| Mean Household Income | 4,190 | $98,873 |
| Income Deficit | 2,321 | $15,238 |
| Wage / Income Gap (%) | 9,966 | 13.38% |
| Wage / Income Gap ($) | 9,966 | 86.62¢ per $1 |
| Gini / Inequality Index | 9,966 | 0.56 |
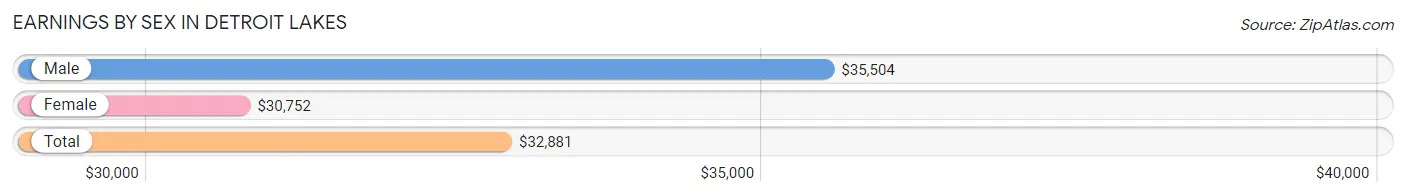
Earnings by Sex in Detroit Lakes
Average Earnings in Detroit Lakes are $32,881, $35,504 for men and $30,752 for women, a difference of 13.4%.
| Sex | Number | Average Earnings |
| Male | 2,630 (51.3%) | $35,504 |
| Female | 2,494 (48.7%) | $30,752 |
| Total | 5,124 (100.0%) | $32,881 |
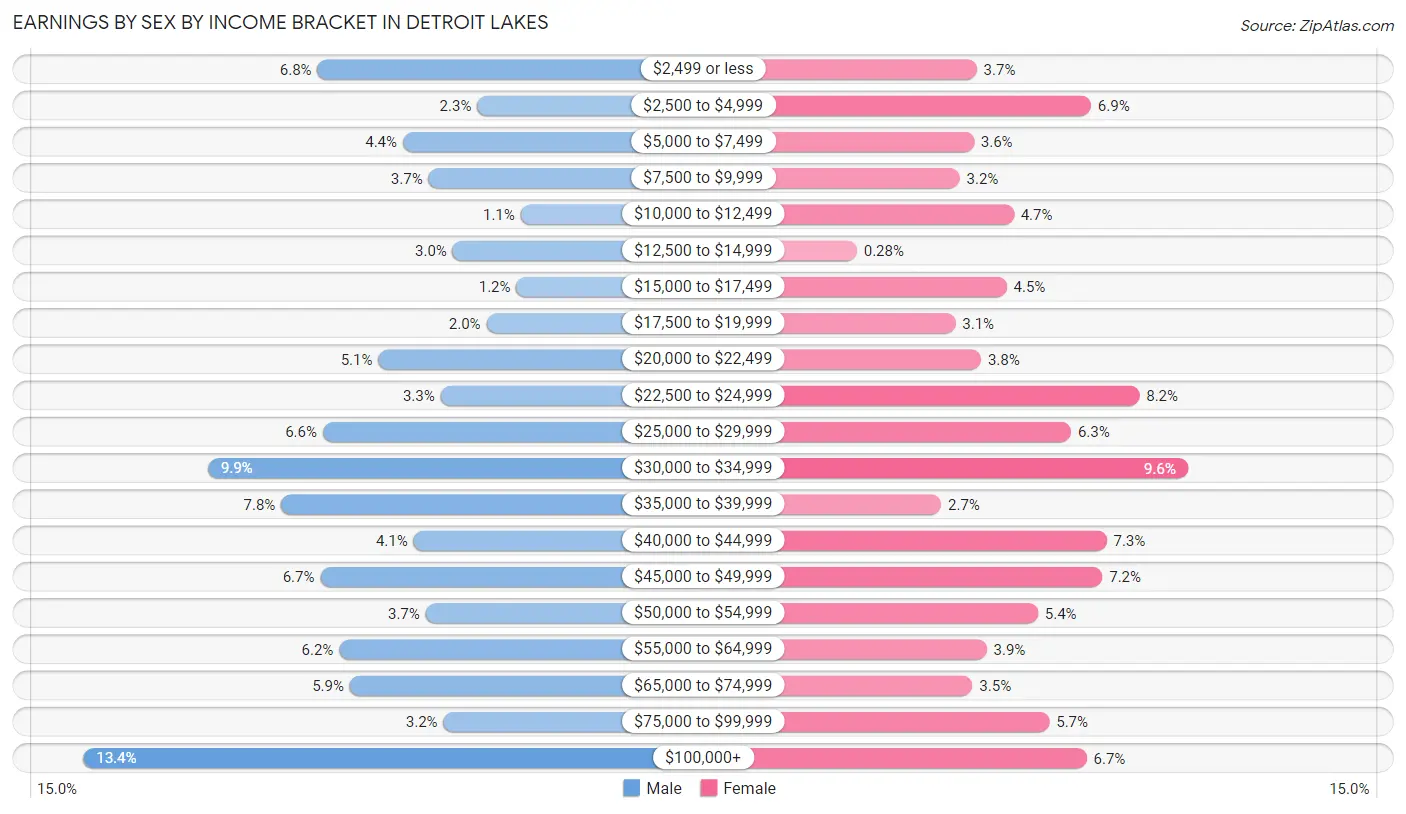
Earnings by Sex by Income Bracket in Detroit Lakes
The most common earnings brackets in Detroit Lakes are $100,000+ for men (351 | 13.4%) and $30,000 to $34,999 for women (239 | 9.6%).
| Income | Male | Female |
| $2,499 or less | 178 (6.8%) | 91 (3.6%) |
| $2,500 to $4,999 | 60 (2.3%) | 171 (6.9%) |
| $5,000 to $7,499 | 115 (4.4%) | 89 (3.6%) |
| $7,500 to $9,999 | 96 (3.6%) | 79 (3.2%) |
| $10,000 to $12,499 | 28 (1.1%) | 117 (4.7%) |
| $12,500 to $14,999 | 78 (3.0%) | 7 (0.3%) |
| $15,000 to $17,499 | 31 (1.2%) | 112 (4.5%) |
| $17,500 to $19,999 | 53 (2.0%) | 76 (3.0%) |
| $20,000 to $22,499 | 133 (5.1%) | 94 (3.8%) |
| $22,500 to $24,999 | 87 (3.3%) | 205 (8.2%) |
| $25,000 to $29,999 | 174 (6.6%) | 157 (6.3%) |
| $30,000 to $34,999 | 259 (9.9%) | 239 (9.6%) |
| $35,000 to $39,999 | 205 (7.8%) | 66 (2.6%) |
| $40,000 to $44,999 | 107 (4.1%) | 182 (7.3%) |
| $45,000 to $49,999 | 176 (6.7%) | 179 (7.2%) |
| $50,000 to $54,999 | 98 (3.7%) | 134 (5.4%) |
| $55,000 to $64,999 | 162 (6.2%) | 98 (3.9%) |
| $65,000 to $74,999 | 154 (5.9%) | 88 (3.5%) |
| $75,000 to $99,999 | 85 (3.2%) | 142 (5.7%) |
| $100,000+ | 351 (13.4%) | 168 (6.7%) |
| Total | 2,630 (100.0%) | 2,494 (100.0%) |
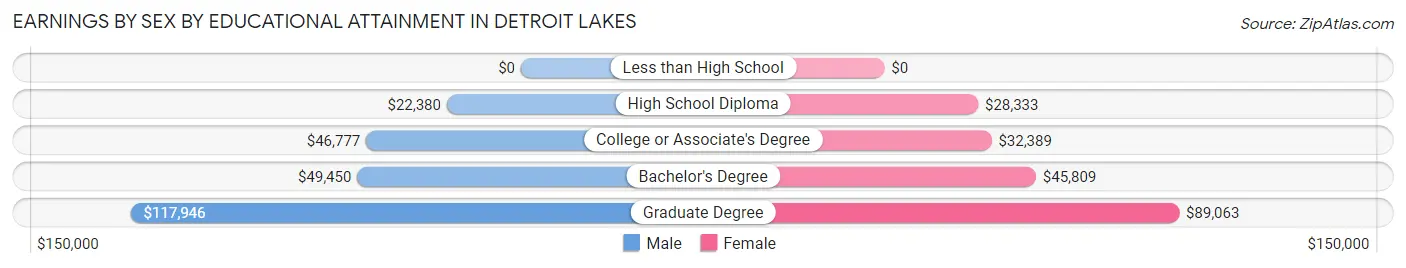
Earnings by Sex by Educational Attainment in Detroit Lakes
Average earnings in Detroit Lakes are $40,938 for men and $33,553 for women, a difference of 18.0%. Men with an educational attainment of graduate degree enjoy the highest average annual earnings of $117,946, while those with high school diploma education earn the least with $22,380. Women with an educational attainment of graduate degree earn the most with the average annual earnings of $89,063, while those with high school diploma education have the smallest earnings of $28,333.
| Educational Attainment | Male Income | Female Income |
| Less than High School | - | - |
| High School Diploma | $22,380 | $28,333 |
| College or Associate's Degree | $46,777 | $32,389 |
| Bachelor's Degree | $49,450 | $45,809 |
| Graduate Degree | $117,946 | $89,063 |
| Total | $40,938 | $33,553 |
Family Income in Detroit Lakes
Family Income Brackets in Detroit Lakes
According to the Detroit Lakes family income data, there are 455 families falling into the $75,000 to $99,999 income range, which is the most common income bracket and makes up 19.6% of all families. Conversely, the less than $10,000 income bracket is the least frequent group with only 32 families (1.4%) belonging to this category.
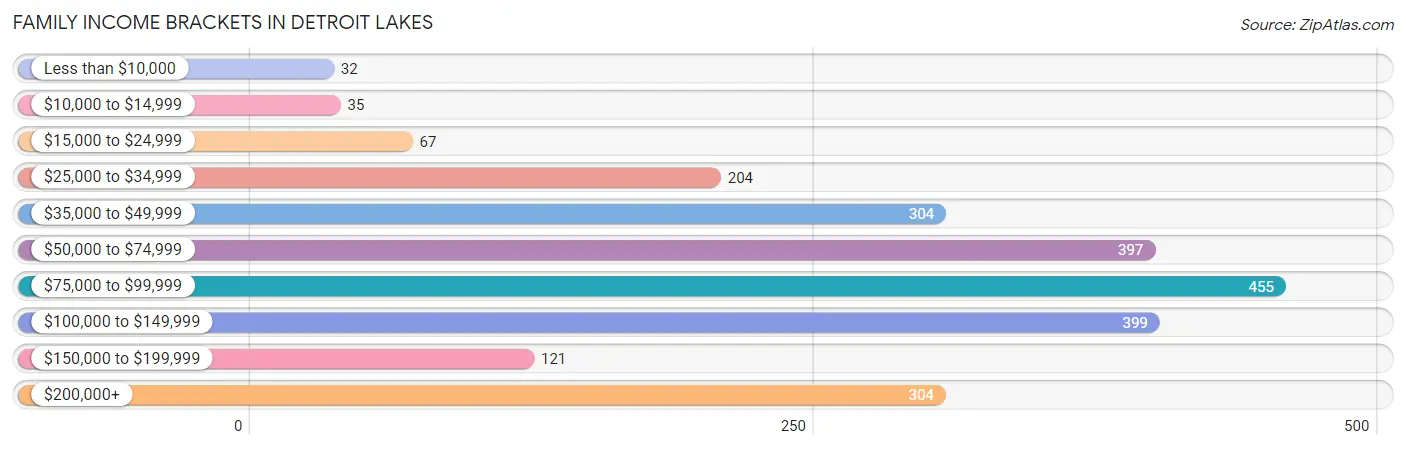
| Income Bracket | # Families | % Families |
| Less than $10,000 | 32 | 1.4% |
| $10,000 to $14,999 | 35 | 1.5% |
| $15,000 to $24,999 | 67 | 2.9% |
| $25,000 to $34,999 | 204 | 8.8% |
| $35,000 to $49,999 | 304 | 13.1% |
| $50,000 to $74,999 | 397 | 17.1% |
| $75,000 to $99,999 | 455 | 19.6% |
| $100,000 to $149,999 | 399 | 17.2% |
| $150,000 to $199,999 | 121 | 5.2% |
| $200,000+ | 304 | 13.1% |
Family Income by Famaliy Size in Detroit Lakes
5-person families (263 | 11.3%) account for the highest median family income in Detroit Lakes with $116,875 per family, while 2-person families (1,216 | 52.4%) have the highest median income of $40,159 per family member.
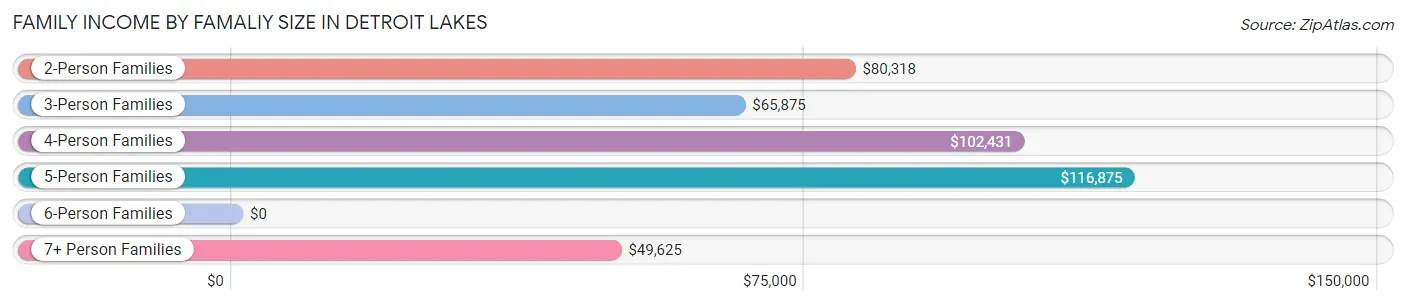
| Income Bracket | # Families | Median Income |
| 2-Person Families | 1,216 (52.4%) | $80,318 |
| 3-Person Families | 470 (20.3%) | $65,875 |
| 4-Person Families | 281 (12.1%) | $102,431 |
| 5-Person Families | 263 (11.3%) | $116,875 |
| 6-Person Families | 0 (0.0%) | $0 |
| 7+ Person Families | 91 (3.9%) | $49,625 |
| Total | 2,321 (100.0%) | $82,172 |
Family Income by Number of Earners in Detroit Lakes
The median family income in Detroit Lakes is $82,172, with families comprising 3+ earners (222) having the highest median family income of $135,870, while families with 1 earner (825) have the lowest median family income of $66,156, accounting for 9.6% and 35.5% of families, respectively.
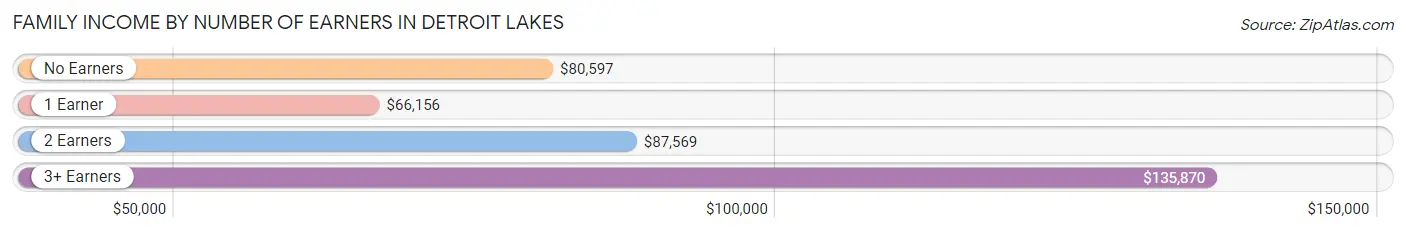
| Number of Earners | # Families | Median Income |
| No Earners | 365 (15.7%) | $80,597 |
| 1 Earner | 825 (35.5%) | $66,156 |
| 2 Earners | 909 (39.2%) | $87,569 |
| 3+ Earners | 222 (9.6%) | $135,870 |
| Total | 2,321 (100.0%) | $82,172 |
Household Income in Detroit Lakes
Household Income Brackets in Detroit Lakes
With 754 households falling in the category, the $50,000 to $74,999 income range is the most frequent in Detroit Lakes, accounting for 18.0% of all households. In contrast, only 130 households (3.1%) fall into the $150,000 to $199,999 income bracket, making it the least populous group.
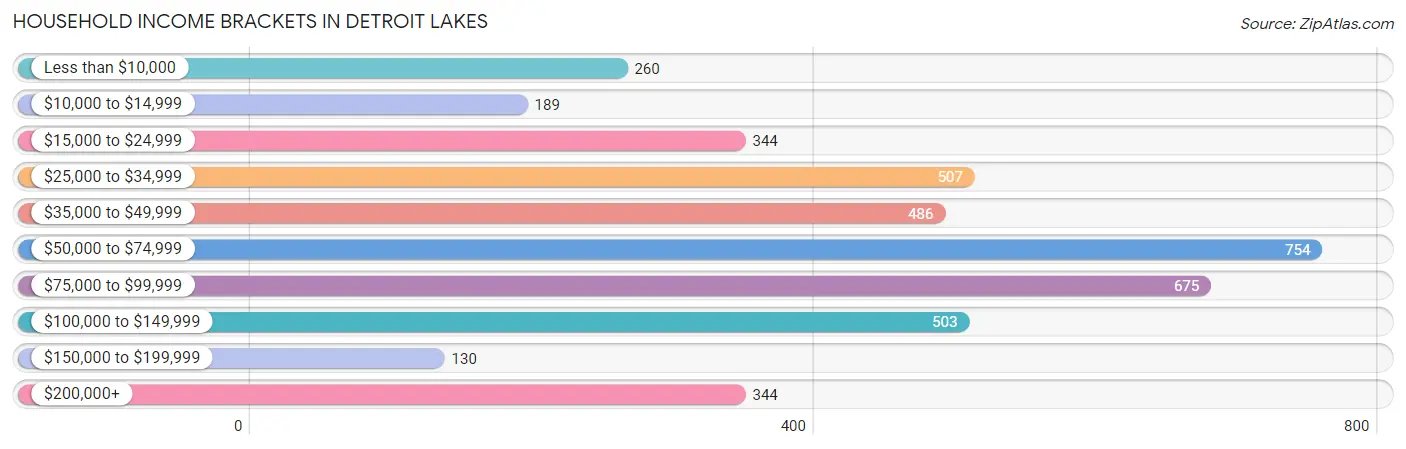
| Income Bracket | # Households | % Households |
| Less than $10,000 | 260 | 6.2% |
| $10,000 to $14,999 | 189 | 4.5% |
| $15,000 to $24,999 | 344 | 8.2% |
| $25,000 to $34,999 | 507 | 12.1% |
| $35,000 to $49,999 | 486 | 11.6% |
| $50,000 to $74,999 | 754 | 18.0% |
| $75,000 to $99,999 | 675 | 16.1% |
| $100,000 to $149,999 | 503 | 12.0% |
| $150,000 to $199,999 | 130 | 3.1% |
| $200,000+ | 344 | 8.2% |
Household Income by Householder Age in Detroit Lakes
The median household income in Detroit Lakes is $60,317, with the highest median household income of $72,813 found in the 25 to 44 years age bracket for the primary householder. A total of 1,233 households (29.4%) fall into this category. Meanwhile, the 15 to 24 years age bracket for the primary householder has the lowest median household income of $40,119, with 272 households (6.5%) in this group.
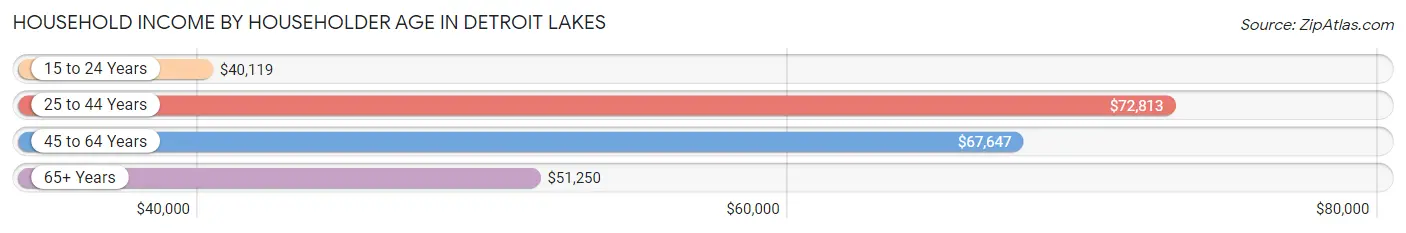
| Income Bracket | # Households | Median Income |
| 15 to 24 Years | 272 (6.5%) | $40,119 |
| 25 to 44 Years | 1,233 (29.4%) | $72,813 |
| 45 to 64 Years | 1,274 (30.4%) | $67,647 |
| 65+ Years | 1,411 (33.7%) | $51,250 |
| Total | 4,190 (100.0%) | $60,317 |
Poverty in Detroit Lakes
Income Below Poverty by Sex and Age in Detroit Lakes
With 10.8% poverty level for males and 10.9% for females among the residents of Detroit Lakes, 15 year old males and 16 and 17 year old females are the most vulnerable to poverty, with 46 males (43.4%) and 54 females (53.5%) in their respective age groups living below the poverty level.
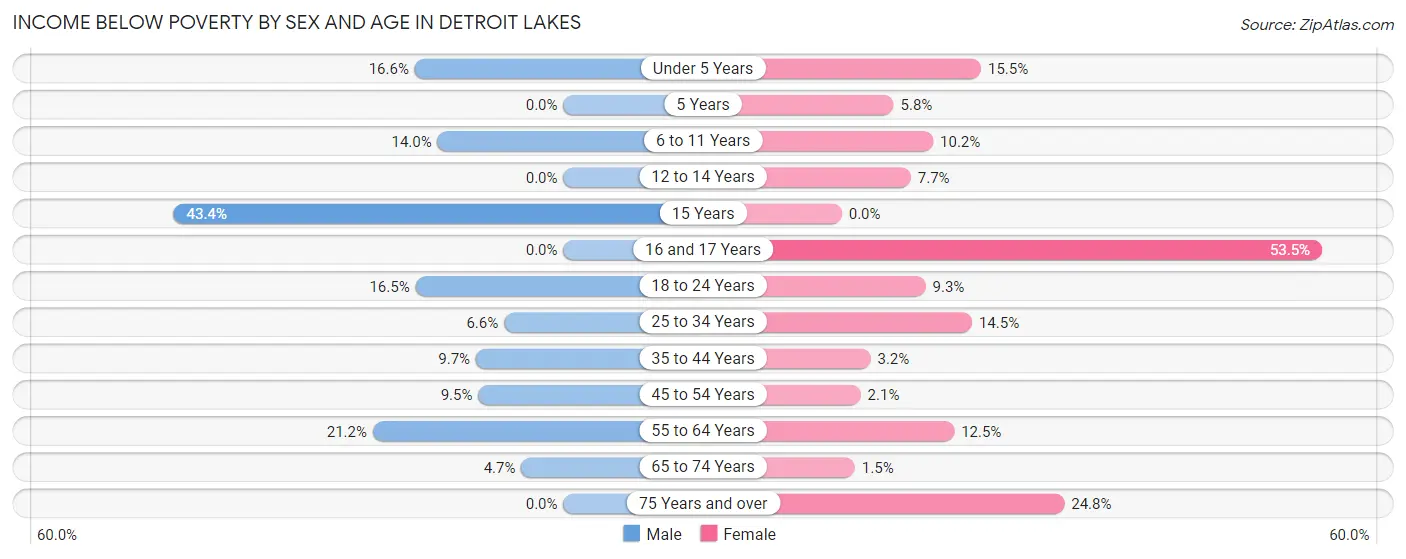
| Age Bracket | Male | Female |
| Under 5 Years | 47 (16.6%) | 49 (15.5%) |
| 5 Years | 0 (0.0%) | 6 (5.8%) |
| 6 to 11 Years | 50 (14.0%) | 35 (10.2%) |
| 12 to 14 Years | 0 (0.0%) | 11 (7.7%) |
| 15 Years | 46 (43.4%) | 0 (0.0%) |
| 16 and 17 Years | 0 (0.0%) | 54 (53.5%) |
| 18 to 24 Years | 85 (16.5%) | 32 (9.3%) |
| 25 to 34 Years | 39 (6.6%) | 86 (14.5%) |
| 35 to 44 Years | 59 (9.7%) | 18 (3.2%) |
| 45 to 54 Years | 39 (9.5%) | 9 (2.1%) |
| 55 to 64 Years | 118 (21.2%) | 85 (12.5%) |
| 65 to 74 Years | 23 (4.7%) | 9 (1.5%) |
| 75 Years and over | 0 (0.0%) | 138 (24.8%) |
| Total | 506 (10.8%) | 532 (10.9%) |
Income Above Poverty by Sex and Age in Detroit Lakes
According to the poverty statistics in Detroit Lakes, males aged 5 years and females aged 15 years are the age groups that are most secure financially, with 100.0% of males and 100.0% of females in these age groups living above the poverty line.
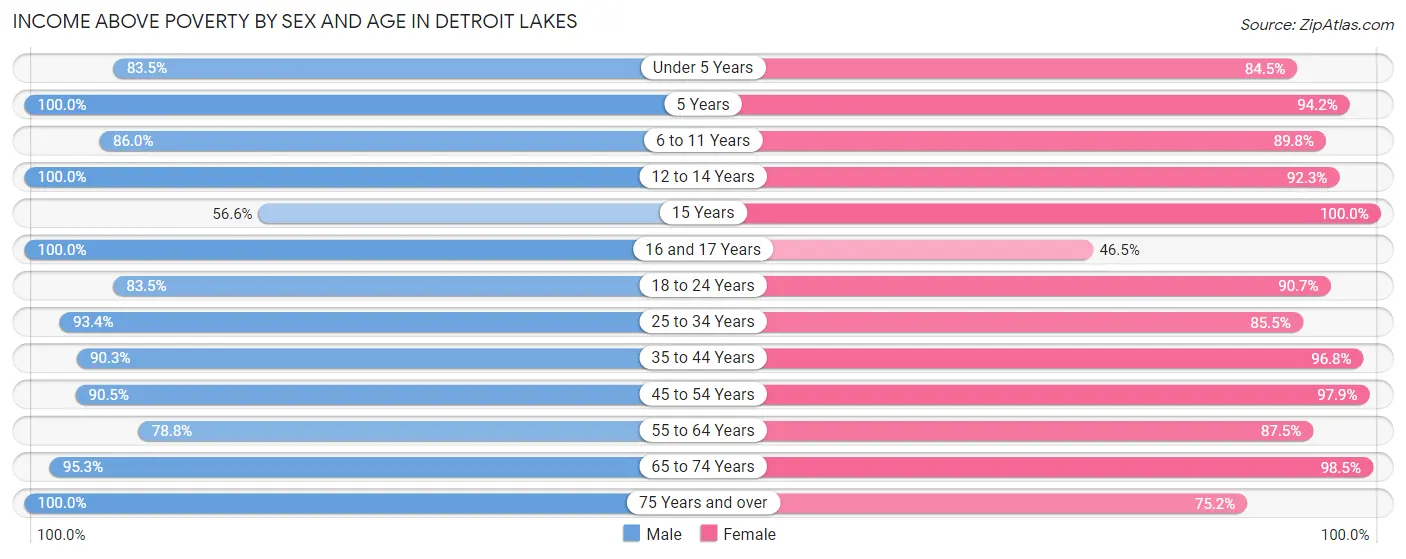
| Age Bracket | Male | Female |
| Under 5 Years | 237 (83.5%) | 267 (84.5%) |
| 5 Years | 111 (100.0%) | 98 (94.2%) |
| 6 to 11 Years | 307 (86.0%) | 309 (89.8%) |
| 12 to 14 Years | 138 (100.0%) | 132 (92.3%) |
| 15 Years | 60 (56.6%) | 80 (100.0%) |
| 16 and 17 Years | 103 (100.0%) | 47 (46.5%) |
| 18 to 24 Years | 431 (83.5%) | 311 (90.7%) |
| 25 to 34 Years | 552 (93.4%) | 507 (85.5%) |
| 35 to 44 Years | 547 (90.3%) | 545 (96.8%) |
| 45 to 54 Years | 373 (90.5%) | 419 (97.9%) |
| 55 to 64 Years | 438 (78.8%) | 594 (87.5%) |
| 65 to 74 Years | 468 (95.3%) | 608 (98.5%) |
| 75 Years and over | 417 (100.0%) | 419 (75.2%) |
| Total | 4,182 (89.2%) | 4,336 (89.1%) |
Income Below Poverty Among Married-Couple Families in Detroit Lakes
The poverty statistics for married-couple families in Detroit Lakes show that 2.0% or 35 of the total 1,771 families live below the poverty line. Families with 5 or more children have the highest poverty rate of 22.0%, comprising of 20 families. On the other hand, families with 3 or 4 children have the lowest poverty rate of 0.0%, which includes 0 families.
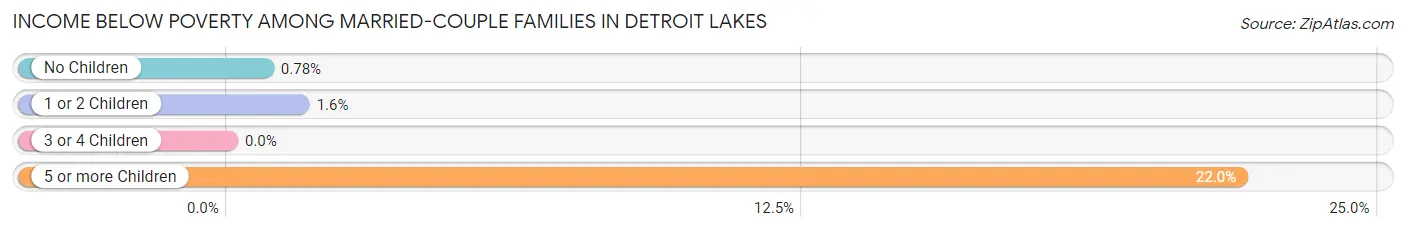
| Children | Above Poverty | Below Poverty |
| No Children | 1,152 (99.2%) | 9 (0.8%) |
| 1 or 2 Children | 378 (98.4%) | 6 (1.6%) |
| 3 or 4 Children | 135 (100.0%) | 0 (0.0%) |
| 5 or more Children | 71 (78.0%) | 20 (22.0%) |
| Total | 1,736 (98.0%) | 35 (2.0%) |
Income Below Poverty Among Single-Parent Households in Detroit Lakes
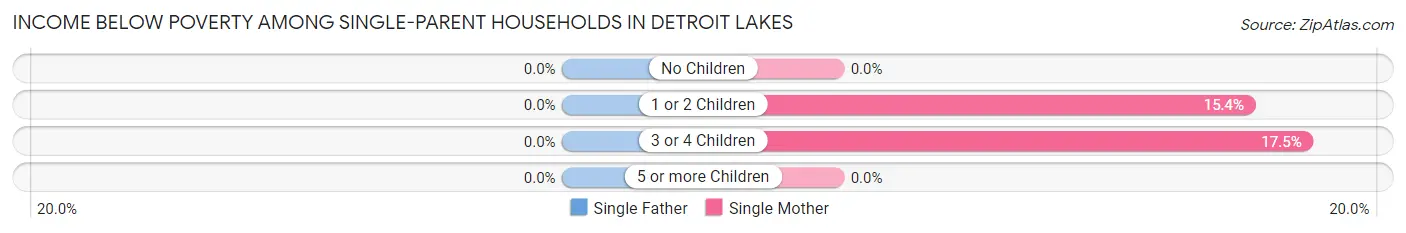
| Children | Single Father | Single Mother |
| No Children | 0 (0.0%) | 0 (0.0%) |
| 1 or 2 Children | 0 (0.0%) | 39 (15.3%) |
| 3 or 4 Children | 0 (0.0%) | 14 (17.5%) |
| 5 or more Children | 0 (0.0%) | 0 (0.0%) |
| Total | 0 (0.0%) | 53 (14.6%) |
Income Below Poverty Among Married-Couple vs Single-Parent Households in Detroit Lakes
The poverty data for Detroit Lakes shows that 35 of the married-couple family households (2.0%) and 53 of the single-parent households (9.6%) are living below the poverty level. Within the married-couple family households, those with 5 or more children have the highest poverty rate, with 20 households (22.0%) falling below the poverty line. Among the single-parent households, those with 3 or 4 children have the highest poverty rate, with 14 household (14.3%) living below poverty.
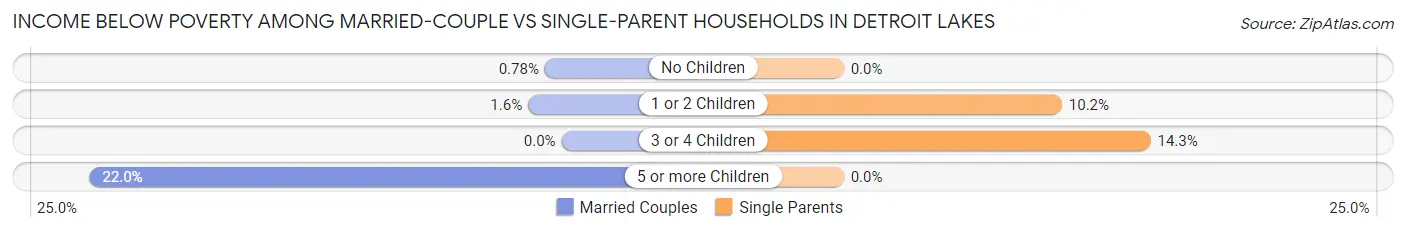
| Children | Married-Couple Families | Single-Parent Households |
| No Children | 9 (0.8%) | 0 (0.0%) |
| 1 or 2 Children | 6 (1.6%) | 39 (10.2%) |
| 3 or 4 Children | 0 (0.0%) | 14 (14.3%) |
| 5 or more Children | 20 (22.0%) | 0 (0.0%) |
| Total | 35 (2.0%) | 53 (9.6%) |
Race in Detroit Lakes
The most populous races in Detroit Lakes are White / Caucasian (9,275 | 93.1%), Two or more Races (353 | 3.5%), and Native / Alaskan (171 | 1.7%).
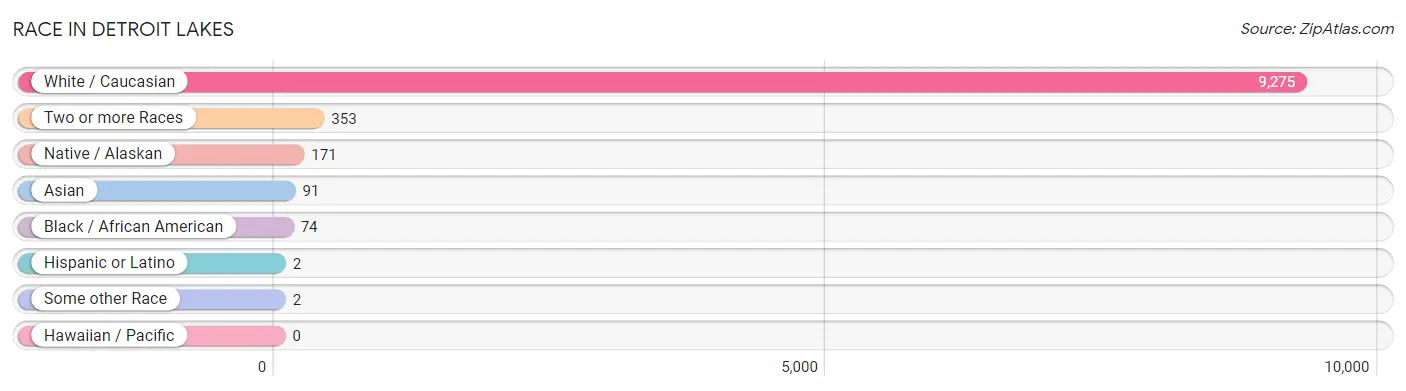
| Race | # Population | % Population |
| Asian | 91 | 0.9% |
| Black / African American | 74 | 0.7% |
| Hawaiian / Pacific | 0 | 0.0% |
| Hispanic or Latino | 2 | 0.0% |
| Native / Alaskan | 171 | 1.7% |
| White / Caucasian | 9,275 | 93.1% |
| Two or more Races | 353 | 3.5% |
| Some other Race | 2 | 0.0% |
| Total | 9,966 | 100.0% |
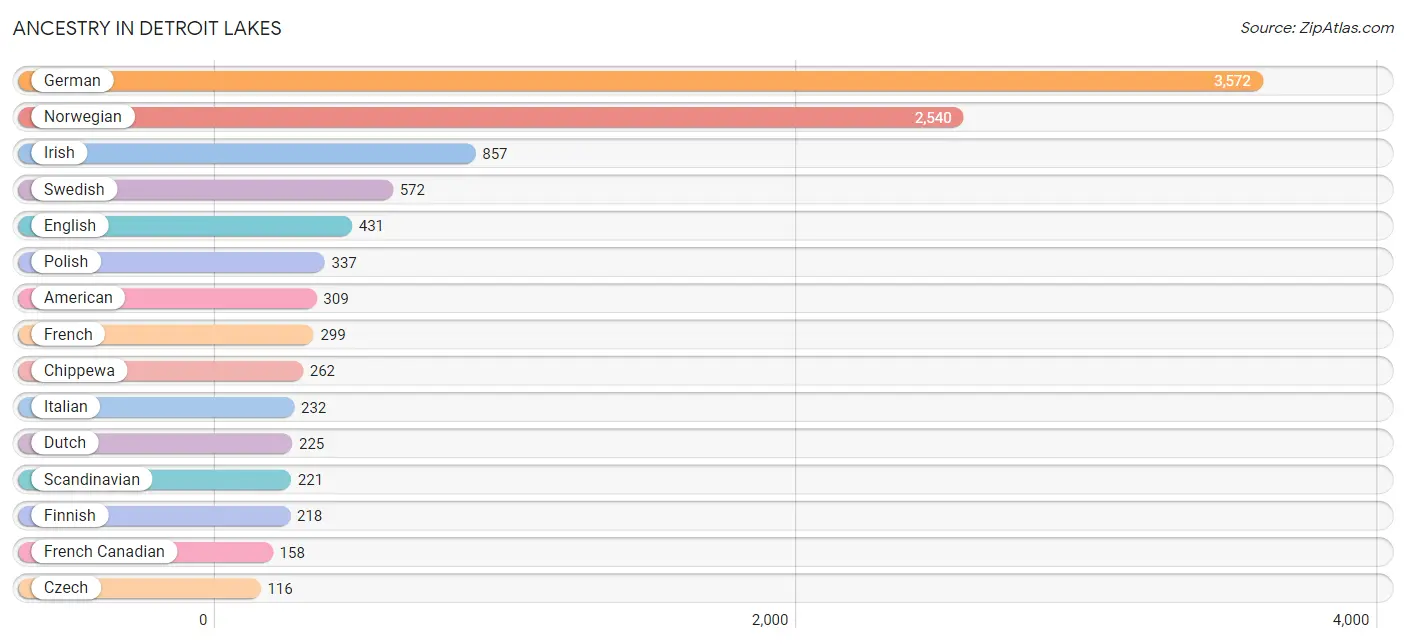
Ancestry in Detroit Lakes
The most populous ancestries reported in Detroit Lakes are German (3,572 | 35.8%), Norwegian (2,540 | 25.5%), Irish (857 | 8.6%), Swedish (572 | 5.7%), and English (431 | 4.3%), together accounting for 80.0% of all Detroit Lakes residents.
| Ancestry | # Population | % Population |
| American | 309 | 3.1% |
| Arab | 20 | 0.2% |
| Belgian | 24 | 0.2% |
| Bhutanese | 20 | 0.2% |
| British | 8 | 0.1% |
| Cajun | 17 | 0.2% |
| Canadian | 41 | 0.4% |
| Celtic | 11 | 0.1% |
| Cherokee | 11 | 0.1% |
| Chippewa | 262 | 2.6% |
| Croatian | 6 | 0.1% |
| Czech | 116 | 1.2% |
| Czechoslovakian | 25 | 0.3% |
| Danish | 41 | 0.4% |
| Dutch | 225 | 2.3% |
| English | 431 | 4.3% |
| European | 100 | 1.0% |
| Finnish | 218 | 2.2% |
| French | 299 | 3.0% |
| French American Indian | 17 | 0.2% |
| French Canadian | 158 | 1.6% |
| German | 3,572 | 35.8% |
| Haitian | 9 | 0.1% |
| Icelander | 34 | 0.3% |
| Irish | 857 | 8.6% |
| Iroquois | 58 | 0.6% |
| Italian | 232 | 2.3% |
| Korean | 1 | 0.0% |
| Lebanese | 20 | 0.2% |
| Lithuanian | 5 | 0.1% |
| Mexican | 2 | 0.0% |
| Northern European | 29 | 0.3% |
| Norwegian | 2,540 | 25.5% |
| Polish | 337 | 3.4% |
| Russian | 58 | 0.6% |
| Scandinavian | 221 | 2.2% |
| Scotch-Irish | 6 | 0.1% |
| Scottish | 84 | 0.8% |
| Sri Lankan | 77 | 0.8% |
| Swedish | 572 | 5.7% |
| Swiss | 9 | 0.1% |
| Thai | 6 | 0.1% |
| Tohono O'Odham | 11 | 0.1% |
| Ukrainian | 8 | 0.1% |
| Welsh | 25 | 0.3% | View All 45 Rows |
Immigrants in Detroit Lakes
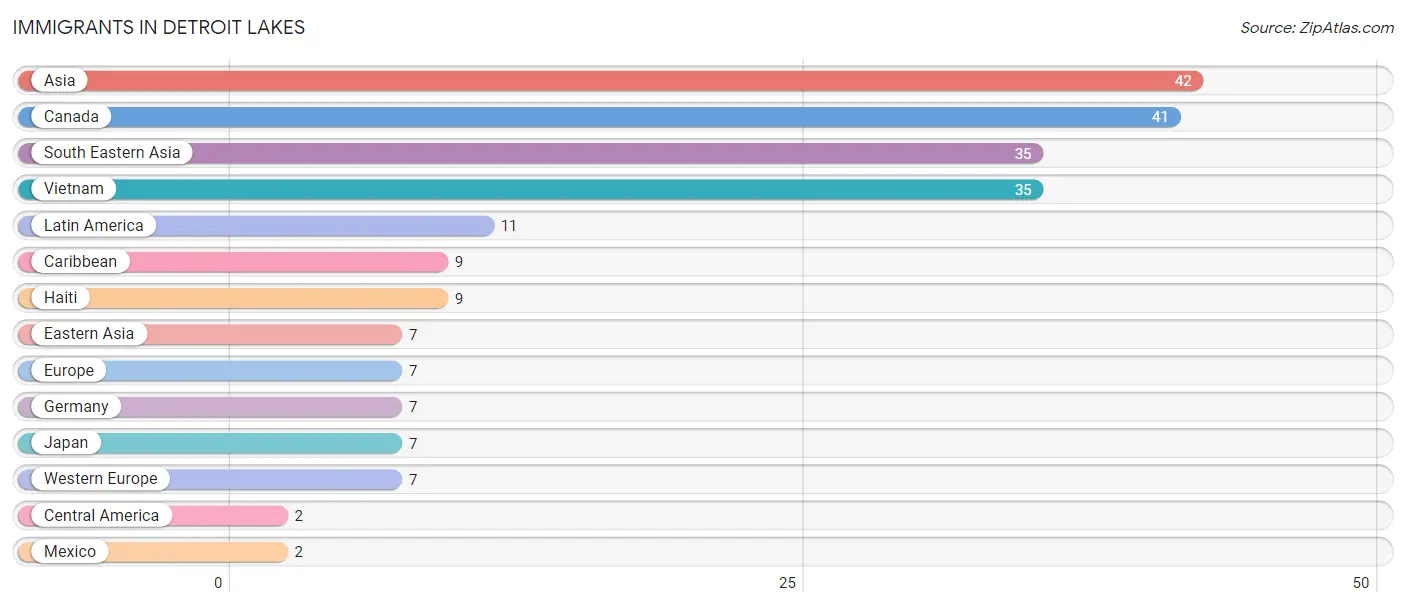
The most numerous immigrant groups reported in Detroit Lakes came from Asia (42 | 0.4%), Canada (41 | 0.4%), South Eastern Asia (35 | 0.4%), Vietnam (35 | 0.4%), and Latin America (11 | 0.1%), together accounting for 1.6% of all Detroit Lakes residents.
| Immigration Origin | # Population | % Population |
| Asia | 42 | 0.4% |
| Canada | 41 | 0.4% |
| Caribbean | 9 | 0.1% |
| Central America | 2 | 0.0% |
| Eastern Asia | 7 | 0.1% |
| Europe | 7 | 0.1% |
| Germany | 7 | 0.1% |
| Haiti | 9 | 0.1% |
| Japan | 7 | 0.1% |
| Latin America | 11 | 0.1% |
| Mexico | 2 | 0.0% |
| South Eastern Asia | 35 | 0.4% |
| Vietnam | 35 | 0.4% |
| Western Europe | 7 | 0.1% | View All 14 Rows |
Sex and Age in Detroit Lakes
Sex and Age in Detroit Lakes
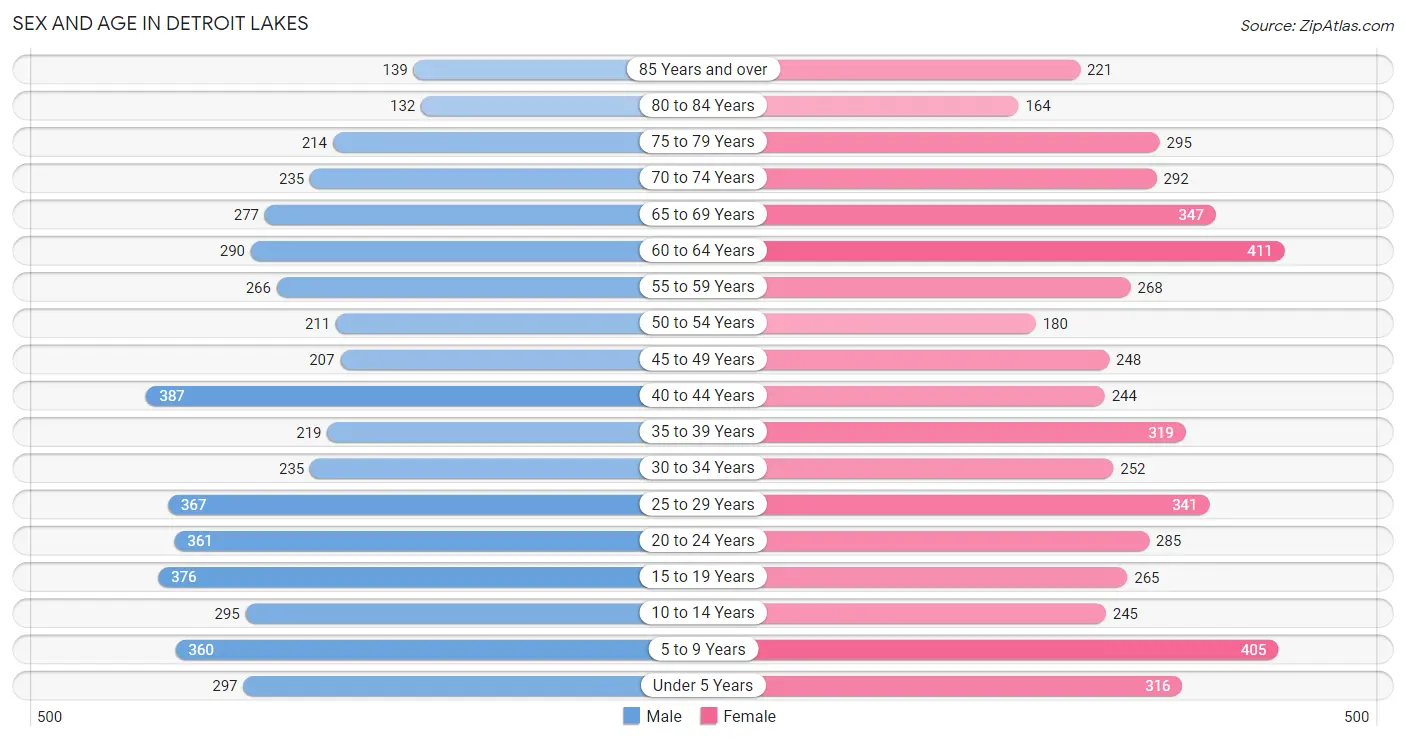
The most populous age groups in Detroit Lakes are 40 to 44 Years (387 | 8.0%) for men and 60 to 64 Years (411 | 8.1%) for women.
| Age Bracket | Male | Female |
| Under 5 Years | 297 (6.1%) | 316 (6.2%) |
| 5 to 9 Years | 360 (7.4%) | 405 (7.9%) |
| 10 to 14 Years | 295 (6.1%) | 245 (4.8%) |
| 15 to 19 Years | 376 (7.7%) | 265 (5.2%) |
| 20 to 24 Years | 361 (7.4%) | 285 (5.6%) |
| 25 to 29 Years | 367 (7.5%) | 341 (6.7%) |
| 30 to 34 Years | 235 (4.8%) | 252 (4.9%) |
| 35 to 39 Years | 219 (4.5%) | 319 (6.3%) |
| 40 to 44 Years | 387 (8.0%) | 244 (4.8%) |
| 45 to 49 Years | 207 (4.3%) | 248 (4.9%) |
| 50 to 54 Years | 211 (4.3%) | 180 (3.5%) |
| 55 to 59 Years | 266 (5.5%) | 268 (5.3%) |
| 60 to 64 Years | 290 (6.0%) | 411 (8.1%) |
| 65 to 69 Years | 277 (5.7%) | 347 (6.8%) |
| 70 to 74 Years | 235 (4.8%) | 292 (5.7%) |
| 75 to 79 Years | 214 (4.4%) | 295 (5.8%) |
| 80 to 84 Years | 132 (2.7%) | 164 (3.2%) |
| 85 Years and over | 139 (2.9%) | 221 (4.3%) |
| Total | 4,868 (100.0%) | 5,098 (100.0%) |
Families and Households in Detroit Lakes
Median Family Size in Detroit Lakes
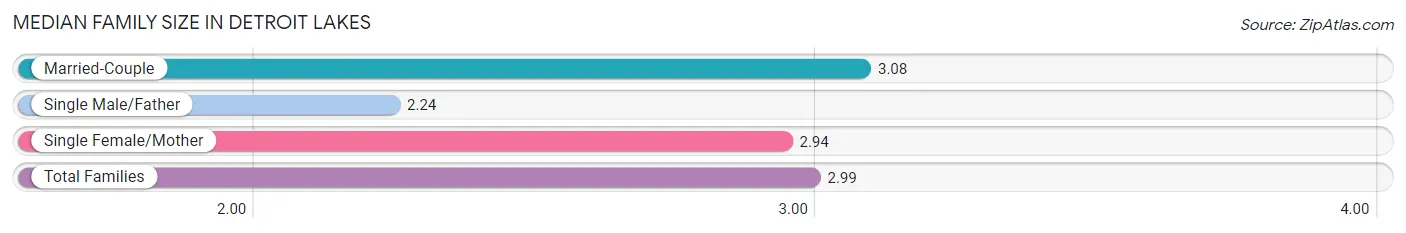
The median family size in Detroit Lakes is 2.99 persons per family, with married-couple families (1,771 | 76.3%) accounting for the largest median family size of 3.08 persons per family. On the other hand, single male/father families (187 | 8.1%) represent the smallest median family size with 2.24 persons per family.
| Family Type | # Families | Family Size |
| Married-Couple | 1,771 (76.3%) | 3.08 |
| Single Male/Father | 187 (8.1%) | 2.24 |
| Single Female/Mother | 363 (15.6%) | 2.94 |
| Total Families | 2,321 (100.0%) | 2.99 |
Median Household Size in Detroit Lakes
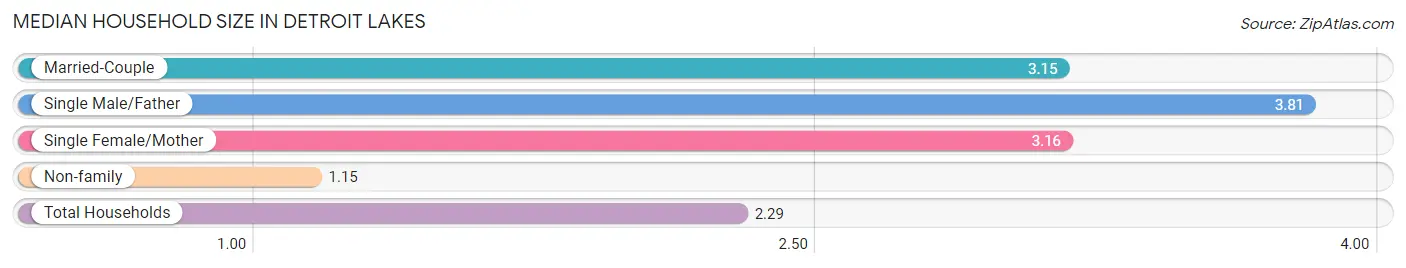
The median household size in Detroit Lakes is 2.29 persons per household, with single male/father households (187 | 4.5%) accounting for the largest median household size of 3.81 persons per household. non-family households (1,869 | 44.6%) represent the smallest median household size with 1.15 persons per household.
| Household Type | # Households | Household Size |
| Married-Couple | 1,771 (42.3%) | 3.15 |
| Single Male/Father | 187 (4.5%) | 3.81 |
| Single Female/Mother | 363 (8.7%) | 3.16 |
| Non-family | 1,869 (44.6%) | 1.15 |
| Total Households | 4,190 (100.0%) | 2.29 |
Household Size by Marriage Status in Detroit Lakes
Out of a total of 4,190 households in Detroit Lakes, 2,321 (55.4%) are family households, while 1,869 (44.6%) are nonfamily households. The most numerous type of family households are 2-person households, comprising 1,106, and the most common type of nonfamily households are 1-person households, comprising 1,595.
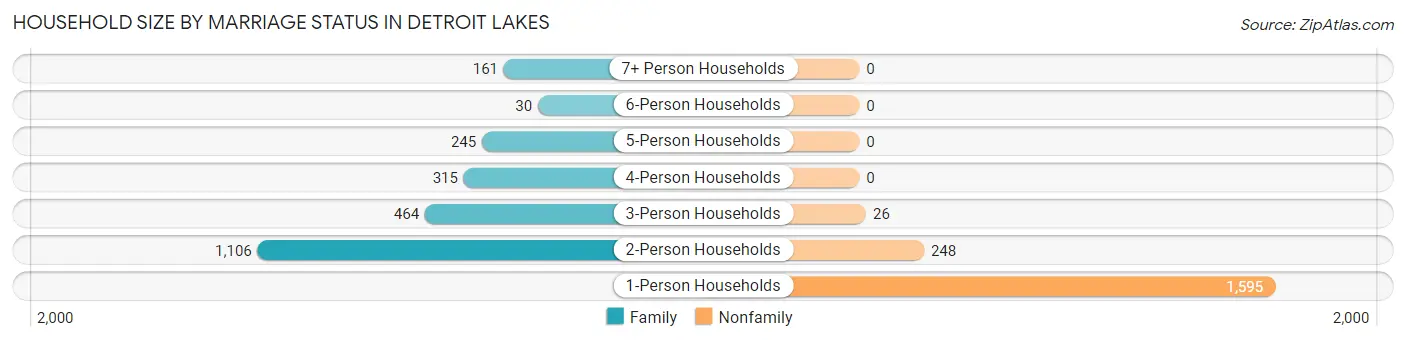
| Household Size | Family Households | Nonfamily Households |
| 1-Person Households | - | 1,595 (38.1%) |
| 2-Person Households | 1,106 (26.4%) | 248 (5.9%) |
| 3-Person Households | 464 (11.1%) | 26 (0.6%) |
| 4-Person Households | 315 (7.5%) | 0 (0.0%) |
| 5-Person Households | 245 (5.9%) | 0 (0.0%) |
| 6-Person Households | 30 (0.7%) | 0 (0.0%) |
| 7+ Person Households | 161 (3.8%) | 0 (0.0%) |
| Total | 2,321 (55.4%) | 1,869 (44.6%) |
Female Fertility in Detroit Lakes
Fertility by Age in Detroit Lakes
Average fertility rate in Detroit Lakes is 57.0 births per 1,000 women. Women in the age bracket of 35 to 50 years have the highest fertility rate with 69.0 births per 1,000 women. Women in the age bracket of 35 to 50 years acount for 52.2% of all women with births.
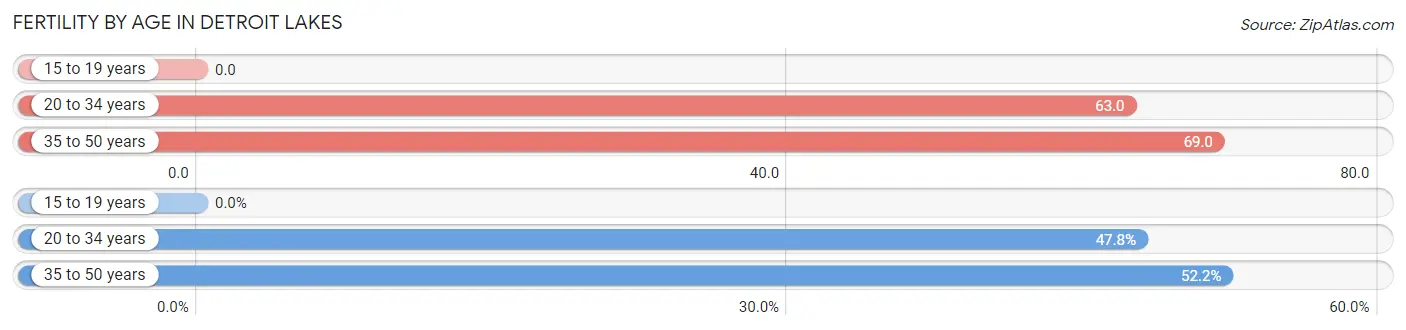
| Age Bracket | Women with Births | Births / 1,000 Women |
| 15 to 19 years | 0 (0.0%) | 0.0 |
| 20 to 34 years | 55 (47.8%) | 63.0 |
| 35 to 50 years | 60 (52.2%) | 69.0 |
| Total | 115 (100.0%) | 57.0 |
Fertility by Age by Marriage Status in Detroit Lakes
35.7% of women with births (115) in Detroit Lakes are married. The highest percentage of unmarried women with births falls into 35 to 50 years age bracket with 100.0% of them unmarried at the time of birth, while the lowest percentage of unmarried women with births belong to 20 to 34 years age bracket with 25.4% of them unmarried.
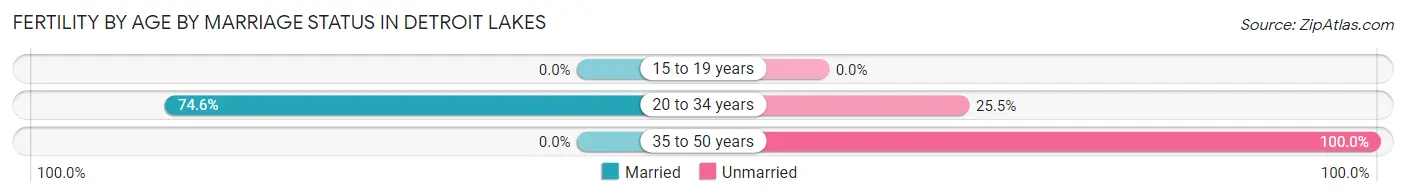
| Age Bracket | Married | Unmarried |
| 15 to 19 years | 0 (0.0%) | 0 (0.0%) |
| 20 to 34 years | 41 (74.6%) | 14 (25.5%) |
| 35 to 50 years | 0 (0.0%) | 60 (100.0%) |
| Total | 41 (35.6%) | 74 (64.3%) |
Fertility by Education in Detroit Lakes
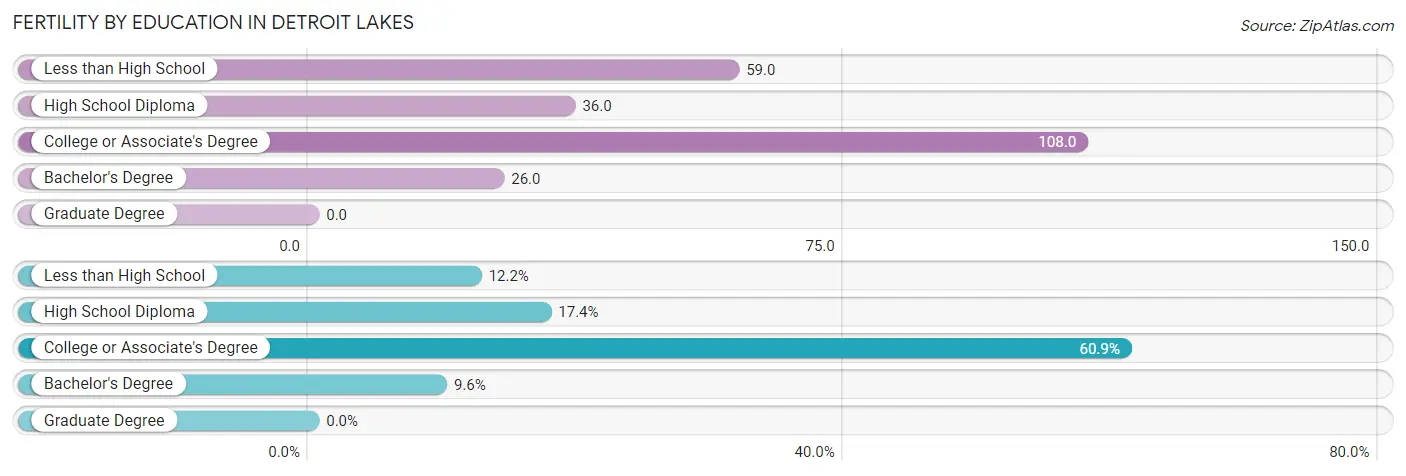
| Educational Attainment | Women with Births | Births / 1,000 Women |
| Less than High School | 14 (12.2%) | 59.0 |
| High School Diploma | 20 (17.4%) | 36.0 |
| College or Associate's Degree | 70 (60.9%) | 108.0 |
| Bachelor's Degree | 11 (9.6%) | 26.0 |
| Graduate Degree | 0 (0.0%) | 0.0 |
| Total | 115 (100.0%) | 57.0 |
Fertility by Education by Marriage Status in Detroit Lakes
64.3% of women with births in Detroit Lakes are unmarried. Women with the educational attainment of high school diploma are most likely to be married with 100.0% of them married at childbirth, while women with the educational attainment of less than high school are least likely to be married with 100.0% of them unmarried at childbirth.
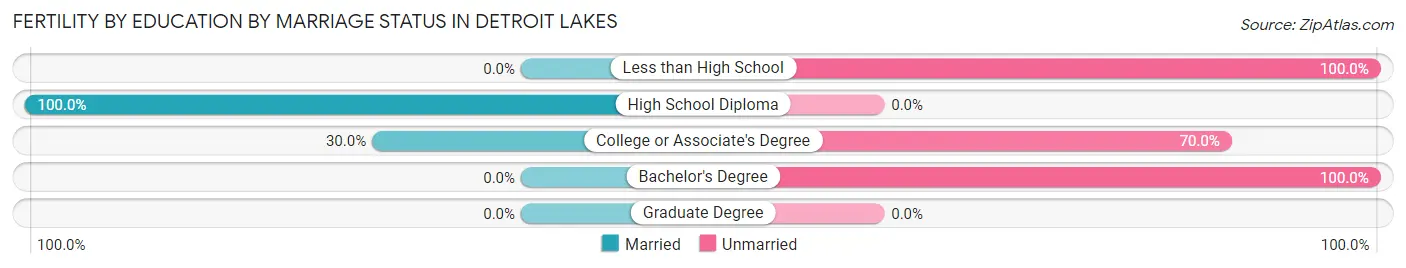
| Educational Attainment | Married | Unmarried |
| Less than High School | 0 (0.0%) | 14 (100.0%) |
| High School Diploma | 20 (100.0%) | 0 (0.0%) |
| College or Associate's Degree | 21 (30.0%) | 49 (70.0%) |
| Bachelor's Degree | 0 (0.0%) | 11 (100.0%) |
| Graduate Degree | 0 (0.0%) | 0 (0.0%) |
| Total | 41 (35.6%) | 74 (64.3%) |
Employment Characteristics in Detroit Lakes
Employment by Class of Employer in Detroit Lakes
Among the 4,510 employed individuals in Detroit Lakes, private company employees (2,699 | 59.8%), not-for-profit organizations (660 | 14.6%), and local government employees (470 | 10.4%) make up the most common classes of employment.
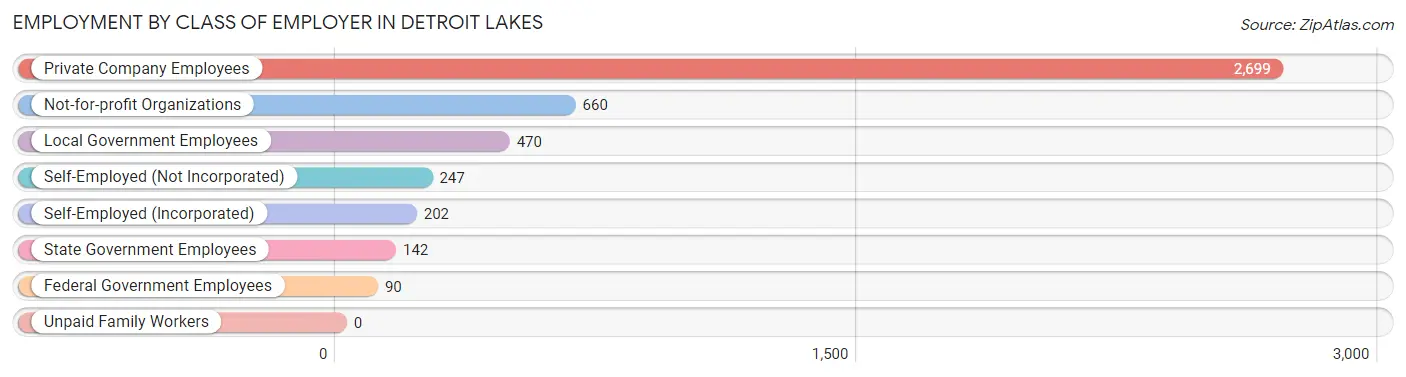
| Employer Class | # Employees | % Employees |
| Private Company Employees | 2,699 | 59.8% |
| Self-Employed (Incorporated) | 202 | 4.5% |
| Self-Employed (Not Incorporated) | 247 | 5.5% |
| Not-for-profit Organizations | 660 | 14.6% |
| Local Government Employees | 470 | 10.4% |
| State Government Employees | 142 | 3.2% |
| Federal Government Employees | 90 | 2.0% |
| Unpaid Family Workers | 0 | 0.0% |
| Total | 4,510 | 100.0% |
Employment Status by Age in Detroit Lakes
According to the labor force statistics for Detroit Lakes, out of the total population over 16 years of age (7,862), 61.9% or 4,867 individuals are in the labor force, with 4.7% or 229 of them unemployed. The age group with the highest labor force participation rate is 30 to 34 years, with 89.1% or 434 individuals in the labor force. Within the labor force, the 20 to 24 years age range has the highest percentage of unemployed individuals, with 16.0% or 79 of them being unemployed.
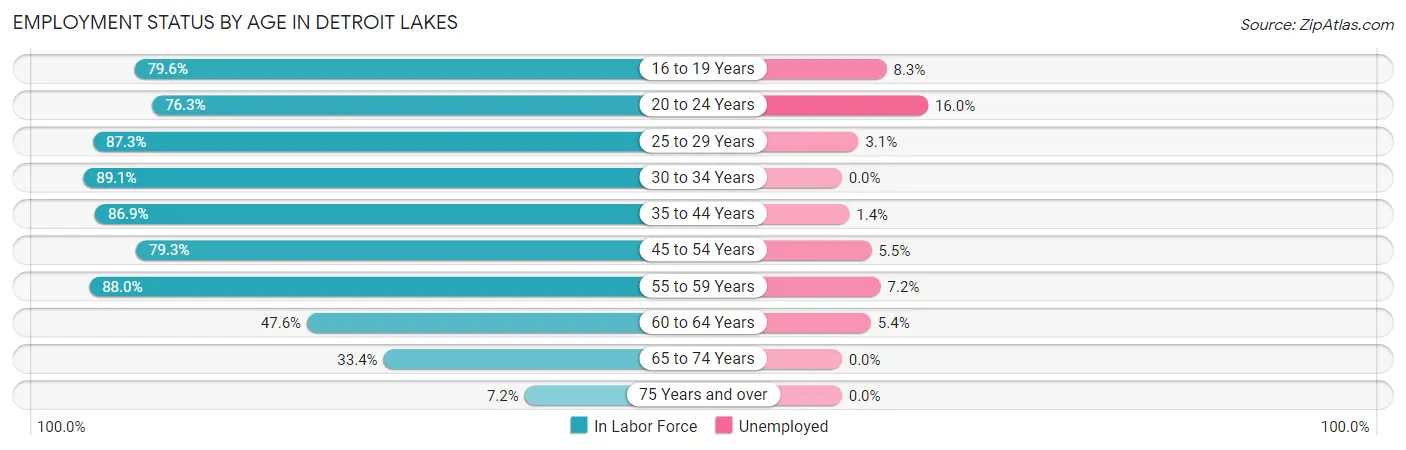
| Age Bracket | In Labor Force | Unemployed |
| 16 to 19 Years | 362 (79.6%) | 30 (8.3%) |
| 20 to 24 Years | 493 (76.3%) | 79 (16.0%) |
| 25 to 29 Years | 618 (87.3%) | 19 (3.1%) |
| 30 to 34 Years | 434 (89.1%) | 0 (0.0%) |
| 35 to 44 Years | 1,016 (86.9%) | 14 (1.4%) |
| 45 to 54 Years | 671 (79.3%) | 37 (5.5%) |
| 55 to 59 Years | 470 (88.0%) | 34 (7.2%) |
| 60 to 64 Years | 334 (47.6%) | 18 (5.4%) |
| 65 to 74 Years | 384 (33.4%) | 0 (0.0%) |
| 75 Years and over | 84 (7.2%) | 0 (0.0%) |
| Total | 4,867 (61.9%) | 229 (4.7%) |
Employment Status by Educational Attainment in Detroit Lakes
According to labor force statistics for Detroit Lakes, 79.7% of individuals (3,543) out of the total population between 25 and 64 years of age (4,445) are in the labor force, with 3.4% or 120 of them being unemployed. The group with the highest labor force participation rate are those with the educational attainment of college / associate degree, with 85.7% or 1,523 individuals in the labor force. Within the labor force, individuals with high school diploma education have the highest percentage of unemployment, with 4.8% or 34 of them being unemployed.
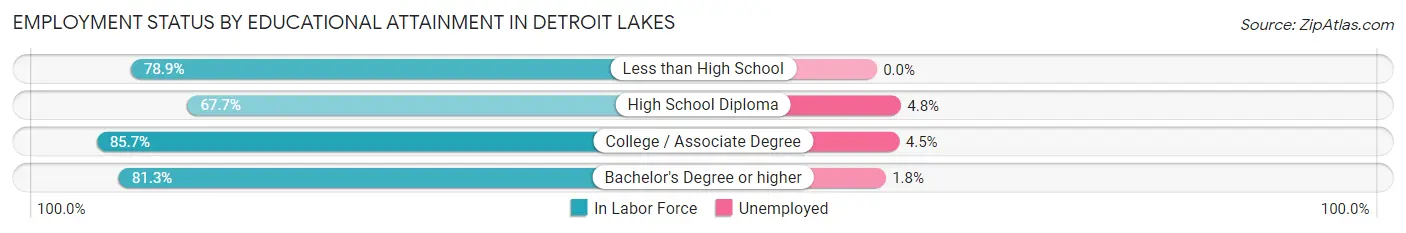
| Educational Attainment | In Labor Force | Unemployed |
| Less than High School | 235 (78.9%) | 0 (0.0%) |
| High School Diploma | 709 (67.7%) | 50 (4.8%) |
| College / Associate Degree | 1,523 (85.7%) | 80 (4.5%) |
| Bachelor's Degree or higher | 1,075 (81.3%) | 24 (1.8%) |
| Total | 3,543 (79.7%) | 151 (3.4%) |
Employment Occupations by Sex in Detroit Lakes
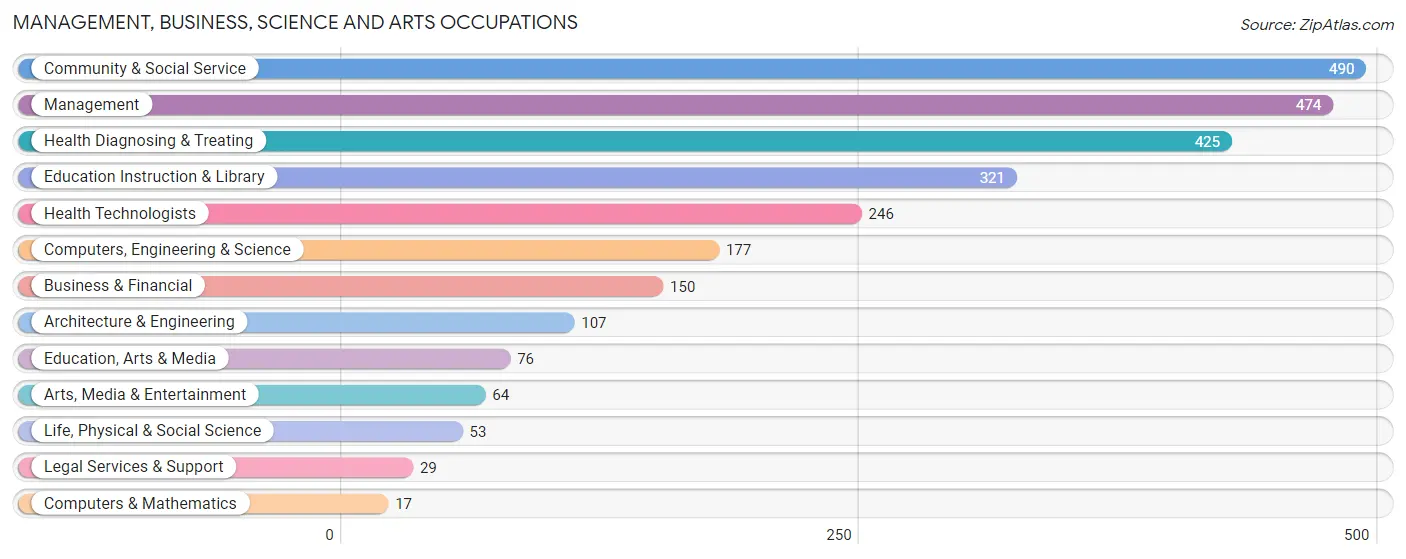
Management, Business, Science and Arts Occupations
The most common Management, Business, Science and Arts occupations in Detroit Lakes are Community & Social Service (490 | 10.6%), Management (474 | 10.2%), Health Diagnosing & Treating (425 | 9.2%), Education Instruction & Library (321 | 6.9%), and Health Technologists (246 | 5.3%).
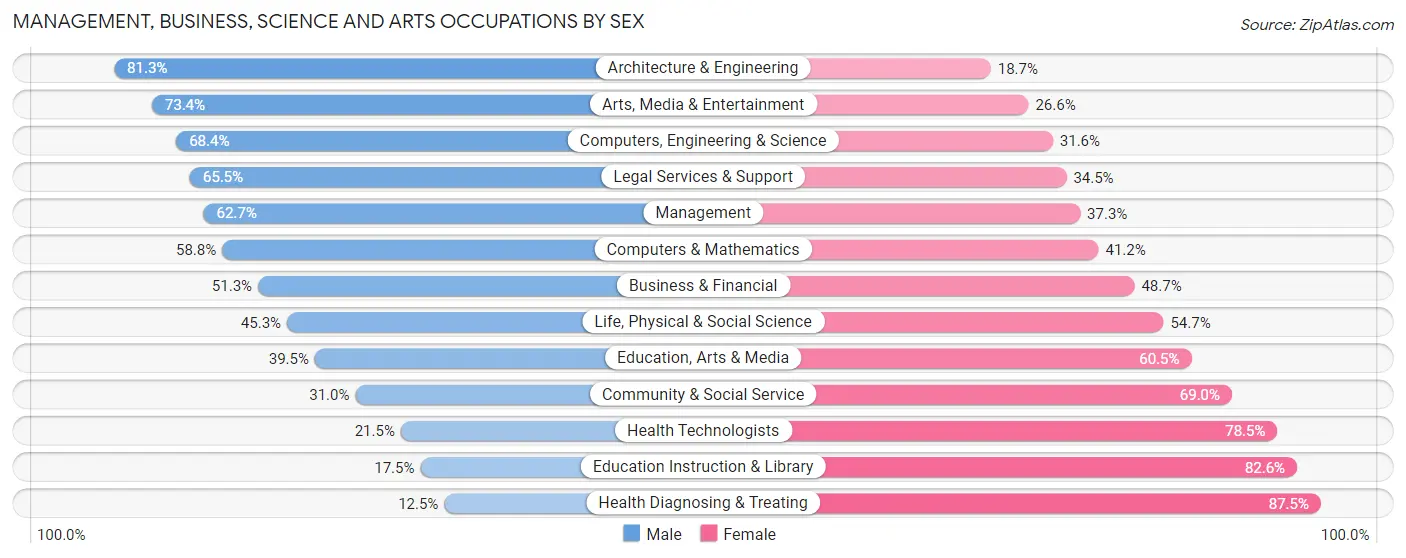
Management, Business, Science and Arts Occupations by Sex
Within the Management, Business, Science and Arts occupations in Detroit Lakes, the most male-oriented occupations are Architecture & Engineering (81.3%), Arts, Media & Entertainment (73.4%), and Computers, Engineering & Science (68.4%), while the most female-oriented occupations are Health Diagnosing & Treating (87.5%), Education Instruction & Library (82.6%), and Health Technologists (78.5%).
| Occupation | Male | Female |
| Management | 297 (62.7%) | 177 (37.3%) |
| Business & Financial | 77 (51.3%) | 73 (48.7%) |
| Computers, Engineering & Science | 121 (68.4%) | 56 (31.6%) |
| Computers & Mathematics | 10 (58.8%) | 7 (41.2%) |
| Architecture & Engineering | 87 (81.3%) | 20 (18.7%) |
| Life, Physical & Social Science | 24 (45.3%) | 29 (54.7%) |
| Community & Social Service | 152 (31.0%) | 338 (69.0%) |
| Education, Arts & Media | 30 (39.5%) | 46 (60.5%) |
| Legal Services & Support | 19 (65.5%) | 10 (34.5%) |
| Education Instruction & Library | 56 (17.4%) | 265 (82.6%) |
| Arts, Media & Entertainment | 47 (73.4%) | 17 (26.6%) |
| Health Diagnosing & Treating | 53 (12.5%) | 372 (87.5%) |
| Health Technologists | 53 (21.5%) | 193 (78.5%) |
| Total (Category) | 700 (40.8%) | 1,016 (59.2%) |
| Total (Overall) | 2,345 (50.6%) | 2,290 (49.4%) |
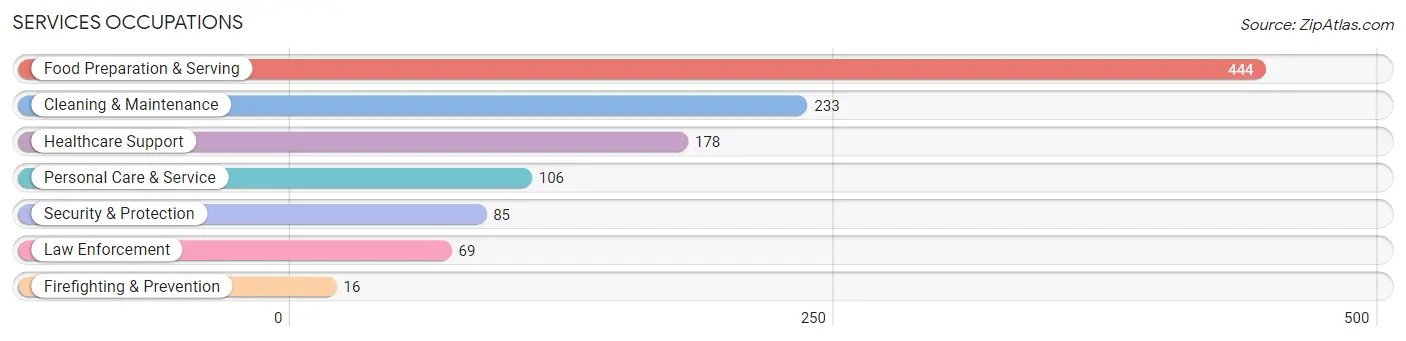
Services Occupations
The most common Services occupations in Detroit Lakes are Food Preparation & Serving (444 | 9.6%), Cleaning & Maintenance (233 | 5.0%), Healthcare Support (178 | 3.8%), Personal Care & Service (106 | 2.3%), and Security & Protection (85 | 1.8%).
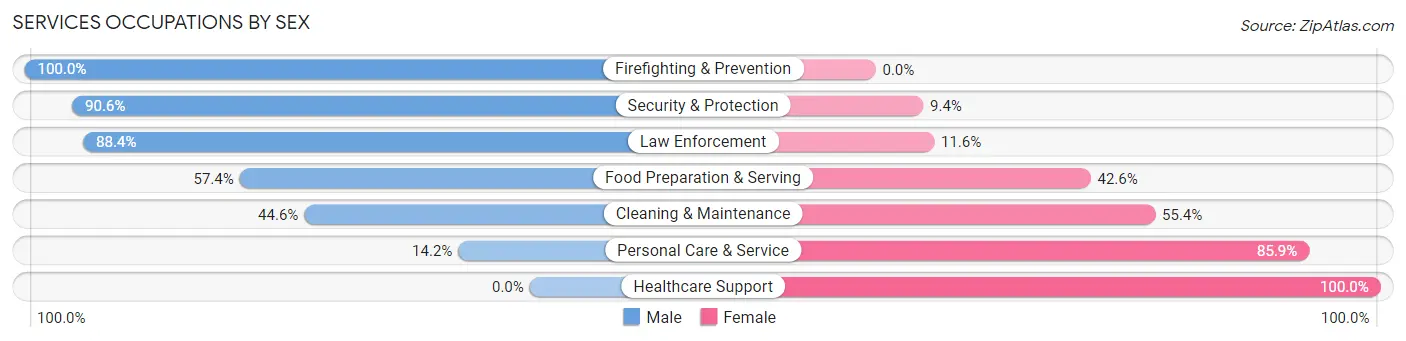
Services Occupations by Sex
Within the Services occupations in Detroit Lakes, the most male-oriented occupations are Firefighting & Prevention (100.0%), Security & Protection (90.6%), and Law Enforcement (88.4%), while the most female-oriented occupations are Healthcare Support (100.0%), Personal Care & Service (85.9%), and Cleaning & Maintenance (55.4%).
| Occupation | Male | Female |
| Healthcare Support | 0 (0.0%) | 178 (100.0%) |
| Security & Protection | 77 (90.6%) | 8 (9.4%) |
| Firefighting & Prevention | 16 (100.0%) | 0 (0.0%) |
| Law Enforcement | 61 (88.4%) | 8 (11.6%) |
| Food Preparation & Serving | 255 (57.4%) | 189 (42.6%) |
| Cleaning & Maintenance | 104 (44.6%) | 129 (55.4%) |
| Personal Care & Service | 15 (14.1%) | 91 (85.9%) |
| Total (Category) | 451 (43.1%) | 595 (56.9%) |
| Total (Overall) | 2,345 (50.6%) | 2,290 (49.4%) |
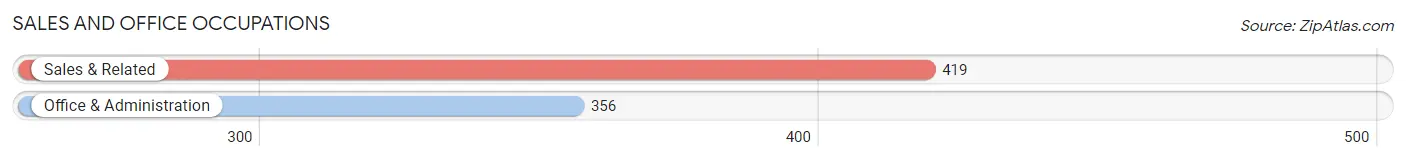
Sales and Office Occupations
The most common Sales and Office occupations in Detroit Lakes are Sales & Related (419 | 9.0%), and Office & Administration (356 | 7.7%).
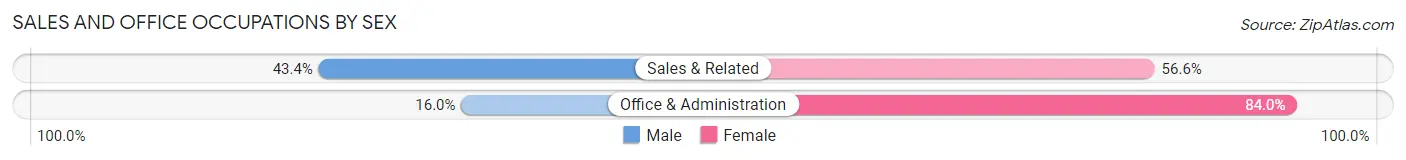
Sales and Office Occupations by Sex
| Occupation | Male | Female |
| Sales & Related | 182 (43.4%) | 237 (56.6%) |
| Office & Administration | 57 (16.0%) | 299 (84.0%) |
| Total (Category) | 239 (30.8%) | 536 (69.2%) |
| Total (Overall) | 2,345 (50.6%) | 2,290 (49.4%) |
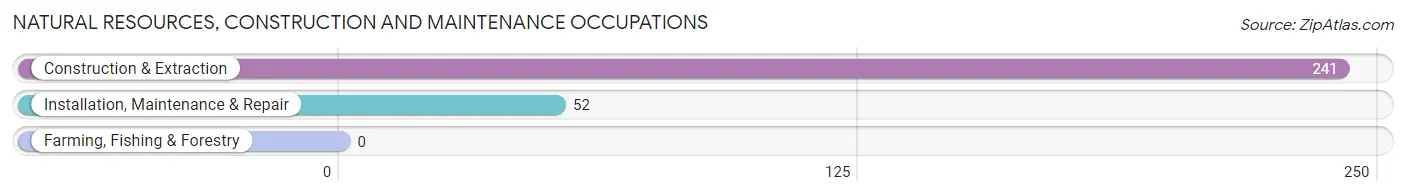
Natural Resources, Construction and Maintenance Occupations
The most common Natural Resources, Construction and Maintenance occupations in Detroit Lakes are Construction & Extraction (241 | 5.2%), and Installation, Maintenance & Repair (52 | 1.1%).
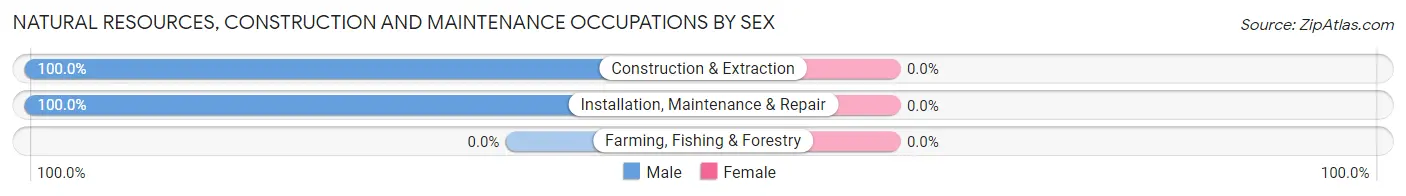
Natural Resources, Construction and Maintenance Occupations by Sex
| Occupation | Male | Female |
| Farming, Fishing & Forestry | 0 (0.0%) | 0 (0.0%) |
| Construction & Extraction | 241 (100.0%) | 0 (0.0%) |
| Installation, Maintenance & Repair | 52 (100.0%) | 0 (0.0%) |
| Total (Category) | 293 (100.0%) | 0 (0.0%) |
| Total (Overall) | 2,345 (50.6%) | 2,290 (49.4%) |
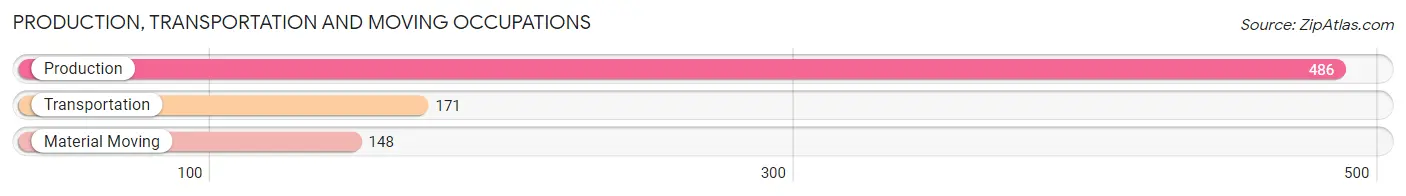
Production, Transportation and Moving Occupations
The most common Production, Transportation and Moving occupations in Detroit Lakes are Production (486 | 10.5%), Transportation (171 | 3.7%), and Material Moving (148 | 3.2%).
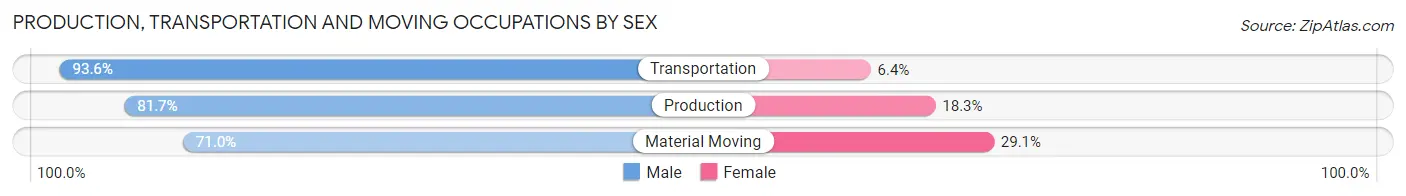
Production, Transportation and Moving Occupations by Sex
| Occupation | Male | Female |
| Production | 397 (81.7%) | 89 (18.3%) |
| Transportation | 160 (93.6%) | 11 (6.4%) |
| Material Moving | 105 (71.0%) | 43 (29.0%) |
| Total (Category) | 662 (82.2%) | 143 (17.8%) |
| Total (Overall) | 2,345 (50.6%) | 2,290 (49.4%) |
Employment Industries by Sex in Detroit Lakes
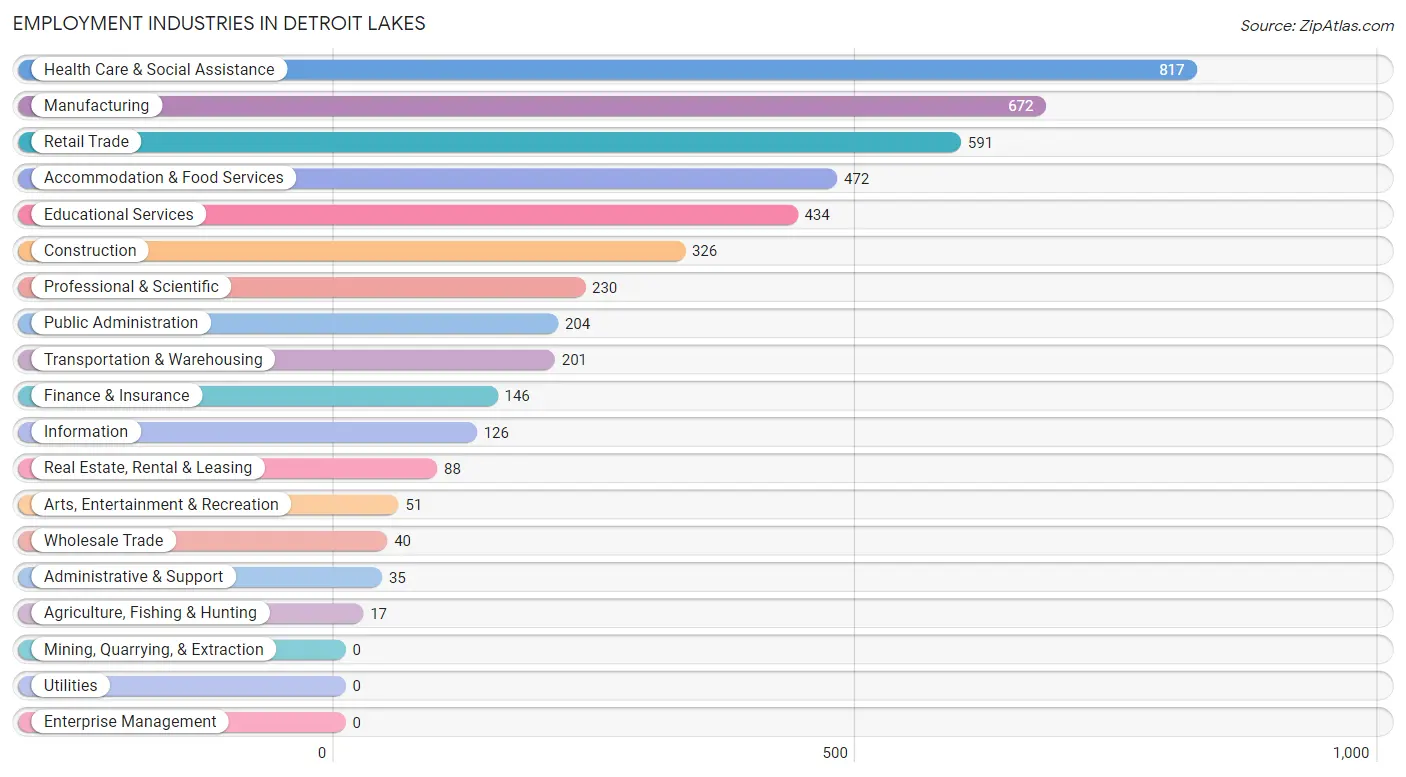
Employment Industries in Detroit Lakes
The major employment industries in Detroit Lakes include Health Care & Social Assistance (817 | 17.6%), Manufacturing (672 | 14.5%), Retail Trade (591 | 12.8%), Accommodation & Food Services (472 | 10.2%), and Educational Services (434 | 9.4%).
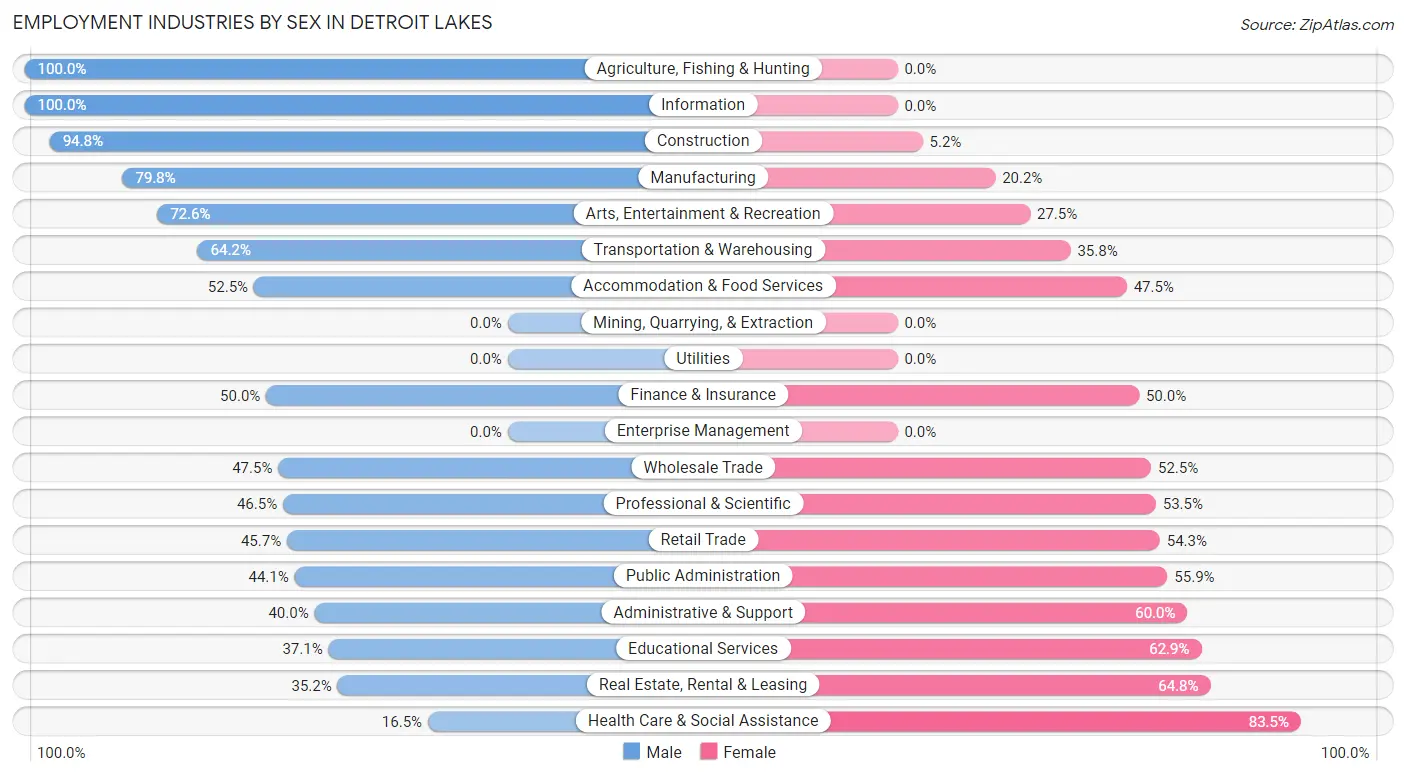
Employment Industries by Sex in Detroit Lakes
The Detroit Lakes industries that see more men than women are Agriculture, Fishing & Hunting (100.0%), Information (100.0%), and Construction (94.8%), whereas the industries that tend to have a higher number of women are Health Care & Social Assistance (83.5%), Real Estate, Rental & Leasing (64.8%), and Educational Services (62.9%).
| Industry | Male | Female |
| Agriculture, Fishing & Hunting | 17 (100.0%) | 0 (0.0%) |
| Mining, Quarrying, & Extraction | 0 (0.0%) | 0 (0.0%) |
| Construction | 309 (94.8%) | 17 (5.2%) |
| Manufacturing | 536 (79.8%) | 136 (20.2%) |
| Wholesale Trade | 19 (47.5%) | 21 (52.5%) |
| Retail Trade | 270 (45.7%) | 321 (54.3%) |
| Transportation & Warehousing | 129 (64.2%) | 72 (35.8%) |
| Utilities | 0 (0.0%) | 0 (0.0%) |
| Information | 126 (100.0%) | 0 (0.0%) |
| Finance & Insurance | 73 (50.0%) | 73 (50.0%) |
| Real Estate, Rental & Leasing | 31 (35.2%) | 57 (64.8%) |
| Professional & Scientific | 107 (46.5%) | 123 (53.5%) |
| Enterprise Management | 0 (0.0%) | 0 (0.0%) |
| Administrative & Support | 14 (40.0%) | 21 (60.0%) |
| Educational Services | 161 (37.1%) | 273 (62.9%) |
| Health Care & Social Assistance | 135 (16.5%) | 682 (83.5%) |
| Arts, Entertainment & Recreation | 37 (72.6%) | 14 (27.5%) |
| Accommodation & Food Services | 248 (52.5%) | 224 (47.5%) |
| Public Administration | 90 (44.1%) | 114 (55.9%) |
| Total | 2,345 (50.6%) | 2,290 (49.4%) |
Education in Detroit Lakes
School Enrollment in Detroit Lakes
The most common levels of schooling among the 2,197 students in Detroit Lakes are high school (533 | 24.3%), middle school (506 | 23.0%), and elementary school (467 | 21.3%).
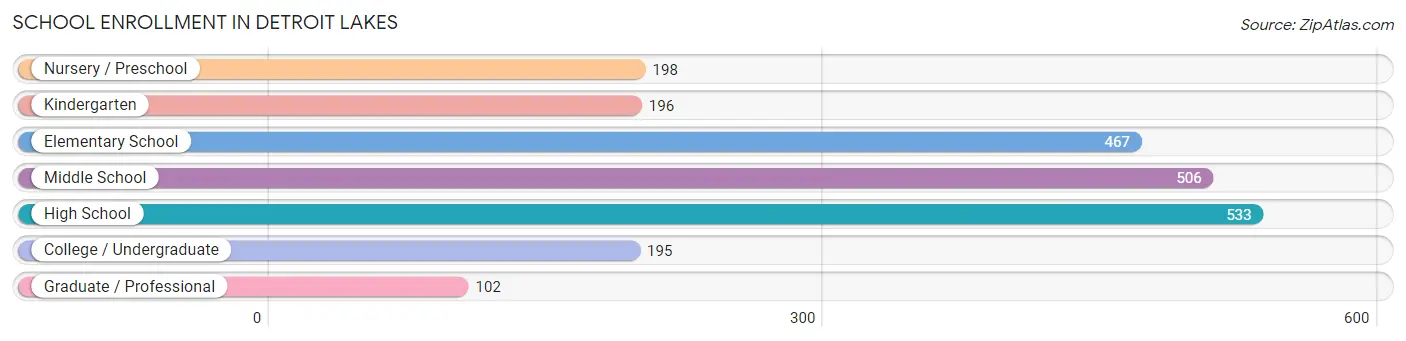
| School Level | # Students | % Students |
| Nursery / Preschool | 198 | 9.0% |
| Kindergarten | 196 | 8.9% |
| Elementary School | 467 | 21.3% |
| Middle School | 506 | 23.0% |
| High School | 533 | 24.3% |
| College / Undergraduate | 195 | 8.9% |
| Graduate / Professional | 102 | 4.6% |
| Total | 2,197 | 100.0% |
School Enrollment by Age by Funding Source in Detroit Lakes
Out of a total of 2,197 students who are enrolled in schools in Detroit Lakes, 174 (7.9%) attend a private institution, while the remaining 2,023 (92.1%) are enrolled in public schools. The age group of 35 years and over has the highest likelihood of being enrolled in private schools, with 27 (37.5% in the age bracket) enrolled. Conversely, the age group of 10 to 14 year olds has the lowest likelihood of being enrolled in a private school, with 533 (100.0% in the age bracket) attending a public institution.
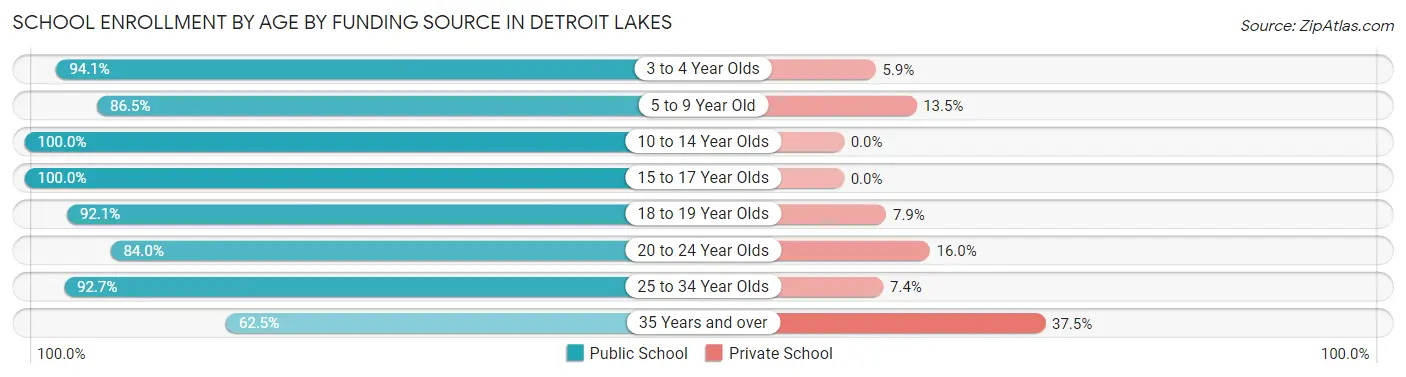
| Age Bracket | Public School | Private School |
| 3 to 4 Year Olds | 143 (94.1%) | 9 (5.9%) |
| 5 to 9 Year Old | 602 (86.5%) | 94 (13.5%) |
| 10 to 14 Year Olds | 533 (100.0%) | 0 (0.0%) |
| 15 to 17 Year Olds | 344 (100.0%) | 0 (0.0%) |
| 18 to 19 Year Olds | 105 (92.1%) | 9 (7.9%) |
| 20 to 24 Year Olds | 126 (84.0%) | 24 (16.0%) |
| 25 to 34 Year Olds | 126 (92.6%) | 10 (7.3%) |
| 35 Years and over | 45 (62.5%) | 27 (37.5%) |
| Total | 2,023 (92.1%) | 174 (7.9%) |
Educational Attainment by Field of Study in Detroit Lakes
Education (661 | 28.1%), business (425 | 18.0%), science & technology (286 | 12.1%), arts & humanities (194 | 8.2%), and bio, nature & agricultural (170 | 7.2%) are the most common fields of study among 2,356 individuals in Detroit Lakes who have obtained a bachelor's degree or higher.
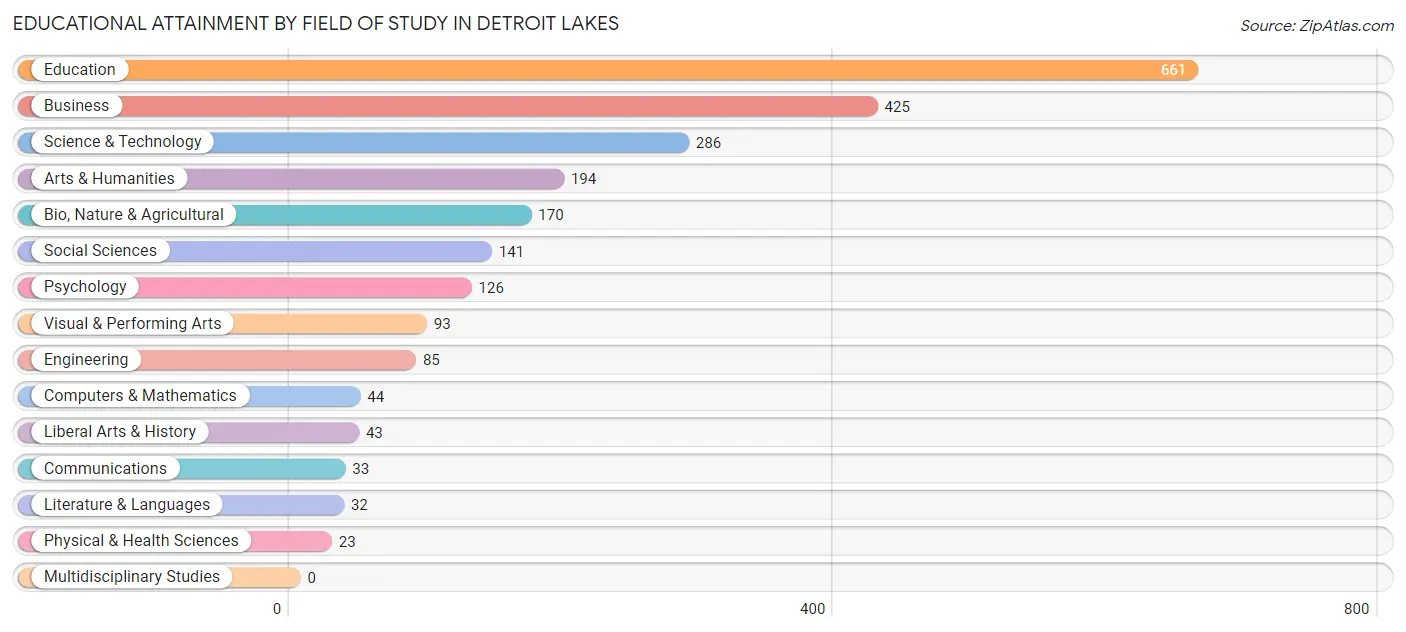
| Field of Study | # Graduates | % Graduates |
| Computers & Mathematics | 44 | 1.9% |
| Bio, Nature & Agricultural | 170 | 7.2% |
| Physical & Health Sciences | 23 | 1.0% |
| Psychology | 126 | 5.3% |
| Social Sciences | 141 | 6.0% |
| Engineering | 85 | 3.6% |
| Multidisciplinary Studies | 0 | 0.0% |
| Science & Technology | 286 | 12.1% |
| Business | 425 | 18.0% |
| Education | 661 | 28.1% |
| Literature & Languages | 32 | 1.4% |
| Liberal Arts & History | 43 | 1.8% |
| Visual & Performing Arts | 93 | 4.0% |
| Communications | 33 | 1.4% |
| Arts & Humanities | 194 | 8.2% |
| Total | 2,356 | 100.0% |
Transportation & Commute in Detroit Lakes
Vehicle Availability by Sex in Detroit Lakes
The most prevalent vehicle ownership categories in Detroit Lakes are males with 2 vehicles (847, accounting for 37.2%) and females with 2 vehicles (674, making up 38.7%).
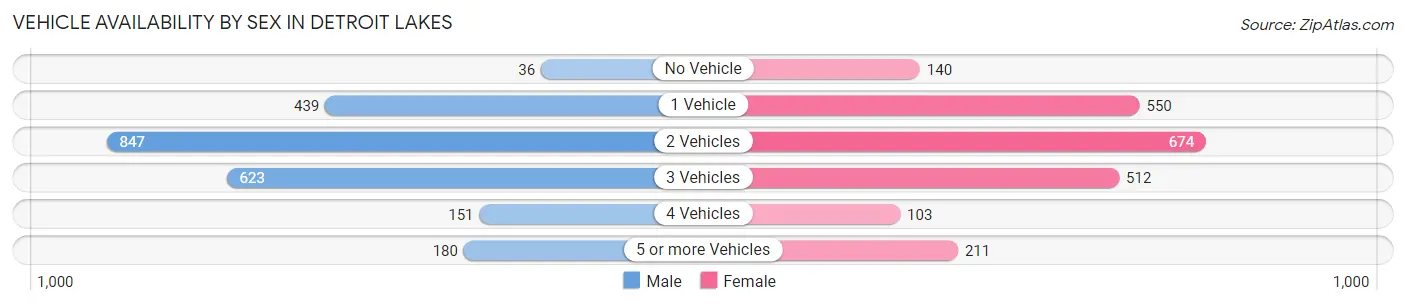
| Vehicles Available | Male | Female |
| No Vehicle | 36 (1.6%) | 140 (6.4%) |
| 1 Vehicle | 439 (19.3%) | 550 (25.1%) |
| 2 Vehicles | 847 (37.2%) | 674 (30.8%) |
| 3 Vehicles | 623 (27.4%) | 512 (23.4%) |
| 4 Vehicles | 151 (6.6%) | 103 (4.7%) |
| 5 or more Vehicles | 180 (7.9%) | 211 (9.6%) |
| Total | 2,276 (100.0%) | 2,190 (100.0%) |
Commute Time in Detroit Lakes
The most frequently occuring commute durations in Detroit Lakes are 5 to 9 minutes (1,418 commuters, 33.8%), 10 to 14 minutes (1,070 commuters, 25.5%), and less than 5 minutes (479 commuters, 11.4%).
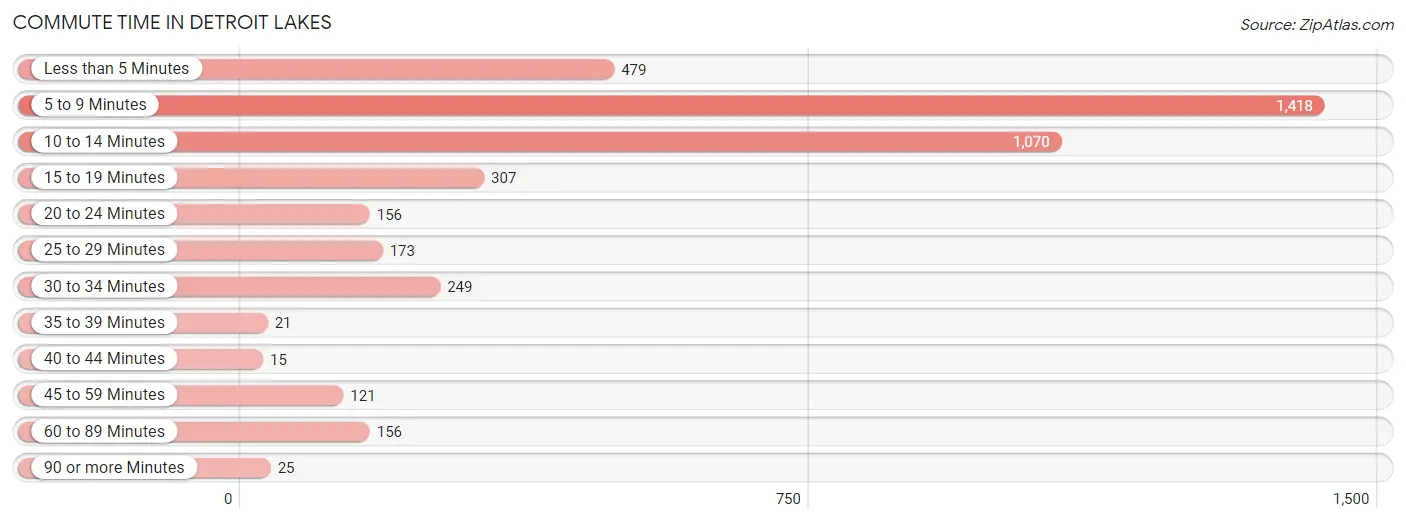
| Commute Time | # Commuters | % Commuters |
| Less than 5 Minutes | 479 | 11.4% |
| 5 to 9 Minutes | 1,418 | 33.8% |
| 10 to 14 Minutes | 1,070 | 25.5% |
| 15 to 19 Minutes | 307 | 7.3% |
| 20 to 24 Minutes | 156 | 3.7% |
| 25 to 29 Minutes | 173 | 4.1% |
| 30 to 34 Minutes | 249 | 5.9% |
| 35 to 39 Minutes | 21 | 0.5% |
| 40 to 44 Minutes | 15 | 0.4% |
| 45 to 59 Minutes | 121 | 2.9% |
| 60 to 89 Minutes | 156 | 3.7% |
| 90 or more Minutes | 25 | 0.6% |
Commute Time by Sex in Detroit Lakes
The most common commute times in Detroit Lakes are 5 to 9 minutes (597 commuters, 27.5%) for males and 5 to 9 minutes (821 commuters, 40.7%) for females.
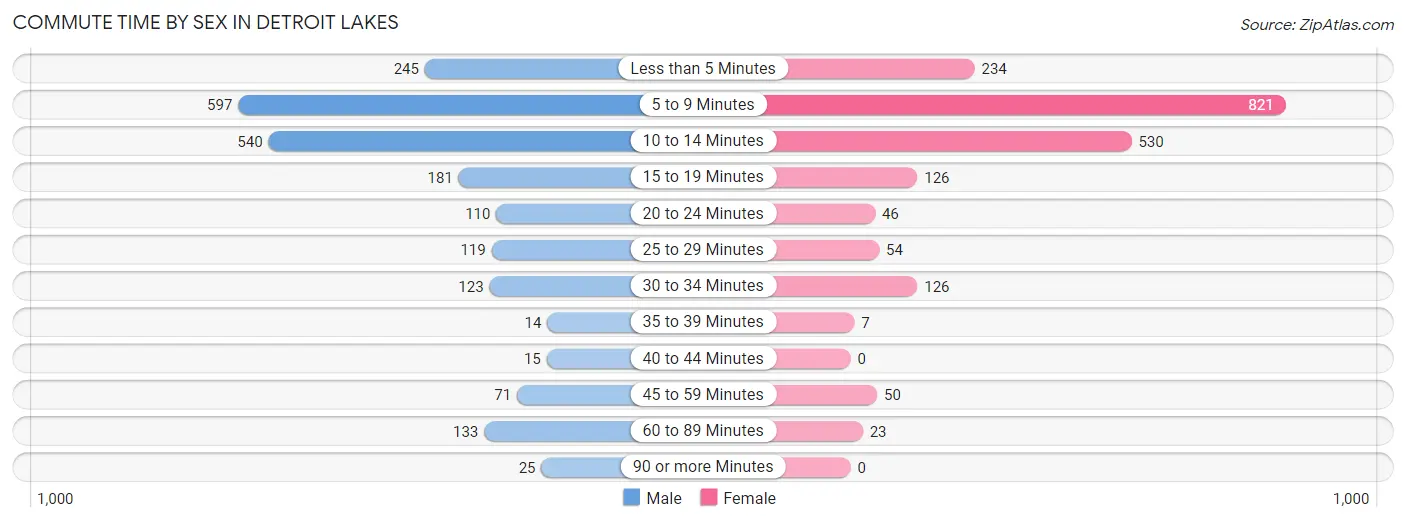
| Commute Time | Male | Female |
| Less than 5 Minutes | 245 (11.3%) | 234 (11.6%) |
| 5 to 9 Minutes | 597 (27.5%) | 821 (40.7%) |
| 10 to 14 Minutes | 540 (24.8%) | 530 (26.3%) |
| 15 to 19 Minutes | 181 (8.3%) | 126 (6.2%) |
| 20 to 24 Minutes | 110 (5.1%) | 46 (2.3%) |
| 25 to 29 Minutes | 119 (5.5%) | 54 (2.7%) |
| 30 to 34 Minutes | 123 (5.7%) | 126 (6.2%) |
| 35 to 39 Minutes | 14 (0.6%) | 7 (0.4%) |
| 40 to 44 Minutes | 15 (0.7%) | 0 (0.0%) |
| 45 to 59 Minutes | 71 (3.3%) | 50 (2.5%) |
| 60 to 89 Minutes | 133 (6.1%) | 23 (1.1%) |
| 90 or more Minutes | 25 (1.1%) | 0 (0.0%) |
Time of Departure to Work by Sex in Detroit Lakes
The most frequent times of departure to work in Detroit Lakes are 12:00 PM to 3:59 PM (295, 13.6%) for males and 7:30 AM to 7:59 AM (514, 25.5%) for females.
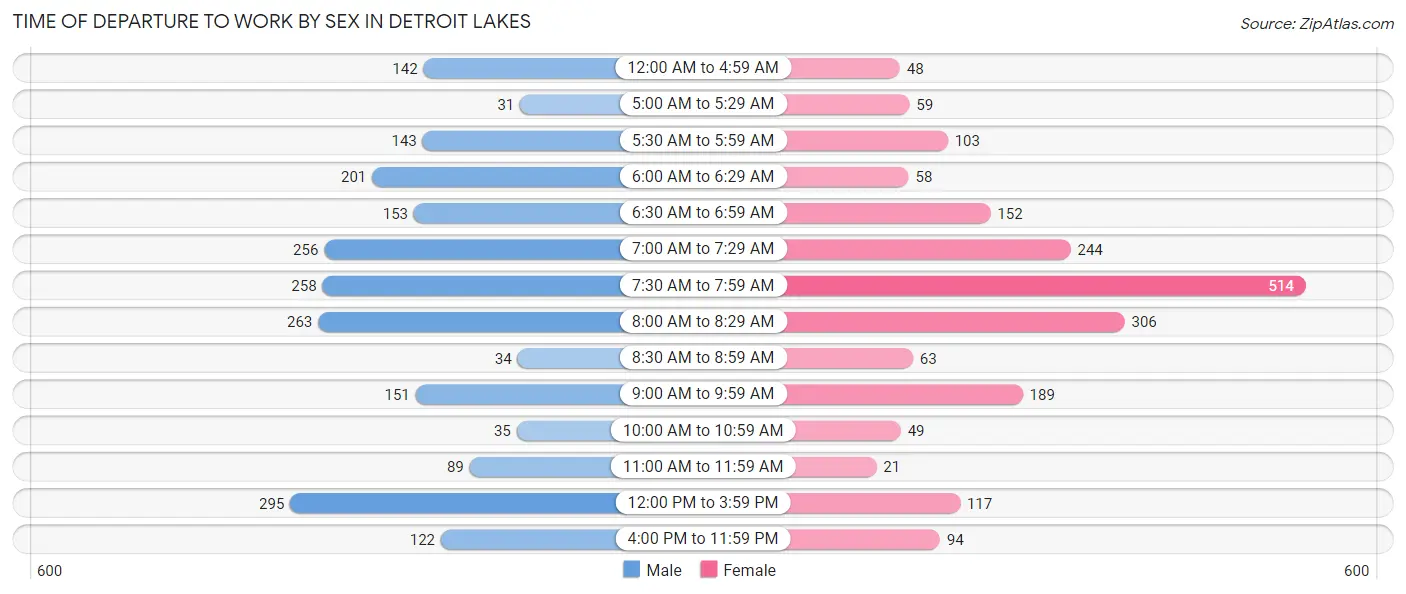
| Time of Departure | Male | Female |
| 12:00 AM to 4:59 AM | 142 (6.5%) | 48 (2.4%) |
| 5:00 AM to 5:29 AM | 31 (1.4%) | 59 (2.9%) |
| 5:30 AM to 5:59 AM | 143 (6.6%) | 103 (5.1%) |
| 6:00 AM to 6:29 AM | 201 (9.2%) | 58 (2.9%) |
| 6:30 AM to 6:59 AM | 153 (7.0%) | 152 (7.5%) |
| 7:00 AM to 7:29 AM | 256 (11.8%) | 244 (12.1%) |
| 7:30 AM to 7:59 AM | 258 (11.9%) | 514 (25.5%) |
| 8:00 AM to 8:29 AM | 263 (12.1%) | 306 (15.2%) |
| 8:30 AM to 8:59 AM | 34 (1.6%) | 63 (3.1%) |
| 9:00 AM to 9:59 AM | 151 (7.0%) | 189 (9.4%) |
| 10:00 AM to 10:59 AM | 35 (1.6%) | 49 (2.4%) |
| 11:00 AM to 11:59 AM | 89 (4.1%) | 21 (1.0%) |
| 12:00 PM to 3:59 PM | 295 (13.6%) | 117 (5.8%) |
| 4:00 PM to 11:59 PM | 122 (5.6%) | 94 (4.7%) |
| Total | 2,173 (100.0%) | 2,017 (100.0%) |
Housing Occupancy in Detroit Lakes
Occupancy by Ownership in Detroit Lakes
Of the total 4,190 dwellings in Detroit Lakes, owner-occupied units account for 2,486 (59.3%), while renter-occupied units make up 1,704 (40.7%).
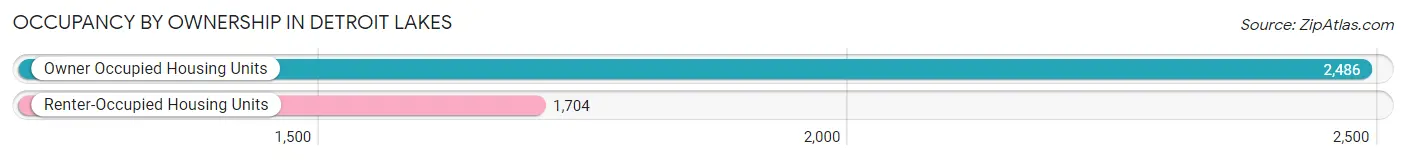
| Occupancy | # Housing Units | % Housing Units |
| Owner Occupied Housing Units | 2,486 | 59.3% |
| Renter-Occupied Housing Units | 1,704 | 40.7% |
| Total Occupied Housing Units | 4,190 | 100.0% |
Occupancy by Household Size in Detroit Lakes
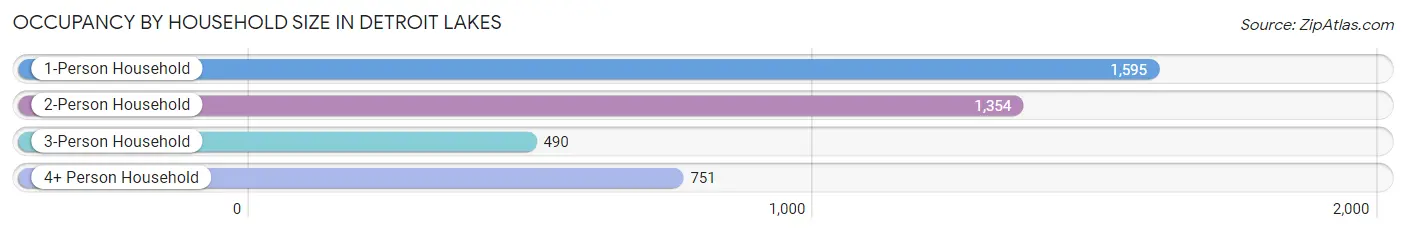
| Household Size | # Housing Units | % Housing Units |
| 1-Person Household | 1,595 | 38.1% |
| 2-Person Household | 1,354 | 32.3% |
| 3-Person Household | 490 | 11.7% |
| 4+ Person Household | 751 | 17.9% |
| Total Housing Units | 4,190 | 100.0% |
Occupancy by Ownership by Household Size in Detroit Lakes
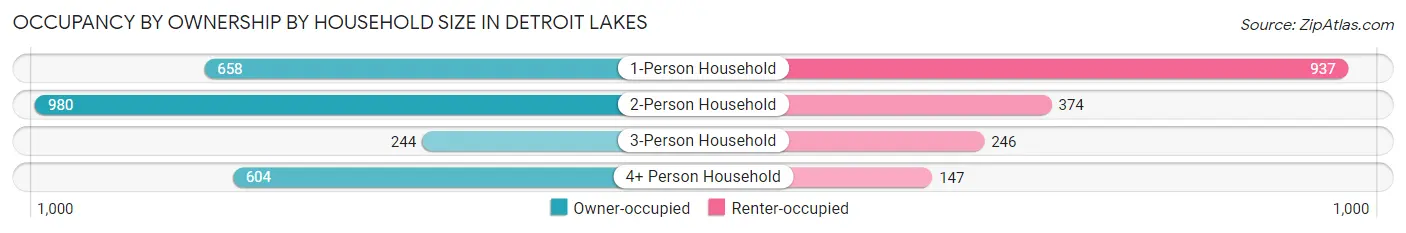
| Household Size | Owner-occupied | Renter-occupied |
| 1-Person Household | 658 (41.2%) | 937 (58.8%) |
| 2-Person Household | 980 (72.4%) | 374 (27.6%) |
| 3-Person Household | 244 (49.8%) | 246 (50.2%) |
| 4+ Person Household | 604 (80.4%) | 147 (19.6%) |
| Total Housing Units | 2,486 (59.3%) | 1,704 (40.7%) |
Occupancy by Educational Attainment in Detroit Lakes
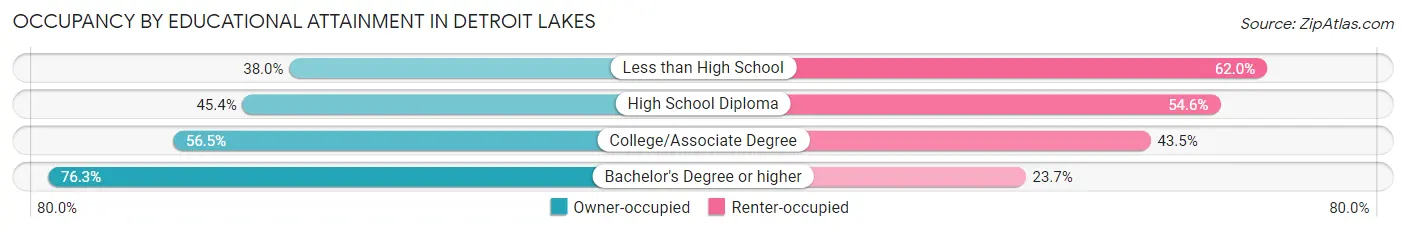
| Household Size | Owner-occupied | Renter-occupied |
| Less than High School | 92 (38.0%) | 150 (62.0%) |
| High School Diploma | 448 (45.4%) | 538 (54.6%) |
| College/Associate Degree | 896 (56.5%) | 690 (43.5%) |
| Bachelor's Degree or higher | 1,050 (76.3%) | 326 (23.7%) |
Occupancy by Age of Householder in Detroit Lakes
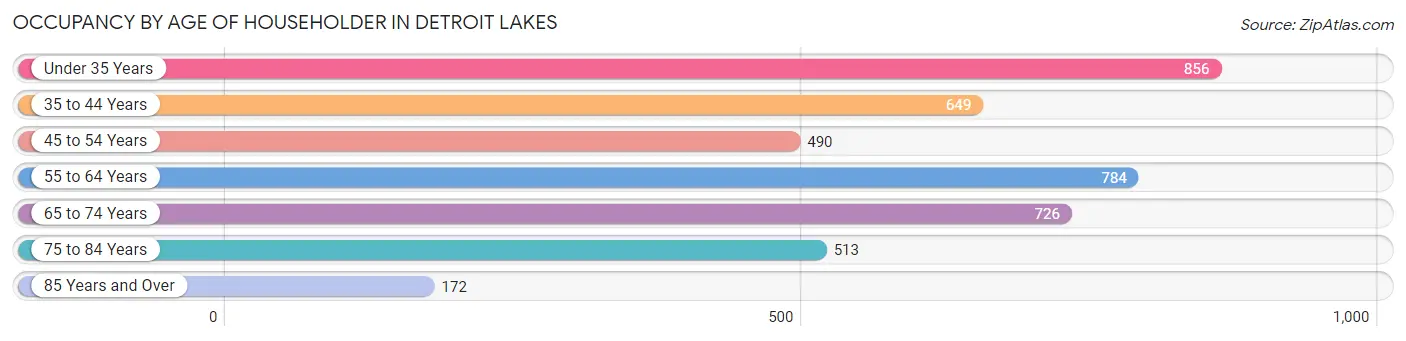
| Age Bracket | # Households | % Households |
| Under 35 Years | 856 | 20.4% |
| 35 to 44 Years | 649 | 15.5% |
| 45 to 54 Years | 490 | 11.7% |
| 55 to 64 Years | 784 | 18.7% |
| 65 to 74 Years | 726 | 17.3% |
| 75 to 84 Years | 513 | 12.2% |
| 85 Years and Over | 172 | 4.1% |
| Total | 4,190 | 100.0% |
Housing Finances in Detroit Lakes
Median Income by Occupancy in Detroit Lakes
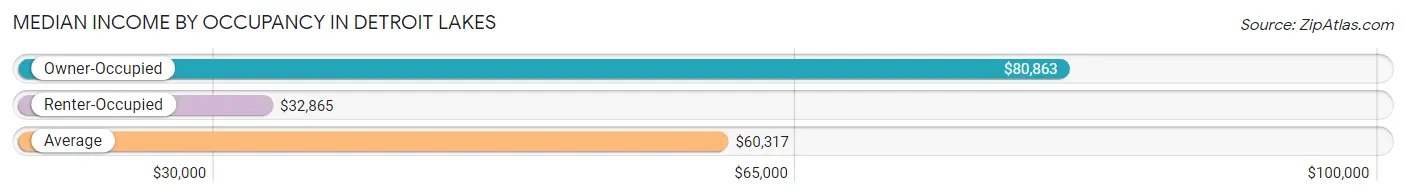
| Occupancy Type | # Households | Median Income |
| Owner-Occupied | 2,486 (59.3%) | $80,863 |
| Renter-Occupied | 1,704 (40.7%) | $32,865 |
| Average | 4,190 (100.0%) | $60,317 |
Occupancy by Householder Income Bracket in Detroit Lakes
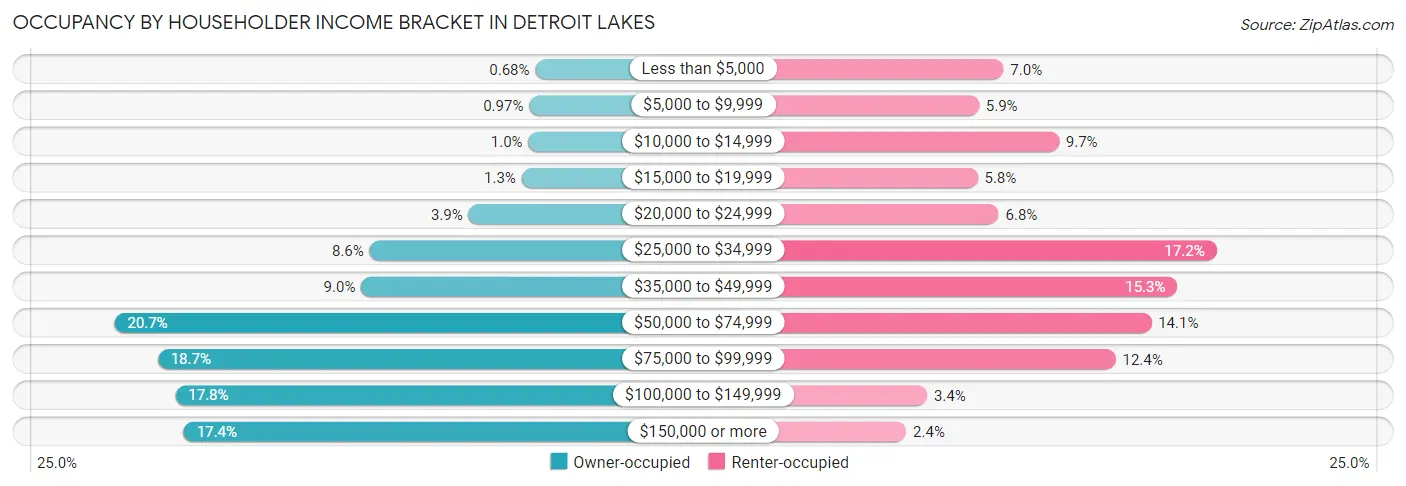
| Income Bracket | Owner-occupied | Renter-occupied |
| Less than $5,000 | 17 (0.7%) | 120 (7.0%) |
| $5,000 to $9,999 | 24 (1.0%) | 100 (5.9%) |
| $10,000 to $14,999 | 25 (1.0%) | 165 (9.7%) |
| $15,000 to $19,999 | 33 (1.3%) | 99 (5.8%) |
| $20,000 to $24,999 | 96 (3.9%) | 116 (6.8%) |
| $25,000 to $34,999 | 213 (8.6%) | 293 (17.2%) |
| $35,000 to $49,999 | 223 (9.0%) | 261 (15.3%) |
| $50,000 to $74,999 | 515 (20.7%) | 240 (14.1%) |
| $75,000 to $99,999 | 464 (18.7%) | 211 (12.4%) |
| $100,000 to $149,999 | 443 (17.8%) | 58 (3.4%) |
| $150,000 or more | 433 (17.4%) | 41 (2.4%) |
| Total | 2,486 (100.0%) | 1,704 (100.0%) |
Monthly Housing Cost Tiers in Detroit Lakes
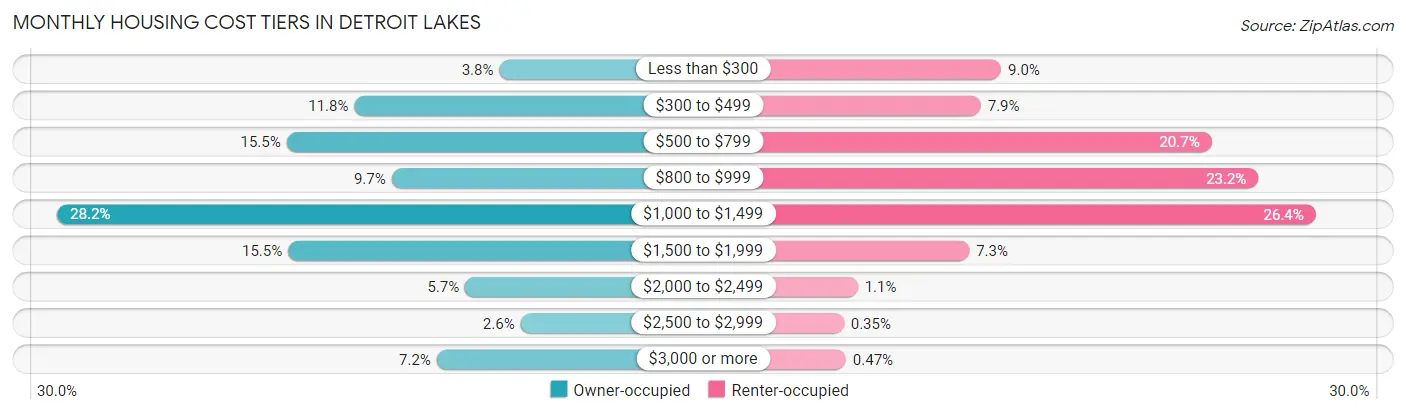
| Monthly Cost | Owner-occupied | Renter-occupied |
| Less than $300 | 94 (3.8%) | 154 (9.0%) |
| $300 to $499 | 293 (11.8%) | 135 (7.9%) |
| $500 to $799 | 386 (15.5%) | 352 (20.7%) |
| $800 to $999 | 242 (9.7%) | 396 (23.2%) |
| $1,000 to $1,499 | 701 (28.2%) | 450 (26.4%) |
| $1,500 to $1,999 | 384 (15.4%) | 124 (7.3%) |
| $2,000 to $2,499 | 141 (5.7%) | 19 (1.1%) |
| $2,500 to $2,999 | 65 (2.6%) | 6 (0.4%) |
| $3,000 or more | 180 (7.2%) | 8 (0.5%) |
| Total | 2,486 (100.0%) | 1,704 (100.0%) |
Physical Housing Characteristics in Detroit Lakes
Housing Structures in Detroit Lakes
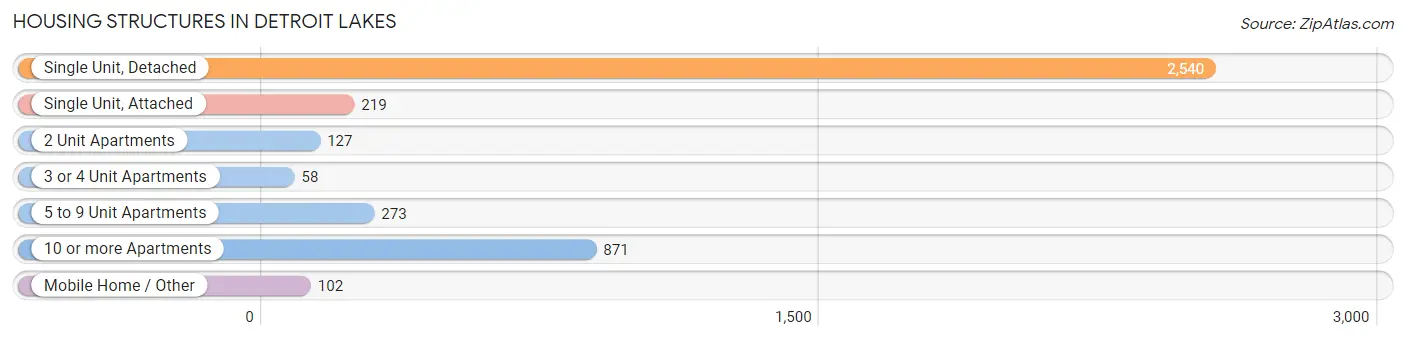
| Structure Type | # Housing Units | % Housing Units |
| Single Unit, Detached | 2,540 | 60.6% |
| Single Unit, Attached | 219 | 5.2% |
| 2 Unit Apartments | 127 | 3.0% |
| 3 or 4 Unit Apartments | 58 | 1.4% |
| 5 to 9 Unit Apartments | 273 | 6.5% |
| 10 or more Apartments | 871 | 20.8% |
| Mobile Home / Other | 102 | 2.4% |
| Total | 4,190 | 100.0% |
Housing Structures by Occupancy in Detroit Lakes
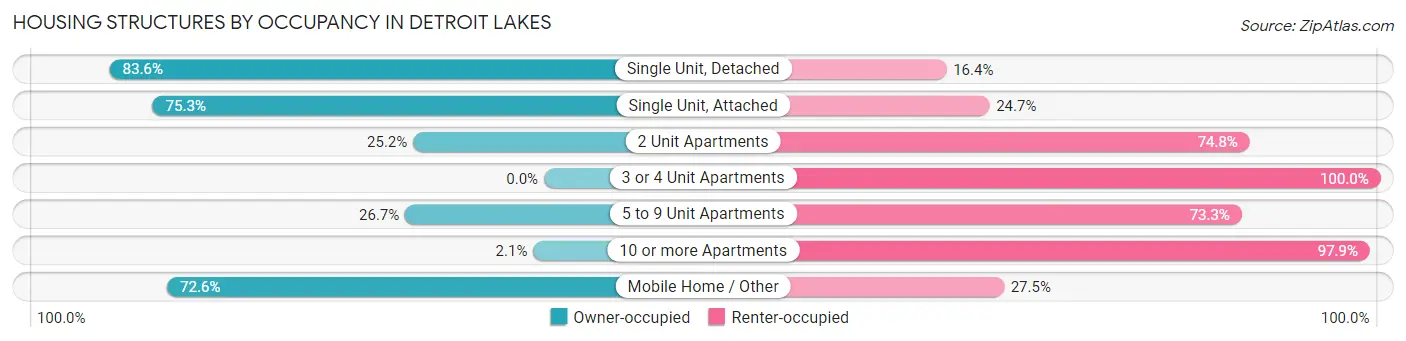
| Structure Type | Owner-occupied | Renter-occupied |
| Single Unit, Detached | 2,124 (83.6%) | 416 (16.4%) |
| Single Unit, Attached | 165 (75.3%) | 54 (24.7%) |
| 2 Unit Apartments | 32 (25.2%) | 95 (74.8%) |
| 3 or 4 Unit Apartments | 0 (0.0%) | 58 (100.0%) |
| 5 to 9 Unit Apartments | 73 (26.7%) | 200 (73.3%) |
| 10 or more Apartments | 18 (2.1%) | 853 (97.9%) |
| Mobile Home / Other | 74 (72.6%) | 28 (27.5%) |
| Total | 2,486 (59.3%) | 1,704 (40.7%) |
Housing Structures by Number of Rooms in Detroit Lakes
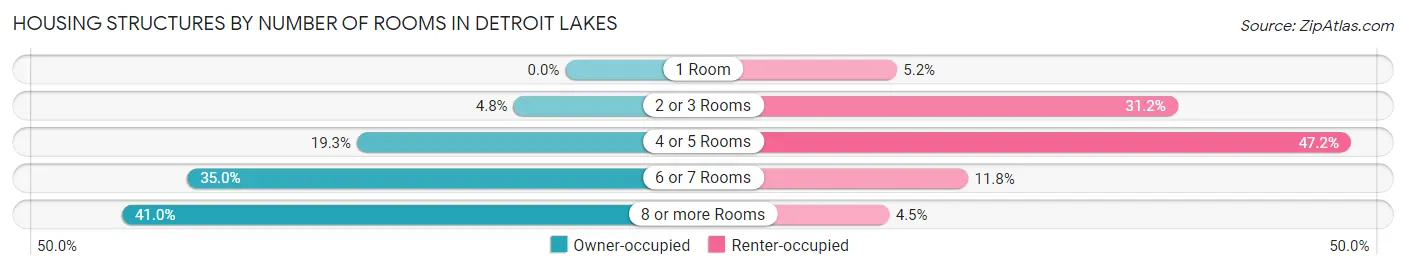
| Number of Rooms | Owner-occupied | Renter-occupied |
| 1 Room | 0 (0.0%) | 89 (5.2%) |
| 2 or 3 Rooms | 119 (4.8%) | 532 (31.2%) |
| 4 or 5 Rooms | 479 (19.3%) | 805 (47.2%) |
| 6 or 7 Rooms | 869 (35.0%) | 201 (11.8%) |
| 8 or more Rooms | 1,019 (41.0%) | 77 (4.5%) |
| Total | 2,486 (100.0%) | 1,704 (100.0%) |
Housing Structure by Heating Type in Detroit Lakes
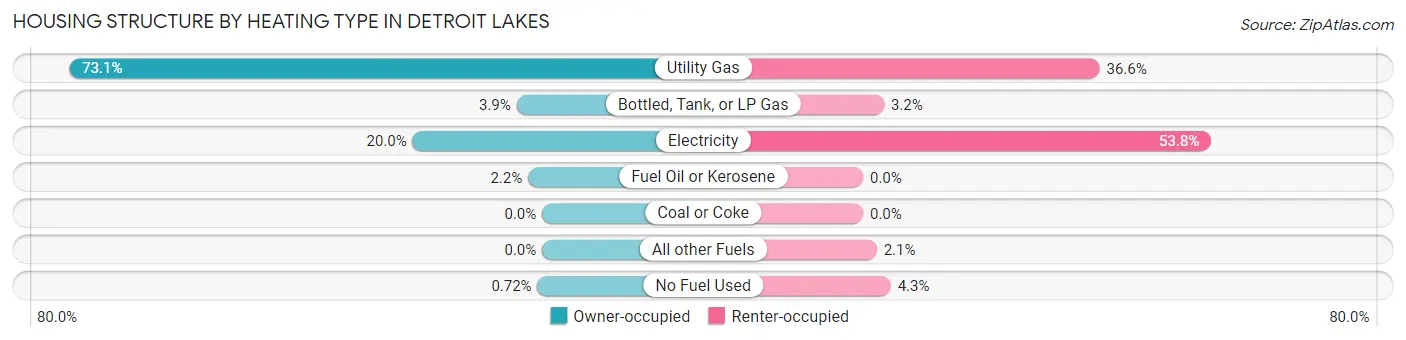
| Heating Type | Owner-occupied | Renter-occupied |
| Utility Gas | 1,818 (73.1%) | 623 (36.6%) |
| Bottled, Tank, or LP Gas | 98 (3.9%) | 55 (3.2%) |
| Electricity | 498 (20.0%) | 917 (53.8%) |
| Fuel Oil or Kerosene | 54 (2.2%) | 0 (0.0%) |
| Coal or Coke | 0 (0.0%) | 0 (0.0%) |
| All other Fuels | 0 (0.0%) | 36 (2.1%) |
| No Fuel Used | 18 (0.7%) | 73 (4.3%) |
| Total | 2,486 (100.0%) | 1,704 (100.0%) |
Household Vehicle Usage in Detroit Lakes
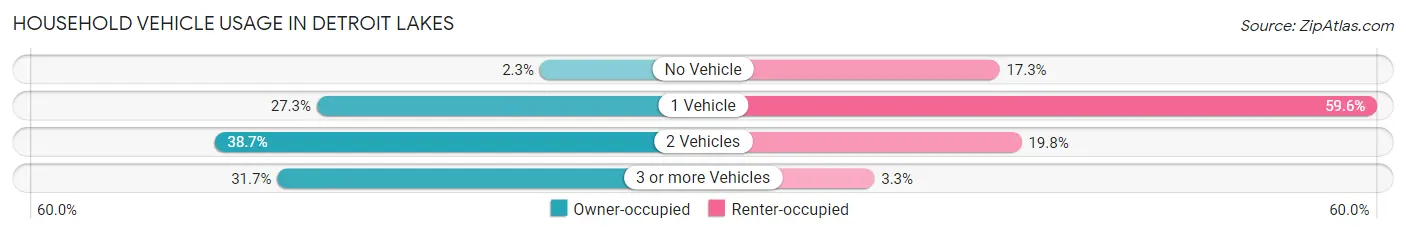
| Vehicles per Household | Owner-occupied | Renter-occupied |
| No Vehicle | 57 (2.3%) | 295 (17.3%) |
| 1 Vehicle | 678 (27.3%) | 1,016 (59.6%) |
| 2 Vehicles | 963 (38.7%) | 337 (19.8%) |
| 3 or more Vehicles | 788 (31.7%) | 56 (3.3%) |
| Total | 2,486 (100.0%) | 1,704 (100.0%) |
Real Estate & Mortgages in Detroit Lakes
Real Estate and Mortgage Overview in Detroit Lakes
| Characteristic | Without Mortgage | With Mortgage |
| Housing Units | 961 | 1,525 |
| Median Property Value | $269,000 | $226,100 |
| Median Household Income | $62,039 | $341 |
| Monthly Housing Costs | $571 | $180 |
| Real Estate Taxes | $2,262 | $6 |
Property Value by Mortgage Status in Detroit Lakes
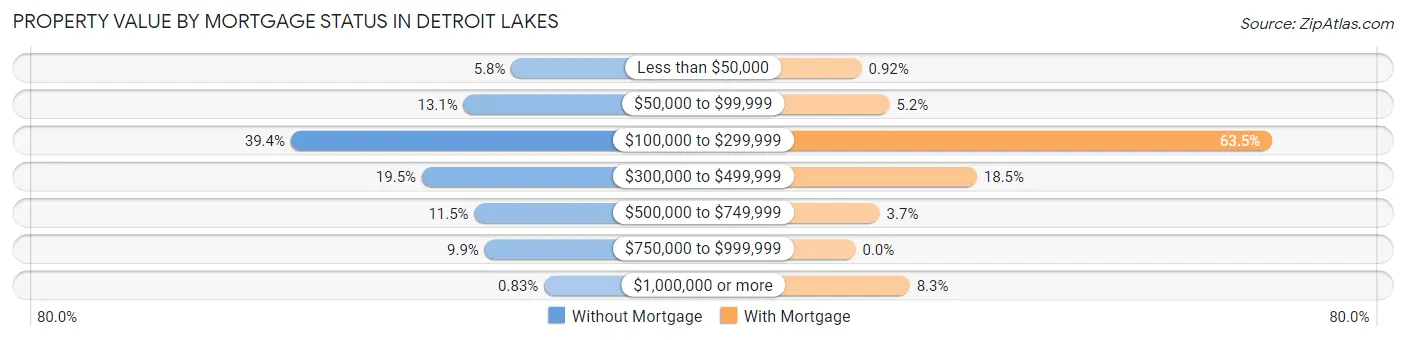
| Property Value | Without Mortgage | With Mortgage |
| Less than $50,000 | 56 (5.8%) | 14 (0.9%) |
| $50,000 to $99,999 | 126 (13.1%) | 79 (5.2%) |
| $100,000 to $299,999 | 379 (39.4%) | 968 (63.5%) |
| $300,000 to $499,999 | 187 (19.5%) | 282 (18.5%) |
| $500,000 to $749,999 | 110 (11.5%) | 56 (3.7%) |
| $750,000 to $999,999 | 95 (9.9%) | 0 (0.0%) |
| $1,000,000 or more | 8 (0.8%) | 126 (8.3%) |
| Total | 961 (100.0%) | 1,525 (100.0%) |
Household Income by Mortgage Status in Detroit Lakes
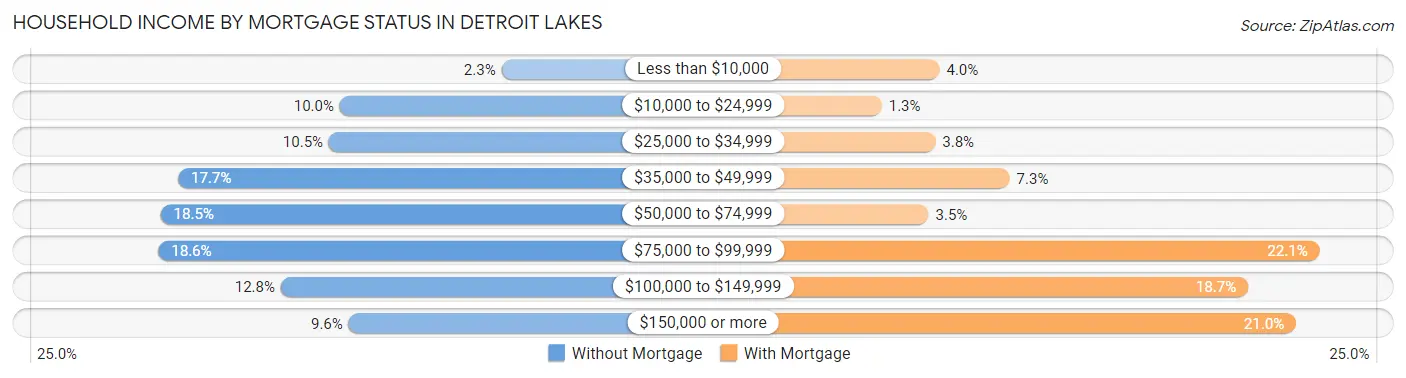
| Household Income | Without Mortgage | With Mortgage |
| Less than $10,000 | 22 (2.3%) | 61 (4.0%) |
| $10,000 to $24,999 | 96 (10.0%) | 19 (1.3%) |
| $25,000 to $34,999 | 101 (10.5%) | 58 (3.8%) |
| $35,000 to $49,999 | 170 (17.7%) | 112 (7.3%) |
| $50,000 to $74,999 | 178 (18.5%) | 53 (3.5%) |
| $75,000 to $99,999 | 179 (18.6%) | 337 (22.1%) |
| $100,000 to $149,999 | 123 (12.8%) | 285 (18.7%) |
| $150,000 or more | 92 (9.6%) | 320 (21.0%) |
| Total | 961 (100.0%) | 1,525 (100.0%) |
Property Value to Household Income Ratio in Detroit Lakes
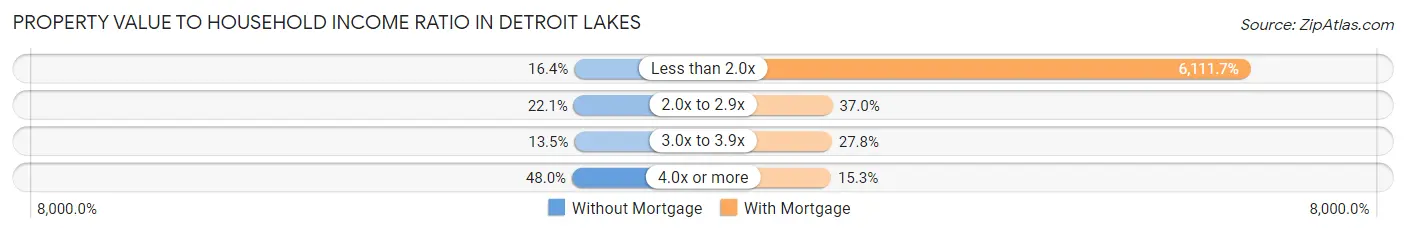
| Value-to-Income Ratio | Without Mortgage | With Mortgage |
| Less than 2.0x | 158 (16.4%) | 93,203 (6,111.7%) |
| 2.0x to 2.9x | 212 (22.1%) | 564 (37.0%) |
| 3.0x to 3.9x | 130 (13.5%) | 424 (27.8%) |
| 4.0x or more | 461 (48.0%) | 234 (15.3%) |
| Total | 961 (100.0%) | 1,525 (100.0%) |
Real Estate Taxes by Mortgage Status in Detroit Lakes
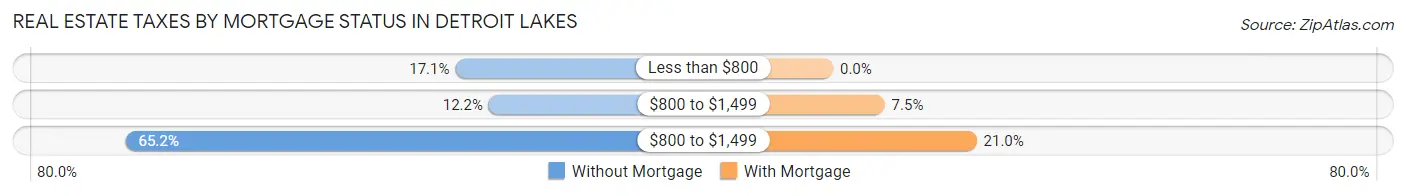
| Property Taxes | Without Mortgage | With Mortgage |
| Less than $800 | 164 (17.1%) | 0 (0.0%) |
| $800 to $1,499 | 117 (12.2%) | 115 (7.5%) |
| $800 to $1,499 | 627 (65.2%) | 320 (21.0%) |
| Total | 961 (100.0%) | 1,525 (100.0%) |
Health & Disability in Detroit Lakes
Health Insurance Coverage by Age in Detroit Lakes
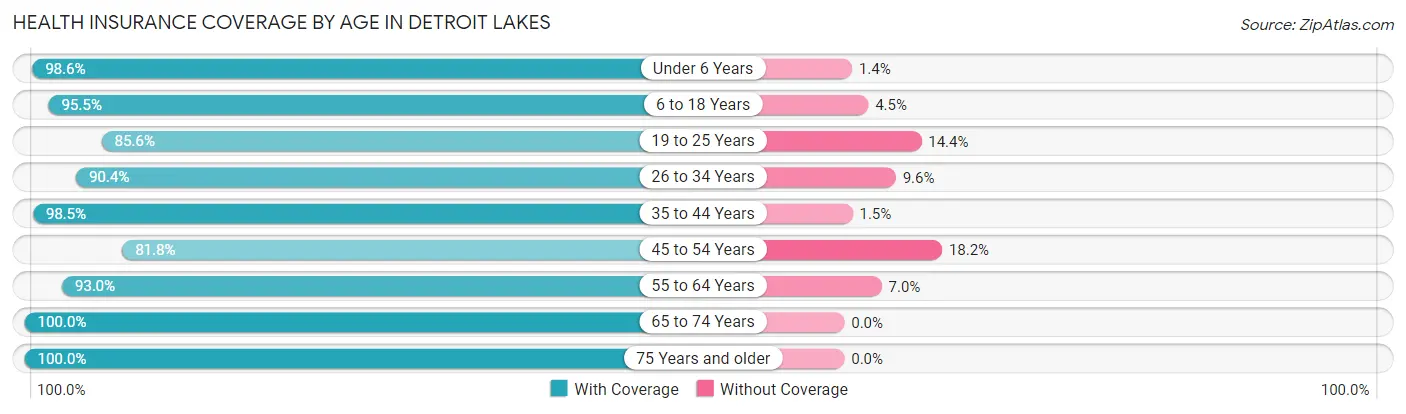
| Age Bracket | With Coverage | Without Coverage |
| Under 6 Years | 828 (98.6%) | 12 (1.4%) |
| 6 to 18 Years | 1,563 (95.5%) | 73 (4.5%) |
| 19 to 25 Years | 650 (85.6%) | 109 (14.4%) |
| 26 to 34 Years | 1,009 (90.4%) | 107 (9.6%) |
| 35 to 44 Years | 1,151 (98.5%) | 18 (1.5%) |
| 45 to 54 Years | 687 (81.8%) | 153 (18.2%) |
| 55 to 64 Years | 1,149 (93.0%) | 86 (7.0%) |
| 65 to 74 Years | 1,108 (100.0%) | 0 (0.0%) |
| 75 Years and older | 974 (100.0%) | 0 (0.0%) |
| Total | 9,119 (94.2%) | 558 (5.8%) |
Health Insurance Coverage by Citizenship Status in Detroit Lakes
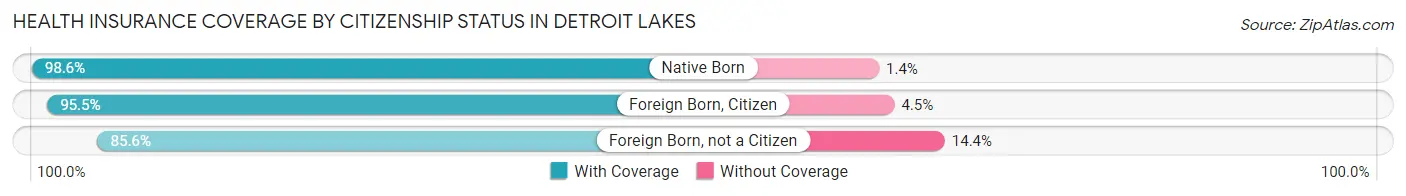
| Citizenship Status | With Coverage | Without Coverage |
| Native Born | 828 (98.6%) | 12 (1.4%) |
| Foreign Born, Citizen | 1,563 (95.5%) | 73 (4.5%) |
| Foreign Born, not a Citizen | 650 (85.6%) | 109 (14.4%) |
Health Insurance Coverage by Household Income in Detroit Lakes
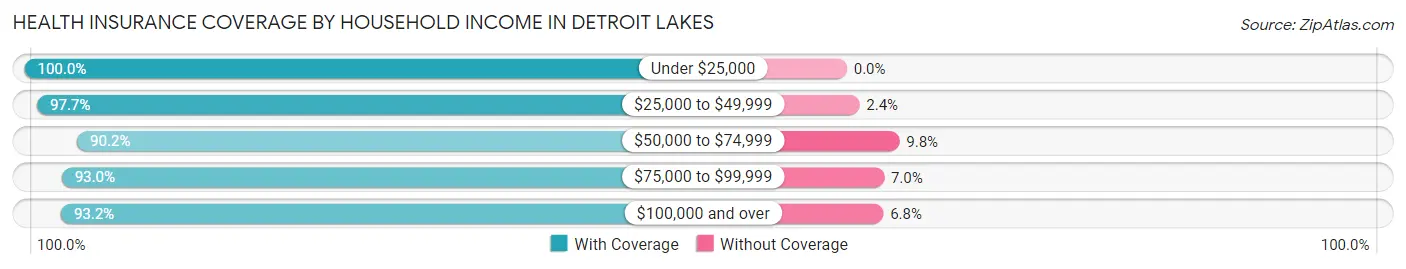
| Household Income | With Coverage | Without Coverage |
| Under $25,000 | 1,100 (100.0%) | 0 (0.0%) |
| $25,000 to $49,999 | 1,700 (97.7%) | 41 (2.4%) |
| $50,000 to $74,999 | 1,613 (90.2%) | 176 (9.8%) |
| $75,000 to $99,999 | 1,605 (93.0%) | 120 (7.0%) |
| $100,000 and over | 3,018 (93.2%) | 221 (6.8%) |
Public vs Private Health Insurance Coverage by Age in Detroit Lakes
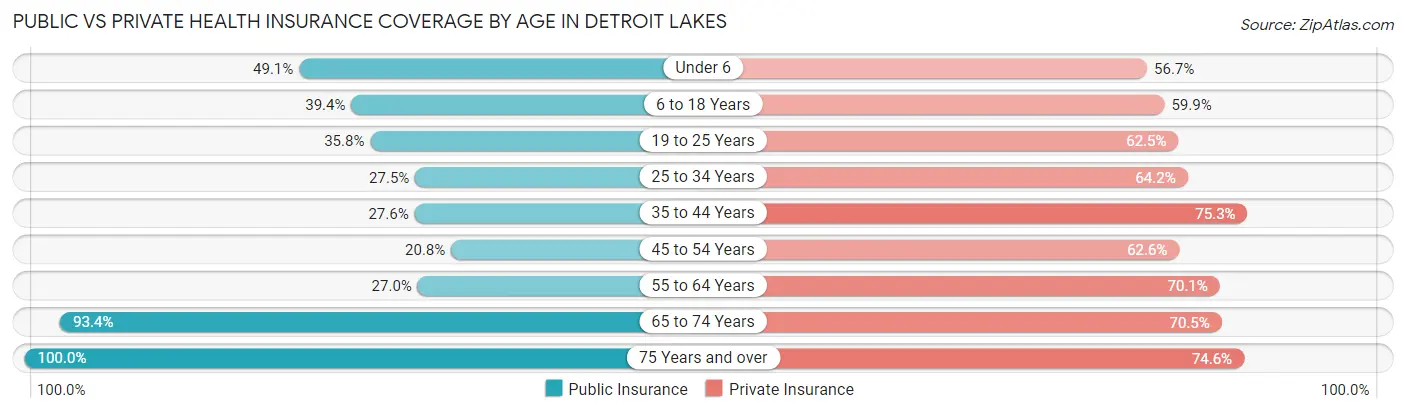
| Age Bracket | Public Insurance | Private Insurance |
| Under 6 | 412 (49.0%) | 476 (56.7%) |
| 6 to 18 Years | 644 (39.4%) | 980 (59.9%) |
| 19 to 25 Years | 272 (35.8%) | 474 (62.5%) |
| 25 to 34 Years | 307 (27.5%) | 716 (64.2%) |
| 35 to 44 Years | 323 (27.6%) | 880 (75.3%) |
| 45 to 54 Years | 175 (20.8%) | 526 (62.6%) |
| 55 to 64 Years | 334 (27.0%) | 866 (70.1%) |
| 65 to 74 Years | 1,035 (93.4%) | 781 (70.5%) |
| 75 Years and over | 974 (100.0%) | 727 (74.6%) |
| Total | 4,476 (46.3%) | 6,426 (66.4%) |
Disability Status by Sex by Age in Detroit Lakes
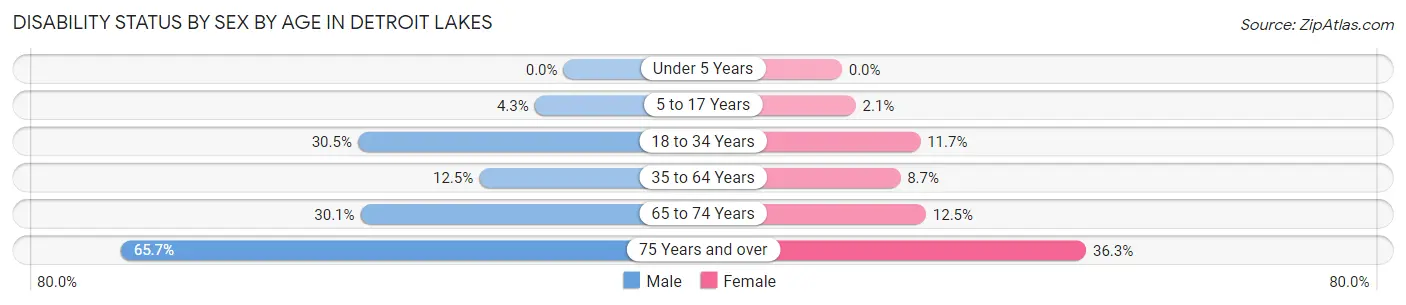
| Age Bracket | Male | Female |
| Under 5 Years | 0 (0.0%) | 0 (0.0%) |
| 5 to 17 Years | 37 (4.3%) | 17 (2.1%) |
| 18 to 34 Years | 338 (30.5%) | 109 (11.7%) |
| 35 to 64 Years | 197 (12.5%) | 145 (8.7%) |
| 65 to 74 Years | 148 (30.1%) | 77 (12.5%) |
| 75 Years and over | 274 (65.7%) | 202 (36.3%) |
Disability Class by Sex by Age in Detroit Lakes
Disability Class: Hearing Difficulty

| Age Bracket | Male | Female |
| Under 5 Years | 0 (0.0%) | 0 (0.0%) |
| 5 to 17 Years | 0 (0.0%) | 0 (0.0%) |
| 18 to 34 Years | 0 (0.0%) | 48 (5.1%) |
| 35 to 64 Years | 16 (1.0%) | 5 (0.3%) |
| 65 to 74 Years | 62 (12.6%) | 10 (1.6%) |
| 75 Years and over | 160 (38.4%) | 39 (7.0%) |
Disability Class: Vision Difficulty
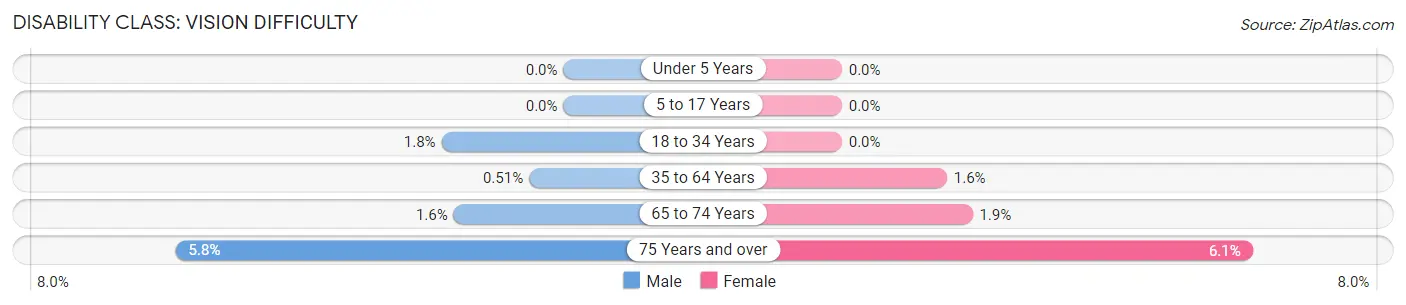
| Age Bracket | Male | Female |
| Under 5 Years | 0 (0.0%) | 0 (0.0%) |
| 5 to 17 Years | 0 (0.0%) | 0 (0.0%) |
| 18 to 34 Years | 20 (1.8%) | 0 (0.0%) |
| 35 to 64 Years | 8 (0.5%) | 26 (1.6%) |
| 65 to 74 Years | 8 (1.6%) | 12 (1.9%) |
| 75 Years and over | 24 (5.8%) | 34 (6.1%) |
Disability Class: Cognitive Difficulty
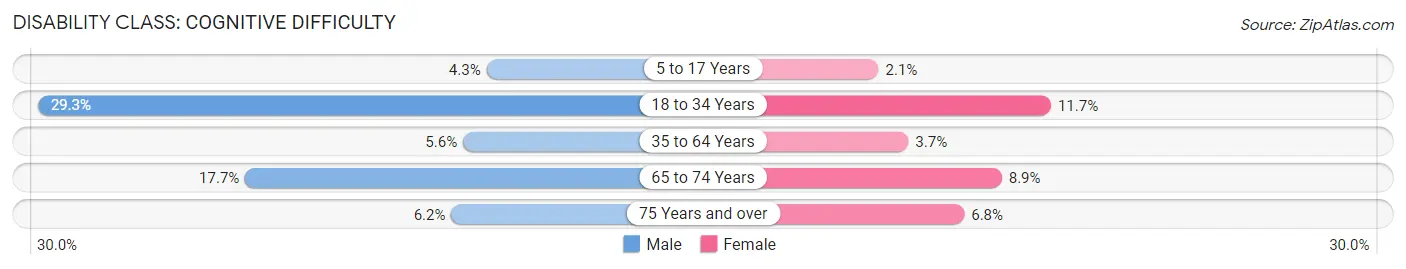
| Age Bracket | Male | Female |
| 5 to 17 Years | 37 (4.3%) | 17 (2.1%) |
| 18 to 34 Years | 324 (29.3%) | 109 (11.7%) |
| 35 to 64 Years | 88 (5.6%) | 62 (3.7%) |
| 65 to 74 Years | 87 (17.7%) | 55 (8.9%) |
| 75 Years and over | 26 (6.2%) | 38 (6.8%) |
Disability Class: Ambulatory Difficulty
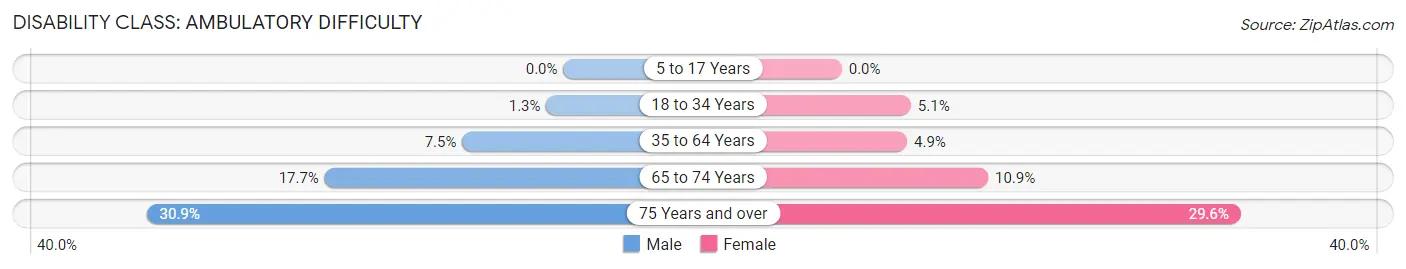
| Age Bracket | Male | Female |
| 5 to 17 Years | 0 (0.0%) | 0 (0.0%) |
| 18 to 34 Years | 14 (1.3%) | 48 (5.1%) |
| 35 to 64 Years | 118 (7.5%) | 81 (4.9%) |
| 65 to 74 Years | 87 (17.7%) | 67 (10.9%) |
| 75 Years and over | 129 (30.9%) | 165 (29.6%) |
Disability Class: Self-Care Difficulty
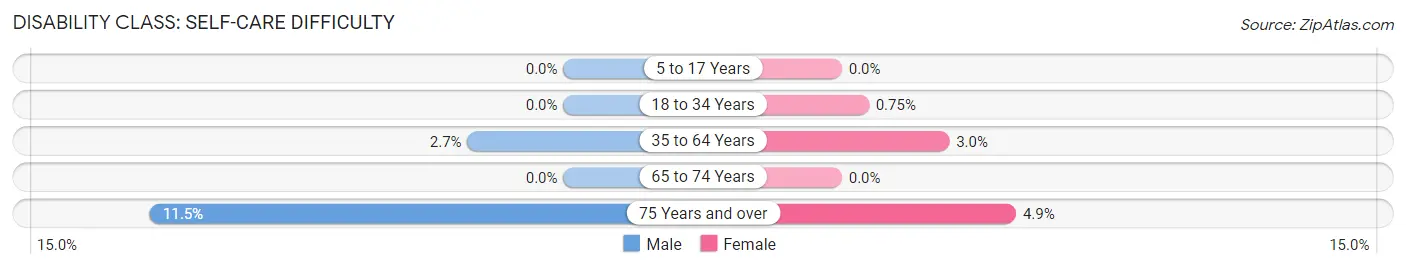
| Age Bracket | Male | Female |
| 5 to 17 Years | 0 (0.0%) | 0 (0.0%) |
| 18 to 34 Years | 0 (0.0%) | 7 (0.7%) |
| 35 to 64 Years | 42 (2.7%) | 50 (3.0%) |
| 65 to 74 Years | 0 (0.0%) | 0 (0.0%) |
| 75 Years and over | 48 (11.5%) | 27 (4.9%) |
Technology Access in Detroit Lakes
Computing Device Access in Detroit Lakes
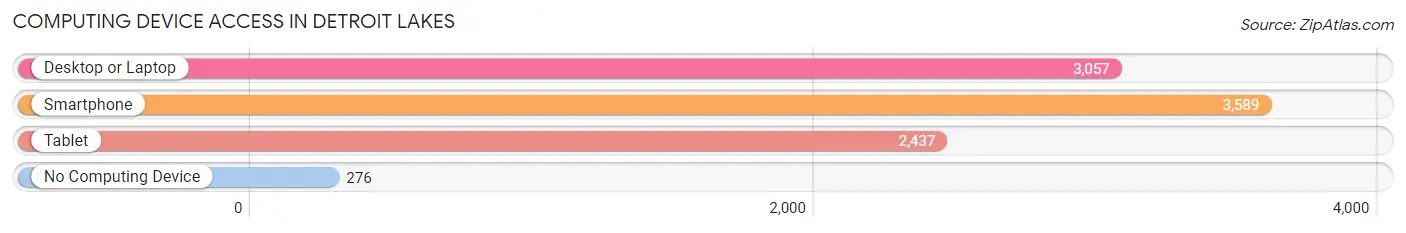
| Device Type | # Households | % Households |
| Desktop or Laptop | 3,057 | 73.0% |
| Smartphone | 3,589 | 85.7% |
| Tablet | 2,437 | 58.2% |
| No Computing Device | 276 | 6.6% |
| Total | 4,190 | 100.0% |
Internet Access in Detroit Lakes
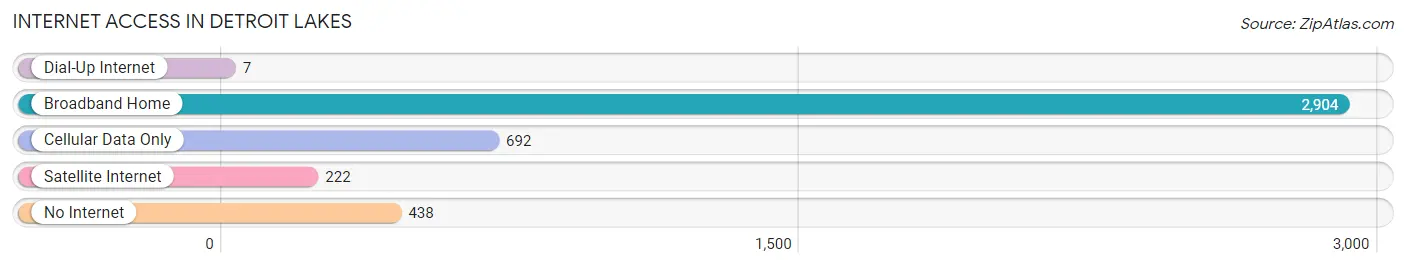
| Internet Type | # Households | % Households |
| Dial-Up Internet | 7 | 0.2% |
| Broadband Home | 2,904 | 69.3% |
| Cellular Data Only | 692 | 16.5% |
| Satellite Internet | 222 | 5.3% |
| No Internet | 438 | 10.4% |
| Total | 4,190 | 100.0% |
Detroit Lakes Summary
History
The city of Detroit Lakes, Minnesota is located in Becker County and is the county seat. It is situated on the western shore of the largest natural lake in the state, Detroit Lake. The city was founded in 1871 and was originally known as Detroit. The name was changed to Detroit Lakes in 1926.
The area was first inhabited by the Ojibwe people, who were the original inhabitants of the region. The first European settlers arrived in the area in the late 1800s. The city was officially incorporated in 1891.
The city was initially a logging and farming community, but it soon became a popular tourist destination. The city was known for its resorts and hotels, which attracted visitors from all over the country. The city was also known for its fishing and hunting opportunities.
In the early 1900s, the city began to develop its infrastructure. The first paved road was built in 1910, and the first electric street lights were installed in 1912. The city also built a water system and a sewage system.
The city continued to grow and develop throughout the 20th century. In the 1950s, the city began to attract more tourists, and the city's economy began to diversify. The city also began to attract more businesses, and the population began to grow.
Geography
Detroit Lakes is located in the northwestern part of Minnesota, in Becker County. It is situated on the western shore of Detroit Lake, the largest natural lake in the state. The city is located about 90 miles northwest of Minneapolis and about 40 miles east of Fargo, North Dakota.
The city has a total area of 8.3 square miles, of which 8.2 square miles is land and 0.1 square miles is water. The city is located in a flat, low-lying area, with an elevation of 1,072 feet above sea level.
The climate in Detroit Lakes is classified as humid continental, with cold winters and warm summers. The average annual temperature is 40.2 degrees Fahrenheit, and the average annual precipitation is 28.3 inches.
Economy
The economy of Detroit Lakes is largely based on tourism and services. The city is a popular tourist destination, and it is home to several resorts and hotels. The city also has a vibrant retail sector, with several shopping centers and stores.
The city is also home to several manufacturing companies, including a paper mill, a food processing plant, and a printing company. The city is also home to several healthcare facilities, including a hospital and several clinics.
The city's largest employer is the Detroit Lakes Public School District, which employs over 1,000 people. Other major employers include the Detroit Lakes Regional Chamber of Commerce, the Detroit Lakes Community and Cultural Center, and the Detroit Lakes Public Library.
Demographics
As of the 2010 census, the population of Detroit Lakes was 8,569. The population density was 1,033.2 people per square mile. The racial makeup of the city was 94.2% White, 0.7% African American, 0.7% Native American, 0.7% Asian, 0.1% Pacific Islander, 1.7% from other races, and 2.0% from two or more races. Hispanic or Latino of any race were 4.2% of the population.
The median income for a household in the city was $41,945, and the median income for a family was $50,945. The per capita income for the city was $21,845. About 8.2% of families and 11.2% of the population were below the poverty line, including 15.2% of those under age 18 and 8.2% of those age 65 or over.
Common Questions
What is Per Capita Income in Detroit Lakes?
Per Capita income in Detroit Lakes is $42,588.
What is the Median Family Income in Detroit Lakes?
Median Family Income in Detroit Lakes is $82,172.
What is the Median Household income in Detroit Lakes?
Median Household Income in Detroit Lakes is $60,317.
What is Income or Wage Gap in Detroit Lakes?
Income or Wage Gap in Detroit Lakes is 13.4%.
Women in Detroit Lakes earn 86.6 cents for every dollar earned by a man.
What is Family Income Deficit in Detroit Lakes?
Family Income Deficit in Detroit Lakes is $15,238.
Families that are below poverty line in Detroit Lakes earn $15,238 less on average than the poverty threshold level.
What is Inequality or Gini Index in Detroit Lakes?
Inequality or Gini Index in Detroit Lakes is 0.56.
What is the Total Population of Detroit Lakes?
Total Population of Detroit Lakes is 9,966.
What is the Total Male Population of Detroit Lakes?
Total Male Population of Detroit Lakes is 4,868.
What is the Total Female Population of Detroit Lakes?
Total Female Population of Detroit Lakes is 5,098.
What is the Ratio of Males per 100 Females in Detroit Lakes?
There are 95.49 Males per 100 Females in Detroit Lakes.
What is the Ratio of Females per 100 Males in Detroit Lakes?
There are 104.72 Females per 100 Males in Detroit Lakes.
What is the Median Population Age in Detroit Lakes?
Median Population Age in Detroit Lakes is 40.2 Years.
What is the Average Family Size in Detroit Lakes
Average Family Size in Detroit Lakes is 3.0 People.
What is the Average Household Size in Detroit Lakes
Average Household Size in Detroit Lakes is 2.3 People.
How Large is the Labor Force in Detroit Lakes?
There are 4,867 People in the Labor Forcein in Detroit Lakes.
What is the Percentage of People in the Labor Force in Detroit Lakes?
61.9% of People are in the Labor Force in Detroit Lakes.
What is the Unemployment Rate in Detroit Lakes?
Unemployment Rate in Detroit Lakes is 4.7%.