Naytahwaush, MN Map & Demographics
Naytahwaush Map
Naytahwaush Overview
$13,815
PER CAPITA INCOME
$30,625
AVG FAMILY INCOME
$31,111
AVG HOUSEHOLD INCOME
16.3%
WAGE / INCOME GAP [ % ]
83.7¢/ $1
WAGE / INCOME GAP [ $ ]
0.43
INEQUALITY / GINI INDEX
472
TOTAL POPULATION
247
MALE POPULATION
225
FEMALE POPULATION
109.78
MALES / 100 FEMALES
91.09
FEMALES / 100 MALES
24.3
MEDIAN AGE
4.1
AVG FAMILY SIZE
3.3
AVG HOUSEHOLD SIZE
140
LABOR FORCE [ PEOPLE ]
44.3%
PERCENT IN LABOR FORCE
25.0%
UNEMPLOYMENT RATE
Naytahwaush Zip Codes
Naytahwaush Area Codes
Income in Naytahwaush
Income Overview in Naytahwaush
Per Capita Income in Naytahwaush is $13,815, while median incomes of families and households are $30,625 and $31,111 respectively.
| Characteristic | Number | Measure |
| Per Capita Income | 472 | $13,815 |
| Median Family Income | 95 | $30,625 |
| Mean Family Income | 95 | $40,339 |
| Median Household Income | 144 | $31,111 |
| Mean Household Income | 144 | $38,066 |
| Income Deficit | 95 | $0 |
| Wage / Income Gap (%) | 472 | 16.33% |
| Wage / Income Gap ($) | 472 | 83.67¢ per $1 |
| Gini / Inequality Index | 472 | 0.43 |
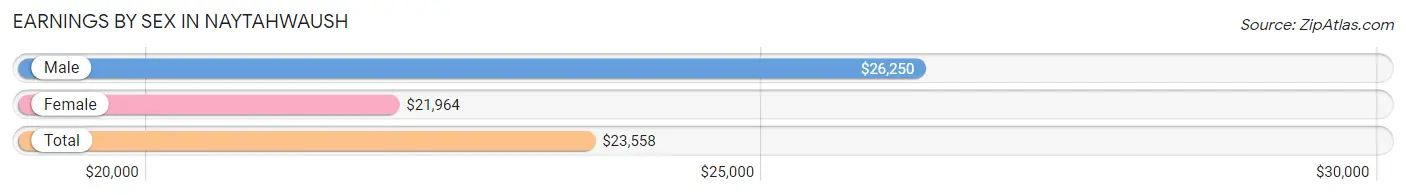
Earnings by Sex in Naytahwaush
Average Earnings in Naytahwaush are $23,558, $26,250 for men and $21,964 for women, a difference of 16.3%.
| Sex | Number | Average Earnings |
| Male | 68 (48.2%) | $26,250 |
| Female | 73 (51.8%) | $21,964 |
| Total | 141 (100.0%) | $23,558 |
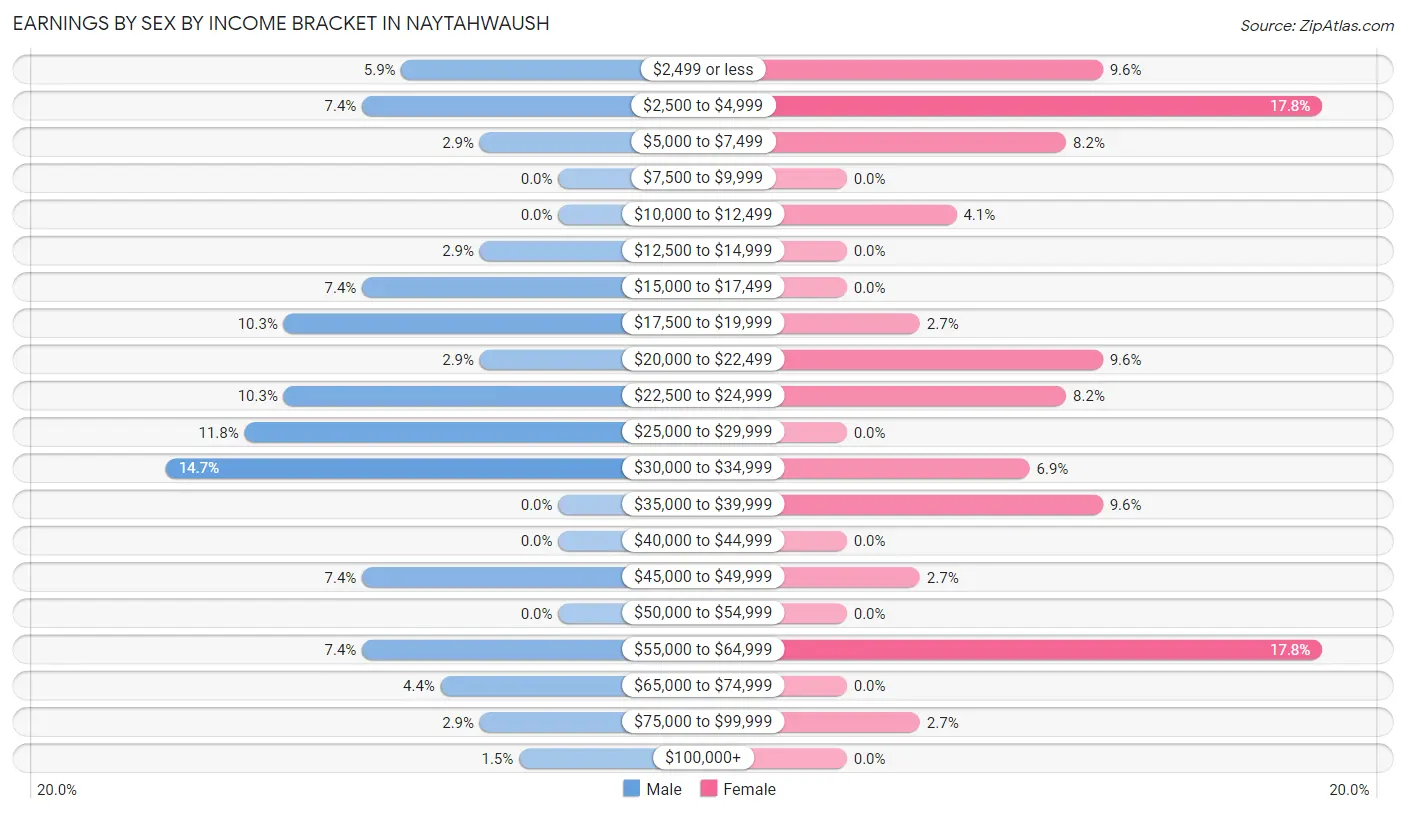
Earnings by Sex by Income Bracket in Naytahwaush
The most common earnings brackets in Naytahwaush are $30,000 to $34,999 for men (10 | 14.7%) and $2,500 to $4,999 for women (13 | 17.8%).
| Income | Male | Female |
| $2,499 or less | 4 (5.9%) | 7 (9.6%) |
| $2,500 to $4,999 | 5 (7.3%) | 13 (17.8%) |
| $5,000 to $7,499 | 2 (2.9%) | 6 (8.2%) |
| $7,500 to $9,999 | 0 (0.0%) | 0 (0.0%) |
| $10,000 to $12,499 | 0 (0.0%) | 3 (4.1%) |
| $12,500 to $14,999 | 2 (2.9%) | 0 (0.0%) |
| $15,000 to $17,499 | 5 (7.3%) | 0 (0.0%) |
| $17,500 to $19,999 | 7 (10.3%) | 2 (2.7%) |
| $20,000 to $22,499 | 2 (2.9%) | 7 (9.6%) |
| $22,500 to $24,999 | 7 (10.3%) | 6 (8.2%) |
| $25,000 to $29,999 | 8 (11.8%) | 0 (0.0%) |
| $30,000 to $34,999 | 10 (14.7%) | 5 (6.9%) |
| $35,000 to $39,999 | 0 (0.0%) | 7 (9.6%) |
| $40,000 to $44,999 | 0 (0.0%) | 0 (0.0%) |
| $45,000 to $49,999 | 5 (7.3%) | 2 (2.7%) |
| $50,000 to $54,999 | 0 (0.0%) | 0 (0.0%) |
| $55,000 to $64,999 | 5 (7.3%) | 13 (17.8%) |
| $65,000 to $74,999 | 3 (4.4%) | 0 (0.0%) |
| $75,000 to $99,999 | 2 (2.9%) | 2 (2.7%) |
| $100,000+ | 1 (1.5%) | 0 (0.0%) |
| Total | 68 (100.0%) | 73 (100.0%) |
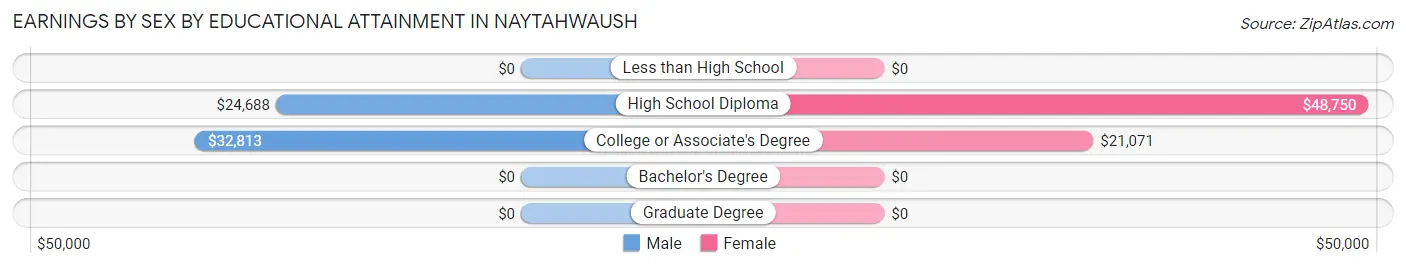
Earnings by Sex by Educational Attainment in Naytahwaush
Average earnings in Naytahwaush are $27,969 for men and $27,500 for women, a difference of 1.7%. Men with an educational attainment of college or associate's degree enjoy the highest average annual earnings of $32,813, while those with high school diploma education earn the least with $24,688. Women with an educational attainment of high school diploma earn the most with the average annual earnings of $48,750, while those with college or associate's degree education have the smallest earnings of $21,071.
| Educational Attainment | Male Income | Female Income |
| Less than High School | - | - |
| High School Diploma | $24,688 | $48,750 |
| College or Associate's Degree | $32,813 | $21,071 |
| Bachelor's Degree | - | - |
| Graduate Degree | - | - |
| Total | $27,969 | $27,500 |
Family Income in Naytahwaush
Family Income Brackets in Naytahwaush
According to the Naytahwaush family income data, there are 19 families falling into the $35,000 to $49,999 income range, which is the most common income bracket and makes up 20.0% of all families.
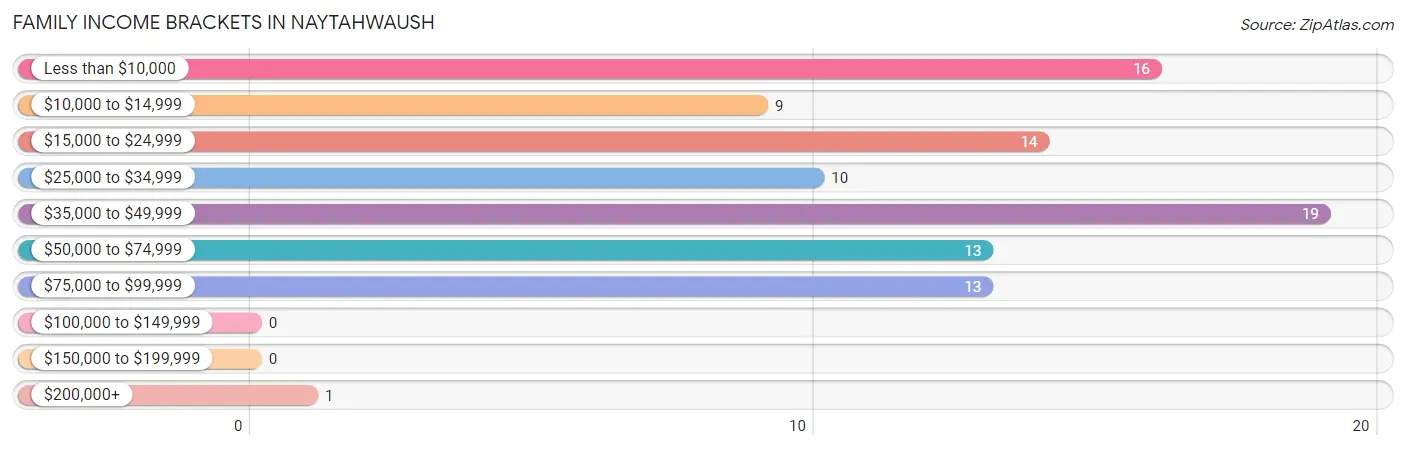
| Income Bracket | # Families | % Families |
| Less than $10,000 | 16 | 16.8% |
| $10,000 to $14,999 | 9 | 9.5% |
| $15,000 to $24,999 | 14 | 14.7% |
| $25,000 to $34,999 | 10 | 10.5% |
| $35,000 to $49,999 | 19 | 20.0% |
| $50,000 to $74,999 | 13 | 13.7% |
| $75,000 to $99,999 | 13 | 13.7% |
| $100,000 to $149,999 | 0 | 0.0% |
| $150,000 to $199,999 | 0 | 0.0% |
| $200,000+ | 1 | 1.1% |
Family Income by Famaliy Size in Naytahwaush
6-person families (12 | 12.6%) account for the highest median family income in Naytahwaush with $90,625 per family, while 2-person families (27 | 28.4%) have the highest median income of $19,792 per family member.
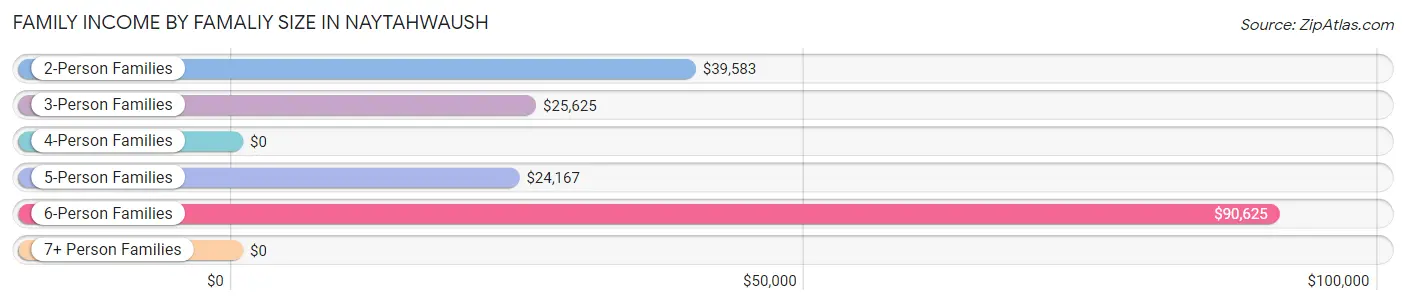
| Income Bracket | # Families | Median Income |
| 2-Person Families | 27 (28.4%) | $39,583 |
| 3-Person Families | 14 (14.7%) | $25,625 |
| 4-Person Families | 20 (21.0%) | $0 |
| 5-Person Families | 20 (21.0%) | $24,167 |
| 6-Person Families | 12 (12.6%) | $90,625 |
| 7+ Person Families | 2 (2.1%) | $0 |
| Total | 95 (100.0%) | $30,625 |
Family Income by Number of Earners in Naytahwaush
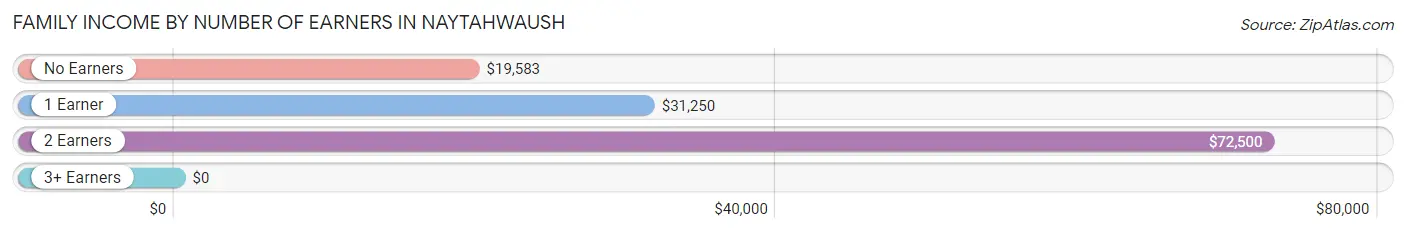
| Number of Earners | # Families | Median Income |
| No Earners | 23 (24.2%) | $19,583 |
| 1 Earner | 58 (61.1%) | $31,250 |
| 2 Earners | 14 (14.7%) | $72,500 |
| 3+ Earners | 0 (0.0%) | $0 |
| Total | 95 (100.0%) | $30,625 |
Household Income in Naytahwaush
Household Income Brackets in Naytahwaush
With 27 households falling in the category, the $35,000 to $49,999 income range is the most frequent in Naytahwaush, accounting for 18.8% of all households.
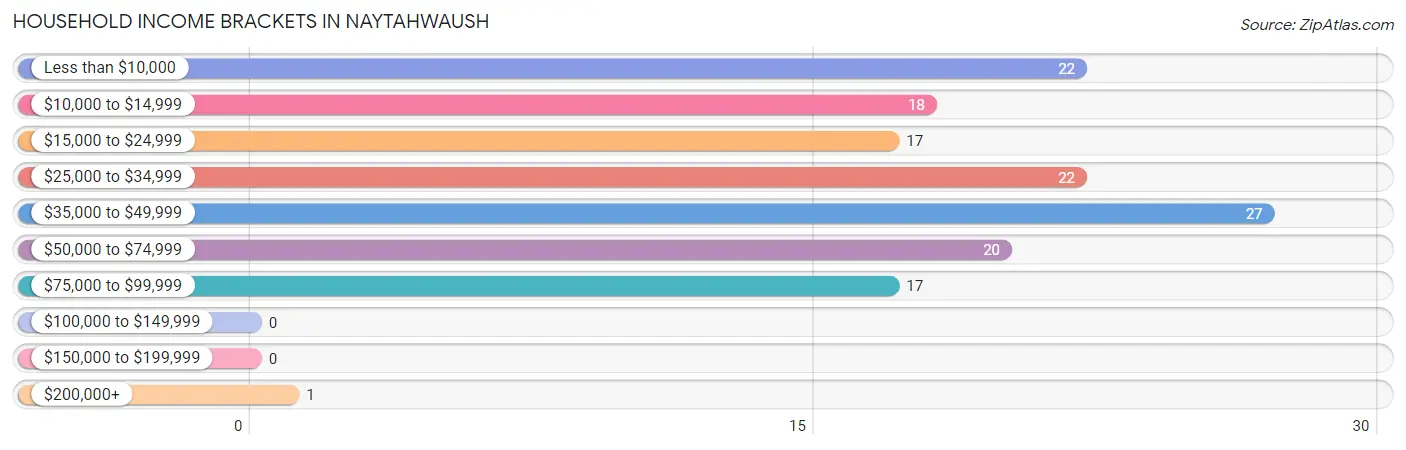
| Income Bracket | # Households | % Households |
| Less than $10,000 | 22 | 15.3% |
| $10,000 to $14,999 | 18 | 12.5% |
| $15,000 to $24,999 | 17 | 11.8% |
| $25,000 to $34,999 | 22 | 15.3% |
| $35,000 to $49,999 | 27 | 18.8% |
| $50,000 to $74,999 | 20 | 13.9% |
| $75,000 to $99,999 | 17 | 11.8% |
| $100,000 to $149,999 | 0 | 0.0% |
| $150,000 to $199,999 | 0 | 0.0% |
| $200,000+ | 1 | 0.7% |
Household Income by Householder Age in Naytahwaush
The median household income in Naytahwaush is $31,111, with the highest median household income of $39,167 found in the 45 to 64 years age bracket for the primary householder. A total of 54 households (37.5%) fall into this category. Meanwhile, the 15 to 24 years age bracket for the primary householder has the lowest median household income of $0, with 7 households (4.9%) in this group.
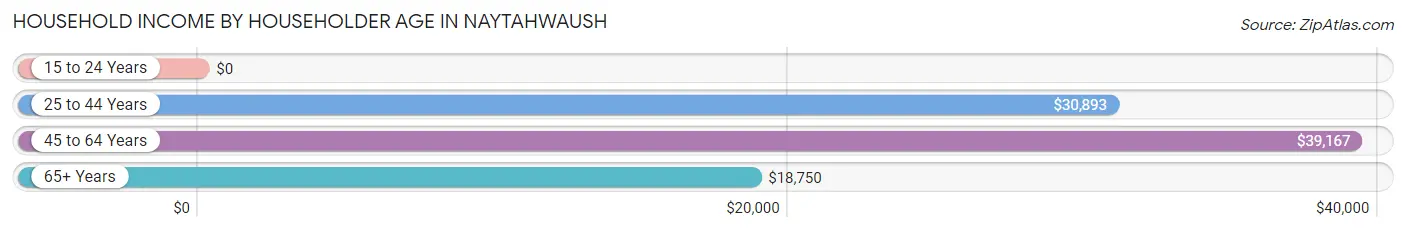
| Income Bracket | # Households | Median Income |
| 15 to 24 Years | 7 (4.9%) | $0 |
| 25 to 44 Years | 53 (36.8%) | $30,893 |
| 45 to 64 Years | 54 (37.5%) | $39,167 |
| 65+ Years | 30 (20.8%) | $18,750 |
| Total | 144 (100.0%) | $31,111 |
Poverty in Naytahwaush
Income Below Poverty by Sex and Age in Naytahwaush
With 41.6% poverty level for males and 44.9% for females among the residents of Naytahwaush, under 5 year old males and 5 year old females are the most vulnerable to poverty, with 20 males (71.4%) and 2 females (100.0%) in their respective age groups living below the poverty level.
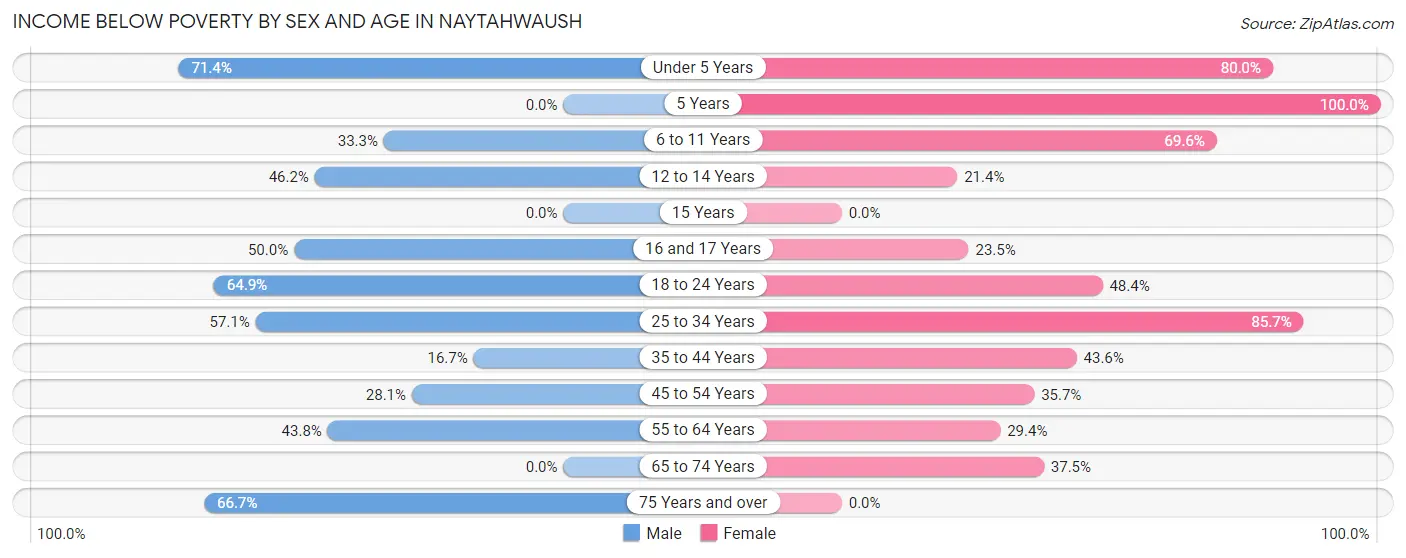
| Age Bracket | Male | Female |
| Under 5 Years | 20 (71.4%) | 16 (80.0%) |
| 5 Years | 0 (0.0%) | 2 (100.0%) |
| 6 to 11 Years | 17 (33.3%) | 16 (69.6%) |
| 12 to 14 Years | 6 (46.2%) | 3 (21.4%) |
| 15 Years | 0 (0.0%) | 0 (0.0%) |
| 16 and 17 Years | 4 (50.0%) | 4 (23.5%) |
| 18 to 24 Years | 24 (64.9%) | 15 (48.4%) |
| 25 to 34 Years | 8 (57.1%) | 12 (85.7%) |
| 35 to 44 Years | 5 (16.7%) | 17 (43.6%) |
| 45 to 54 Years | 9 (28.1%) | 5 (35.7%) |
| 55 to 64 Years | 7 (43.8%) | 5 (29.4%) |
| 65 to 74 Years | 0 (0.0%) | 6 (37.5%) |
| 75 Years and over | 2 (66.7%) | 0 (0.0%) |
| Total | 102 (41.6%) | 101 (44.9%) |
Income Above Poverty by Sex and Age in Naytahwaush
According to the poverty statistics in Naytahwaush, males aged 5 years and females aged 75 years and over are the age groups that are most secure financially, with 100.0% of males and 100.0% of females in these age groups living above the poverty line.
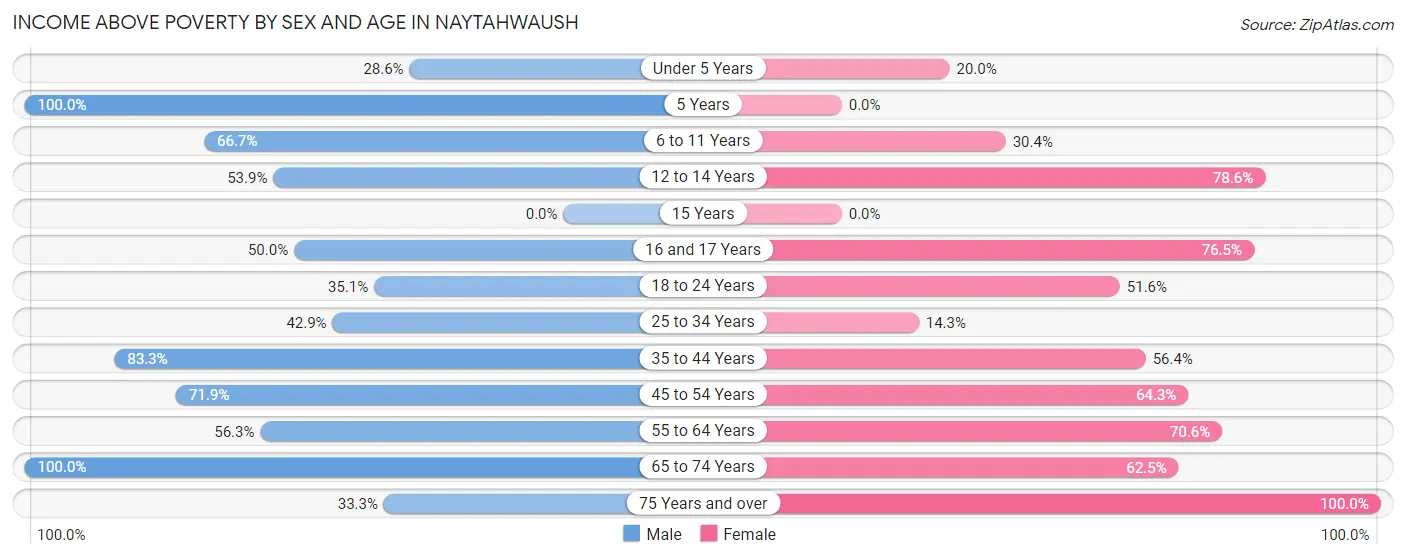
| Age Bracket | Male | Female |
| Under 5 Years | 8 (28.6%) | 4 (20.0%) |
| 5 Years | 3 (100.0%) | 0 (0.0%) |
| 6 to 11 Years | 34 (66.7%) | 7 (30.4%) |
| 12 to 14 Years | 7 (53.8%) | 11 (78.6%) |
| 15 Years | 0 (0.0%) | 0 (0.0%) |
| 16 and 17 Years | 4 (50.0%) | 13 (76.5%) |
| 18 to 24 Years | 13 (35.1%) | 16 (51.6%) |
| 25 to 34 Years | 6 (42.9%) | 2 (14.3%) |
| 35 to 44 Years | 25 (83.3%) | 22 (56.4%) |
| 45 to 54 Years | 23 (71.9%) | 9 (64.3%) |
| 55 to 64 Years | 9 (56.2%) | 12 (70.6%) |
| 65 to 74 Years | 10 (100.0%) | 10 (62.5%) |
| 75 Years and over | 1 (33.3%) | 18 (100.0%) |
| Total | 143 (58.4%) | 124 (55.1%) |
Income Below Poverty Among Married-Couple Families in Naytahwaush
The poverty statistics for married-couple families in Naytahwaush show that 20.0% or 2 of the total 10 families live below the poverty line. Families with 1 or 2 children have the highest poverty rate of 50.0%, comprising of 2 families. On the other hand, families with no children have the lowest poverty rate of 0.0%, which includes 0 families.
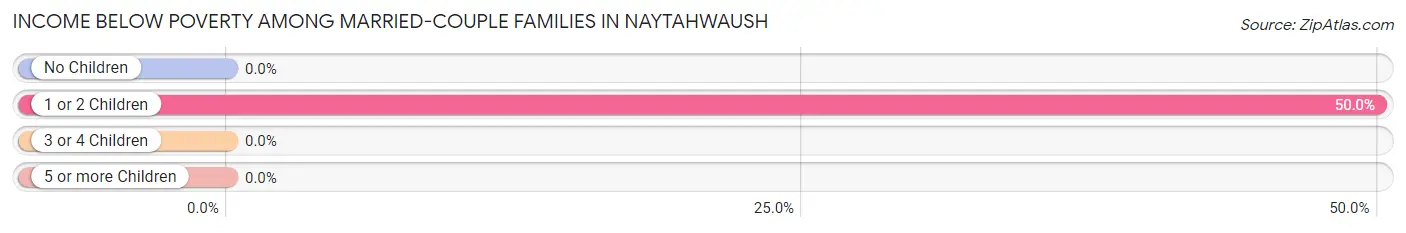
| Children | Above Poverty | Below Poverty |
| No Children | 3 (100.0%) | 0 (0.0%) |
| 1 or 2 Children | 2 (50.0%) | 2 (50.0%) |
| 3 or 4 Children | 3 (100.0%) | 0 (0.0%) |
| 5 or more Children | 0 (0.0%) | 0 (0.0%) |
| Total | 8 (80.0%) | 2 (20.0%) |
Income Below Poverty Among Single-Parent Households in Naytahwaush
According to the poverty data in Naytahwaush, 18.5% or 5 single-father households and 55.2% or 32 single-mother households are living below the poverty line. Among single-father households, those with 3 or 4 children have the highest poverty rate, with 3 households (50.0%) experiencing poverty. Likewise, among single-mother households, those with 3 or 4 children have the highest poverty rate, with 20 households (76.9%) falling below the poverty line.
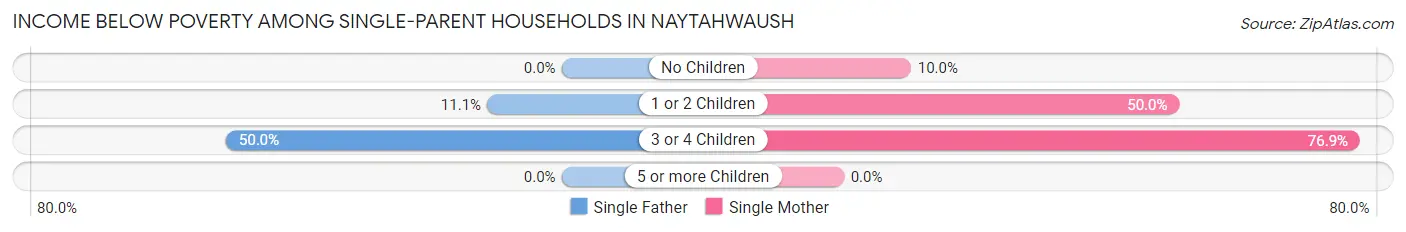
| Children | Single Father | Single Mother |
| No Children | 0 (0.0%) | 1 (10.0%) |
| 1 or 2 Children | 2 (11.1%) | 11 (50.0%) |
| 3 or 4 Children | 3 (50.0%) | 20 (76.9%) |
| 5 or more Children | 0 (0.0%) | 0 (0.0%) |
| Total | 5 (18.5%) | 32 (55.2%) |
Income Below Poverty Among Married-Couple vs Single-Parent Households in Naytahwaush
The poverty data for Naytahwaush shows that 2 of the married-couple family households (20.0%) and 37 of the single-parent households (43.5%) are living below the poverty level. Within the married-couple family households, those with 1 or 2 children have the highest poverty rate, with 2 households (50.0%) falling below the poverty line. Among the single-parent households, those with 3 or 4 children have the highest poverty rate, with 23 household (71.9%) living below poverty.
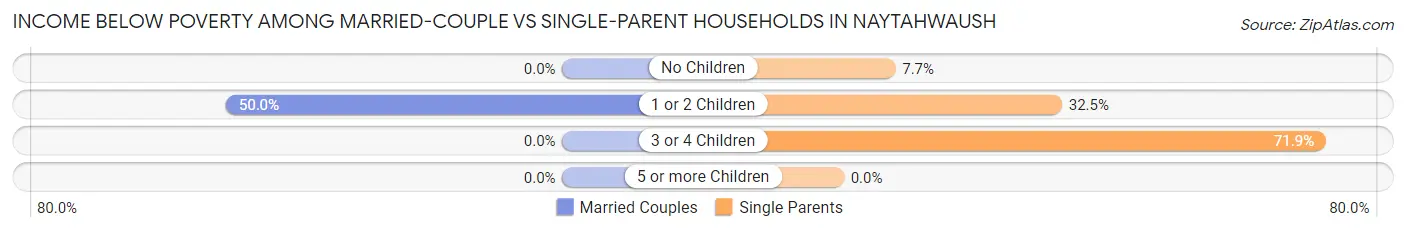
| Children | Married-Couple Families | Single-Parent Households |
| No Children | 0 (0.0%) | 1 (7.7%) |
| 1 or 2 Children | 2 (50.0%) | 13 (32.5%) |
| 3 or 4 Children | 0 (0.0%) | 23 (71.9%) |
| 5 or more Children | 0 (0.0%) | 0 (0.0%) |
| Total | 2 (20.0%) | 37 (43.5%) |
Race in Naytahwaush
The most populous races in Naytahwaush are Native / Alaskan (375 | 79.4%), Two or more Races (87 | 18.4%), and Hispanic or Latino (29 | 6.1%).
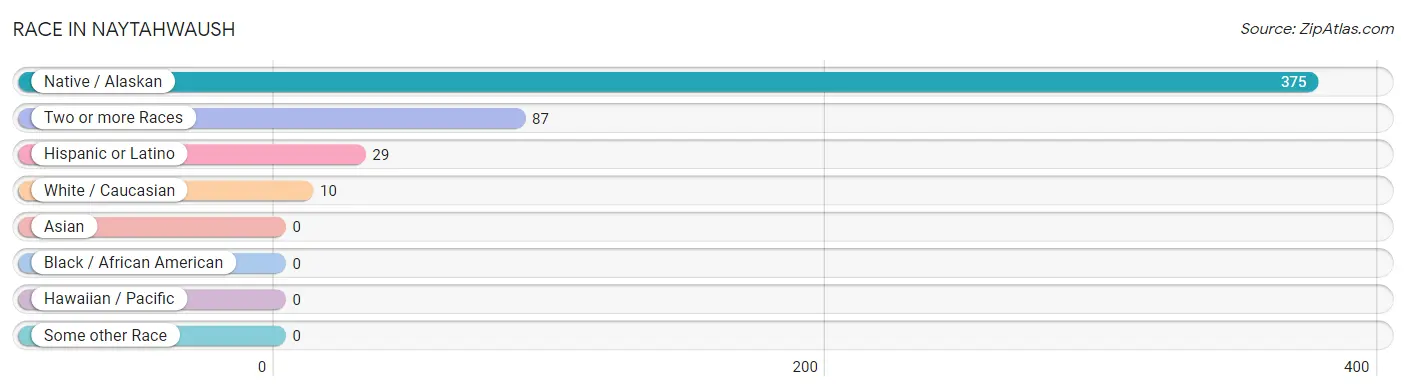
| Race | # Population | % Population |
| Asian | 0 | 0.0% |
| Black / African American | 0 | 0.0% |
| Hawaiian / Pacific | 0 | 0.0% |
| Hispanic or Latino | 29 | 6.1% |
| Native / Alaskan | 375 | 79.4% |
| White / Caucasian | 10 | 2.1% |
| Two or more Races | 87 | 18.4% |
| Some other Race | 0 | 0.0% |
| Total | 472 | 100.0% |
Ancestry in Naytahwaush
The most populous ancestries reported in Naytahwaush are Chippewa (386 | 81.8%), German (43 | 9.1%), French (34 | 7.2%), Mexican (27 | 5.7%), and Norwegian (27 | 5.7%), together accounting for 109.5% of all Naytahwaush residents.
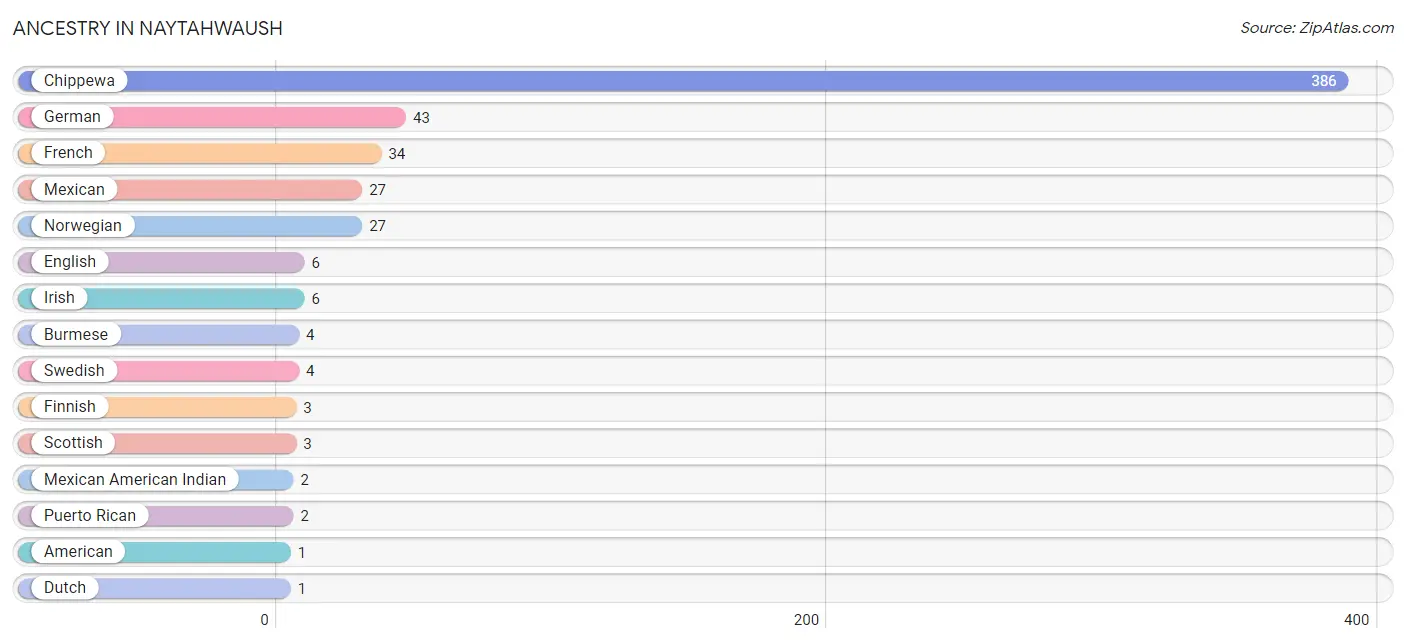
| Ancestry | # Population | % Population |
| American | 1 | 0.2% |
| Burmese | 4 | 0.9% |
| Chippewa | 386 | 81.8% |
| Dutch | 1 | 0.2% |
| English | 6 | 1.3% |
| Finnish | 3 | 0.6% |
| French | 34 | 7.2% |
| German | 43 | 9.1% |
| Inupiat | 1 | 0.2% |
| Irish | 6 | 1.3% |
| Mexican | 27 | 5.7% |
| Mexican American Indian | 2 | 0.4% |
| Norwegian | 27 | 5.7% |
| Puerto Rican | 2 | 0.4% |
| Scottish | 3 | 0.6% |
| Swedish | 4 | 0.9% | View All 16 Rows |
Immigrants in Naytahwaush
The most numerous immigrant groups reported in Naytahwaush came from Central America (2 | 0.4%), Latin America (2 | 0.4%), and Mexico (2 | 0.4%), together accounting for 1.3% of all Naytahwaush residents.
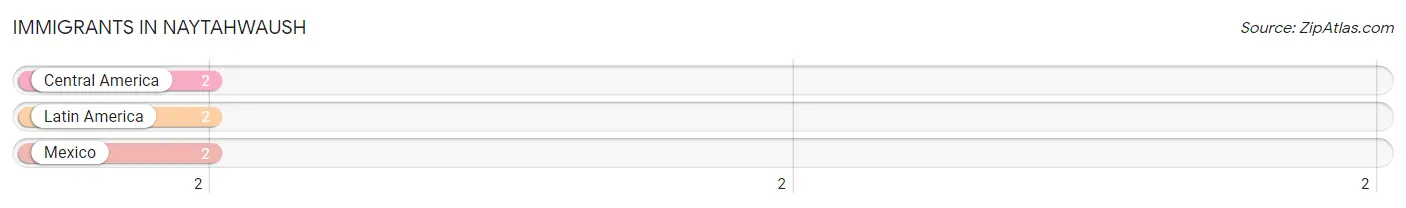
| Immigration Origin | # Population | % Population |
| Central America | 2 | 0.4% |
| Latin America | 2 | 0.4% |
| Mexico | 2 | 0.4% | View All 3 Rows |
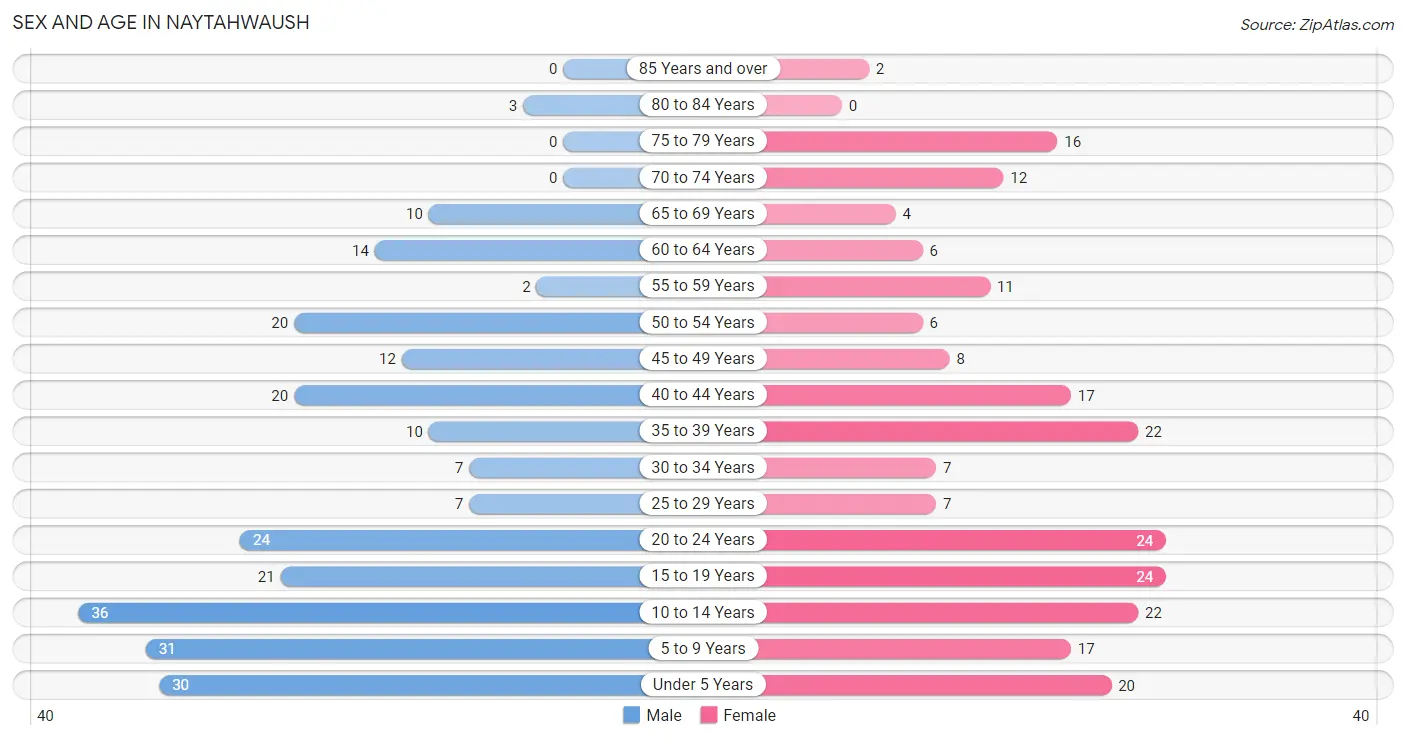
Sex and Age in Naytahwaush
Sex and Age in Naytahwaush
The most populous age groups in Naytahwaush are 10 to 14 Years (36 | 14.6%) for men and 15 to 19 Years (24 | 10.7%) for women.
| Age Bracket | Male | Female |
| Under 5 Years | 30 (12.1%) | 20 (8.9%) |
| 5 to 9 Years | 31 (12.6%) | 17 (7.6%) |
| 10 to 14 Years | 36 (14.6%) | 22 (9.8%) |
| 15 to 19 Years | 21 (8.5%) | 24 (10.7%) |
| 20 to 24 Years | 24 (9.7%) | 24 (10.7%) |
| 25 to 29 Years | 7 (2.8%) | 7 (3.1%) |
| 30 to 34 Years | 7 (2.8%) | 7 (3.1%) |
| 35 to 39 Years | 10 (4.1%) | 22 (9.8%) |
| 40 to 44 Years | 20 (8.1%) | 17 (7.6%) |
| 45 to 49 Years | 12 (4.9%) | 8 (3.6%) |
| 50 to 54 Years | 20 (8.1%) | 6 (2.7%) |
| 55 to 59 Years | 2 (0.8%) | 11 (4.9%) |
| 60 to 64 Years | 14 (5.7%) | 6 (2.7%) |
| 65 to 69 Years | 10 (4.1%) | 4 (1.8%) |
| 70 to 74 Years | 0 (0.0%) | 12 (5.3%) |
| 75 to 79 Years | 0 (0.0%) | 16 (7.1%) |
| 80 to 84 Years | 3 (1.2%) | 0 (0.0%) |
| 85 Years and over | 0 (0.0%) | 2 (0.9%) |
| Total | 247 (100.0%) | 225 (100.0%) |
Families and Households in Naytahwaush
Median Family Size in Naytahwaush
The median family size in Naytahwaush is 4.11 persons per family, with married-couple families (10 | 10.5%) accounting for the largest median family size of 5 persons per family. On the other hand, single female/mother families (58 | 61.1%) represent the smallest median family size with 3.78 persons per family.
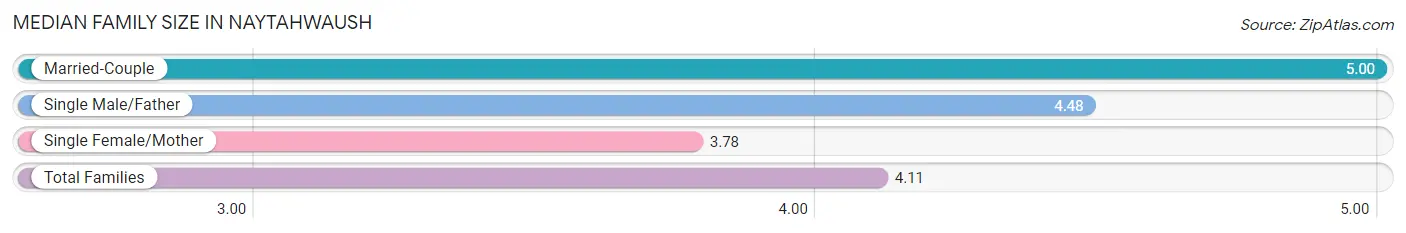
| Family Type | # Families | Family Size |
| Married-Couple | 10 (10.5%) | 5.00 |
| Single Male/Father | 27 (28.4%) | 4.48 |
| Single Female/Mother | 58 (61.1%) | 3.78 |
| Total Families | 95 (100.0%) | 4.11 |
Median Household Size in Naytahwaush
The median household size in Naytahwaush is 3.28 persons per household, with married-couple households (10 | 6.9%) accounting for the largest median household size of 5 persons per household. non-family households (49 | 34.0%) represent the smallest median household size with 1.24 persons per household.
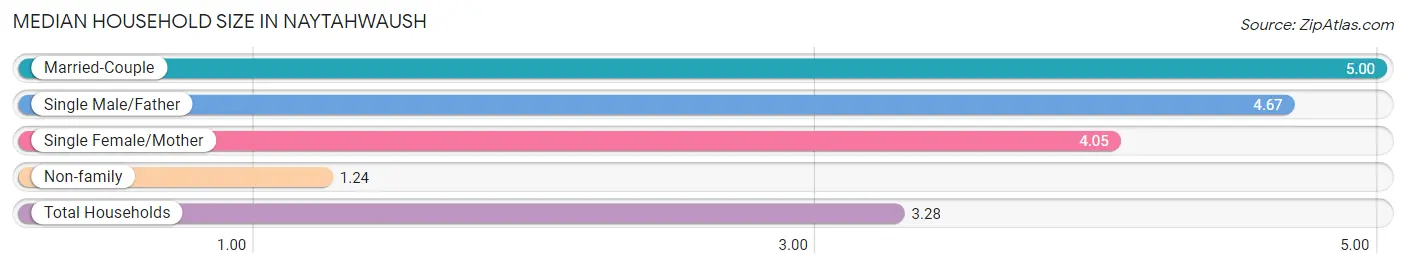
| Household Type | # Households | Household Size |
| Married-Couple | 10 (6.9%) | 5.00 |
| Single Male/Father | 27 (18.8%) | 4.67 |
| Single Female/Mother | 58 (40.3%) | 4.05 |
| Non-family | 49 (34.0%) | 1.24 |
| Total Households | 144 (100.0%) | 3.28 |
Household Size by Marriage Status in Naytahwaush
Out of a total of 144 households in Naytahwaush, 95 (66.0%) are family households, while 49 (34.0%) are nonfamily households. The most numerous type of family households are 2-person households, comprising 25, and the most common type of nonfamily households are 1-person households, comprising 37.
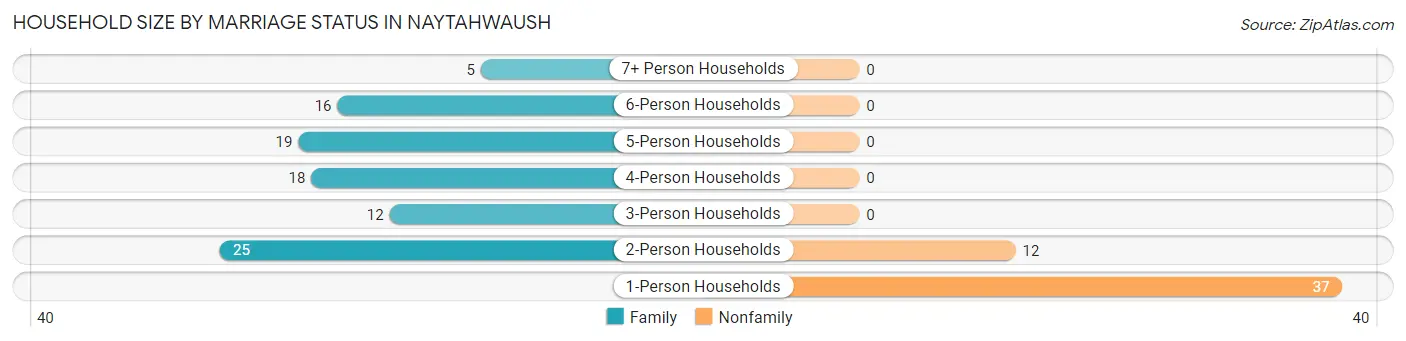
| Household Size | Family Households | Nonfamily Households |
| 1-Person Households | - | 37 (25.7%) |
| 2-Person Households | 25 (17.4%) | 12 (8.3%) |
| 3-Person Households | 12 (8.3%) | 0 (0.0%) |
| 4-Person Households | 18 (12.5%) | 0 (0.0%) |
| 5-Person Households | 19 (13.2%) | 0 (0.0%) |
| 6-Person Households | 16 (11.1%) | 0 (0.0%) |
| 7+ Person Households | 5 (3.5%) | 0 (0.0%) |
| Total | 95 (66.0%) | 49 (34.0%) |
Female Fertility in Naytahwaush
Fertility by Age in Naytahwaush
Average fertility rate in Naytahwaush is 220.0 births per 1,000 women. Women in the age bracket of 20 to 34 years have the highest fertility rate with 447.0 births per 1,000 women. Women in the age bracket of 20 to 34 years acount for 70.8% of all women with births.
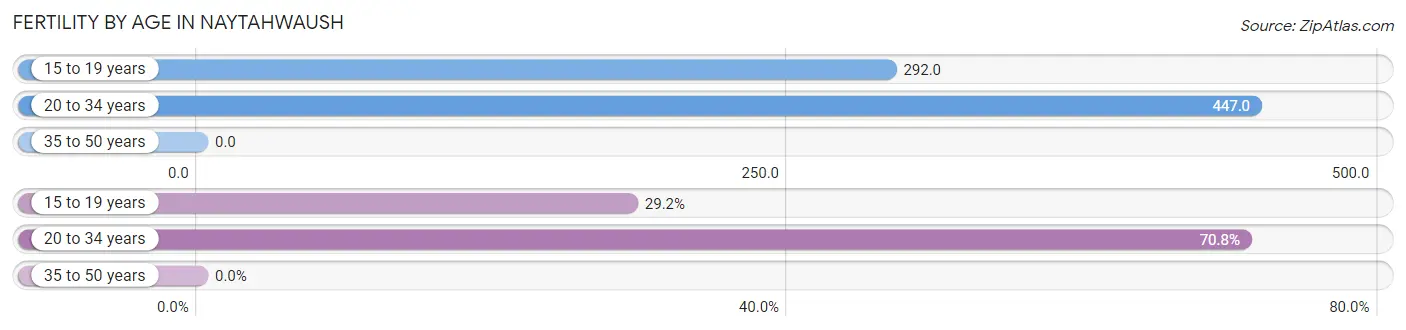
| Age Bracket | Women with Births | Births / 1,000 Women |
| 15 to 19 years | 7 (29.2%) | 292.0 |
| 20 to 34 years | 17 (70.8%) | 447.0 |
| 35 to 50 years | 0 (0.0%) | 0.0 |
| Total | 24 (100.0%) | 220.0 |
Fertility by Age by Marriage Status in Naytahwaush
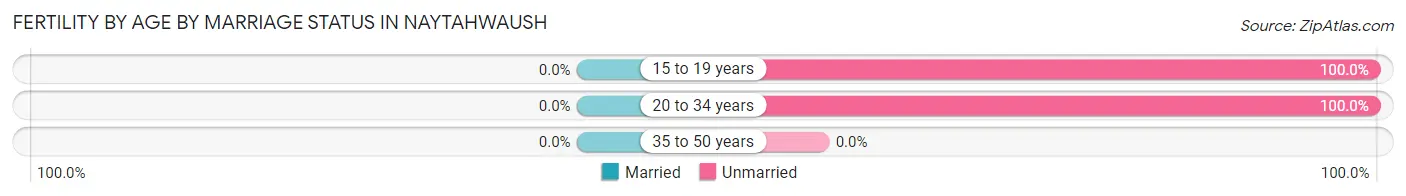
| Age Bracket | Married | Unmarried |
| 15 to 19 years | 0 (0.0%) | 7 (100.0%) |
| 20 to 34 years | 0 (0.0%) | 17 (100.0%) |
| 35 to 50 years | 0 (0.0%) | 0 (0.0%) |
| Total | 0 (0.0%) | 24 (100.0%) |
Fertility by Education in Naytahwaush
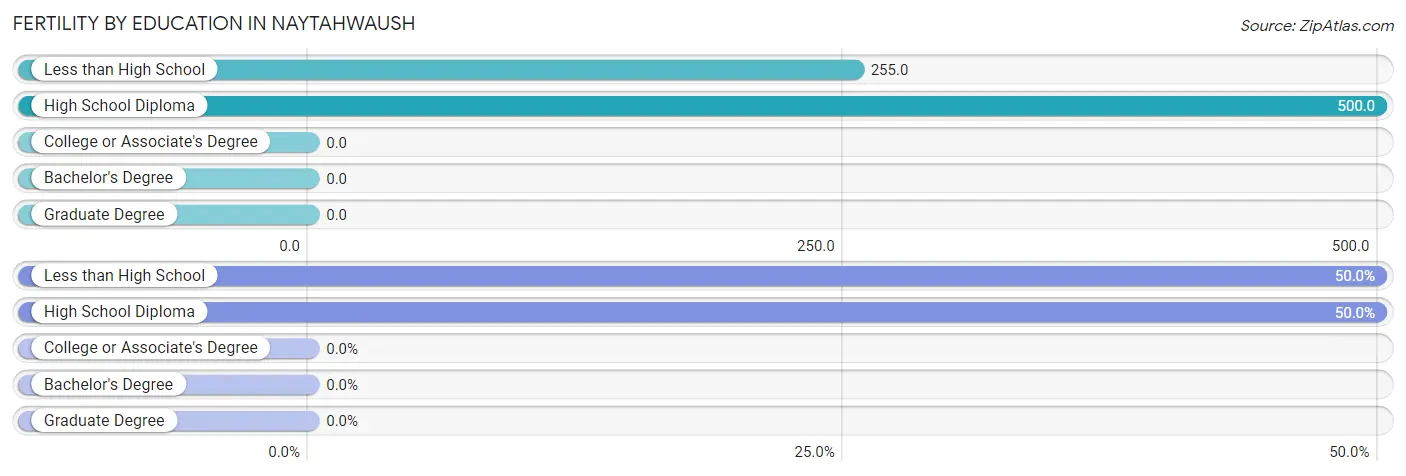
| Educational Attainment | Women with Births | Births / 1,000 Women |
| Less than High School | 12 (50.0%) | 255.0 |
| High School Diploma | 12 (50.0%) | 500.0 |
| College or Associate's Degree | 0 (0.0%) | 0.0 |
| Bachelor's Degree | 0 (0.0%) | 0.0 |
| Graduate Degree | 0 (0.0%) | 0.0 |
| Total | 24 (100.0%) | 220.0 |
Fertility by Education by Marriage Status in Naytahwaush
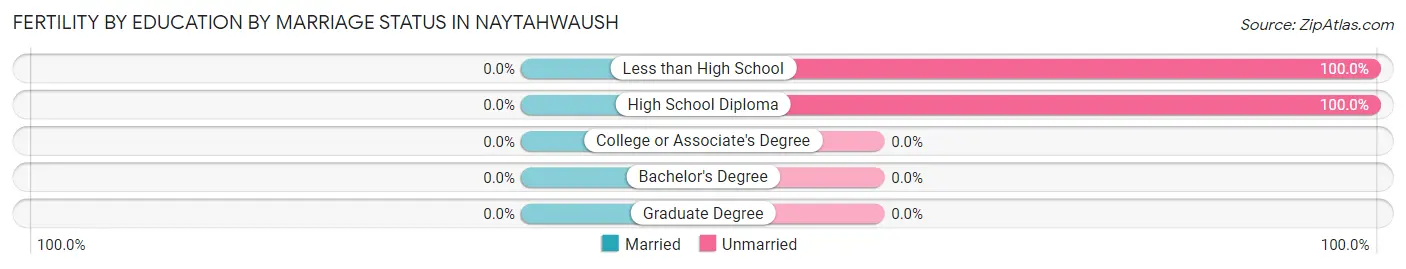
| Educational Attainment | Married | Unmarried |
| Less than High School | 0 (0.0%) | 12 (100.0%) |
| High School Diploma | 0 (0.0%) | 12 (100.0%) |
| College or Associate's Degree | 0 (0.0%) | 0 (0.0%) |
| Bachelor's Degree | 0 (0.0%) | 0 (0.0%) |
| Graduate Degree | 0 (0.0%) | 0 (0.0%) |
| Total | 0 (0.0%) | 24 (100.0%) |
Employment Characteristics in Naytahwaush
Employment by Class of Employer in Naytahwaush
Among the 105 employed individuals in Naytahwaush, local government employees (55 | 52.4%), private company employees (22 | 20.9%), and not-for-profit organizations (19 | 18.1%) make up the most common classes of employment.
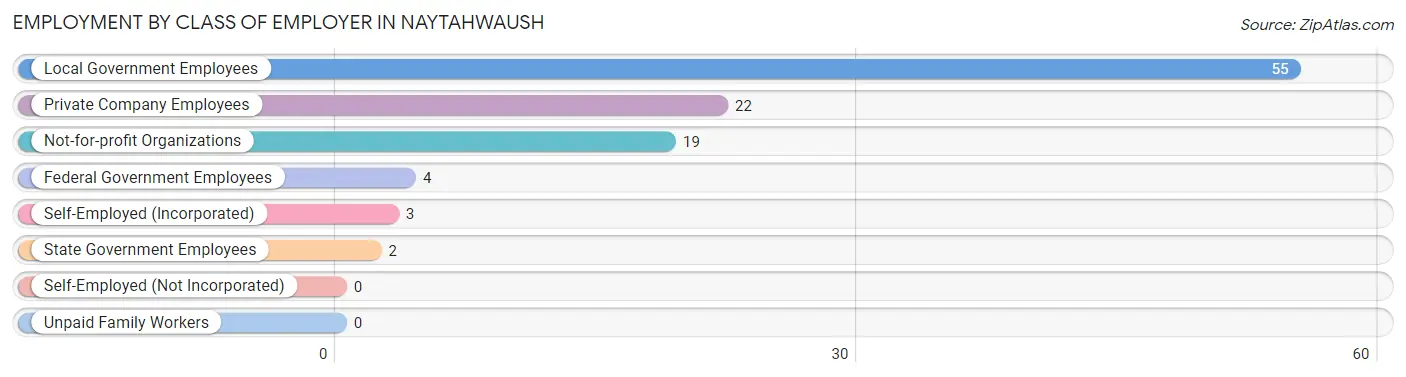
| Employer Class | # Employees | % Employees |
| Private Company Employees | 22 | 20.9% |
| Self-Employed (Incorporated) | 3 | 2.9% |
| Self-Employed (Not Incorporated) | 0 | 0.0% |
| Not-for-profit Organizations | 19 | 18.1% |
| Local Government Employees | 55 | 52.4% |
| State Government Employees | 2 | 1.9% |
| Federal Government Employees | 4 | 3.8% |
| Unpaid Family Workers | 0 | 0.0% |
| Total | 105 | 100.0% |
Employment Status by Age in Naytahwaush
According to the labor force statistics for Naytahwaush, out of the total population over 16 years of age (316), 44.3% or 140 individuals are in the labor force, with 25.0% or 35 of them unemployed. The age group with the highest labor force participation rate is 30 to 34 years, with 78.6% or 11 individuals in the labor force. Within the labor force, the 25 to 29 years age range has the highest percentage of unemployed individuals, with 60.0% or 6 of them being unemployed.
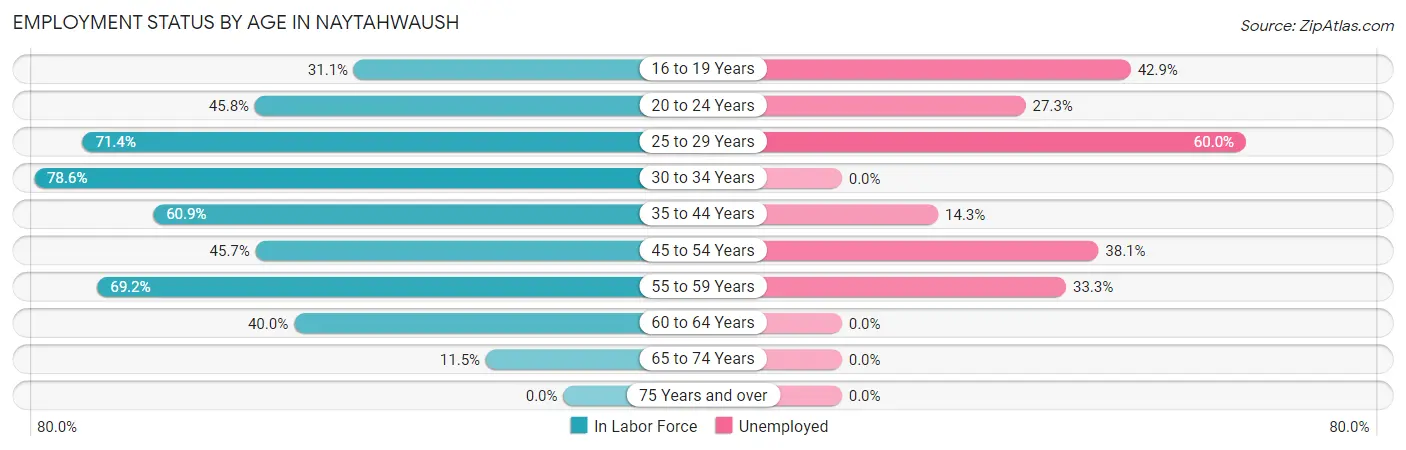
| Age Bracket | In Labor Force | Unemployed |
| 16 to 19 Years | 14 (31.1%) | 6 (42.9%) |
| 20 to 24 Years | 22 (45.8%) | 6 (27.3%) |
| 25 to 29 Years | 10 (71.4%) | 6 (60.0%) |
| 30 to 34 Years | 11 (78.6%) | 0 (0.0%) |
| 35 to 44 Years | 42 (60.9%) | 6 (14.3%) |
| 45 to 54 Years | 21 (45.7%) | 8 (38.1%) |
| 55 to 59 Years | 9 (69.2%) | 3 (33.3%) |
| 60 to 64 Years | 8 (40.0%) | 0 (0.0%) |
| 65 to 74 Years | 3 (11.5%) | 0 (0.0%) |
| 75 Years and over | 0 (0.0%) | 0 (0.0%) |
| Total | 140 (44.3%) | 35 (25.0%) |
Employment Status by Educational Attainment in Naytahwaush
According to labor force statistics for Naytahwaush, 57.4% of individuals (101) out of the total population between 25 and 64 years of age (176) are in the labor force, with 22.8% or 23 of them being unemployed. The group with the highest labor force participation rate are those with the educational attainment of college / associate degree, with 75.0% or 54 individuals in the labor force. Within the labor force, individuals with less than high school education have the highest percentage of unemployment, with 33.3% or 4 of them being unemployed.
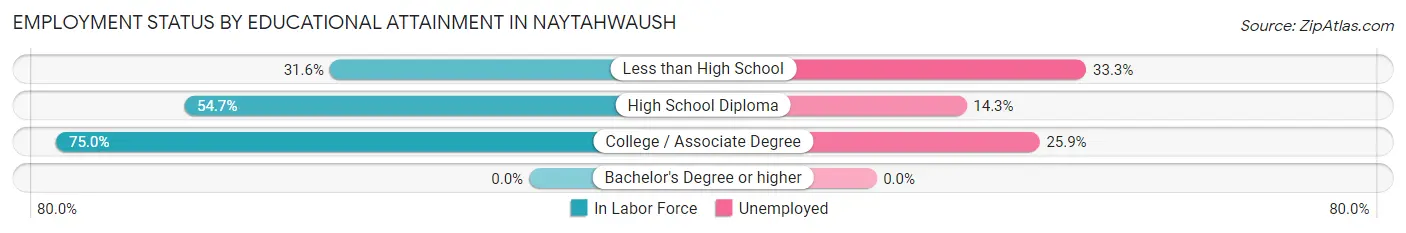
| Educational Attainment | In Labor Force | Unemployed |
| Less than High School | 12 (31.6%) | 13 (33.3%) |
| High School Diploma | 35 (54.7%) | 9 (14.3%) |
| College / Associate Degree | 54 (75.0%) | 19 (25.9%) |
| Bachelor's Degree or higher | 0 (0.0%) | 0 (0.0%) |
| Total | 101 (57.4%) | 40 (22.8%) |
Employment Occupations by Sex in Naytahwaush
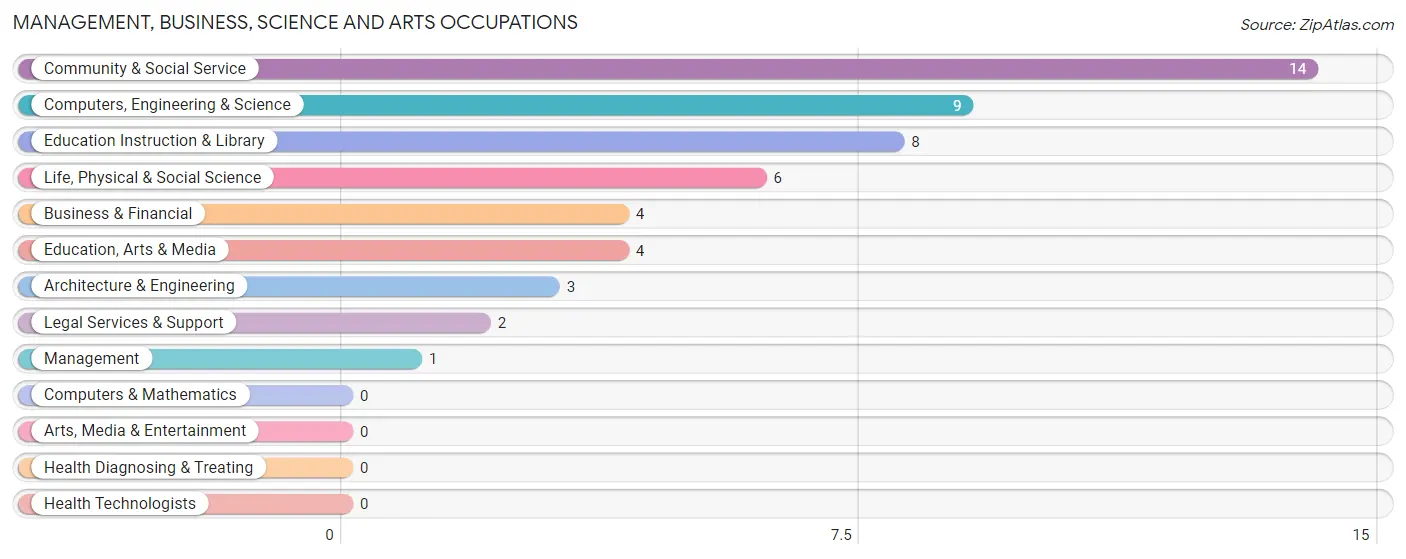
Management, Business, Science and Arts Occupations
The most common Management, Business, Science and Arts occupations in Naytahwaush are Community & Social Service (14 | 13.3%), Computers, Engineering & Science (9 | 8.6%), Education Instruction & Library (8 | 7.6%), Life, Physical & Social Science (6 | 5.7%), and Business & Financial (4 | 3.8%).
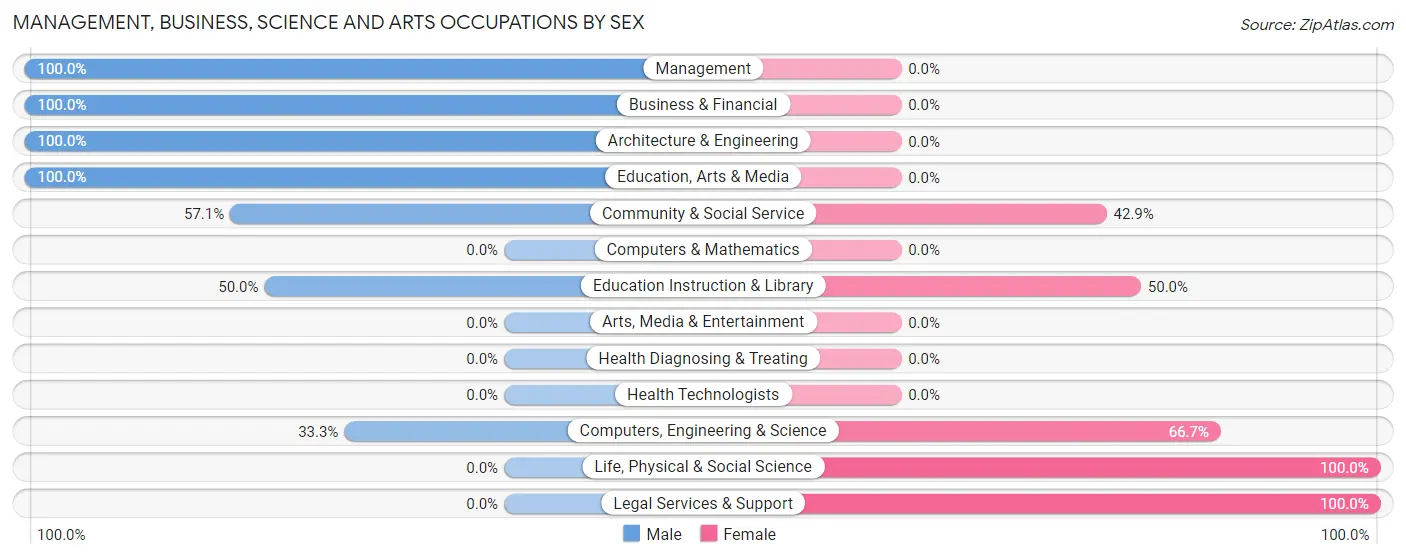
Management, Business, Science and Arts Occupations by Sex
Within the Management, Business, Science and Arts occupations in Naytahwaush, the most male-oriented occupations are Management (100.0%), Business & Financial (100.0%), and Architecture & Engineering (100.0%), while the most female-oriented occupations are Life, Physical & Social Science (100.0%), Legal Services & Support (100.0%), and Computers, Engineering & Science (66.7%).
| Occupation | Male | Female |
| Management | 1 (100.0%) | 0 (0.0%) |
| Business & Financial | 4 (100.0%) | 0 (0.0%) |
| Computers, Engineering & Science | 3 (33.3%) | 6 (66.7%) |
| Computers & Mathematics | 0 (0.0%) | 0 (0.0%) |
| Architecture & Engineering | 3 (100.0%) | 0 (0.0%) |
| Life, Physical & Social Science | 0 (0.0%) | 6 (100.0%) |
| Community & Social Service | 8 (57.1%) | 6 (42.9%) |
| Education, Arts & Media | 4 (100.0%) | 0 (0.0%) |
| Legal Services & Support | 0 (0.0%) | 2 (100.0%) |
| Education Instruction & Library | 4 (50.0%) | 4 (50.0%) |
| Arts, Media & Entertainment | 0 (0.0%) | 0 (0.0%) |
| Health Diagnosing & Treating | 0 (0.0%) | 0 (0.0%) |
| Health Technologists | 0 (0.0%) | 0 (0.0%) |
| Total (Category) | 16 (57.1%) | 12 (42.9%) |
| Total (Overall) | 45 (42.9%) | 60 (57.1%) |
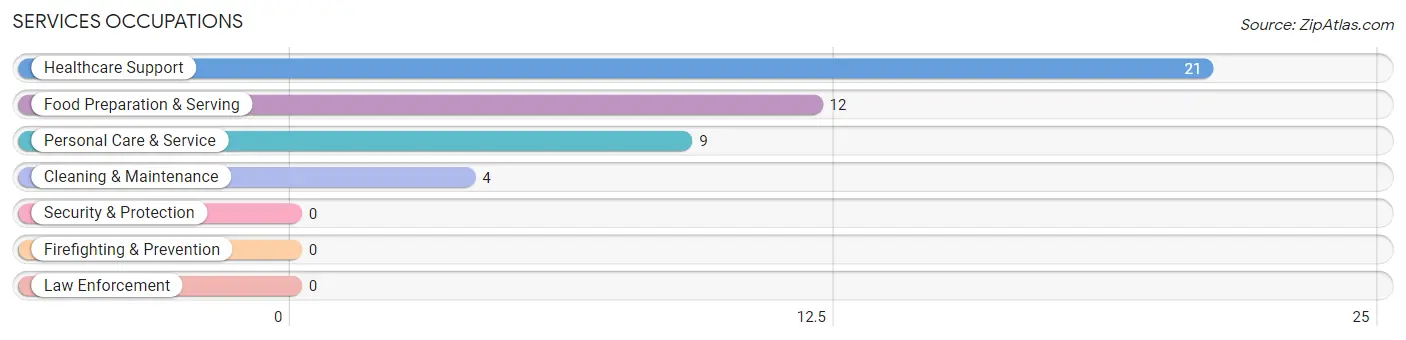
Services Occupations
The most common Services occupations in Naytahwaush are Healthcare Support (21 | 20.0%), Food Preparation & Serving (12 | 11.4%), Personal Care & Service (9 | 8.6%), and Cleaning & Maintenance (4 | 3.8%).
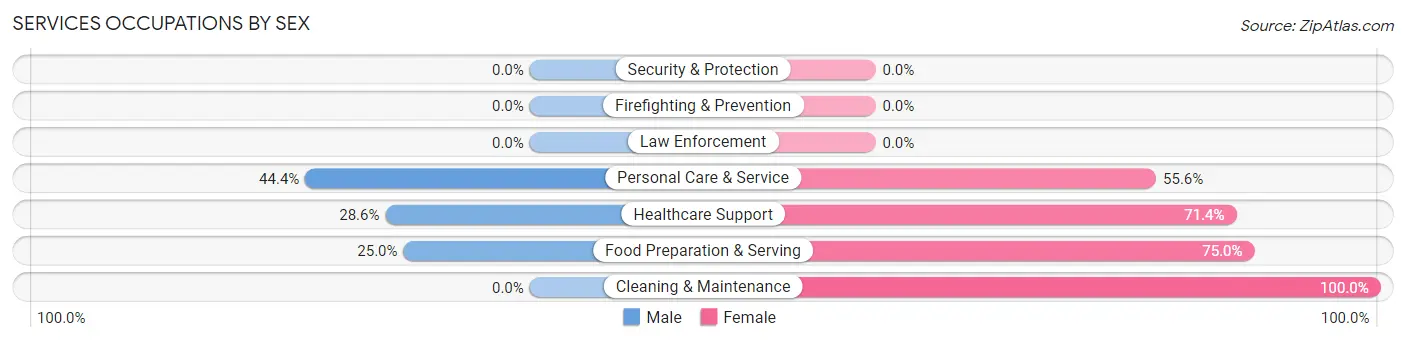
Services Occupations by Sex
Within the Services occupations in Naytahwaush, the most male-oriented occupations are Personal Care & Service (44.4%), Healthcare Support (28.6%), and Food Preparation & Serving (25.0%), while the most female-oriented occupations are Cleaning & Maintenance (100.0%), Food Preparation & Serving (75.0%), and Healthcare Support (71.4%).
| Occupation | Male | Female |
| Healthcare Support | 6 (28.6%) | 15 (71.4%) |
| Security & Protection | 0 (0.0%) | 0 (0.0%) |
| Firefighting & Prevention | 0 (0.0%) | 0 (0.0%) |
| Law Enforcement | 0 (0.0%) | 0 (0.0%) |
| Food Preparation & Serving | 3 (25.0%) | 9 (75.0%) |
| Cleaning & Maintenance | 0 (0.0%) | 4 (100.0%) |
| Personal Care & Service | 4 (44.4%) | 5 (55.6%) |
| Total (Category) | 13 (28.3%) | 33 (71.7%) |
| Total (Overall) | 45 (42.9%) | 60 (57.1%) |
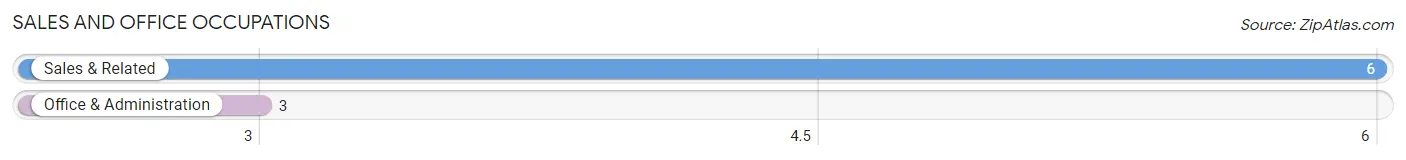
Sales and Office Occupations
The most common Sales and Office occupations in Naytahwaush are Sales & Related (6 | 5.7%), and Office & Administration (3 | 2.9%).
Sales and Office Occupations by Sex
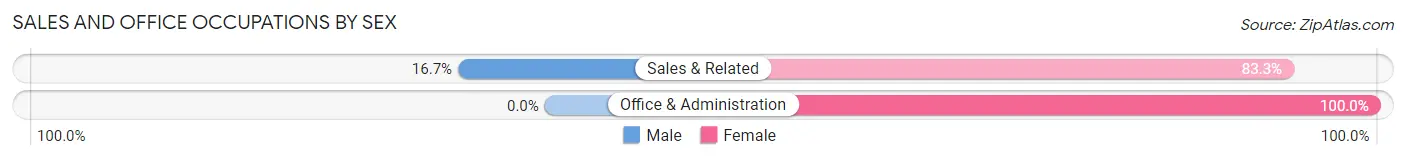
| Occupation | Male | Female |
| Sales & Related | 1 (16.7%) | 5 (83.3%) |
| Office & Administration | 0 (0.0%) | 3 (100.0%) |
| Total (Category) | 1 (11.1%) | 8 (88.9%) |
| Total (Overall) | 45 (42.9%) | 60 (57.1%) |
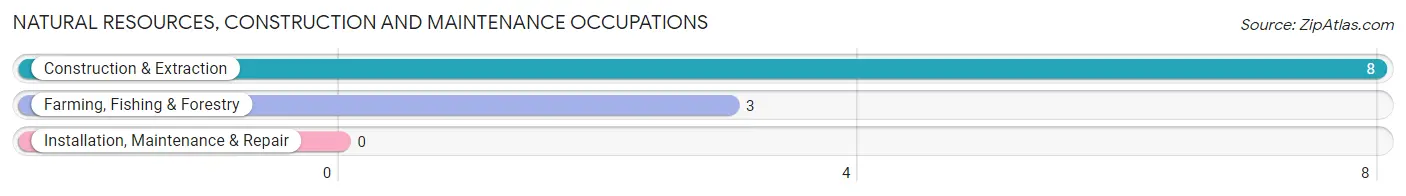
Natural Resources, Construction and Maintenance Occupations
The most common Natural Resources, Construction and Maintenance occupations in Naytahwaush are Construction & Extraction (8 | 7.6%), and Farming, Fishing & Forestry (3 | 2.9%).
Natural Resources, Construction and Maintenance Occupations by Sex
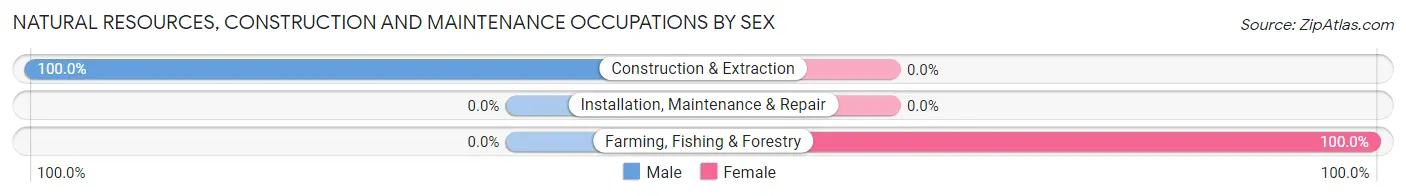
| Occupation | Male | Female |
| Farming, Fishing & Forestry | 0 (0.0%) | 3 (100.0%) |
| Construction & Extraction | 8 (100.0%) | 0 (0.0%) |
| Installation, Maintenance & Repair | 0 (0.0%) | 0 (0.0%) |
| Total (Category) | 8 (72.7%) | 3 (27.3%) |
| Total (Overall) | 45 (42.9%) | 60 (57.1%) |
Production, Transportation and Moving Occupations
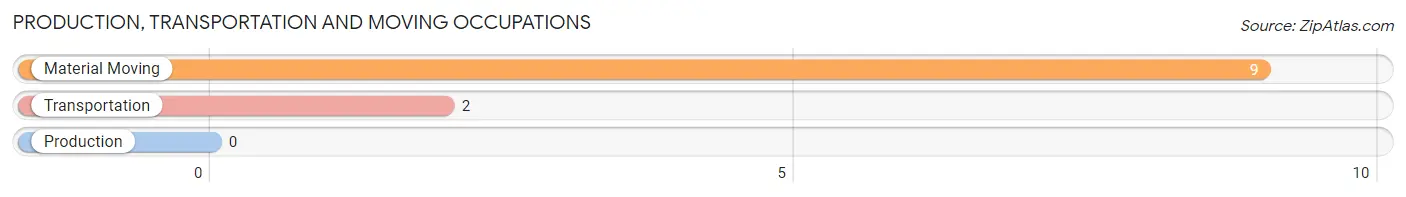
The most common Production, Transportation and Moving occupations in Naytahwaush are Material Moving (9 | 8.6%), and Transportation (2 | 1.9%).
Production, Transportation and Moving Occupations by Sex
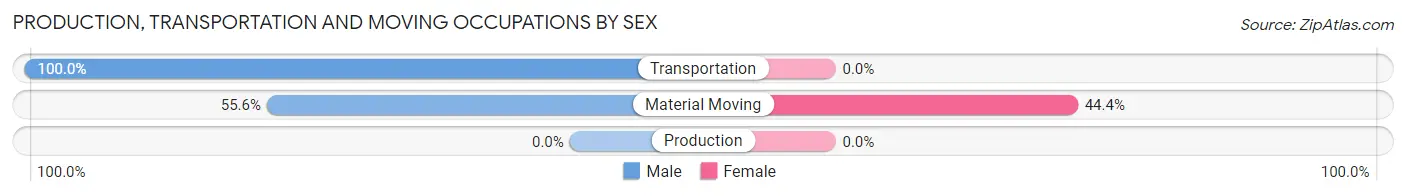
| Occupation | Male | Female |
| Production | 0 (0.0%) | 0 (0.0%) |
| Transportation | 2 (100.0%) | 0 (0.0%) |
| Material Moving | 5 (55.6%) | 4 (44.4%) |
| Total (Category) | 7 (63.6%) | 4 (36.4%) |
| Total (Overall) | 45 (42.9%) | 60 (57.1%) |
Employment Industries by Sex in Naytahwaush
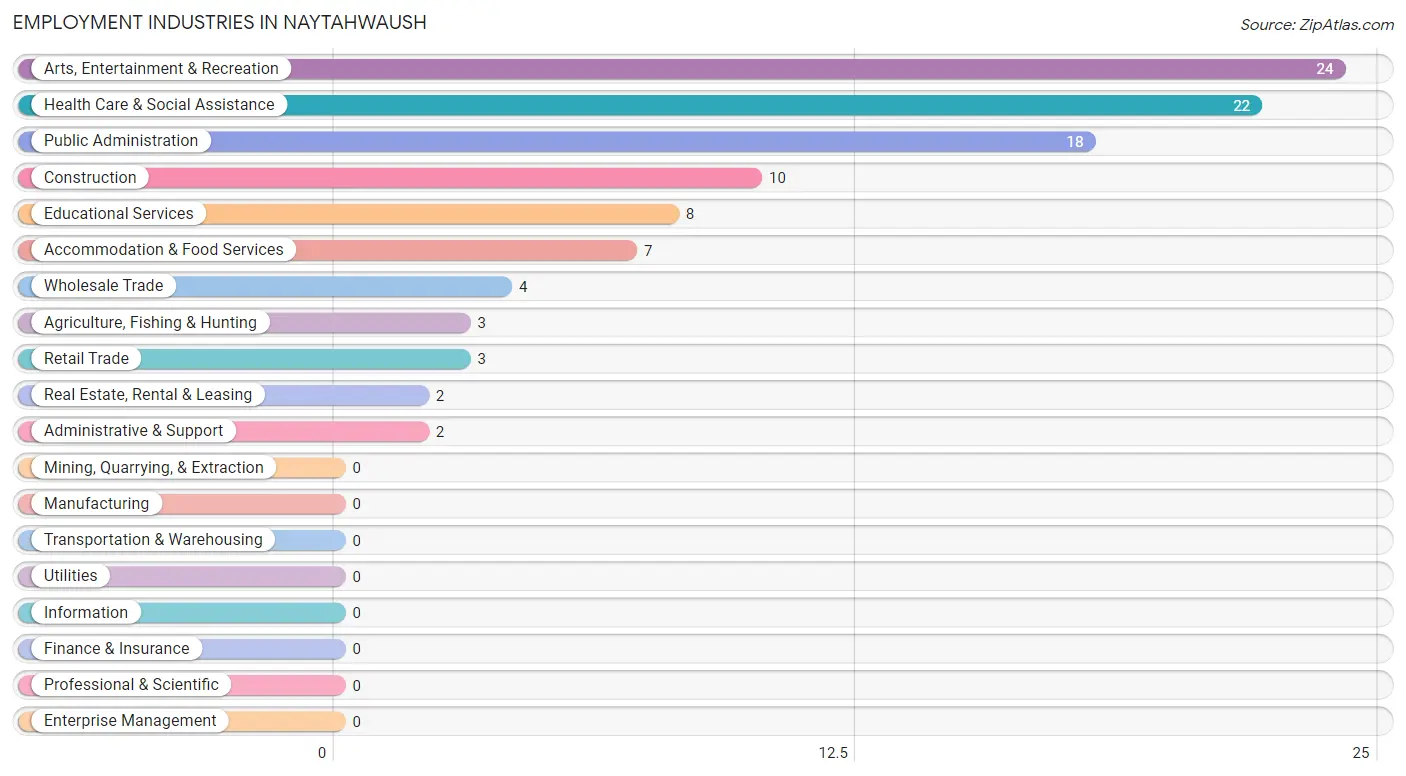
Employment Industries in Naytahwaush
The major employment industries in Naytahwaush include Arts, Entertainment & Recreation (24 | 22.9%), Health Care & Social Assistance (22 | 20.9%), Public Administration (18 | 17.1%), Construction (10 | 9.5%), and Educational Services (8 | 7.6%).
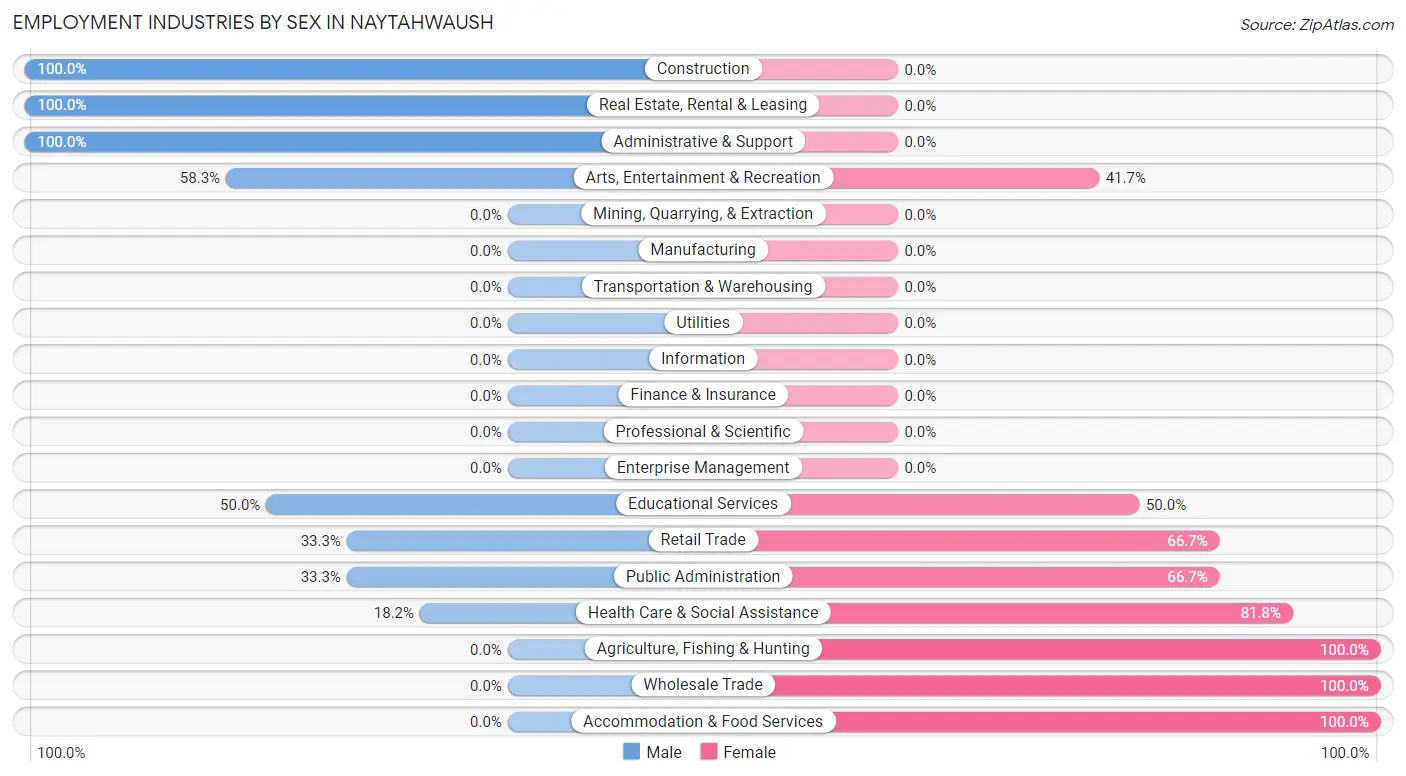
Employment Industries by Sex in Naytahwaush
The Naytahwaush industries that see more men than women are Construction (100.0%), Real Estate, Rental & Leasing (100.0%), and Administrative & Support (100.0%), whereas the industries that tend to have a higher number of women are Agriculture, Fishing & Hunting (100.0%), Wholesale Trade (100.0%), and Accommodation & Food Services (100.0%).
| Industry | Male | Female |
| Agriculture, Fishing & Hunting | 0 (0.0%) | 3 (100.0%) |
| Mining, Quarrying, & Extraction | 0 (0.0%) | 0 (0.0%) |
| Construction | 10 (100.0%) | 0 (0.0%) |
| Manufacturing | 0 (0.0%) | 0 (0.0%) |
| Wholesale Trade | 0 (0.0%) | 4 (100.0%) |
| Retail Trade | 1 (33.3%) | 2 (66.7%) |
| Transportation & Warehousing | 0 (0.0%) | 0 (0.0%) |
| Utilities | 0 (0.0%) | 0 (0.0%) |
| Information | 0 (0.0%) | 0 (0.0%) |
| Finance & Insurance | 0 (0.0%) | 0 (0.0%) |
| Real Estate, Rental & Leasing | 2 (100.0%) | 0 (0.0%) |
| Professional & Scientific | 0 (0.0%) | 0 (0.0%) |
| Enterprise Management | 0 (0.0%) | 0 (0.0%) |
| Administrative & Support | 2 (100.0%) | 0 (0.0%) |
| Educational Services | 4 (50.0%) | 4 (50.0%) |
| Health Care & Social Assistance | 4 (18.2%) | 18 (81.8%) |
| Arts, Entertainment & Recreation | 14 (58.3%) | 10 (41.7%) |
| Accommodation & Food Services | 0 (0.0%) | 7 (100.0%) |
| Public Administration | 6 (33.3%) | 12 (66.7%) |
| Total | 45 (42.9%) | 60 (57.1%) |
Education in Naytahwaush
School Enrollment in Naytahwaush
The most common levels of schooling among the 152 students in Naytahwaush are elementary school (45 | 29.6%), middle school (43 | 28.3%), and high school (35 | 23.0%).
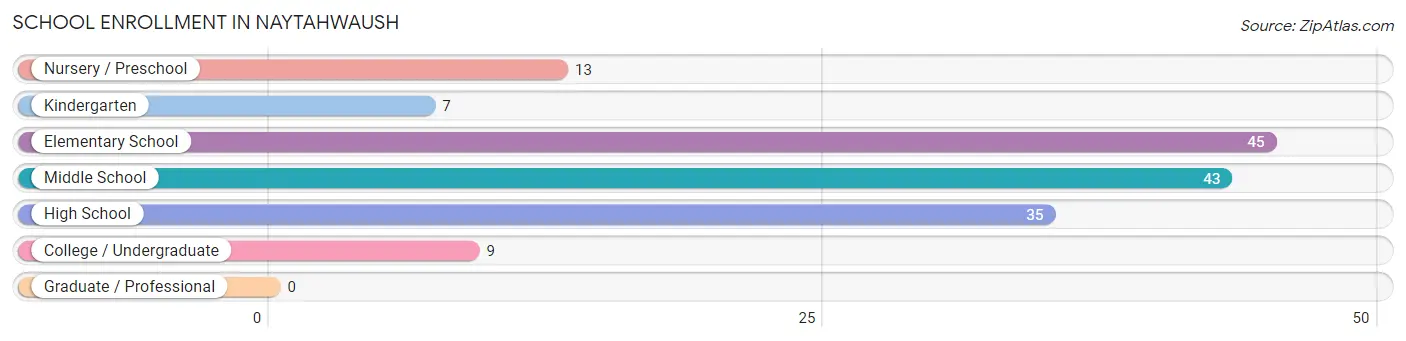
| School Level | # Students | % Students |
| Nursery / Preschool | 13 | 8.6% |
| Kindergarten | 7 | 4.6% |
| Elementary School | 45 | 29.6% |
| Middle School | 43 | 28.3% |
| High School | 35 | 23.0% |
| College / Undergraduate | 9 | 5.9% |
| Graduate / Professional | 0 | 0.0% |
| Total | 152 | 100.0% |
School Enrollment by Age by Funding Source in Naytahwaush
Out of a total of 152 students who are enrolled in schools in Naytahwaush, 3 (2.0%) attend a private institution, while the remaining 149 (98.0%) are enrolled in public schools. The age group of 25 to 34 year olds has the highest likelihood of being enrolled in private schools, with 3 (42.9% in the age bracket) enrolled. Conversely, the age group of 3 to 4 year olds has the lowest likelihood of being enrolled in a private school, with 14 (100.0% in the age bracket) attending a public institution.
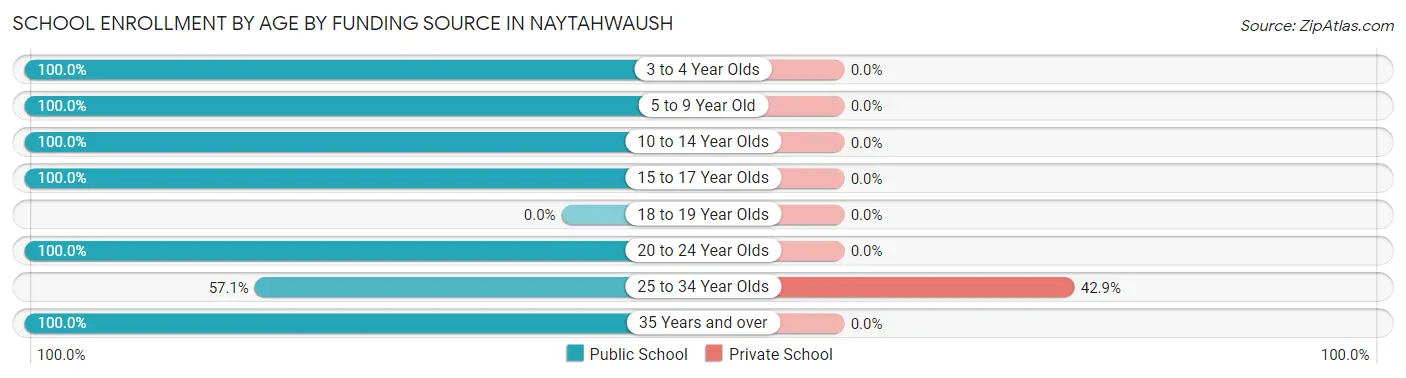
| Age Bracket | Public School | Private School |
| 3 to 4 Year Olds | 14 (100.0%) | 0 (0.0%) |
| 5 to 9 Year Old | 46 (100.0%) | 0 (0.0%) |
| 10 to 14 Year Olds | 56 (100.0%) | 0 (0.0%) |
| 15 to 17 Year Olds | 23 (100.0%) | 0 (0.0%) |
| 18 to 19 Year Olds | 0 (0.0%) | 0 (0.0%) |
| 20 to 24 Year Olds | 4 (100.0%) | 0 (0.0%) |
| 25 to 34 Year Olds | 4 (57.1%) | 3 (42.9%) |
| 35 Years and over | 2 (100.0%) | 0 (0.0%) |
| Total | 149 (98.0%) | 3 (2.0%) |
Educational Attainment by Field of Study in Naytahwaush
Social sciences (4 | 50.0%), and education (4 | 50.0%) are the most common fields of study among 8 individuals in Naytahwaush who have obtained a bachelor's degree or higher.
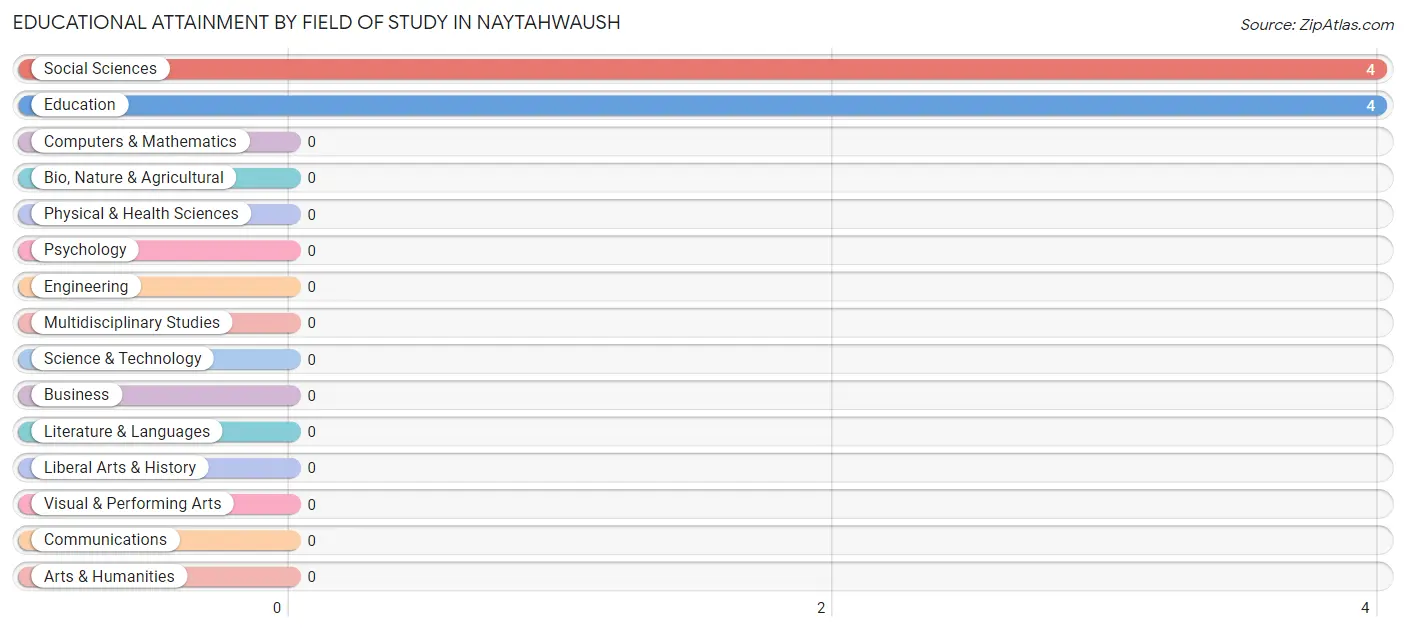
| Field of Study | # Graduates | % Graduates |
| Computers & Mathematics | 0 | 0.0% |
| Bio, Nature & Agricultural | 0 | 0.0% |
| Physical & Health Sciences | 0 | 0.0% |
| Psychology | 0 | 0.0% |
| Social Sciences | 4 | 50.0% |
| Engineering | 0 | 0.0% |
| Multidisciplinary Studies | 0 | 0.0% |
| Science & Technology | 0 | 0.0% |
| Business | 0 | 0.0% |
| Education | 4 | 50.0% |
| Literature & Languages | 0 | 0.0% |
| Liberal Arts & History | 0 | 0.0% |
| Visual & Performing Arts | 0 | 0.0% |
| Communications | 0 | 0.0% |
| Arts & Humanities | 0 | 0.0% |
| Total | 8 | 100.0% |
Transportation & Commute in Naytahwaush
Vehicle Availability by Sex in Naytahwaush
The most prevalent vehicle ownership categories in Naytahwaush are males with 1 vehicle (25, accounting for 55.6%) and females with 1 vehicle (17, making up 41.7%).
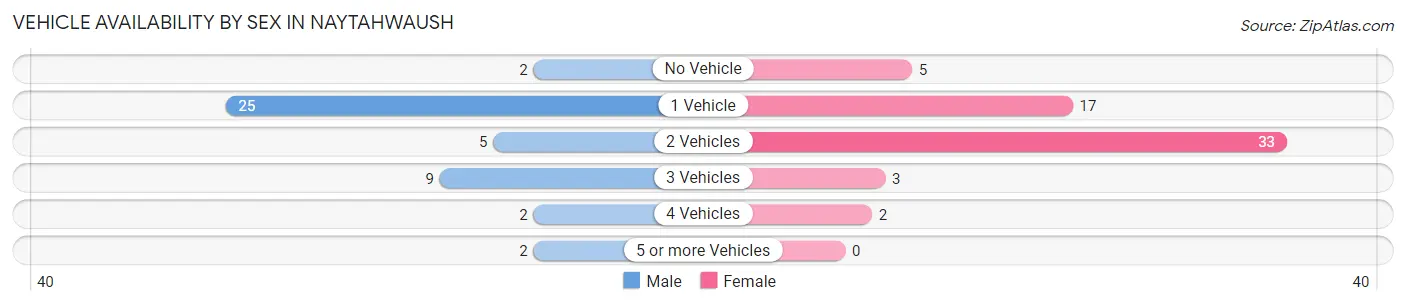
| Vehicles Available | Male | Female |
| No Vehicle | 2 (4.4%) | 5 (8.3%) |
| 1 Vehicle | 25 (55.6%) | 17 (28.3%) |
| 2 Vehicles | 5 (11.1%) | 33 (55.0%) |
| 3 Vehicles | 9 (20.0%) | 3 (5.0%) |
| 4 Vehicles | 2 (4.4%) | 2 (3.3%) |
| 5 or more Vehicles | 2 (4.4%) | 0 (0.0%) |
| Total | 45 (100.0%) | 60 (100.0%) |
Commute Time in Naytahwaush
The most frequently occuring commute durations in Naytahwaush are 30 to 34 minutes (27 commuters, 27.0%), less than 5 minutes (21 commuters, 21.0%), and 20 to 24 minutes (19 commuters, 19.0%).
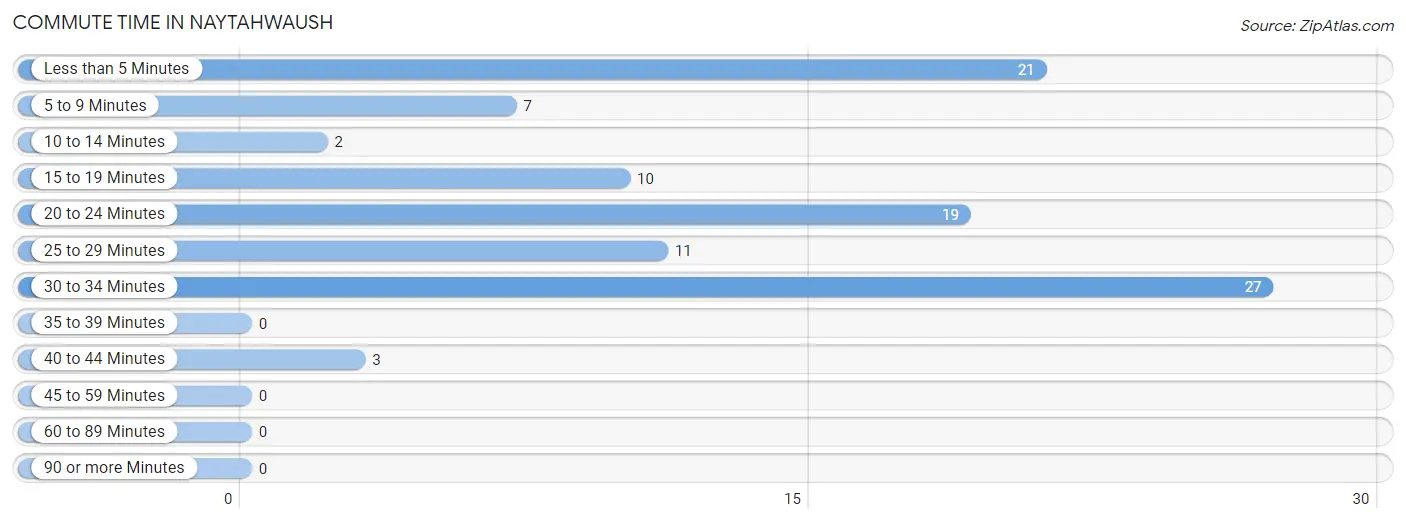
| Commute Time | # Commuters | % Commuters |
| Less than 5 Minutes | 21 | 21.0% |
| 5 to 9 Minutes | 7 | 7.0% |
| 10 to 14 Minutes | 2 | 2.0% |
| 15 to 19 Minutes | 10 | 10.0% |
| 20 to 24 Minutes | 19 | 19.0% |
| 25 to 29 Minutes | 11 | 11.0% |
| 30 to 34 Minutes | 27 | 27.0% |
| 35 to 39 Minutes | 0 | 0.0% |
| 40 to 44 Minutes | 3 | 3.0% |
| 45 to 59 Minutes | 0 | 0.0% |
| 60 to 89 Minutes | 0 | 0.0% |
| 90 or more Minutes | 0 | 0.0% |
Commute Time by Sex in Naytahwaush
The most common commute times in Naytahwaush are 30 to 34 minutes (18 commuters, 45.0%) for males and less than 5 minutes (16 commuters, 26.7%) for females.

| Commute Time | Male | Female |
| Less than 5 Minutes | 5 (12.5%) | 16 (26.7%) |
| 5 to 9 Minutes | 0 (0.0%) | 7 (11.7%) |
| 10 to 14 Minutes | 0 (0.0%) | 2 (3.3%) |
| 15 to 19 Minutes | 0 (0.0%) | 10 (16.7%) |
| 20 to 24 Minutes | 6 (15.0%) | 13 (21.7%) |
| 25 to 29 Minutes | 11 (27.5%) | 0 (0.0%) |
| 30 to 34 Minutes | 18 (45.0%) | 9 (15.0%) |
| 35 to 39 Minutes | 0 (0.0%) | 0 (0.0%) |
| 40 to 44 Minutes | 0 (0.0%) | 3 (5.0%) |
| 45 to 59 Minutes | 0 (0.0%) | 0 (0.0%) |
| 60 to 89 Minutes | 0 (0.0%) | 0 (0.0%) |
| 90 or more Minutes | 0 (0.0%) | 0 (0.0%) |
Time of Departure to Work by Sex in Naytahwaush
The most frequent times of departure to work in Naytahwaush are 7:00 AM to 7:29 AM (15, 37.5%) for males and 7:30 AM to 7:59 AM (18, 30.0%) for females.
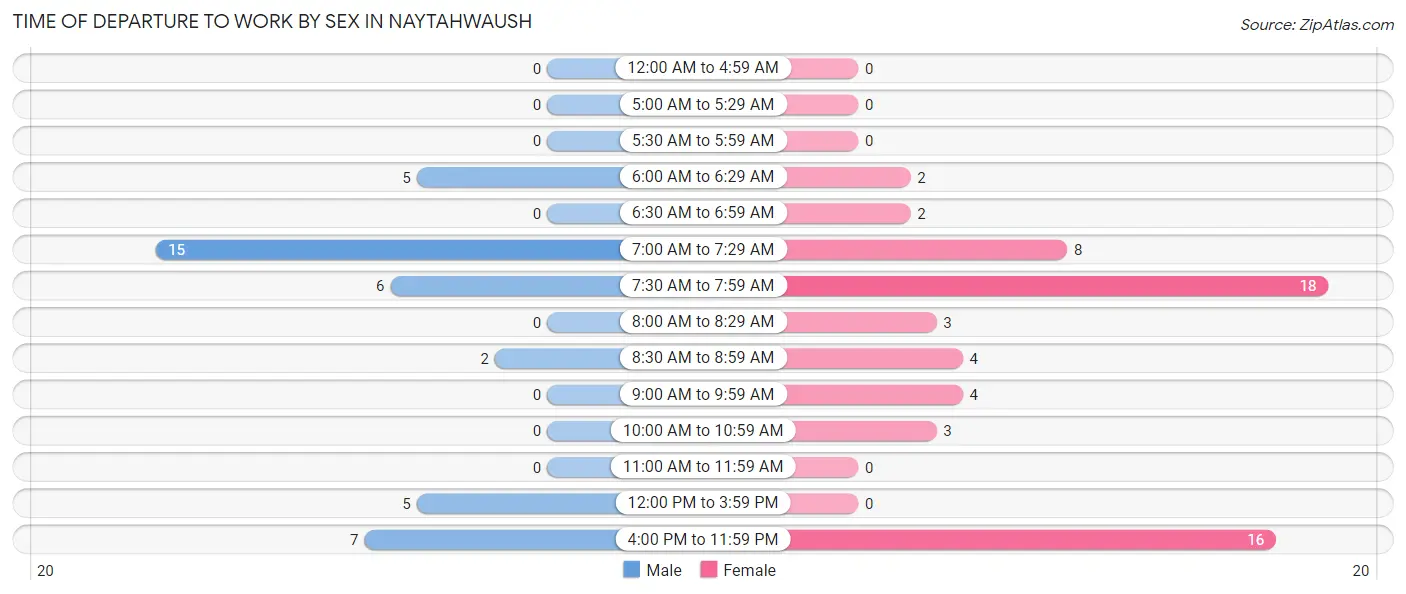
| Time of Departure | Male | Female |
| 12:00 AM to 4:59 AM | 0 (0.0%) | 0 (0.0%) |
| 5:00 AM to 5:29 AM | 0 (0.0%) | 0 (0.0%) |
| 5:30 AM to 5:59 AM | 0 (0.0%) | 0 (0.0%) |
| 6:00 AM to 6:29 AM | 5 (12.5%) | 2 (3.3%) |
| 6:30 AM to 6:59 AM | 0 (0.0%) | 2 (3.3%) |
| 7:00 AM to 7:29 AM | 15 (37.5%) | 8 (13.3%) |
| 7:30 AM to 7:59 AM | 6 (15.0%) | 18 (30.0%) |
| 8:00 AM to 8:29 AM | 0 (0.0%) | 3 (5.0%) |
| 8:30 AM to 8:59 AM | 2 (5.0%) | 4 (6.7%) |
| 9:00 AM to 9:59 AM | 0 (0.0%) | 4 (6.7%) |
| 10:00 AM to 10:59 AM | 0 (0.0%) | 3 (5.0%) |
| 11:00 AM to 11:59 AM | 0 (0.0%) | 0 (0.0%) |
| 12:00 PM to 3:59 PM | 5 (12.5%) | 0 (0.0%) |
| 4:00 PM to 11:59 PM | 7 (17.5%) | 16 (26.7%) |
| Total | 40 (100.0%) | 60 (100.0%) |
Housing Occupancy in Naytahwaush
Occupancy by Ownership in Naytahwaush
Of the total 144 dwellings in Naytahwaush, owner-occupied units account for 48 (33.3%), while renter-occupied units make up 96 (66.7%).
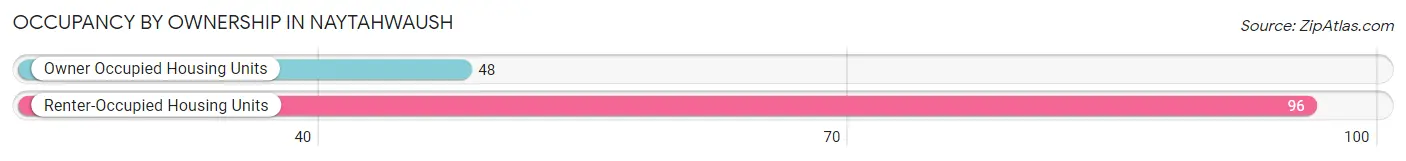
| Occupancy | # Housing Units | % Housing Units |
| Owner Occupied Housing Units | 48 | 33.3% |
| Renter-Occupied Housing Units | 96 | 66.7% |
| Total Occupied Housing Units | 144 | 100.0% |
Occupancy by Household Size in Naytahwaush
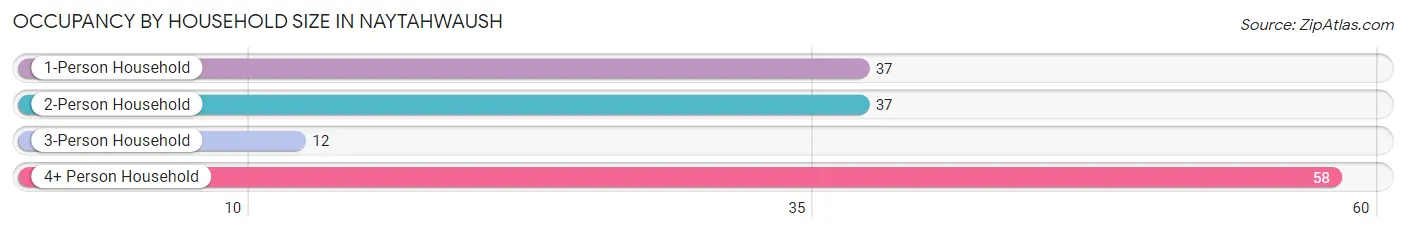
| Household Size | # Housing Units | % Housing Units |
| 1-Person Household | 37 | 25.7% |
| 2-Person Household | 37 | 25.7% |
| 3-Person Household | 12 | 8.3% |
| 4+ Person Household | 58 | 40.3% |
| Total Housing Units | 144 | 100.0% |
Occupancy by Ownership by Household Size in Naytahwaush
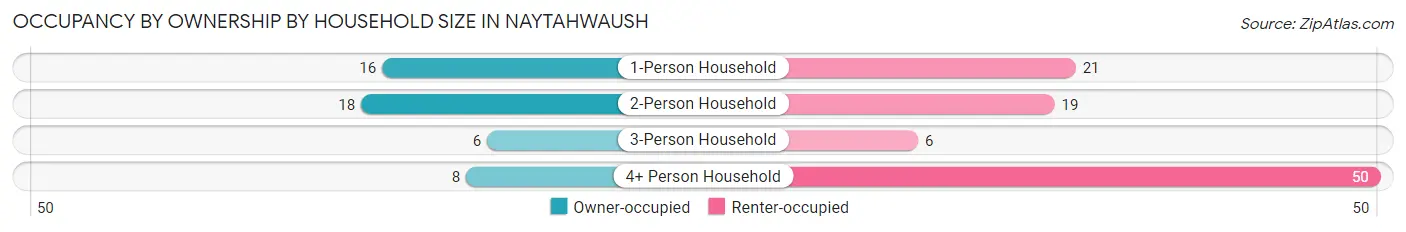
| Household Size | Owner-occupied | Renter-occupied |
| 1-Person Household | 16 (43.2%) | 21 (56.8%) |
| 2-Person Household | 18 (48.6%) | 19 (51.3%) |
| 3-Person Household | 6 (50.0%) | 6 (50.0%) |
| 4+ Person Household | 8 (13.8%) | 50 (86.2%) |
| Total Housing Units | 48 (33.3%) | 96 (66.7%) |
Occupancy by Educational Attainment in Naytahwaush
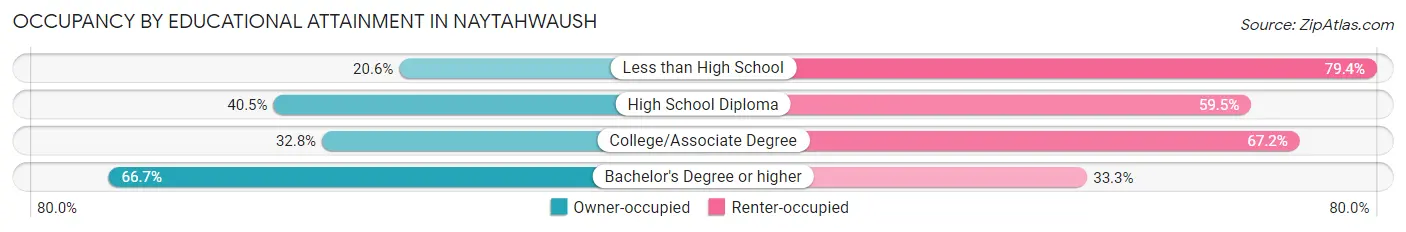
| Household Size | Owner-occupied | Renter-occupied |
| Less than High School | 7 (20.6%) | 27 (79.4%) |
| High School Diploma | 15 (40.5%) | 22 (59.5%) |
| College/Associate Degree | 22 (32.8%) | 45 (67.2%) |
| Bachelor's Degree or higher | 4 (66.7%) | 2 (33.3%) |
Occupancy by Age of Householder in Naytahwaush
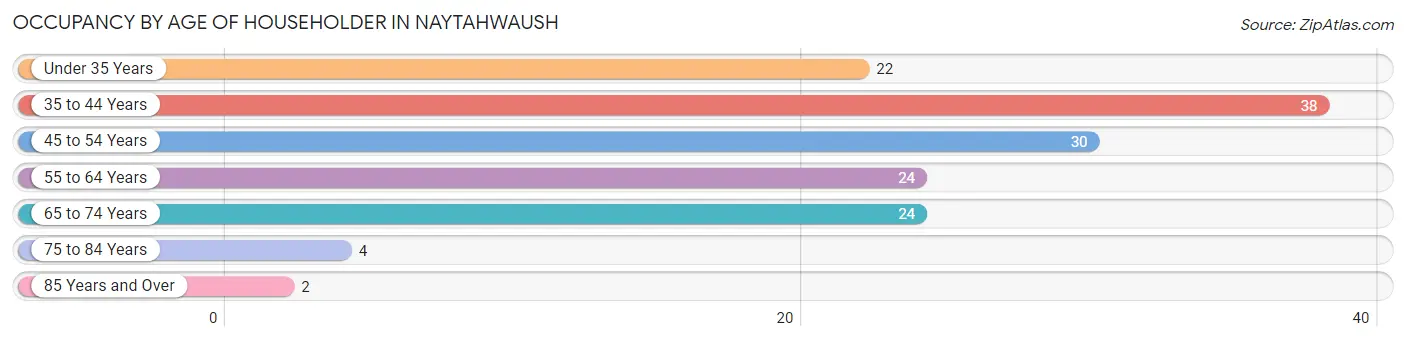
| Age Bracket | # Households | % Households |
| Under 35 Years | 22 | 15.3% |
| 35 to 44 Years | 38 | 26.4% |
| 45 to 54 Years | 30 | 20.8% |
| 55 to 64 Years | 24 | 16.7% |
| 65 to 74 Years | 24 | 16.7% |
| 75 to 84 Years | 4 | 2.8% |
| 85 Years and Over | 2 | 1.4% |
| Total | 144 | 100.0% |
Housing Finances in Naytahwaush
Median Income by Occupancy in Naytahwaush
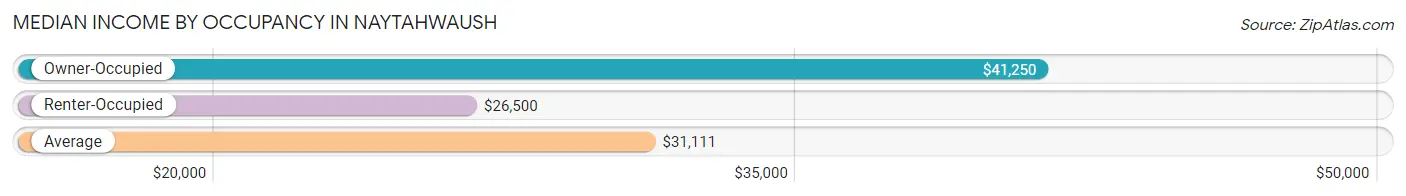
| Occupancy Type | # Households | Median Income |
| Owner-Occupied | 48 (33.3%) | $41,250 |
| Renter-Occupied | 96 (66.7%) | $26,500 |
| Average | 144 (100.0%) | $31,111 |
Occupancy by Householder Income Bracket in Naytahwaush
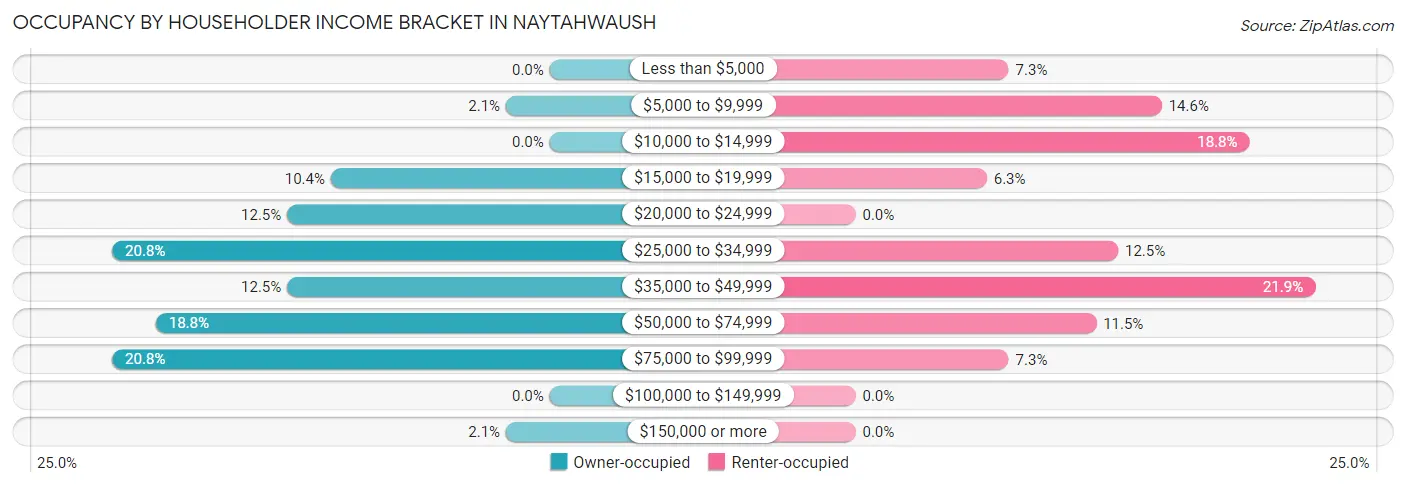
| Income Bracket | Owner-occupied | Renter-occupied |
| Less than $5,000 | 0 (0.0%) | 7 (7.3%) |
| $5,000 to $9,999 | 1 (2.1%) | 14 (14.6%) |
| $10,000 to $14,999 | 0 (0.0%) | 18 (18.8%) |
| $15,000 to $19,999 | 5 (10.4%) | 6 (6.2%) |
| $20,000 to $24,999 | 6 (12.5%) | 0 (0.0%) |
| $25,000 to $34,999 | 10 (20.8%) | 12 (12.5%) |
| $35,000 to $49,999 | 6 (12.5%) | 21 (21.9%) |
| $50,000 to $74,999 | 9 (18.8%) | 11 (11.5%) |
| $75,000 to $99,999 | 10 (20.8%) | 7 (7.3%) |
| $100,000 to $149,999 | 0 (0.0%) | 0 (0.0%) |
| $150,000 or more | 1 (2.1%) | 0 (0.0%) |
| Total | 48 (100.0%) | 96 (100.0%) |
Monthly Housing Cost Tiers in Naytahwaush
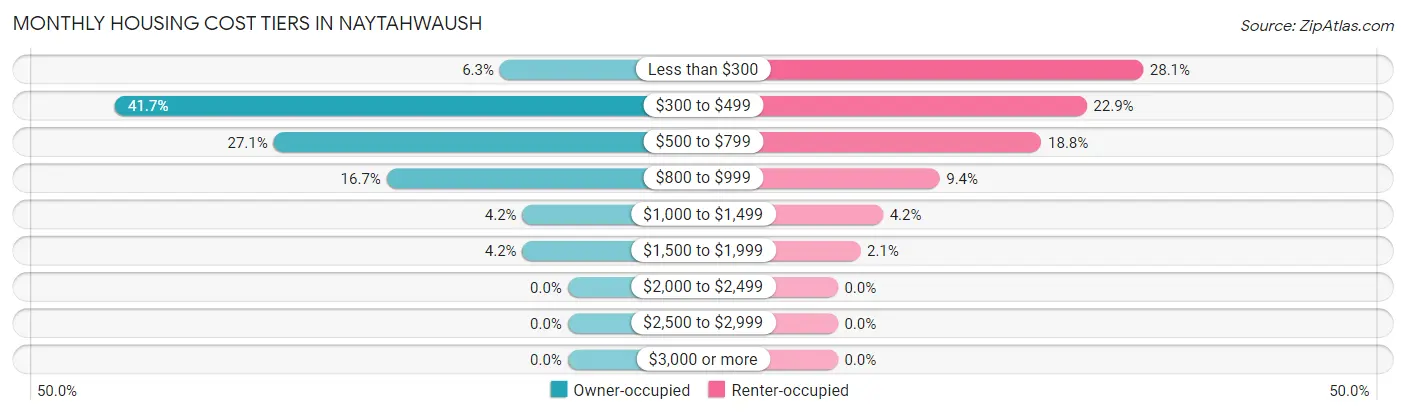
| Monthly Cost | Owner-occupied | Renter-occupied |
| Less than $300 | 3 (6.2%) | 27 (28.1%) |
| $300 to $499 | 20 (41.7%) | 22 (22.9%) |
| $500 to $799 | 13 (27.1%) | 18 (18.8%) |
| $800 to $999 | 8 (16.7%) | 9 (9.4%) |
| $1,000 to $1,499 | 2 (4.2%) | 4 (4.2%) |
| $1,500 to $1,999 | 2 (4.2%) | 2 (2.1%) |
| $2,000 to $2,499 | 0 (0.0%) | 0 (0.0%) |
| $2,500 to $2,999 | 0 (0.0%) | 0 (0.0%) |
| $3,000 or more | 0 (0.0%) | 0 (0.0%) |
| Total | 48 (100.0%) | 96 (100.0%) |
Physical Housing Characteristics in Naytahwaush
Housing Structures in Naytahwaush
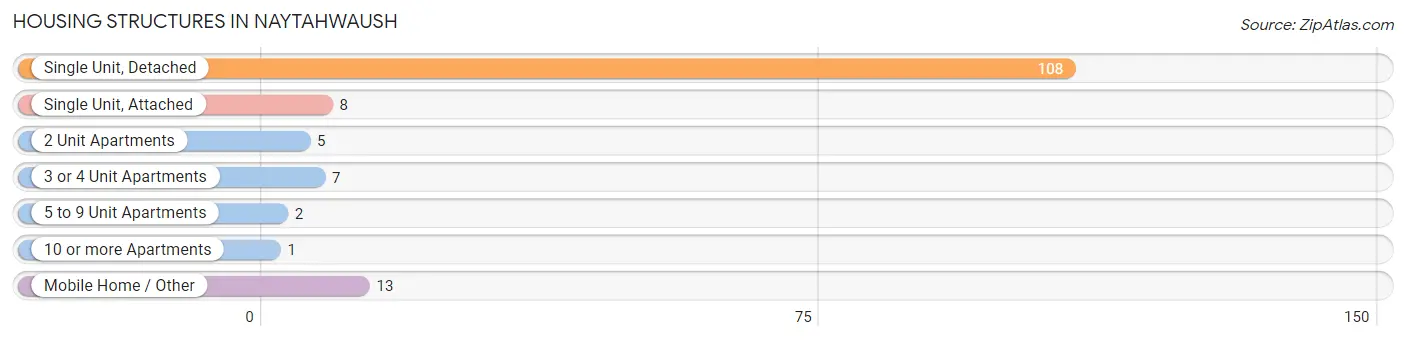
| Structure Type | # Housing Units | % Housing Units |
| Single Unit, Detached | 108 | 75.0% |
| Single Unit, Attached | 8 | 5.6% |
| 2 Unit Apartments | 5 | 3.5% |
| 3 or 4 Unit Apartments | 7 | 4.9% |
| 5 to 9 Unit Apartments | 2 | 1.4% |
| 10 or more Apartments | 1 | 0.7% |
| Mobile Home / Other | 13 | 9.0% |
| Total | 144 | 100.0% |
Housing Structures by Occupancy in Naytahwaush
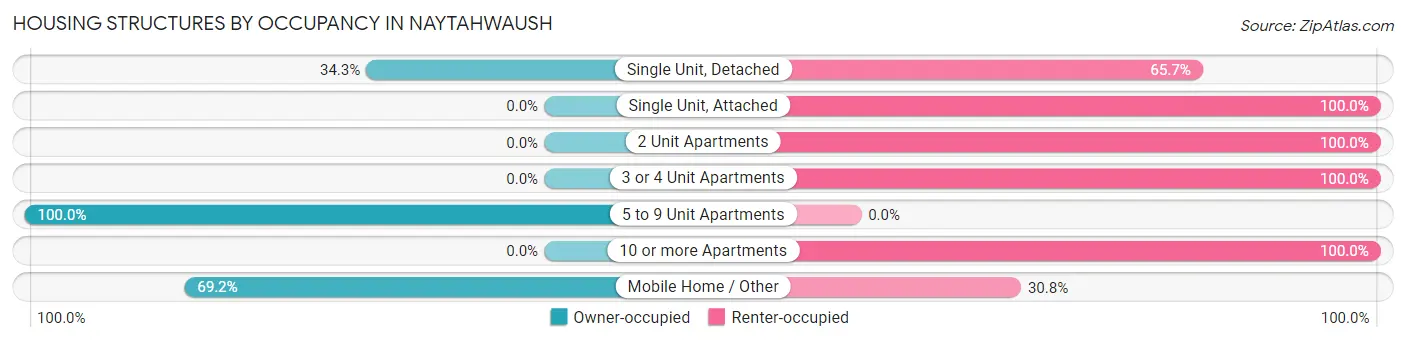
| Structure Type | Owner-occupied | Renter-occupied |
| Single Unit, Detached | 37 (34.3%) | 71 (65.7%) |
| Single Unit, Attached | 0 (0.0%) | 8 (100.0%) |
| 2 Unit Apartments | 0 (0.0%) | 5 (100.0%) |
| 3 or 4 Unit Apartments | 0 (0.0%) | 7 (100.0%) |
| 5 to 9 Unit Apartments | 2 (100.0%) | 0 (0.0%) |
| 10 or more Apartments | 0 (0.0%) | 1 (100.0%) |
| Mobile Home / Other | 9 (69.2%) | 4 (30.8%) |
| Total | 48 (33.3%) | 96 (66.7%) |
Housing Structures by Number of Rooms in Naytahwaush
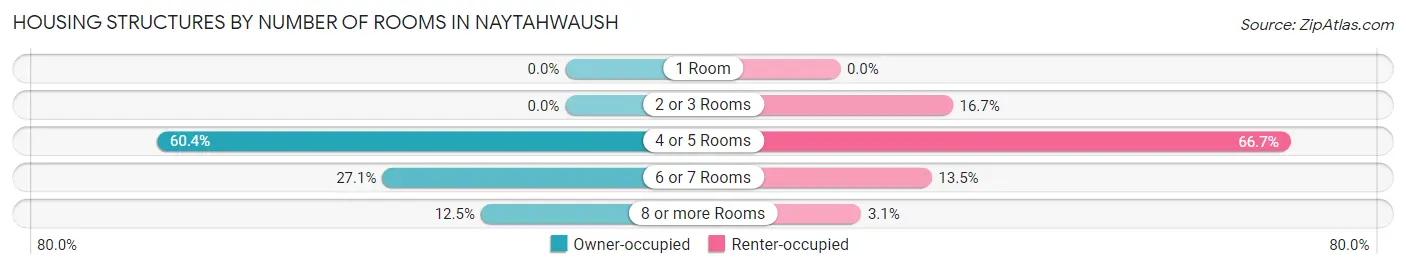
| Number of Rooms | Owner-occupied | Renter-occupied |
| 1 Room | 0 (0.0%) | 0 (0.0%) |
| 2 or 3 Rooms | 0 (0.0%) | 16 (16.7%) |
| 4 or 5 Rooms | 29 (60.4%) | 64 (66.7%) |
| 6 or 7 Rooms | 13 (27.1%) | 13 (13.5%) |
| 8 or more Rooms | 6 (12.5%) | 3 (3.1%) |
| Total | 48 (100.0%) | 96 (100.0%) |
Housing Structure by Heating Type in Naytahwaush
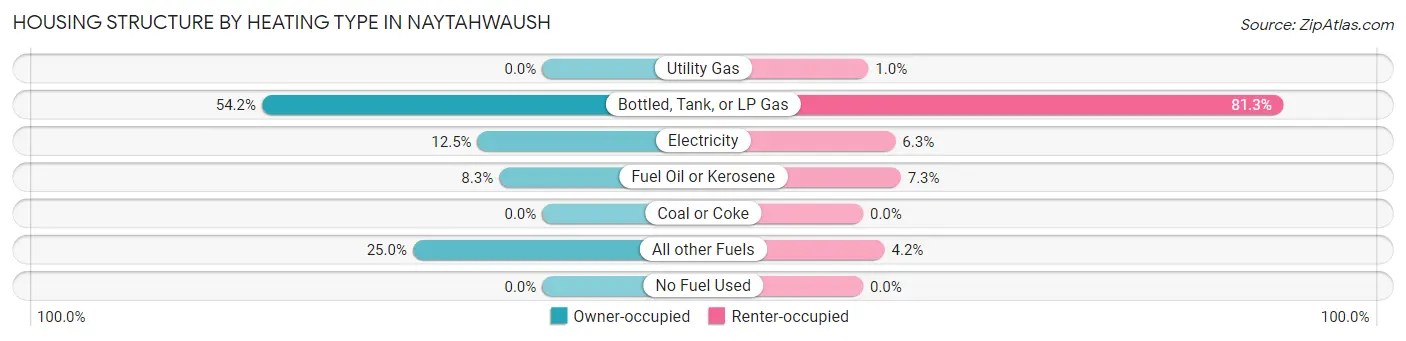
| Heating Type | Owner-occupied | Renter-occupied |
| Utility Gas | 0 (0.0%) | 1 (1.0%) |
| Bottled, Tank, or LP Gas | 26 (54.2%) | 78 (81.2%) |
| Electricity | 6 (12.5%) | 6 (6.2%) |
| Fuel Oil or Kerosene | 4 (8.3%) | 7 (7.3%) |
| Coal or Coke | 0 (0.0%) | 0 (0.0%) |
| All other Fuels | 12 (25.0%) | 4 (4.2%) |
| No Fuel Used | 0 (0.0%) | 0 (0.0%) |
| Total | 48 (100.0%) | 96 (100.0%) |
Household Vehicle Usage in Naytahwaush
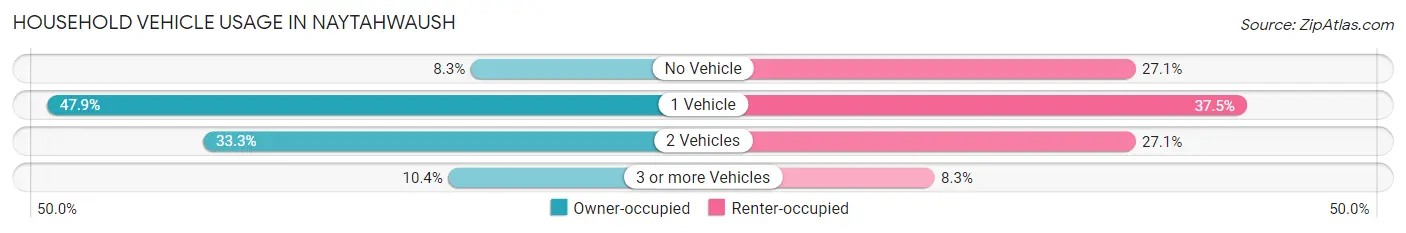
| Vehicles per Household | Owner-occupied | Renter-occupied |
| No Vehicle | 4 (8.3%) | 26 (27.1%) |
| 1 Vehicle | 23 (47.9%) | 36 (37.5%) |
| 2 Vehicles | 16 (33.3%) | 26 (27.1%) |
| 3 or more Vehicles | 5 (10.4%) | 8 (8.3%) |
| Total | 48 (100.0%) | 96 (100.0%) |
Real Estate & Mortgages in Naytahwaush
Real Estate and Mortgage Overview in Naytahwaush
| Characteristic | Without Mortgage | With Mortgage |
| Housing Units | 38 | 10 |
| Median Property Value | $81,400 | $77,500 |
| Median Household Income | $31,875 | $0 |
| Monthly Housing Costs | $433 | $0 |
| Real Estate Taxes | $800 | $2 |
Property Value by Mortgage Status in Naytahwaush
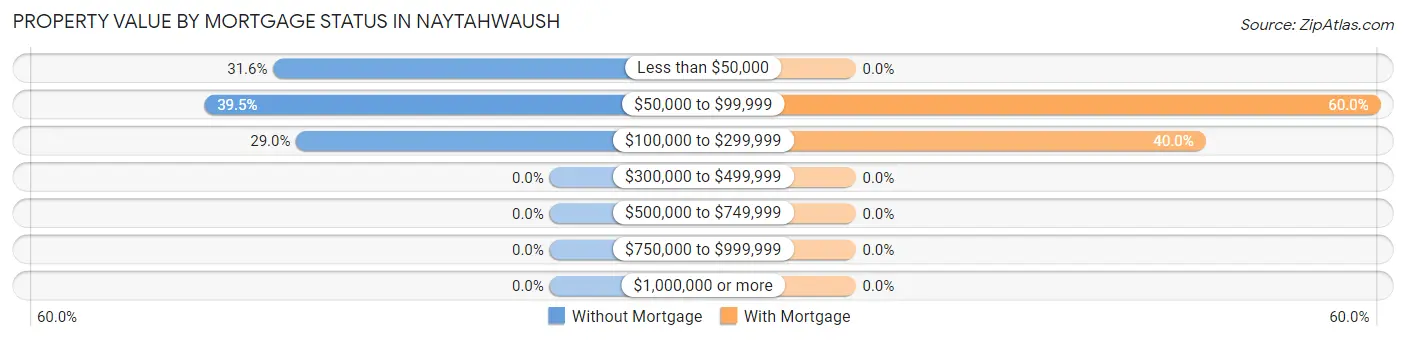
| Property Value | Without Mortgage | With Mortgage |
| Less than $50,000 | 12 (31.6%) | 0 (0.0%) |
| $50,000 to $99,999 | 15 (39.5%) | 6 (60.0%) |
| $100,000 to $299,999 | 11 (28.9%) | 4 (40.0%) |
| $300,000 to $499,999 | 0 (0.0%) | 0 (0.0%) |
| $500,000 to $749,999 | 0 (0.0%) | 0 (0.0%) |
| $750,000 to $999,999 | 0 (0.0%) | 0 (0.0%) |
| $1,000,000 or more | 0 (0.0%) | 0 (0.0%) |
| Total | 38 (100.0%) | 10 (100.0%) |
Household Income by Mortgage Status in Naytahwaush
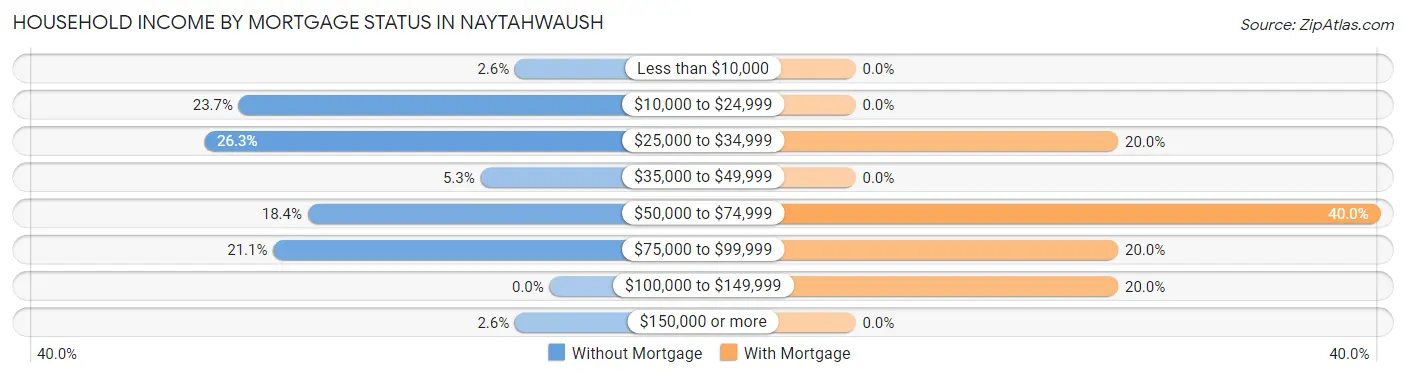
| Household Income | Without Mortgage | With Mortgage |
| Less than $10,000 | 1 (2.6%) | 0 (0.0%) |
| $10,000 to $24,999 | 9 (23.7%) | 0 (0.0%) |
| $25,000 to $34,999 | 10 (26.3%) | 2 (20.0%) |
| $35,000 to $49,999 | 2 (5.3%) | 0 (0.0%) |
| $50,000 to $74,999 | 7 (18.4%) | 4 (40.0%) |
| $75,000 to $99,999 | 8 (21.0%) | 2 (20.0%) |
| $100,000 to $149,999 | 0 (0.0%) | 2 (20.0%) |
| $150,000 or more | 1 (2.6%) | 0 (0.0%) |
| Total | 38 (100.0%) | 10 (100.0%) |
Property Value to Household Income Ratio in Naytahwaush
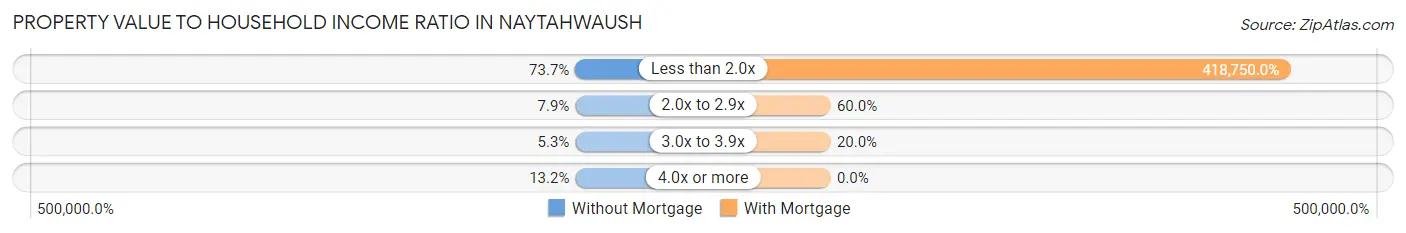
| Value-to-Income Ratio | Without Mortgage | With Mortgage |
| Less than 2.0x | 28 (73.7%) | 41,875 (418,750.0%) |
| 2.0x to 2.9x | 3 (7.9%) | 6 (60.0%) |
| 3.0x to 3.9x | 2 (5.3%) | 2 (20.0%) |
| 4.0x or more | 5 (13.2%) | 0 (0.0%) |
| Total | 38 (100.0%) | 10 (100.0%) |
Real Estate Taxes by Mortgage Status in Naytahwaush
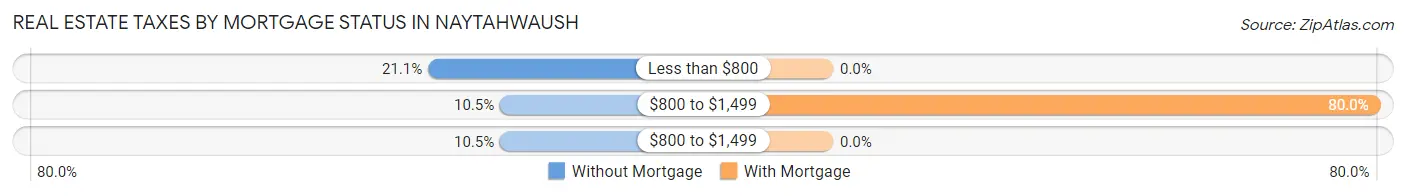
| Property Taxes | Without Mortgage | With Mortgage |
| Less than $800 | 8 (21.0%) | 0 (0.0%) |
| $800 to $1,499 | 4 (10.5%) | 8 (80.0%) |
| $800 to $1,499 | 4 (10.5%) | 0 (0.0%) |
| Total | 38 (100.0%) | 10 (100.0%) |
Health & Disability in Naytahwaush
Health Insurance Coverage by Age in Naytahwaush
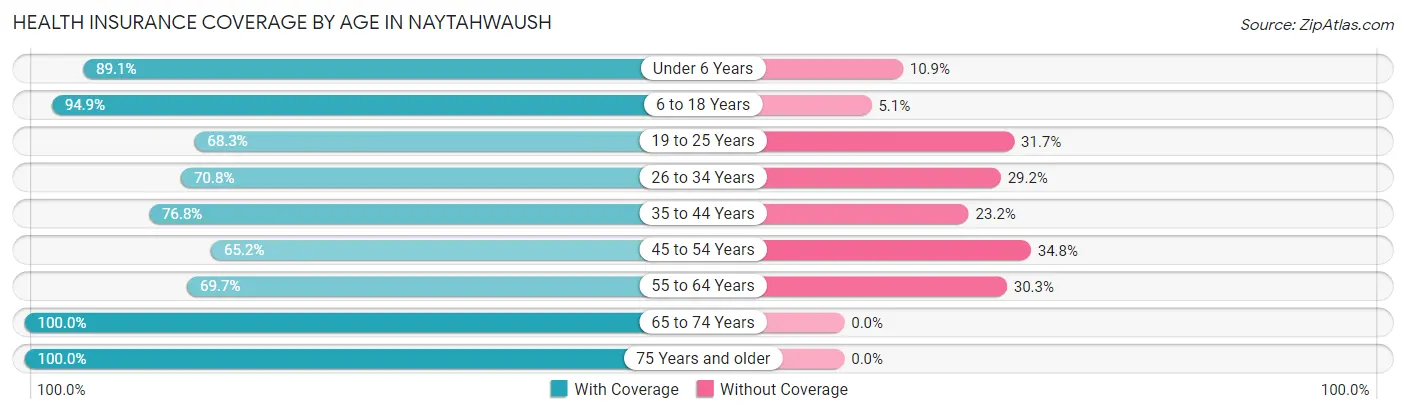
| Age Bracket | With Coverage | Without Coverage |
| Under 6 Years | 49 (89.1%) | 6 (10.9%) |
| 6 to 18 Years | 131 (94.9%) | 7 (5.1%) |
| 19 to 25 Years | 41 (68.3%) | 19 (31.7%) |
| 26 to 34 Years | 17 (70.8%) | 7 (29.2%) |
| 35 to 44 Years | 53 (76.8%) | 16 (23.2%) |
| 45 to 54 Years | 30 (65.2%) | 16 (34.8%) |
| 55 to 64 Years | 23 (69.7%) | 10 (30.3%) |
| 65 to 74 Years | 26 (100.0%) | 0 (0.0%) |
| 75 Years and older | 21 (100.0%) | 0 (0.0%) |
| Total | 391 (82.8%) | 81 (17.2%) |
Health Insurance Coverage by Citizenship Status in Naytahwaush
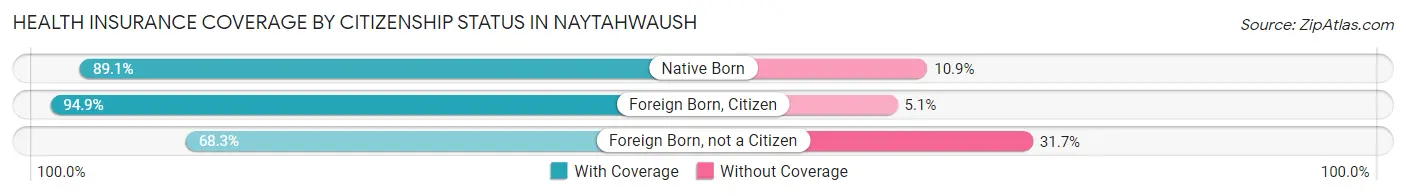
| Citizenship Status | With Coverage | Without Coverage |
| Native Born | 49 (89.1%) | 6 (10.9%) |
| Foreign Born, Citizen | 131 (94.9%) | 7 (5.1%) |
| Foreign Born, not a Citizen | 41 (68.3%) | 19 (31.7%) |
Health Insurance Coverage by Household Income in Naytahwaush
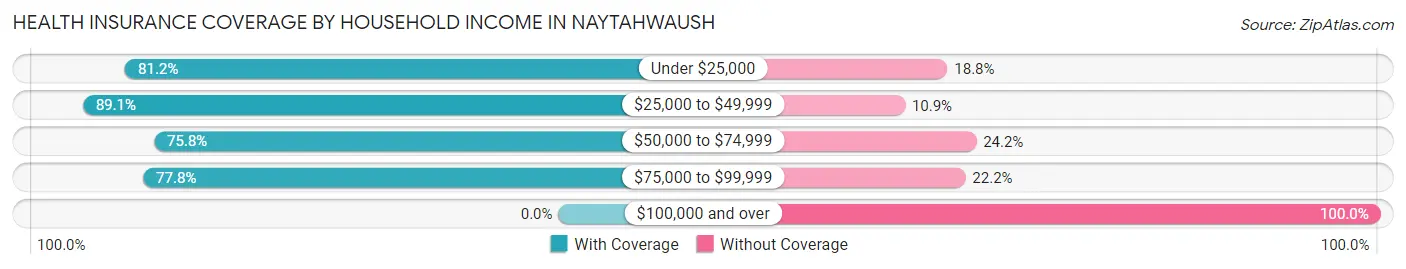
| Household Income | With Coverage | Without Coverage |
| Under $25,000 | 112 (81.2%) | 26 (18.8%) |
| $25,000 to $49,999 | 180 (89.1%) | 22 (10.9%) |
| $50,000 to $74,999 | 50 (75.8%) | 16 (24.2%) |
| $75,000 to $99,999 | 49 (77.8%) | 14 (22.2%) |
| $100,000 and over | 0 (0.0%) | 3 (100.0%) |
Public vs Private Health Insurance Coverage by Age in Naytahwaush
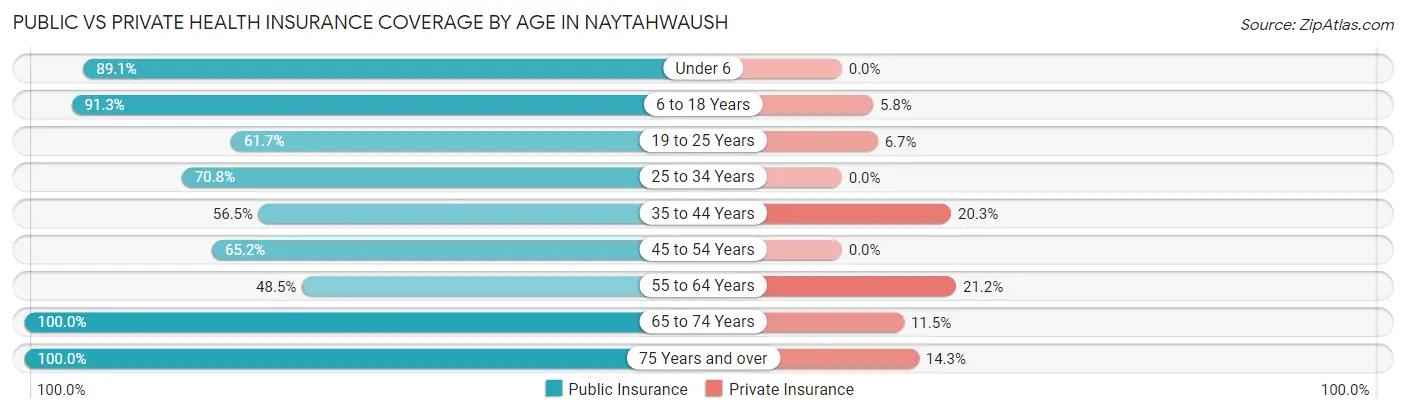
| Age Bracket | Public Insurance | Private Insurance |
| Under 6 | 49 (89.1%) | 0 (0.0%) |
| 6 to 18 Years | 126 (91.3%) | 8 (5.8%) |
| 19 to 25 Years | 37 (61.7%) | 4 (6.7%) |
| 25 to 34 Years | 17 (70.8%) | 0 (0.0%) |
| 35 to 44 Years | 39 (56.5%) | 14 (20.3%) |
| 45 to 54 Years | 30 (65.2%) | 0 (0.0%) |
| 55 to 64 Years | 16 (48.5%) | 7 (21.2%) |
| 65 to 74 Years | 26 (100.0%) | 3 (11.5%) |
| 75 Years and over | 21 (100.0%) | 3 (14.3%) |
| Total | 361 (76.5%) | 39 (8.3%) |
Disability Status by Sex by Age in Naytahwaush
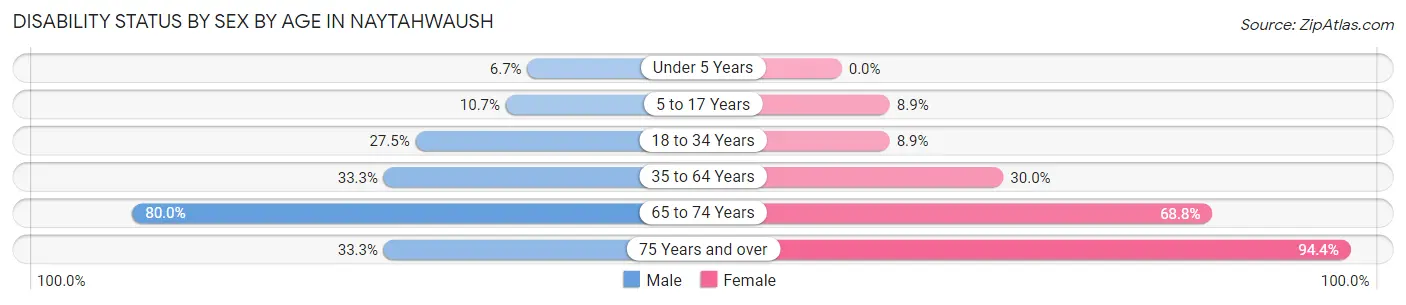
| Age Bracket | Male | Female |
| Under 5 Years | 2 (6.7%) | 0 (0.0%) |
| 5 to 17 Years | 8 (10.7%) | 5 (8.9%) |
| 18 to 34 Years | 14 (27.5%) | 4 (8.9%) |
| 35 to 64 Years | 26 (33.3%) | 21 (30.0%) |
| 65 to 74 Years | 8 (80.0%) | 11 (68.8%) |
| 75 Years and over | 1 (33.3%) | 17 (94.4%) |
Disability Class by Sex by Age in Naytahwaush
Disability Class: Hearing Difficulty
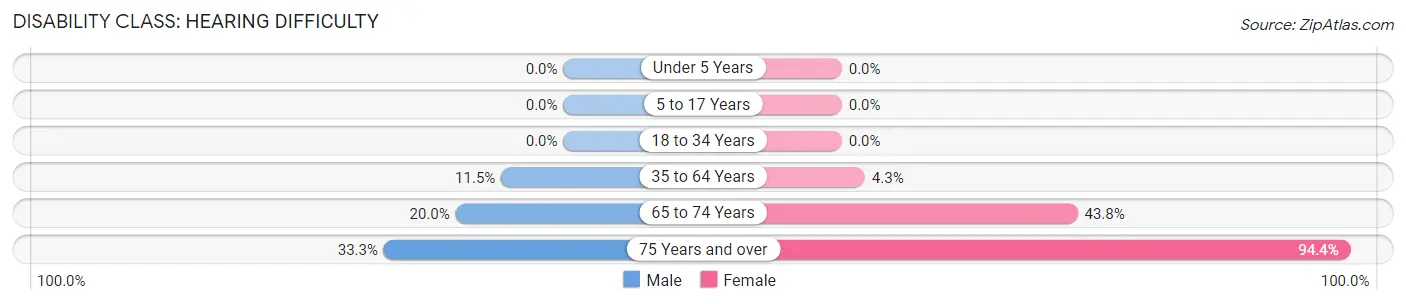
| Age Bracket | Male | Female |
| Under 5 Years | 0 (0.0%) | 0 (0.0%) |
| 5 to 17 Years | 0 (0.0%) | 0 (0.0%) |
| 18 to 34 Years | 0 (0.0%) | 0 (0.0%) |
| 35 to 64 Years | 9 (11.5%) | 3 (4.3%) |
| 65 to 74 Years | 2 (20.0%) | 7 (43.8%) |
| 75 Years and over | 1 (33.3%) | 17 (94.4%) |
Disability Class: Vision Difficulty
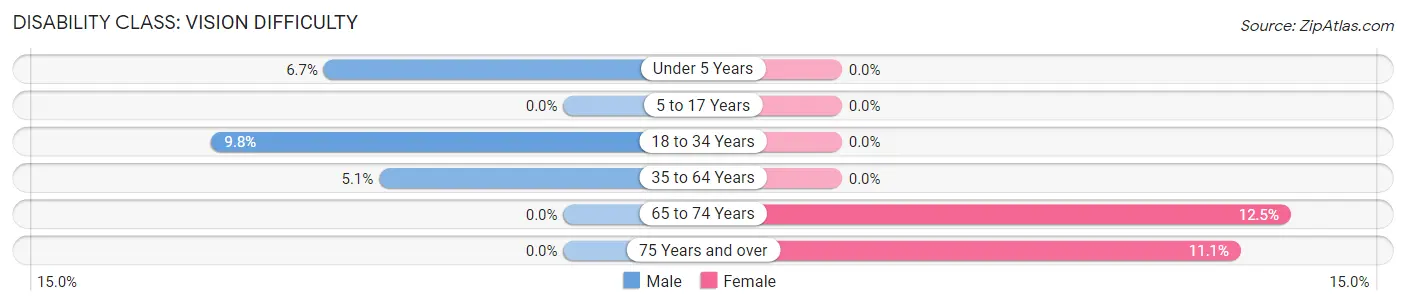
| Age Bracket | Male | Female |
| Under 5 Years | 2 (6.7%) | 0 (0.0%) |
| 5 to 17 Years | 0 (0.0%) | 0 (0.0%) |
| 18 to 34 Years | 5 (9.8%) | 0 (0.0%) |
| 35 to 64 Years | 4 (5.1%) | 0 (0.0%) |
| 65 to 74 Years | 0 (0.0%) | 2 (12.5%) |
| 75 Years and over | 0 (0.0%) | 2 (11.1%) |
Disability Class: Cognitive Difficulty
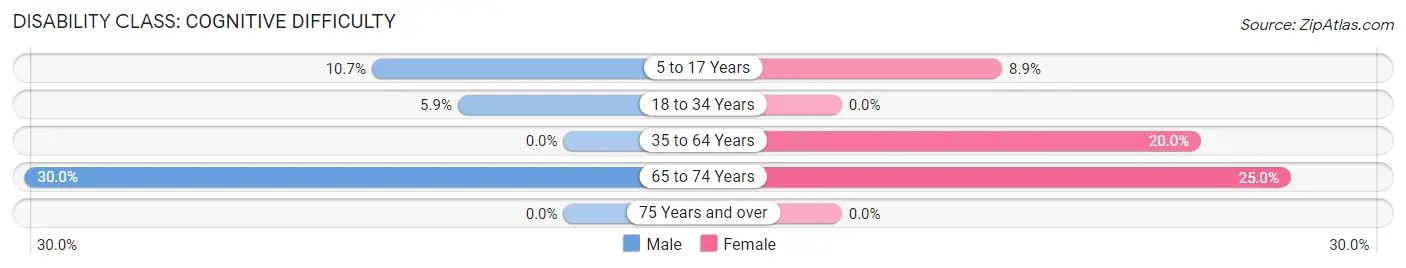
| Age Bracket | Male | Female |
| 5 to 17 Years | 8 (10.7%) | 5 (8.9%) |
| 18 to 34 Years | 3 (5.9%) | 0 (0.0%) |
| 35 to 64 Years | 0 (0.0%) | 14 (20.0%) |
| 65 to 74 Years | 3 (30.0%) | 4 (25.0%) |
| 75 Years and over | 0 (0.0%) | 0 (0.0%) |
Disability Class: Ambulatory Difficulty
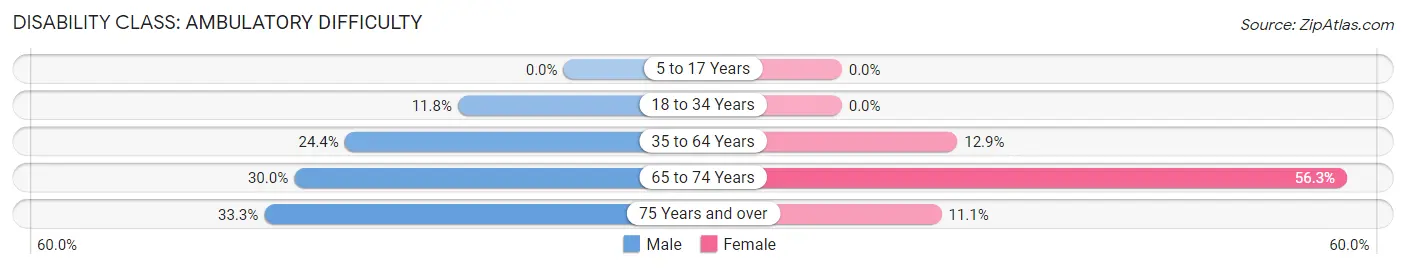
| Age Bracket | Male | Female |
| 5 to 17 Years | 0 (0.0%) | 0 (0.0%) |
| 18 to 34 Years | 6 (11.8%) | 0 (0.0%) |
| 35 to 64 Years | 19 (24.4%) | 9 (12.9%) |
| 65 to 74 Years | 3 (30.0%) | 9 (56.2%) |
| 75 Years and over | 1 (33.3%) | 2 (11.1%) |
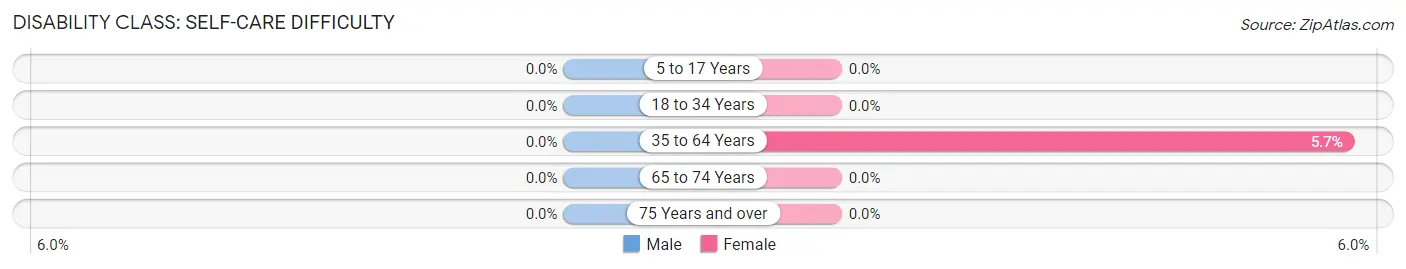
Disability Class: Self-Care Difficulty
| Age Bracket | Male | Female |
| 5 to 17 Years | 0 (0.0%) | 0 (0.0%) |
| 18 to 34 Years | 0 (0.0%) | 0 (0.0%) |
| 35 to 64 Years | 0 (0.0%) | 4 (5.7%) |
| 65 to 74 Years | 0 (0.0%) | 0 (0.0%) |
| 75 Years and over | 0 (0.0%) | 0 (0.0%) |
Technology Access in Naytahwaush
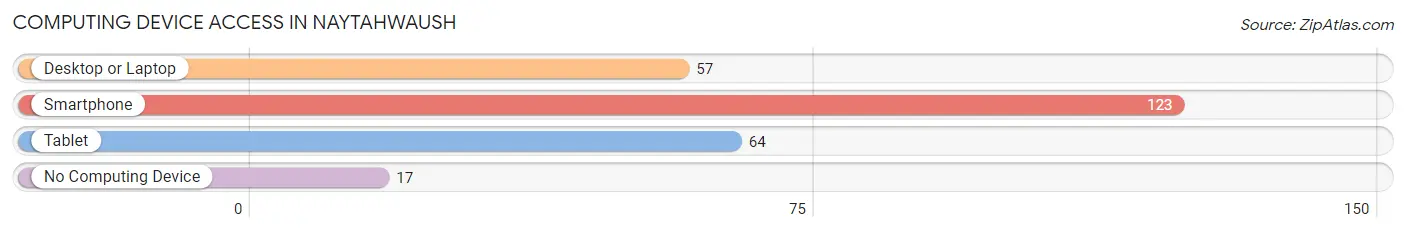
Computing Device Access in Naytahwaush
| Device Type | # Households | % Households |
| Desktop or Laptop | 57 | 39.6% |
| Smartphone | 123 | 85.4% |
| Tablet | 64 | 44.4% |
| No Computing Device | 17 | 11.8% |
| Total | 144 | 100.0% |
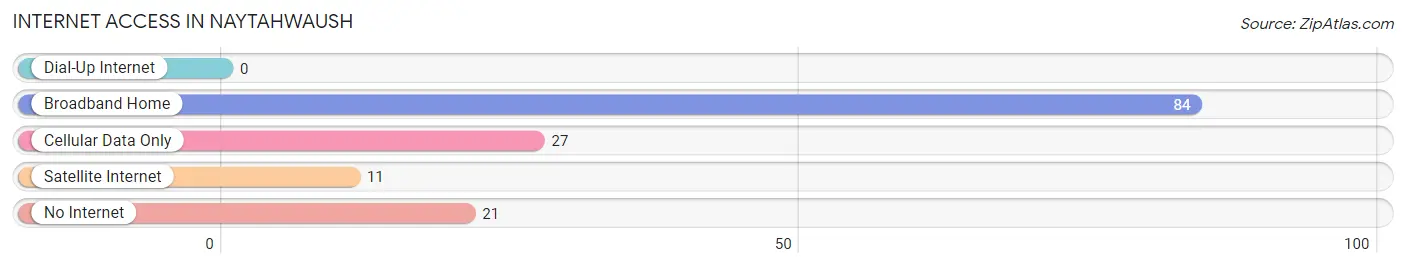
Internet Access in Naytahwaush
| Internet Type | # Households | % Households |
| Dial-Up Internet | 0 | 0.0% |
| Broadband Home | 84 | 58.3% |
| Cellular Data Only | 27 | 18.8% |
| Satellite Internet | 11 | 7.6% |
| No Internet | 21 | 14.6% |
| Total | 144 | 100.0% |
Naytahwaush Summary
Naytahwaush is a small unincorporated community located in the northwestern corner of Minnesota, in Mahnomen County. It is situated on the White Earth Indian Reservation, and is home to the White Earth Band of Ojibwe. The population of Naytahwaush was estimated to be around 1,000 in 2020.
History
Naytahwaush is an Ojibwe word meaning “where the wild rice grows”. The area was first settled by the Ojibwe in the late 1800s, and the community was officially established in the early 1900s. The White Earth Indian Reservation was established in 1867, and the Naytahwaush area was included in the reservation.
The community was originally a logging and farming community, and the first school was built in the area in the early 1900s. The community was also home to a sawmill, a general store, and a post office.
In the late 1960s, the White Earth Band of Ojibwe began to reclaim their land and culture, and the community of Naytahwaush was revitalized. The White Earth Tribal and Community College was established in the area in the 1970s, and the Naytahwaush Community Center was built in the 1980s.
Geography
Naytahwaush is located in the northwestern corner of Minnesota, in Mahnomen County. It is situated on the White Earth Indian Reservation, and is bordered by the cities of White Earth and Mahnomen. The community is located on the shores of Rice Lake, and is surrounded by forests and wetlands.
The climate in Naytahwaush is continental, with cold winters and warm summers. The average annual temperature is around 40°F (4°C), and the average annual precipitation is around 28 inches (71 cm).
Economy
The economy of Naytahwaush is largely based on agriculture and tourism. The White Earth Band of Ojibwe operates a number of businesses in the area, including a casino, a hotel, and a golf course. The community is also home to a number of small businesses, including restaurants, stores, and gas stations.
The White Earth Tribal and Community College provides educational opportunities for the community, and the Naytahwaush Community Center offers a variety of recreational activities.
Demographics
The population of Naytahwaush was estimated to be around 1,000 in 2020. The majority of the population is Native American, and the community is home to members of the White Earth Band of Ojibwe. The median household income in the community is around $30,000, and the median home value is around $90,000.
The community is served by the Naytahwaush Public School District, which includes an elementary school, a middle school, and a high school. The community is also home to a number of churches, including the Naytahwaush United Methodist Church and the White Earth Presbyterian Church.
Naytahwaush is a small, close-knit community with a rich history and culture. The community is home to a number of businesses and organizations, and offers a variety of educational and recreational opportunities. The community is also home to a number of Native American tribes, and is a great place to experience the culture and history of the Ojibwe people.
Common Questions
What is Per Capita Income in Naytahwaush?
Per Capita income in Naytahwaush is $13,815.
What is the Median Family Income in Naytahwaush?
Median Family Income in Naytahwaush is $30,625.
What is the Median Household income in Naytahwaush?
Median Household Income in Naytahwaush is $31,111.
What is Income or Wage Gap in Naytahwaush?
Income or Wage Gap in Naytahwaush is 16.3%.
Women in Naytahwaush earn 83.7 cents for every dollar earned by a man.
What is Inequality or Gini Index in Naytahwaush?
Inequality or Gini Index in Naytahwaush is 0.43.
What is the Total Population of Naytahwaush?
Total Population of Naytahwaush is 472.
What is the Total Male Population of Naytahwaush?
Total Male Population of Naytahwaush is 247.
What is the Total Female Population of Naytahwaush?
Total Female Population of Naytahwaush is 225.
What is the Ratio of Males per 100 Females in Naytahwaush?
There are 109.78 Males per 100 Females in Naytahwaush.
What is the Ratio of Females per 100 Males in Naytahwaush?
There are 91.09 Females per 100 Males in Naytahwaush.
What is the Median Population Age in Naytahwaush?
Median Population Age in Naytahwaush is 24.3 Years.
What is the Average Family Size in Naytahwaush
Average Family Size in Naytahwaush is 4.1 People.
What is the Average Household Size in Naytahwaush
Average Household Size in Naytahwaush is 3.3 People.
How Large is the Labor Force in Naytahwaush?
There are 140 People in the Labor Forcein in Naytahwaush.
What is the Percentage of People in the Labor Force in Naytahwaush?
44.3% of People are in the Labor Force in Naytahwaush.
What is the Unemployment Rate in Naytahwaush?
Unemployment Rate in Naytahwaush is 25.0%.