Bemidji, MN Map & Demographics
Bemidji Map
Bemidji Overview
$28,990
PER CAPITA INCOME
$74,288
AVG FAMILY INCOME
$49,799
AVG HOUSEHOLD INCOME
20.7%
WAGE / INCOME GAP [ % ]
79.3¢/ $1
WAGE / INCOME GAP [ $ ]
$11,700
FAMILY INCOME DEFICIT
0.46
INEQUALITY / GINI INDEX
15,441
TOTAL POPULATION
7,498
MALE POPULATION
7,943
FEMALE POPULATION
94.40
MALES / 100 FEMALES
105.93
FEMALES / 100 MALES
29.1
MEDIAN AGE
3.0
AVG FAMILY SIZE
2.1
AVG HOUSEHOLD SIZE
8,054
LABOR FORCE [ PEOPLE ]
63.3%
PERCENT IN LABOR FORCE
4.2%
UNEMPLOYMENT RATE
Bemidji Zip Codes
Bemidji Area Codes
Income in Bemidji
Income Overview in Bemidji
Per Capita Income in Bemidji is $28,990, while median incomes of families and households are $74,288 and $49,799 respectively.
| Characteristic | Number | Measure |
| Per Capita Income | 15,441 | $28,990 |
| Median Family Income | 2,799 | $74,288 |
| Mean Family Income | 2,799 | $93,749 |
| Median Household Income | 6,451 | $49,799 |
| Mean Household Income | 6,451 | $66,680 |
| Income Deficit | 2,799 | $11,700 |
| Wage / Income Gap (%) | 15,441 | 20.67% |
| Wage / Income Gap ($) | 15,441 | 79.33¢ per $1 |
| Gini / Inequality Index | 15,441 | 0.46 |
Earnings by Sex in Bemidji
Average Earnings in Bemidji are $23,588, $26,349 for men and $20,902 for women, a difference of 20.7%.
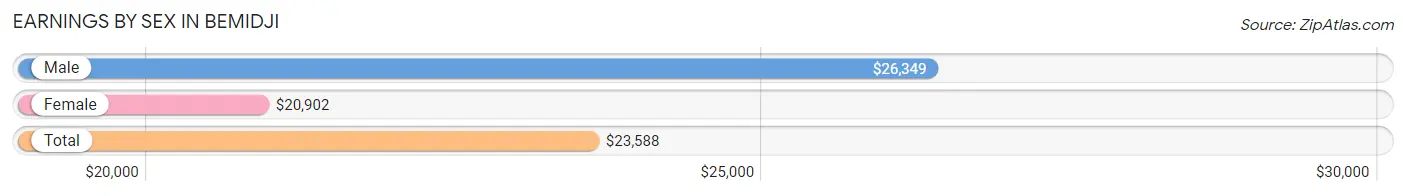
| Sex | Number | Average Earnings |
| Male | 4,512 (50.3%) | $26,349 |
| Female | 4,452 (49.7%) | $20,902 |
| Total | 8,964 (100.0%) | $23,588 |
Earnings by Sex by Income Bracket in Bemidji
The most common earnings brackets in Bemidji are $30,000 to $34,999 for men (428 | 9.5%) and $2,499 or less for women (584 | 13.1%).
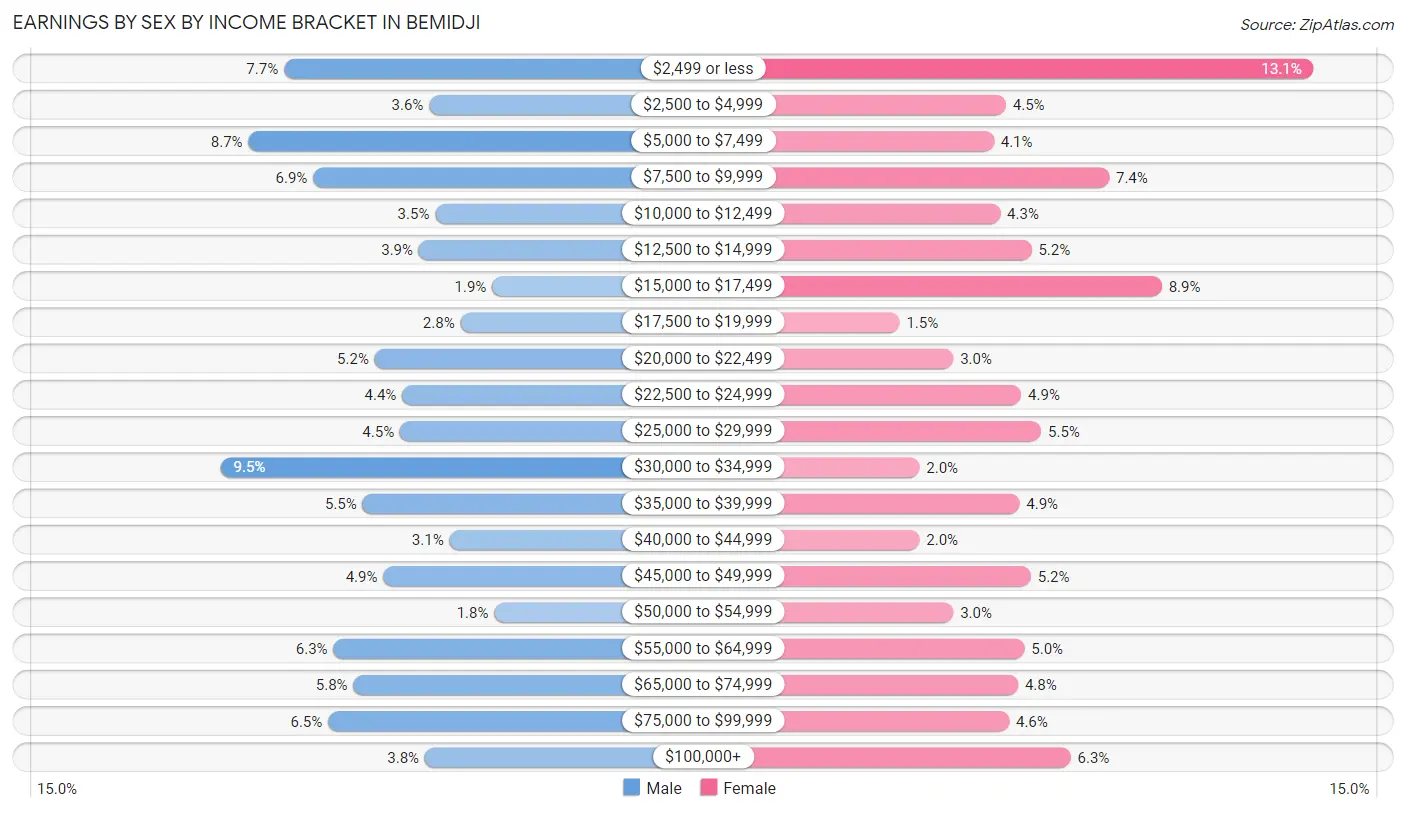
| Income | Male | Female |
| $2,499 or less | 348 (7.7%) | 584 (13.1%) |
| $2,500 to $4,999 | 164 (3.6%) | 199 (4.5%) |
| $5,000 to $7,499 | 393 (8.7%) | 184 (4.1%) |
| $7,500 to $9,999 | 311 (6.9%) | 328 (7.4%) |
| $10,000 to $12,499 | 156 (3.5%) | 192 (4.3%) |
| $12,500 to $14,999 | 177 (3.9%) | 231 (5.2%) |
| $15,000 to $17,499 | 84 (1.9%) | 394 (8.8%) |
| $17,500 to $19,999 | 124 (2.8%) | 66 (1.5%) |
| $20,000 to $22,499 | 233 (5.2%) | 133 (3.0%) |
| $22,500 to $24,999 | 198 (4.4%) | 218 (4.9%) |
| $25,000 to $29,999 | 201 (4.4%) | 243 (5.5%) |
| $30,000 to $34,999 | 428 (9.5%) | 91 (2.0%) |
| $35,000 to $39,999 | 248 (5.5%) | 216 (4.9%) |
| $40,000 to $44,999 | 138 (3.1%) | 91 (2.0%) |
| $45,000 to $49,999 | 222 (4.9%) | 230 (5.2%) |
| $50,000 to $54,999 | 81 (1.8%) | 133 (3.0%) |
| $55,000 to $64,999 | 285 (6.3%) | 222 (5.0%) |
| $65,000 to $74,999 | 260 (5.8%) | 214 (4.8%) |
| $75,000 to $99,999 | 292 (6.5%) | 203 (4.6%) |
| $100,000+ | 169 (3.7%) | 280 (6.3%) |
| Total | 4,512 (100.0%) | 4,452 (100.0%) |
Earnings by Sex by Educational Attainment in Bemidji
Average earnings in Bemidji are $41,580 for men and $37,093 for women, a difference of 10.8%. Men with an educational attainment of graduate degree enjoy the highest average annual earnings of $79,022, while those with less than high school education earn the least with $8,311. Women with an educational attainment of graduate degree earn the most with the average annual earnings of $71,607, while those with high school diploma education have the smallest earnings of $13,372.
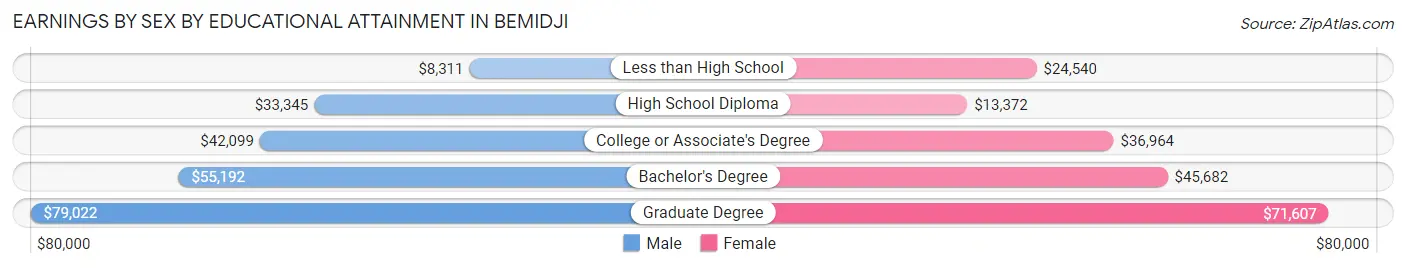
| Educational Attainment | Male Income | Female Income |
| Less than High School | $8,311 | $24,540 |
| High School Diploma | $33,345 | $13,372 |
| College or Associate's Degree | $42,099 | $36,964 |
| Bachelor's Degree | $55,192 | $45,682 |
| Graduate Degree | $79,022 | $71,607 |
| Total | $41,580 | $37,093 |
Family Income in Bemidji
Family Income Brackets in Bemidji
According to the Bemidji family income data, there are 546 families falling into the $50,000 to $74,999 income range, which is the most common income bracket and makes up 19.5% of all families. Conversely, the $15,000 to $24,999 income bracket is the least frequent group with only 53 families (1.9%) belonging to this category.
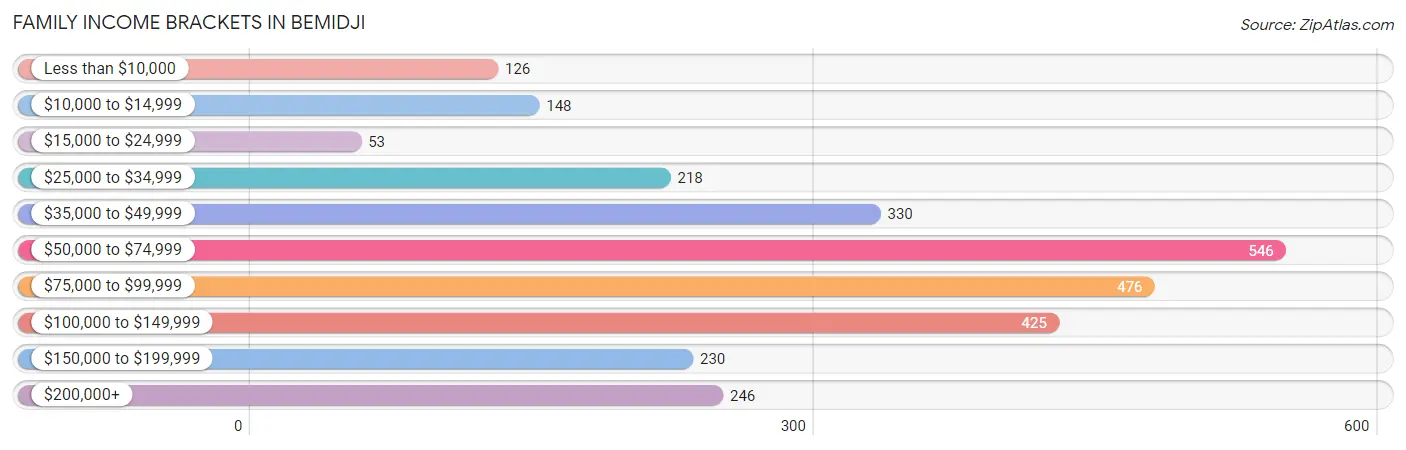
| Income Bracket | # Families | % Families |
| Less than $10,000 | 126 | 4.5% |
| $10,000 to $14,999 | 148 | 5.3% |
| $15,000 to $24,999 | 53 | 1.9% |
| $25,000 to $34,999 | 218 | 7.8% |
| $35,000 to $49,999 | 330 | 11.8% |
| $50,000 to $74,999 | 546 | 19.5% |
| $75,000 to $99,999 | 476 | 17.0% |
| $100,000 to $149,999 | 425 | 15.2% |
| $150,000 to $199,999 | 230 | 8.2% |
| $200,000+ | 246 | 8.8% |
Family Income by Famaliy Size in Bemidji
6-person families (102 | 3.6%) account for the highest median family income in Bemidji with $102,609 per family, while 2-person families (1,457 | 52.0%) have the highest median income of $31,938 per family member.
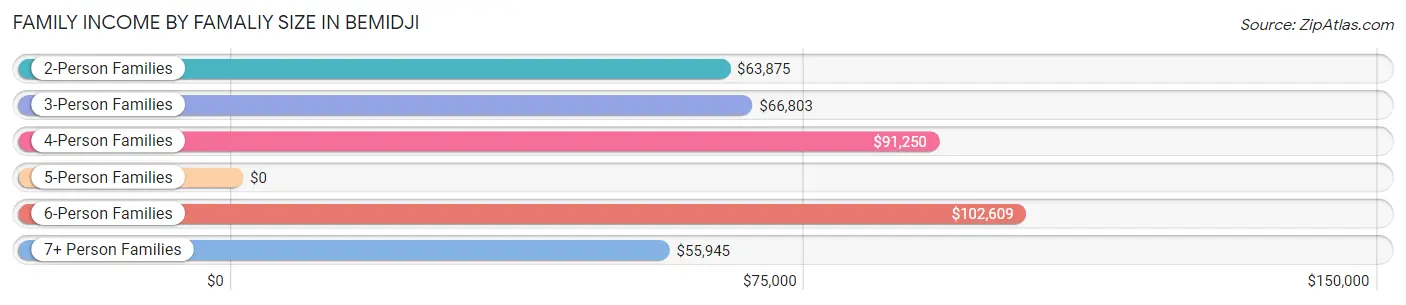
| Income Bracket | # Families | Median Income |
| 2-Person Families | 1,457 (52.0%) | $63,875 |
| 3-Person Families | 500 (17.9%) | $66,803 |
| 4-Person Families | 486 (17.4%) | $91,250 |
| 5-Person Families | 191 (6.8%) | $0 |
| 6-Person Families | 102 (3.6%) | $102,609 |
| 7+ Person Families | 63 (2.2%) | $55,945 |
| Total | 2,799 (100.0%) | $74,288 |
Family Income by Number of Earners in Bemidji
The median family income in Bemidji is $74,288, with families comprising 3+ earners (261) having the highest median family income of $130,515, while families with 1 earner (959) have the lowest median family income of $43,875, accounting for 9.3% and 34.3% of families, respectively.
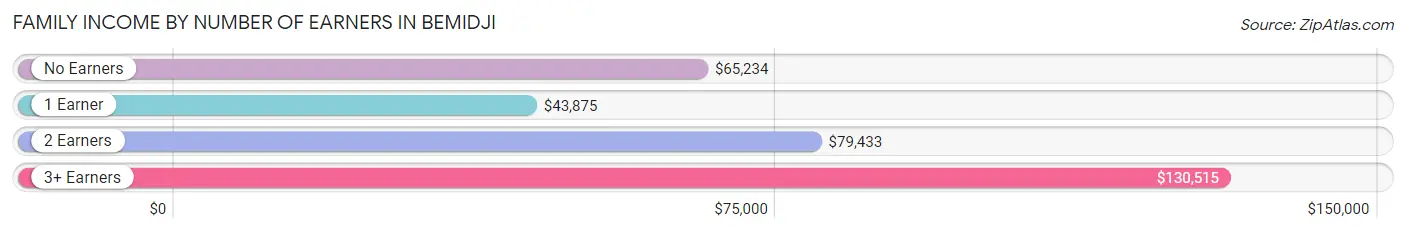
| Number of Earners | # Families | Median Income |
| No Earners | 427 (15.3%) | $65,234 |
| 1 Earner | 959 (34.3%) | $43,875 |
| 2 Earners | 1,152 (41.2%) | $79,433 |
| 3+ Earners | 261 (9.3%) | $130,515 |
| Total | 2,799 (100.0%) | $74,288 |
Household Income in Bemidji
Household Income Brackets in Bemidji
With 1,271 households falling in the category, the $50,000 to $74,999 income range is the most frequent in Bemidji, accounting for 19.7% of all households. In contrast, only 213 households (3.3%) fall into the $150,000 to $199,999 income bracket, making it the least populous group.
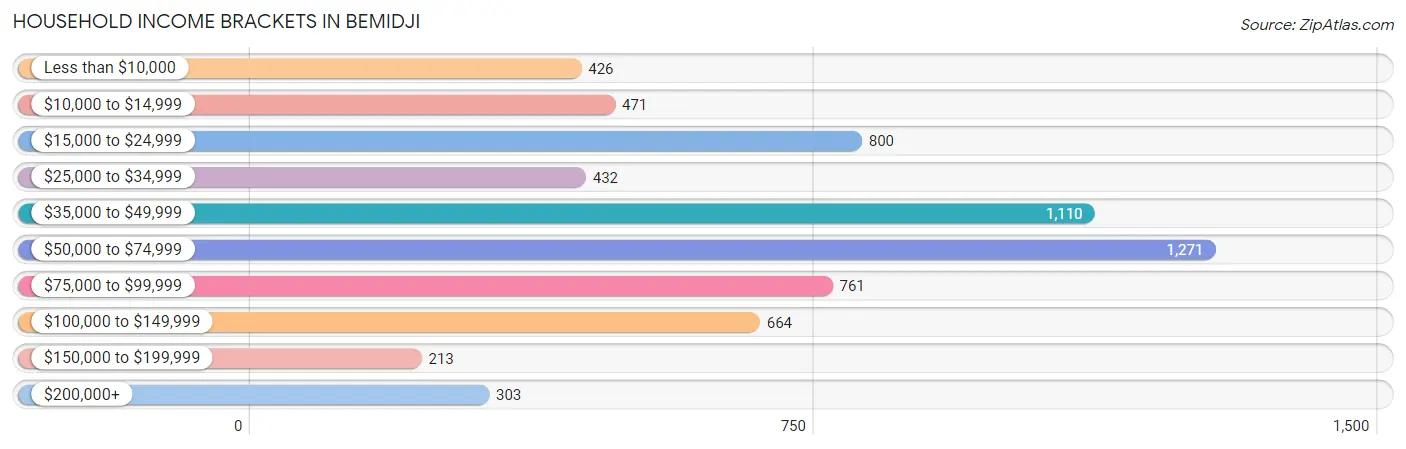
| Income Bracket | # Households | % Households |
| Less than $10,000 | 426 | 6.6% |
| $10,000 to $14,999 | 471 | 7.3% |
| $15,000 to $24,999 | 800 | 12.4% |
| $25,000 to $34,999 | 432 | 6.7% |
| $35,000 to $49,999 | 1,110 | 17.2% |
| $50,000 to $74,999 | 1,271 | 19.7% |
| $75,000 to $99,999 | 761 | 11.8% |
| $100,000 to $149,999 | 664 | 10.3% |
| $150,000 to $199,999 | 213 | 3.3% |
| $200,000+ | 303 | 4.7% |
Household Income by Householder Age in Bemidji
The median household income in Bemidji is $49,799, with the highest median household income of $68,694 found in the 45 to 64 years age bracket for the primary householder. A total of 1,655 households (25.7%) fall into this category. Meanwhile, the 15 to 24 years age bracket for the primary householder has the lowest median household income of $35,367, with 1,272 households (19.7%) in this group.
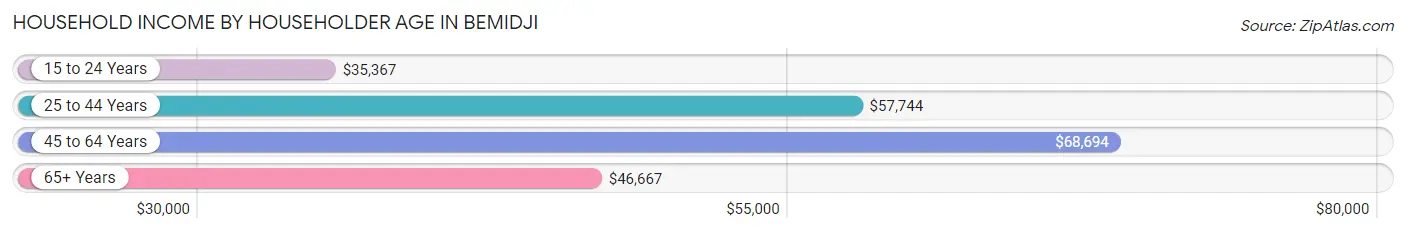
| Income Bracket | # Households | Median Income |
| 15 to 24 Years | 1,272 (19.7%) | $35,367 |
| 25 to 44 Years | 1,884 (29.2%) | $57,744 |
| 45 to 64 Years | 1,655 (25.7%) | $68,694 |
| 65+ Years | 1,640 (25.4%) | $46,667 |
| Total | 6,451 (100.0%) | $49,799 |
Poverty in Bemidji
Income Below Poverty by Sex and Age in Bemidji
With 21.6% poverty level for males and 21.9% for females among the residents of Bemidji, 12 to 14 year old males and 16 and 17 year old females are the most vulnerable to poverty, with 68 males (58.6%) and 65 females (43.6%) in their respective age groups living below the poverty level.
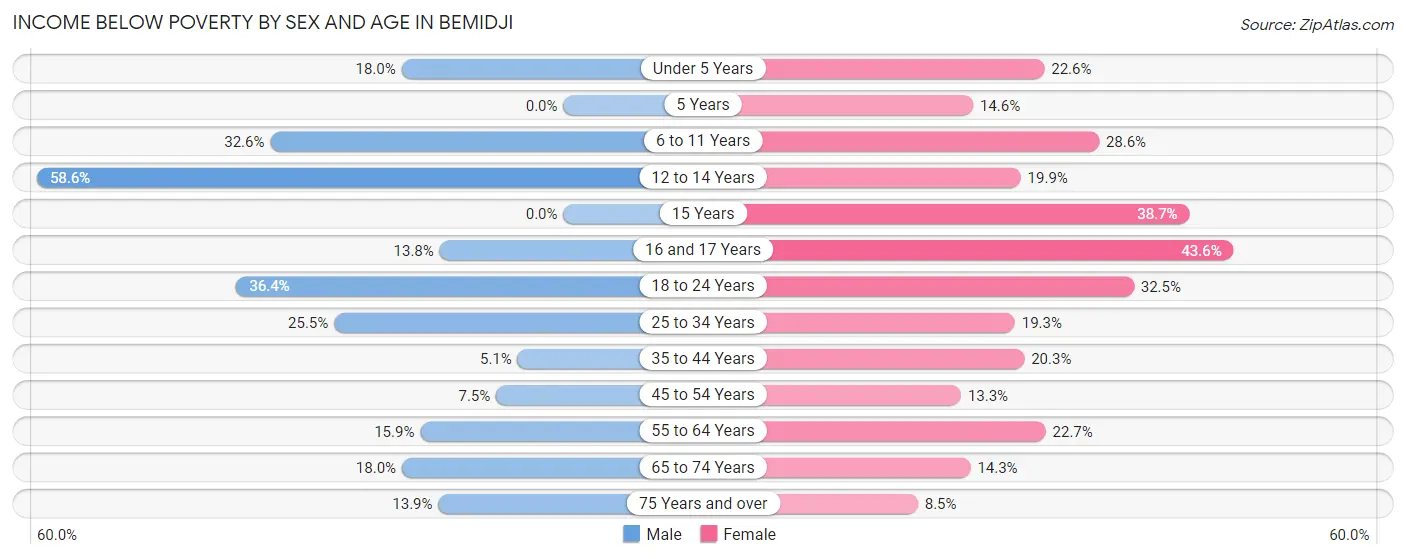
| Age Bracket | Male | Female |
| Under 5 Years | 73 (18.0%) | 136 (22.6%) |
| 5 Years | 0 (0.0%) | 13 (14.6%) |
| 6 to 11 Years | 205 (32.6%) | 118 (28.6%) |
| 12 to 14 Years | 68 (58.6%) | 47 (19.9%) |
| 15 Years | 0 (0.0%) | 24 (38.7%) |
| 16 and 17 Years | 27 (13.8%) | 65 (43.6%) |
| 18 to 24 Years | 533 (36.4%) | 456 (32.5%) |
| 25 to 34 Years | 227 (25.5%) | 168 (19.3%) |
| 35 to 44 Years | 50 (5.1%) | 165 (20.3%) |
| 45 to 54 Years | 40 (7.5%) | 58 (13.3%) |
| 55 to 64 Years | 102 (15.9%) | 160 (22.7%) |
| 65 to 74 Years | 82 (18.0%) | 98 (14.3%) |
| 75 Years and over | 54 (13.9%) | 57 (8.5%) |
| Total | 1,461 (21.6%) | 1,565 (21.9%) |
Income Above Poverty by Sex and Age in Bemidji
According to the poverty statistics in Bemidji, males aged 5 years and females aged 75 years and over are the age groups that are most secure financially, with 100.0% of males and 91.5% of females in these age groups living above the poverty line.
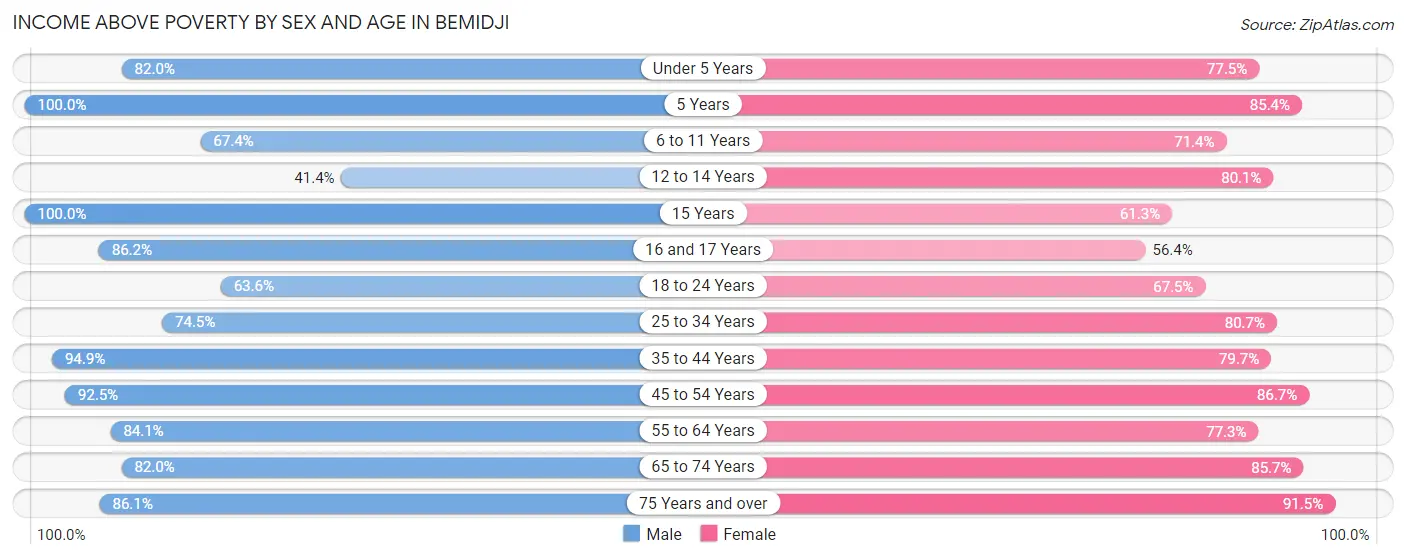
| Age Bracket | Male | Female |
| Under 5 Years | 332 (82.0%) | 467 (77.4%) |
| 5 Years | 18 (100.0%) | 76 (85.4%) |
| 6 to 11 Years | 423 (67.4%) | 294 (71.4%) |
| 12 to 14 Years | 48 (41.4%) | 189 (80.1%) |
| 15 Years | 37 (100.0%) | 38 (61.3%) |
| 16 and 17 Years | 169 (86.2%) | 84 (56.4%) |
| 18 to 24 Years | 931 (63.6%) | 946 (67.5%) |
| 25 to 34 Years | 662 (74.5%) | 704 (80.7%) |
| 35 to 44 Years | 932 (94.9%) | 647 (79.7%) |
| 45 to 54 Years | 494 (92.5%) | 379 (86.7%) |
| 55 to 64 Years | 538 (84.1%) | 545 (77.3%) |
| 65 to 74 Years | 374 (82.0%) | 586 (85.7%) |
| 75 Years and over | 334 (86.1%) | 617 (91.5%) |
| Total | 5,292 (78.4%) | 5,572 (78.1%) |
Income Below Poverty Among Married-Couple Families in Bemidji
The poverty statistics for married-couple families in Bemidji show that 3.1% or 57 of the total 1,824 families live below the poverty line. Families with 1 or 2 children have the highest poverty rate of 6.8%, comprising of 42 families. On the other hand, families with 3 or 4 children have the lowest poverty rate of 0.0%, which includes 0 families.
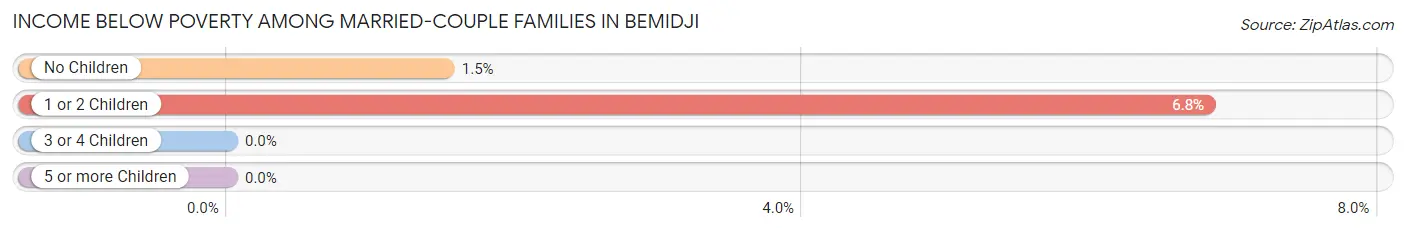
| Children | Above Poverty | Below Poverty |
| No Children | 976 (98.5%) | 15 (1.5%) |
| 1 or 2 Children | 575 (93.2%) | 42 (6.8%) |
| 3 or 4 Children | 159 (100.0%) | 0 (0.0%) |
| 5 or more Children | 57 (100.0%) | 0 (0.0%) |
| Total | 1,767 (96.9%) | 57 (3.1%) |
Income Below Poverty Among Single-Parent Households in Bemidji
According to the poverty data in Bemidji, 19.7% or 48 single-father households and 33.2% or 243 single-mother households are living below the poverty line. Among single-father households, those with 3 or 4 children have the highest poverty rate, with 36 households (43.9%) experiencing poverty. Likewise, among single-mother households, those with 3 or 4 children have the highest poverty rate, with 81 households (58.7%) falling below the poverty line.
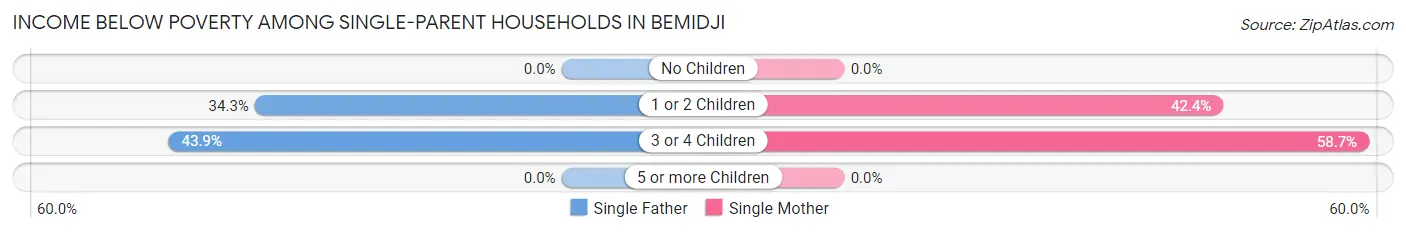
| Children | Single Father | Single Mother |
| No Children | 0 (0.0%) | 0 (0.0%) |
| 1 or 2 Children | 12 (34.3%) | 162 (42.4%) |
| 3 or 4 Children | 36 (43.9%) | 81 (58.7%) |
| 5 or more Children | 0 (0.0%) | 0 (0.0%) |
| Total | 48 (19.7%) | 243 (33.2%) |
Income Below Poverty Among Married-Couple vs Single-Parent Households in Bemidji
The poverty data for Bemidji shows that 57 of the married-couple family households (3.1%) and 291 of the single-parent households (29.8%) are living below the poverty level. Within the married-couple family households, those with 1 or 2 children have the highest poverty rate, with 42 households (6.8%) falling below the poverty line. Among the single-parent households, those with 3 or 4 children have the highest poverty rate, with 117 household (53.2%) living below poverty.
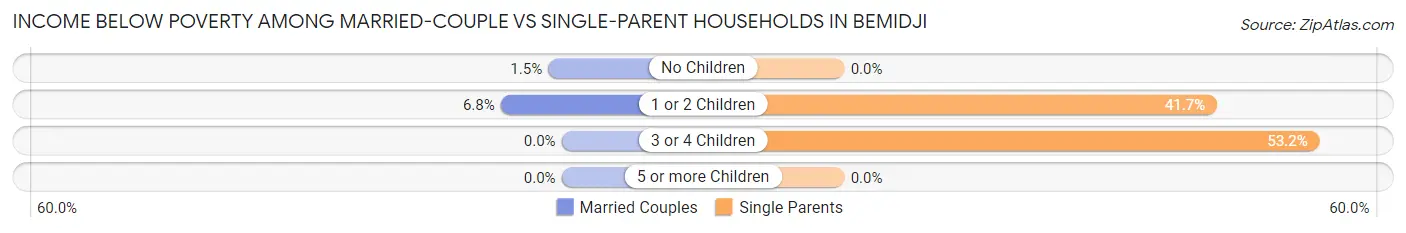
| Children | Married-Couple Families | Single-Parent Households |
| No Children | 15 (1.5%) | 0 (0.0%) |
| 1 or 2 Children | 42 (6.8%) | 174 (41.7%) |
| 3 or 4 Children | 0 (0.0%) | 117 (53.2%) |
| 5 or more Children | 0 (0.0%) | 0 (0.0%) |
| Total | 57 (3.1%) | 291 (29.8%) |
Race in Bemidji
The most populous races in Bemidji are White / Caucasian (11,777 | 76.3%), Native / Alaskan (1,563 | 10.1%), and Two or more Races (1,422 | 9.2%).
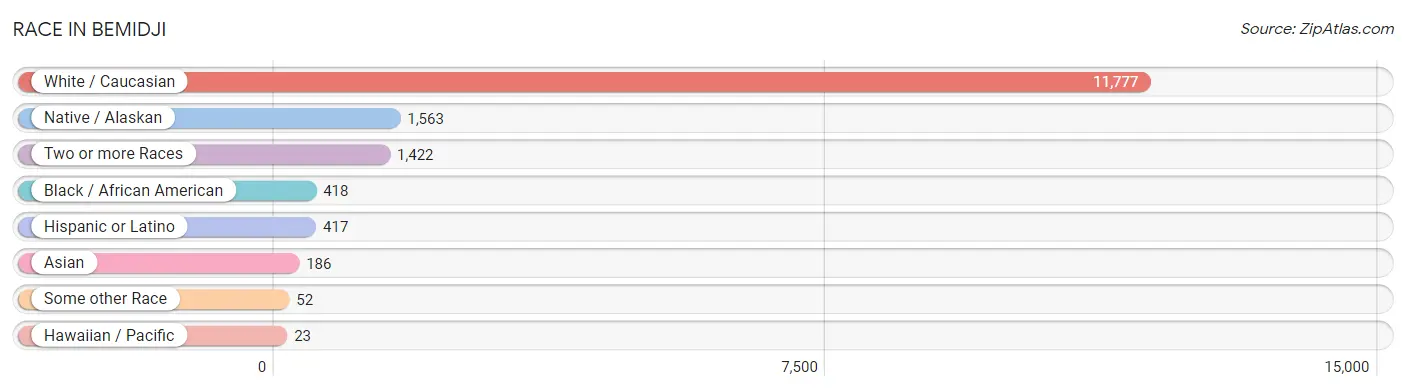
| Race | # Population | % Population |
| Asian | 186 | 1.2% |
| Black / African American | 418 | 2.7% |
| Hawaiian / Pacific | 23 | 0.2% |
| Hispanic or Latino | 417 | 2.7% |
| Native / Alaskan | 1,563 | 10.1% |
| White / Caucasian | 11,777 | 76.3% |
| Two or more Races | 1,422 | 9.2% |
| Some other Race | 52 | 0.3% |
| Total | 15,441 | 100.0% |
Ancestry in Bemidji
The most populous ancestries reported in Bemidji are German (3,780 | 24.5%), Norwegian (2,256 | 14.6%), Chippewa (1,775 | 11.5%), Irish (1,278 | 8.3%), and English (996 | 6.5%), together accounting for 65.3% of all Bemidji residents.
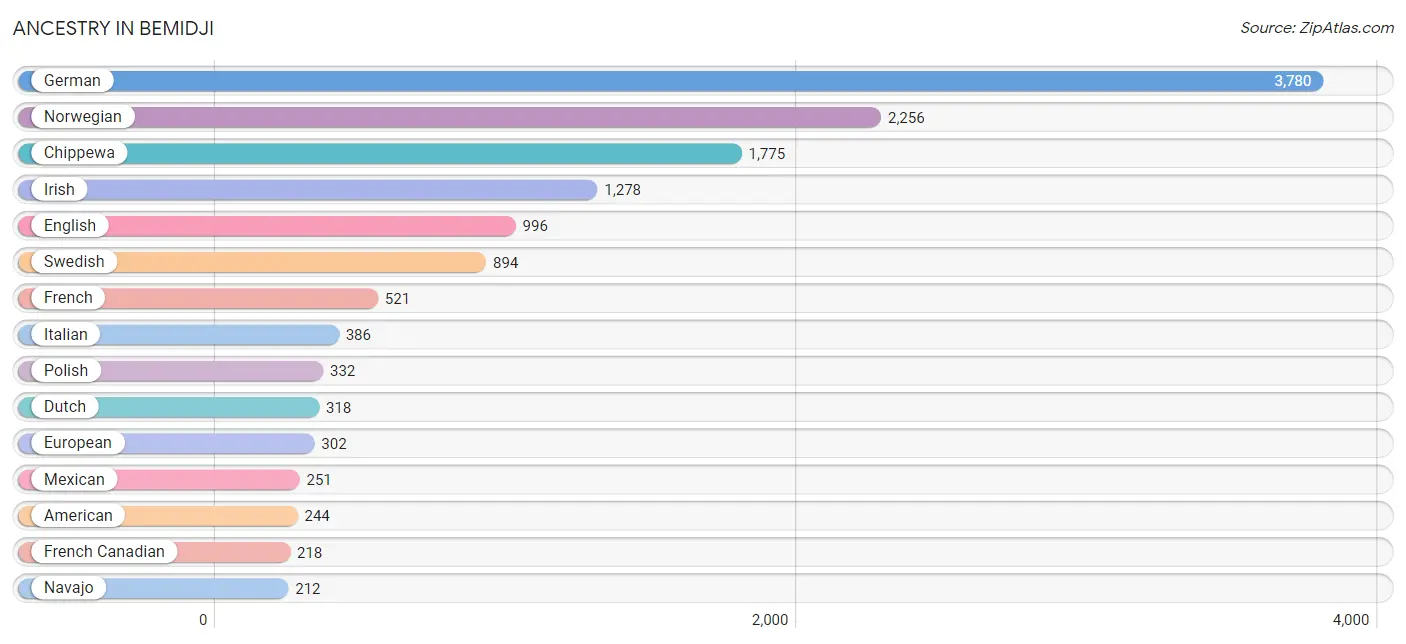
| Ancestry | # Population | % Population |
| Albanian | 13 | 0.1% |
| American | 244 | 1.6% |
| Arab | 102 | 0.7% |
| Austrian | 3 | 0.0% |
| Bangladeshi | 52 | 0.3% |
| Bhutanese | 39 | 0.3% |
| British | 54 | 0.4% |
| Burmese | 12 | 0.1% |
| Canadian | 110 | 0.7% |
| Central American | 91 | 0.6% |
| Cherokee | 26 | 0.2% |
| Chilean | 23 | 0.2% |
| Chippewa | 1,775 | 11.5% |
| Choctaw | 163 | 1.1% |
| Costa Rican | 35 | 0.2% |
| Croatian | 35 | 0.2% |
| Crow | 3 | 0.0% |
| Czech | 86 | 0.6% |
| Czechoslovakian | 8 | 0.1% |
| Danish | 174 | 1.1% |
| Dominican | 39 | 0.3% |
| Dutch | 318 | 2.1% |
| Eastern European | 75 | 0.5% |
| English | 996 | 6.5% |
| European | 302 | 2.0% |
| Finnish | 195 | 1.3% |
| French | 521 | 3.4% |
| French Canadian | 218 | 1.4% |
| German | 3,780 | 24.5% |
| Greek | 54 | 0.4% |
| Guamanian / Chamorro | 23 | 0.2% |
| Hungarian | 6 | 0.0% |
| Icelander | 159 | 1.0% |
| Indian (Asian) | 134 | 0.9% |
| Irish | 1,278 | 8.3% |
| Italian | 386 | 2.5% |
| Korean | 92 | 0.6% |
| Lebanese | 36 | 0.2% |
| Liberian | 42 | 0.3% |
| Lithuanian | 16 | 0.1% |
| Luxembourger | 12 | 0.1% |
| Mexican | 251 | 1.6% |
| Navajo | 212 | 1.4% |
| Northern European | 14 | 0.1% |
| Norwegian | 2,256 | 14.6% |
| Ottawa | 11 | 0.1% |
| Pakistani | 42 | 0.3% |
| Panamanian | 56 | 0.4% |
| Polish | 332 | 2.1% |
| Russian | 43 | 0.3% |
| Scandinavian | 178 | 1.1% |
| Scotch-Irish | 77 | 0.5% |
| Scottish | 210 | 1.4% |
| Sioux | 44 | 0.3% |
| South American | 23 | 0.2% |
| Sri Lankan | 22 | 0.1% |
| Subsaharan African | 50 | 0.3% |
| Swedish | 894 | 5.8% |
| Swiss | 15 | 0.1% |
| Thai | 4 | 0.0% |
| Ukrainian | 34 | 0.2% |
| Welsh | 38 | 0.3% |
| Yugoslavian | 9 | 0.1% |
| Zimbabwean | 8 | 0.1% | View All 64 Rows |
Immigrants in Bemidji
The most numerous immigrant groups reported in Bemidji came from Asia (144 | 0.9%), Africa (120 | 0.8%), Eastern Asia (82 | 0.5%), Eastern Africa (78 | 0.5%), and South Eastern Asia (58 | 0.4%), together accounting for 3.1% of all Bemidji residents.
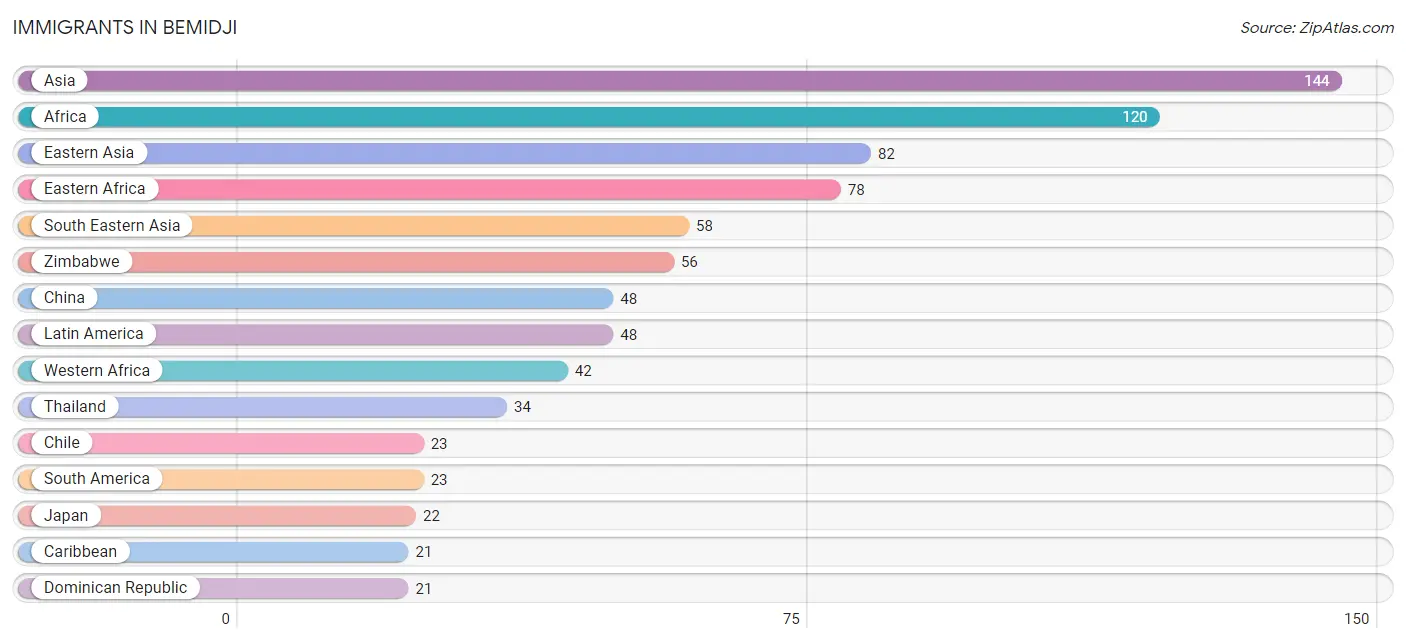
| Immigration Origin | # Population | % Population |
| Africa | 120 | 0.8% |
| Asia | 144 | 0.9% |
| Canada | 12 | 0.1% |
| Caribbean | 21 | 0.1% |
| Central America | 4 | 0.0% |
| Chile | 23 | 0.2% |
| China | 48 | 0.3% |
| Dominican Republic | 21 | 0.1% |
| Eastern Africa | 78 | 0.5% |
| Eastern Asia | 82 | 0.5% |
| Ethiopia | 18 | 0.1% |
| Europe | 7 | 0.1% |
| India | 4 | 0.0% |
| Japan | 22 | 0.1% |
| Korea | 12 | 0.1% |
| Latin America | 48 | 0.3% |
| Mexico | 4 | 0.0% |
| Northern Europe | 7 | 0.1% |
| Philippines | 8 | 0.1% |
| Somalia | 4 | 0.0% |
| South America | 23 | 0.2% |
| South Central Asia | 4 | 0.0% |
| South Eastern Asia | 58 | 0.4% |
| Sweden | 7 | 0.1% |
| Thailand | 34 | 0.2% |
| Vietnam | 16 | 0.1% |
| Western Africa | 42 | 0.3% |
| Zimbabwe | 56 | 0.4% | View All 28 Rows |
Sex and Age in Bemidji
Sex and Age in Bemidji
The most populous age groups in Bemidji are 20 to 24 Years (1,473 | 19.7%) for men and 20 to 24 Years (1,313 | 16.5%) for women.
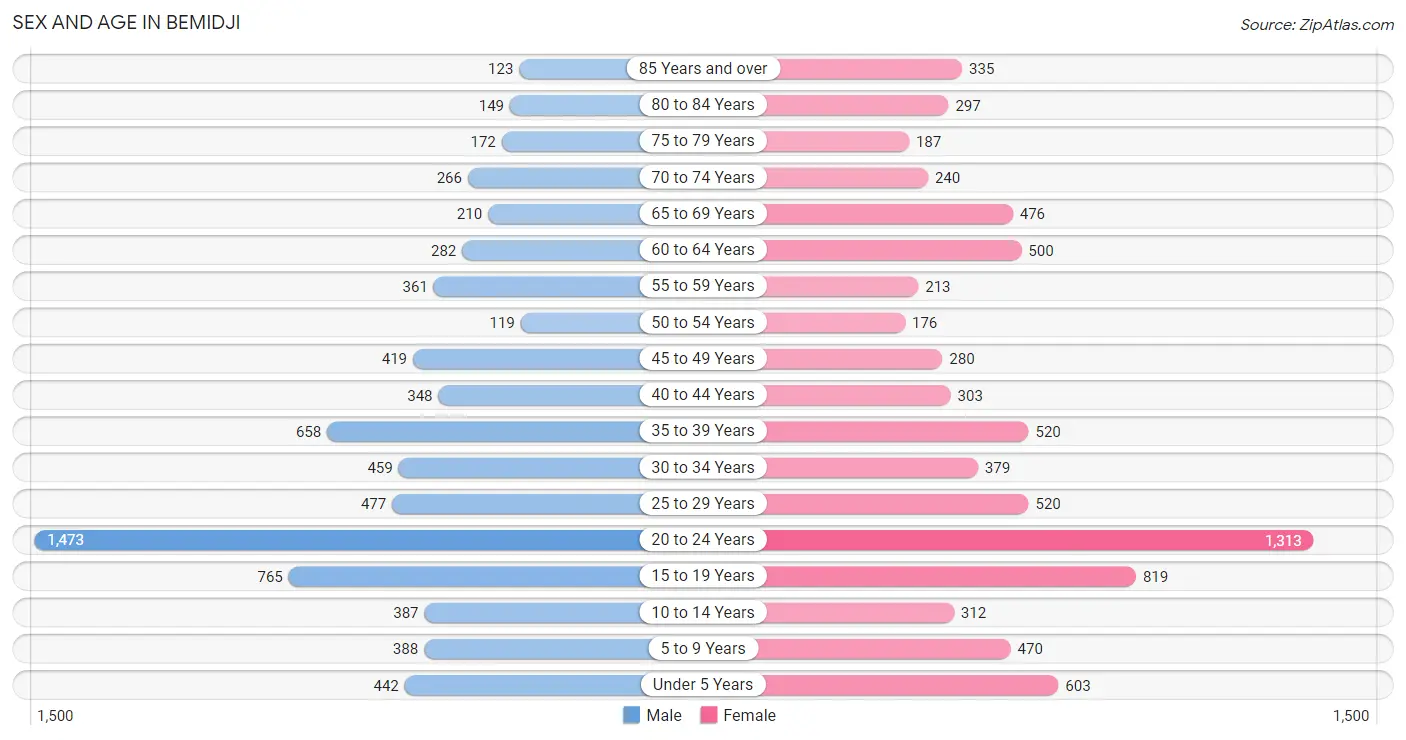
| Age Bracket | Male | Female |
| Under 5 Years | 442 (5.9%) | 603 (7.6%) |
| 5 to 9 Years | 388 (5.2%) | 470 (5.9%) |
| 10 to 14 Years | 387 (5.2%) | 312 (3.9%) |
| 15 to 19 Years | 765 (10.2%) | 819 (10.3%) |
| 20 to 24 Years | 1,473 (19.7%) | 1,313 (16.5%) |
| 25 to 29 Years | 477 (6.4%) | 520 (6.6%) |
| 30 to 34 Years | 459 (6.1%) | 379 (4.8%) |
| 35 to 39 Years | 658 (8.8%) | 520 (6.6%) |
| 40 to 44 Years | 348 (4.6%) | 303 (3.8%) |
| 45 to 49 Years | 419 (5.6%) | 280 (3.5%) |
| 50 to 54 Years | 119 (1.6%) | 176 (2.2%) |
| 55 to 59 Years | 361 (4.8%) | 213 (2.7%) |
| 60 to 64 Years | 282 (3.8%) | 500 (6.3%) |
| 65 to 69 Years | 210 (2.8%) | 476 (6.0%) |
| 70 to 74 Years | 266 (3.5%) | 240 (3.0%) |
| 75 to 79 Years | 172 (2.3%) | 187 (2.4%) |
| 80 to 84 Years | 149 (2.0%) | 297 (3.7%) |
| 85 Years and over | 123 (1.6%) | 335 (4.2%) |
| Total | 7,498 (100.0%) | 7,943 (100.0%) |
Families and Households in Bemidji
Median Family Size in Bemidji
The median family size in Bemidji is 2.98 persons per family, with single female/mother families (731 | 26.1%) accounting for the largest median family size of 3.06 persons per family. On the other hand, single male/father families (244 | 8.7%) represent the smallest median family size with 2.89 persons per family.
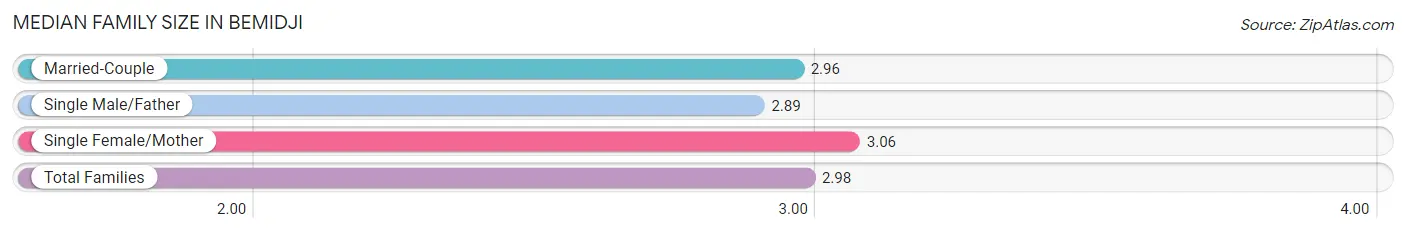
| Family Type | # Families | Family Size |
| Married-Couple | 1,824 (65.2%) | 2.96 |
| Single Male/Father | 244 (8.7%) | 2.89 |
| Single Female/Mother | 731 (26.1%) | 3.06 |
| Total Families | 2,799 (100.0%) | 2.98 |
Median Household Size in Bemidji
The median household size in Bemidji is 2.14 persons per household, with single female/mother households (731 | 11.3%) accounting for the largest median household size of 3.55 persons per household. non-family households (3,652 | 56.6%) represent the smallest median household size with 1.35 persons per household.
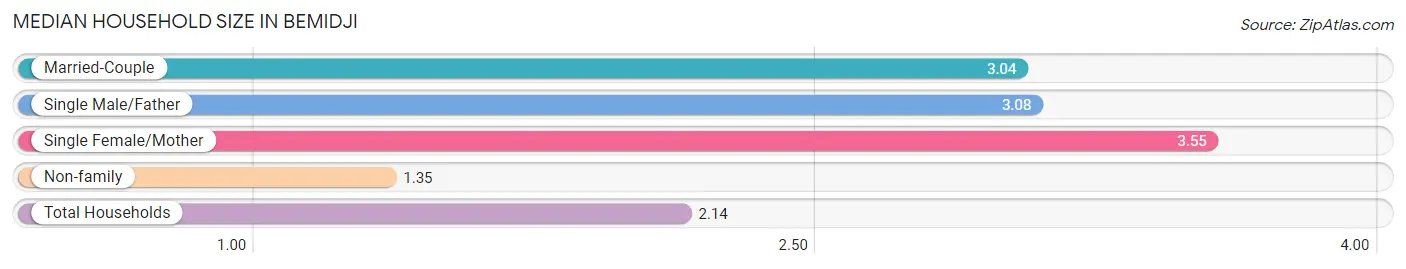
| Household Type | # Households | Household Size |
| Married-Couple | 1,824 (28.3%) | 3.04 |
| Single Male/Father | 244 (3.8%) | 3.08 |
| Single Female/Mother | 731 (11.3%) | 3.55 |
| Non-family | 3,652 (56.6%) | 1.35 |
| Total Households | 6,451 (100.0%) | 2.14 |
Household Size by Marriage Status in Bemidji
Out of a total of 6,451 households in Bemidji, 2,799 (43.4%) are family households, while 3,652 (56.6%) are nonfamily households. The most numerous type of family households are 2-person households, comprising 1,133, and the most common type of nonfamily households are 1-person households, comprising 2,795.
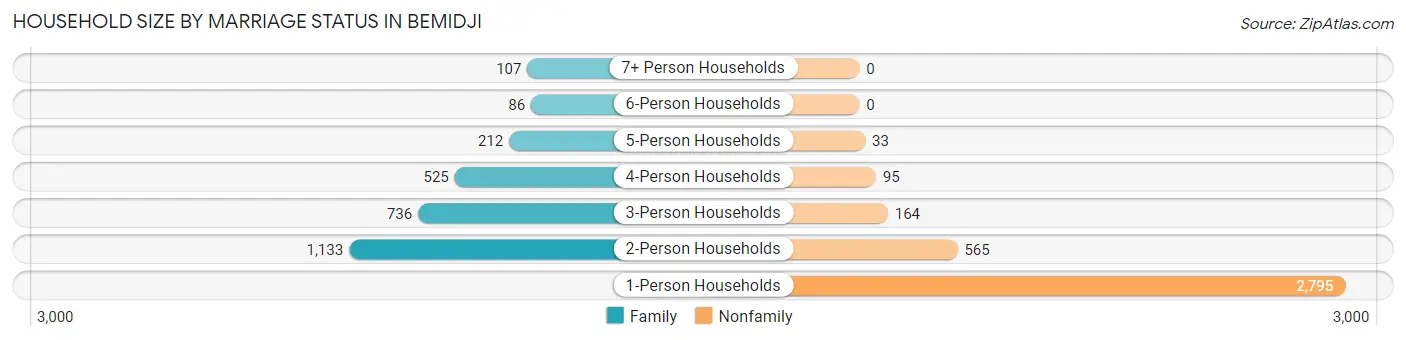
| Household Size | Family Households | Nonfamily Households |
| 1-Person Households | - | 2,795 (43.3%) |
| 2-Person Households | 1,133 (17.6%) | 565 (8.8%) |
| 3-Person Households | 736 (11.4%) | 164 (2.5%) |
| 4-Person Households | 525 (8.1%) | 95 (1.5%) |
| 5-Person Households | 212 (3.3%) | 33 (0.5%) |
| 6-Person Households | 86 (1.3%) | 0 (0.0%) |
| 7+ Person Households | 107 (1.7%) | 0 (0.0%) |
| Total | 2,799 (43.4%) | 3,652 (56.6%) |
Female Fertility in Bemidji
Fertility by Age in Bemidji
Average fertility rate in Bemidji is 53.0 births per 1,000 women. Women in the age bracket of 20 to 34 years have the highest fertility rate with 69.0 births per 1,000 women. Women in the age bracket of 20 to 34 years acount for 69.2% of all women with births.
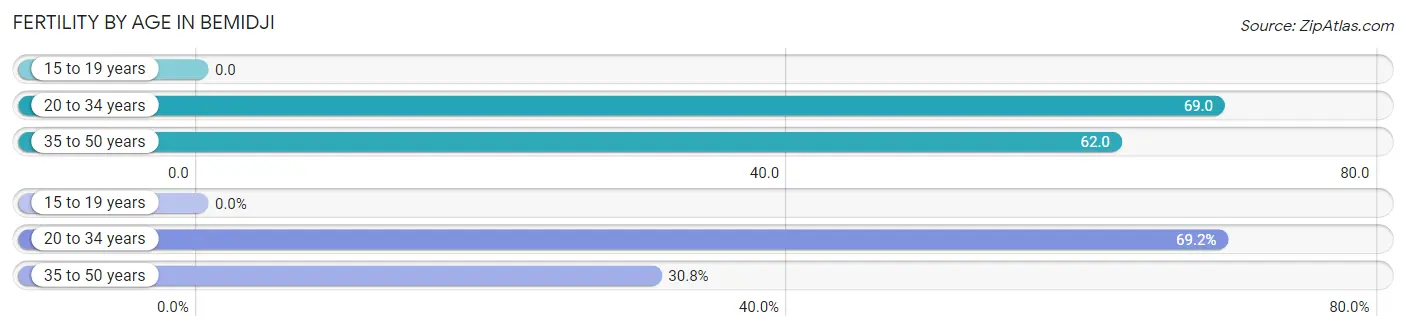
| Age Bracket | Women with Births | Births / 1,000 Women |
| 15 to 19 years | 0 (0.0%) | 0.0 |
| 20 to 34 years | 153 (69.2%) | 69.0 |
| 35 to 50 years | 68 (30.8%) | 62.0 |
| Total | 221 (100.0%) | 53.0 |
Fertility by Age by Marriage Status in Bemidji
43.9% of women with births (221) in Bemidji are married. The highest percentage of unmarried women with births falls into 20 to 34 years age bracket with 64.0% of them unmarried at the time of birth, while the lowest percentage of unmarried women with births belong to 35 to 50 years age bracket with 38.2% of them unmarried.
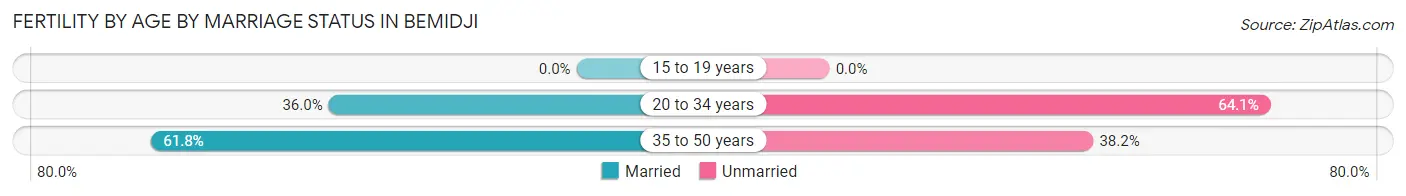
| Age Bracket | Married | Unmarried |
| 15 to 19 years | 0 (0.0%) | 0 (0.0%) |
| 20 to 34 years | 55 (35.9%) | 98 (64.0%) |
| 35 to 50 years | 42 (61.8%) | 26 (38.2%) |
| Total | 97 (43.9%) | 124 (56.1%) |
Fertility by Education in Bemidji
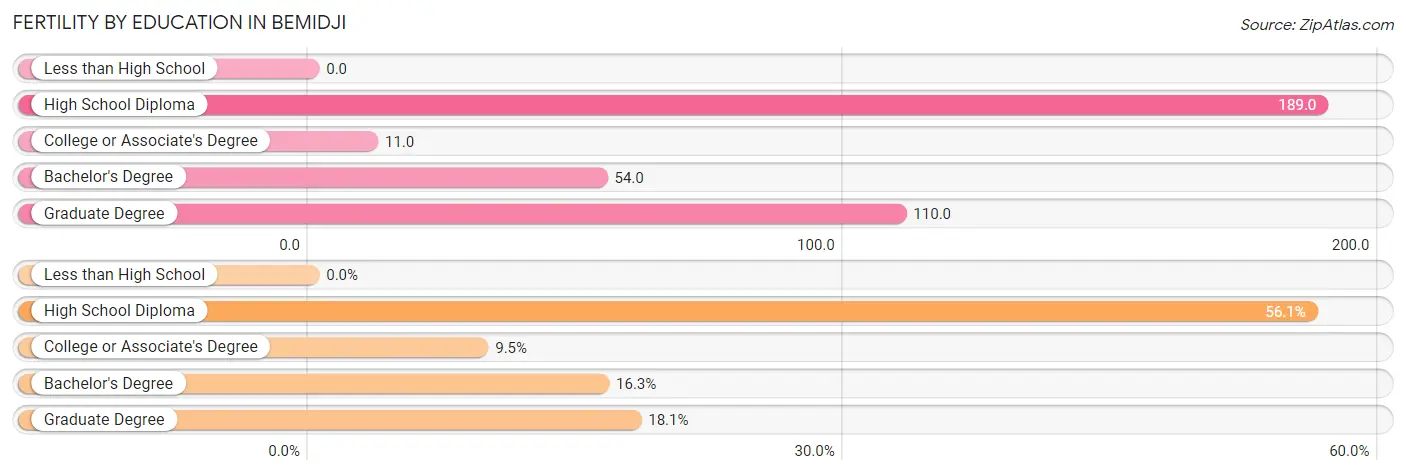
| Educational Attainment | Women with Births | Births / 1,000 Women |
| Less than High School | 0 (0.0%) | 0.0 |
| High School Diploma | 124 (56.1%) | 189.0 |
| College or Associate's Degree | 21 (9.5%) | 11.0 |
| Bachelor's Degree | 36 (16.3%) | 54.0 |
| Graduate Degree | 40 (18.1%) | 110.0 |
| Total | 221 (100.0%) | 53.0 |
Fertility by Education by Marriage Status in Bemidji
56.1% of women with births in Bemidji are unmarried. Women with the educational attainment of bachelor's degree are most likely to be married with 100.0% of them married at childbirth, while women with the educational attainment of college or associate's degree are least likely to be married with 76.2% of them unmarried at childbirth.
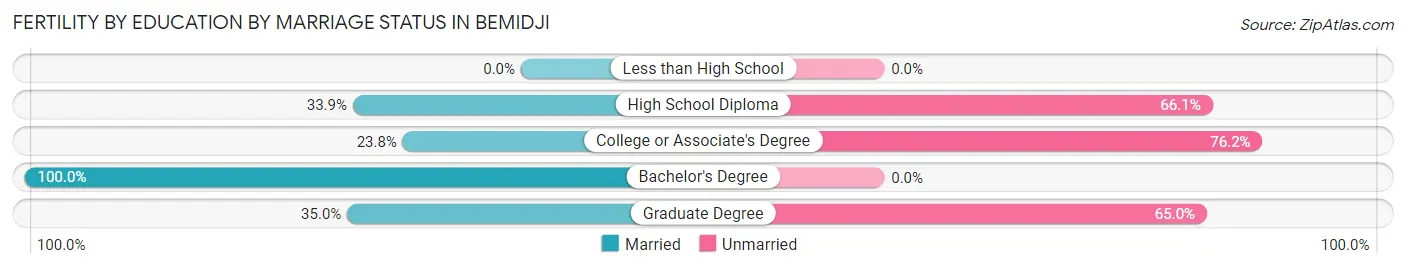
| Educational Attainment | Married | Unmarried |
| Less than High School | 0 (0.0%) | 0 (0.0%) |
| High School Diploma | 42 (33.9%) | 82 (66.1%) |
| College or Associate's Degree | 5 (23.8%) | 16 (76.2%) |
| Bachelor's Degree | 36 (100.0%) | 0 (0.0%) |
| Graduate Degree | 14 (35.0%) | 26 (65.0%) |
| Total | 97 (43.9%) | 124 (56.1%) |
Employment Characteristics in Bemidji
Employment by Class of Employer in Bemidji
Among the 7,470 employed individuals in Bemidji, private company employees (4,377 | 58.6%), not-for-profit organizations (862 | 11.5%), and local government employees (786 | 10.5%) make up the most common classes of employment.
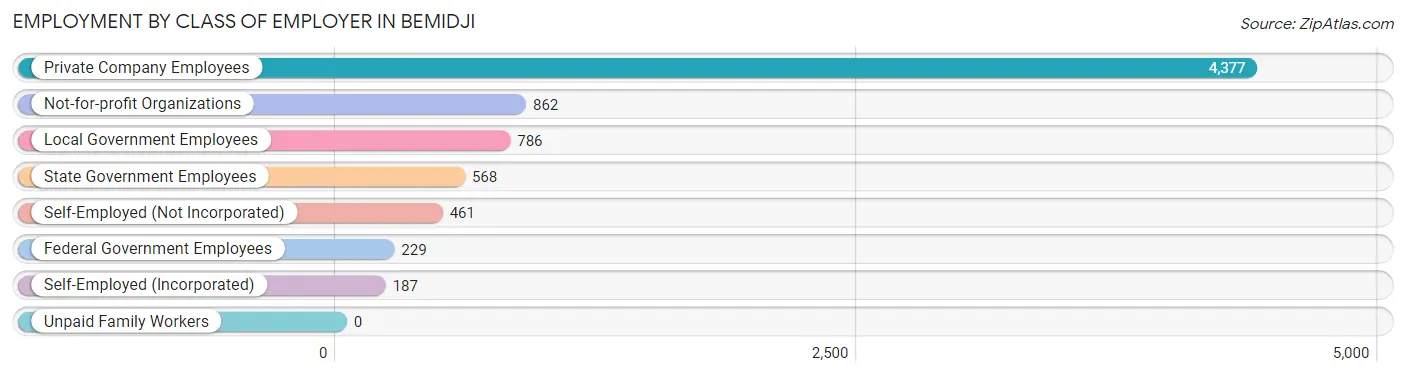
| Employer Class | # Employees | % Employees |
| Private Company Employees | 4,377 | 58.6% |
| Self-Employed (Incorporated) | 187 | 2.5% |
| Self-Employed (Not Incorporated) | 461 | 6.2% |
| Not-for-profit Organizations | 862 | 11.5% |
| Local Government Employees | 786 | 10.5% |
| State Government Employees | 568 | 7.6% |
| Federal Government Employees | 229 | 3.1% |
| Unpaid Family Workers | 0 | 0.0% |
| Total | 7,470 | 100.0% |
Employment Status by Age in Bemidji
According to the labor force statistics for Bemidji, out of the total population over 16 years of age (12,724), 63.3% or 8,054 individuals are in the labor force, with 4.2% or 338 of them unemployed. The age group with the highest labor force participation rate is 25 to 29 years, with 92.9% or 926 individuals in the labor force. Within the labor force, the 30 to 34 years age range has the highest percentage of unemployed individuals, with 12.5% or 78 of them being unemployed.
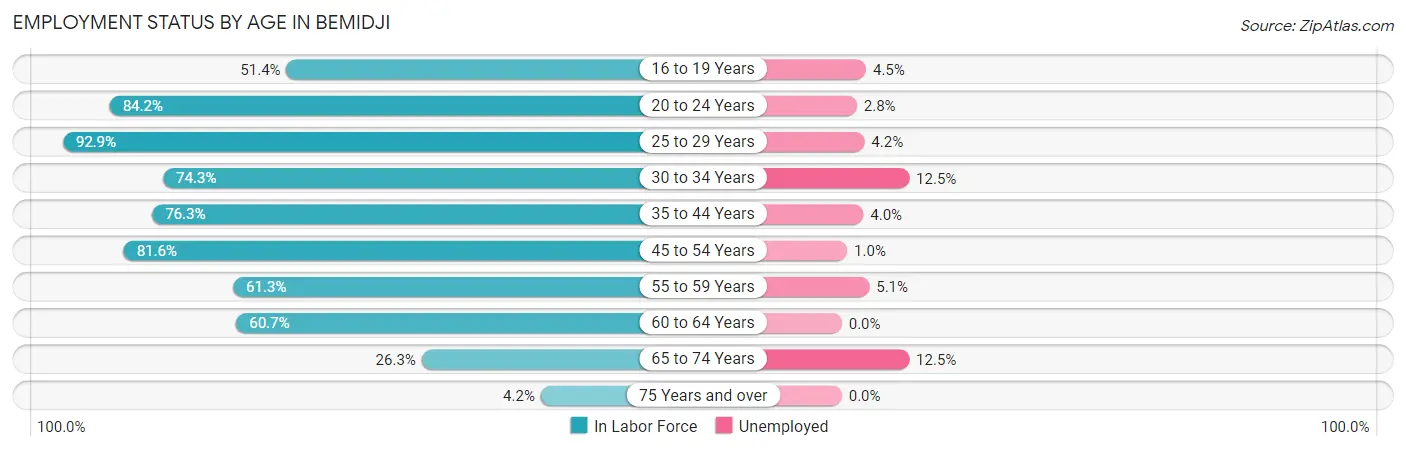
| Age Bracket | In Labor Force | Unemployed |
| 16 to 19 Years | 755 (51.4%) | 34 (4.5%) |
| 20 to 24 Years | 2,346 (84.2%) | 66 (2.8%) |
| 25 to 29 Years | 926 (92.9%) | 39 (4.2%) |
| 30 to 34 Years | 623 (74.3%) | 78 (12.5%) |
| 35 to 44 Years | 1,396 (76.3%) | 56 (4.0%) |
| 45 to 54 Years | 811 (81.6%) | 8 (1.0%) |
| 55 to 59 Years | 352 (61.3%) | 18 (5.1%) |
| 60 to 64 Years | 475 (60.7%) | 0 (0.0%) |
| 65 to 74 Years | 313 (26.3%) | 39 (12.5%) |
| 75 Years and over | 53 (4.2%) | 0 (0.0%) |
| Total | 8,054 (63.3%) | 338 (4.2%) |
Employment Status by Educational Attainment in Bemidji
According to labor force statistics for Bemidji, 76.2% of individuals (4,583) out of the total population between 25 and 64 years of age (6,014) are in the labor force, with 4.3% or 197 of them being unemployed. The group with the highest labor force participation rate are those with the educational attainment of bachelor's degree or higher, with 83.1% or 1,642 individuals in the labor force. Within the labor force, individuals with less than high school education have the highest percentage of unemployment, with 22.7% or 67 of them being unemployed.
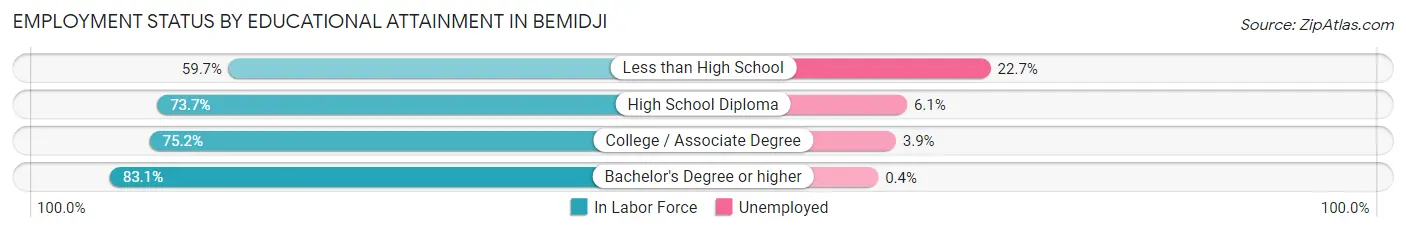
| Educational Attainment | In Labor Force | Unemployed |
| Less than High School | 295 (59.7%) | 112 (22.7%) |
| High School Diploma | 1,002 (73.7%) | 83 (6.1%) |
| College / Associate Degree | 1,643 (75.2%) | 85 (3.9%) |
| Bachelor's Degree or higher | 1,642 (83.1%) | 8 (0.4%) |
| Total | 4,583 (76.2%) | 259 (4.3%) |
Employment Occupations by Sex in Bemidji
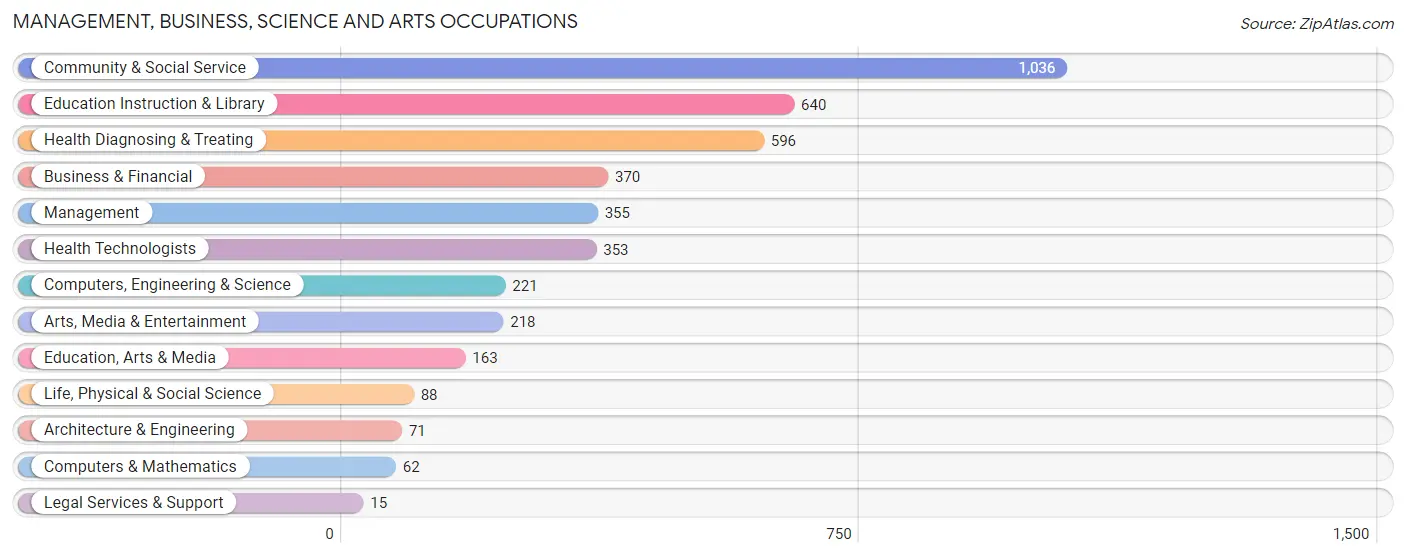
Management, Business, Science and Arts Occupations
The most common Management, Business, Science and Arts occupations in Bemidji are Community & Social Service (1,036 | 13.5%), Education Instruction & Library (640 | 8.3%), Health Diagnosing & Treating (596 | 7.7%), Business & Financial (370 | 4.8%), and Management (355 | 4.6%).
Management, Business, Science and Arts Occupations by Sex
Within the Management, Business, Science and Arts occupations in Bemidji, the most male-oriented occupations are Architecture & Engineering (100.0%), Computers & Mathematics (77.4%), and Computers, Engineering & Science (71.0%), while the most female-oriented occupations are Legal Services & Support (100.0%), Health Technologists (72.2%), and Health Diagnosing & Treating (70.6%).
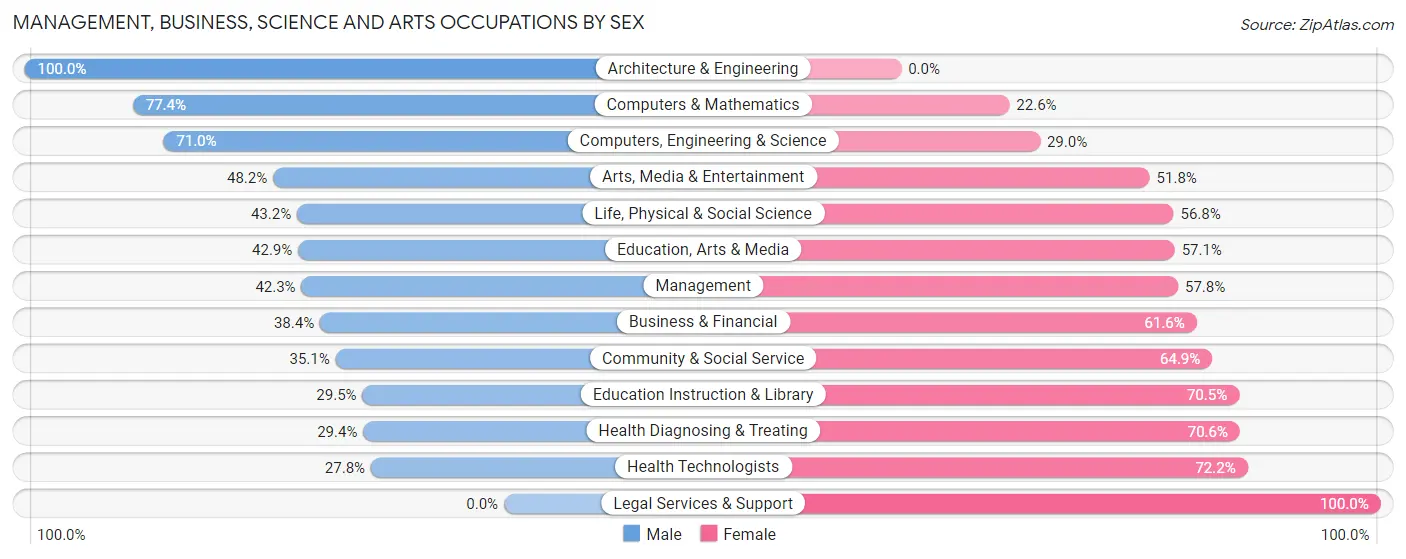
| Occupation | Male | Female |
| Management | 150 (42.2%) | 205 (57.8%) |
| Business & Financial | 142 (38.4%) | 228 (61.6%) |
| Computers, Engineering & Science | 157 (71.0%) | 64 (29.0%) |
| Computers & Mathematics | 48 (77.4%) | 14 (22.6%) |
| Architecture & Engineering | 71 (100.0%) | 0 (0.0%) |
| Life, Physical & Social Science | 38 (43.2%) | 50 (56.8%) |
| Community & Social Service | 364 (35.1%) | 672 (64.9%) |
| Education, Arts & Media | 70 (42.9%) | 93 (57.1%) |
| Legal Services & Support | 0 (0.0%) | 15 (100.0%) |
| Education Instruction & Library | 189 (29.5%) | 451 (70.5%) |
| Arts, Media & Entertainment | 105 (48.2%) | 113 (51.8%) |
| Health Diagnosing & Treating | 175 (29.4%) | 421 (70.6%) |
| Health Technologists | 98 (27.8%) | 255 (72.2%) |
| Total (Category) | 988 (38.3%) | 1,590 (61.7%) |
| Total (Overall) | 3,703 (48.1%) | 3,996 (51.9%) |
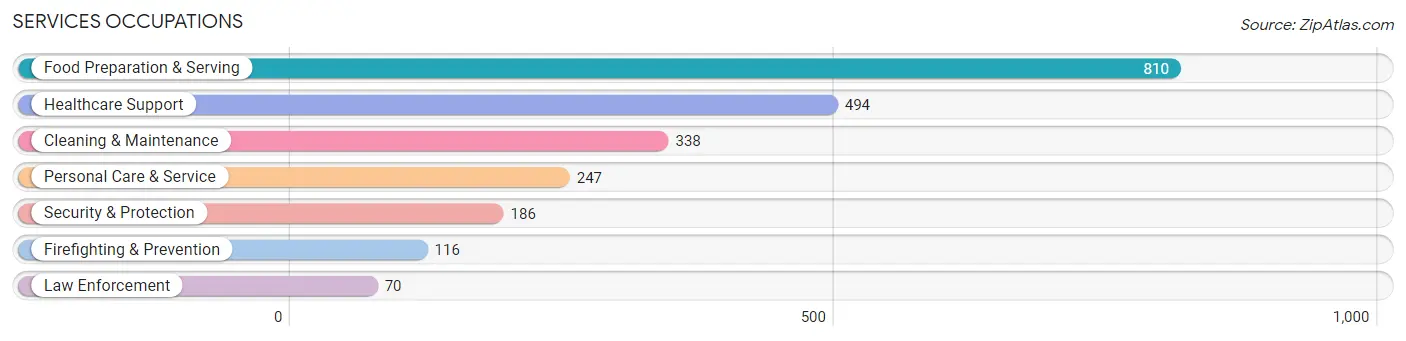
Services Occupations
The most common Services occupations in Bemidji are Food Preparation & Serving (810 | 10.5%), Healthcare Support (494 | 6.4%), Cleaning & Maintenance (338 | 4.4%), Personal Care & Service (247 | 3.2%), and Security & Protection (186 | 2.4%).
Services Occupations by Sex
Within the Services occupations in Bemidji, the most male-oriented occupations are Law Enforcement (82.9%), Security & Protection (80.1%), and Firefighting & Prevention (78.4%), while the most female-oriented occupations are Healthcare Support (88.7%), Personal Care & Service (84.2%), and Food Preparation & Serving (48.9%).
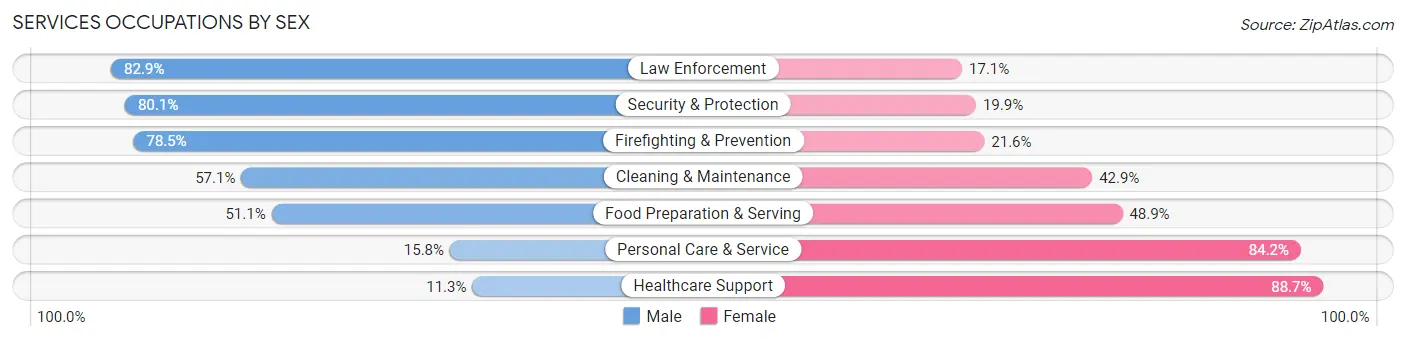
| Occupation | Male | Female |
| Healthcare Support | 56 (11.3%) | 438 (88.7%) |
| Security & Protection | 149 (80.1%) | 37 (19.9%) |
| Firefighting & Prevention | 91 (78.4%) | 25 (21.5%) |
| Law Enforcement | 58 (82.9%) | 12 (17.1%) |
| Food Preparation & Serving | 414 (51.1%) | 396 (48.9%) |
| Cleaning & Maintenance | 193 (57.1%) | 145 (42.9%) |
| Personal Care & Service | 39 (15.8%) | 208 (84.2%) |
| Total (Category) | 851 (41.0%) | 1,224 (59.0%) |
| Total (Overall) | 3,703 (48.1%) | 3,996 (51.9%) |
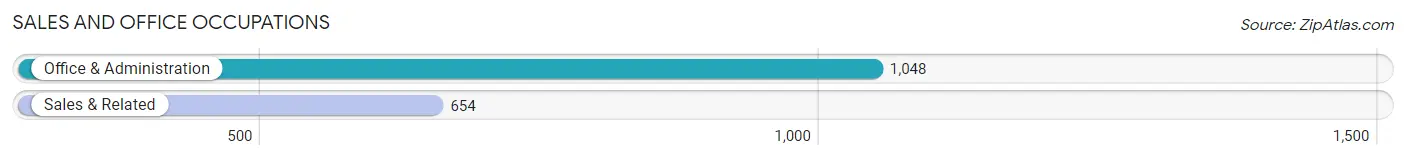
Sales and Office Occupations
The most common Sales and Office occupations in Bemidji are Office & Administration (1,048 | 13.6%), and Sales & Related (654 | 8.5%).
Sales and Office Occupations by Sex
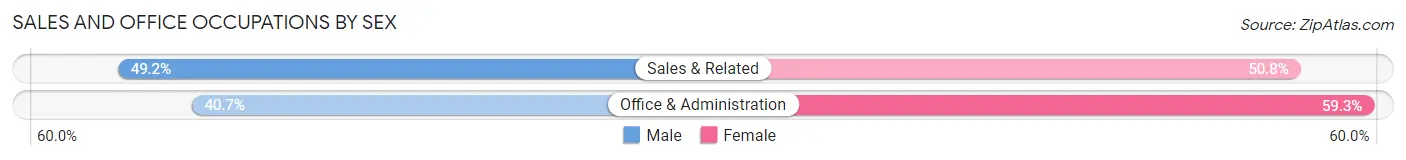
| Occupation | Male | Female |
| Sales & Related | 322 (49.2%) | 332 (50.8%) |
| Office & Administration | 427 (40.7%) | 621 (59.3%) |
| Total (Category) | 749 (44.0%) | 953 (56.0%) |
| Total (Overall) | 3,703 (48.1%) | 3,996 (51.9%) |
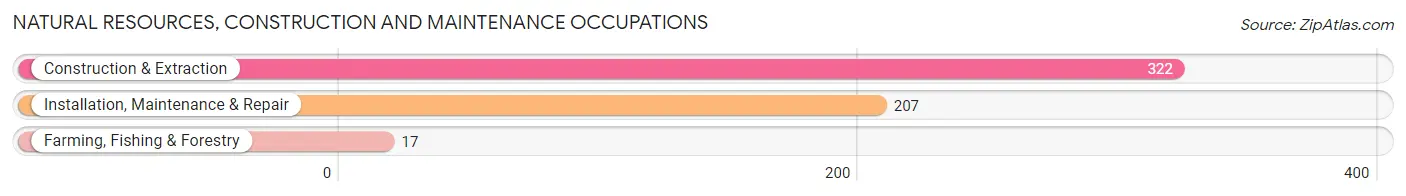
Natural Resources, Construction and Maintenance Occupations
The most common Natural Resources, Construction and Maintenance occupations in Bemidji are Construction & Extraction (322 | 4.2%), Installation, Maintenance & Repair (207 | 2.7%), and Farming, Fishing & Forestry (17 | 0.2%).
Natural Resources, Construction and Maintenance Occupations by Sex
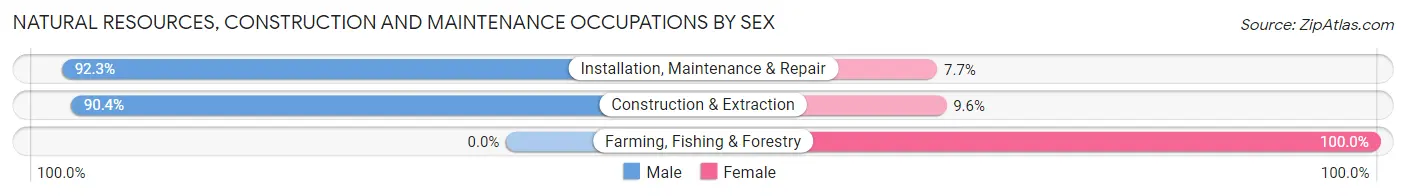
| Occupation | Male | Female |
| Farming, Fishing & Forestry | 0 (0.0%) | 17 (100.0%) |
| Construction & Extraction | 291 (90.4%) | 31 (9.6%) |
| Installation, Maintenance & Repair | 191 (92.3%) | 16 (7.7%) |
| Total (Category) | 482 (88.3%) | 64 (11.7%) |
| Total (Overall) | 3,703 (48.1%) | 3,996 (51.9%) |
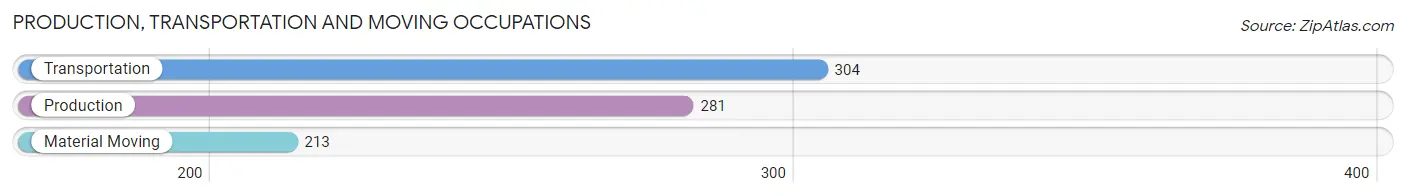
Production, Transportation and Moving Occupations
The most common Production, Transportation and Moving occupations in Bemidji are Transportation (304 | 4.0%), Production (281 | 3.6%), and Material Moving (213 | 2.8%).
Production, Transportation and Moving Occupations by Sex
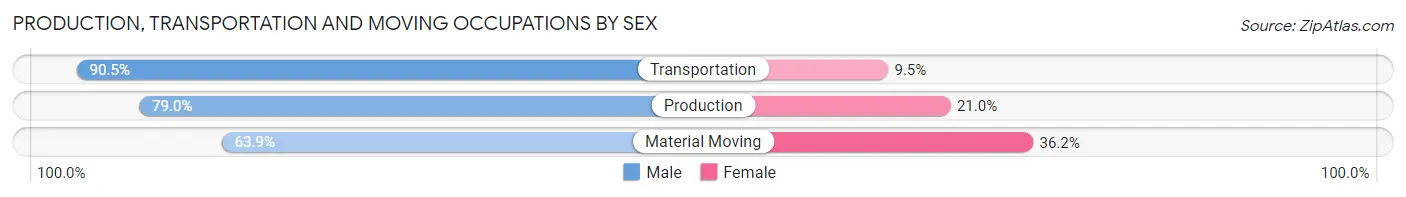
| Occupation | Male | Female |
| Production | 222 (79.0%) | 59 (21.0%) |
| Transportation | 275 (90.5%) | 29 (9.5%) |
| Material Moving | 136 (63.8%) | 77 (36.1%) |
| Total (Category) | 633 (79.3%) | 165 (20.7%) |
| Total (Overall) | 3,703 (48.1%) | 3,996 (51.9%) |
Employment Industries by Sex in Bemidji
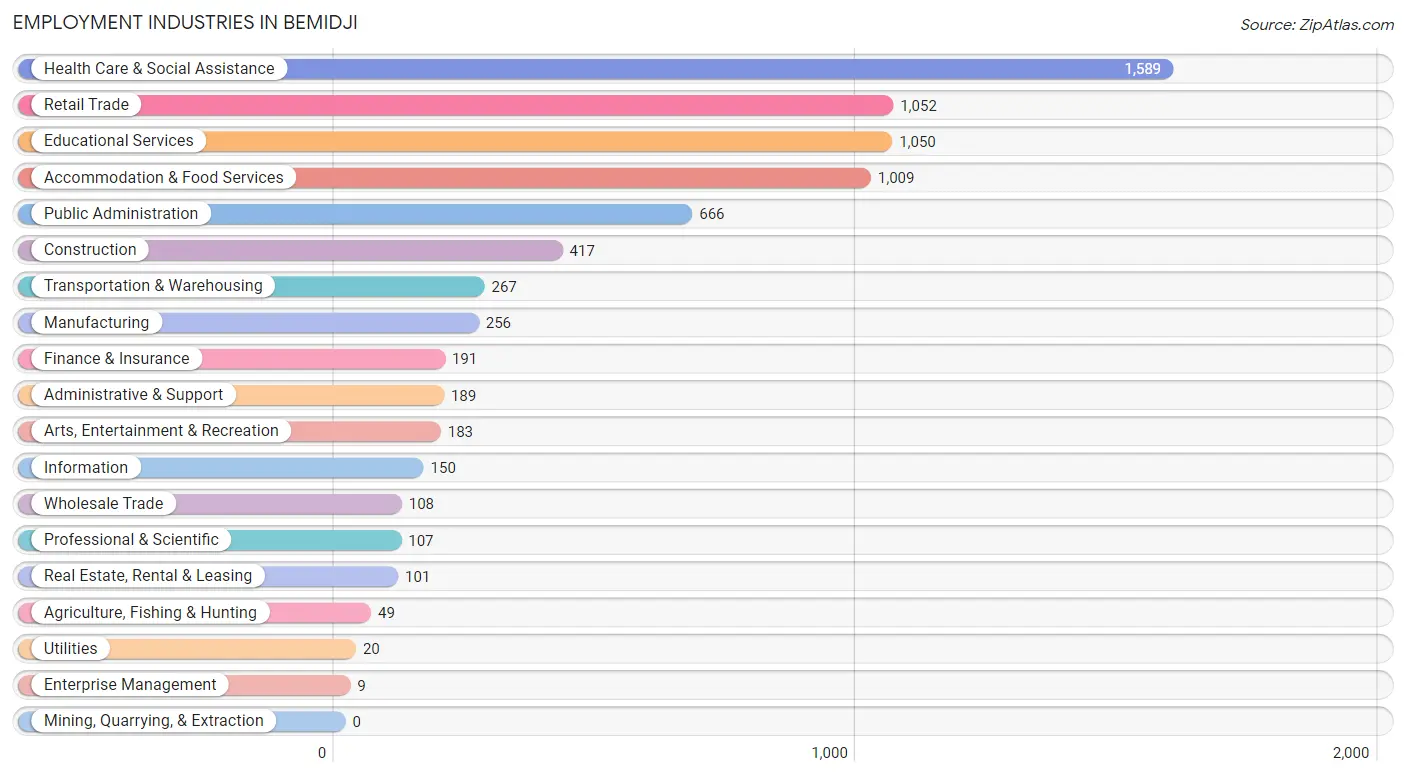
Employment Industries in Bemidji
The major employment industries in Bemidji include Health Care & Social Assistance (1,589 | 20.6%), Retail Trade (1,052 | 13.7%), Educational Services (1,050 | 13.6%), Accommodation & Food Services (1,009 | 13.1%), and Public Administration (666 | 8.6%).
Employment Industries by Sex in Bemidji
The Bemidji industries that see more men than women are Agriculture, Fishing & Hunting (100.0%), Wholesale Trade (100.0%), and Transportation & Warehousing (100.0%), whereas the industries that tend to have a higher number of women are Utilities (100.0%), Enterprise Management (100.0%), and Finance & Insurance (82.2%).
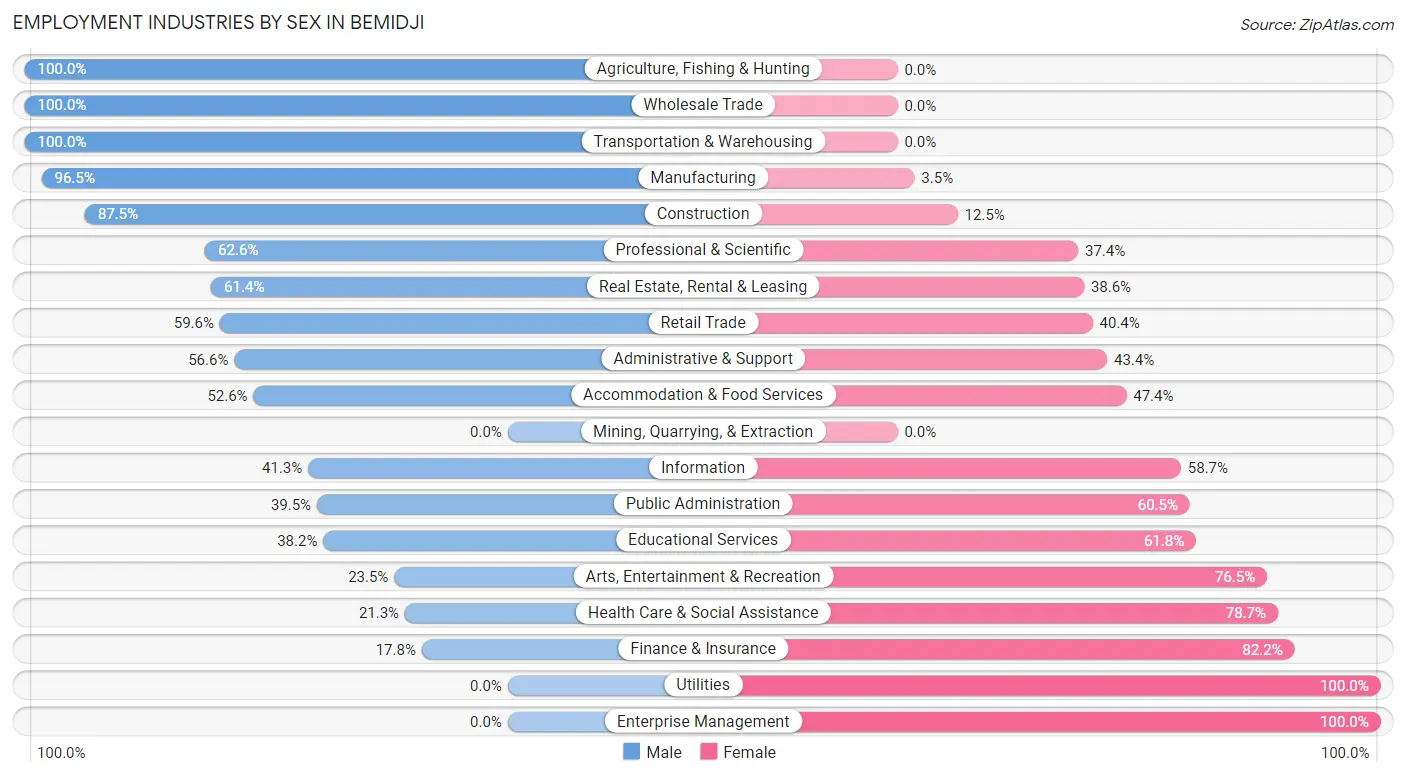
| Industry | Male | Female |
| Agriculture, Fishing & Hunting | 49 (100.0%) | 0 (0.0%) |
| Mining, Quarrying, & Extraction | 0 (0.0%) | 0 (0.0%) |
| Construction | 365 (87.5%) | 52 (12.5%) |
| Manufacturing | 247 (96.5%) | 9 (3.5%) |
| Wholesale Trade | 108 (100.0%) | 0 (0.0%) |
| Retail Trade | 627 (59.6%) | 425 (40.4%) |
| Transportation & Warehousing | 267 (100.0%) | 0 (0.0%) |
| Utilities | 0 (0.0%) | 20 (100.0%) |
| Information | 62 (41.3%) | 88 (58.7%) |
| Finance & Insurance | 34 (17.8%) | 157 (82.2%) |
| Real Estate, Rental & Leasing | 62 (61.4%) | 39 (38.6%) |
| Professional & Scientific | 67 (62.6%) | 40 (37.4%) |
| Enterprise Management | 0 (0.0%) | 9 (100.0%) |
| Administrative & Support | 107 (56.6%) | 82 (43.4%) |
| Educational Services | 401 (38.2%) | 649 (61.8%) |
| Health Care & Social Assistance | 338 (21.3%) | 1,251 (78.7%) |
| Arts, Entertainment & Recreation | 43 (23.5%) | 140 (76.5%) |
| Accommodation & Food Services | 531 (52.6%) | 478 (47.4%) |
| Public Administration | 263 (39.5%) | 403 (60.5%) |
| Total | 3,703 (48.1%) | 3,996 (51.9%) |
Education in Bemidji
School Enrollment in Bemidji
The most common levels of schooling among the 5,355 students in Bemidji are college / undergraduate (2,655 | 49.6%), high school (794 | 14.8%), and elementary school (696 | 13.0%).
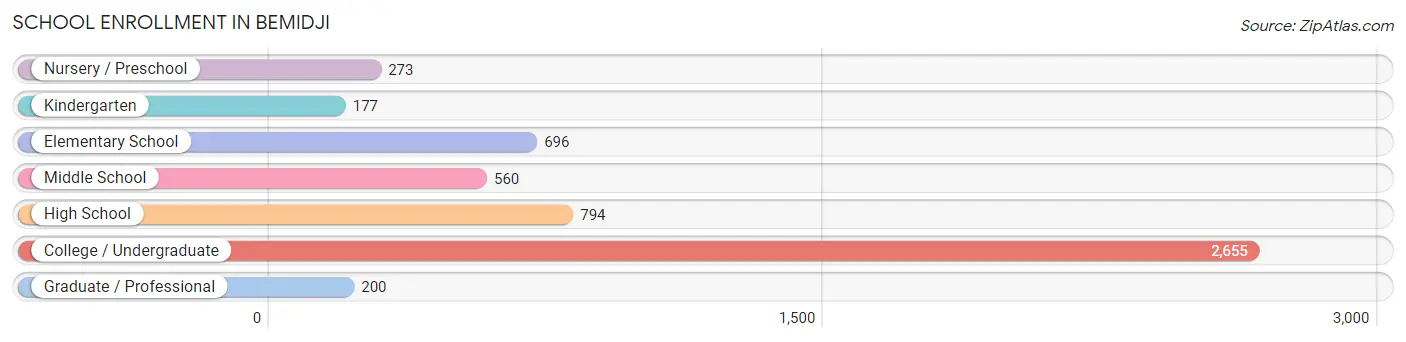
| School Level | # Students | % Students |
| Nursery / Preschool | 273 | 5.1% |
| Kindergarten | 177 | 3.3% |
| Elementary School | 696 | 13.0% |
| Middle School | 560 | 10.5% |
| High School | 794 | 14.8% |
| College / Undergraduate | 2,655 | 49.6% |
| Graduate / Professional | 200 | 3.7% |
| Total | 5,355 | 100.0% |
School Enrollment by Age by Funding Source in Bemidji
Out of a total of 5,355 students who are enrolled in schools in Bemidji, 884 (16.5%) attend a private institution, while the remaining 4,471 (83.5%) are enrolled in public schools. The age group of 3 to 4 year olds has the highest likelihood of being enrolled in private schools, with 162 (73.6% in the age bracket) enrolled. Conversely, the age group of 18 to 19 year olds has the lowest likelihood of being enrolled in a private school, with 855 (95.6% in the age bracket) attending a public institution.
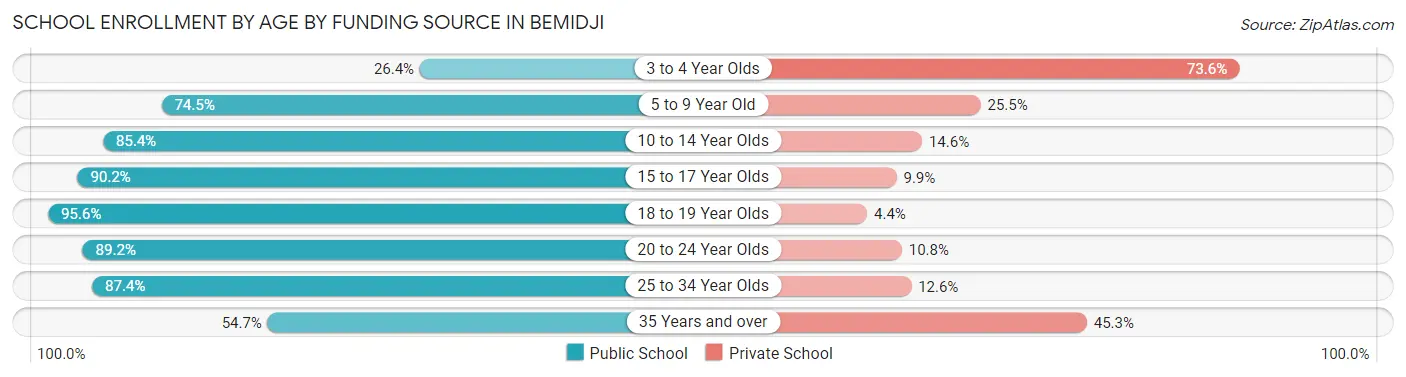
| Age Bracket | Public School | Private School |
| 3 to 4 Year Olds | 58 (26.4%) | 162 (73.6%) |
| 5 to 9 Year Old | 628 (74.5%) | 215 (25.5%) |
| 10 to 14 Year Olds | 597 (85.4%) | 102 (14.6%) |
| 15 to 17 Year Olds | 430 (90.1%) | 47 (9.9%) |
| 18 to 19 Year Olds | 855 (95.6%) | 39 (4.4%) |
| 20 to 24 Year Olds | 1,509 (89.2%) | 183 (10.8%) |
| 25 to 34 Year Olds | 278 (87.4%) | 40 (12.6%) |
| 35 Years and over | 116 (54.7%) | 96 (45.3%) |
| Total | 4,471 (83.5%) | 884 (16.5%) |
Educational Attainment by Field of Study in Bemidji
Education (673 | 21.5%), arts & humanities (350 | 11.2%), science & technology (338 | 10.8%), bio, nature & agricultural (315 | 10.1%), and business (294 | 9.4%) are the most common fields of study among 3,125 individuals in Bemidji who have obtained a bachelor's degree or higher.
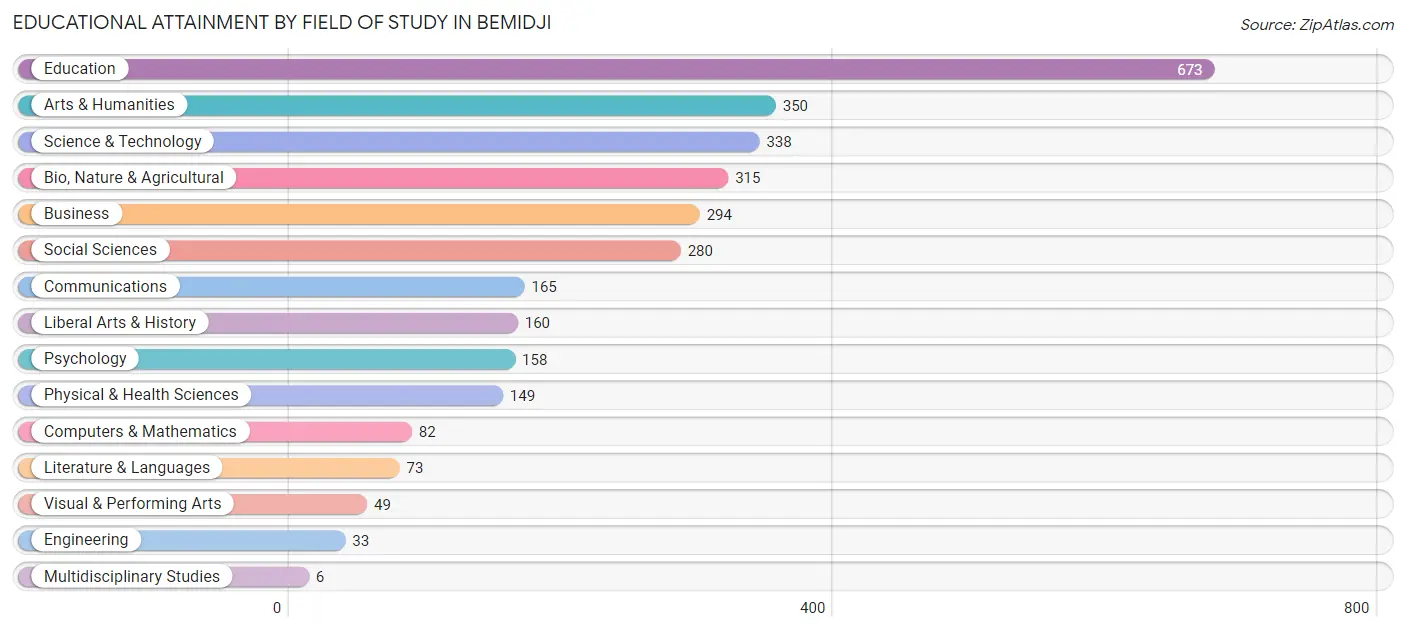
| Field of Study | # Graduates | % Graduates |
| Computers & Mathematics | 82 | 2.6% |
| Bio, Nature & Agricultural | 315 | 10.1% |
| Physical & Health Sciences | 149 | 4.8% |
| Psychology | 158 | 5.1% |
| Social Sciences | 280 | 9.0% |
| Engineering | 33 | 1.1% |
| Multidisciplinary Studies | 6 | 0.2% |
| Science & Technology | 338 | 10.8% |
| Business | 294 | 9.4% |
| Education | 673 | 21.5% |
| Literature & Languages | 73 | 2.3% |
| Liberal Arts & History | 160 | 5.1% |
| Visual & Performing Arts | 49 | 1.6% |
| Communications | 165 | 5.3% |
| Arts & Humanities | 350 | 11.2% |
| Total | 3,125 | 100.0% |
Transportation & Commute in Bemidji
Vehicle Availability by Sex in Bemidji
The most prevalent vehicle ownership categories in Bemidji are males with 2 vehicles (1,214, accounting for 35.9%) and females with 2 vehicles (1,428, making up 33.9%).
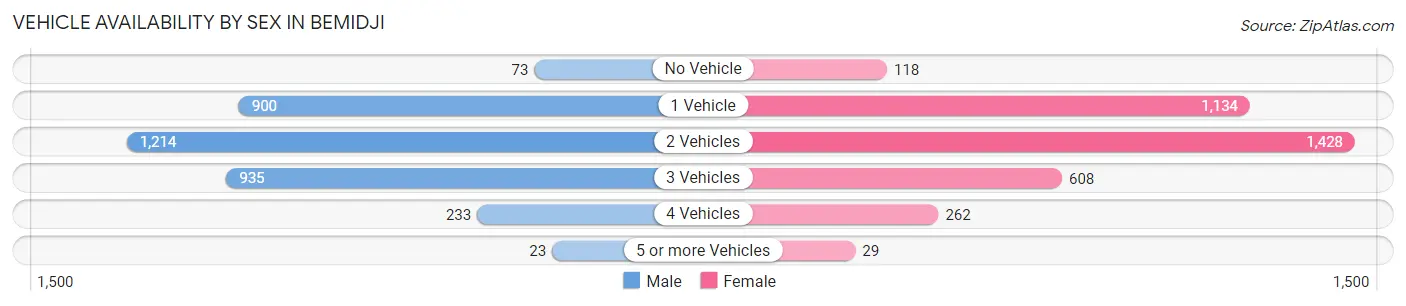
| Vehicles Available | Male | Female |
| No Vehicle | 73 (2.2%) | 118 (3.3%) |
| 1 Vehicle | 900 (26.6%) | 1,134 (31.7%) |
| 2 Vehicles | 1,214 (35.9%) | 1,428 (39.9%) |
| 3 Vehicles | 935 (27.7%) | 608 (17.0%) |
| 4 Vehicles | 233 (6.9%) | 262 (7.3%) |
| 5 or more Vehicles | 23 (0.7%) | 29 (0.8%) |
| Total | 3,378 (100.0%) | 3,579 (100.0%) |
Commute Time in Bemidji
The most frequently occuring commute durations in Bemidji are 5 to 9 minutes (2,062 commuters, 29.8%), 10 to 14 minutes (2,052 commuters, 29.6%), and 15 to 19 minutes (748 commuters, 10.8%).
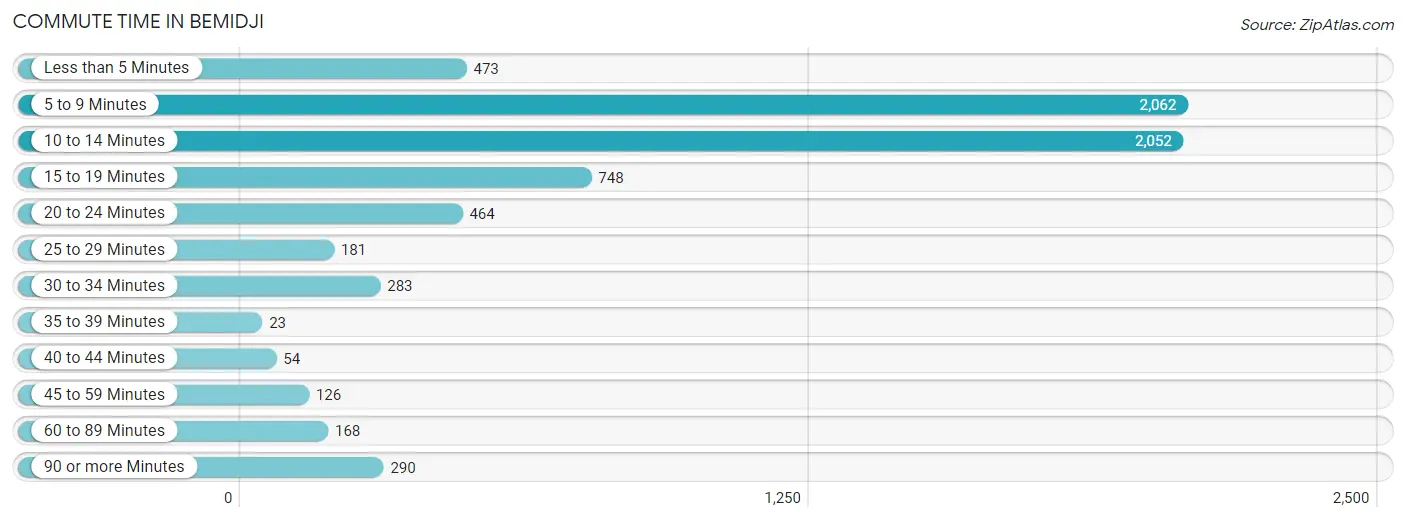
| Commute Time | # Commuters | % Commuters |
| Less than 5 Minutes | 473 | 6.8% |
| 5 to 9 Minutes | 2,062 | 29.8% |
| 10 to 14 Minutes | 2,052 | 29.6% |
| 15 to 19 Minutes | 748 | 10.8% |
| 20 to 24 Minutes | 464 | 6.7% |
| 25 to 29 Minutes | 181 | 2.6% |
| 30 to 34 Minutes | 283 | 4.1% |
| 35 to 39 Minutes | 23 | 0.3% |
| 40 to 44 Minutes | 54 | 0.8% |
| 45 to 59 Minutes | 126 | 1.8% |
| 60 to 89 Minutes | 168 | 2.4% |
| 90 or more Minutes | 290 | 4.2% |
Commute Time by Sex in Bemidji
The most common commute times in Bemidji are 10 to 14 minutes (1,119 commuters, 32.8%) for males and 5 to 9 minutes (1,160 commuters, 33.0%) for females.
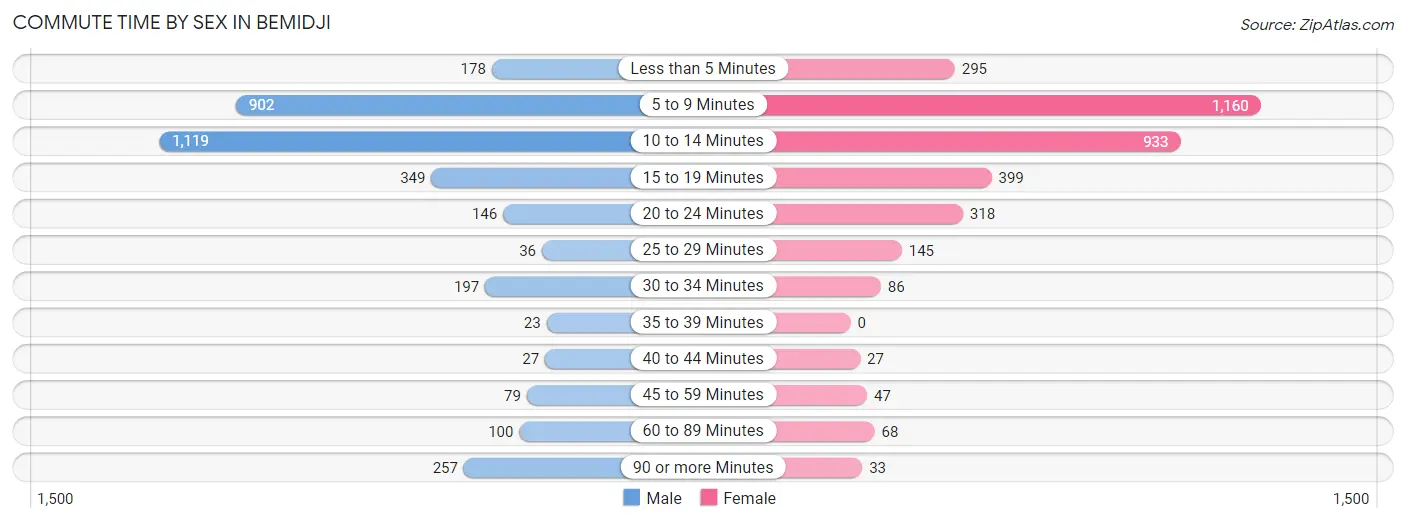
| Commute Time | Male | Female |
| Less than 5 Minutes | 178 (5.2%) | 295 (8.4%) |
| 5 to 9 Minutes | 902 (26.4%) | 1,160 (33.0%) |
| 10 to 14 Minutes | 1,119 (32.8%) | 933 (26.6%) |
| 15 to 19 Minutes | 349 (10.2%) | 399 (11.4%) |
| 20 to 24 Minutes | 146 (4.3%) | 318 (9.1%) |
| 25 to 29 Minutes | 36 (1.1%) | 145 (4.1%) |
| 30 to 34 Minutes | 197 (5.8%) | 86 (2.5%) |
| 35 to 39 Minutes | 23 (0.7%) | 0 (0.0%) |
| 40 to 44 Minutes | 27 (0.8%) | 27 (0.8%) |
| 45 to 59 Minutes | 79 (2.3%) | 47 (1.3%) |
| 60 to 89 Minutes | 100 (2.9%) | 68 (1.9%) |
| 90 or more Minutes | 257 (7.5%) | 33 (0.9%) |
Time of Departure to Work by Sex in Bemidji
The most frequent times of departure to work in Bemidji are 7:30 AM to 7:59 AM (645, 18.9%) for males and 7:30 AM to 7:59 AM (1,038, 29.6%) for females.
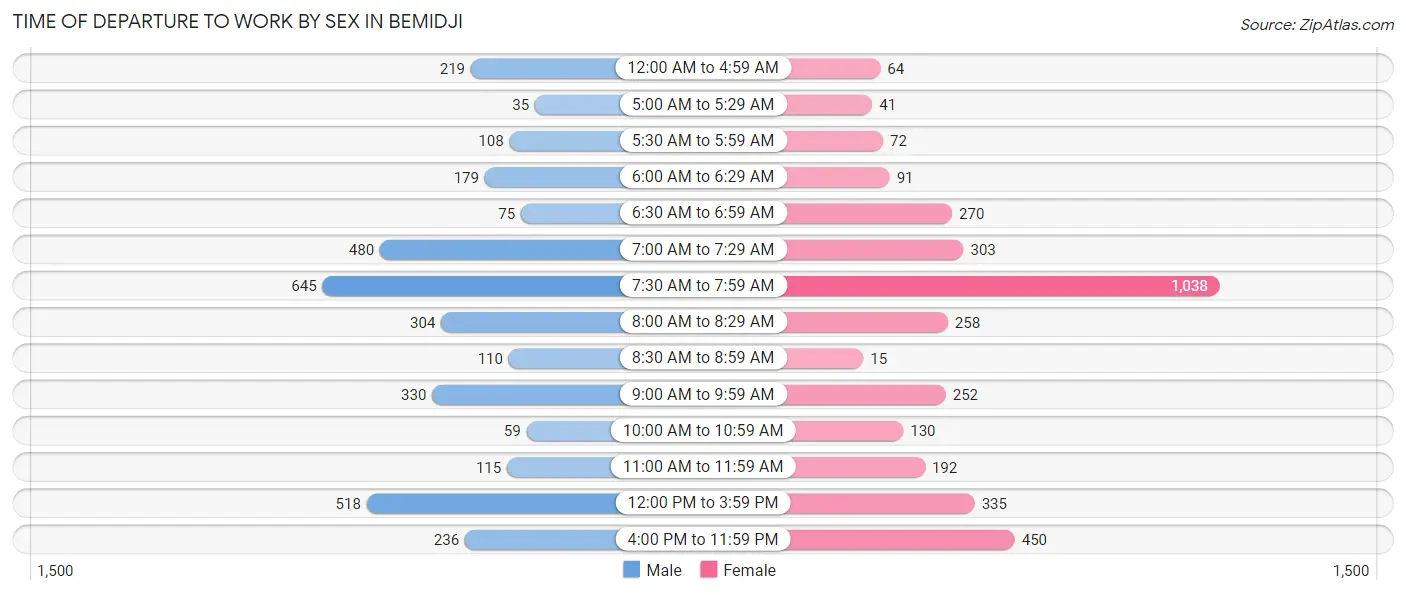
| Time of Departure | Male | Female |
| 12:00 AM to 4:59 AM | 219 (6.4%) | 64 (1.8%) |
| 5:00 AM to 5:29 AM | 35 (1.0%) | 41 (1.2%) |
| 5:30 AM to 5:59 AM | 108 (3.2%) | 72 (2.1%) |
| 6:00 AM to 6:29 AM | 179 (5.2%) | 91 (2.6%) |
| 6:30 AM to 6:59 AM | 75 (2.2%) | 270 (7.7%) |
| 7:00 AM to 7:29 AM | 480 (14.1%) | 303 (8.6%) |
| 7:30 AM to 7:59 AM | 645 (18.9%) | 1,038 (29.6%) |
| 8:00 AM to 8:29 AM | 304 (8.9%) | 258 (7.3%) |
| 8:30 AM to 8:59 AM | 110 (3.2%) | 15 (0.4%) |
| 9:00 AM to 9:59 AM | 330 (9.7%) | 252 (7.2%) |
| 10:00 AM to 10:59 AM | 59 (1.7%) | 130 (3.7%) |
| 11:00 AM to 11:59 AM | 115 (3.4%) | 192 (5.5%) |
| 12:00 PM to 3:59 PM | 518 (15.2%) | 335 (9.5%) |
| 4:00 PM to 11:59 PM | 236 (6.9%) | 450 (12.8%) |
| Total | 3,413 (100.0%) | 3,511 (100.0%) |
Housing Occupancy in Bemidji
Occupancy by Ownership in Bemidji
Of the total 6,451 dwellings in Bemidji, owner-occupied units account for 2,611 (40.5%), while renter-occupied units make up 3,840 (59.5%).
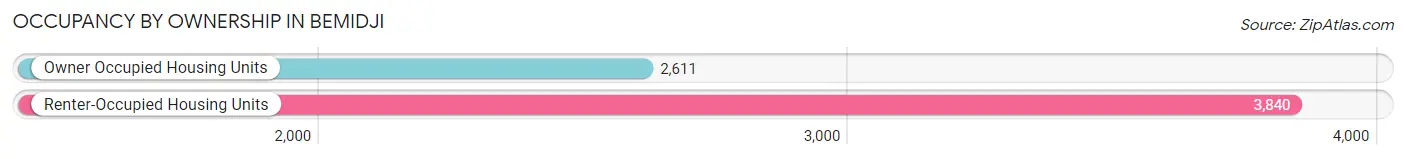
| Occupancy | # Housing Units | % Housing Units |
| Owner Occupied Housing Units | 2,611 | 40.5% |
| Renter-Occupied Housing Units | 3,840 | 59.5% |
| Total Occupied Housing Units | 6,451 | 100.0% |
Occupancy by Household Size in Bemidji
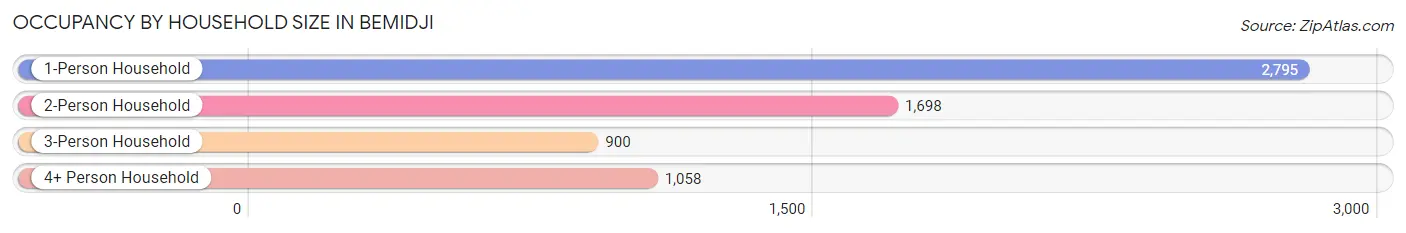
| Household Size | # Housing Units | % Housing Units |
| 1-Person Household | 2,795 | 43.3% |
| 2-Person Household | 1,698 | 26.3% |
| 3-Person Household | 900 | 14.0% |
| 4+ Person Household | 1,058 | 16.4% |
| Total Housing Units | 6,451 | 100.0% |
Occupancy by Ownership by Household Size in Bemidji
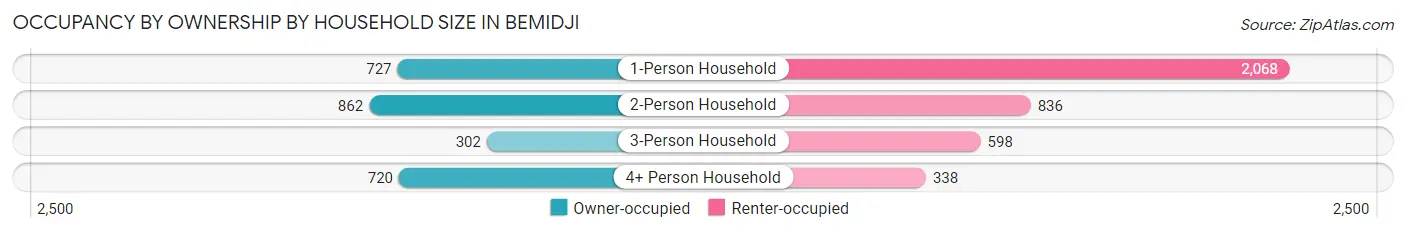
| Household Size | Owner-occupied | Renter-occupied |
| 1-Person Household | 727 (26.0%) | 2,068 (74.0%) |
| 2-Person Household | 862 (50.8%) | 836 (49.2%) |
| 3-Person Household | 302 (33.6%) | 598 (66.4%) |
| 4+ Person Household | 720 (68.0%) | 338 (32.0%) |
| Total Housing Units | 2,611 (40.5%) | 3,840 (59.5%) |
Occupancy by Educational Attainment in Bemidji
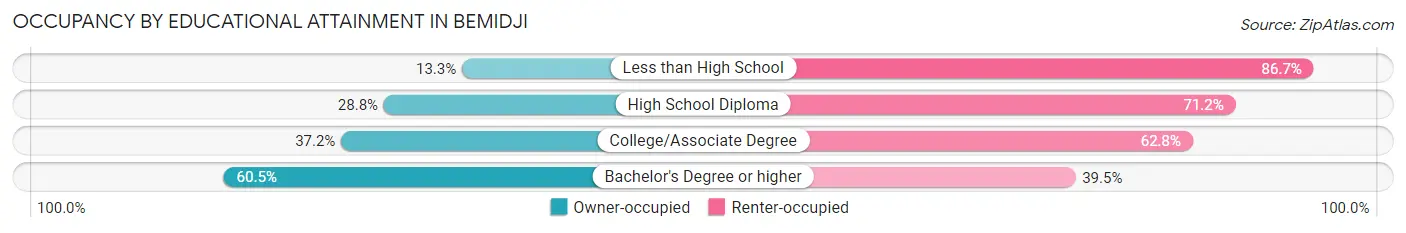
| Household Size | Owner-occupied | Renter-occupied |
| Less than High School | 58 (13.3%) | 379 (86.7%) |
| High School Diploma | 455 (28.8%) | 1,127 (71.2%) |
| College/Associate Degree | 934 (37.2%) | 1,575 (62.8%) |
| Bachelor's Degree or higher | 1,164 (60.5%) | 759 (39.5%) |
Occupancy by Age of Householder in Bemidji
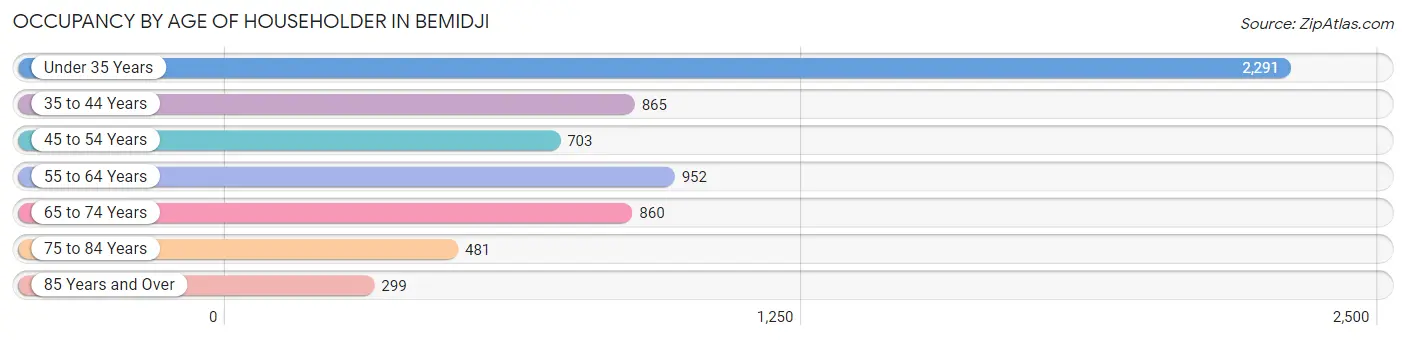
| Age Bracket | # Households | % Households |
| Under 35 Years | 2,291 | 35.5% |
| 35 to 44 Years | 865 | 13.4% |
| 45 to 54 Years | 703 | 10.9% |
| 55 to 64 Years | 952 | 14.8% |
| 65 to 74 Years | 860 | 13.3% |
| 75 to 84 Years | 481 | 7.5% |
| 85 Years and Over | 299 | 4.6% |
| Total | 6,451 | 100.0% |
Housing Finances in Bemidji
Median Income by Occupancy in Bemidji
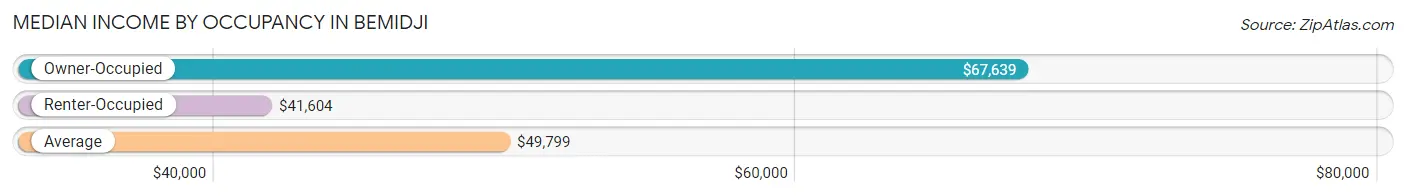
| Occupancy Type | # Households | Median Income |
| Owner-Occupied | 2,611 (40.5%) | $67,639 |
| Renter-Occupied | 3,840 (59.5%) | $41,604 |
| Average | 6,451 (100.0%) | $49,799 |
Occupancy by Householder Income Bracket in Bemidji
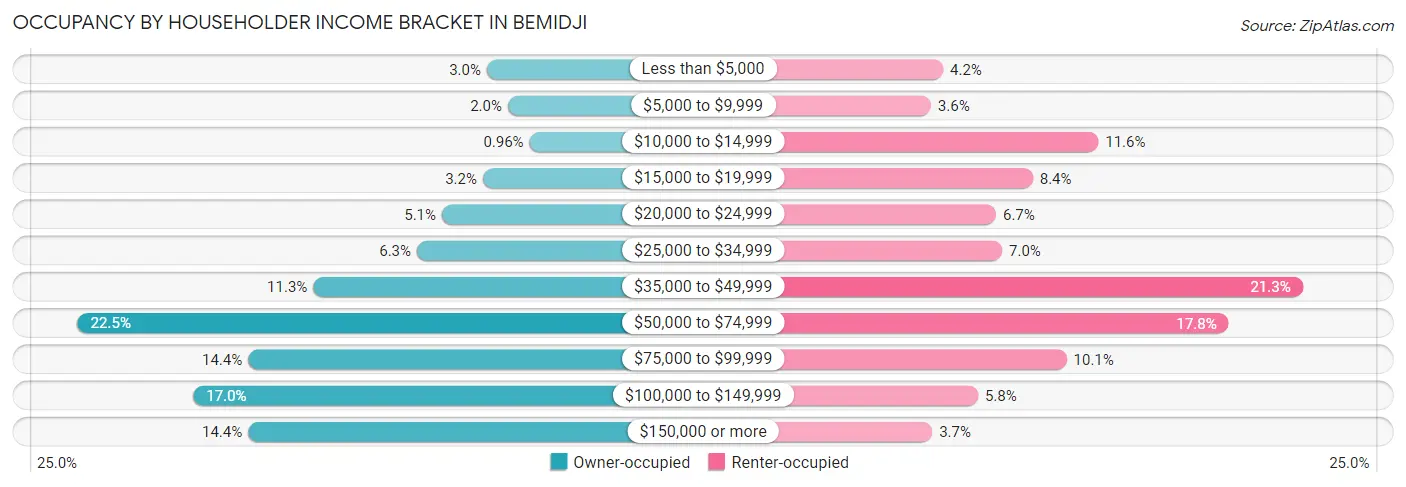
| Income Bracket | Owner-occupied | Renter-occupied |
| Less than $5,000 | 78 (3.0%) | 160 (4.2%) |
| $5,000 to $9,999 | 52 (2.0%) | 138 (3.6%) |
| $10,000 to $14,999 | 25 (1.0%) | 444 (11.6%) |
| $15,000 to $19,999 | 83 (3.2%) | 324 (8.4%) |
| $20,000 to $24,999 | 134 (5.1%) | 257 (6.7%) |
| $25,000 to $34,999 | 165 (6.3%) | 268 (7.0%) |
| $35,000 to $49,999 | 294 (11.3%) | 817 (21.3%) |
| $50,000 to $74,999 | 587 (22.5%) | 682 (17.8%) |
| $75,000 to $99,999 | 375 (14.4%) | 386 (10.1%) |
| $100,000 to $149,999 | 443 (17.0%) | 224 (5.8%) |
| $150,000 or more | 375 (14.4%) | 140 (3.6%) |
| Total | 2,611 (100.0%) | 3,840 (100.0%) |
Monthly Housing Cost Tiers in Bemidji
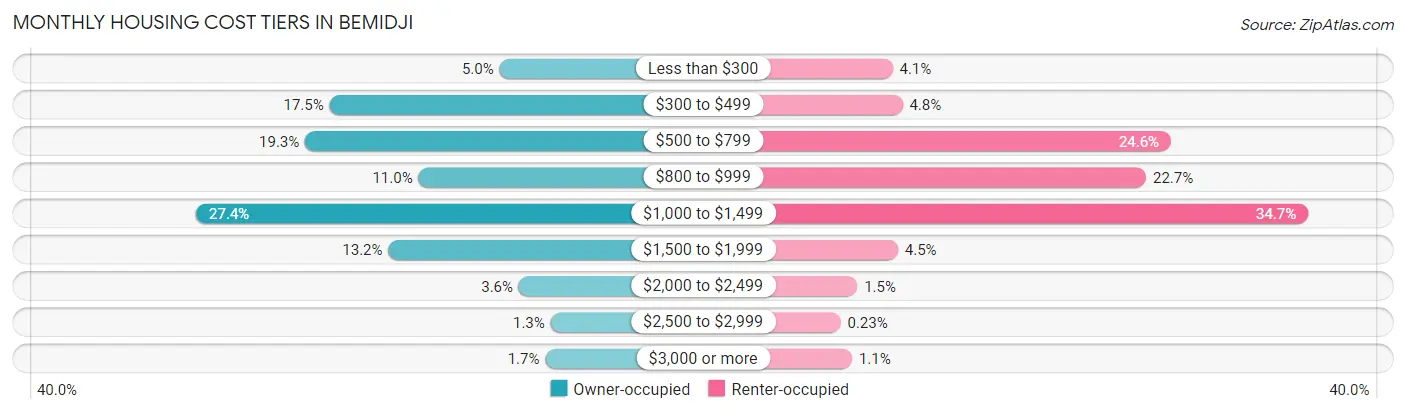
| Monthly Cost | Owner-occupied | Renter-occupied |
| Less than $300 | 131 (5.0%) | 156 (4.1%) |
| $300 to $499 | 458 (17.5%) | 184 (4.8%) |
| $500 to $799 | 505 (19.3%) | 943 (24.6%) |
| $800 to $999 | 287 (11.0%) | 873 (22.7%) |
| $1,000 to $1,499 | 715 (27.4%) | 1,331 (34.7%) |
| $1,500 to $1,999 | 345 (13.2%) | 171 (4.4%) |
| $2,000 to $2,499 | 94 (3.6%) | 56 (1.5%) |
| $2,500 to $2,999 | 33 (1.3%) | 9 (0.2%) |
| $3,000 or more | 43 (1.7%) | 41 (1.1%) |
| Total | 2,611 (100.0%) | 3,840 (100.0%) |
Physical Housing Characteristics in Bemidji
Housing Structures in Bemidji
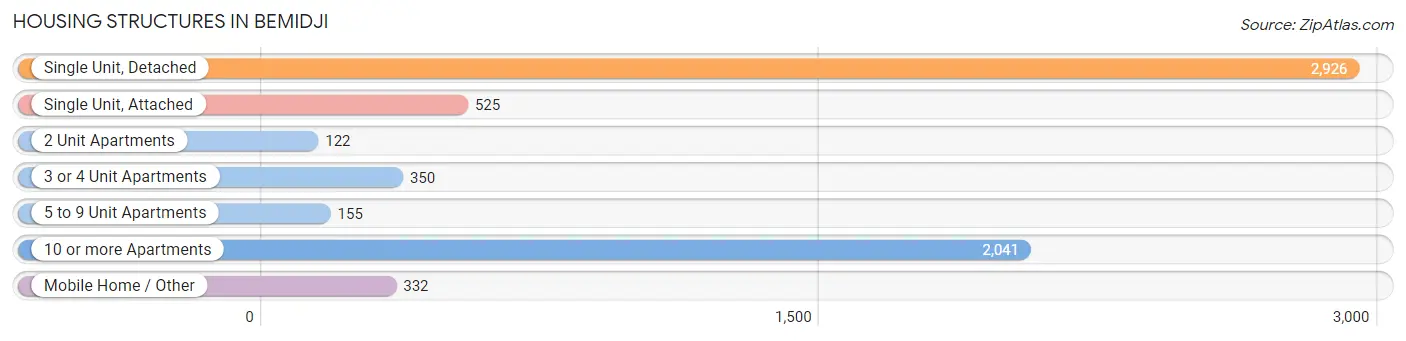
| Structure Type | # Housing Units | % Housing Units |
| Single Unit, Detached | 2,926 | 45.4% |
| Single Unit, Attached | 525 | 8.1% |
| 2 Unit Apartments | 122 | 1.9% |
| 3 or 4 Unit Apartments | 350 | 5.4% |
| 5 to 9 Unit Apartments | 155 | 2.4% |
| 10 or more Apartments | 2,041 | 31.6% |
| Mobile Home / Other | 332 | 5.1% |
| Total | 6,451 | 100.0% |
Housing Structures by Occupancy in Bemidji
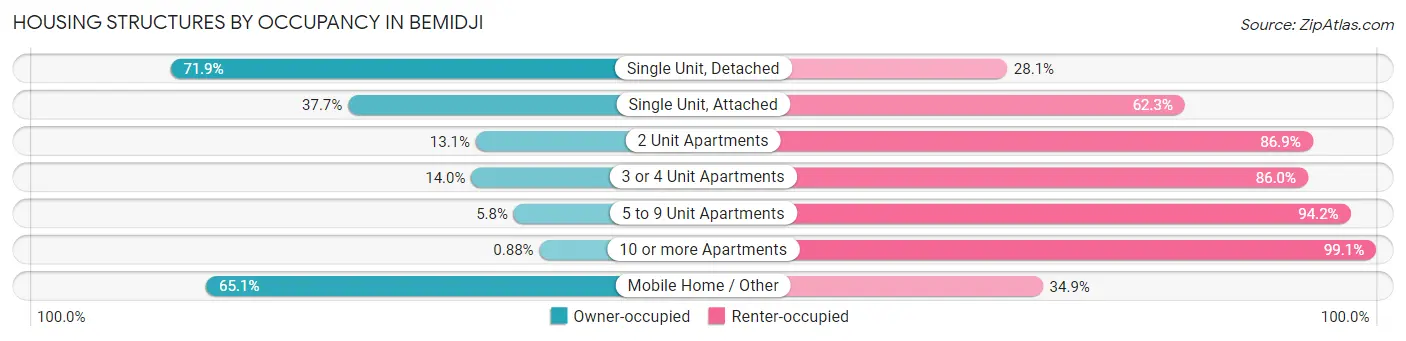
| Structure Type | Owner-occupied | Renter-occupied |
| Single Unit, Detached | 2,105 (71.9%) | 821 (28.1%) |
| Single Unit, Attached | 198 (37.7%) | 327 (62.3%) |
| 2 Unit Apartments | 16 (13.1%) | 106 (86.9%) |
| 3 or 4 Unit Apartments | 49 (14.0%) | 301 (86.0%) |
| 5 to 9 Unit Apartments | 9 (5.8%) | 146 (94.2%) |
| 10 or more Apartments | 18 (0.9%) | 2,023 (99.1%) |
| Mobile Home / Other | 216 (65.1%) | 116 (34.9%) |
| Total | 2,611 (40.5%) | 3,840 (59.5%) |
Housing Structures by Number of Rooms in Bemidji
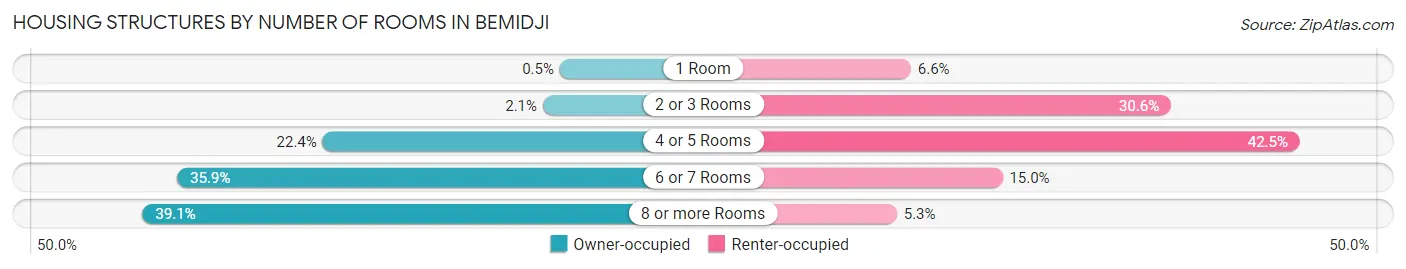
| Number of Rooms | Owner-occupied | Renter-occupied |
| 1 Room | 13 (0.5%) | 252 (6.6%) |
| 2 or 3 Rooms | 54 (2.1%) | 1,176 (30.6%) |
| 4 or 5 Rooms | 586 (22.4%) | 1,633 (42.5%) |
| 6 or 7 Rooms | 937 (35.9%) | 577 (15.0%) |
| 8 or more Rooms | 1,021 (39.1%) | 202 (5.3%) |
| Total | 2,611 (100.0%) | 3,840 (100.0%) |
Housing Structure by Heating Type in Bemidji
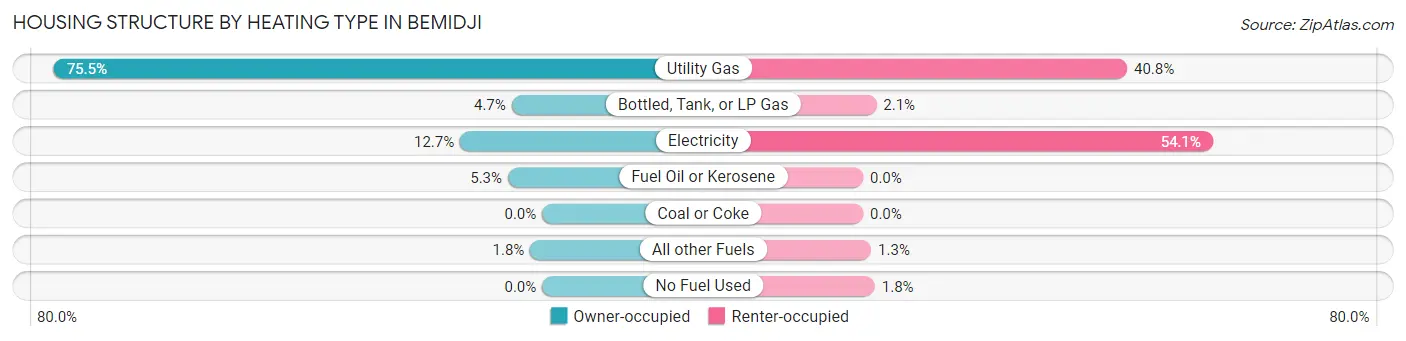
| Heating Type | Owner-occupied | Renter-occupied |
| Utility Gas | 1,971 (75.5%) | 1,567 (40.8%) |
| Bottled, Tank, or LP Gas | 123 (4.7%) | 79 (2.1%) |
| Electricity | 331 (12.7%) | 2,076 (54.1%) |
| Fuel Oil or Kerosene | 138 (5.3%) | 0 (0.0%) |
| Coal or Coke | 0 (0.0%) | 0 (0.0%) |
| All other Fuels | 48 (1.8%) | 48 (1.3%) |
| No Fuel Used | 0 (0.0%) | 70 (1.8%) |
| Total | 2,611 (100.0%) | 3,840 (100.0%) |
Household Vehicle Usage in Bemidji
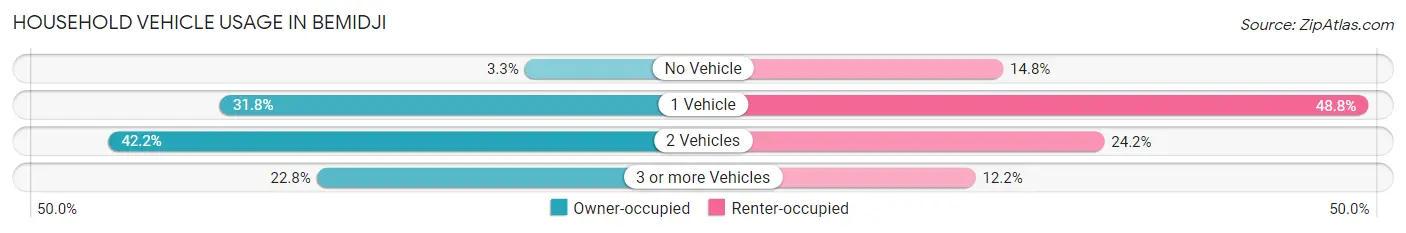
| Vehicles per Household | Owner-occupied | Renter-occupied |
| No Vehicle | 87 (3.3%) | 567 (14.8%) |
| 1 Vehicle | 829 (31.8%) | 1,875 (48.8%) |
| 2 Vehicles | 1,101 (42.2%) | 930 (24.2%) |
| 3 or more Vehicles | 594 (22.8%) | 468 (12.2%) |
| Total | 2,611 (100.0%) | 3,840 (100.0%) |
Real Estate & Mortgages in Bemidji
Real Estate and Mortgage Overview in Bemidji
| Characteristic | Without Mortgage | With Mortgage |
| Housing Units | 1,276 | 1,335 |
| Median Property Value | $182,000 | $174,600 |
| Median Household Income | $55,982 | $179 |
| Monthly Housing Costs | $572 | $37 |
| Real Estate Taxes | $2,321 | $15 |
Property Value by Mortgage Status in Bemidji
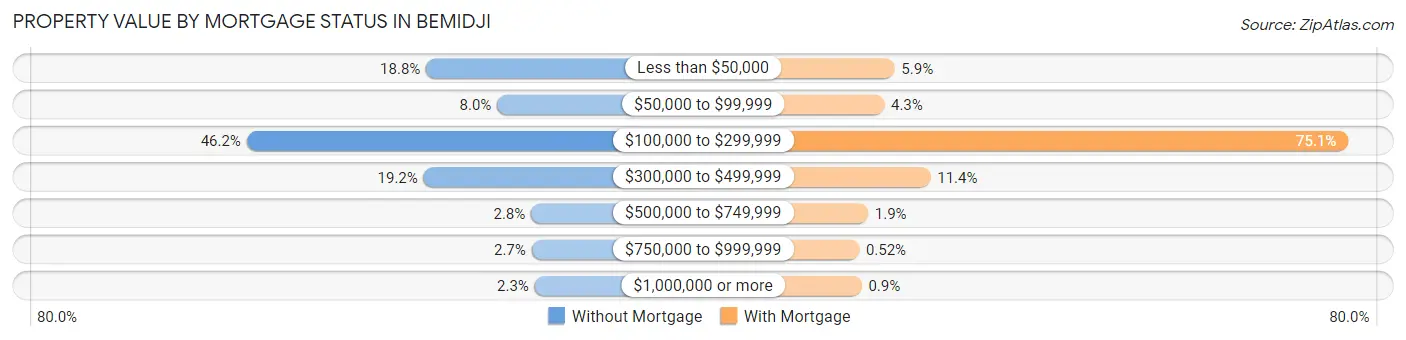
| Property Value | Without Mortgage | With Mortgage |
| Less than $50,000 | 240 (18.8%) | 79 (5.9%) |
| $50,000 to $99,999 | 102 (8.0%) | 58 (4.3%) |
| $100,000 to $299,999 | 589 (46.2%) | 1,002 (75.1%) |
| $300,000 to $499,999 | 245 (19.2%) | 152 (11.4%) |
| $500,000 to $749,999 | 36 (2.8%) | 25 (1.9%) |
| $750,000 to $999,999 | 35 (2.7%) | 7 (0.5%) |
| $1,000,000 or more | 29 (2.3%) | 12 (0.9%) |
| Total | 1,276 (100.0%) | 1,335 (100.0%) |
Household Income by Mortgage Status in Bemidji
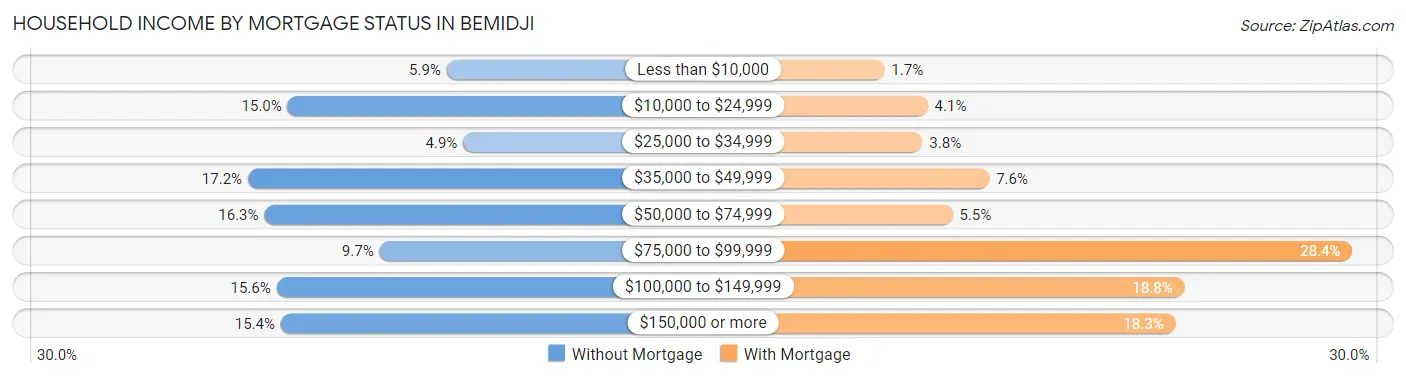
| Household Income | Without Mortgage | With Mortgage |
| Less than $10,000 | 75 (5.9%) | 22 (1.7%) |
| $10,000 to $24,999 | 191 (15.0%) | 55 (4.1%) |
| $25,000 to $34,999 | 63 (4.9%) | 51 (3.8%) |
| $35,000 to $49,999 | 220 (17.2%) | 102 (7.6%) |
| $50,000 to $74,999 | 208 (16.3%) | 74 (5.5%) |
| $75,000 to $99,999 | 124 (9.7%) | 379 (28.4%) |
| $100,000 to $149,999 | 199 (15.6%) | 251 (18.8%) |
| $150,000 or more | 196 (15.4%) | 244 (18.3%) |
| Total | 1,276 (100.0%) | 1,335 (100.0%) |
Property Value to Household Income Ratio in Bemidji
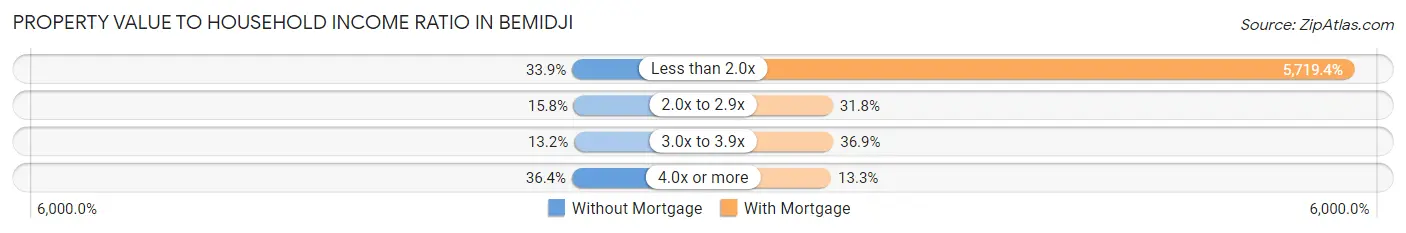
| Value-to-Income Ratio | Without Mortgage | With Mortgage |
| Less than 2.0x | 433 (33.9%) | 76,354 (5,719.4%) |
| 2.0x to 2.9x | 202 (15.8%) | 424 (31.8%) |
| 3.0x to 3.9x | 169 (13.2%) | 493 (36.9%) |
| 4.0x or more | 465 (36.4%) | 178 (13.3%) |
| Total | 1,276 (100.0%) | 1,335 (100.0%) |
Real Estate Taxes by Mortgage Status in Bemidji
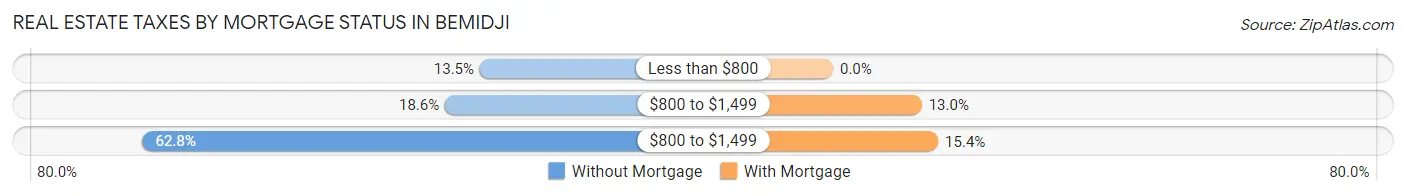
| Property Taxes | Without Mortgage | With Mortgage |
| Less than $800 | 172 (13.5%) | 0 (0.0%) |
| $800 to $1,499 | 237 (18.6%) | 173 (13.0%) |
| $800 to $1,499 | 801 (62.8%) | 205 (15.4%) |
| Total | 1,276 (100.0%) | 1,335 (100.0%) |
Health & Disability in Bemidji
Health Insurance Coverage by Age in Bemidji
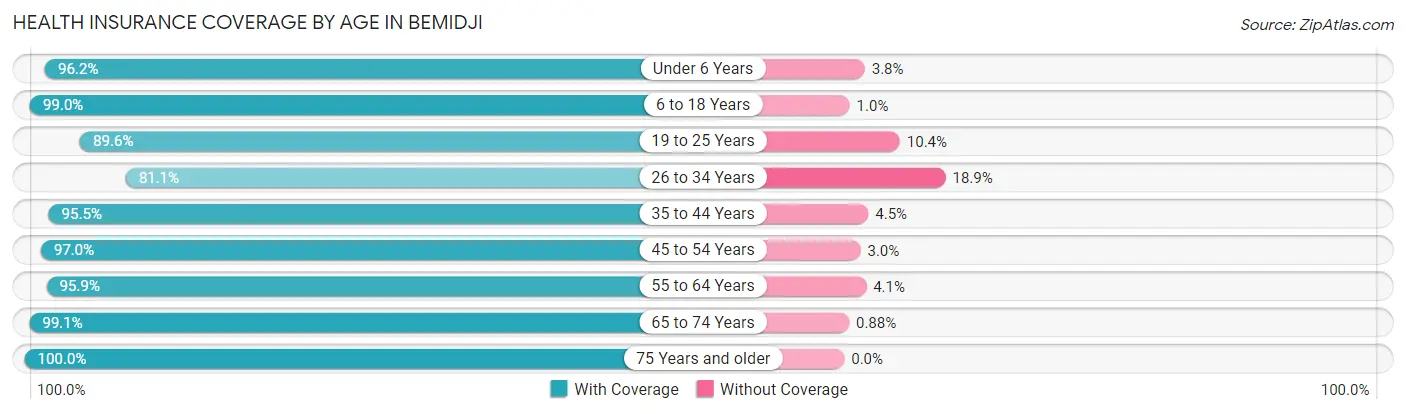
| Age Bracket | With Coverage | Without Coverage |
| Under 6 Years | 1,108 (96.2%) | 44 (3.8%) |
| 6 to 18 Years | 2,278 (99.0%) | 23 (1.0%) |
| 19 to 25 Years | 3,228 (89.6%) | 373 (10.4%) |
| 26 to 34 Years | 1,315 (81.1%) | 306 (18.9%) |
| 35 to 44 Years | 1,724 (95.5%) | 81 (4.5%) |
| 45 to 54 Years | 960 (97.0%) | 30 (3.0%) |
| 55 to 64 Years | 1,290 (95.9%) | 55 (4.1%) |
| 65 to 74 Years | 1,130 (99.1%) | 10 (0.9%) |
| 75 Years and older | 1,062 (100.0%) | 0 (0.0%) |
| Total | 14,095 (93.9%) | 922 (6.1%) |
Health Insurance Coverage by Citizenship Status in Bemidji
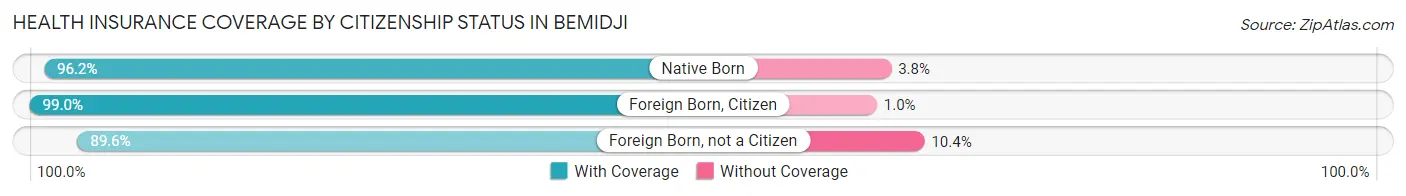
| Citizenship Status | With Coverage | Without Coverage |
| Native Born | 1,108 (96.2%) | 44 (3.8%) |
| Foreign Born, Citizen | 2,278 (99.0%) | 23 (1.0%) |
| Foreign Born, not a Citizen | 3,228 (89.6%) | 373 (10.4%) |
Health Insurance Coverage by Household Income in Bemidji
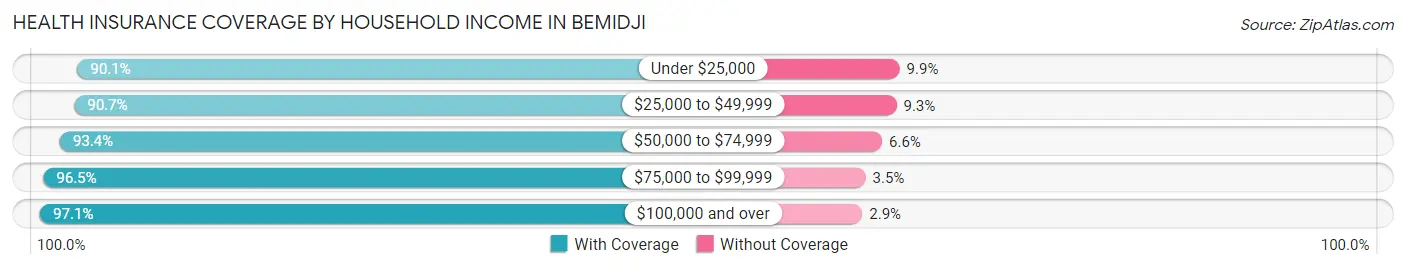
| Household Income | With Coverage | Without Coverage |
| Under $25,000 | 2,413 (90.1%) | 265 (9.9%) |
| $25,000 to $49,999 | 2,578 (90.7%) | 265 (9.3%) |
| $50,000 to $74,999 | 2,686 (93.4%) | 190 (6.6%) |
| $75,000 to $99,999 | 1,643 (96.5%) | 60 (3.5%) |
| $100,000 and over | 3,595 (97.1%) | 108 (2.9%) |
Public vs Private Health Insurance Coverage by Age in Bemidji
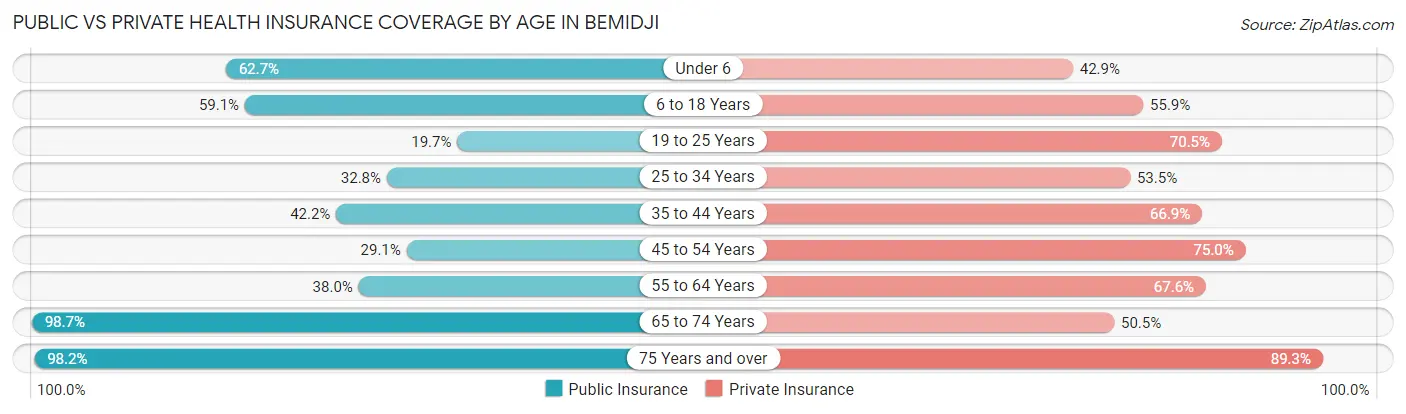
| Age Bracket | Public Insurance | Private Insurance |
| Under 6 | 722 (62.7%) | 494 (42.9%) |
| 6 to 18 Years | 1,360 (59.1%) | 1,287 (55.9%) |
| 19 to 25 Years | 709 (19.7%) | 2,540 (70.5%) |
| 25 to 34 Years | 531 (32.8%) | 867 (53.5%) |
| 35 to 44 Years | 761 (42.2%) | 1,207 (66.9%) |
| 45 to 54 Years | 288 (29.1%) | 742 (75.0%) |
| 55 to 64 Years | 511 (38.0%) | 909 (67.6%) |
| 65 to 74 Years | 1,125 (98.7%) | 576 (50.5%) |
| 75 Years and over | 1,043 (98.2%) | 948 (89.3%) |
| Total | 7,050 (46.9%) | 9,570 (63.7%) |
Disability Status by Sex by Age in Bemidji
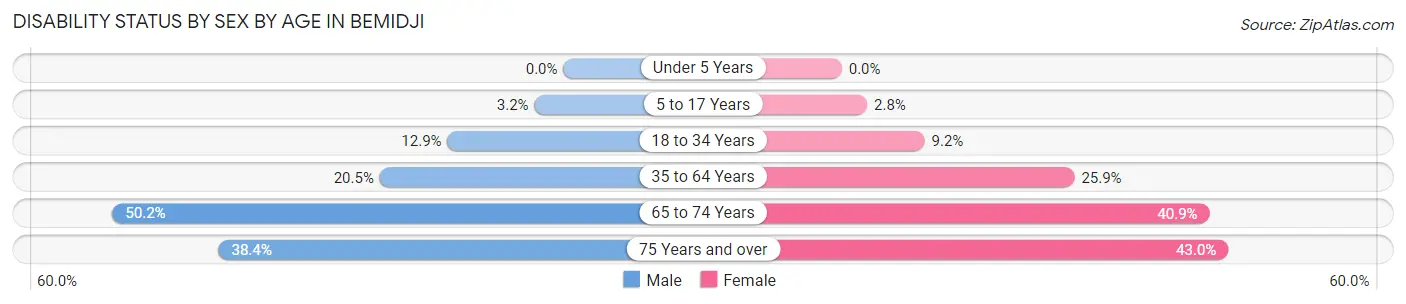
| Age Bracket | Male | Female |
| Under 5 Years | 0 (0.0%) | 0 (0.0%) |
| 5 to 17 Years | 32 (3.2%) | 28 (2.8%) |
| 18 to 34 Years | 370 (12.9%) | 256 (9.2%) |
| 35 to 64 Years | 441 (20.4%) | 514 (25.9%) |
| 65 to 74 Years | 229 (50.2%) | 280 (40.9%) |
| 75 Years and over | 149 (38.4%) | 290 (43.0%) |
Disability Class by Sex by Age in Bemidji
Disability Class: Hearing Difficulty
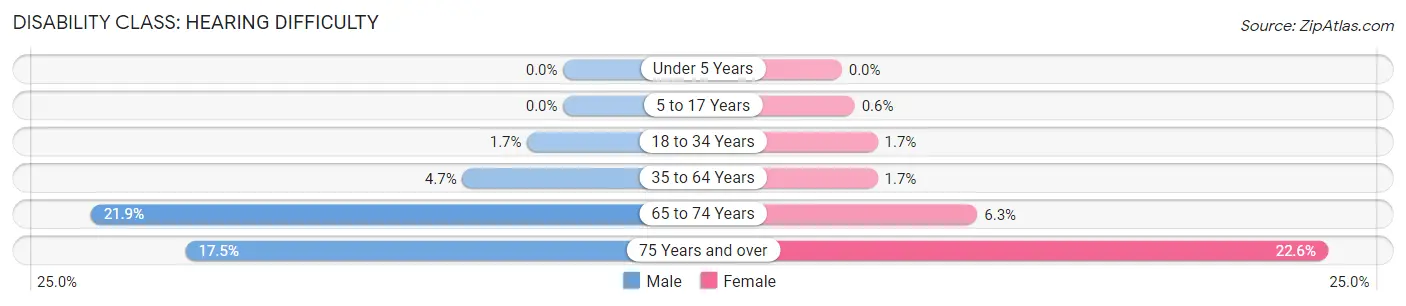
| Age Bracket | Male | Female |
| Under 5 Years | 0 (0.0%) | 0 (0.0%) |
| 5 to 17 Years | 0 (0.0%) | 6 (0.6%) |
| 18 to 34 Years | 48 (1.7%) | 46 (1.7%) |
| 35 to 64 Years | 101 (4.7%) | 33 (1.7%) |
| 65 to 74 Years | 100 (21.9%) | 43 (6.3%) |
| 75 Years and over | 68 (17.5%) | 152 (22.6%) |
Disability Class: Vision Difficulty
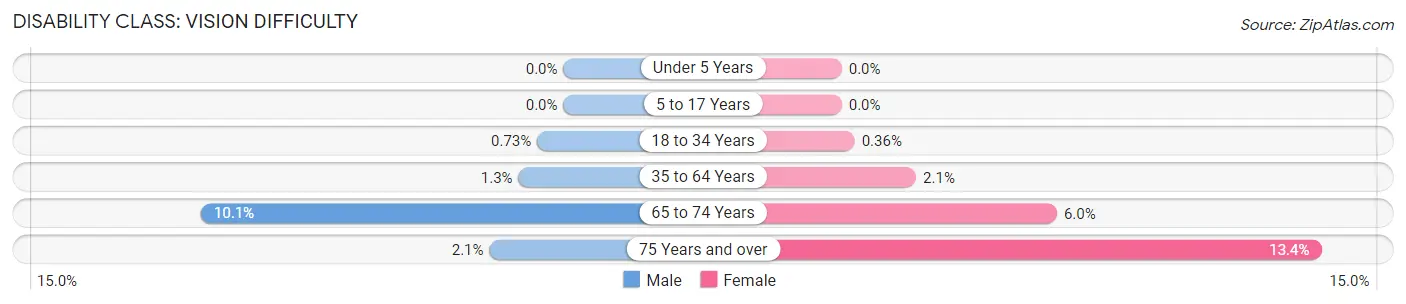
| Age Bracket | Male | Female |
| Under 5 Years | 0 (0.0%) | 0 (0.0%) |
| 5 to 17 Years | 0 (0.0%) | 0 (0.0%) |
| 18 to 34 Years | 21 (0.7%) | 10 (0.4%) |
| 35 to 64 Years | 27 (1.3%) | 41 (2.1%) |
| 65 to 74 Years | 46 (10.1%) | 41 (6.0%) |
| 75 Years and over | 8 (2.1%) | 90 (13.4%) |
Disability Class: Cognitive Difficulty
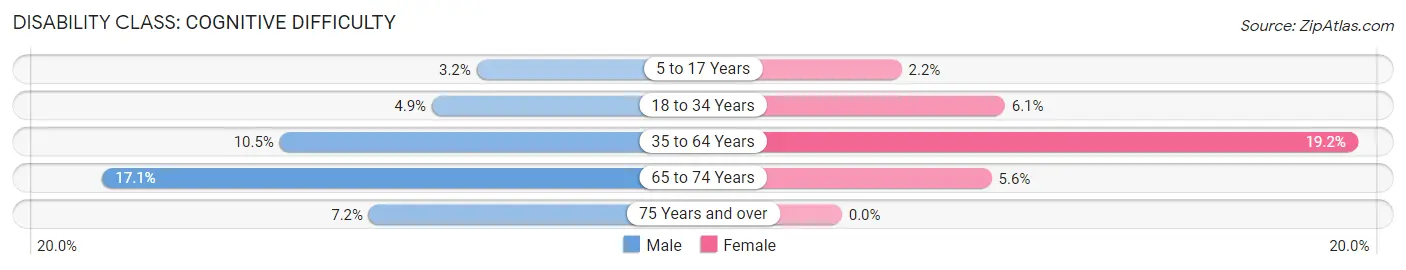
| Age Bracket | Male | Female |
| 5 to 17 Years | 32 (3.2%) | 22 (2.2%) |
| 18 to 34 Years | 140 (4.9%) | 168 (6.0%) |
| 35 to 64 Years | 227 (10.5%) | 380 (19.2%) |
| 65 to 74 Years | 78 (17.1%) | 38 (5.6%) |
| 75 Years and over | 28 (7.2%) | 0 (0.0%) |
Disability Class: Ambulatory Difficulty
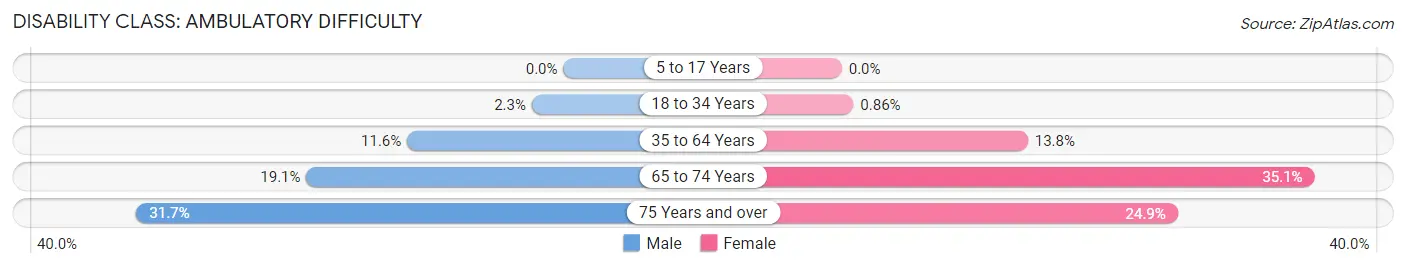
| Age Bracket | Male | Female |
| 5 to 17 Years | 0 (0.0%) | 0 (0.0%) |
| 18 to 34 Years | 67 (2.3%) | 24 (0.9%) |
| 35 to 64 Years | 250 (11.6%) | 274 (13.8%) |
| 65 to 74 Years | 87 (19.1%) | 240 (35.1%) |
| 75 Years and over | 123 (31.7%) | 168 (24.9%) |
Disability Class: Self-Care Difficulty
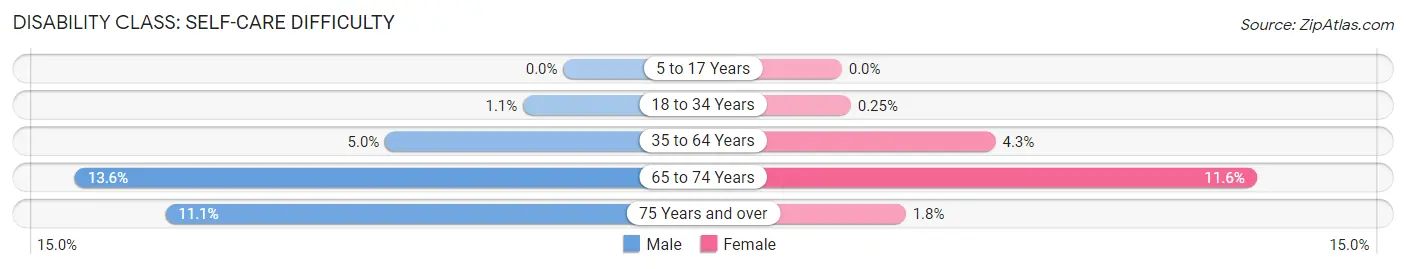
| Age Bracket | Male | Female |
| 5 to 17 Years | 0 (0.0%) | 0 (0.0%) |
| 18 to 34 Years | 32 (1.1%) | 7 (0.3%) |
| 35 to 64 Years | 107 (5.0%) | 85 (4.3%) |
| 65 to 74 Years | 62 (13.6%) | 79 (11.6%) |
| 75 Years and over | 43 (11.1%) | 12 (1.8%) |
Technology Access in Bemidji
Computing Device Access in Bemidji
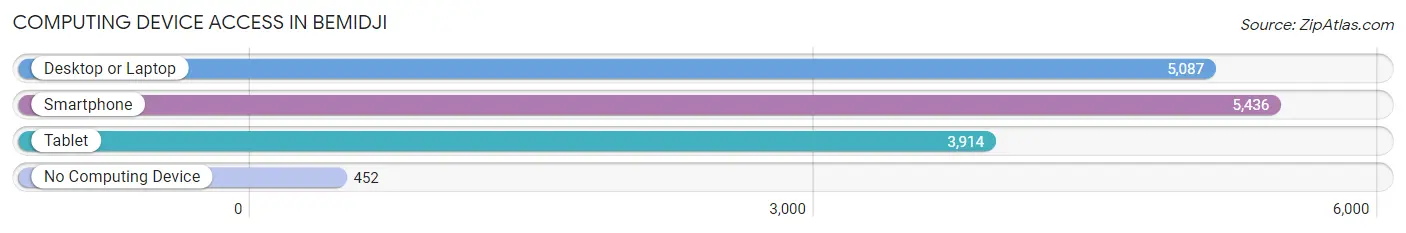
| Device Type | # Households | % Households |
| Desktop or Laptop | 5,087 | 78.9% |
| Smartphone | 5,436 | 84.3% |
| Tablet | 3,914 | 60.7% |
| No Computing Device | 452 | 7.0% |
| Total | 6,451 | 100.0% |
Internet Access in Bemidji
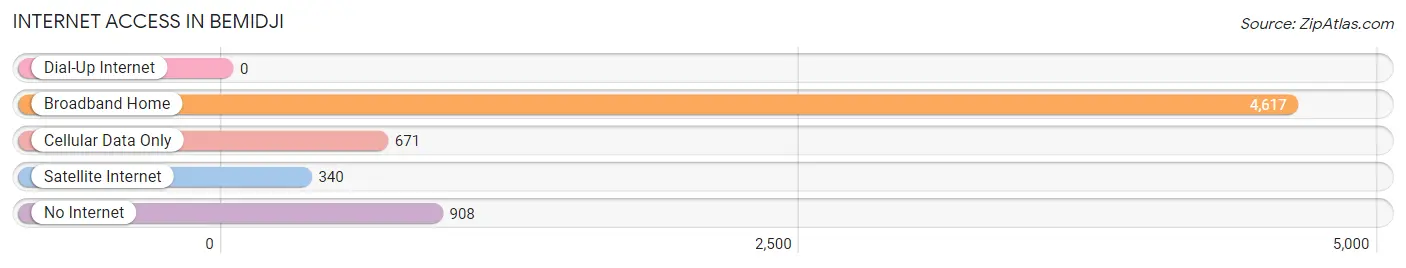
| Internet Type | # Households | % Households |
| Dial-Up Internet | 0 | 0.0% |
| Broadband Home | 4,617 | 71.6% |
| Cellular Data Only | 671 | 10.4% |
| Satellite Internet | 340 | 5.3% |
| No Internet | 908 | 14.1% |
| Total | 6,451 | 100.0% |
Bemidji Summary
Bemidji, Minnesota is a city located in Beltrami County in the north-central part of the state. It is the county seat and the largest city in the county. The city is situated on the south shore of Lake Bemidji, and is surrounded by forests and lakes. The city is known for its natural beauty, and is a popular destination for outdoor recreation.
History
The area around Bemidji has been inhabited for thousands of years by the Ojibwe people. The first European settlers arrived in the area in the late 19th century, and the city was officially incorporated in 1896. The city was named after Chief Bemidji, an Ojibwe leader who lived in the area.
The city grew rapidly in the early 20th century, and by the 1950s it had become a major regional center for commerce and industry. The city has continued to grow and develop since then, and today it is a vibrant and diverse community.
Geography
Bemidji is located in the north-central part of Minnesota, in Beltrami County. It is situated on the south shore of Lake Bemidji, and is surrounded by forests and lakes. The city is located at the intersection of U.S. Highways 2 and 71, and is about 150 miles north of Minneapolis.
The city has a total area of 11.2 square miles, of which 10.7 square miles is land and 0.5 square miles is water. The terrain is mostly flat, with some rolling hills in the northern part of the city. The city is located in a transition zone between the boreal forest and the deciduous forest, and is home to a variety of wildlife.
Economy
Bemidji is a regional center for commerce and industry. The city is home to a variety of businesses, including manufacturing, retail, healthcare, and tourism. The city is also home to several educational institutions, including Bemidji State University and Northwest Technical College.
The city's largest employers include Bemidji State University, Sanford Health, and the Bemidji School District. The city is also home to several major retail stores, including Walmart, Target, and Best Buy.
Demographics
As of the 2010 census, the population of Bemidji was 13,431. The racial makeup of the city was 90.2% White, 2.3% African American, 0.7% Native American, 2.2% Asian, 0.1% Pacific Islander, 2.3% from other races, and 2.4% from two or more races. Hispanic or Latino of any race were 4.3% of the population.
The median household income in Bemidji was $41,945, and the median family income was $50,945. The per capita income was $20,945. About 11.2% of families and 15.3% of the population were below the poverty line, including 22.2% of those under age 18 and 8.2% of those age 65 or over.
Common Questions
What is Per Capita Income in Bemidji?
Per Capita income in Bemidji is $28,990.
What is the Median Family Income in Bemidji?
Median Family Income in Bemidji is $74,288.
What is the Median Household income in Bemidji?
Median Household Income in Bemidji is $49,799.
What is Income or Wage Gap in Bemidji?
Income or Wage Gap in Bemidji is 20.7%.
Women in Bemidji earn 79.3 cents for every dollar earned by a man.
What is Family Income Deficit in Bemidji?
Family Income Deficit in Bemidji is $11,700.
Families that are below poverty line in Bemidji earn $11,700 less on average than the poverty threshold level.
What is Inequality or Gini Index in Bemidji?
Inequality or Gini Index in Bemidji is 0.46.
What is the Total Population of Bemidji?
Total Population of Bemidji is 15,441.
What is the Total Male Population of Bemidji?
Total Male Population of Bemidji is 7,498.
What is the Total Female Population of Bemidji?
Total Female Population of Bemidji is 7,943.
What is the Ratio of Males per 100 Females in Bemidji?
There are 94.40 Males per 100 Females in Bemidji.
What is the Ratio of Females per 100 Males in Bemidji?
There are 105.93 Females per 100 Males in Bemidji.
What is the Median Population Age in Bemidji?
Median Population Age in Bemidji is 29.1 Years.
What is the Average Family Size in Bemidji
Average Family Size in Bemidji is 3.0 People.
What is the Average Household Size in Bemidji
Average Household Size in Bemidji is 2.1 People.
How Large is the Labor Force in Bemidji?
There are 8,054 People in the Labor Forcein in Bemidji.
What is the Percentage of People in the Labor Force in Bemidji?
63.3% of People are in the Labor Force in Bemidji.
What is the Unemployment Rate in Bemidji?
Unemployment Rate in Bemidji is 4.2%.