Marquette, MI Map & Demographics
Marquette Map
Marquette Overview
$30,343
PER CAPITA INCOME
$82,083
AVG FAMILY INCOME
$51,599
AVG HOUSEHOLD INCOME
36.1%
WAGE / INCOME GAP [ % ]
63.9¢/ $1
WAGE / INCOME GAP [ $ ]
0.47
INEQUALITY / GINI INDEX
20,673
TOTAL POPULATION
10,617
MALE POPULATION
10,056
FEMALE POPULATION
105.58
MALES / 100 FEMALES
94.72
FEMALES / 100 MALES
30.2
MEDIAN AGE
2.6
AVG FAMILY SIZE
2.1
AVG HOUSEHOLD SIZE
12,003
LABOR FORCE [ PEOPLE ]
64.0%
PERCENT IN LABOR FORCE
5.9%
UNEMPLOYMENT RATE
Marquette Zip Codes
Marquette Area Codes
Income in Marquette
Income Overview in Marquette
Per Capita Income in Marquette is $30,343, while median incomes of families and households are $82,083 and $51,599 respectively.
| Characteristic | Number | Measure |
| Per Capita Income | 20,673 | $30,343 |
| Median Family Income | 3,862 | $82,083 |
| Mean Family Income | 3,862 | $99,281 |
| Median Household Income | 8,420 | $51,599 |
| Mean Household Income | 8,420 | $70,761 |
| Income Deficit | 3,862 | $0 |
| Wage / Income Gap (%) | 20,673 | 36.05% |
| Wage / Income Gap ($) | 20,673 | 63.95¢ per $1 |
| Gini / Inequality Index | 20,673 | 0.47 |
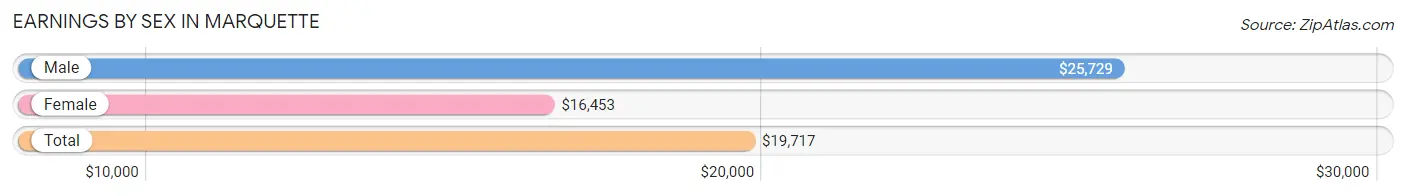
Earnings by Sex in Marquette
Average Earnings in Marquette are $19,717, $25,729 for men and $16,453 for women, a difference of 36.0%.
| Sex | Number | Average Earnings |
| Male | 6,670 (49.7%) | $25,729 |
| Female | 6,751 (50.3%) | $16,453 |
| Total | 13,421 (100.0%) | $19,717 |
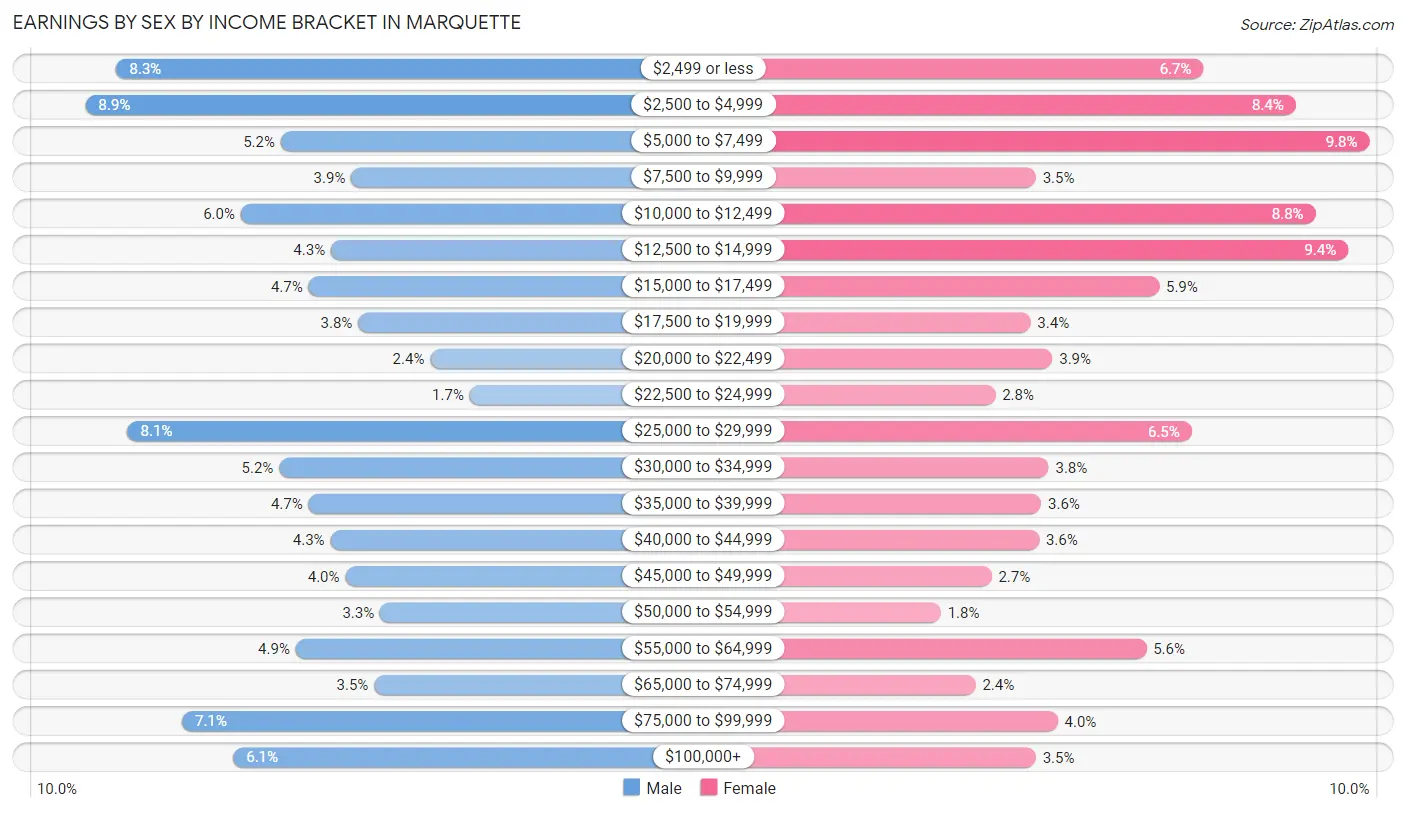
Earnings by Sex by Income Bracket in Marquette
The most common earnings brackets in Marquette are $2,500 to $4,999 for men (591 | 8.9%) and $5,000 to $7,499 for women (661 | 9.8%).
| Income | Male | Female |
| $2,499 or less | 552 (8.3%) | 451 (6.7%) |
| $2,500 to $4,999 | 591 (8.9%) | 568 (8.4%) |
| $5,000 to $7,499 | 347 (5.2%) | 661 (9.8%) |
| $7,500 to $9,999 | 259 (3.9%) | 239 (3.5%) |
| $10,000 to $12,499 | 397 (5.9%) | 593 (8.8%) |
| $12,500 to $14,999 | 284 (4.3%) | 634 (9.4%) |
| $15,000 to $17,499 | 312 (4.7%) | 395 (5.9%) |
| $17,500 to $19,999 | 250 (3.7%) | 232 (3.4%) |
| $20,000 to $22,499 | 160 (2.4%) | 260 (3.8%) |
| $22,500 to $24,999 | 111 (1.7%) | 188 (2.8%) |
| $25,000 to $29,999 | 538 (8.1%) | 436 (6.5%) |
| $30,000 to $34,999 | 349 (5.2%) | 255 (3.8%) |
| $35,000 to $39,999 | 312 (4.7%) | 246 (3.6%) |
| $40,000 to $44,999 | 285 (4.3%) | 243 (3.6%) |
| $45,000 to $49,999 | 266 (4.0%) | 183 (2.7%) |
| $50,000 to $54,999 | 223 (3.3%) | 119 (1.8%) |
| $55,000 to $64,999 | 328 (4.9%) | 379 (5.6%) |
| $65,000 to $74,999 | 230 (3.5%) | 163 (2.4%) |
| $75,000 to $99,999 | 470 (7.0%) | 267 (4.0%) |
| $100,000+ | 406 (6.1%) | 239 (3.5%) |
| Total | 6,670 (100.0%) | 6,751 (100.0%) |
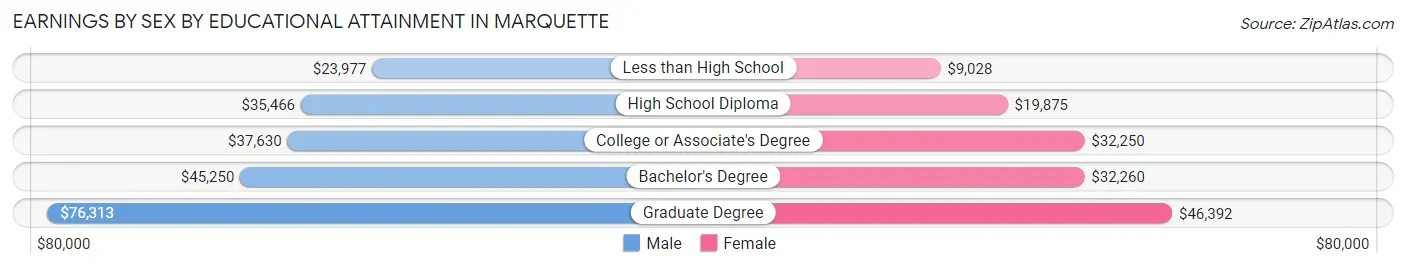
Earnings by Sex by Educational Attainment in Marquette
Average earnings in Marquette are $40,168 for men and $33,944 for women, a difference of 15.5%. Men with an educational attainment of graduate degree enjoy the highest average annual earnings of $76,313, while those with less than high school education earn the least with $23,977. Women with an educational attainment of graduate degree earn the most with the average annual earnings of $46,392, while those with less than high school education have the smallest earnings of $9,028.
| Educational Attainment | Male Income | Female Income |
| Less than High School | $23,977 | $9,028 |
| High School Diploma | $35,466 | $19,875 |
| College or Associate's Degree | $37,630 | $32,250 |
| Bachelor's Degree | $45,250 | $32,260 |
| Graduate Degree | $76,313 | $46,392 |
| Total | $40,168 | $33,944 |
Family Income in Marquette
Family Income Brackets in Marquette
According to the Marquette family income data, there are 854 families falling into the $75,000 to $99,999 income range, which is the most common income bracket and makes up 22.1% of all families. Conversely, the $10,000 to $14,999 income bracket is the least frequent group with only 97 families (2.5%) belonging to this category.
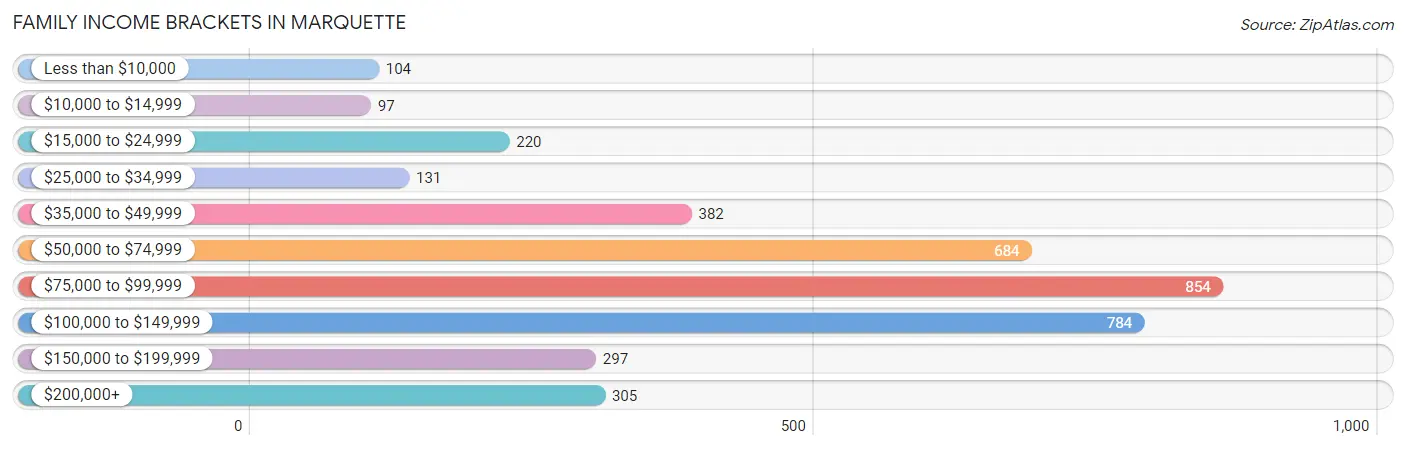
| Income Bracket | # Families | % Families |
| Less than $10,000 | 104 | 2.7% |
| $10,000 to $14,999 | 97 | 2.5% |
| $15,000 to $24,999 | 220 | 5.7% |
| $25,000 to $34,999 | 131 | 3.4% |
| $35,000 to $49,999 | 382 | 9.9% |
| $50,000 to $74,999 | 684 | 17.7% |
| $75,000 to $99,999 | 854 | 22.1% |
| $100,000 to $149,999 | 784 | 20.3% |
| $150,000 to $199,999 | 297 | 7.7% |
| $200,000+ | 305 | 7.9% |
Family Income by Famaliy Size in Marquette
4-person families (434 | 11.2%) account for the highest median family income in Marquette with $125,208 per family, while 2-person families (2,428 | 62.9%) have the highest median income of $38,511 per family member.
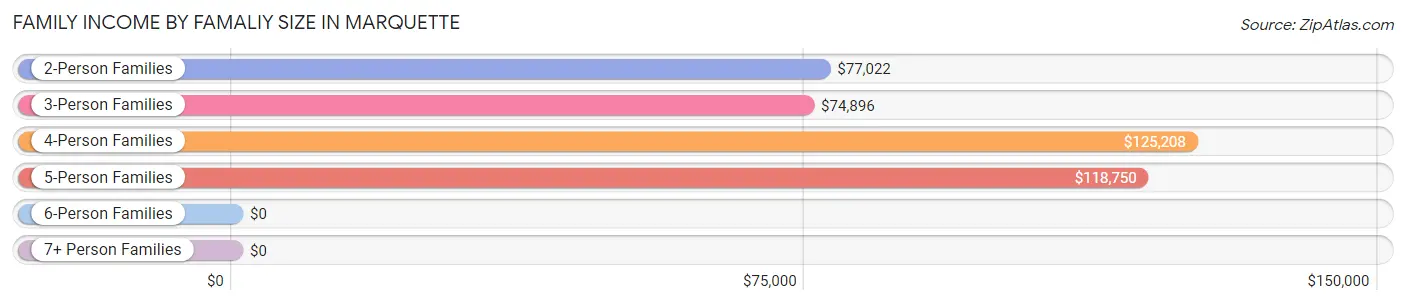
| Income Bracket | # Families | Median Income |
| 2-Person Families | 2,428 (62.9%) | $77,022 |
| 3-Person Families | 857 (22.2%) | $74,896 |
| 4-Person Families | 434 (11.2%) | $125,208 |
| 5-Person Families | 108 (2.8%) | $118,750 |
| 6-Person Families | 17 (0.4%) | $0 |
| 7+ Person Families | 18 (0.5%) | $0 |
| Total | 3,862 (100.0%) | $82,083 |
Family Income by Number of Earners in Marquette
The median family income in Marquette is $82,083, with families comprising 3+ earners (327) having the highest median family income of $118,063, while families with 1 earner (937) have the lowest median family income of $53,188, accounting for 8.5% and 24.3% of families, respectively.
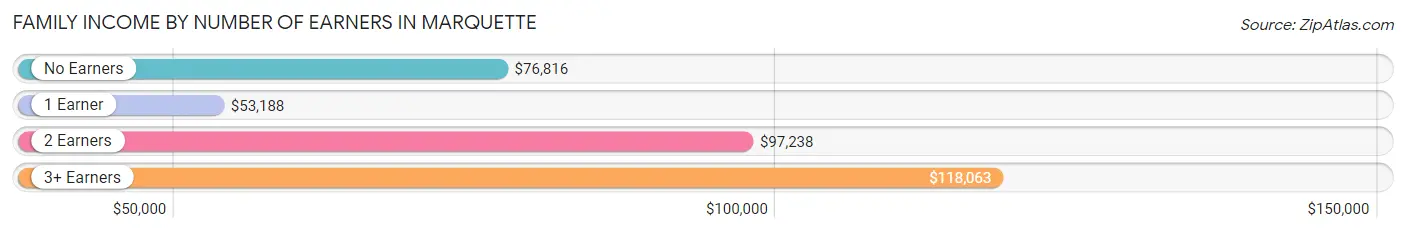
| Number of Earners | # Families | Median Income |
| No Earners | 771 (20.0%) | $76,816 |
| 1 Earner | 937 (24.3%) | $53,188 |
| 2 Earners | 1,827 (47.3%) | $97,238 |
| 3+ Earners | 327 (8.5%) | $118,063 |
| Total | 3,862 (100.0%) | $82,083 |
Household Income in Marquette
Household Income Brackets in Marquette
With 1,423 households falling in the category, the $50,000 to $74,999 income range is the most frequent in Marquette, accounting for 16.9% of all households. In contrast, only 370 households (4.4%) fall into the $150,000 to $199,999 income bracket, making it the least populous group.
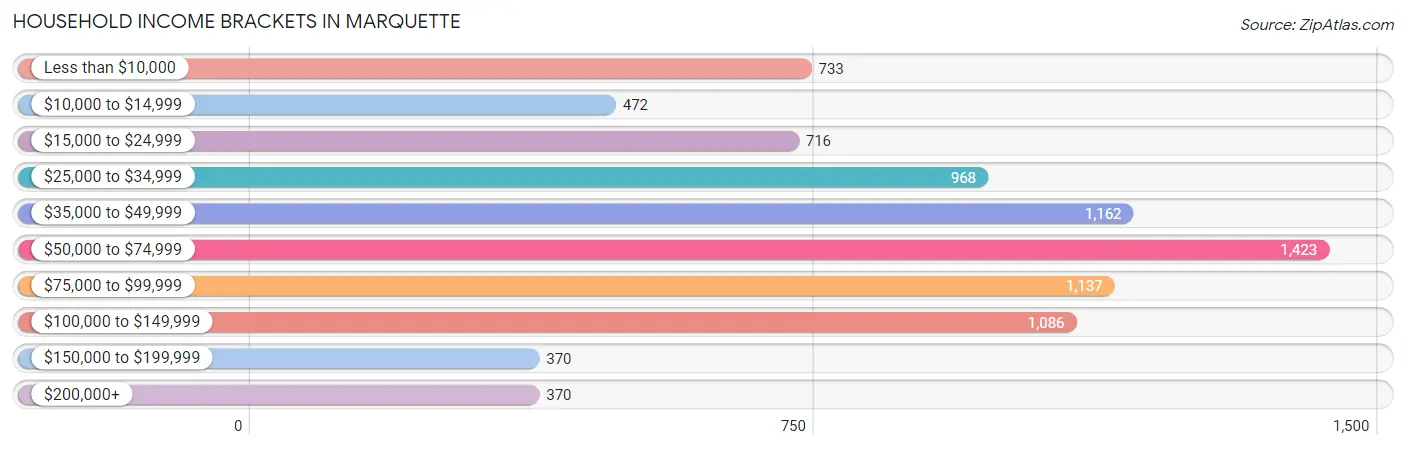
| Income Bracket | # Households | % Households |
| Less than $10,000 | 733 | 8.7% |
| $10,000 to $14,999 | 472 | 5.6% |
| $15,000 to $24,999 | 716 | 8.5% |
| $25,000 to $34,999 | 968 | 11.5% |
| $35,000 to $49,999 | 1,162 | 13.8% |
| $50,000 to $74,999 | 1,423 | 16.9% |
| $75,000 to $99,999 | 1,137 | 13.5% |
| $100,000 to $149,999 | 1,086 | 12.9% |
| $150,000 to $199,999 | 370 | 4.4% |
| $200,000+ | 370 | 4.4% |
Household Income by Householder Age in Marquette
The median household income in Marquette is $51,599, with the highest median household income of $68,825 found in the 45 to 64 years age bracket for the primary householder. A total of 2,159 households (25.6%) fall into this category. Meanwhile, the 15 to 24 years age bracket for the primary householder has the lowest median household income of $28,544, with 1,833 households (21.8%) in this group.
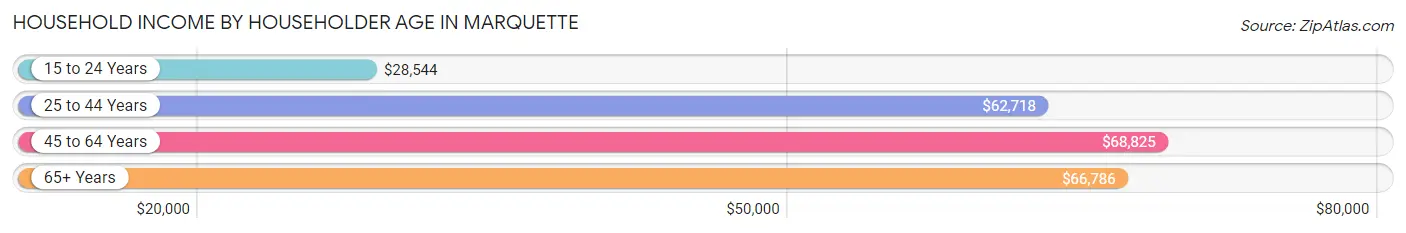
| Income Bracket | # Households | Median Income |
| 15 to 24 Years | 1,833 (21.8%) | $28,544 |
| 25 to 44 Years | 2,366 (28.1%) | $62,718 |
| 45 to 64 Years | 2,159 (25.6%) | $68,825 |
| 65+ Years | 2,062 (24.5%) | $66,786 |
| Total | 8,420 (100.0%) | $51,599 |
Poverty in Marquette
Income Below Poverty by Sex and Age in Marquette
With 20.4% poverty level for males and 25.6% for females among the residents of Marquette, 18 to 24 year old males and 18 to 24 year old females are the most vulnerable to poverty, with 980 males (46.9%) and 1,445 females (56.2%) in their respective age groups living below the poverty level.
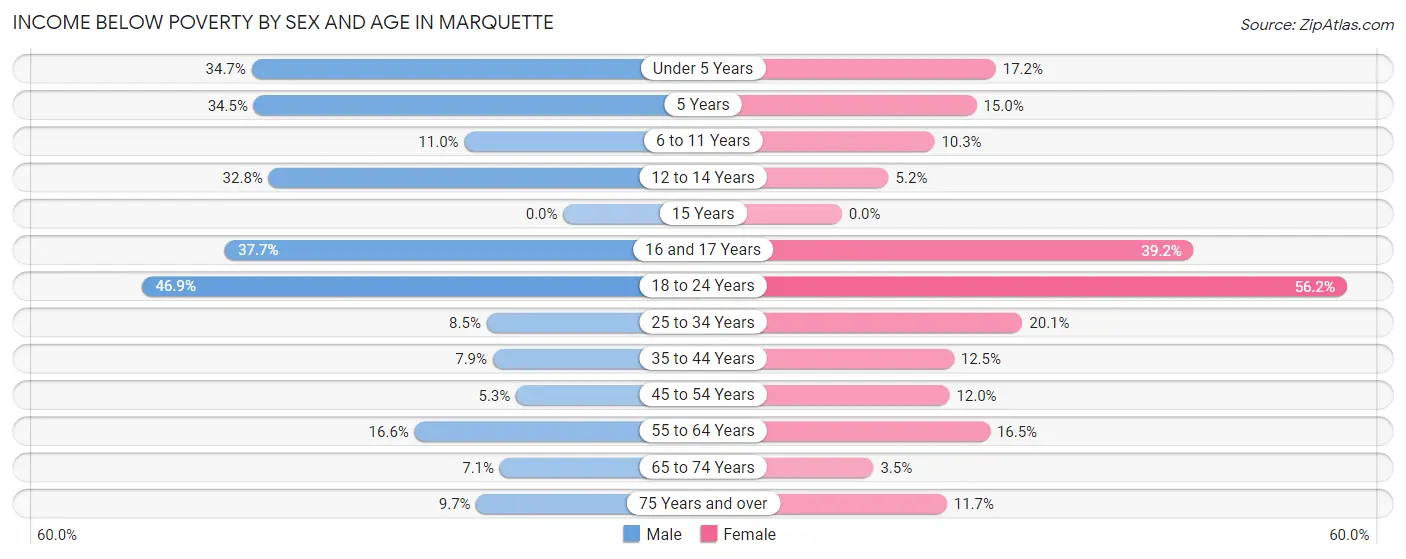
| Age Bracket | Male | Female |
| Under 5 Years | 150 (34.7%) | 41 (17.2%) |
| 5 Years | 20 (34.5%) | 9 (15.0%) |
| 6 to 11 Years | 28 (11.0%) | 32 (10.3%) |
| 12 to 14 Years | 43 (32.8%) | 12 (5.2%) |
| 15 Years | 0 (0.0%) | 0 (0.0%) |
| 16 and 17 Years | 29 (37.7%) | 76 (39.2%) |
| 18 to 24 Years | 980 (46.9%) | 1,445 (56.2%) |
| 25 to 34 Years | 117 (8.5%) | 250 (20.1%) |
| 35 to 44 Years | 65 (7.9%) | 97 (12.5%) |
| 45 to 54 Years | 53 (5.3%) | 112 (12.0%) |
| 55 to 64 Years | 158 (16.6%) | 147 (16.5%) |
| 65 to 74 Years | 52 (7.1%) | 34 (3.5%) |
| 75 Years and over | 54 (9.7%) | 79 (11.7%) |
| Total | 1,749 (20.4%) | 2,334 (25.6%) |
Income Above Poverty by Sex and Age in Marquette
According to the poverty statistics in Marquette, males aged 15 years and females aged 15 years are the age groups that are most secure financially, with 100.0% of males and 100.0% of females in these age groups living above the poverty line.
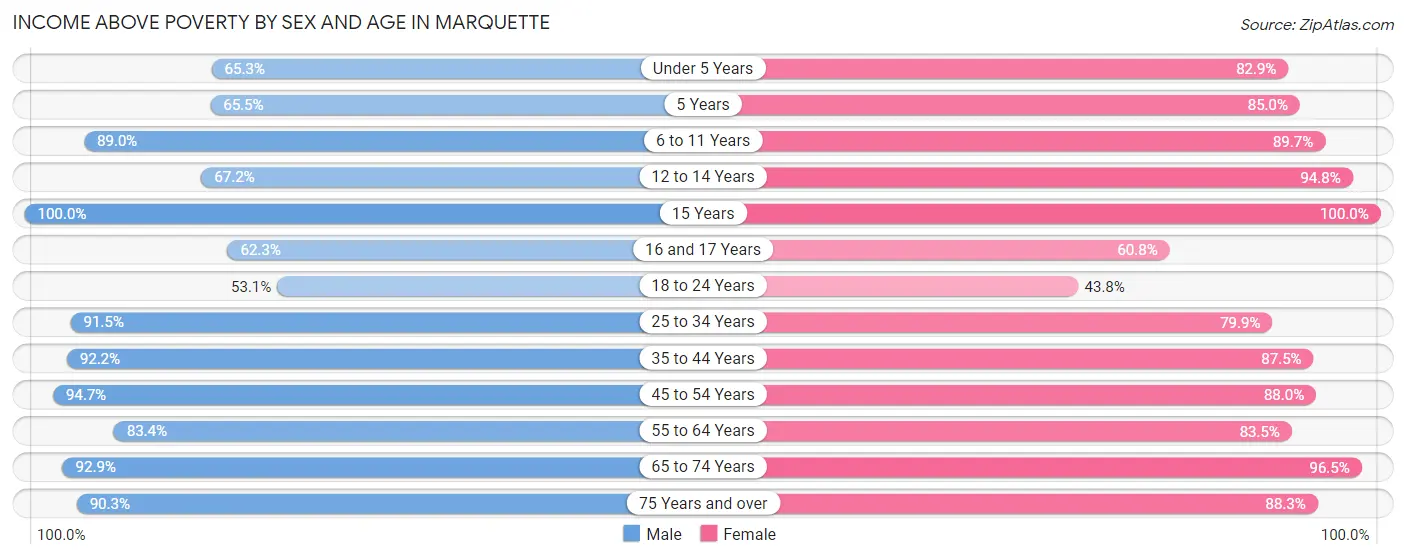
| Age Bracket | Male | Female |
| Under 5 Years | 282 (65.3%) | 198 (82.9%) |
| 5 Years | 38 (65.5%) | 51 (85.0%) |
| 6 to 11 Years | 226 (89.0%) | 278 (89.7%) |
| 12 to 14 Years | 88 (67.2%) | 218 (94.8%) |
| 15 Years | 80 (100.0%) | 46 (100.0%) |
| 16 and 17 Years | 48 (62.3%) | 118 (60.8%) |
| 18 to 24 Years | 1,111 (53.1%) | 1,125 (43.8%) |
| 25 to 34 Years | 1,254 (91.5%) | 993 (79.9%) |
| 35 to 44 Years | 763 (92.1%) | 681 (87.5%) |
| 45 to 54 Years | 955 (94.7%) | 822 (88.0%) |
| 55 to 64 Years | 796 (83.4%) | 744 (83.5%) |
| 65 to 74 Years | 684 (92.9%) | 930 (96.5%) |
| 75 Years and over | 504 (90.3%) | 597 (88.3%) |
| Total | 6,829 (79.6%) | 6,801 (74.5%) |
Income Below Poverty Among Married-Couple Families in Marquette
The poverty statistics for married-couple families in Marquette show that 2.5% or 72 of the total 2,825 families live below the poverty line. Families with 1 or 2 children have the highest poverty rate of 4.0%, comprising of 29 families. On the other hand, families with 3 or 4 children have the lowest poverty rate of 0.0%, which includes 0 families.
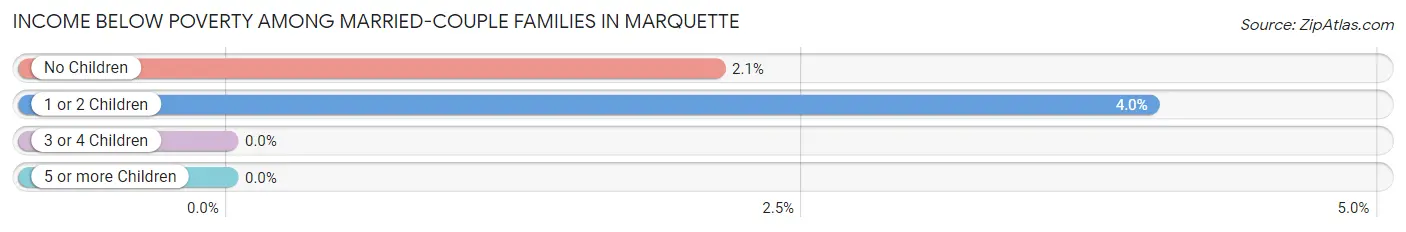
| Children | Above Poverty | Below Poverty |
| No Children | 1,985 (97.9%) | 43 (2.1%) |
| 1 or 2 Children | 694 (96.0%) | 29 (4.0%) |
| 3 or 4 Children | 74 (100.0%) | 0 (0.0%) |
| 5 or more Children | 0 (0.0%) | 0 (0.0%) |
| Total | 2,753 (97.5%) | 72 (2.5%) |
Income Below Poverty Among Single-Parent Households in Marquette
According to the poverty data in Marquette, 11.8% or 54 single-father households and 46.2% or 268 single-mother households are living below the poverty line. Among single-father households, those with 1 or 2 children have the highest poverty rate, with 54 households (26.3%) experiencing poverty. Likewise, among single-mother households, those with 1 or 2 children have the highest poverty rate, with 233 households (69.6%) falling below the poverty line.
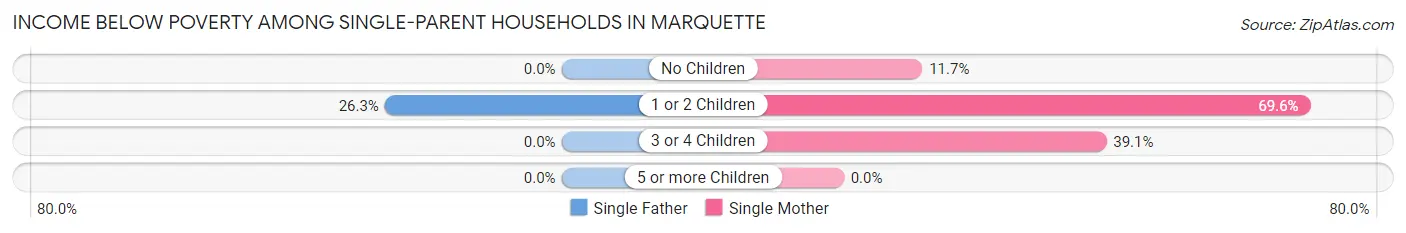
| Children | Single Father | Single Mother |
| No Children | 0 (0.0%) | 26 (11.7%) |
| 1 or 2 Children | 54 (26.3%) | 233 (69.6%) |
| 3 or 4 Children | 0 (0.0%) | 9 (39.1%) |
| 5 or more Children | 0 (0.0%) | 0 (0.0%) |
| Total | 54 (11.8%) | 268 (46.2%) |
Income Below Poverty Among Married-Couple vs Single-Parent Households in Marquette
The poverty data for Marquette shows that 72 of the married-couple family households (2.5%) and 322 of the single-parent households (31.0%) are living below the poverty level. Within the married-couple family households, those with 1 or 2 children have the highest poverty rate, with 29 households (4.0%) falling below the poverty line. Among the single-parent households, those with 1 or 2 children have the highest poverty rate, with 287 household (53.1%) living below poverty.
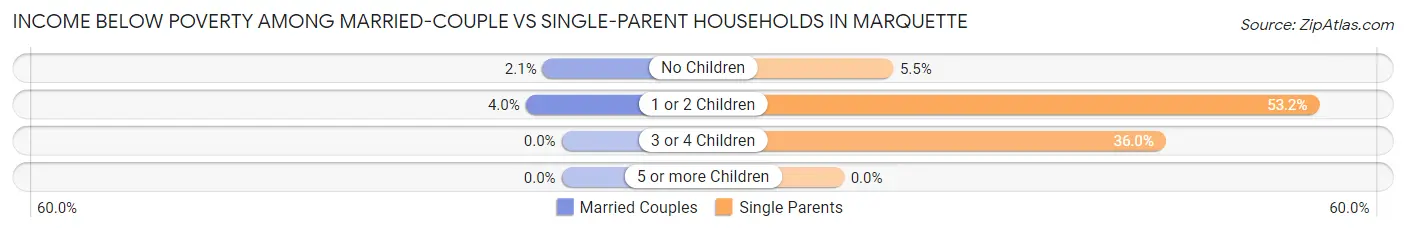
| Children | Married-Couple Families | Single-Parent Households |
| No Children | 43 (2.1%) | 26 (5.5%) |
| 1 or 2 Children | 29 (4.0%) | 287 (53.1%) |
| 3 or 4 Children | 0 (0.0%) | 9 (36.0%) |
| 5 or more Children | 0 (0.0%) | 0 (0.0%) |
| Total | 72 (2.5%) | 322 (31.0%) |
Race in Marquette
The most populous races in Marquette are White / Caucasian (18,602 | 90.0%), Two or more Races (1,049 | 5.1%), and Black / African American (688 | 3.3%).
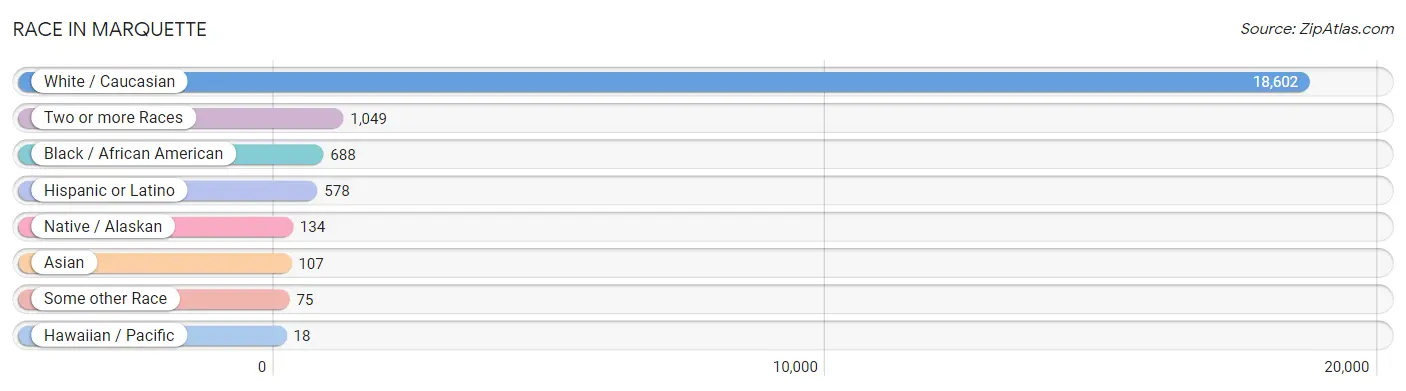
| Race | # Population | % Population |
| Asian | 107 | 0.5% |
| Black / African American | 688 | 3.3% |
| Hawaiian / Pacific | 18 | 0.1% |
| Hispanic or Latino | 578 | 2.8% |
| Native / Alaskan | 134 | 0.6% |
| White / Caucasian | 18,602 | 90.0% |
| Two or more Races | 1,049 | 5.1% |
| Some other Race | 75 | 0.4% |
| Total | 20,673 | 100.0% |
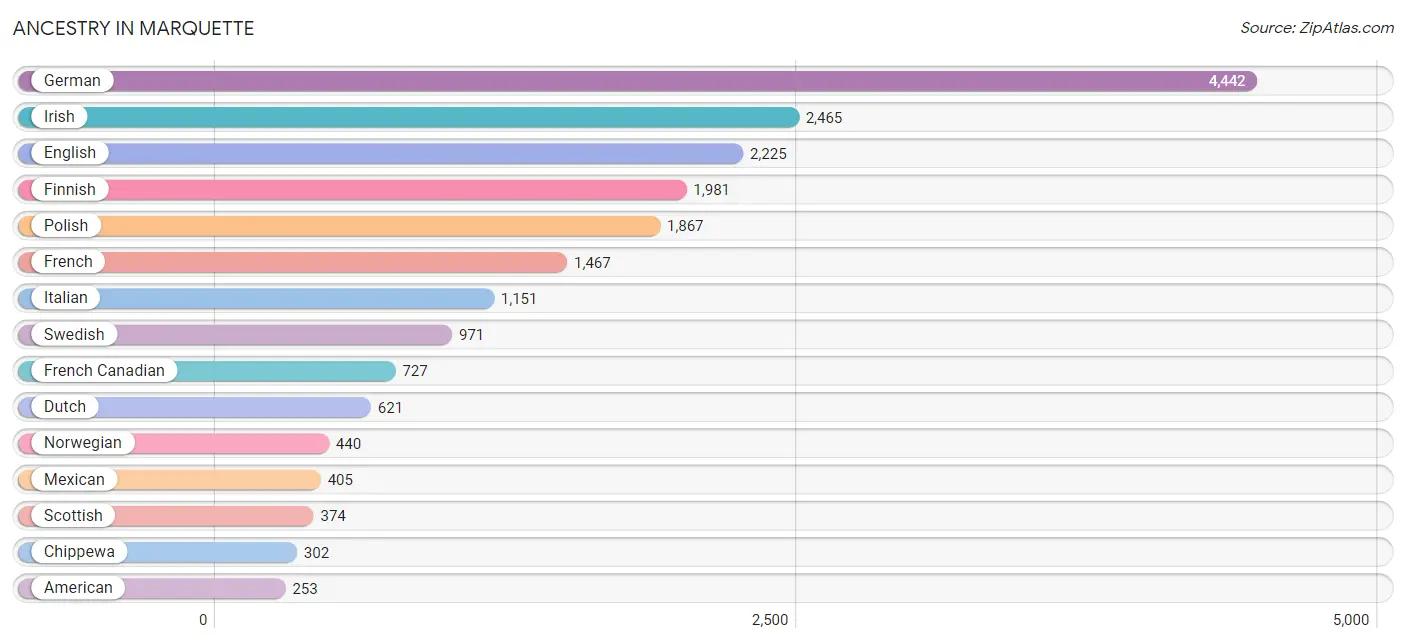
Ancestry in Marquette
The most populous ancestries reported in Marquette are German (4,442 | 21.5%), Irish (2,465 | 11.9%), English (2,225 | 10.8%), Finnish (1,981 | 9.6%), and Polish (1,867 | 9.0%), together accounting for 62.8% of all Marquette residents.
| Ancestry | # Population | % Population |
| African | 25 | 0.1% |
| American | 253 | 1.2% |
| Apache | 26 | 0.1% |
| Arab | 50 | 0.2% |
| Argentinean | 29 | 0.1% |
| Assyrian / Chaldean / Syriac | 69 | 0.3% |
| Australian | 5 | 0.0% |
| Austrian | 99 | 0.5% |
| Belgian | 157 | 0.8% |
| Bhutanese | 39 | 0.2% |
| Blackfeet | 5 | 0.0% |
| Brazilian | 6 | 0.0% |
| British | 202 | 1.0% |
| Bulgarian | 20 | 0.1% |
| Burmese | 46 | 0.2% |
| Canadian | 35 | 0.2% |
| Central American | 6 | 0.0% |
| Central American Indian | 13 | 0.1% |
| Cherokee | 17 | 0.1% |
| Chippewa | 302 | 1.5% |
| Colombian | 6 | 0.0% |
| Croatian | 67 | 0.3% |
| Crow | 2 | 0.0% |
| Cuban | 9 | 0.0% |
| Czech | 96 | 0.5% |
| Czechoslovakian | 10 | 0.1% |
| Danish | 146 | 0.7% |
| Dominican | 20 | 0.1% |
| Dutch | 621 | 3.0% |
| Eastern European | 36 | 0.2% |
| English | 2,225 | 10.8% |
| European | 193 | 0.9% |
| Fijian | 5 | 0.0% |
| Finnish | 1,981 | 9.6% |
| French | 1,467 | 7.1% |
| French American Indian | 19 | 0.1% |
| French Canadian | 727 | 3.5% |
| German | 4,442 | 21.5% |
| Greek | 168 | 0.8% |
| Guamanian / Chamorro | 3 | 0.0% |
| Guatemalan | 6 | 0.0% |
| Hungarian | 135 | 0.6% |
| Indian (Asian) | 35 | 0.2% |
| Iranian | 8 | 0.0% |
| Irish | 2,465 | 11.9% |
| Iroquois | 5 | 0.0% |
| Italian | 1,151 | 5.6% |
| Jamaican | 5 | 0.0% |
| Korean | 19 | 0.1% |
| Laotian | 36 | 0.2% |
| Latvian | 36 | 0.2% |
| Lebanese | 15 | 0.1% |
| Lithuanian | 67 | 0.3% |
| Macedonian | 162 | 0.8% |
| Malaysian | 9 | 0.0% |
| Mexican | 405 | 2.0% |
| Mexican American Indian | 7 | 0.0% |
| Moroccan | 5 | 0.0% |
| Northern European | 22 | 0.1% |
| Norwegian | 440 | 2.1% |
| Ottawa | 10 | 0.1% |
| Polish | 1,867 | 9.0% |
| Portuguese | 63 | 0.3% |
| Potawatomi | 39 | 0.2% |
| Puerto Rican | 51 | 0.3% |
| Russian | 108 | 0.5% |
| Samoan | 10 | 0.1% |
| Scandinavian | 183 | 0.9% |
| Scotch-Irish | 95 | 0.5% |
| Scottish | 374 | 1.8% |
| Serbian | 2 | 0.0% |
| Slavic | 5 | 0.0% |
| Slovak | 51 | 0.3% |
| Slovene | 18 | 0.1% |
| South American | 53 | 0.3% |
| Spaniard | 5 | 0.0% |
| Spanish | 5 | 0.0% |
| Sri Lankan | 12 | 0.1% |
| Subsaharan African | 25 | 0.1% |
| Swedish | 971 | 4.7% |
| Swiss | 47 | 0.2% |
| Thai | 73 | 0.4% |
| Turkish | 4 | 0.0% |
| Ukrainian | 133 | 0.6% |
| Uruguayan | 7 | 0.0% |
| Venezuelan | 11 | 0.1% |
| Welsh | 53 | 0.3% |
| Yaqui | 7 | 0.0% |
| Yugoslavian | 7 | 0.0% | View All 89 Rows |
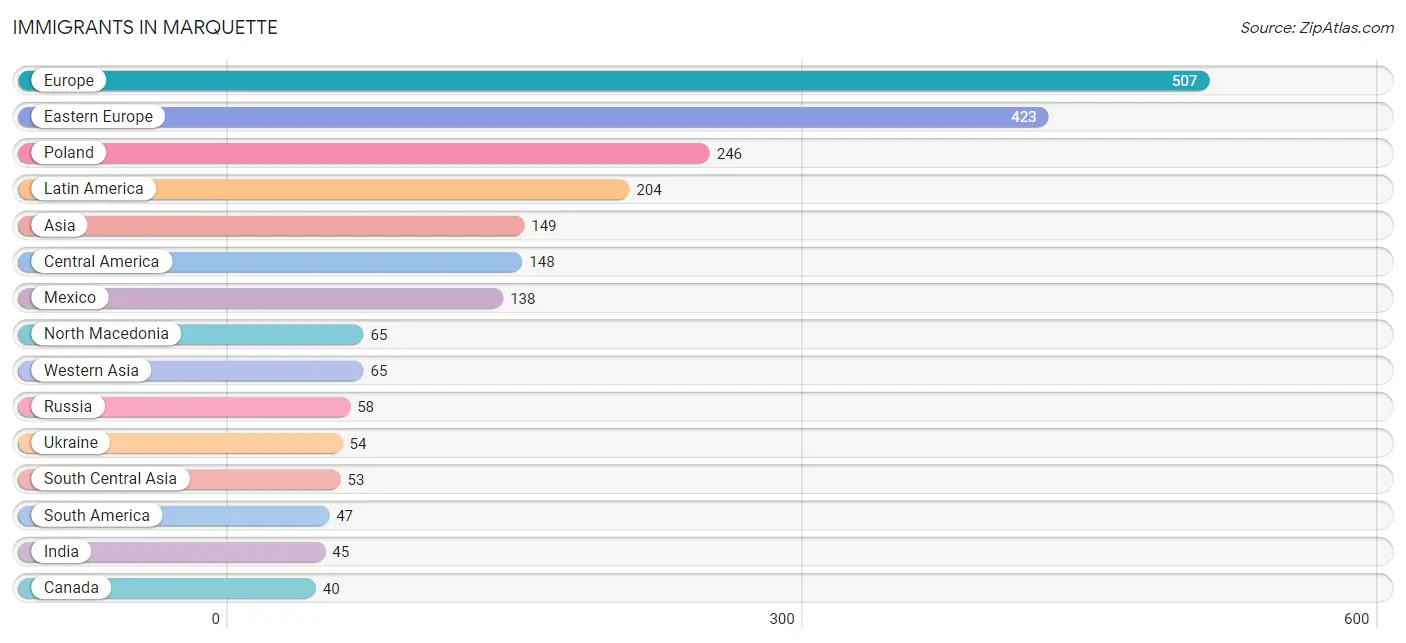
Immigrants in Marquette
The most numerous immigrant groups reported in Marquette came from Europe (507 | 2.5%), Eastern Europe (423 | 2.1%), Poland (246 | 1.2%), Latin America (204 | 1.0%), and Asia (149 | 0.7%), together accounting for 7.4% of all Marquette residents.
| Immigration Origin | # Population | % Population |
| Argentina | 29 | 0.1% |
| Asia | 149 | 0.7% |
| Canada | 40 | 0.2% |
| Caribbean | 9 | 0.0% |
| Central America | 148 | 0.7% |
| China | 9 | 0.0% |
| Cuba | 9 | 0.0% |
| Eastern Asia | 21 | 0.1% |
| Eastern Europe | 423 | 2.1% |
| El Salvador | 10 | 0.1% |
| England | 20 | 0.1% |
| Europe | 507 | 2.5% |
| Germany | 34 | 0.2% |
| India | 45 | 0.2% |
| Iran | 8 | 0.0% |
| Iraq | 36 | 0.2% |
| Israel | 8 | 0.0% |
| Italy | 22 | 0.1% |
| Korea | 12 | 0.1% |
| Latin America | 204 | 1.0% |
| Mexico | 138 | 0.7% |
| North Macedonia | 65 | 0.3% |
| Northern Europe | 28 | 0.1% |
| Philippines | 10 | 0.1% |
| Poland | 246 | 1.2% |
| Russia | 58 | 0.3% |
| South America | 47 | 0.2% |
| South Central Asia | 53 | 0.3% |
| South Eastern Asia | 10 | 0.1% |
| Southern Europe | 22 | 0.1% |
| Syria | 13 | 0.1% |
| Turkey | 8 | 0.0% |
| Ukraine | 54 | 0.3% |
| Uruguay | 7 | 0.0% |
| Venezuela | 11 | 0.1% |
| Western Asia | 65 | 0.3% |
| Western Europe | 34 | 0.2% | View All 37 Rows |
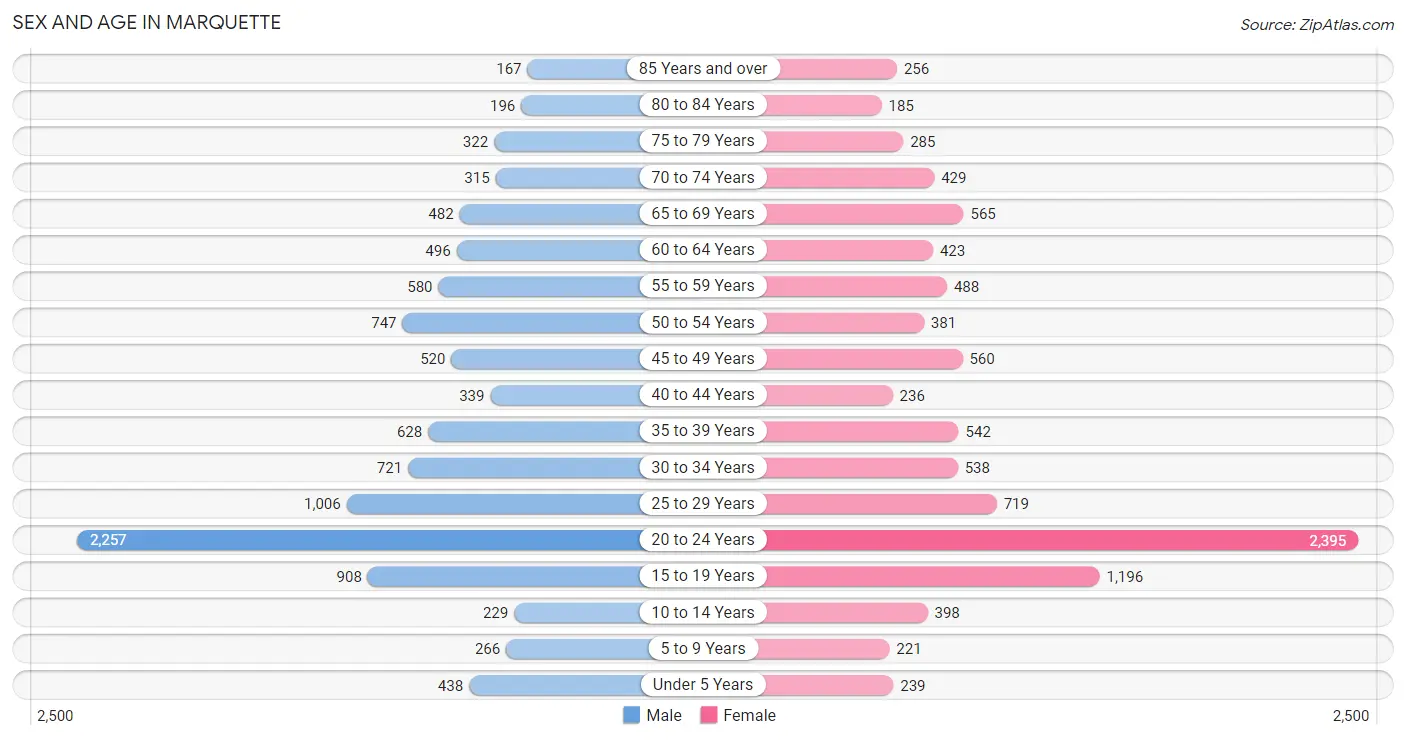
Sex and Age in Marquette
Sex and Age in Marquette
The most populous age groups in Marquette are 20 to 24 Years (2,257 | 21.3%) for men and 20 to 24 Years (2,395 | 23.8%) for women.
| Age Bracket | Male | Female |
| Under 5 Years | 438 (4.1%) | 239 (2.4%) |
| 5 to 9 Years | 266 (2.5%) | 221 (2.2%) |
| 10 to 14 Years | 229 (2.2%) | 398 (4.0%) |
| 15 to 19 Years | 908 (8.6%) | 1,196 (11.9%) |
| 20 to 24 Years | 2,257 (21.3%) | 2,395 (23.8%) |
| 25 to 29 Years | 1,006 (9.5%) | 719 (7.1%) |
| 30 to 34 Years | 721 (6.8%) | 538 (5.3%) |
| 35 to 39 Years | 628 (5.9%) | 542 (5.4%) |
| 40 to 44 Years | 339 (3.2%) | 236 (2.4%) |
| 45 to 49 Years | 520 (4.9%) | 560 (5.6%) |
| 50 to 54 Years | 747 (7.0%) | 381 (3.8%) |
| 55 to 59 Years | 580 (5.5%) | 488 (4.9%) |
| 60 to 64 Years | 496 (4.7%) | 423 (4.2%) |
| 65 to 69 Years | 482 (4.5%) | 565 (5.6%) |
| 70 to 74 Years | 315 (3.0%) | 429 (4.3%) |
| 75 to 79 Years | 322 (3.0%) | 285 (2.8%) |
| 80 to 84 Years | 196 (1.8%) | 185 (1.8%) |
| 85 Years and over | 167 (1.6%) | 256 (2.5%) |
| Total | 10,617 (100.0%) | 10,056 (100.0%) |
Families and Households in Marquette
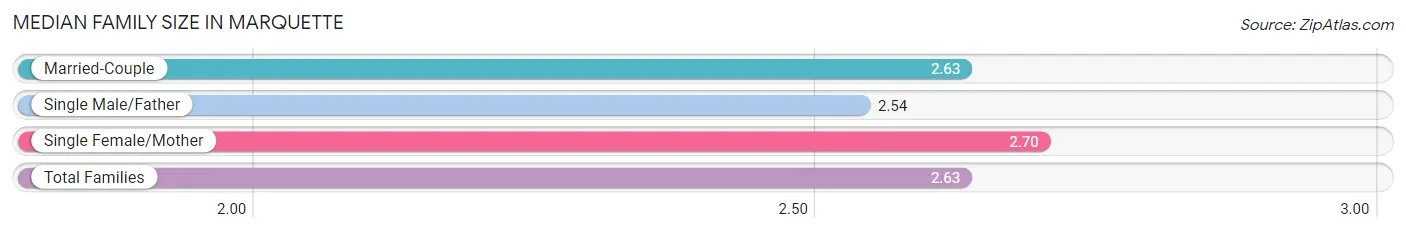
Median Family Size in Marquette
The median family size in Marquette is 2.63 persons per family, with single female/mother families (580 | 15.0%) accounting for the largest median family size of 2.7 persons per family. On the other hand, single male/father families (457 | 11.8%) represent the smallest median family size with 2.54 persons per family.
| Family Type | # Families | Family Size |
| Married-Couple | 2,825 (73.2%) | 2.63 |
| Single Male/Father | 457 (11.8%) | 2.54 |
| Single Female/Mother | 580 (15.0%) | 2.70 |
| Total Families | 3,862 (100.0%) | 2.63 |
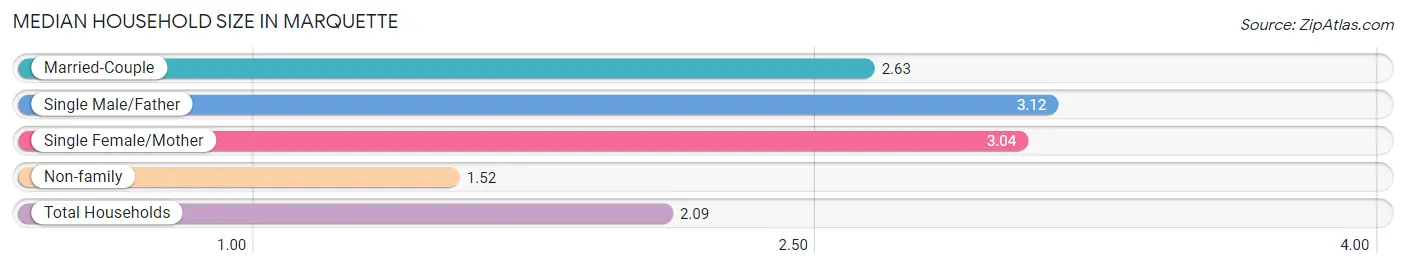
Median Household Size in Marquette
The median household size in Marquette is 2.09 persons per household, with single male/father households (457 | 5.4%) accounting for the largest median household size of 3.12 persons per household. non-family households (4,558 | 54.1%) represent the smallest median household size with 1.52 persons per household.
| Household Type | # Households | Household Size |
| Married-Couple | 2,825 (33.6%) | 2.63 |
| Single Male/Father | 457 (5.4%) | 3.12 |
| Single Female/Mother | 580 (6.9%) | 3.04 |
| Non-family | 4,558 (54.1%) | 1.52 |
| Total Households | 8,420 (100.0%) | 2.09 |
Household Size by Marriage Status in Marquette
Out of a total of 8,420 households in Marquette, 3,862 (45.9%) are family households, while 4,558 (54.1%) are nonfamily households. The most numerous type of family households are 2-person households, comprising 2,217, and the most common type of nonfamily households are 1-person households, comprising 3,032.
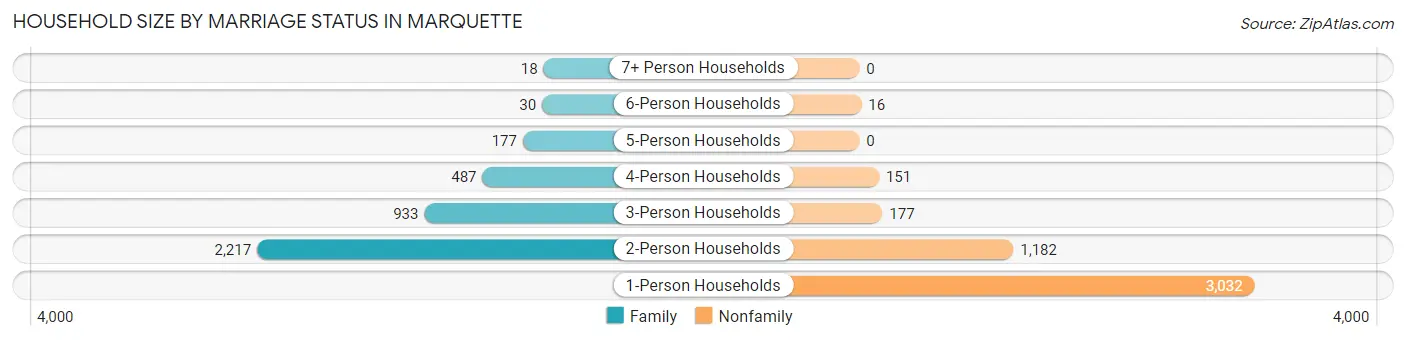
| Household Size | Family Households | Nonfamily Households |
| 1-Person Households | - | 3,032 (36.0%) |
| 2-Person Households | 2,217 (26.3%) | 1,182 (14.0%) |
| 3-Person Households | 933 (11.1%) | 177 (2.1%) |
| 4-Person Households | 487 (5.8%) | 151 (1.8%) |
| 5-Person Households | 177 (2.1%) | 0 (0.0%) |
| 6-Person Households | 30 (0.4%) | 16 (0.2%) |
| 7+ Person Households | 18 (0.2%) | 0 (0.0%) |
| Total | 3,862 (45.9%) | 4,558 (54.1%) |
Female Fertility in Marquette
Fertility by Age in Marquette
Average fertility rate in Marquette is 22.0 births per 1,000 women. Women in the age bracket of 35 to 50 years have the highest fertility rate with 51.0 births per 1,000 women. Women in the age bracket of 35 to 50 years acount for 51.8% of all women with births.
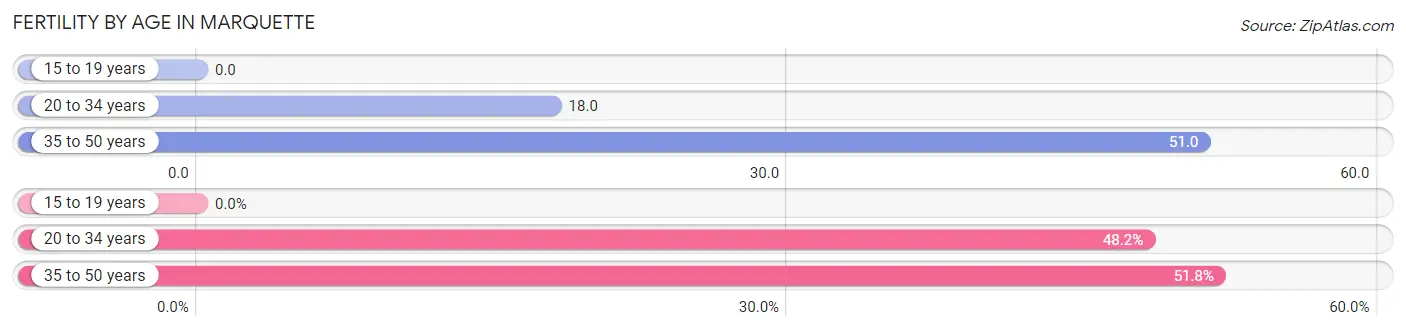
| Age Bracket | Women with Births | Births / 1,000 Women |
| 15 to 19 years | 0 (0.0%) | 0.0 |
| 20 to 34 years | 67 (48.2%) | 18.0 |
| 35 to 50 years | 72 (51.8%) | 51.0 |
| Total | 139 (100.0%) | 22.0 |
Fertility by Age by Marriage Status in Marquette
87.1% of women with births (139) in Marquette are married. The highest percentage of unmarried women with births falls into 20 to 34 years age bracket with 26.9% of them unmarried at the time of birth, while the lowest percentage of unmarried women with births belong to 35 to 50 years age bracket with 0.0% of them unmarried.
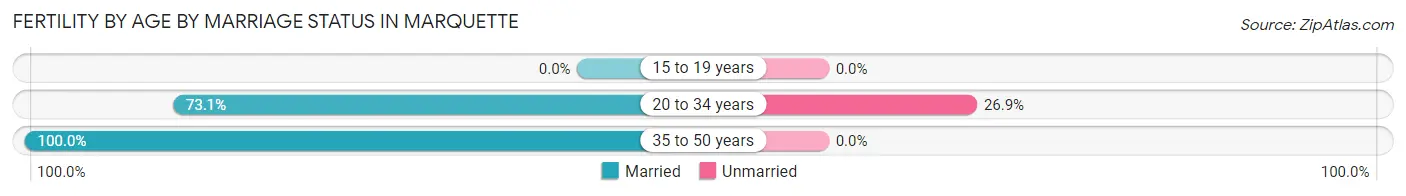
| Age Bracket | Married | Unmarried |
| 15 to 19 years | 0 (0.0%) | 0 (0.0%) |
| 20 to 34 years | 49 (73.1%) | 18 (26.9%) |
| 35 to 50 years | 72 (100.0%) | 0 (0.0%) |
| Total | 121 (87.1%) | 18 (13.0%) |
Fertility by Education in Marquette
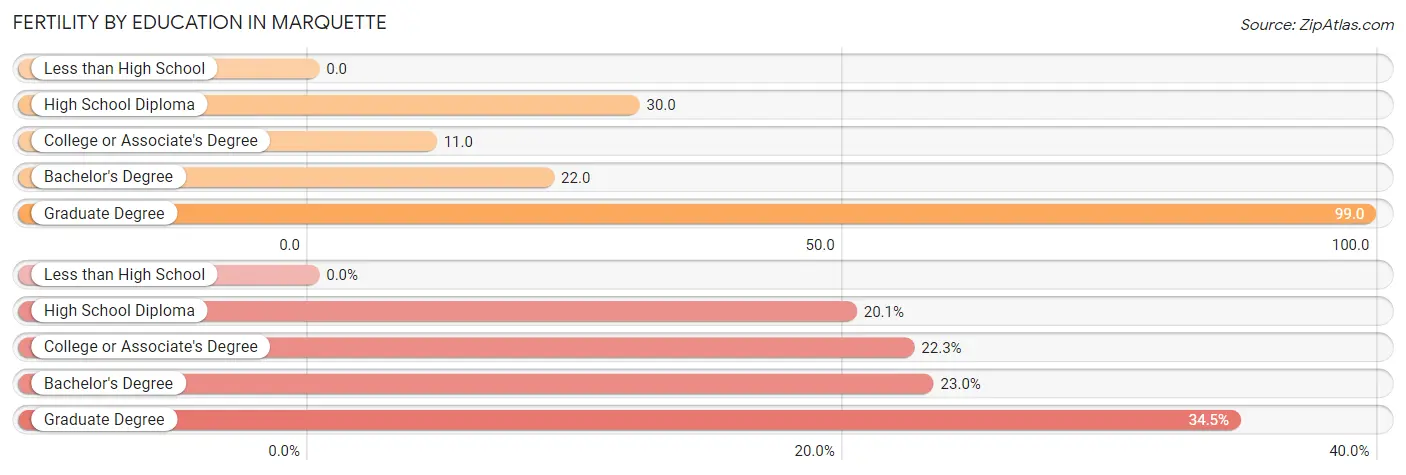
| Educational Attainment | Women with Births | Births / 1,000 Women |
| Less than High School | 0 (0.0%) | 0.0 |
| High School Diploma | 28 (20.1%) | 30.0 |
| College or Associate's Degree | 31 (22.3%) | 11.0 |
| Bachelor's Degree | 32 (23.0%) | 22.0 |
| Graduate Degree | 48 (34.5%) | 99.0 |
| Total | 139 (100.0%) | 22.0 |
Fertility by Education by Marriage Status in Marquette
13.0% of women with births in Marquette are unmarried. Women with the educational attainment of bachelor's degree are most likely to be married with 100.0% of them married at childbirth, while women with the educational attainment of college or associate's degree are least likely to be married with 54.8% of them unmarried at childbirth.
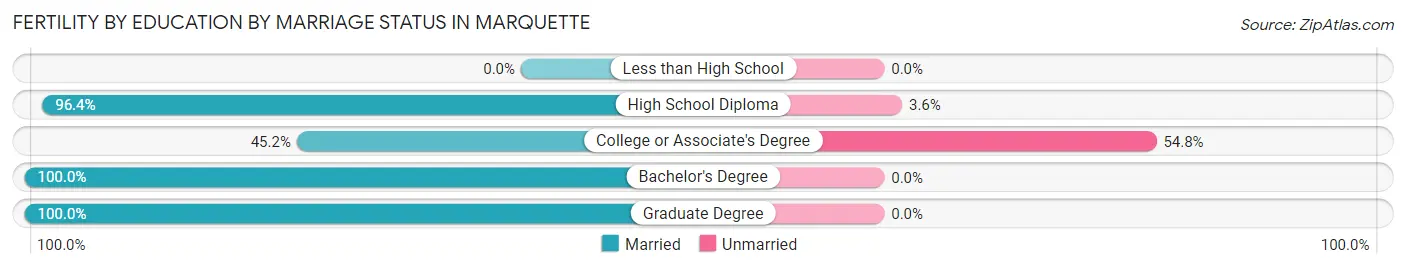
| Educational Attainment | Married | Unmarried |
| Less than High School | 0 (0.0%) | 0 (0.0%) |
| High School Diploma | 27 (96.4%) | 1 (3.6%) |
| College or Associate's Degree | 14 (45.2%) | 17 (54.8%) |
| Bachelor's Degree | 32 (100.0%) | 0 (0.0%) |
| Graduate Degree | 48 (100.0%) | 0 (0.0%) |
| Total | 121 (87.1%) | 18 (13.0%) |
Employment Characteristics in Marquette
Employment by Class of Employer in Marquette
Among the 10,994 employed individuals in Marquette, private company employees (7,502 | 68.2%), not-for-profit organizations (1,082 | 9.8%), and state government employees (949 | 8.6%) make up the most common classes of employment.
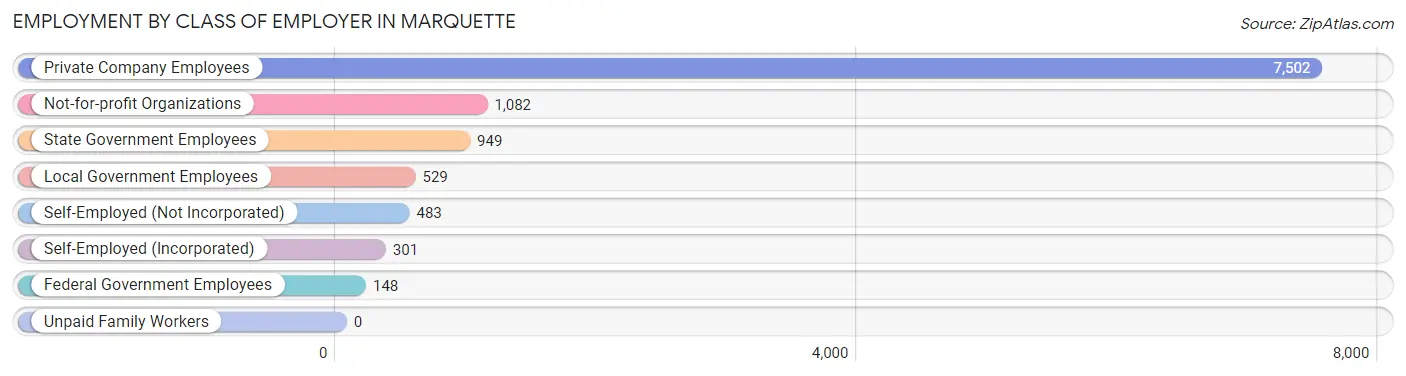
| Employer Class | # Employees | % Employees |
| Private Company Employees | 7,502 | 68.2% |
| Self-Employed (Incorporated) | 301 | 2.7% |
| Self-Employed (Not Incorporated) | 483 | 4.4% |
| Not-for-profit Organizations | 1,082 | 9.8% |
| Local Government Employees | 529 | 4.8% |
| State Government Employees | 949 | 8.6% |
| Federal Government Employees | 148 | 1.3% |
| Unpaid Family Workers | 0 | 0.0% |
| Total | 10,994 | 100.0% |
Employment Status by Age in Marquette
According to the labor force statistics for Marquette, out of the total population over 16 years of age (18,755), 64.0% or 12,003 individuals are in the labor force, with 5.9% or 708 of them unemployed. The age group with the highest labor force participation rate is 35 to 44 years, with 86.0% or 1,501 individuals in the labor force. Within the labor force, the 65 to 74 years age range has the highest percentage of unemployed individuals, with 15.2% or 55 of them being unemployed.
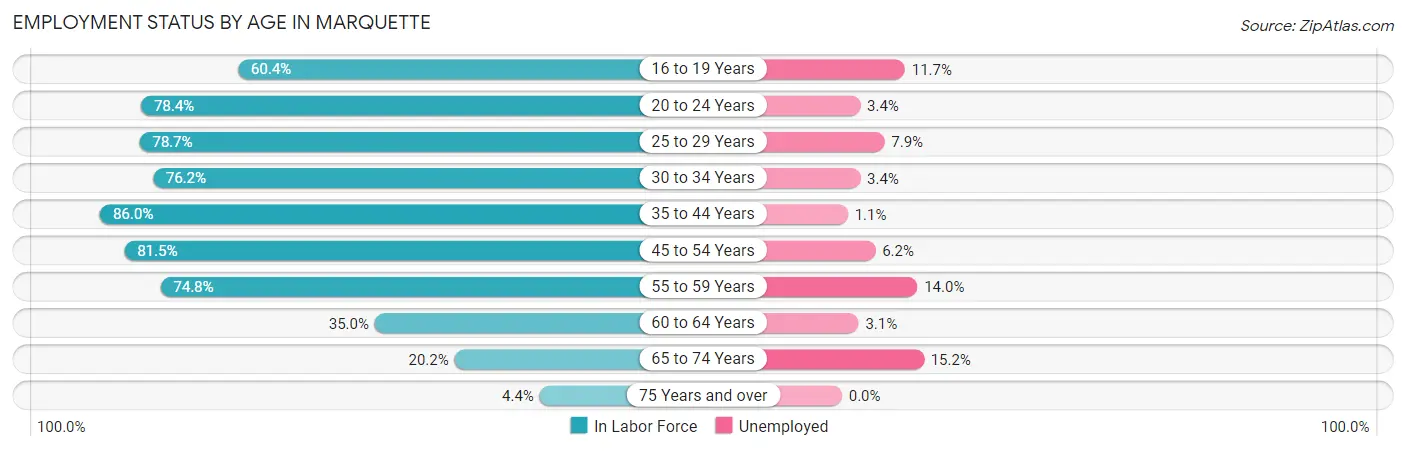
| Age Bracket | In Labor Force | Unemployed |
| 16 to 19 Years | 1,194 (60.4%) | 140 (11.7%) |
| 20 to 24 Years | 3,647 (78.4%) | 124 (3.4%) |
| 25 to 29 Years | 1,358 (78.7%) | 107 (7.9%) |
| 30 to 34 Years | 959 (76.2%) | 33 (3.4%) |
| 35 to 44 Years | 1,501 (86.0%) | 17 (1.1%) |
| 45 to 54 Years | 1,800 (81.5%) | 112 (6.2%) |
| 55 to 59 Years | 799 (74.8%) | 112 (14.0%) |
| 60 to 64 Years | 322 (35.0%) | 10 (3.1%) |
| 65 to 74 Years | 362 (20.2%) | 55 (15.2%) |
| 75 Years and over | 62 (4.4%) | 0 (0.0%) |
| Total | 12,003 (64.0%) | 708 (5.9%) |
Employment Status by Educational Attainment in Marquette
According to labor force statistics for Marquette, 75.5% of individuals (6,738) out of the total population between 25 and 64 years of age (8,924) are in the labor force, with 5.8% or 391 of them being unemployed. The group with the highest labor force participation rate are those with the educational attainment of bachelor's degree or higher, with 90.3% or 3,703 individuals in the labor force. Within the labor force, individuals with high school diploma education have the highest percentage of unemployment, with 18.0% or 178 of them being unemployed.
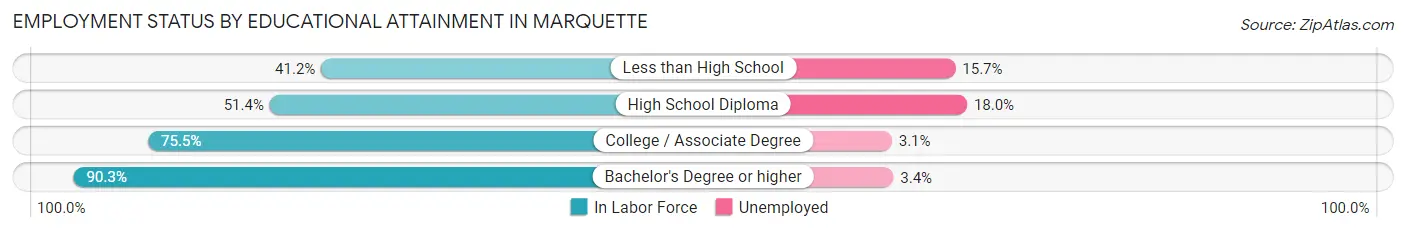
| Educational Attainment | In Labor Force | Unemployed |
| Less than High School | 172 (41.2%) | 65 (15.7%) |
| High School Diploma | 989 (51.4%) | 346 (18.0%) |
| College / Associate Degree | 1,874 (75.5%) | 77 (3.1%) |
| Bachelor's Degree or higher | 3,703 (90.3%) | 139 (3.4%) |
| Total | 6,738 (75.5%) | 518 (5.8%) |
Employment Occupations by Sex in Marquette
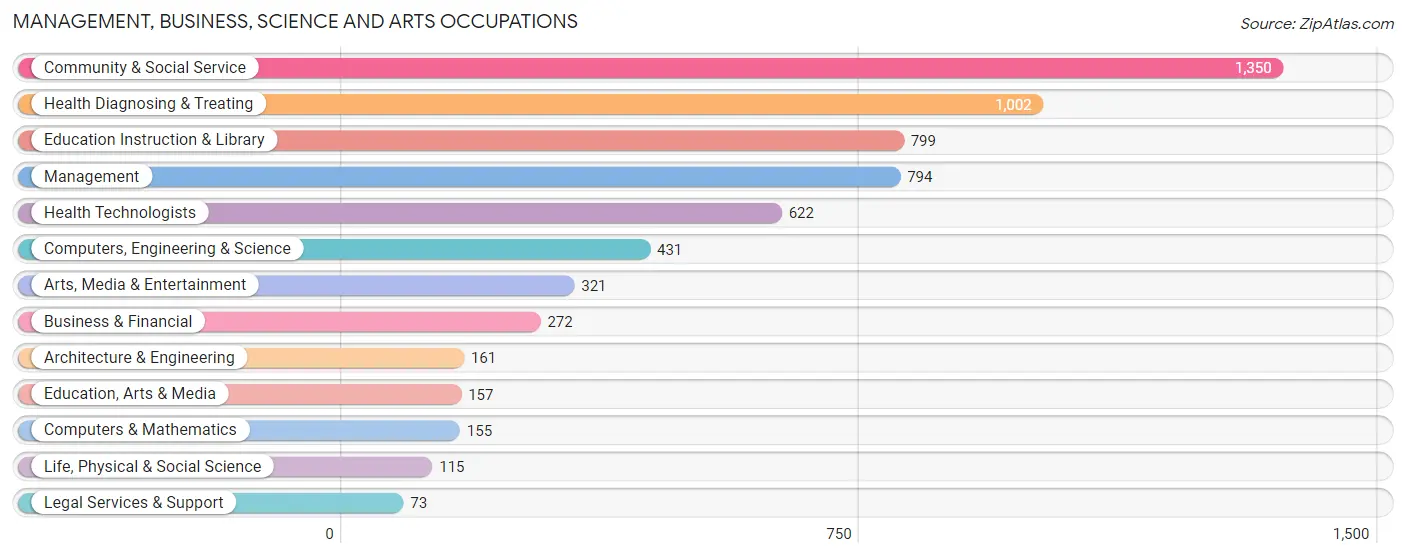
Management, Business, Science and Arts Occupations
The most common Management, Business, Science and Arts occupations in Marquette are Community & Social Service (1,350 | 12.0%), Health Diagnosing & Treating (1,002 | 8.9%), Education Instruction & Library (799 | 7.1%), Management (794 | 7.0%), and Health Technologists (622 | 5.5%).
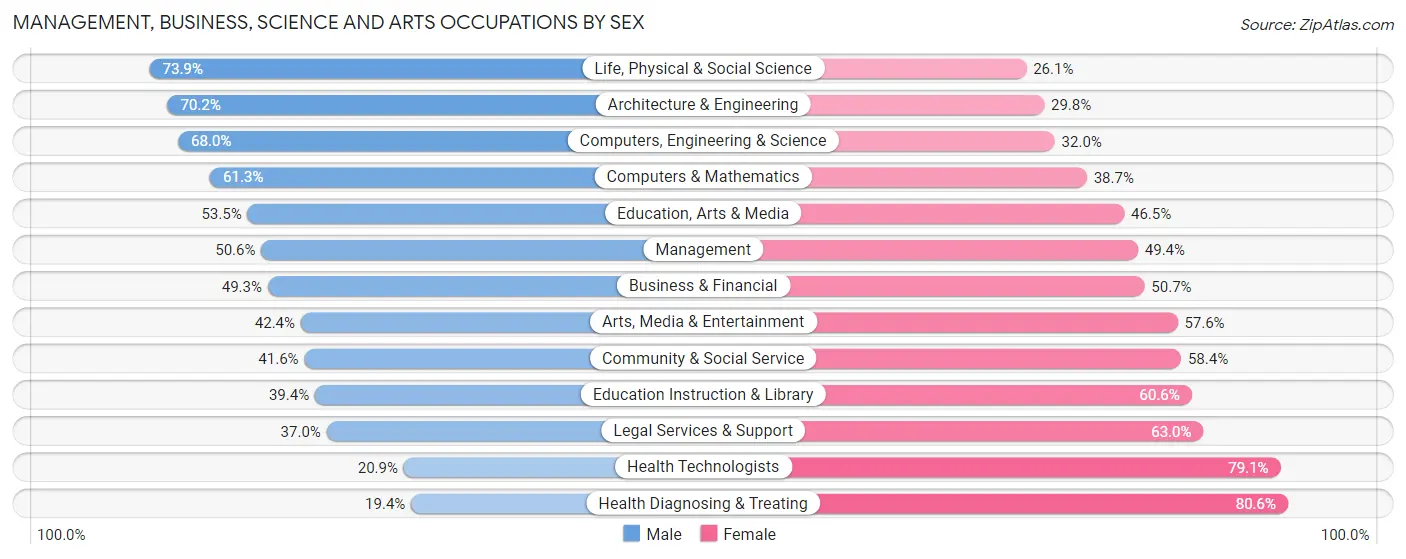
Management, Business, Science and Arts Occupations by Sex
Within the Management, Business, Science and Arts occupations in Marquette, the most male-oriented occupations are Life, Physical & Social Science (73.9%), Architecture & Engineering (70.2%), and Computers, Engineering & Science (68.0%), while the most female-oriented occupations are Health Diagnosing & Treating (80.6%), Health Technologists (79.1%), and Legal Services & Support (63.0%).
| Occupation | Male | Female |
| Management | 402 (50.6%) | 392 (49.4%) |
| Business & Financial | 134 (49.3%) | 138 (50.7%) |
| Computers, Engineering & Science | 293 (68.0%) | 138 (32.0%) |
| Computers & Mathematics | 95 (61.3%) | 60 (38.7%) |
| Architecture & Engineering | 113 (70.2%) | 48 (29.8%) |
| Life, Physical & Social Science | 85 (73.9%) | 30 (26.1%) |
| Community & Social Service | 562 (41.6%) | 788 (58.4%) |
| Education, Arts & Media | 84 (53.5%) | 73 (46.5%) |
| Legal Services & Support | 27 (37.0%) | 46 (63.0%) |
| Education Instruction & Library | 315 (39.4%) | 484 (60.6%) |
| Arts, Media & Entertainment | 136 (42.4%) | 185 (57.6%) |
| Health Diagnosing & Treating | 194 (19.4%) | 808 (80.6%) |
| Health Technologists | 130 (20.9%) | 492 (79.1%) |
| Total (Category) | 1,585 (41.2%) | 2,264 (58.8%) |
| Total (Overall) | 5,343 (47.4%) | 5,921 (52.6%) |
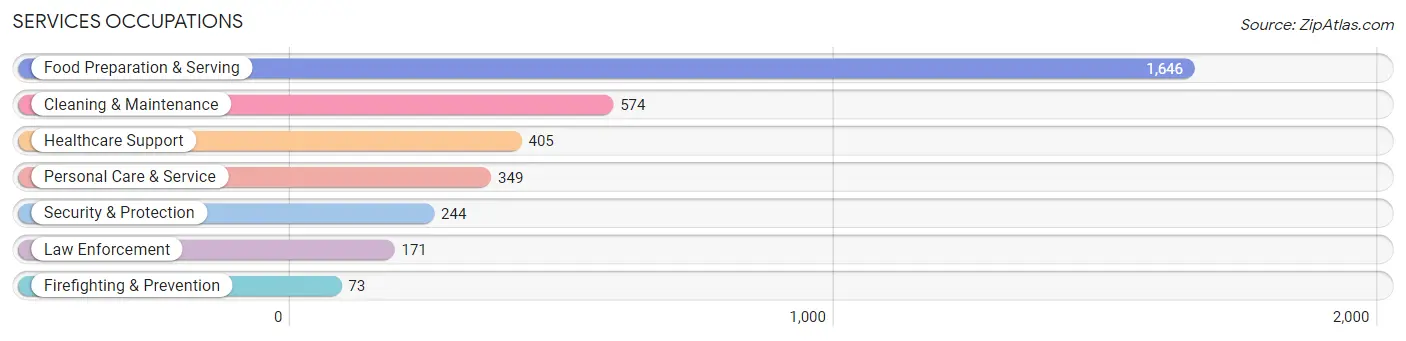
Services Occupations
The most common Services occupations in Marquette are Food Preparation & Serving (1,646 | 14.6%), Cleaning & Maintenance (574 | 5.1%), Healthcare Support (405 | 3.6%), Personal Care & Service (349 | 3.1%), and Security & Protection (244 | 2.2%).
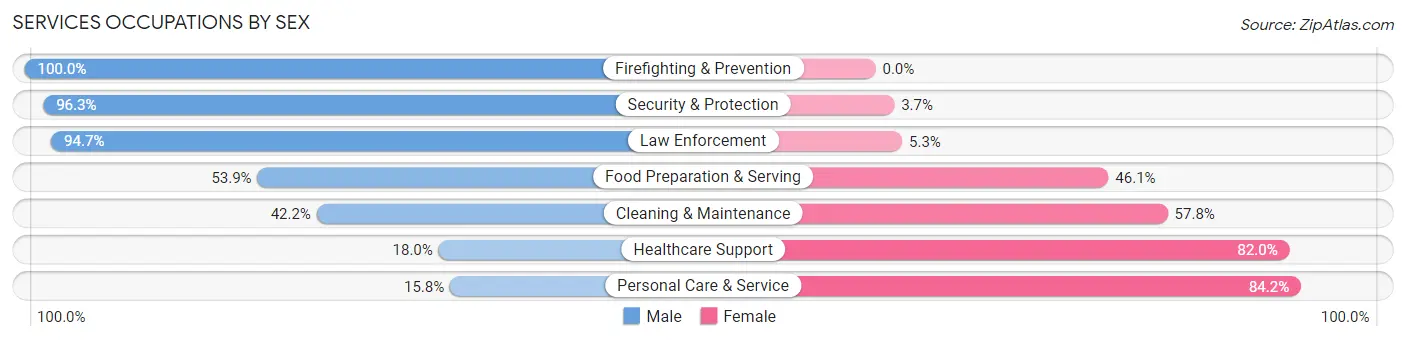
Services Occupations by Sex
Within the Services occupations in Marquette, the most male-oriented occupations are Firefighting & Prevention (100.0%), Security & Protection (96.3%), and Law Enforcement (94.7%), while the most female-oriented occupations are Personal Care & Service (84.2%), Healthcare Support (82.0%), and Cleaning & Maintenance (57.8%).
| Occupation | Male | Female |
| Healthcare Support | 73 (18.0%) | 332 (82.0%) |
| Security & Protection | 235 (96.3%) | 9 (3.7%) |
| Firefighting & Prevention | 73 (100.0%) | 0 (0.0%) |
| Law Enforcement | 162 (94.7%) | 9 (5.3%) |
| Food Preparation & Serving | 887 (53.9%) | 759 (46.1%) |
| Cleaning & Maintenance | 242 (42.2%) | 332 (57.8%) |
| Personal Care & Service | 55 (15.8%) | 294 (84.2%) |
| Total (Category) | 1,492 (46.4%) | 1,726 (53.6%) |
| Total (Overall) | 5,343 (47.4%) | 5,921 (52.6%) |
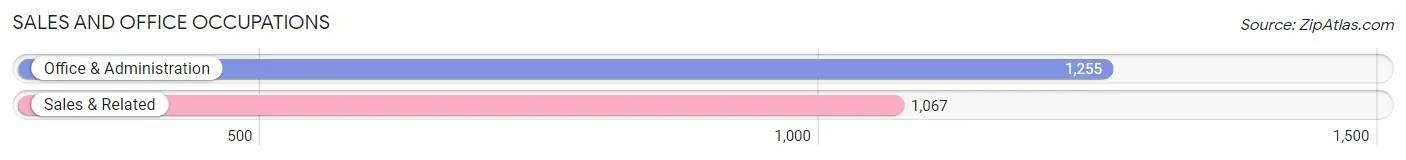
Sales and Office Occupations
The most common Sales and Office occupations in Marquette are Office & Administration (1,255 | 11.1%), and Sales & Related (1,067 | 9.5%).
Sales and Office Occupations by Sex
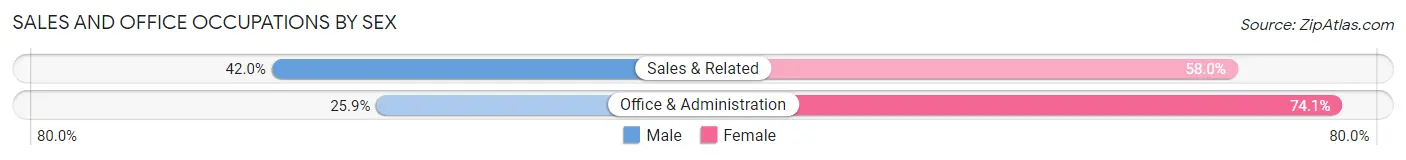
| Occupation | Male | Female |
| Sales & Related | 448 (42.0%) | 619 (58.0%) |
| Office & Administration | 325 (25.9%) | 930 (74.1%) |
| Total (Category) | 773 (33.3%) | 1,549 (66.7%) |
| Total (Overall) | 5,343 (47.4%) | 5,921 (52.6%) |
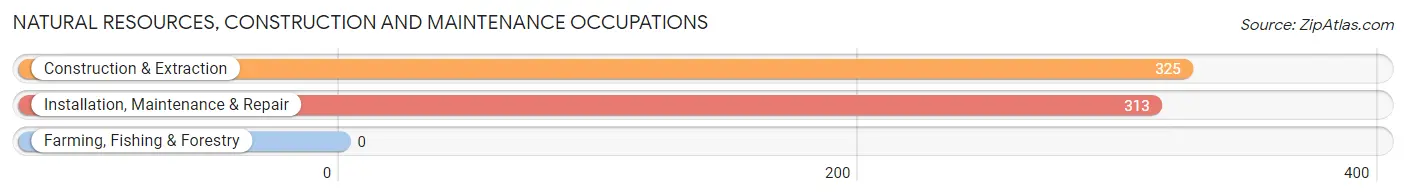
Natural Resources, Construction and Maintenance Occupations
The most common Natural Resources, Construction and Maintenance occupations in Marquette are Construction & Extraction (325 | 2.9%), and Installation, Maintenance & Repair (313 | 2.8%).
Natural Resources, Construction and Maintenance Occupations by Sex
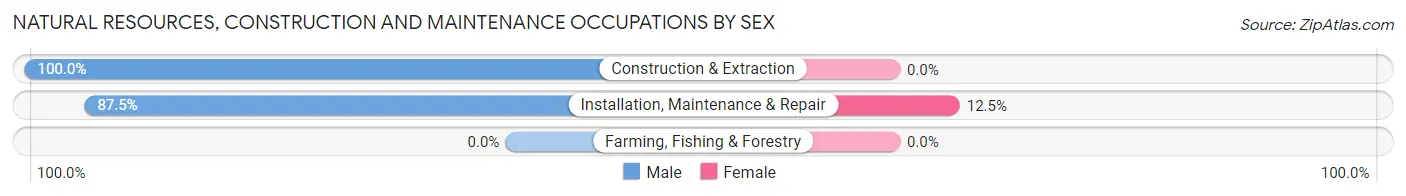
| Occupation | Male | Female |
| Farming, Fishing & Forestry | 0 (0.0%) | 0 (0.0%) |
| Construction & Extraction | 325 (100.0%) | 0 (0.0%) |
| Installation, Maintenance & Repair | 274 (87.5%) | 39 (12.5%) |
| Total (Category) | 599 (93.9%) | 39 (6.1%) |
| Total (Overall) | 5,343 (47.4%) | 5,921 (52.6%) |
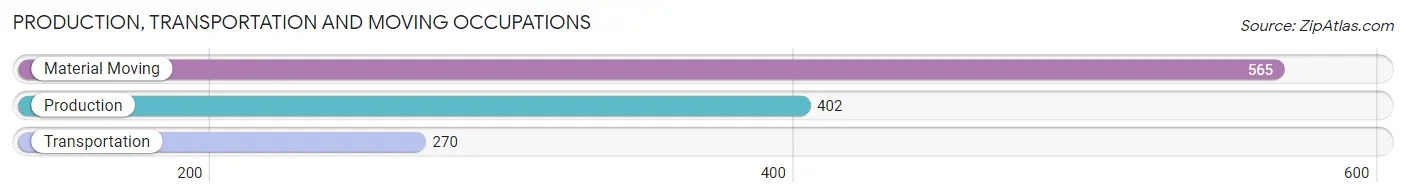
Production, Transportation and Moving Occupations
The most common Production, Transportation and Moving occupations in Marquette are Material Moving (565 | 5.0%), Production (402 | 3.6%), and Transportation (270 | 2.4%).
Production, Transportation and Moving Occupations by Sex
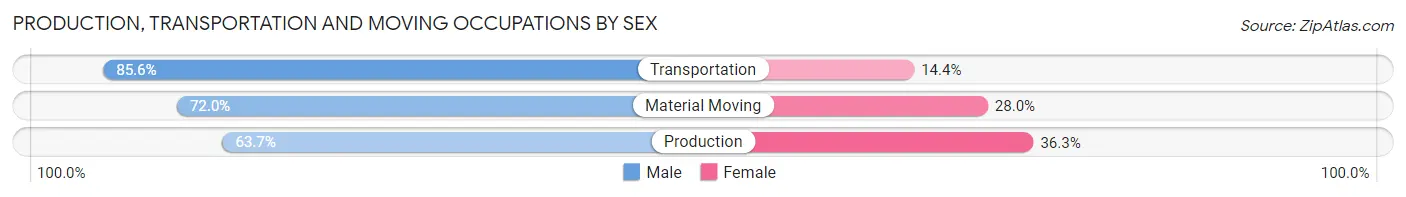
| Occupation | Male | Female |
| Production | 256 (63.7%) | 146 (36.3%) |
| Transportation | 231 (85.6%) | 39 (14.4%) |
| Material Moving | 407 (72.0%) | 158 (28.0%) |
| Total (Category) | 894 (72.3%) | 343 (27.7%) |
| Total (Overall) | 5,343 (47.4%) | 5,921 (52.6%) |
Employment Industries by Sex in Marquette
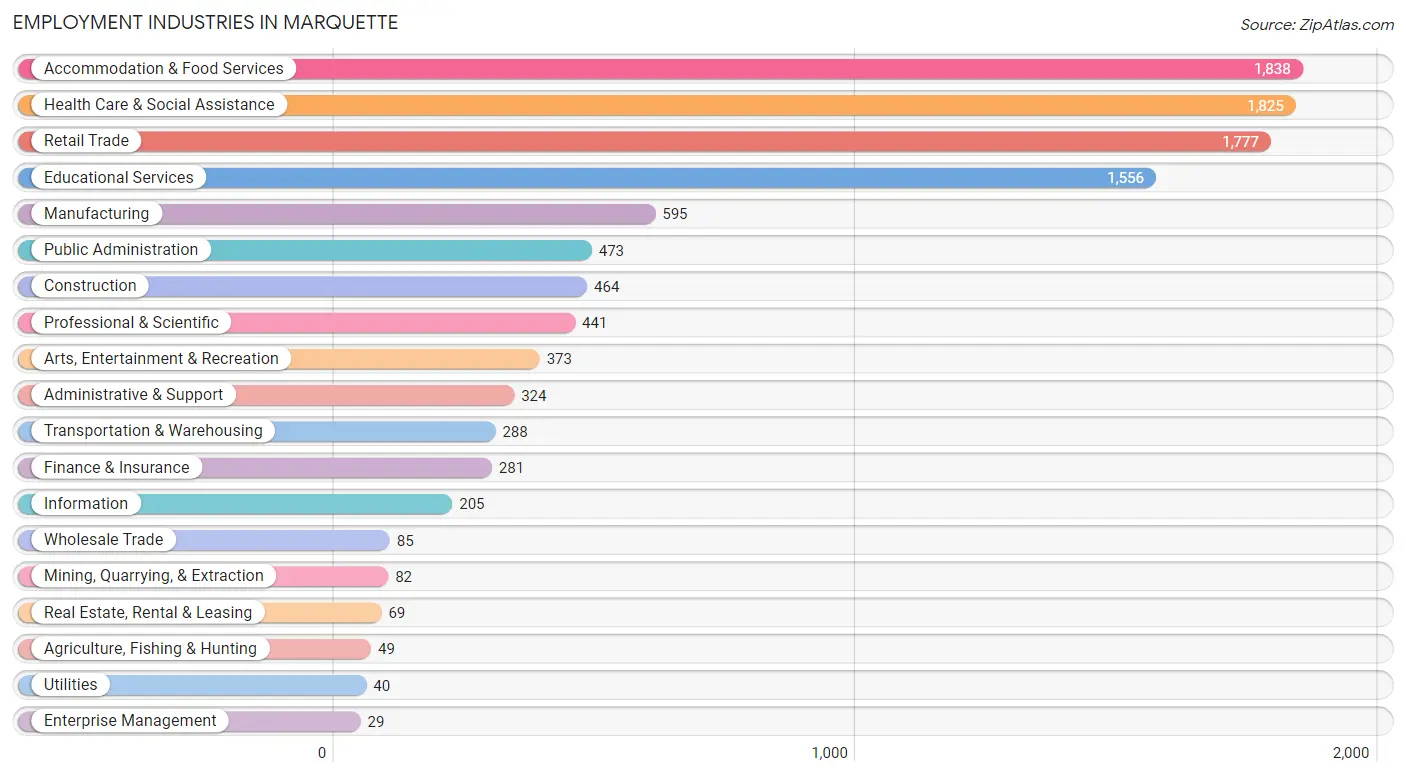
Employment Industries in Marquette
The major employment industries in Marquette include Accommodation & Food Services (1,838 | 16.3%), Health Care & Social Assistance (1,825 | 16.2%), Retail Trade (1,777 | 15.8%), Educational Services (1,556 | 13.8%), and Manufacturing (595 | 5.3%).
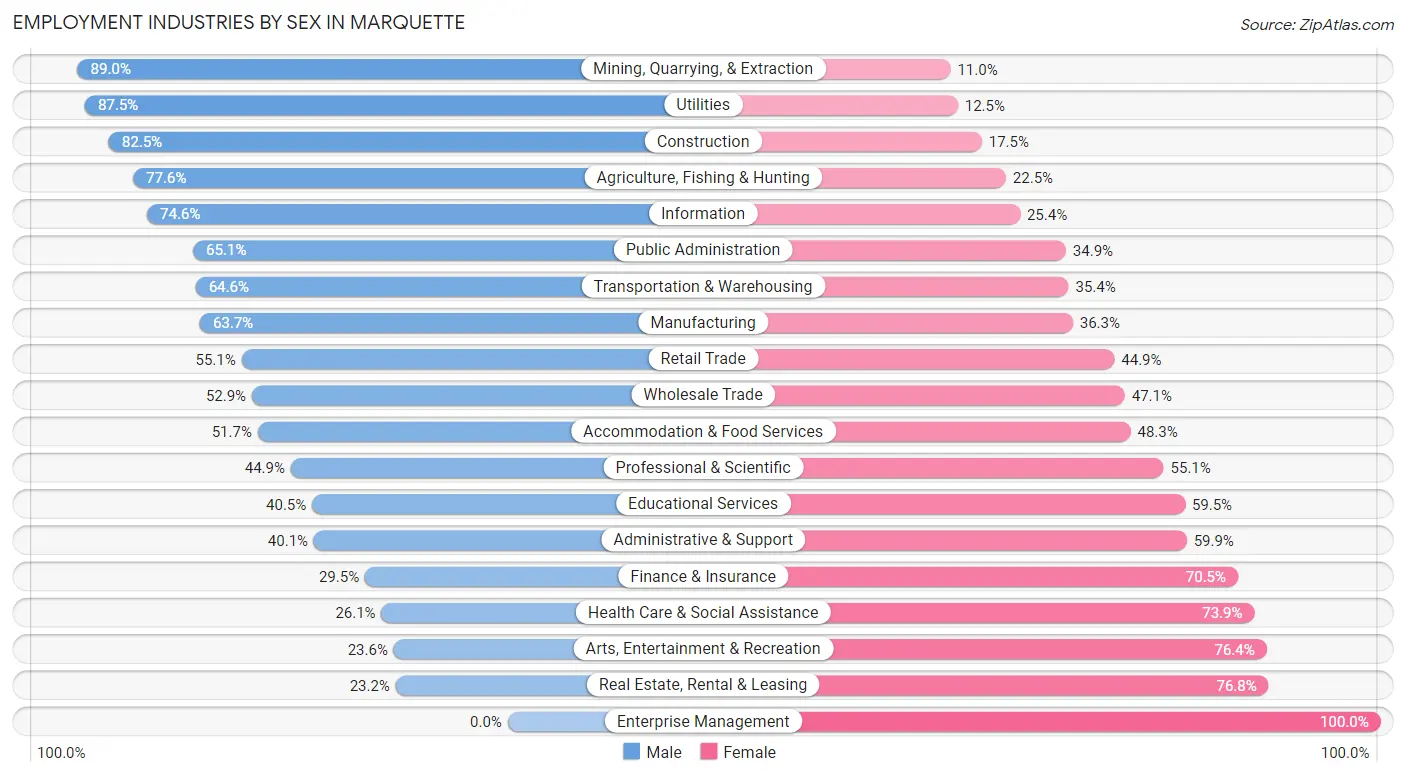
Employment Industries by Sex in Marquette
The Marquette industries that see more men than women are Mining, Quarrying, & Extraction (89.0%), Utilities (87.5%), and Construction (82.5%), whereas the industries that tend to have a higher number of women are Enterprise Management (100.0%), Real Estate, Rental & Leasing (76.8%), and Arts, Entertainment & Recreation (76.4%).
| Industry | Male | Female |
| Agriculture, Fishing & Hunting | 38 (77.5%) | 11 (22.5%) |
| Mining, Quarrying, & Extraction | 73 (89.0%) | 9 (11.0%) |
| Construction | 383 (82.5%) | 81 (17.5%) |
| Manufacturing | 379 (63.7%) | 216 (36.3%) |
| Wholesale Trade | 45 (52.9%) | 40 (47.1%) |
| Retail Trade | 979 (55.1%) | 798 (44.9%) |
| Transportation & Warehousing | 186 (64.6%) | 102 (35.4%) |
| Utilities | 35 (87.5%) | 5 (12.5%) |
| Information | 153 (74.6%) | 52 (25.4%) |
| Finance & Insurance | 83 (29.5%) | 198 (70.5%) |
| Real Estate, Rental & Leasing | 16 (23.2%) | 53 (76.8%) |
| Professional & Scientific | 198 (44.9%) | 243 (55.1%) |
| Enterprise Management | 0 (0.0%) | 29 (100.0%) |
| Administrative & Support | 130 (40.1%) | 194 (59.9%) |
| Educational Services | 630 (40.5%) | 926 (59.5%) |
| Health Care & Social Assistance | 477 (26.1%) | 1,348 (73.9%) |
| Arts, Entertainment & Recreation | 88 (23.6%) | 285 (76.4%) |
| Accommodation & Food Services | 951 (51.7%) | 887 (48.3%) |
| Public Administration | 308 (65.1%) | 165 (34.9%) |
| Total | 5,343 (47.4%) | 5,921 (52.6%) |
Education in Marquette
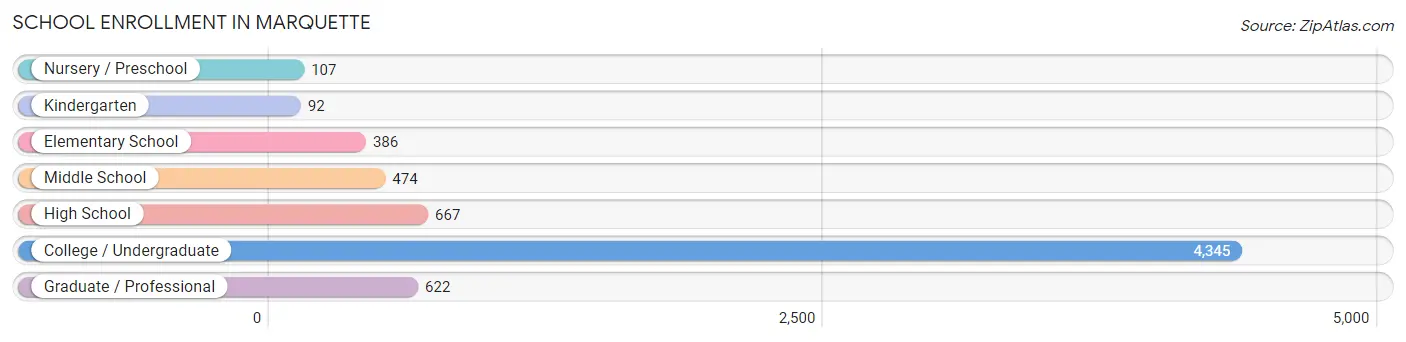
School Enrollment in Marquette
The most common levels of schooling among the 6,693 students in Marquette are college / undergraduate (4,345 | 64.9%), high school (667 | 10.0%), and graduate / professional (622 | 9.3%).
| School Level | # Students | % Students |
| Nursery / Preschool | 107 | 1.6% |
| Kindergarten | 92 | 1.4% |
| Elementary School | 386 | 5.8% |
| Middle School | 474 | 7.1% |
| High School | 667 | 10.0% |
| College / Undergraduate | 4,345 | 64.9% |
| Graduate / Professional | 622 | 9.3% |
| Total | 6,693 | 100.0% |
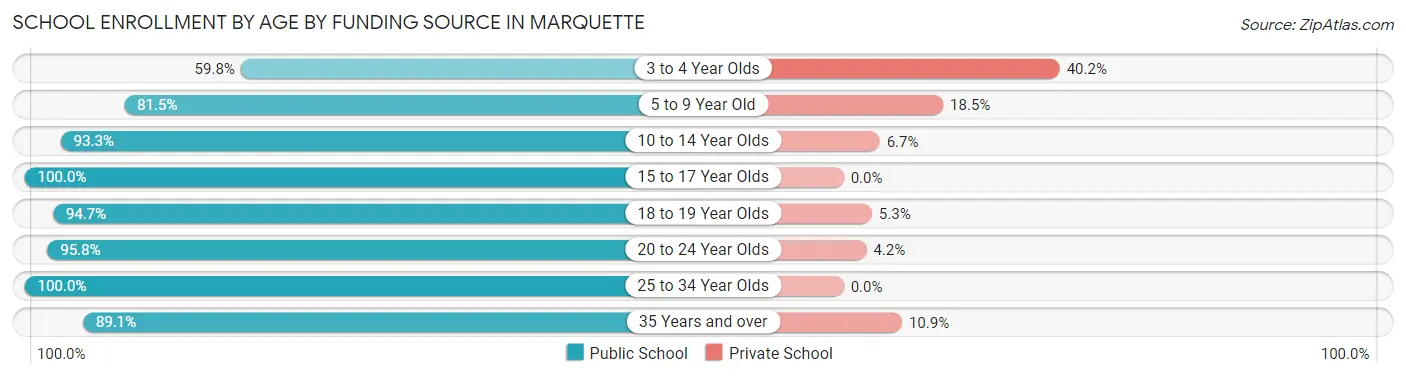
School Enrollment by Age by Funding Source in Marquette
Out of a total of 6,693 students who are enrolled in schools in Marquette, 375 (5.6%) attend a private institution, while the remaining 6,318 (94.4%) are enrolled in public schools. The age group of 3 to 4 year olds has the highest likelihood of being enrolled in private schools, with 33 (40.2% in the age bracket) enrolled. Conversely, the age group of 15 to 17 year olds has the lowest likelihood of being enrolled in a private school, with 404 (100.0% in the age bracket) attending a public institution.
| Age Bracket | Public School | Private School |
| 3 to 4 Year Olds | 49 (59.8%) | 33 (40.2%) |
| 5 to 9 Year Old | 365 (81.5%) | 83 (18.5%) |
| 10 to 14 Year Olds | 583 (93.3%) | 42 (6.7%) |
| 15 to 17 Year Olds | 404 (100.0%) | 0 (0.0%) |
| 18 to 19 Year Olds | 1,334 (94.7%) | 74 (5.3%) |
| 20 to 24 Year Olds | 2,821 (95.8%) | 125 (4.2%) |
| 25 to 34 Year Olds | 605 (100.0%) | 0 (0.0%) |
| 35 Years and over | 156 (89.1%) | 19 (10.9%) |
| Total | 6,318 (94.4%) | 375 (5.6%) |
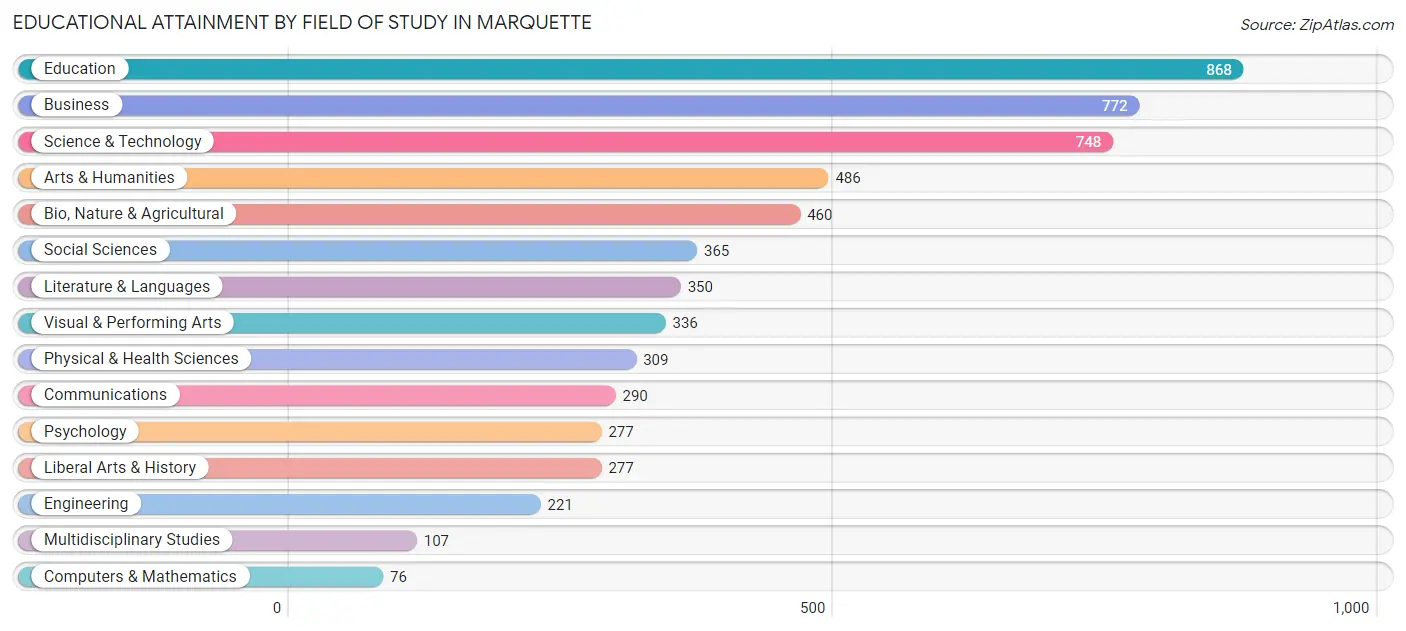
Educational Attainment by Field of Study in Marquette
Education (868 | 14.6%), business (772 | 13.0%), science & technology (748 | 12.6%), arts & humanities (486 | 8.2%), and bio, nature & agricultural (460 | 7.7%) are the most common fields of study among 5,942 individuals in Marquette who have obtained a bachelor's degree or higher.
| Field of Study | # Graduates | % Graduates |
| Computers & Mathematics | 76 | 1.3% |
| Bio, Nature & Agricultural | 460 | 7.7% |
| Physical & Health Sciences | 309 | 5.2% |
| Psychology | 277 | 4.7% |
| Social Sciences | 365 | 6.1% |
| Engineering | 221 | 3.7% |
| Multidisciplinary Studies | 107 | 1.8% |
| Science & Technology | 748 | 12.6% |
| Business | 772 | 13.0% |
| Education | 868 | 14.6% |
| Literature & Languages | 350 | 5.9% |
| Liberal Arts & History | 277 | 4.7% |
| Visual & Performing Arts | 336 | 5.7% |
| Communications | 290 | 4.9% |
| Arts & Humanities | 486 | 8.2% |
| Total | 5,942 | 100.0% |
Transportation & Commute in Marquette
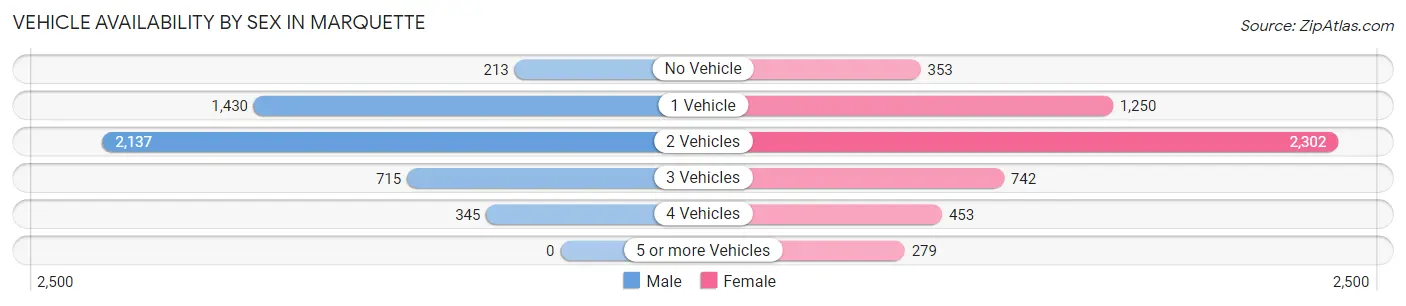
Vehicle Availability by Sex in Marquette
The most prevalent vehicle ownership categories in Marquette are males with 2 vehicles (2,137, accounting for 44.2%) and females with 2 vehicles (2,302, making up 39.7%).
| Vehicles Available | Male | Female |
| No Vehicle | 213 (4.4%) | 353 (6.6%) |
| 1 Vehicle | 1,430 (29.5%) | 1,250 (23.2%) |
| 2 Vehicles | 2,137 (44.2%) | 2,302 (42.8%) |
| 3 Vehicles | 715 (14.8%) | 742 (13.8%) |
| 4 Vehicles | 345 (7.1%) | 453 (8.4%) |
| 5 or more Vehicles | 0 (0.0%) | 279 (5.2%) |
| Total | 4,840 (100.0%) | 5,379 (100.0%) |
Commute Time in Marquette
The most frequently occuring commute durations in Marquette are 5 to 9 minutes (4,059 commuters, 39.0%), 10 to 14 minutes (2,742 commuters, 26.4%), and 15 to 19 minutes (1,075 commuters, 10.3%).
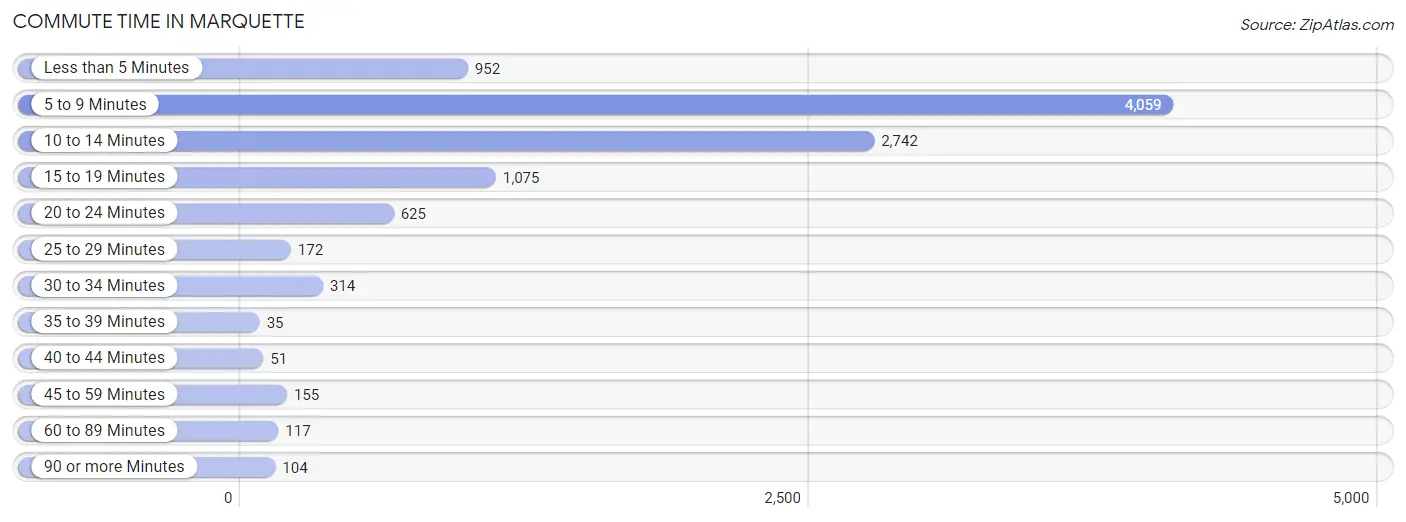
| Commute Time | # Commuters | % Commuters |
| Less than 5 Minutes | 952 | 9.1% |
| 5 to 9 Minutes | 4,059 | 39.0% |
| 10 to 14 Minutes | 2,742 | 26.4% |
| 15 to 19 Minutes | 1,075 | 10.3% |
| 20 to 24 Minutes | 625 | 6.0% |
| 25 to 29 Minutes | 172 | 1.7% |
| 30 to 34 Minutes | 314 | 3.0% |
| 35 to 39 Minutes | 35 | 0.3% |
| 40 to 44 Minutes | 51 | 0.5% |
| 45 to 59 Minutes | 155 | 1.5% |
| 60 to 89 Minutes | 117 | 1.1% |
| 90 or more Minutes | 104 | 1.0% |
Commute Time by Sex in Marquette
The most common commute times in Marquette are 5 to 9 minutes (1,764 commuters, 35.7%) for males and 5 to 9 minutes (2,295 commuters, 42.0%) for females.
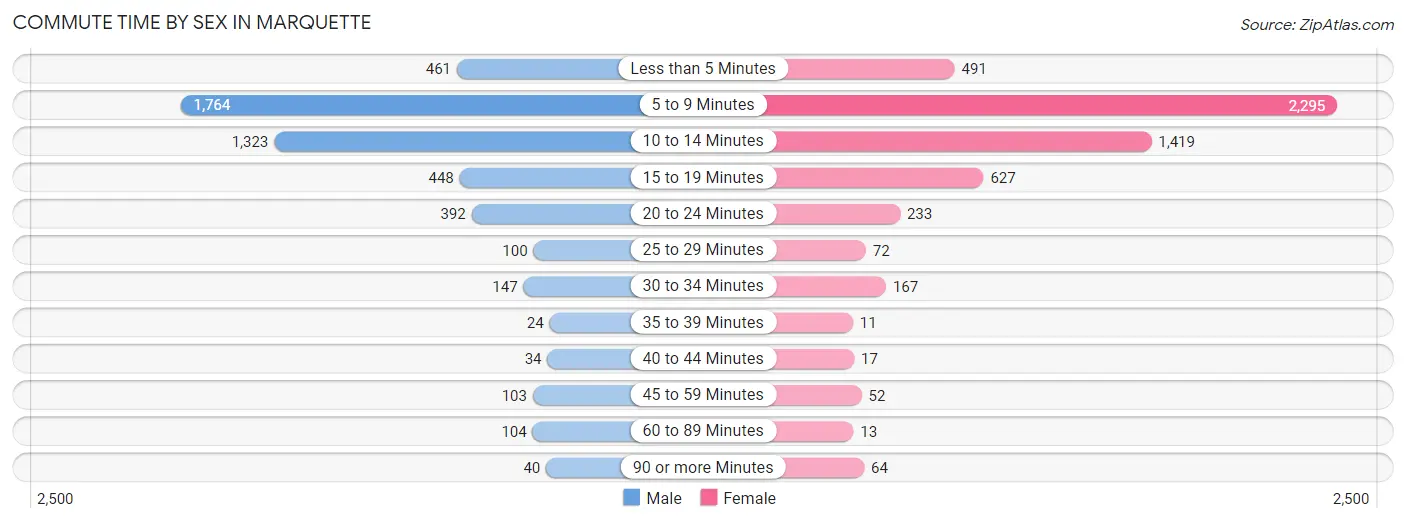
| Commute Time | Male | Female |
| Less than 5 Minutes | 461 (9.3%) | 491 (9.0%) |
| 5 to 9 Minutes | 1,764 (35.7%) | 2,295 (42.0%) |
| 10 to 14 Minutes | 1,323 (26.8%) | 1,419 (26.0%) |
| 15 to 19 Minutes | 448 (9.1%) | 627 (11.5%) |
| 20 to 24 Minutes | 392 (7.9%) | 233 (4.3%) |
| 25 to 29 Minutes | 100 (2.0%) | 72 (1.3%) |
| 30 to 34 Minutes | 147 (3.0%) | 167 (3.1%) |
| 35 to 39 Minutes | 24 (0.5%) | 11 (0.2%) |
| 40 to 44 Minutes | 34 (0.7%) | 17 (0.3%) |
| 45 to 59 Minutes | 103 (2.1%) | 52 (0.9%) |
| 60 to 89 Minutes | 104 (2.1%) | 13 (0.2%) |
| 90 or more Minutes | 40 (0.8%) | 64 (1.2%) |
Time of Departure to Work by Sex in Marquette
The most frequent times of departure to work in Marquette are 7:30 AM to 7:59 AM (745, 15.1%) for males and 7:30 AM to 7:59 AM (876, 16.0%) for females.
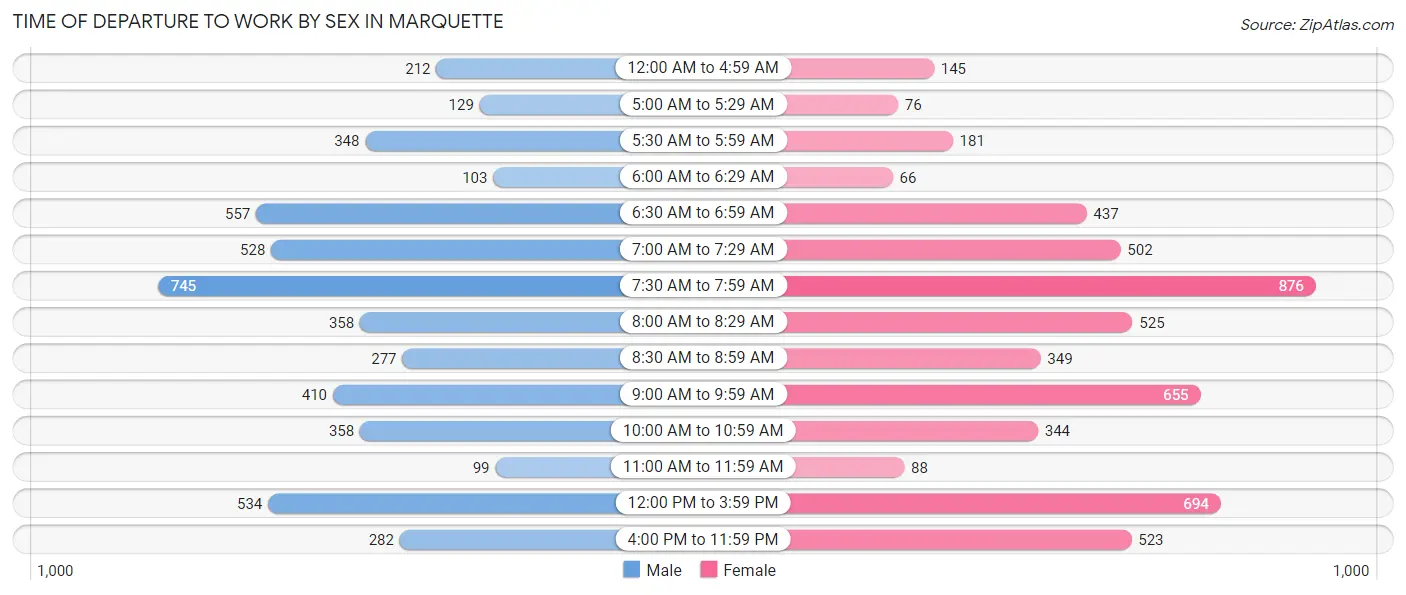
| Time of Departure | Male | Female |
| 12:00 AM to 4:59 AM | 212 (4.3%) | 145 (2.7%) |
| 5:00 AM to 5:29 AM | 129 (2.6%) | 76 (1.4%) |
| 5:30 AM to 5:59 AM | 348 (7.0%) | 181 (3.3%) |
| 6:00 AM to 6:29 AM | 103 (2.1%) | 66 (1.2%) |
| 6:30 AM to 6:59 AM | 557 (11.3%) | 437 (8.0%) |
| 7:00 AM to 7:29 AM | 528 (10.7%) | 502 (9.2%) |
| 7:30 AM to 7:59 AM | 745 (15.1%) | 876 (16.0%) |
| 8:00 AM to 8:29 AM | 358 (7.2%) | 525 (9.6%) |
| 8:30 AM to 8:59 AM | 277 (5.6%) | 349 (6.4%) |
| 9:00 AM to 9:59 AM | 410 (8.3%) | 655 (12.0%) |
| 10:00 AM to 10:59 AM | 358 (7.2%) | 344 (6.3%) |
| 11:00 AM to 11:59 AM | 99 (2.0%) | 88 (1.6%) |
| 12:00 PM to 3:59 PM | 534 (10.8%) | 694 (12.7%) |
| 4:00 PM to 11:59 PM | 282 (5.7%) | 523 (9.6%) |
| Total | 4,940 (100.0%) | 5,461 (100.0%) |
Housing Occupancy in Marquette
Occupancy by Ownership in Marquette
Of the total 8,420 dwellings in Marquette, owner-occupied units account for 4,020 (47.7%), while renter-occupied units make up 4,400 (52.3%).
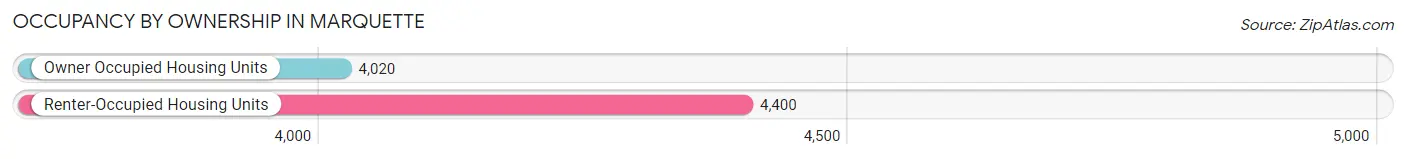
| Occupancy | # Housing Units | % Housing Units |
| Owner Occupied Housing Units | 4,020 | 47.7% |
| Renter-Occupied Housing Units | 4,400 | 52.3% |
| Total Occupied Housing Units | 8,420 | 100.0% |
Occupancy by Household Size in Marquette
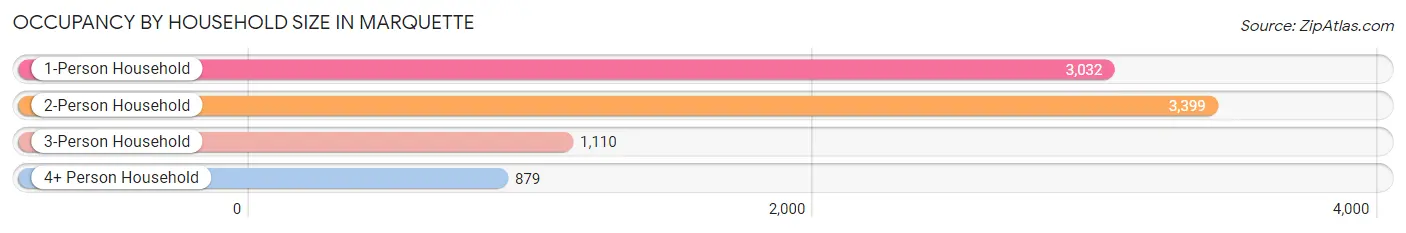
| Household Size | # Housing Units | % Housing Units |
| 1-Person Household | 3,032 | 36.0% |
| 2-Person Household | 3,399 | 40.4% |
| 3-Person Household | 1,110 | 13.2% |
| 4+ Person Household | 879 | 10.4% |
| Total Housing Units | 8,420 | 100.0% |
Occupancy by Ownership by Household Size in Marquette
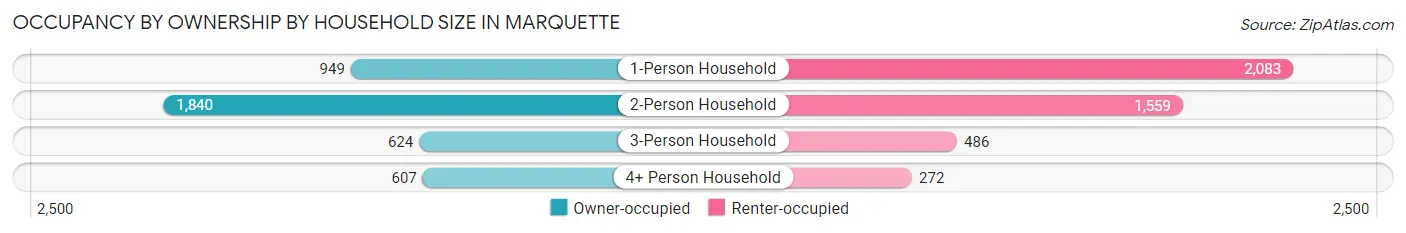
| Household Size | Owner-occupied | Renter-occupied |
| 1-Person Household | 949 (31.3%) | 2,083 (68.7%) |
| 2-Person Household | 1,840 (54.1%) | 1,559 (45.9%) |
| 3-Person Household | 624 (56.2%) | 486 (43.8%) |
| 4+ Person Household | 607 (69.1%) | 272 (30.9%) |
| Total Housing Units | 4,020 (47.7%) | 4,400 (52.3%) |
Occupancy by Educational Attainment in Marquette
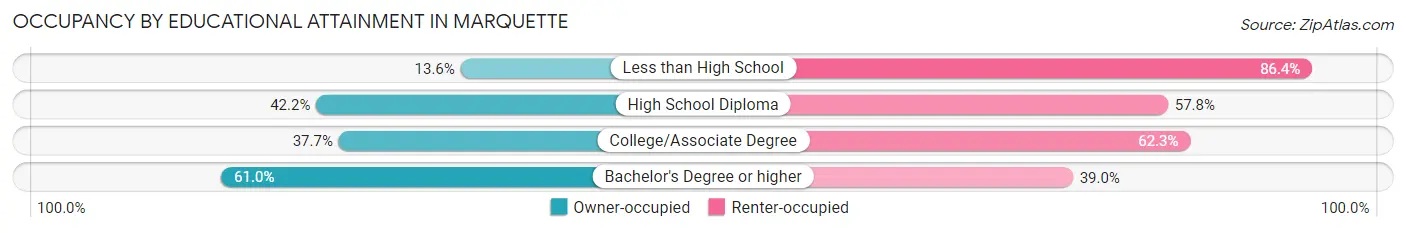
| Household Size | Owner-occupied | Renter-occupied |
| Less than High School | 40 (13.6%) | 255 (86.4%) |
| High School Diploma | 564 (42.2%) | 773 (57.8%) |
| College/Associate Degree | 1,177 (37.7%) | 1,943 (62.3%) |
| Bachelor's Degree or higher | 2,239 (61.0%) | 1,429 (39.0%) |
Occupancy by Age of Householder in Marquette
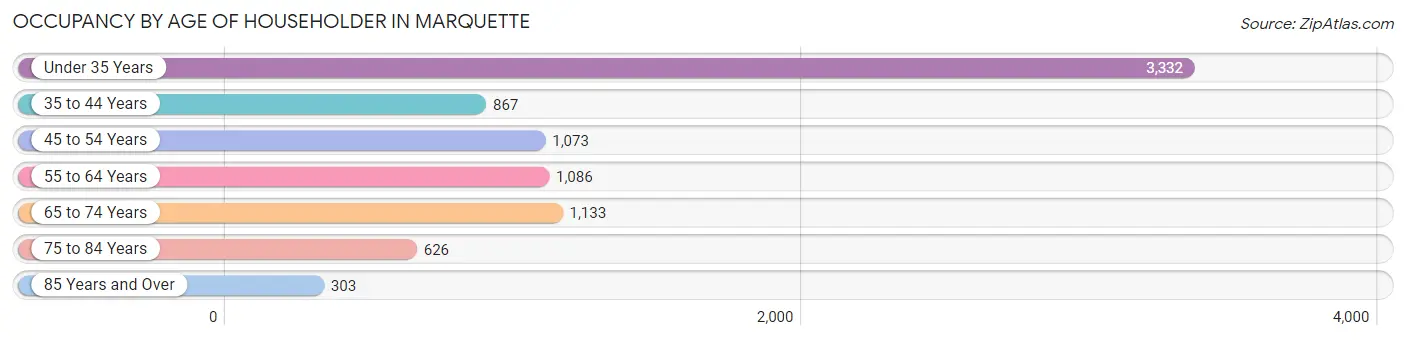
| Age Bracket | # Households | % Households |
| Under 35 Years | 3,332 | 39.6% |
| 35 to 44 Years | 867 | 10.3% |
| 45 to 54 Years | 1,073 | 12.7% |
| 55 to 64 Years | 1,086 | 12.9% |
| 65 to 74 Years | 1,133 | 13.5% |
| 75 to 84 Years | 626 | 7.4% |
| 85 Years and Over | 303 | 3.6% |
| Total | 8,420 | 100.0% |
Housing Finances in Marquette
Median Income by Occupancy in Marquette
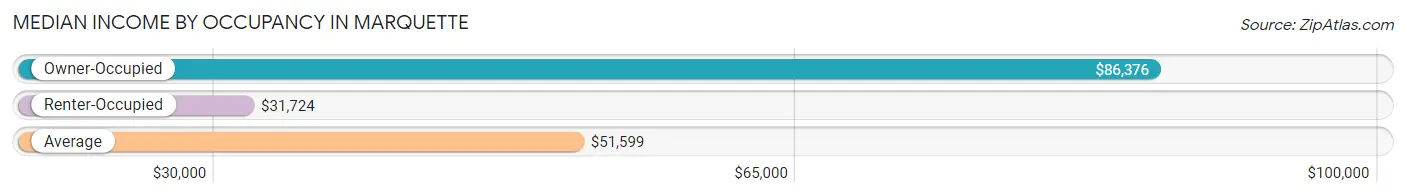
| Occupancy Type | # Households | Median Income |
| Owner-Occupied | 4,020 (47.7%) | $86,376 |
| Renter-Occupied | 4,400 (52.3%) | $31,724 |
| Average | 8,420 (100.0%) | $51,599 |
Occupancy by Householder Income Bracket in Marquette
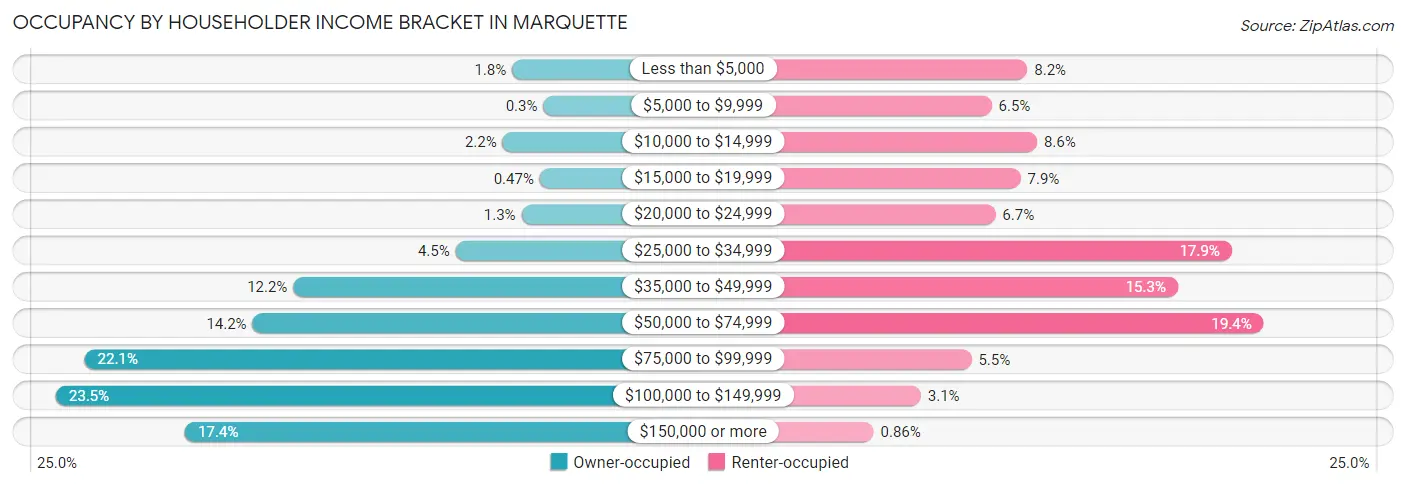
| Income Bracket | Owner-occupied | Renter-occupied |
| Less than $5,000 | 72 (1.8%) | 360 (8.2%) |
| $5,000 to $9,999 | 12 (0.3%) | 285 (6.5%) |
| $10,000 to $14,999 | 90 (2.2%) | 380 (8.6%) |
| $15,000 to $19,999 | 19 (0.5%) | 346 (7.9%) |
| $20,000 to $24,999 | 54 (1.3%) | 293 (6.7%) |
| $25,000 to $34,999 | 180 (4.5%) | 788 (17.9%) |
| $35,000 to $49,999 | 491 (12.2%) | 675 (15.3%) |
| $50,000 to $74,999 | 569 (14.1%) | 855 (19.4%) |
| $75,000 to $99,999 | 890 (22.1%) | 243 (5.5%) |
| $100,000 to $149,999 | 945 (23.5%) | 137 (3.1%) |
| $150,000 or more | 698 (17.4%) | 38 (0.9%) |
| Total | 4,020 (100.0%) | 4,400 (100.0%) |
Monthly Housing Cost Tiers in Marquette
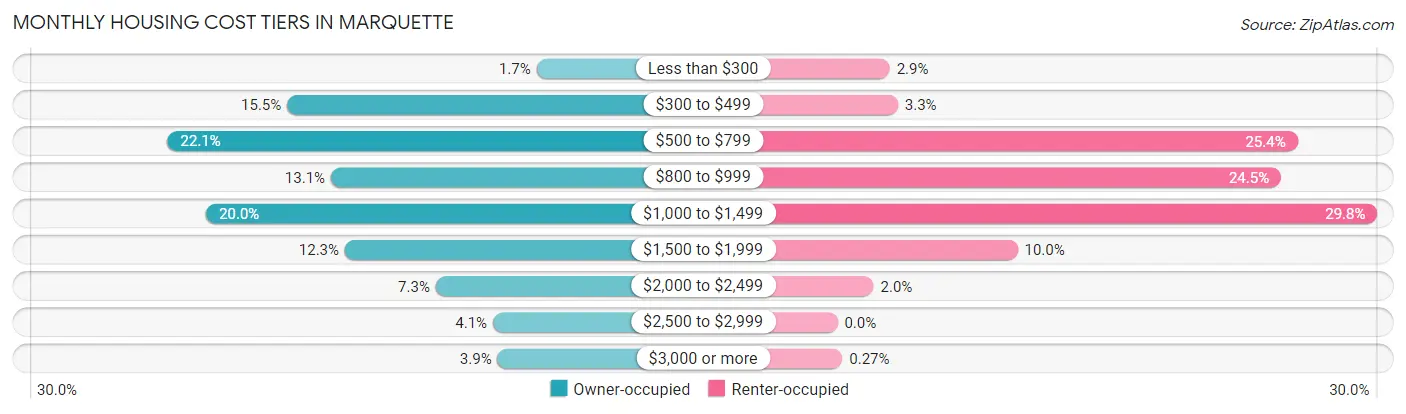
| Monthly Cost | Owner-occupied | Renter-occupied |
| Less than $300 | 69 (1.7%) | 127 (2.9%) |
| $300 to $499 | 623 (15.5%) | 147 (3.3%) |
| $500 to $799 | 889 (22.1%) | 1,118 (25.4%) |
| $800 to $999 | 526 (13.1%) | 1,078 (24.5%) |
| $1,000 to $1,499 | 803 (20.0%) | 1,312 (29.8%) |
| $1,500 to $1,999 | 495 (12.3%) | 438 (10.0%) |
| $2,000 to $2,499 | 293 (7.3%) | 88 (2.0%) |
| $2,500 to $2,999 | 166 (4.1%) | 0 (0.0%) |
| $3,000 or more | 156 (3.9%) | 12 (0.3%) |
| Total | 4,020 (100.0%) | 4,400 (100.0%) |
Physical Housing Characteristics in Marquette
Housing Structures in Marquette
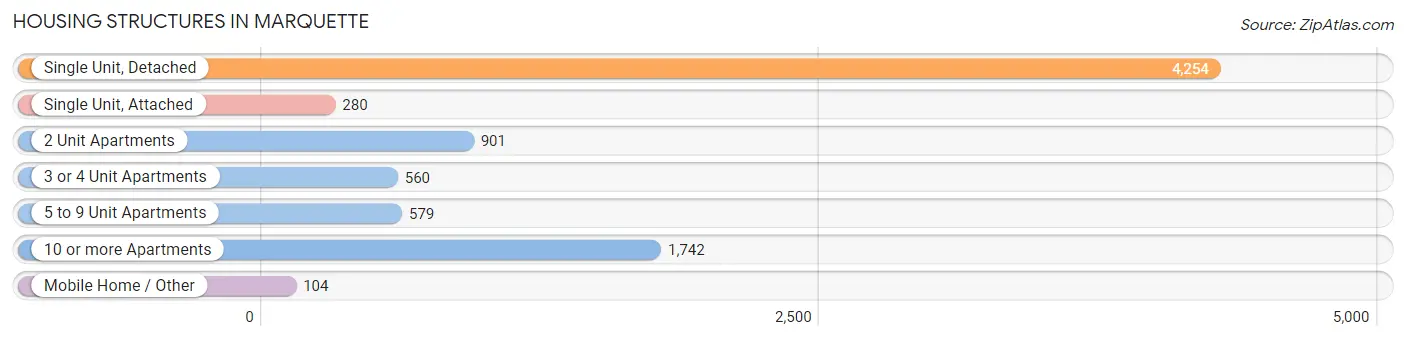
| Structure Type | # Housing Units | % Housing Units |
| Single Unit, Detached | 4,254 | 50.5% |
| Single Unit, Attached | 280 | 3.3% |
| 2 Unit Apartments | 901 | 10.7% |
| 3 or 4 Unit Apartments | 560 | 6.7% |
| 5 to 9 Unit Apartments | 579 | 6.9% |
| 10 or more Apartments | 1,742 | 20.7% |
| Mobile Home / Other | 104 | 1.2% |
| Total | 8,420 | 100.0% |
Housing Structures by Occupancy in Marquette
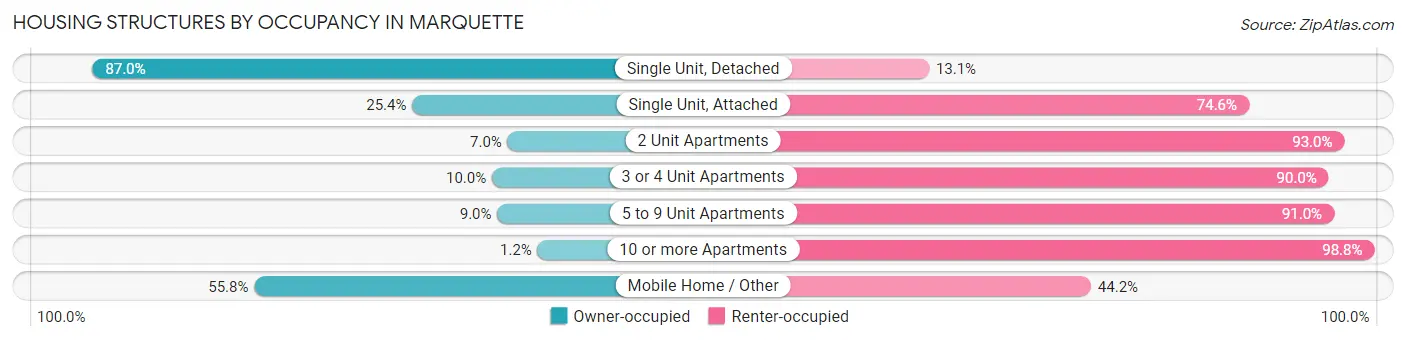
| Structure Type | Owner-occupied | Renter-occupied |
| Single Unit, Detached | 3,699 (87.0%) | 555 (13.1%) |
| Single Unit, Attached | 71 (25.4%) | 209 (74.6%) |
| 2 Unit Apartments | 63 (7.0%) | 838 (93.0%) |
| 3 or 4 Unit Apartments | 56 (10.0%) | 504 (90.0%) |
| 5 to 9 Unit Apartments | 52 (9.0%) | 527 (91.0%) |
| 10 or more Apartments | 21 (1.2%) | 1,721 (98.8%) |
| Mobile Home / Other | 58 (55.8%) | 46 (44.2%) |
| Total | 4,020 (47.7%) | 4,400 (52.3%) |
Housing Structures by Number of Rooms in Marquette
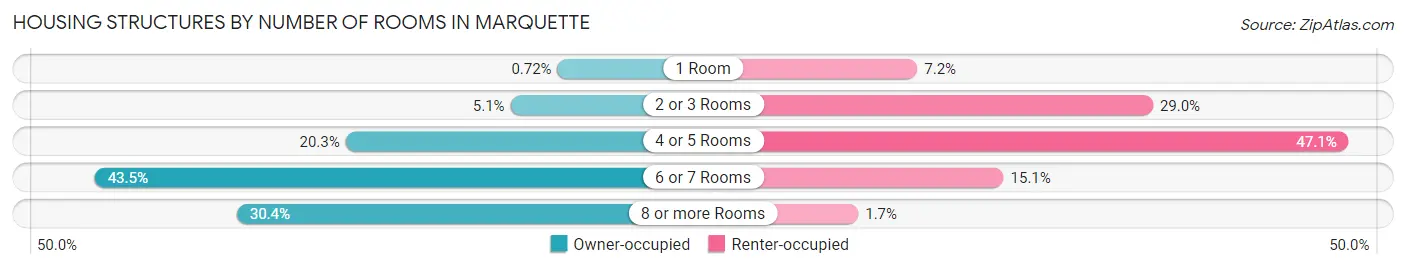
| Number of Rooms | Owner-occupied | Renter-occupied |
| 1 Room | 29 (0.7%) | 315 (7.2%) |
| 2 or 3 Rooms | 204 (5.1%) | 1,274 (28.9%) |
| 4 or 5 Rooms | 817 (20.3%) | 2,070 (47.0%) |
| 6 or 7 Rooms | 1,749 (43.5%) | 666 (15.1%) |
| 8 or more Rooms | 1,221 (30.4%) | 75 (1.7%) |
| Total | 4,020 (100.0%) | 4,400 (100.0%) |
Housing Structure by Heating Type in Marquette
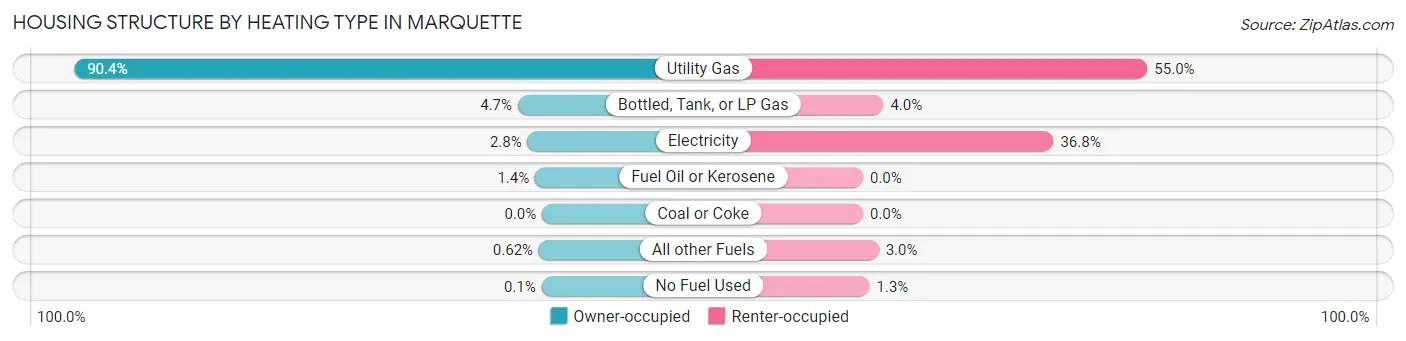
| Heating Type | Owner-occupied | Renter-occupied |
| Utility Gas | 3,634 (90.4%) | 2,418 (54.9%) |
| Bottled, Tank, or LP Gas | 189 (4.7%) | 174 (4.0%) |
| Electricity | 113 (2.8%) | 1,619 (36.8%) |
| Fuel Oil or Kerosene | 55 (1.4%) | 0 (0.0%) |
| Coal or Coke | 0 (0.0%) | 0 (0.0%) |
| All other Fuels | 25 (0.6%) | 133 (3.0%) |
| No Fuel Used | 4 (0.1%) | 56 (1.3%) |
| Total | 4,020 (100.0%) | 4,400 (100.0%) |
Household Vehicle Usage in Marquette
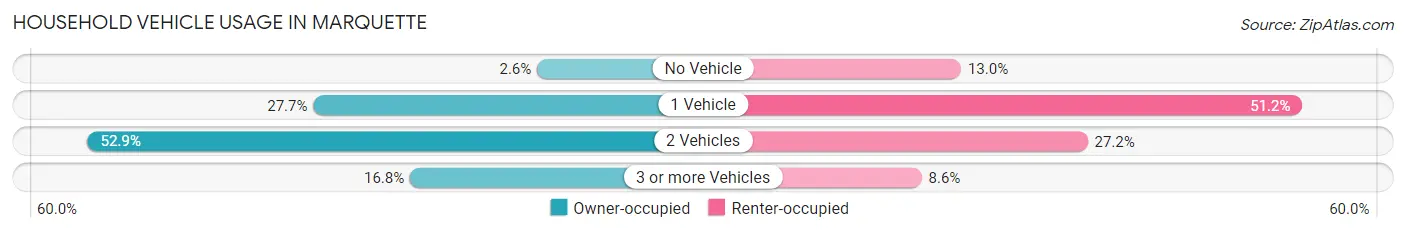
| Vehicles per Household | Owner-occupied | Renter-occupied |
| No Vehicle | 104 (2.6%) | 572 (13.0%) |
| 1 Vehicle | 1,112 (27.7%) | 2,254 (51.2%) |
| 2 Vehicles | 2,128 (52.9%) | 1,196 (27.2%) |
| 3 or more Vehicles | 676 (16.8%) | 378 (8.6%) |
| Total | 4,020 (100.0%) | 4,400 (100.0%) |
Real Estate & Mortgages in Marquette
Real Estate and Mortgage Overview in Marquette
| Characteristic | Without Mortgage | With Mortgage |
| Housing Units | 1,839 | 2,181 |
| Median Property Value | $218,100 | $247,400 |
| Median Household Income | $75,870 | $480 |
| Monthly Housing Costs | $560 | $156 |
| Real Estate Taxes | $2,824 | $39 |
Property Value by Mortgage Status in Marquette
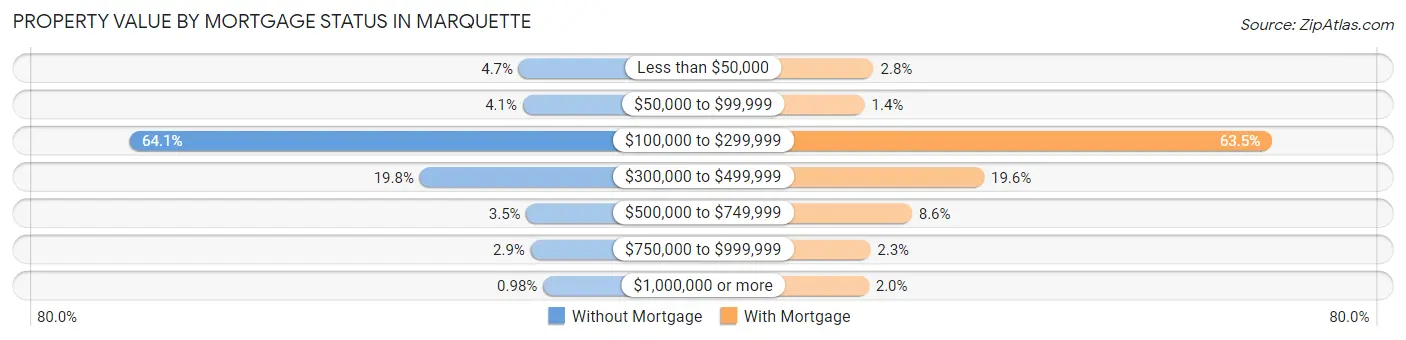
| Property Value | Without Mortgage | With Mortgage |
| Less than $50,000 | 86 (4.7%) | 60 (2.8%) |
| $50,000 to $99,999 | 75 (4.1%) | 30 (1.4%) |
| $100,000 to $299,999 | 1,178 (64.1%) | 1,384 (63.5%) |
| $300,000 to $499,999 | 364 (19.8%) | 427 (19.6%) |
| $500,000 to $749,999 | 65 (3.5%) | 187 (8.6%) |
| $750,000 to $999,999 | 53 (2.9%) | 49 (2.2%) |
| $1,000,000 or more | 18 (1.0%) | 44 (2.0%) |
| Total | 1,839 (100.0%) | 2,181 (100.0%) |
Household Income by Mortgage Status in Marquette
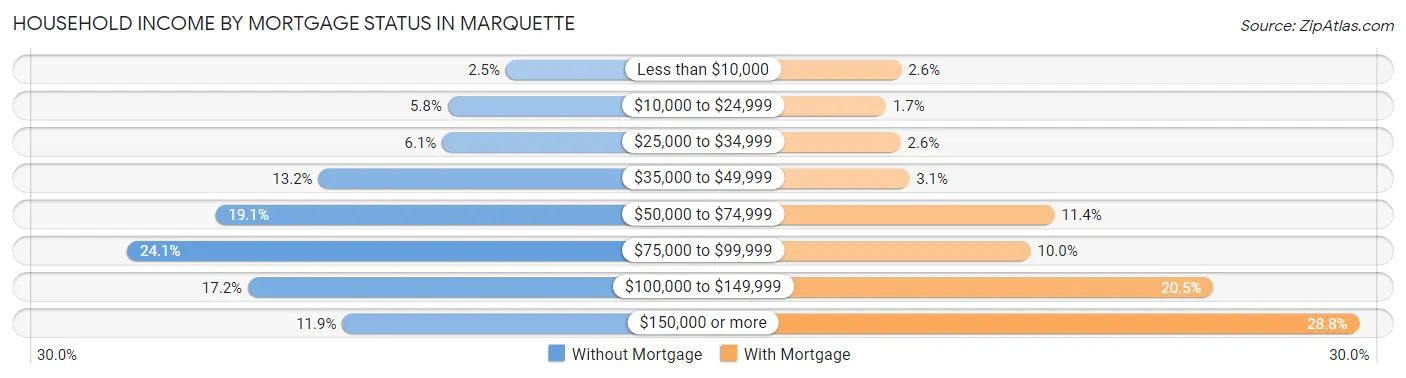
| Household Income | Without Mortgage | With Mortgage |
| Less than $10,000 | 46 (2.5%) | 57 (2.6%) |
| $10,000 to $24,999 | 107 (5.8%) | 38 (1.7%) |
| $25,000 to $34,999 | 113 (6.1%) | 56 (2.6%) |
| $35,000 to $49,999 | 243 (13.2%) | 67 (3.1%) |
| $50,000 to $74,999 | 351 (19.1%) | 248 (11.4%) |
| $75,000 to $99,999 | 444 (24.1%) | 218 (10.0%) |
| $100,000 to $149,999 | 317 (17.2%) | 446 (20.4%) |
| $150,000 or more | 218 (11.8%) | 628 (28.8%) |
| Total | 1,839 (100.0%) | 2,181 (100.0%) |
Property Value to Household Income Ratio in Marquette
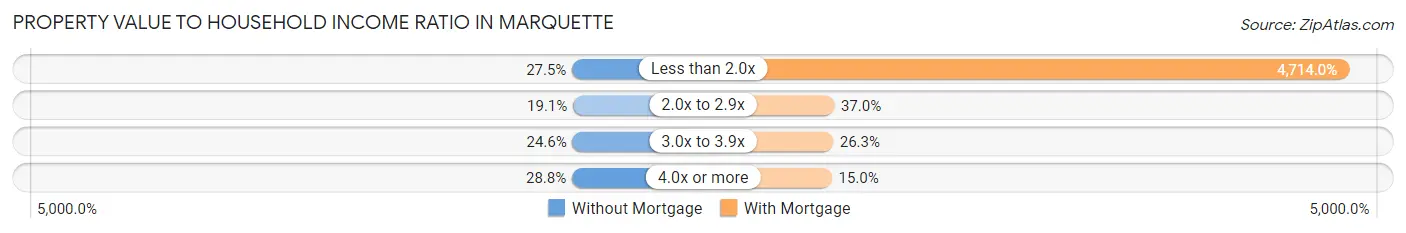
| Value-to-Income Ratio | Without Mortgage | With Mortgage |
| Less than 2.0x | 505 (27.5%) | 102,813 (4,714.0%) |
| 2.0x to 2.9x | 351 (19.1%) | 806 (37.0%) |
| 3.0x to 3.9x | 453 (24.6%) | 574 (26.3%) |
| 4.0x or more | 530 (28.8%) | 328 (15.0%) |
| Total | 1,839 (100.0%) | 2,181 (100.0%) |
Real Estate Taxes by Mortgage Status in Marquette
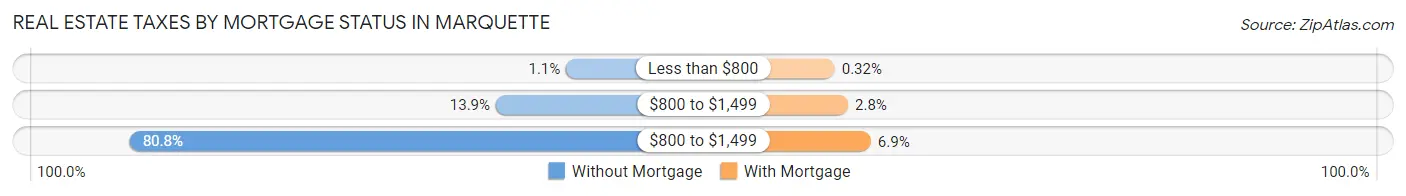
| Property Taxes | Without Mortgage | With Mortgage |
| Less than $800 | 20 (1.1%) | 7 (0.3%) |
| $800 to $1,499 | 256 (13.9%) | 60 (2.8%) |
| $800 to $1,499 | 1,486 (80.8%) | 151 (6.9%) |
| Total | 1,839 (100.0%) | 2,181 (100.0%) |
Health & Disability in Marquette
Health Insurance Coverage by Age in Marquette
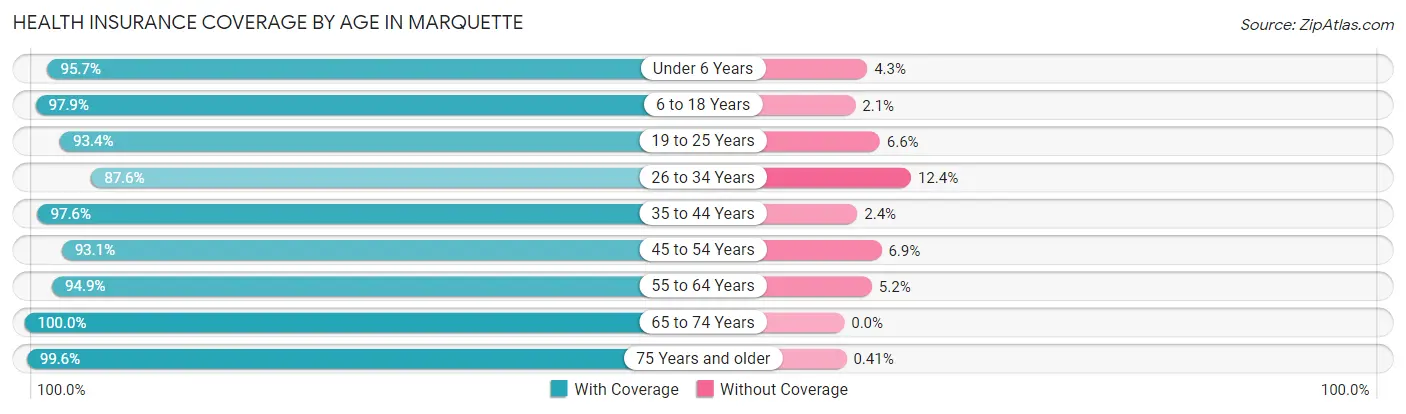
| Age Bracket | With Coverage | Without Coverage |
| Under 6 Years | 761 (95.7%) | 34 (4.3%) |
| 6 to 18 Years | 2,045 (97.9%) | 43 (2.1%) |
| 19 to 25 Years | 5,352 (93.4%) | 380 (6.6%) |
| 26 to 34 Years | 2,147 (87.6%) | 305 (12.4%) |
| 35 to 44 Years | 1,567 (97.6%) | 39 (2.4%) |
| 45 to 54 Years | 1,812 (93.1%) | 135 (6.9%) |
| 55 to 64 Years | 1,750 (94.9%) | 95 (5.1%) |
| 65 to 74 Years | 1,700 (100.0%) | 0 (0.0%) |
| 75 Years and older | 1,229 (99.6%) | 5 (0.4%) |
| Total | 18,363 (94.7%) | 1,036 (5.3%) |
Health Insurance Coverage by Citizenship Status in Marquette
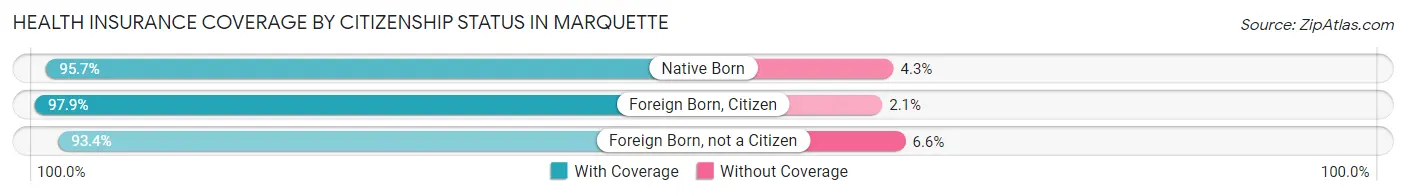
| Citizenship Status | With Coverage | Without Coverage |
| Native Born | 761 (95.7%) | 34 (4.3%) |
| Foreign Born, Citizen | 2,045 (97.9%) | 43 (2.1%) |
| Foreign Born, not a Citizen | 5,352 (93.4%) | 380 (6.6%) |
Health Insurance Coverage by Household Income in Marquette
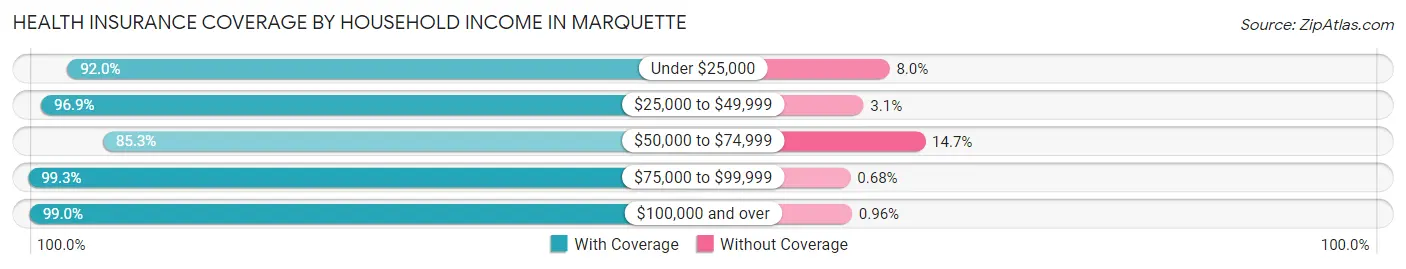
| Household Income | With Coverage | Without Coverage |
| Under $25,000 | 2,705 (92.0%) | 235 (8.0%) |
| $25,000 to $49,999 | 3,550 (96.9%) | 114 (3.1%) |
| $50,000 to $74,999 | 2,907 (85.3%) | 500 (14.7%) |
| $75,000 to $99,999 | 2,469 (99.3%) | 17 (0.7%) |
| $100,000 and over | 5,033 (99.0%) | 49 (1.0%) |
Public vs Private Health Insurance Coverage by Age in Marquette
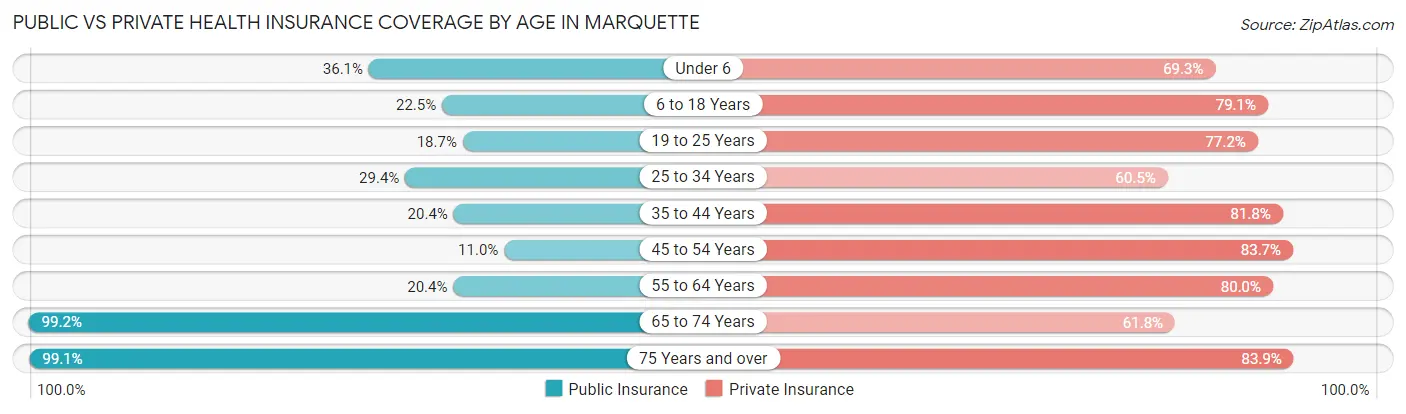
| Age Bracket | Public Insurance | Private Insurance |
| Under 6 | 287 (36.1%) | 551 (69.3%) |
| 6 to 18 Years | 470 (22.5%) | 1,651 (79.1%) |
| 19 to 25 Years | 1,071 (18.7%) | 4,424 (77.2%) |
| 25 to 34 Years | 720 (29.4%) | 1,483 (60.5%) |
| 35 to 44 Years | 327 (20.4%) | 1,314 (81.8%) |
| 45 to 54 Years | 214 (11.0%) | 1,630 (83.7%) |
| 55 to 64 Years | 377 (20.4%) | 1,476 (80.0%) |
| 65 to 74 Years | 1,687 (99.2%) | 1,051 (61.8%) |
| 75 Years and over | 1,223 (99.1%) | 1,035 (83.9%) |
| Total | 6,376 (32.9%) | 14,615 (75.3%) |
Disability Status by Sex by Age in Marquette
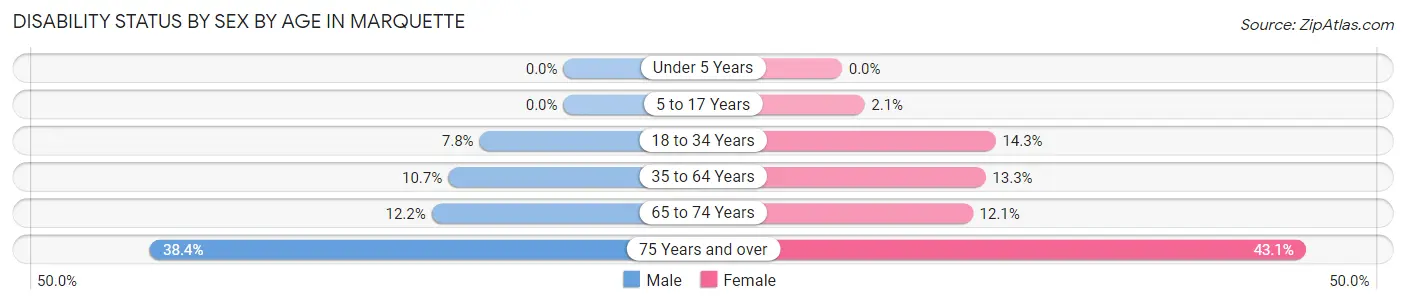
| Age Bracket | Male | Female |
| Under 5 Years | 0 (0.0%) | 0 (0.0%) |
| 5 to 17 Years | 0 (0.0%) | 18 (2.1%) |
| 18 to 34 Years | 334 (7.8%) | 654 (14.3%) |
| 35 to 64 Years | 299 (10.7%) | 347 (13.3%) |
| 65 to 74 Years | 90 (12.2%) | 117 (12.1%) |
| 75 Years and over | 214 (38.4%) | 291 (43.0%) |
Disability Class by Sex by Age in Marquette
Disability Class: Hearing Difficulty
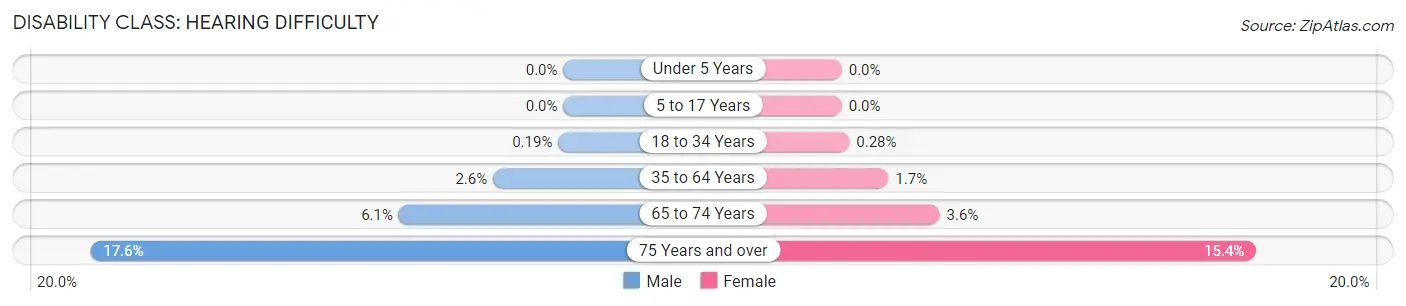
| Age Bracket | Male | Female |
| Under 5 Years | 0 (0.0%) | 0 (0.0%) |
| 5 to 17 Years | 0 (0.0%) | 0 (0.0%) |
| 18 to 34 Years | 8 (0.2%) | 13 (0.3%) |
| 35 to 64 Years | 73 (2.6%) | 45 (1.7%) |
| 65 to 74 Years | 45 (6.1%) | 35 (3.6%) |
| 75 Years and over | 98 (17.6%) | 104 (15.4%) |
Disability Class: Vision Difficulty
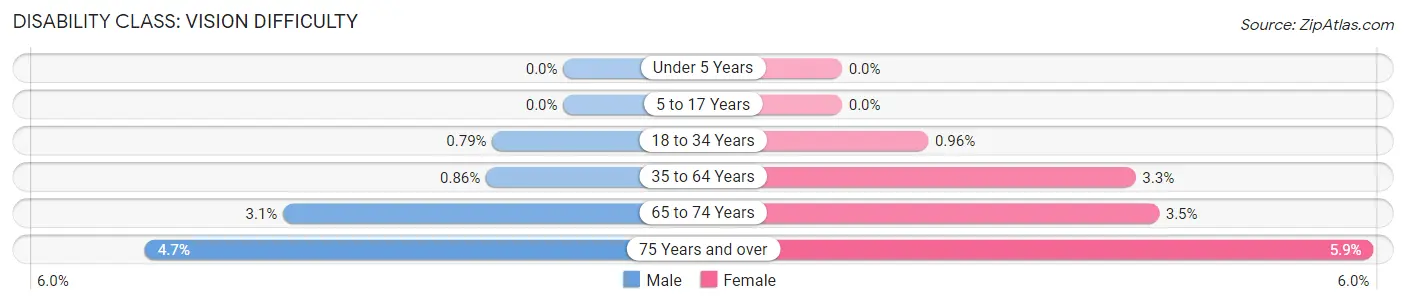
| Age Bracket | Male | Female |
| Under 5 Years | 0 (0.0%) | 0 (0.0%) |
| 5 to 17 Years | 0 (0.0%) | 0 (0.0%) |
| 18 to 34 Years | 34 (0.8%) | 44 (1.0%) |
| 35 to 64 Years | 24 (0.9%) | 85 (3.3%) |
| 65 to 74 Years | 23 (3.1%) | 34 (3.5%) |
| 75 Years and over | 26 (4.7%) | 40 (5.9%) |
Disability Class: Cognitive Difficulty
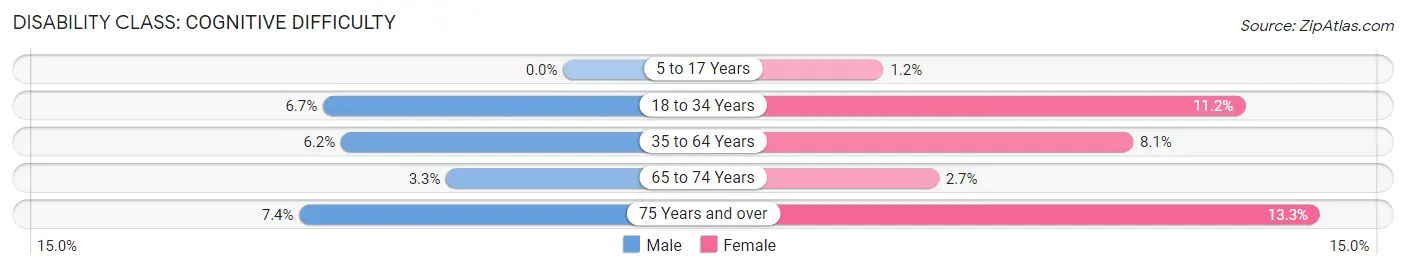
| Age Bracket | Male | Female |
| 5 to 17 Years | 0 (0.0%) | 10 (1.2%) |
| 18 to 34 Years | 287 (6.7%) | 515 (11.2%) |
| 35 to 64 Years | 173 (6.2%) | 211 (8.1%) |
| 65 to 74 Years | 24 (3.3%) | 26 (2.7%) |
| 75 Years and over | 41 (7.3%) | 90 (13.3%) |
Disability Class: Ambulatory Difficulty
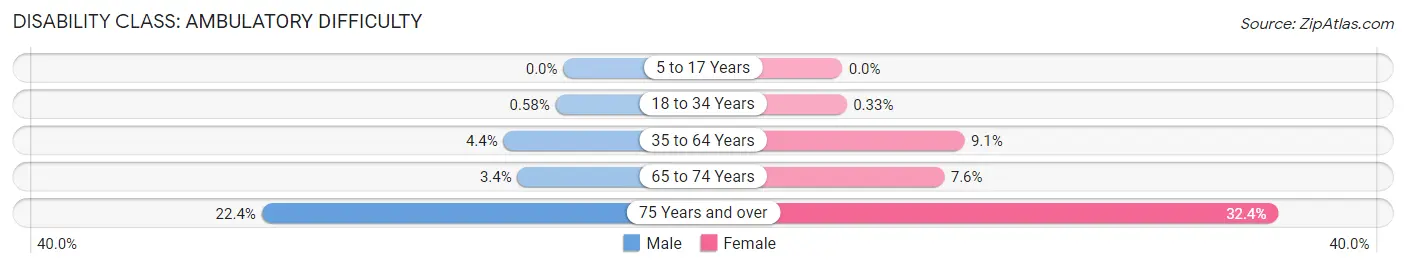
| Age Bracket | Male | Female |
| 5 to 17 Years | 0 (0.0%) | 0 (0.0%) |
| 18 to 34 Years | 25 (0.6%) | 15 (0.3%) |
| 35 to 64 Years | 124 (4.4%) | 236 (9.1%) |
| 65 to 74 Years | 25 (3.4%) | 73 (7.6%) |
| 75 Years and over | 125 (22.4%) | 219 (32.4%) |
Disability Class: Self-Care Difficulty
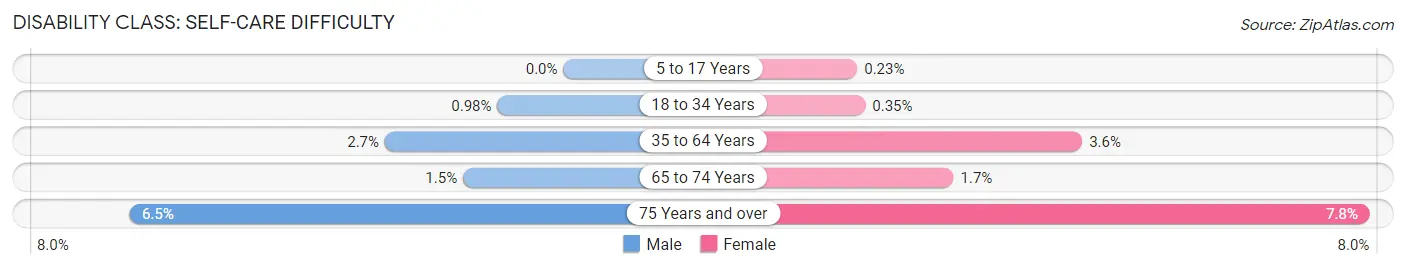
| Age Bracket | Male | Female |
| 5 to 17 Years | 0 (0.0%) | 2 (0.2%) |
| 18 to 34 Years | 42 (1.0%) | 16 (0.4%) |
| 35 to 64 Years | 74 (2.6%) | 93 (3.6%) |
| 65 to 74 Years | 11 (1.5%) | 16 (1.7%) |
| 75 Years and over | 36 (6.5%) | 53 (7.8%) |
Technology Access in Marquette
Computing Device Access in Marquette
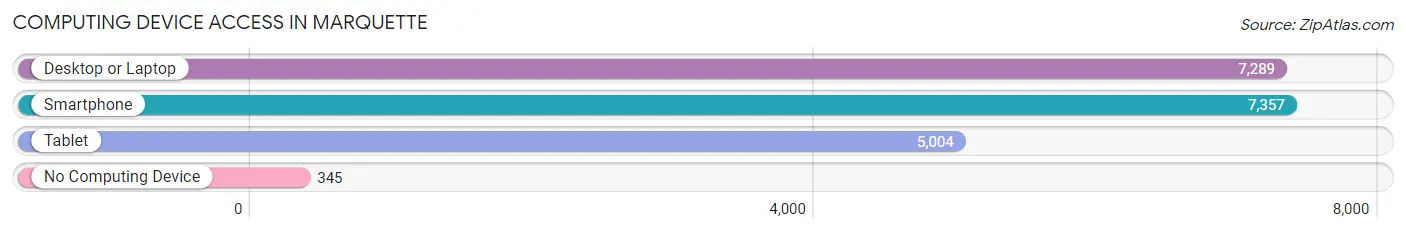
| Device Type | # Households | % Households |
| Desktop or Laptop | 7,289 | 86.6% |
| Smartphone | 7,357 | 87.4% |
| Tablet | 5,004 | 59.4% |
| No Computing Device | 345 | 4.1% |
| Total | 8,420 | 100.0% |
Internet Access in Marquette
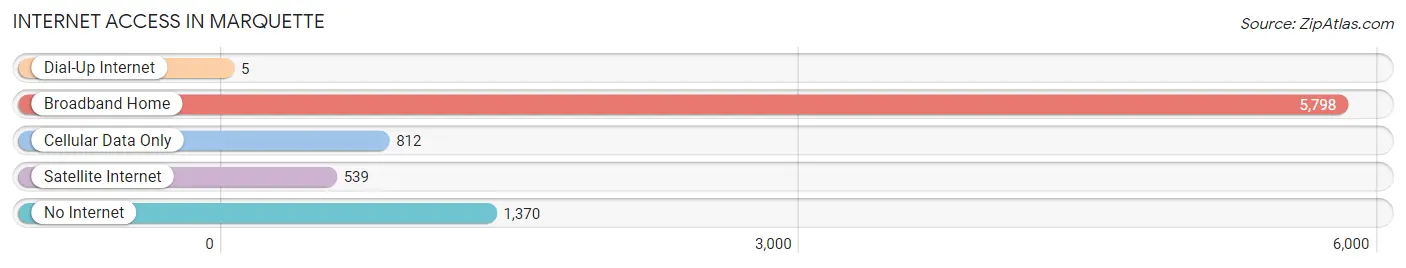
| Internet Type | # Households | % Households |
| Dial-Up Internet | 5 | 0.1% |
| Broadband Home | 5,798 | 68.9% |
| Cellular Data Only | 812 | 9.6% |
| Satellite Internet | 539 | 6.4% |
| No Internet | 1,370 | 16.3% |
| Total | 8,420 | 100.0% |
Marquette Summary
Marquette, Michigan is a city located in the Upper Peninsula of Michigan. It is the county seat of Marquette County and is the largest city in the Upper Peninsula. The city is situated on the shores of Lake Superior and is home to Northern Michigan University.
History
Marquette was founded in 1849 by Father Frederic Baraga, a Catholic missionary. He named the city after the French Jesuit missionary Jacques Marquette. The city was incorporated in 1859 and was the first city in the Upper Peninsula to be incorporated.
In the late 19th century, Marquette became a major port for the iron ore industry. The city was home to several iron ore processing plants and was the largest port on Lake Superior. The city was also home to several lumber mills and was a major hub for the lumber industry.
In the early 20th century, the city experienced a period of growth and development. The city was home to several large manufacturing plants and was a major center for the automotive industry. The city was also home to several large banks and financial institutions.
Geography
Marquette is located in the Upper Peninsula of Michigan. It is situated on the shores of Lake Superior and is bordered by the cities of Negaunee and Ishpeming. The city is located in the northern part of the state and is approximately 200 miles from the state capital of Lansing.
The city has a total area of 11.2 square miles, of which 10.9 square miles is land and 0.3 square miles is water. The city is located in a hilly region and is surrounded by forests and lakes. The city is home to several parks and recreational areas, including Presque Isle Park, which is located on the shores of Lake Superior.
Economy
Marquette has a diverse economy that is driven by several industries. The city is home to several large manufacturing plants and is a major center for the automotive industry. The city is also home to several large banks and financial institutions.
The city is also home to several large health care providers, including UP Health System-Marquette and Marquette General Hospital. The city is also home to several educational institutions, including Northern Michigan University.
Demographics
As of the 2010 census, the city had a population of 21,355. The racial makeup of the city was 90.2% White, 2.7% African American, 0.7% Native American, 2.3% Asian, 0.1% Pacific Islander, 1.7% from other races, and 2.2% from two or more races. Hispanic or Latino of any race were 4.2% of the population.
The median income for a household in the city was $37,945 and the median income for a family was $50,945. The per capita income for the city was $21,945. About 11.2% of families and 16.2% of the population were below the poverty line, including 22.2% of those under age 18 and 8.2% of those age 65 or over.
Common Questions
What is Per Capita Income in Marquette?
Per Capita income in Marquette is $30,343.
What is the Median Family Income in Marquette?
Median Family Income in Marquette is $82,083.
What is the Median Household income in Marquette?
Median Household Income in Marquette is $51,599.
What is Income or Wage Gap in Marquette?
Income or Wage Gap in Marquette is 36.1%.
Women in Marquette earn 63.9 cents for every dollar earned by a man.
What is Inequality or Gini Index in Marquette?
Inequality or Gini Index in Marquette is 0.47.
What is the Total Population of Marquette?
Total Population of Marquette is 20,673.
What is the Total Male Population of Marquette?
Total Male Population of Marquette is 10,617.
What is the Total Female Population of Marquette?
Total Female Population of Marquette is 10,056.
What is the Ratio of Males per 100 Females in Marquette?
There are 105.58 Males per 100 Females in Marquette.
What is the Ratio of Females per 100 Males in Marquette?
There are 94.72 Females per 100 Males in Marquette.
What is the Median Population Age in Marquette?
Median Population Age in Marquette is 30.2 Years.
What is the Average Family Size in Marquette
Average Family Size in Marquette is 2.6 People.
What is the Average Household Size in Marquette
Average Household Size in Marquette is 2.1 People.
How Large is the Labor Force in Marquette?
There are 12,003 People in the Labor Forcein in Marquette.
What is the Percentage of People in the Labor Force in Marquette?
64.0% of People are in the Labor Force in Marquette.
What is the Unemployment Rate in Marquette?
Unemployment Rate in Marquette is 5.9%.