Great Falls, MT Map & Demographics
Great Falls Map
Great Falls Overview
$33,437
PER CAPITA INCOME
$78,799
AVG FAMILY INCOME
$58,272
AVG HOUSEHOLD INCOME
30.5%
WAGE / INCOME GAP [ % ]
69.5¢/ $1
WAGE / INCOME GAP [ $ ]
$10,409
FAMILY INCOME DEFICIT
0.45
INEQUALITY / GINI INDEX
60,373
TOTAL POPULATION
29,876
MALE POPULATION
30,497
FEMALE POPULATION
97.96
MALES / 100 FEMALES
102.08
FEMALES / 100 MALES
38.8
MEDIAN AGE
3.0
AVG FAMILY SIZE
2.3
AVG HOUSEHOLD SIZE
30,861
LABOR FORCE [ PEOPLE ]
62.8%
PERCENT IN LABOR FORCE
3.4%
UNEMPLOYMENT RATE
Great Falls Area Codes
Income in Great Falls
Income Overview in Great Falls
Per Capita Income in Great Falls is $33,437, while median incomes of families and households are $78,799 and $58,272 respectively.
| Characteristic | Number | Measure |
| Per Capita Income | 60,373 | $33,437 |
| Median Family Income | 14,724 | $78,799 |
| Mean Family Income | 14,724 | $92,492 |
| Median Household Income | 25,720 | $58,272 |
| Mean Household Income | 25,720 | $75,826 |
| Income Deficit | 14,724 | $10,409 |
| Wage / Income Gap (%) | 60,373 | 30.45% |
| Wage / Income Gap ($) | 60,373 | 69.55¢ per $1 |
| Gini / Inequality Index | 60,373 | 0.45 |
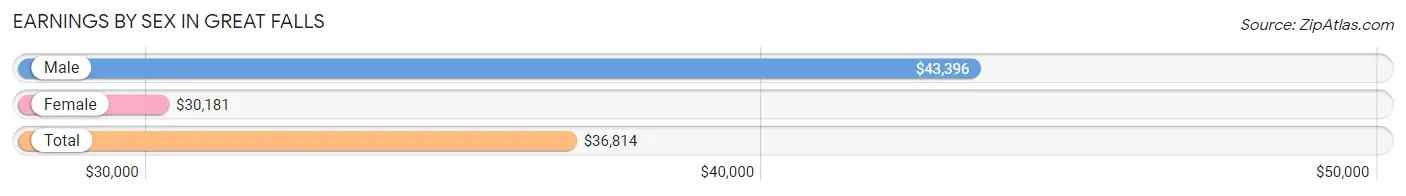
Earnings by Sex in Great Falls
Average Earnings in Great Falls are $36,814, $43,396 for men and $30,181 for women, a difference of 30.4%.
| Sex | Number | Average Earnings |
| Male | 16,465 (50.8%) | $43,396 |
| Female | 15,914 (49.1%) | $30,181 |
| Total | 32,379 (100.0%) | $36,814 |
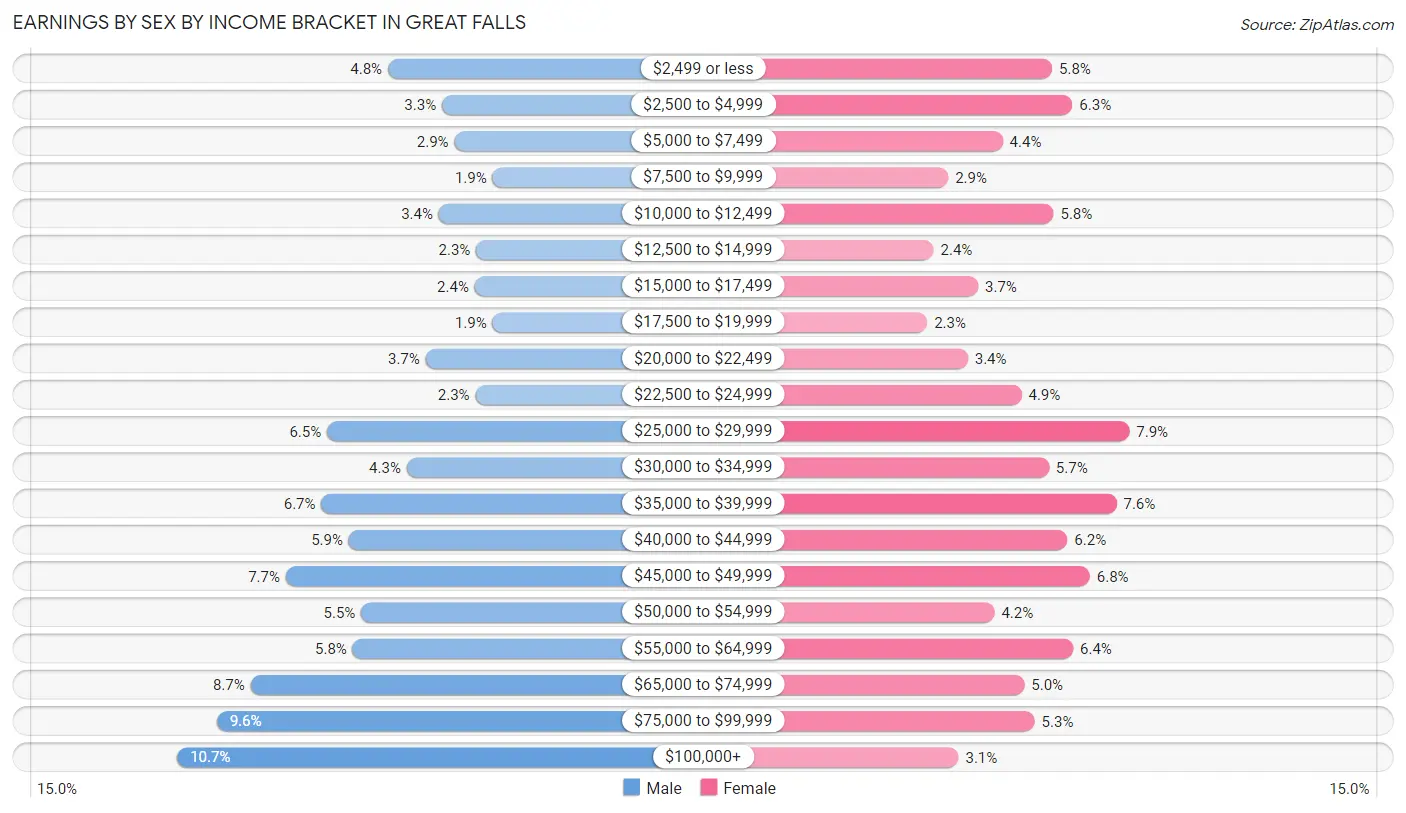
Earnings by Sex by Income Bracket in Great Falls
The most common earnings brackets in Great Falls are $100,000+ for men (1,764 | 10.7%) and $25,000 to $29,999 for women (1,264 | 7.9%).
| Income | Male | Female |
| $2,499 or less | 788 (4.8%) | 918 (5.8%) |
| $2,500 to $4,999 | 538 (3.3%) | 1,009 (6.3%) |
| $5,000 to $7,499 | 481 (2.9%) | 697 (4.4%) |
| $7,500 to $9,999 | 304 (1.8%) | 454 (2.9%) |
| $10,000 to $12,499 | 553 (3.4%) | 924 (5.8%) |
| $12,500 to $14,999 | 381 (2.3%) | 388 (2.4%) |
| $15,000 to $17,499 | 387 (2.4%) | 587 (3.7%) |
| $17,500 to $19,999 | 304 (1.8%) | 360 (2.3%) |
| $20,000 to $22,499 | 614 (3.7%) | 541 (3.4%) |
| $22,500 to $24,999 | 383 (2.3%) | 782 (4.9%) |
| $25,000 to $29,999 | 1,071 (6.5%) | 1,264 (7.9%) |
| $30,000 to $34,999 | 702 (4.3%) | 904 (5.7%) |
| $35,000 to $39,999 | 1,097 (6.7%) | 1,206 (7.6%) |
| $40,000 to $44,999 | 969 (5.9%) | 987 (6.2%) |
| $45,000 to $49,999 | 1,261 (7.7%) | 1,087 (6.8%) |
| $50,000 to $54,999 | 912 (5.5%) | 661 (4.2%) |
| $55,000 to $64,999 | 951 (5.8%) | 1,012 (6.4%) |
| $65,000 to $74,999 | 1,425 (8.6%) | 794 (5.0%) |
| $75,000 to $99,999 | 1,580 (9.6%) | 840 (5.3%) |
| $100,000+ | 1,764 (10.7%) | 499 (3.1%) |
| Total | 16,465 (100.0%) | 15,914 (100.0%) |
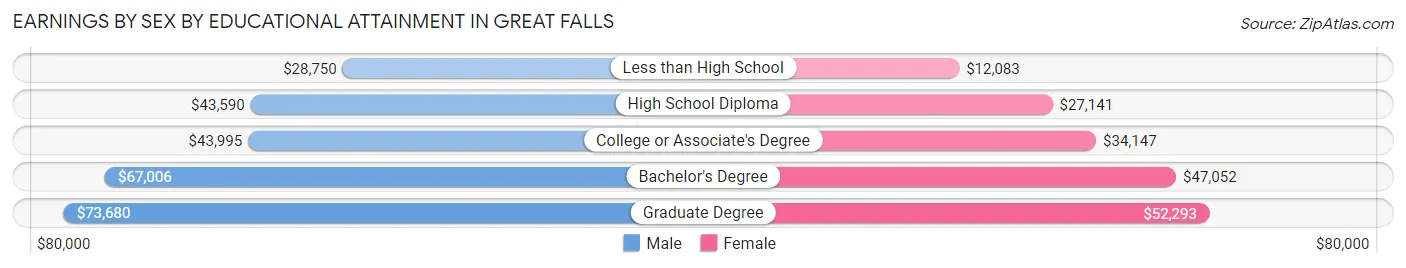
Earnings by Sex by Educational Attainment in Great Falls
Average earnings in Great Falls are $46,899 for men and $36,396 for women, a difference of 22.4%. Men with an educational attainment of graduate degree enjoy the highest average annual earnings of $73,680, while those with less than high school education earn the least with $28,750. Women with an educational attainment of graduate degree earn the most with the average annual earnings of $52,293, while those with less than high school education have the smallest earnings of $12,083.
| Educational Attainment | Male Income | Female Income |
| Less than High School | $28,750 | $12,083 |
| High School Diploma | $43,590 | $27,141 |
| College or Associate's Degree | $43,995 | $34,147 |
| Bachelor's Degree | $67,006 | $47,052 |
| Graduate Degree | $73,680 | $52,293 |
| Total | $46,899 | $36,396 |
Family Income in Great Falls
Family Income Brackets in Great Falls
According to the Great Falls family income data, there are 3,048 families falling into the $100,000 to $149,999 income range, which is the most common income bracket and makes up 20.7% of all families. Conversely, the $10,000 to $14,999 income bracket is the least frequent group with only 339 families (2.3%) belonging to this category.
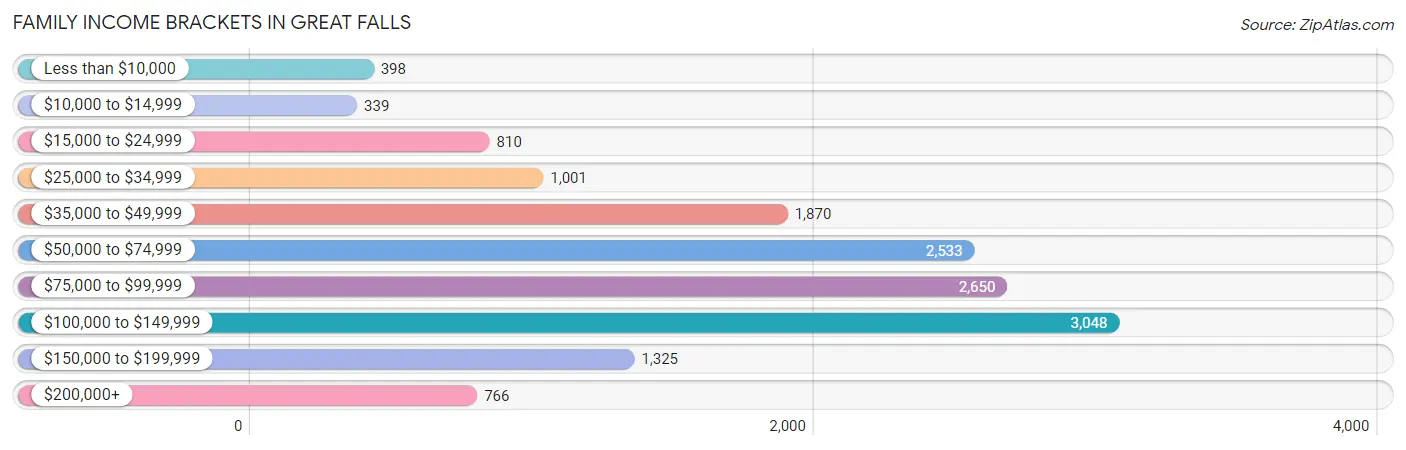
| Income Bracket | # Families | % Families |
| Less than $10,000 | 398 | 2.7% |
| $10,000 to $14,999 | 339 | 2.3% |
| $15,000 to $24,999 | 810 | 5.5% |
| $25,000 to $34,999 | 1,001 | 6.8% |
| $35,000 to $49,999 | 1,870 | 12.7% |
| $50,000 to $74,999 | 2,533 | 17.2% |
| $75,000 to $99,999 | 2,650 | 18.0% |
| $100,000 to $149,999 | 3,048 | 20.7% |
| $150,000 to $199,999 | 1,325 | 9.0% |
| $200,000+ | 766 | 5.2% |
Family Income by Famaliy Size in Great Falls
5-person families (609 | 4.1%) account for the highest median family income in Great Falls with $112,422 per family, while 2-person families (8,415 | 57.2%) have the highest median income of $37,816 per family member.
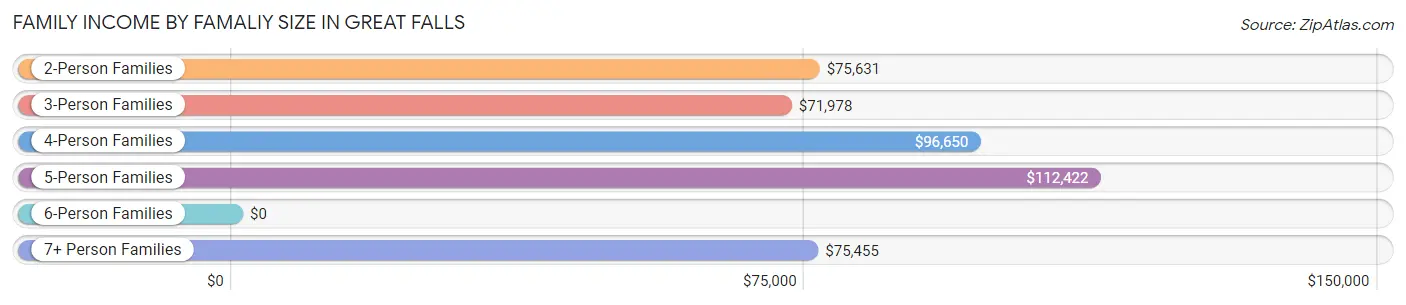
| Income Bracket | # Families | Median Income |
| 2-Person Families | 8,415 (57.2%) | $75,631 |
| 3-Person Families | 3,161 (21.5%) | $71,978 |
| 4-Person Families | 1,971 (13.4%) | $96,650 |
| 5-Person Families | 609 (4.1%) | $112,422 |
| 6-Person Families | 328 (2.2%) | $0 |
| 7+ Person Families | 240 (1.6%) | $75,455 |
| Total | 14,724 (100.0%) | $78,799 |
Family Income by Number of Earners in Great Falls
The median family income in Great Falls is $78,799, with families comprising 3+ earners (1,097) having the highest median family income of $137,614, while families with no earners (2,327) have the lowest median family income of $48,618, accounting for 7.4% and 15.8% of families, respectively.
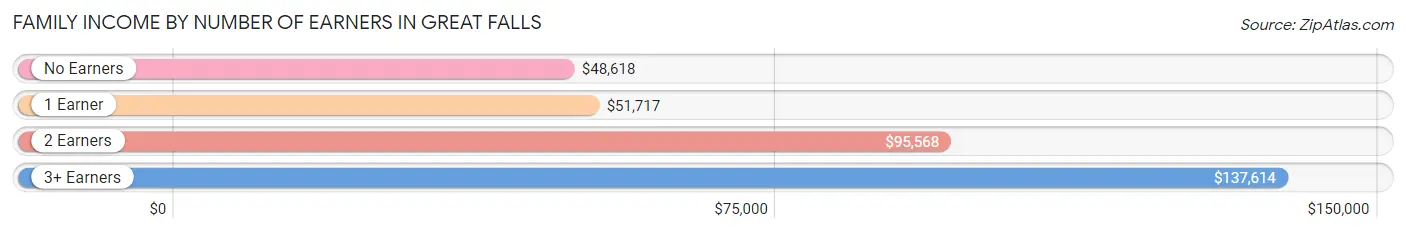
| Number of Earners | # Families | Median Income |
| No Earners | 2,327 (15.8%) | $48,618 |
| 1 Earner | 4,873 (33.1%) | $51,717 |
| 2 Earners | 6,427 (43.6%) | $95,568 |
| 3+ Earners | 1,097 (7.4%) | $137,614 |
| Total | 14,724 (100.0%) | $78,799 |
Household Income in Great Falls
Household Income Brackets in Great Falls
With 4,861 households falling in the category, the $50,000 to $74,999 income range is the most frequent in Great Falls, accounting for 18.9% of all households. In contrast, only 977 households (3.8%) fall into the $200,000+ income bracket, making it the least populous group.
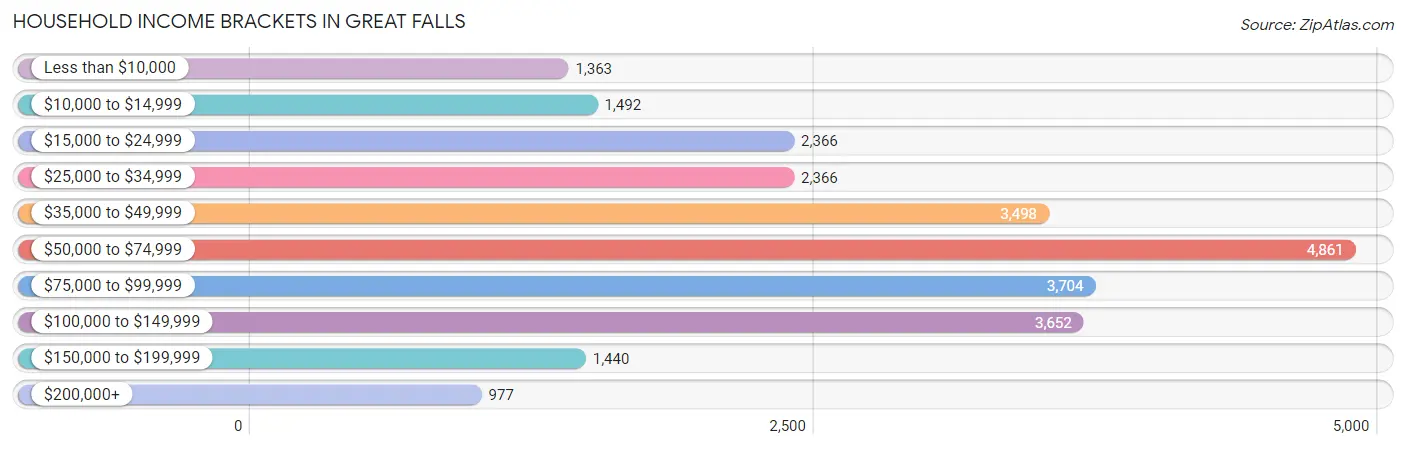
| Income Bracket | # Households | % Households |
| Less than $10,000 | 1,363 | 5.3% |
| $10,000 to $14,999 | 1,492 | 5.8% |
| $15,000 to $24,999 | 2,366 | 9.2% |
| $25,000 to $34,999 | 2,366 | 9.2% |
| $35,000 to $49,999 | 3,498 | 13.6% |
| $50,000 to $74,999 | 4,861 | 18.9% |
| $75,000 to $99,999 | 3,704 | 14.4% |
| $100,000 to $149,999 | 3,652 | 14.2% |
| $150,000 to $199,999 | 1,440 | 5.6% |
| $200,000+ | 977 | 3.8% |
Household Income by Householder Age in Great Falls
The median household income in Great Falls is $58,272, with the highest median household income of $69,069 found in the 45 to 64 years age bracket for the primary householder. A total of 8,030 households (31.2%) fall into this category. Meanwhile, the 15 to 24 years age bracket for the primary householder has the lowest median household income of $42,388, with 1,247 households (4.9%) in this group.
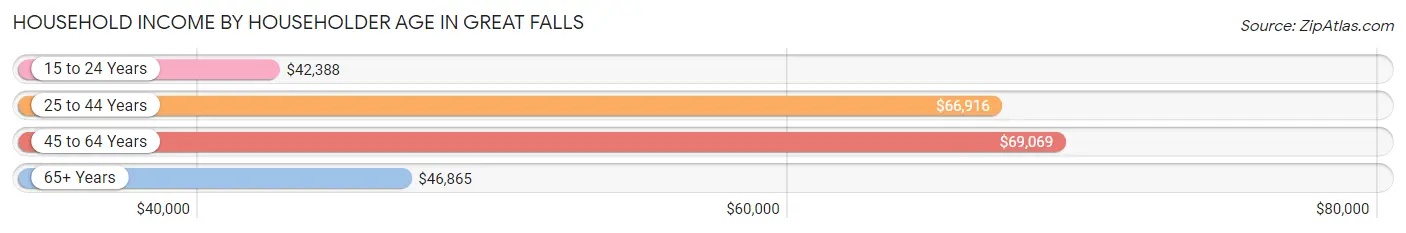
| Income Bracket | # Households | Median Income |
| 15 to 24 Years | 1,247 (4.9%) | $42,388 |
| 25 to 44 Years | 8,369 (32.5%) | $66,916 |
| 45 to 64 Years | 8,030 (31.2%) | $69,069 |
| 65+ Years | 8,074 (31.4%) | $46,865 |
| Total | 25,720 (100.0%) | $58,272 |
Poverty in Great Falls
Income Below Poverty by Sex and Age in Great Falls
With 14.4% poverty level for males and 15.6% for females among the residents of Great Falls, 5 year old males and 15 year old females are the most vulnerable to poverty, with 77 males (27.2%) and 101 females (36.9%) in their respective age groups living below the poverty level.
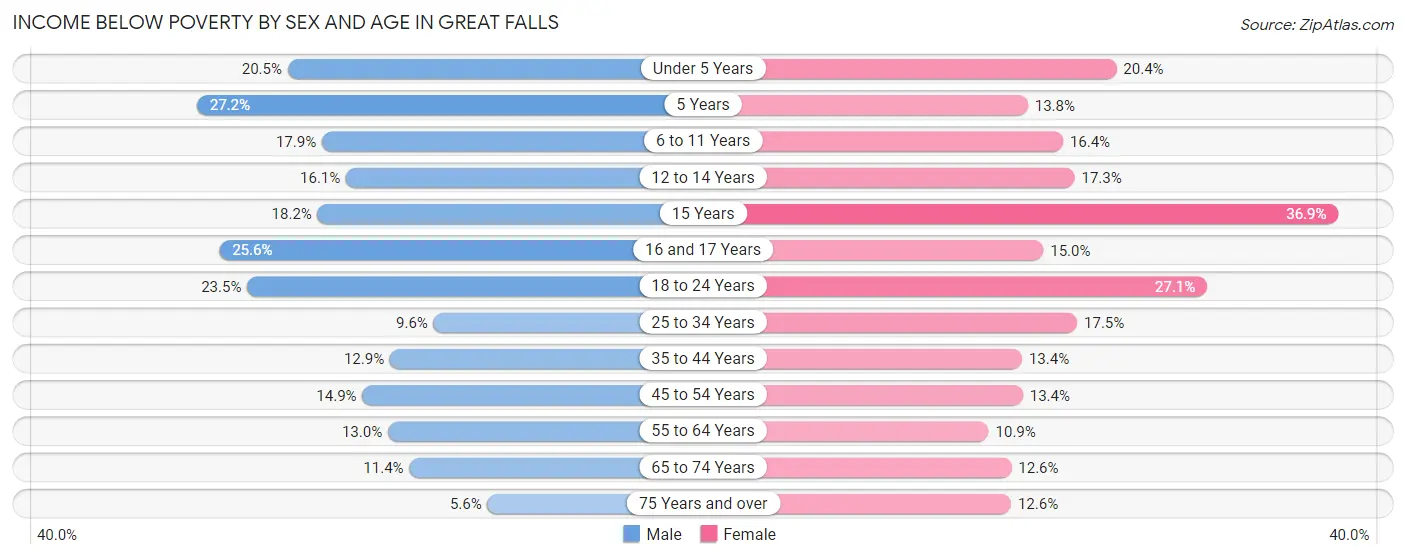
| Age Bracket | Male | Female |
| Under 5 Years | 329 (20.5%) | 344 (20.4%) |
| 5 Years | 77 (27.2%) | 37 (13.8%) |
| 6 to 11 Years | 385 (17.9%) | 372 (16.4%) |
| 12 to 14 Years | 195 (16.1%) | 159 (17.3%) |
| 15 Years | 60 (18.2%) | 101 (36.9%) |
| 16 and 17 Years | 174 (25.6%) | 123 (15.0%) |
| 18 to 24 Years | 627 (23.5%) | 668 (27.1%) |
| 25 to 34 Years | 431 (9.6%) | 704 (17.5%) |
| 35 to 44 Years | 478 (12.9%) | 460 (13.4%) |
| 45 to 54 Years | 484 (14.9%) | 440 (13.4%) |
| 55 to 64 Years | 466 (13.0%) | 439 (10.9%) |
| 65 to 74 Years | 341 (11.4%) | 422 (12.6%) |
| 75 Years and over | 113 (5.6%) | 388 (12.6%) |
| Total | 4,160 (14.4%) | 4,657 (15.6%) |
Income Above Poverty by Sex and Age in Great Falls
According to the poverty statistics in Great Falls, males aged 75 years and over and females aged 55 to 64 years are the age groups that are most secure financially, with 94.4% of males and 89.1% of females in these age groups living above the poverty line.
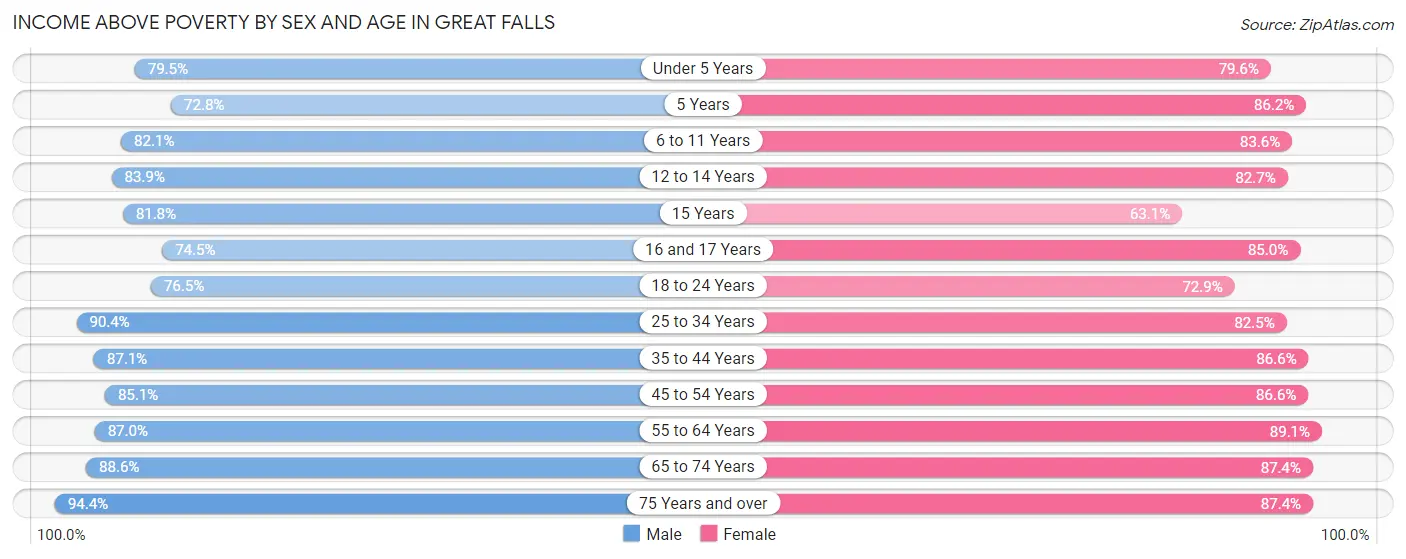
| Age Bracket | Male | Female |
| Under 5 Years | 1,279 (79.5%) | 1,343 (79.6%) |
| 5 Years | 206 (72.8%) | 231 (86.2%) |
| 6 to 11 Years | 1,763 (82.1%) | 1,893 (83.6%) |
| 12 to 14 Years | 1,014 (83.9%) | 761 (82.7%) |
| 15 Years | 269 (81.8%) | 173 (63.1%) |
| 16 and 17 Years | 507 (74.5%) | 699 (85.0%) |
| 18 to 24 Years | 2,044 (76.5%) | 1,795 (72.9%) |
| 25 to 34 Years | 4,046 (90.4%) | 3,325 (82.5%) |
| 35 to 44 Years | 3,235 (87.1%) | 2,979 (86.6%) |
| 45 to 54 Years | 2,761 (85.1%) | 2,834 (86.6%) |
| 55 to 64 Years | 3,114 (87.0%) | 3,587 (89.1%) |
| 65 to 74 Years | 2,643 (88.6%) | 2,929 (87.4%) |
| 75 Years and over | 1,894 (94.4%) | 2,702 (87.4%) |
| Total | 24,775 (85.6%) | 25,251 (84.4%) |
Income Below Poverty Among Married-Couple Families in Great Falls
The poverty statistics for married-couple families in Great Falls show that 3.9% or 410 of the total 10,544 families live below the poverty line. Families with 5 or more children have the highest poverty rate of 25.2%, comprising of 37 families. On the other hand, families with no children have the lowest poverty rate of 2.0%, which includes 140 families.
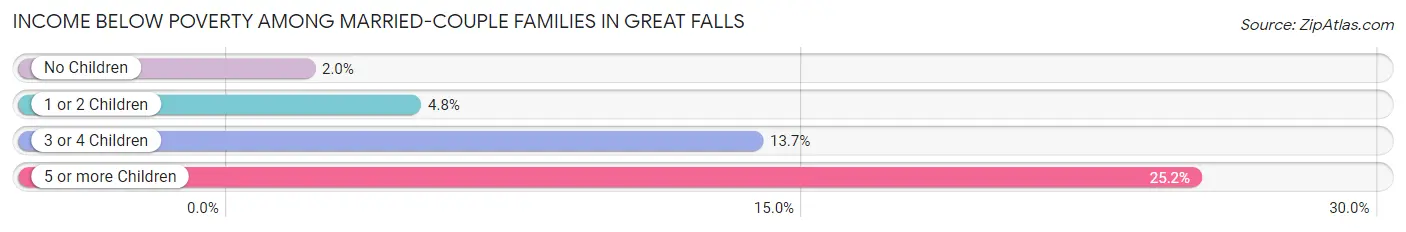
| Children | Above Poverty | Below Poverty |
| No Children | 6,826 (98.0%) | 140 (2.0%) |
| 1 or 2 Children | 2,531 (95.2%) | 127 (4.8%) |
| 3 or 4 Children | 667 (86.3%) | 106 (13.7%) |
| 5 or more Children | 110 (74.8%) | 37 (25.2%) |
| Total | 10,134 (96.1%) | 410 (3.9%) |
Income Below Poverty Among Single-Parent Households in Great Falls
According to the poverty data in Great Falls, 12.8% or 168 single-father households and 24.6% or 704 single-mother households are living below the poverty line. Among single-father households, those with 3 or 4 children have the highest poverty rate, with 34 households (43.0%) experiencing poverty. Likewise, among single-mother households, those with 3 or 4 children have the highest poverty rate, with 84 households (42.2%) falling below the poverty line.
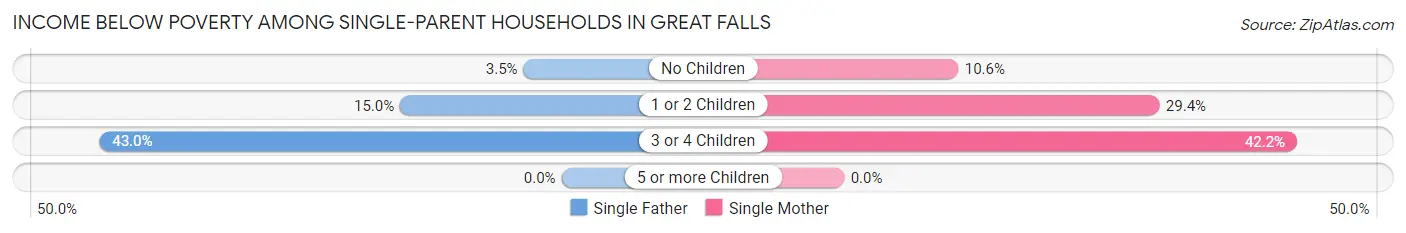
| Children | Single Father | Single Mother |
| No Children | 16 (3.5%) | 88 (10.6%) |
| 1 or 2 Children | 118 (15.0%) | 532 (29.4%) |
| 3 or 4 Children | 34 (43.0%) | 84 (42.2%) |
| 5 or more Children | 0 (0.0%) | 0 (0.0%) |
| Total | 168 (12.8%) | 704 (24.6%) |
Income Below Poverty Among Married-Couple vs Single-Parent Households in Great Falls
The poverty data for Great Falls shows that 410 of the married-couple family households (3.9%) and 872 of the single-parent households (20.9%) are living below the poverty level. Within the married-couple family households, those with 5 or more children have the highest poverty rate, with 37 households (25.2%) falling below the poverty line. Among the single-parent households, those with 3 or 4 children have the highest poverty rate, with 118 household (42.4%) living below poverty.
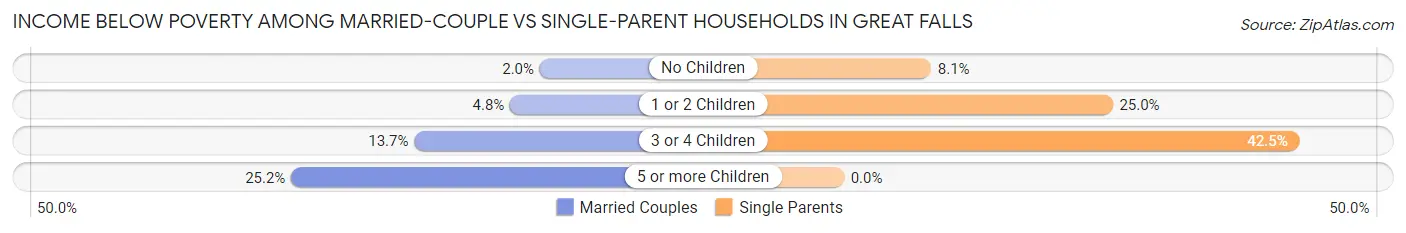
| Children | Married-Couple Families | Single-Parent Households |
| No Children | 140 (2.0%) | 104 (8.1%) |
| 1 or 2 Children | 127 (4.8%) | 650 (25.0%) |
| 3 or 4 Children | 106 (13.7%) | 118 (42.4%) |
| 5 or more Children | 37 (25.2%) | 0 (0.0%) |
| Total | 410 (3.9%) | 872 (20.9%) |
Race in Great Falls
The most populous races in Great Falls are White / Caucasian (51,451 | 85.2%), Two or more Races (3,983 | 6.6%), and Hispanic or Latino (3,279 | 5.4%).
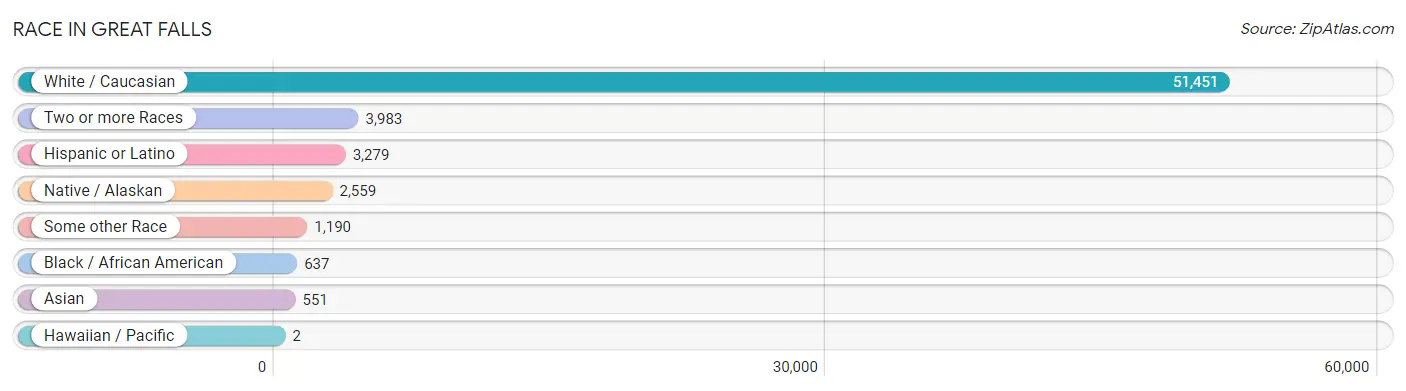
| Race | # Population | % Population |
| Asian | 551 | 0.9% |
| Black / African American | 637 | 1.1% |
| Hawaiian / Pacific | 2 | 0.0% |
| Hispanic or Latino | 3,279 | 5.4% |
| Native / Alaskan | 2,559 | 4.2% |
| White / Caucasian | 51,451 | 85.2% |
| Two or more Races | 3,983 | 6.6% |
| Some other Race | 1,190 | 2.0% |
| Total | 60,373 | 100.0% |
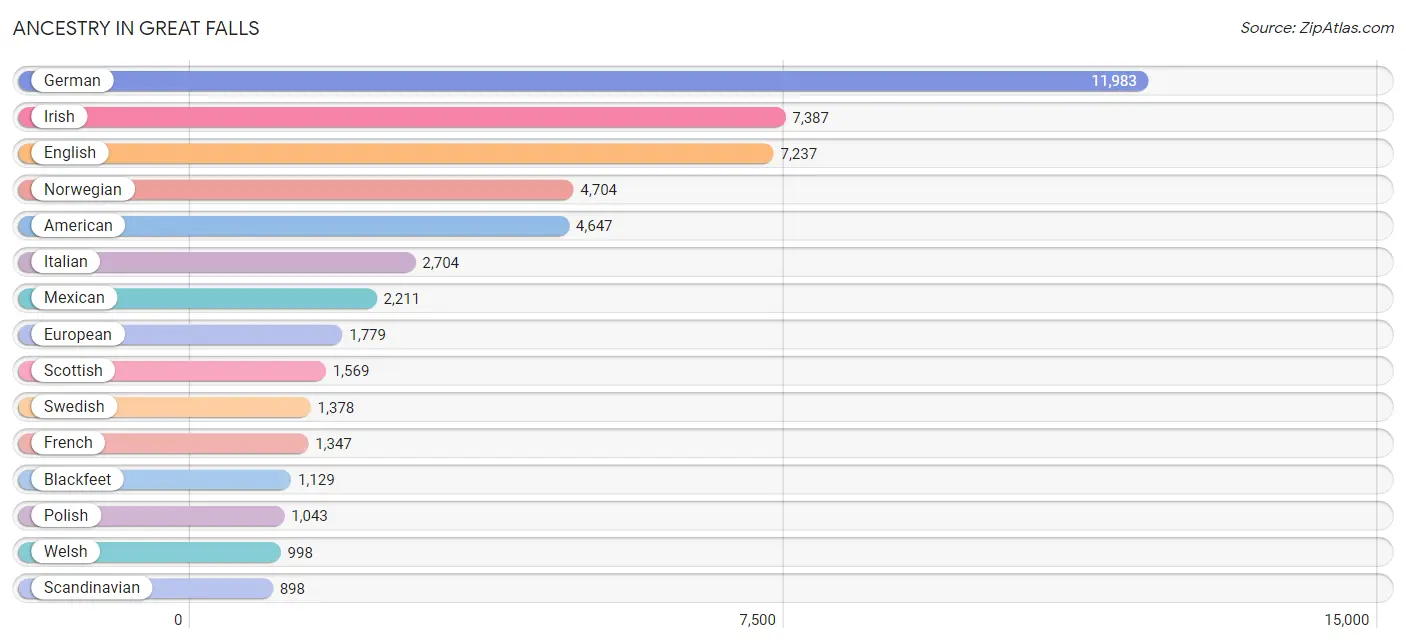
Ancestry in Great Falls
The most populous ancestries reported in Great Falls are German (11,983 | 19.9%), Irish (7,387 | 12.2%), English (7,237 | 12.0%), Norwegian (4,704 | 7.8%), and American (4,647 | 7.7%), together accounting for 59.6% of all Great Falls residents.
| Ancestry | # Population | % Population |
| African | 4 | 0.0% |
| Alaska Native | 163 | 0.3% |
| Aleut | 5 | 0.0% |
| American | 4,647 | 7.7% |
| Apache | 12 | 0.0% |
| Arab | 112 | 0.2% |
| Argentinean | 7 | 0.0% |
| Armenian | 70 | 0.1% |
| Australian | 21 | 0.0% |
| Austrian | 189 | 0.3% |
| Bahamian | 28 | 0.1% |
| Basque | 40 | 0.1% |
| Belgian | 40 | 0.1% |
| Bhutanese | 113 | 0.2% |
| Blackfeet | 1,129 | 1.9% |
| British | 308 | 0.5% |
| Bulgarian | 10 | 0.0% |
| Burmese | 20 | 0.0% |
| Cajun | 15 | 0.0% |
| Canadian | 120 | 0.2% |
| Central American | 269 | 0.4% |
| Cherokee | 91 | 0.2% |
| Cheyenne | 1 | 0.0% |
| Chippewa | 600 | 1.0% |
| Choctaw | 32 | 0.1% |
| Colombian | 14 | 0.0% |
| Colville | 14 | 0.0% |
| Costa Rican | 31 | 0.1% |
| Cree | 196 | 0.3% |
| Croatian | 306 | 0.5% |
| Crow | 43 | 0.1% |
| Cuban | 215 | 0.4% |
| Czech | 237 | 0.4% |
| Czechoslovakian | 97 | 0.2% |
| Danish | 456 | 0.8% |
| Dutch | 661 | 1.1% |
| Eastern European | 119 | 0.2% |
| Egyptian | 10 | 0.0% |
| English | 7,237 | 12.0% |
| Estonian | 28 | 0.1% |
| European | 1,779 | 2.9% |
| Finnish | 568 | 0.9% |
| French | 1,347 | 2.2% |
| French American Indian | 77 | 0.1% |
| French Canadian | 444 | 0.7% |
| German | 11,983 | 19.9% |
| German Russian | 47 | 0.1% |
| Greek | 358 | 0.6% |
| Haitian | 9 | 0.0% |
| Honduran | 172 | 0.3% |
| Hungarian | 250 | 0.4% |
| Indian (Asian) | 270 | 0.4% |
| Iranian | 80 | 0.1% |
| Irish | 7,387 | 12.2% |
| Iroquois | 41 | 0.1% |
| Italian | 2,704 | 4.5% |
| Jamaican | 47 | 0.1% |
| Kiowa | 6 | 0.0% |
| Korean | 444 | 0.7% |
| Latvian | 16 | 0.0% |
| Lebanese | 34 | 0.1% |
| Lithuanian | 70 | 0.1% |
| Luxembourger | 6 | 0.0% |
| Mexican | 2,211 | 3.7% |
| Native Hawaiian | 86 | 0.1% |
| Navajo | 22 | 0.0% |
| Nicaraguan | 65 | 0.1% |
| Nigerian | 11 | 0.0% |
| Northern European | 185 | 0.3% |
| Norwegian | 4,704 | 7.8% |
| Pennsylvania German | 29 | 0.1% |
| Polish | 1,043 | 1.7% |
| Portuguese | 188 | 0.3% |
| Puerto Rican | 316 | 0.5% |
| Romanian | 40 | 0.1% |
| Russian | 354 | 0.6% |
| Salvadoran | 1 | 0.0% |
| Scandinavian | 898 | 1.5% |
| Scotch-Irish | 873 | 1.5% |
| Scottish | 1,569 | 2.6% |
| Seminole | 5 | 0.0% |
| Shoshone | 20 | 0.0% |
| Sioux | 97 | 0.2% |
| Slavic | 86 | 0.1% |
| Slovak | 46 | 0.1% |
| Slovene | 111 | 0.2% |
| South American | 21 | 0.0% |
| Spaniard | 33 | 0.1% |
| Spanish | 105 | 0.2% |
| Sri Lankan | 35 | 0.1% |
| Subsaharan African | 15 | 0.0% |
| Swedish | 1,378 | 2.3% |
| Swiss | 180 | 0.3% |
| Thai | 61 | 0.1% |
| Tlingit-Haida | 5 | 0.0% |
| Turkish | 15 | 0.0% |
| Ukrainian | 109 | 0.2% |
| Welsh | 998 | 1.7% |
| West Indian | 20 | 0.0% |
| Yugoslavian | 70 | 0.1% | View All 100 Rows |
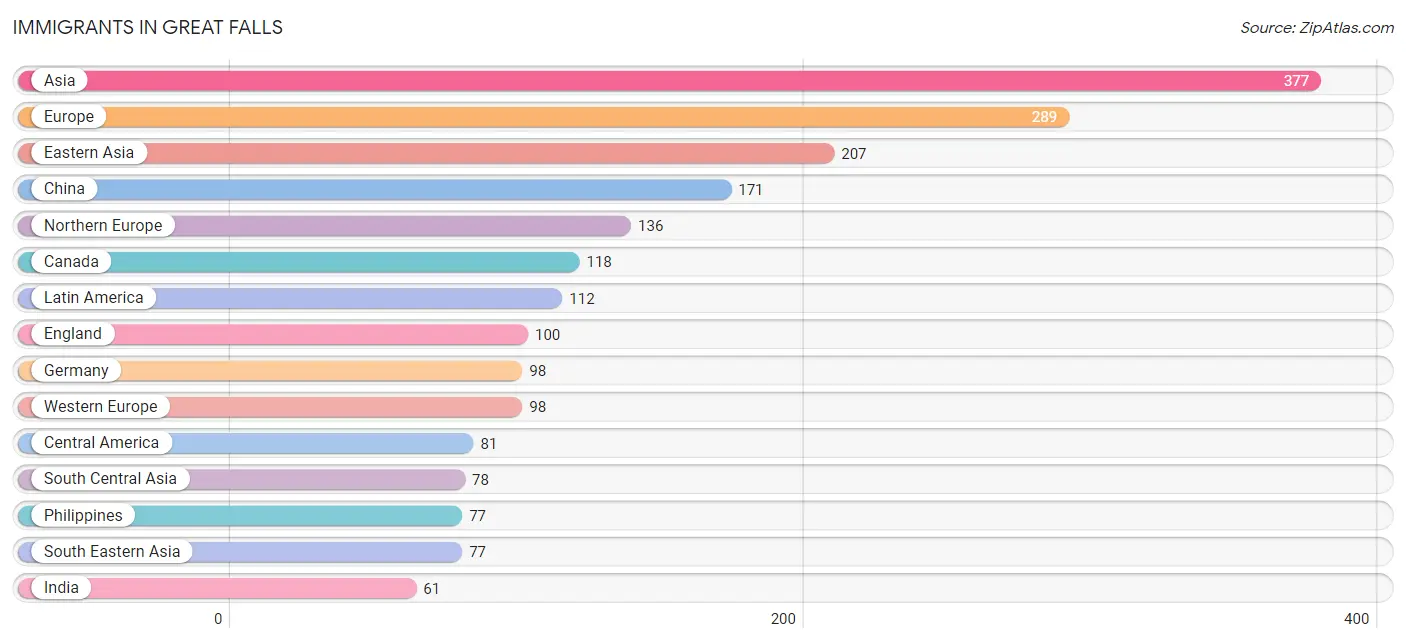
Immigrants in Great Falls
The most numerous immigrant groups reported in Great Falls came from Asia (377 | 0.6%), Europe (289 | 0.5%), Eastern Asia (207 | 0.3%), China (171 | 0.3%), and Northern Europe (136 | 0.2%), together accounting for 1.9% of all Great Falls residents.
| Immigration Origin | # Population | % Population |
| Africa | 14 | 0.0% |
| Argentina | 7 | 0.0% |
| Asia | 377 | 0.6% |
| Australia | 10 | 0.0% |
| Bulgaria | 5 | 0.0% |
| Canada | 118 | 0.2% |
| Caribbean | 10 | 0.0% |
| Central America | 81 | 0.1% |
| China | 171 | 0.3% |
| Colombia | 14 | 0.0% |
| Costa Rica | 31 | 0.1% |
| Cuba | 10 | 0.0% |
| Denmark | 10 | 0.0% |
| Eastern Asia | 207 | 0.3% |
| Eastern Europe | 55 | 0.1% |
| England | 100 | 0.2% |
| Europe | 289 | 0.5% |
| Germany | 98 | 0.2% |
| Hong Kong | 24 | 0.0% |
| India | 61 | 0.1% |
| Iran | 17 | 0.0% |
| Ireland | 3 | 0.0% |
| Japan | 36 | 0.1% |
| Latin America | 112 | 0.2% |
| Latvia | 6 | 0.0% |
| Lebanon | 10 | 0.0% |
| Liberia | 1 | 0.0% |
| Mexico | 5 | 0.0% |
| Nicaragua | 45 | 0.1% |
| Northern Europe | 136 | 0.2% |
| Norway | 1 | 0.0% |
| Oceania | 10 | 0.0% |
| Philippines | 77 | 0.1% |
| Poland | 6 | 0.0% |
| Romania | 22 | 0.0% |
| Russia | 16 | 0.0% |
| South Africa | 13 | 0.0% |
| South America | 21 | 0.0% |
| South Central Asia | 78 | 0.1% |
| South Eastern Asia | 77 | 0.1% |
| Turkey | 5 | 0.0% |
| Western Africa | 1 | 0.0% |
| Western Asia | 15 | 0.0% |
| Western Europe | 98 | 0.2% | View All 44 Rows |
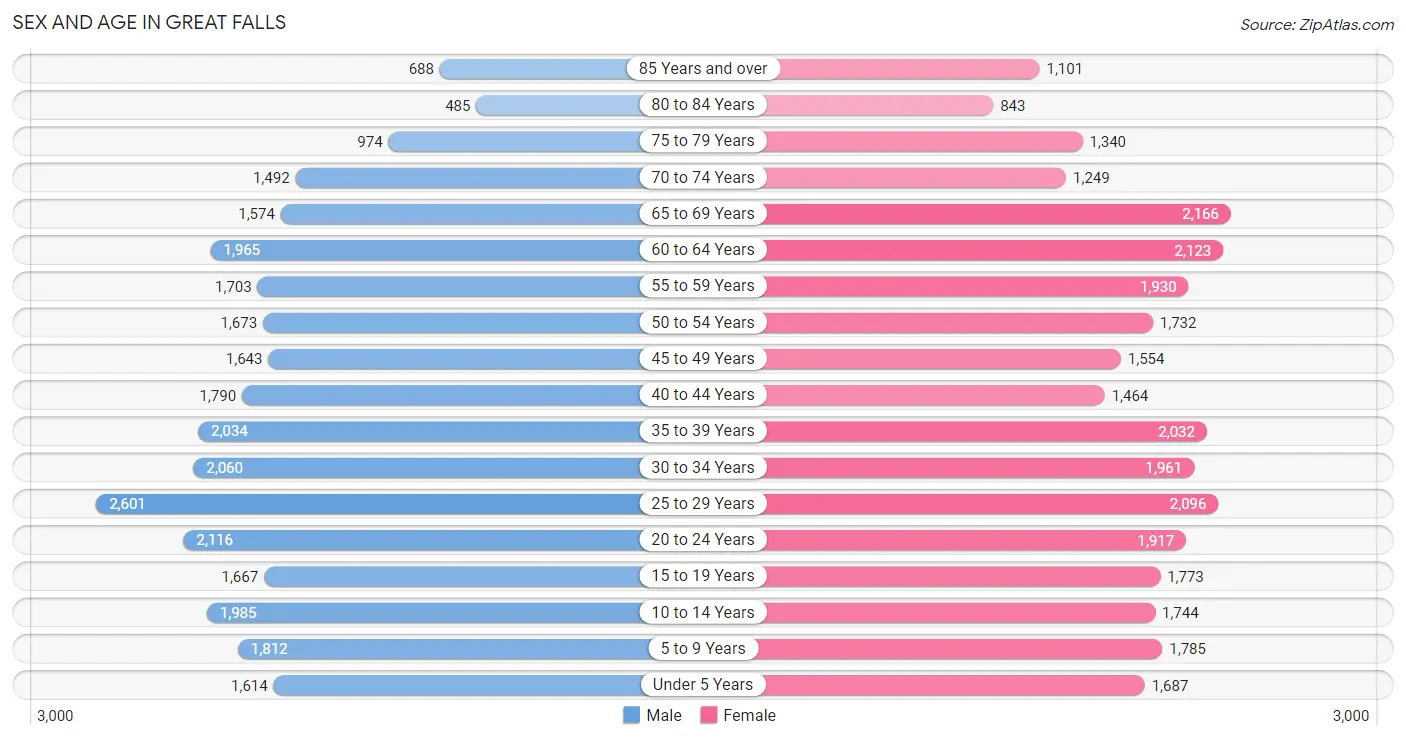
Sex and Age in Great Falls
Sex and Age in Great Falls
The most populous age groups in Great Falls are 25 to 29 Years (2,601 | 8.7%) for men and 65 to 69 Years (2,166 | 7.1%) for women.
| Age Bracket | Male | Female |
| Under 5 Years | 1,614 (5.4%) | 1,687 (5.5%) |
| 5 to 9 Years | 1,812 (6.1%) | 1,785 (5.9%) |
| 10 to 14 Years | 1,985 (6.6%) | 1,744 (5.7%) |
| 15 to 19 Years | 1,667 (5.6%) | 1,773 (5.8%) |
| 20 to 24 Years | 2,116 (7.1%) | 1,917 (6.3%) |
| 25 to 29 Years | 2,601 (8.7%) | 2,096 (6.9%) |
| 30 to 34 Years | 2,060 (6.9%) | 1,961 (6.4%) |
| 35 to 39 Years | 2,034 (6.8%) | 2,032 (6.7%) |
| 40 to 44 Years | 1,790 (6.0%) | 1,464 (4.8%) |
| 45 to 49 Years | 1,643 (5.5%) | 1,554 (5.1%) |
| 50 to 54 Years | 1,673 (5.6%) | 1,732 (5.7%) |
| 55 to 59 Years | 1,703 (5.7%) | 1,930 (6.3%) |
| 60 to 64 Years | 1,965 (6.6%) | 2,123 (7.0%) |
| 65 to 69 Years | 1,574 (5.3%) | 2,166 (7.1%) |
| 70 to 74 Years | 1,492 (5.0%) | 1,249 (4.1%) |
| 75 to 79 Years | 974 (3.3%) | 1,340 (4.4%) |
| 80 to 84 Years | 485 (1.6%) | 843 (2.8%) |
| 85 Years and over | 688 (2.3%) | 1,101 (3.6%) |
| Total | 29,876 (100.0%) | 30,497 (100.0%) |
Families and Households in Great Falls
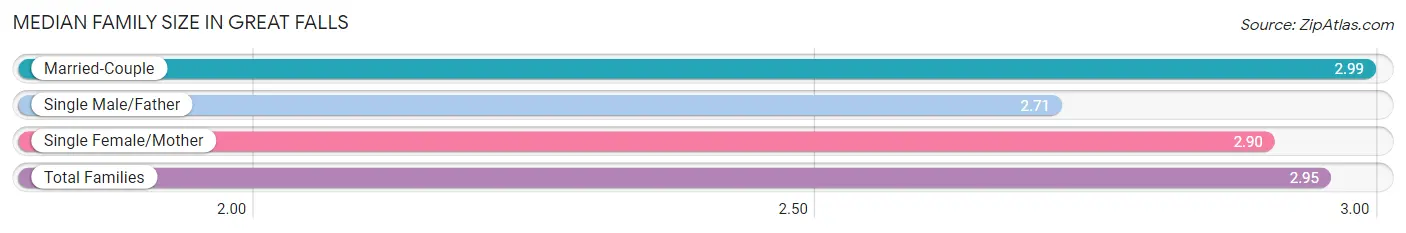
Median Family Size in Great Falls
The median family size in Great Falls is 2.95 persons per family, with married-couple families (10,544 | 71.6%) accounting for the largest median family size of 2.99 persons per family. On the other hand, single male/father families (1,316 | 8.9%) represent the smallest median family size with 2.71 persons per family.
| Family Type | # Families | Family Size |
| Married-Couple | 10,544 (71.6%) | 2.99 |
| Single Male/Father | 1,316 (8.9%) | 2.71 |
| Single Female/Mother | 2,864 (19.5%) | 2.90 |
| Total Families | 14,724 (100.0%) | 2.95 |
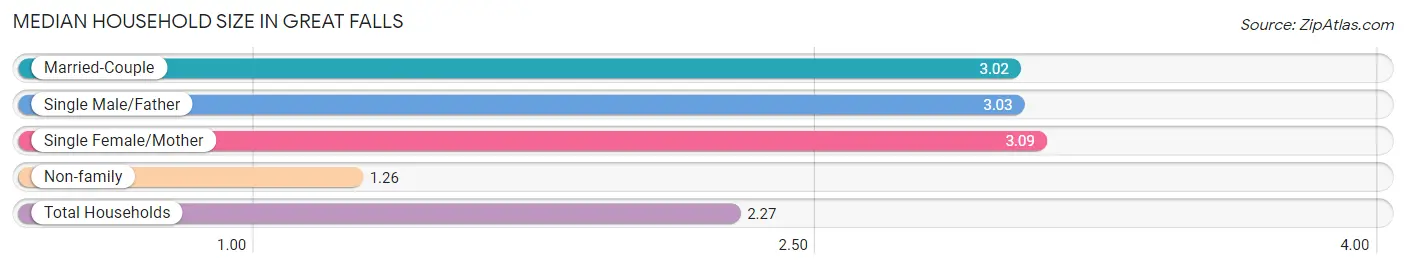
Median Household Size in Great Falls
The median household size in Great Falls is 2.27 persons per household, with single female/mother households (2,864 | 11.1%) accounting for the largest median household size of 3.09 persons per household. non-family households (10,996 | 42.7%) represent the smallest median household size with 1.26 persons per household.
| Household Type | # Households | Household Size |
| Married-Couple | 10,544 (41.0%) | 3.02 |
| Single Male/Father | 1,316 (5.1%) | 3.03 |
| Single Female/Mother | 2,864 (11.1%) | 3.09 |
| Non-family | 10,996 (42.7%) | 1.26 |
| Total Households | 25,720 (100.0%) | 2.27 |
Household Size by Marriage Status in Great Falls
Out of a total of 25,720 households in Great Falls, 14,724 (57.3%) are family households, while 10,996 (42.7%) are nonfamily households. The most numerous type of family households are 2-person households, comprising 7,989, and the most common type of nonfamily households are 1-person households, comprising 9,426.
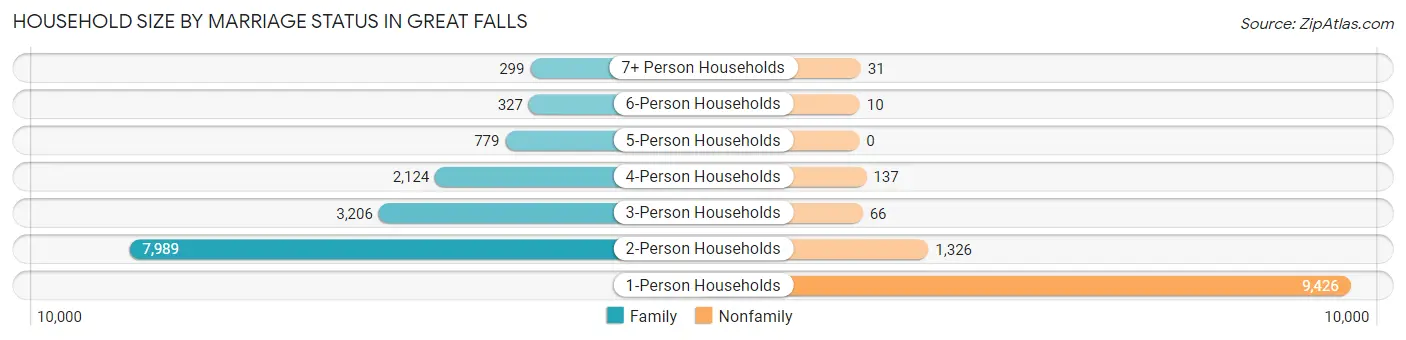
| Household Size | Family Households | Nonfamily Households |
| 1-Person Households | - | 9,426 (36.6%) |
| 2-Person Households | 7,989 (31.1%) | 1,326 (5.2%) |
| 3-Person Households | 3,206 (12.5%) | 66 (0.3%) |
| 4-Person Households | 2,124 (8.3%) | 137 (0.5%) |
| 5-Person Households | 779 (3.0%) | 0 (0.0%) |
| 6-Person Households | 327 (1.3%) | 10 (0.0%) |
| 7+ Person Households | 299 (1.2%) | 31 (0.1%) |
| Total | 14,724 (57.3%) | 10,996 (42.7%) |
Female Fertility in Great Falls
Fertility by Age in Great Falls
Average fertility rate in Great Falls is 101.0 births per 1,000 women. Women in the age bracket of 20 to 34 years have the highest fertility rate with 144.0 births per 1,000 women. Women in the age bracket of 20 to 34 years acount for 64.9% of all women with births.
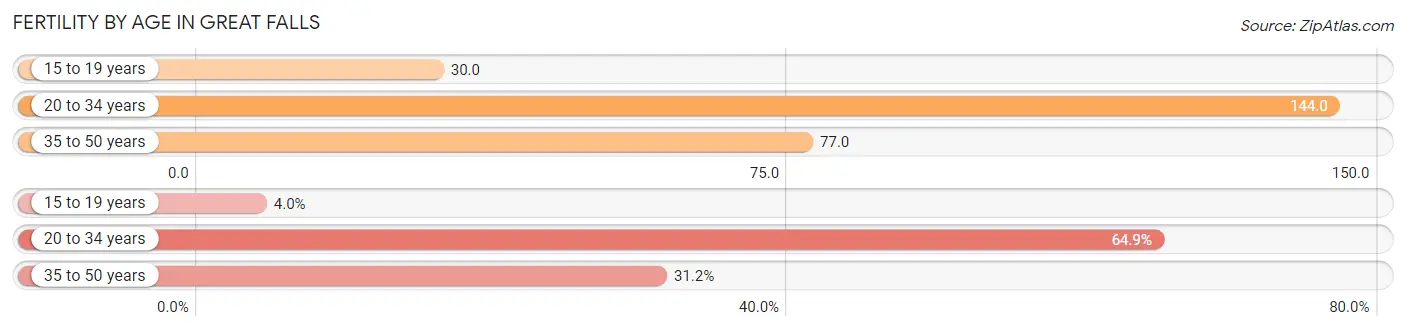
| Age Bracket | Women with Births | Births / 1,000 Women |
| 15 to 19 years | 53 (4.0%) | 30.0 |
| 20 to 34 years | 862 (64.9%) | 144.0 |
| 35 to 50 years | 414 (31.1%) | 77.0 |
| Total | 1,329 (100.0%) | 101.0 |
Fertility by Age by Marriage Status in Great Falls
53.2% of women with births (1,329) in Great Falls are married. The highest percentage of unmarried women with births falls into 15 to 19 years age bracket with 100.0% of them unmarried at the time of birth, while the lowest percentage of unmarried women with births belong to 20 to 34 years age bracket with 41.2% of them unmarried.
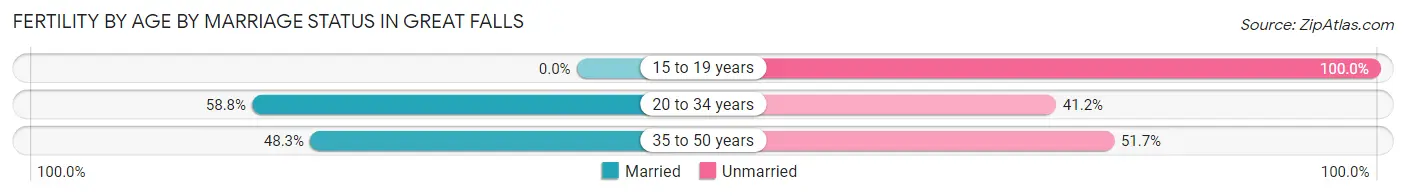
| Age Bracket | Married | Unmarried |
| 15 to 19 years | 0 (0.0%) | 53 (100.0%) |
| 20 to 34 years | 507 (58.8%) | 355 (41.2%) |
| 35 to 50 years | 200 (48.3%) | 214 (51.7%) |
| Total | 707 (53.2%) | 622 (46.8%) |
Fertility by Education in Great Falls
Average fertility rate in Great Falls is 101.0 births per 1,000 women. Women with the education attainment of high school diploma have the highest fertility rate of 137.0 births per 1,000 women, while women with the education attainment of graduate degree have the lowest fertility at 28.0 births per 1,000 women. Women with the education attainment of high school diploma represent 39.8% of all women with births.
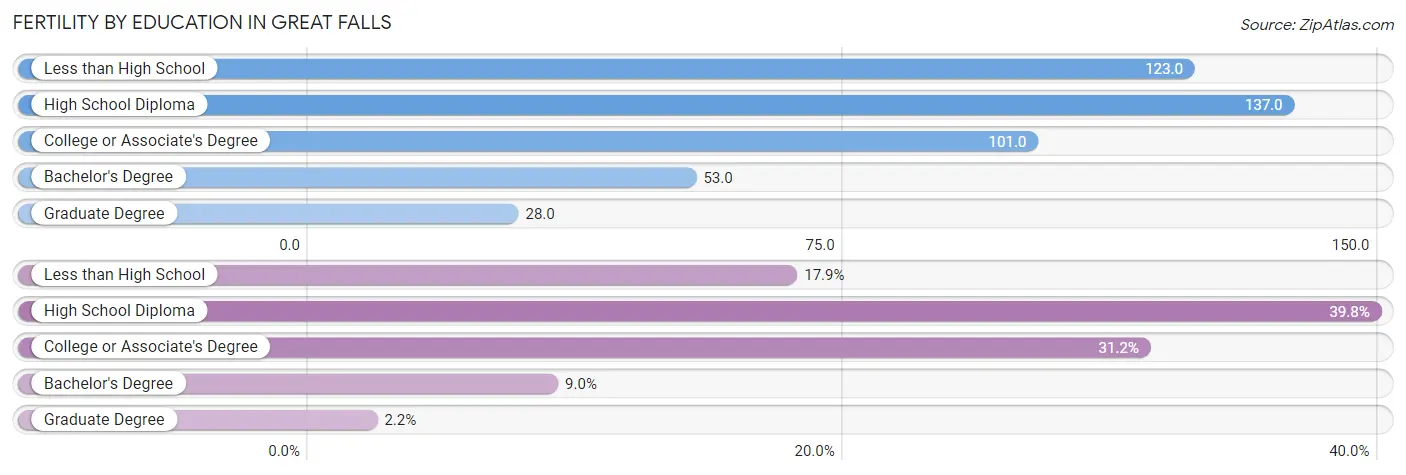
| Educational Attainment | Women with Births | Births / 1,000 Women |
| Less than High School | 238 (17.9%) | 123.0 |
| High School Diploma | 529 (39.8%) | 137.0 |
| College or Associate's Degree | 414 (31.1%) | 101.0 |
| Bachelor's Degree | 119 (8.9%) | 53.0 |
| Graduate Degree | 29 (2.2%) | 28.0 |
| Total | 1,329 (100.0%) | 101.0 |
Fertility by Education by Marriage Status in Great Falls
46.8% of women with births in Great Falls are unmarried. Women with the educational attainment of bachelor's degree are most likely to be married with 100.0% of them married at childbirth, while women with the educational attainment of less than high school are least likely to be married with 70.2% of them unmarried at childbirth.
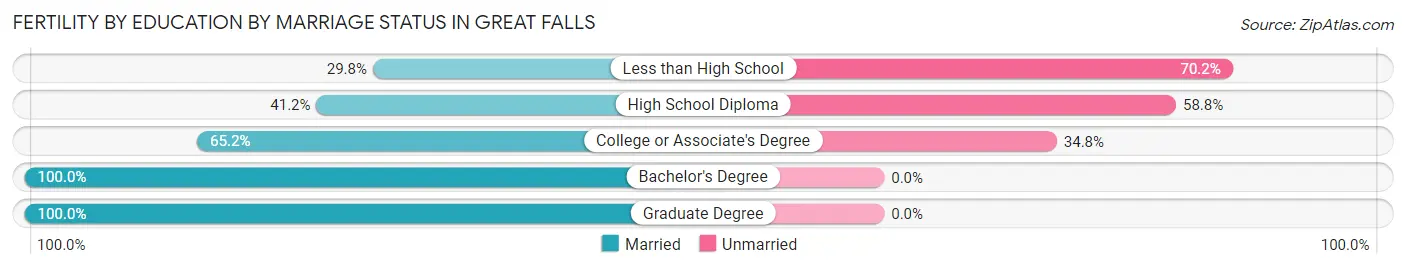
| Educational Attainment | Married | Unmarried |
| Less than High School | 71 (29.8%) | 167 (70.2%) |
| High School Diploma | 218 (41.2%) | 311 (58.8%) |
| College or Associate's Degree | 270 (65.2%) | 144 (34.8%) |
| Bachelor's Degree | 119 (100.0%) | 0 (0.0%) |
| Graduate Degree | 29 (100.0%) | 0 (0.0%) |
| Total | 707 (53.2%) | 622 (46.8%) |
Employment Characteristics in Great Falls
Employment by Class of Employer in Great Falls
Among the 29,094 employed individuals in Great Falls, private company employees (17,043 | 58.6%), not-for-profit organizations (4,020 | 13.8%), and local government employees (2,349 | 8.1%) make up the most common classes of employment.
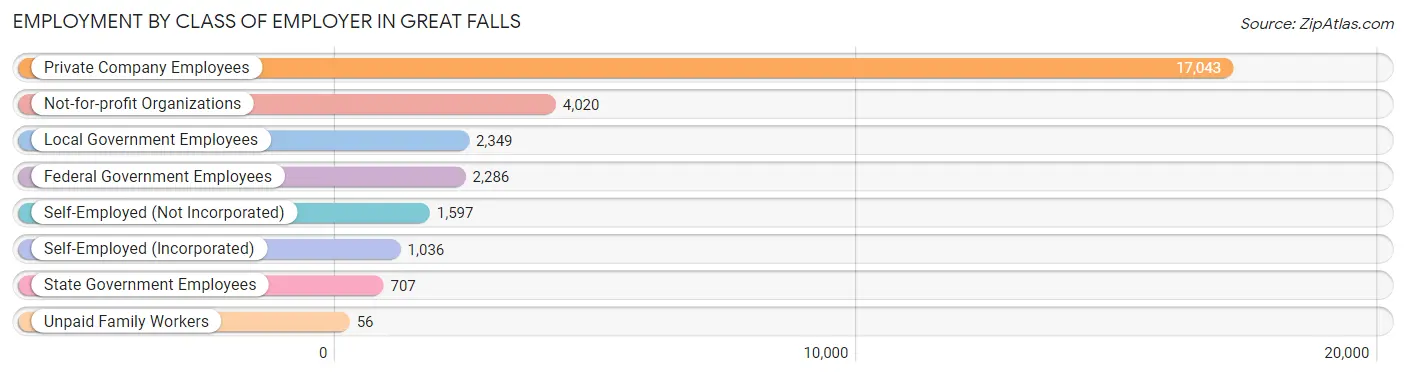
| Employer Class | # Employees | % Employees |
| Private Company Employees | 17,043 | 58.6% |
| Self-Employed (Incorporated) | 1,036 | 3.6% |
| Self-Employed (Not Incorporated) | 1,597 | 5.5% |
| Not-for-profit Organizations | 4,020 | 13.8% |
| Local Government Employees | 2,349 | 8.1% |
| State Government Employees | 707 | 2.4% |
| Federal Government Employees | 2,286 | 7.9% |
| Unpaid Family Workers | 56 | 0.2% |
| Total | 29,094 | 100.0% |
Employment Status by Age in Great Falls
According to the labor force statistics for Great Falls, out of the total population over 16 years of age (49,142), 62.8% or 30,861 individuals are in the labor force, with 3.4% or 1,049 of them unemployed. The age group with the highest labor force participation rate is 20 to 24 years, with 84.5% or 3,408 individuals in the labor force. Within the labor force, the 16 to 19 years age range has the highest percentage of unemployed individuals, with 7.5% or 109 of them being unemployed.
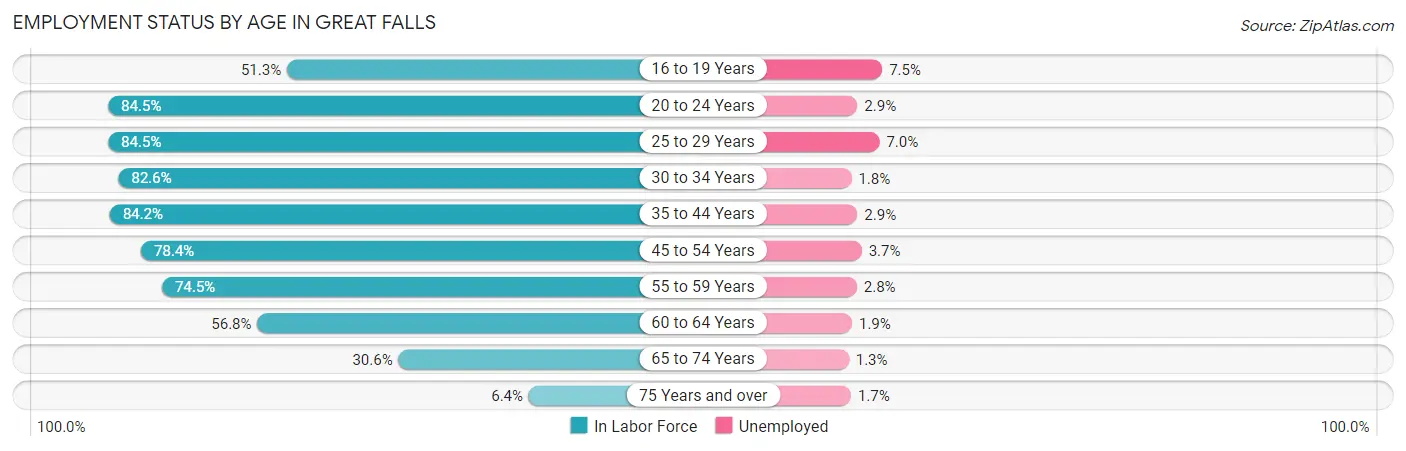
| Age Bracket | In Labor Force | Unemployed |
| 16 to 19 Years | 1,455 (51.3%) | 109 (7.5%) |
| 20 to 24 Years | 3,408 (84.5%) | 99 (2.9%) |
| 25 to 29 Years | 3,969 (84.5%) | 278 (7.0%) |
| 30 to 34 Years | 3,321 (82.6%) | 60 (1.8%) |
| 35 to 44 Years | 6,163 (84.2%) | 179 (2.9%) |
| 45 to 54 Years | 5,176 (78.4%) | 192 (3.7%) |
| 55 to 59 Years | 2,707 (74.5%) | 76 (2.8%) |
| 60 to 64 Years | 2,322 (56.8%) | 44 (1.9%) |
| 65 to 74 Years | 1,983 (30.6%) | 26 (1.3%) |
| 75 Years and over | 348 (6.4%) | 6 (1.7%) |
| Total | 30,861 (62.8%) | 1,049 (3.4%) |
Employment Status by Educational Attainment in Great Falls
According to labor force statistics for Great Falls, 77.9% of individuals (23,651) out of the total population between 25 and 64 years of age (30,361) are in the labor force, with 3.5% or 828 of them being unemployed. The group with the highest labor force participation rate are those with the educational attainment of bachelor's degree or higher, with 87.5% or 6,917 individuals in the labor force. Within the labor force, individuals with less than high school education have the highest percentage of unemployment, with 10.8% or 106 of them being unemployed.
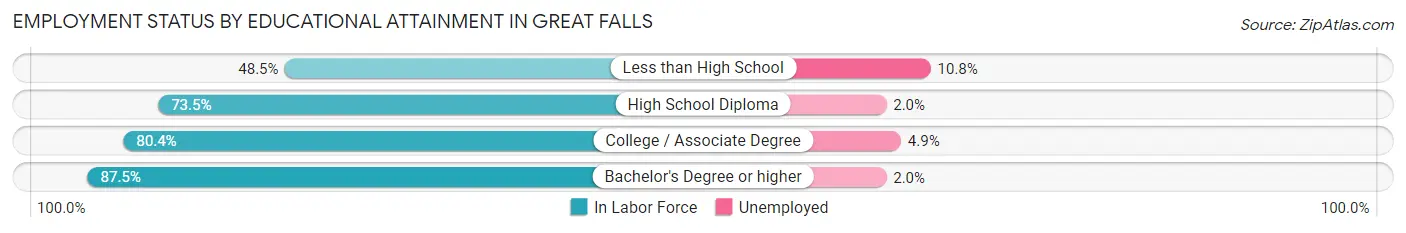
| Educational Attainment | In Labor Force | Unemployed |
| Less than High School | 984 (48.5%) | 219 (10.8%) |
| High School Diploma | 7,072 (73.5%) | 192 (2.0%) |
| College / Associate Degree | 8,688 (80.4%) | 529 (4.9%) |
| Bachelor's Degree or higher | 6,917 (87.5%) | 158 (2.0%) |
| Total | 23,651 (77.9%) | 1,063 (3.5%) |
Employment Occupations by Sex in Great Falls
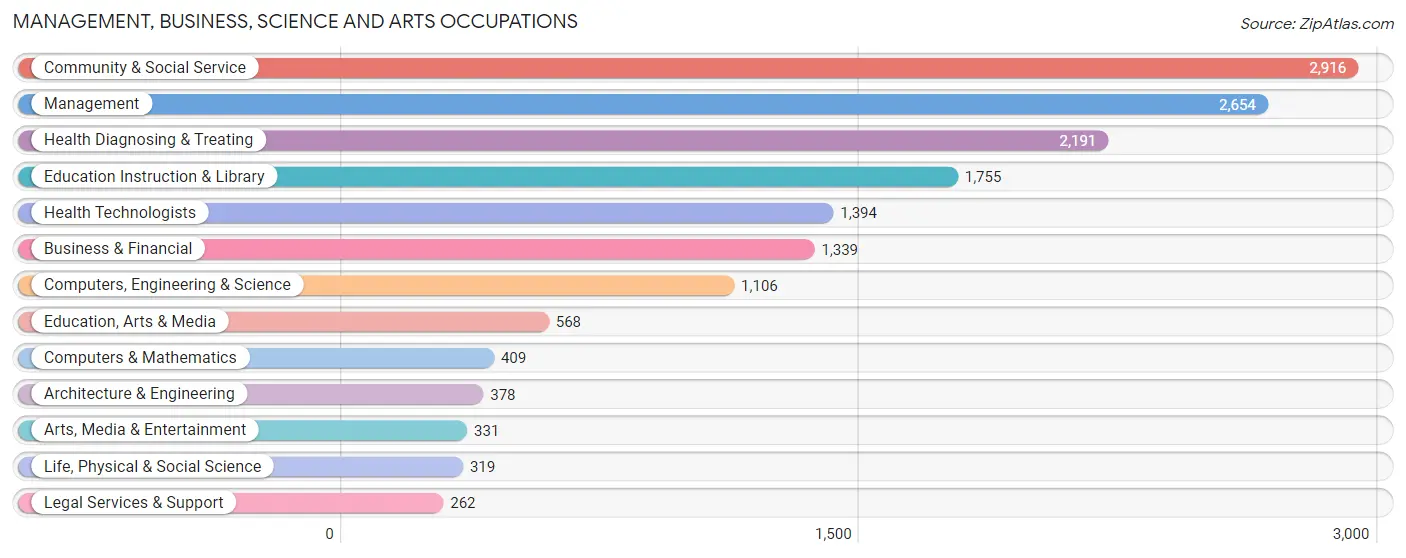
Management, Business, Science and Arts Occupations
The most common Management, Business, Science and Arts occupations in Great Falls are Community & Social Service (2,916 | 10.1%), Management (2,654 | 9.2%), Health Diagnosing & Treating (2,191 | 7.6%), Education Instruction & Library (1,755 | 6.1%), and Health Technologists (1,394 | 4.8%).
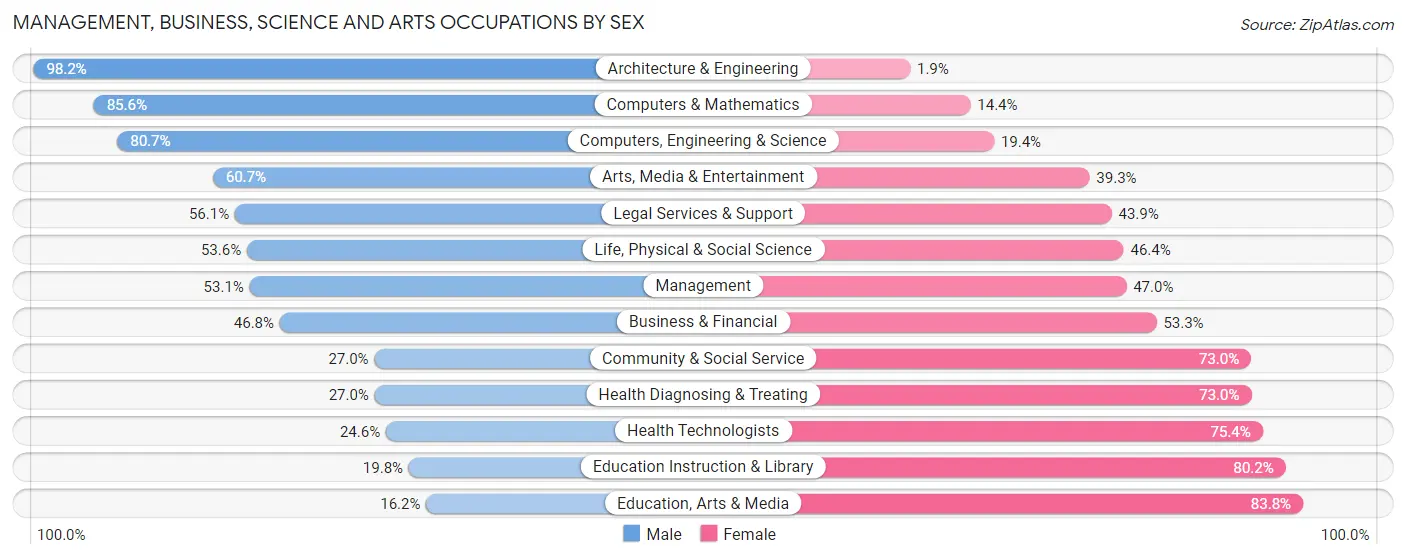
Management, Business, Science and Arts Occupations by Sex
Within the Management, Business, Science and Arts occupations in Great Falls, the most male-oriented occupations are Architecture & Engineering (98.2%), Computers & Mathematics (85.6%), and Computers, Engineering & Science (80.6%), while the most female-oriented occupations are Education, Arts & Media (83.8%), Education Instruction & Library (80.2%), and Health Technologists (75.4%).
| Occupation | Male | Female |
| Management | 1,408 (53.0%) | 1,246 (46.9%) |
| Business & Financial | 626 (46.8%) | 713 (53.2%) |
| Computers, Engineering & Science | 892 (80.6%) | 214 (19.4%) |
| Computers & Mathematics | 350 (85.6%) | 59 (14.4%) |
| Architecture & Engineering | 371 (98.2%) | 7 (1.8%) |
| Life, Physical & Social Science | 171 (53.6%) | 148 (46.4%) |
| Community & Social Service | 788 (27.0%) | 2,128 (73.0%) |
| Education, Arts & Media | 92 (16.2%) | 476 (83.8%) |
| Legal Services & Support | 147 (56.1%) | 115 (43.9%) |
| Education Instruction & Library | 348 (19.8%) | 1,407 (80.2%) |
| Arts, Media & Entertainment | 201 (60.7%) | 130 (39.3%) |
| Health Diagnosing & Treating | 591 (27.0%) | 1,600 (73.0%) |
| Health Technologists | 343 (24.6%) | 1,051 (75.4%) |
| Total (Category) | 4,305 (42.2%) | 5,901 (57.8%) |
| Total (Overall) | 14,424 (50.0%) | 14,404 (50.0%) |
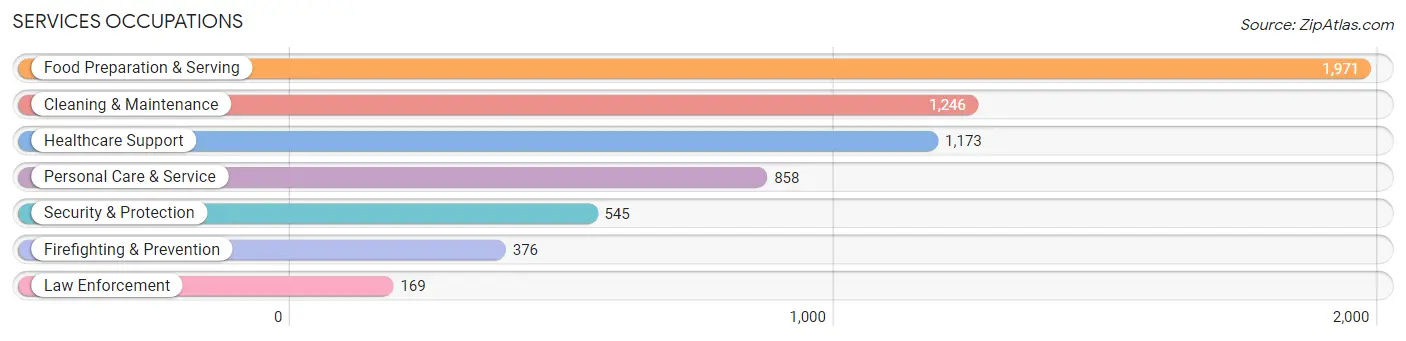
Services Occupations
The most common Services occupations in Great Falls are Food Preparation & Serving (1,971 | 6.8%), Cleaning & Maintenance (1,246 | 4.3%), Healthcare Support (1,173 | 4.1%), Personal Care & Service (858 | 3.0%), and Security & Protection (545 | 1.9%).
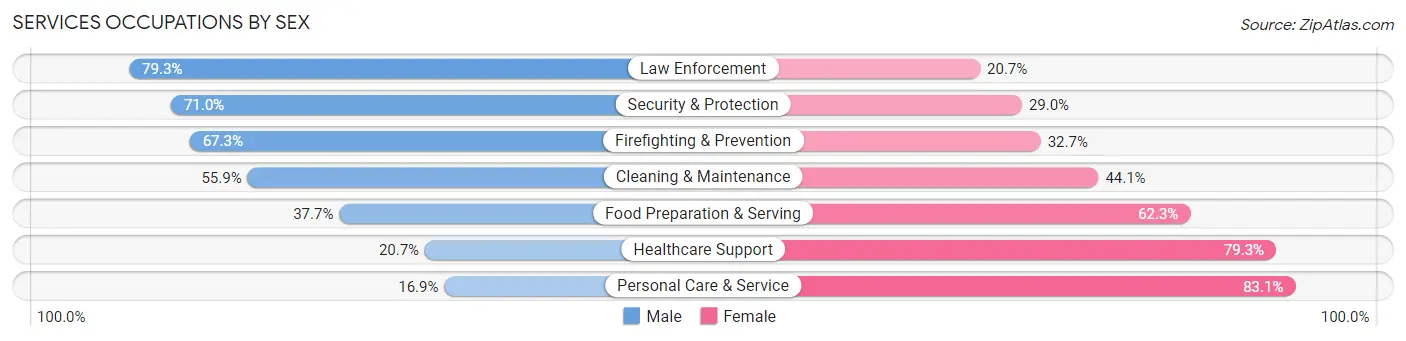
Services Occupations by Sex
Within the Services occupations in Great Falls, the most male-oriented occupations are Law Enforcement (79.3%), Security & Protection (71.0%), and Firefighting & Prevention (67.3%), while the most female-oriented occupations are Personal Care & Service (83.1%), Healthcare Support (79.3%), and Food Preparation & Serving (62.3%).
| Occupation | Male | Female |
| Healthcare Support | 243 (20.7%) | 930 (79.3%) |
| Security & Protection | 387 (71.0%) | 158 (29.0%) |
| Firefighting & Prevention | 253 (67.3%) | 123 (32.7%) |
| Law Enforcement | 134 (79.3%) | 35 (20.7%) |
| Food Preparation & Serving | 743 (37.7%) | 1,228 (62.3%) |
| Cleaning & Maintenance | 696 (55.9%) | 550 (44.1%) |
| Personal Care & Service | 145 (16.9%) | 713 (83.1%) |
| Total (Category) | 2,214 (38.2%) | 3,579 (61.8%) |
| Total (Overall) | 14,424 (50.0%) | 14,404 (50.0%) |
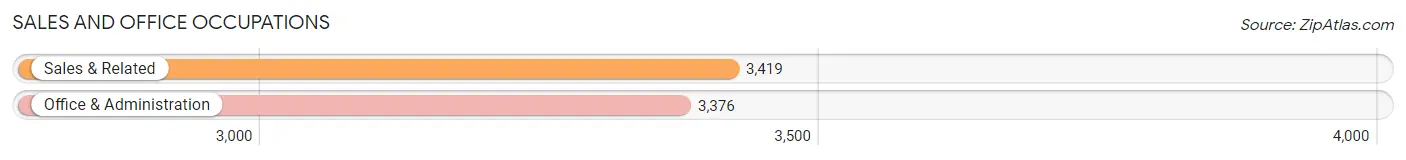
Sales and Office Occupations
The most common Sales and Office occupations in Great Falls are Sales & Related (3,419 | 11.9%), and Office & Administration (3,376 | 11.7%).
Sales and Office Occupations by Sex
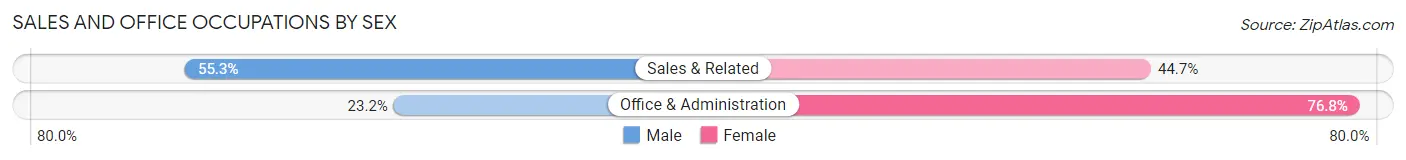
| Occupation | Male | Female |
| Sales & Related | 1,891 (55.3%) | 1,528 (44.7%) |
| Office & Administration | 784 (23.2%) | 2,592 (76.8%) |
| Total (Category) | 2,675 (39.4%) | 4,120 (60.6%) |
| Total (Overall) | 14,424 (50.0%) | 14,404 (50.0%) |
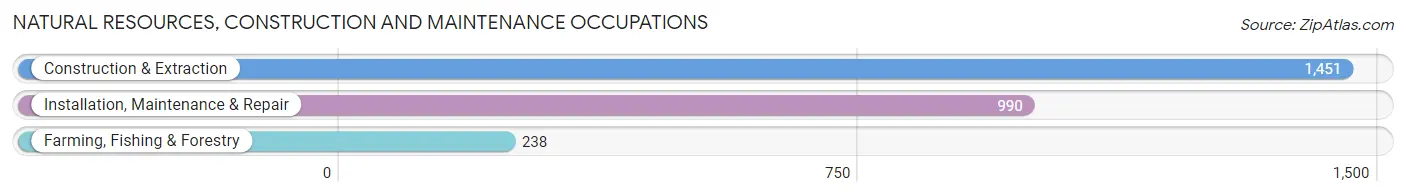
Natural Resources, Construction and Maintenance Occupations
The most common Natural Resources, Construction and Maintenance occupations in Great Falls are Construction & Extraction (1,451 | 5.0%), Installation, Maintenance & Repair (990 | 3.4%), and Farming, Fishing & Forestry (238 | 0.8%).
Natural Resources, Construction and Maintenance Occupations by Sex
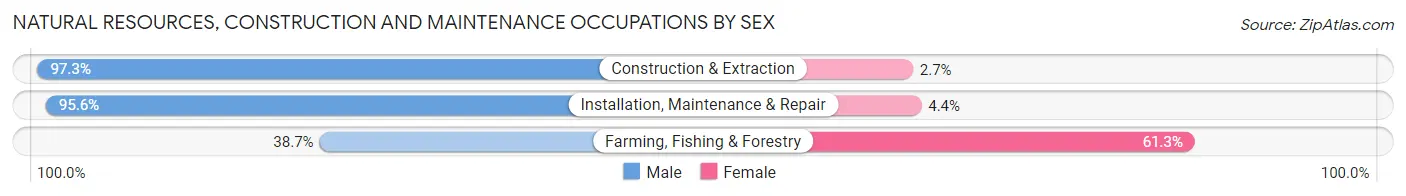
| Occupation | Male | Female |
| Farming, Fishing & Forestry | 92 (38.7%) | 146 (61.3%) |
| Construction & Extraction | 1,412 (97.3%) | 39 (2.7%) |
| Installation, Maintenance & Repair | 946 (95.6%) | 44 (4.4%) |
| Total (Category) | 2,450 (91.4%) | 229 (8.6%) |
| Total (Overall) | 14,424 (50.0%) | 14,404 (50.0%) |
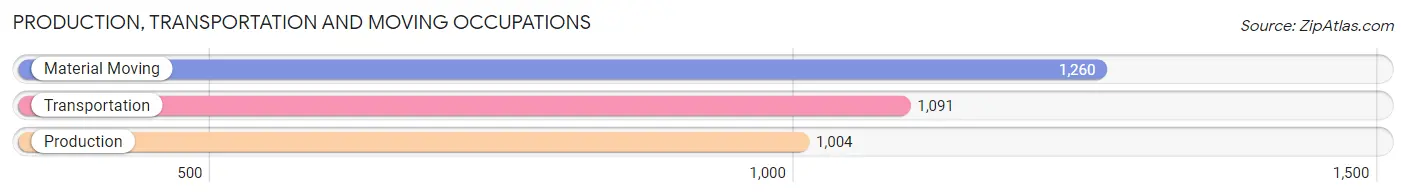
Production, Transportation and Moving Occupations
The most common Production, Transportation and Moving occupations in Great Falls are Material Moving (1,260 | 4.4%), Transportation (1,091 | 3.8%), and Production (1,004 | 3.5%).
Production, Transportation and Moving Occupations by Sex
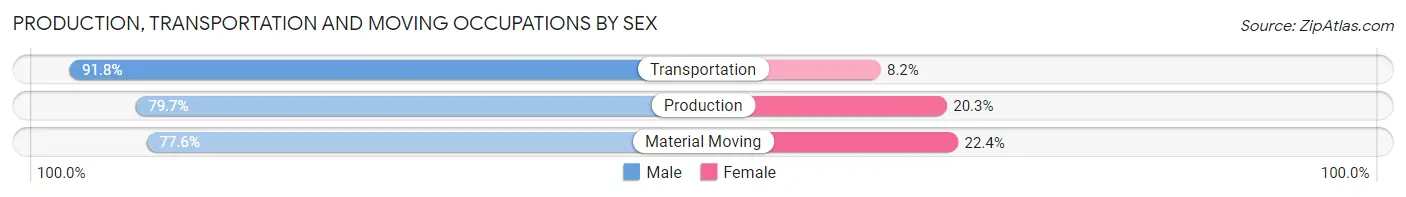
| Occupation | Male | Female |
| Production | 800 (79.7%) | 204 (20.3%) |
| Transportation | 1,002 (91.8%) | 89 (8.2%) |
| Material Moving | 978 (77.6%) | 282 (22.4%) |
| Total (Category) | 2,780 (82.9%) | 575 (17.1%) |
| Total (Overall) | 14,424 (50.0%) | 14,404 (50.0%) |
Employment Industries by Sex in Great Falls
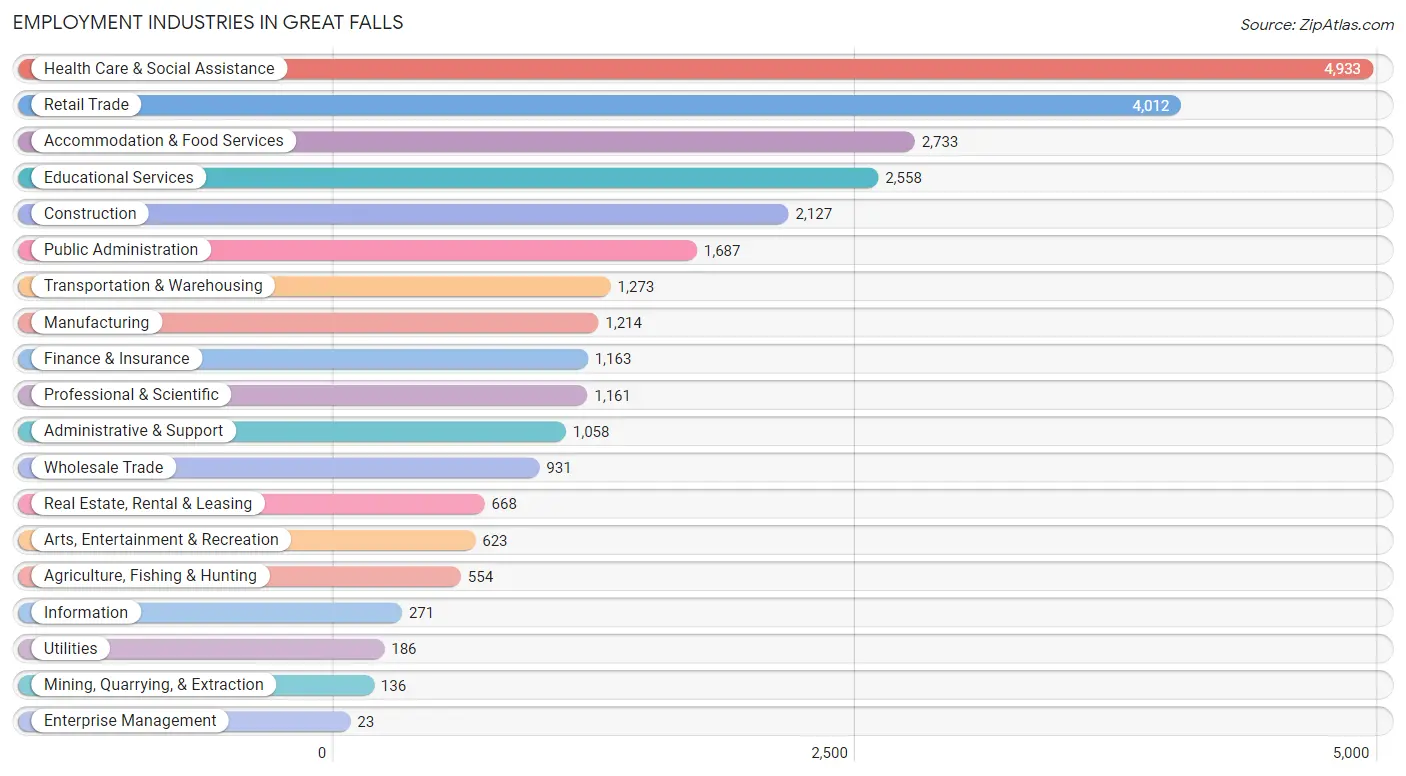
Employment Industries in Great Falls
The major employment industries in Great Falls include Health Care & Social Assistance (4,933 | 17.1%), Retail Trade (4,012 | 13.9%), Accommodation & Food Services (2,733 | 9.5%), Educational Services (2,558 | 8.9%), and Construction (2,127 | 7.4%).
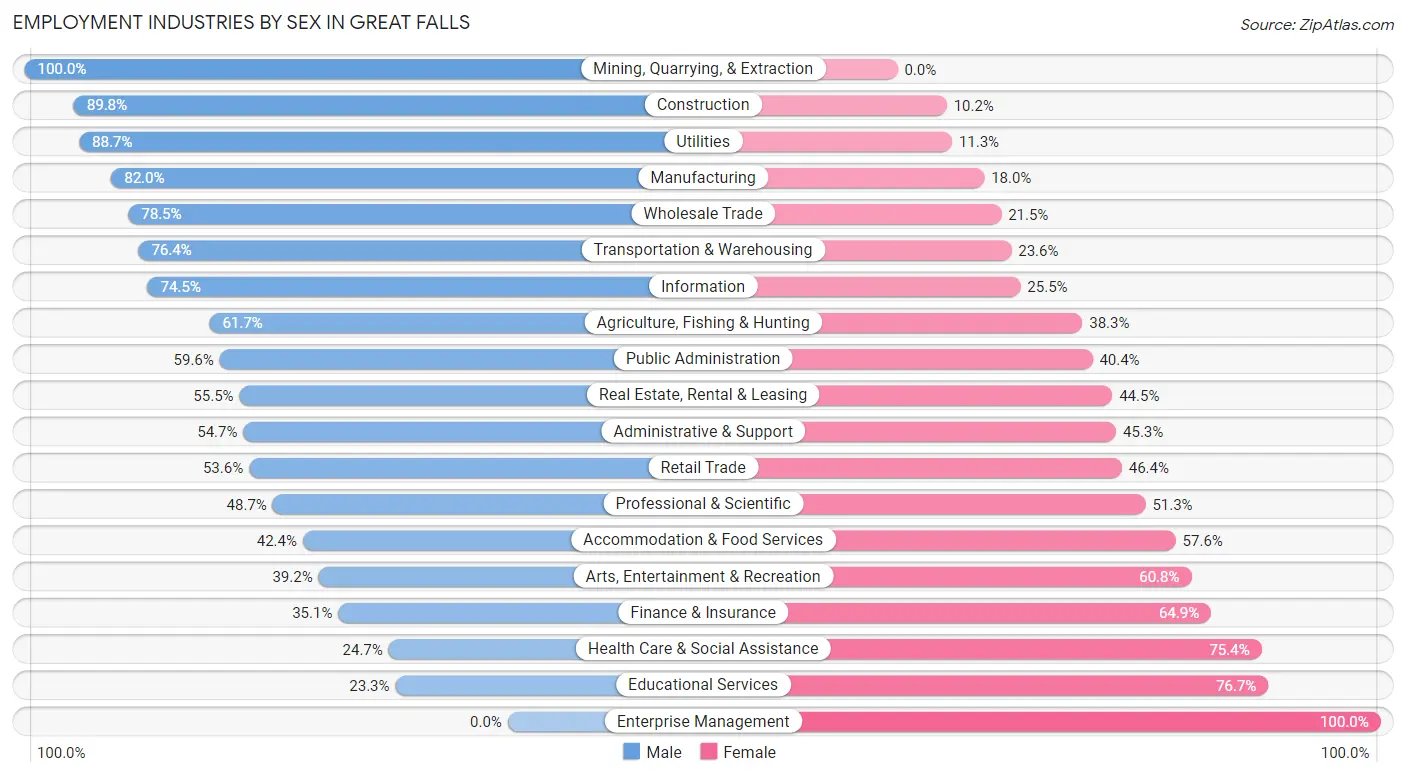
Employment Industries by Sex in Great Falls
The Great Falls industries that see more men than women are Mining, Quarrying, & Extraction (100.0%), Construction (89.8%), and Utilities (88.7%), whereas the industries that tend to have a higher number of women are Enterprise Management (100.0%), Educational Services (76.7%), and Health Care & Social Assistance (75.3%).
| Industry | Male | Female |
| Agriculture, Fishing & Hunting | 342 (61.7%) | 212 (38.3%) |
| Mining, Quarrying, & Extraction | 136 (100.0%) | 0 (0.0%) |
| Construction | 1,910 (89.8%) | 217 (10.2%) |
| Manufacturing | 996 (82.0%) | 218 (18.0%) |
| Wholesale Trade | 731 (78.5%) | 200 (21.5%) |
| Retail Trade | 2,149 (53.6%) | 1,863 (46.4%) |
| Transportation & Warehousing | 973 (76.4%) | 300 (23.6%) |
| Utilities | 165 (88.7%) | 21 (11.3%) |
| Information | 202 (74.5%) | 69 (25.5%) |
| Finance & Insurance | 408 (35.1%) | 755 (64.9%) |
| Real Estate, Rental & Leasing | 371 (55.5%) | 297 (44.5%) |
| Professional & Scientific | 565 (48.7%) | 596 (51.3%) |
| Enterprise Management | 0 (0.0%) | 23 (100.0%) |
| Administrative & Support | 579 (54.7%) | 479 (45.3%) |
| Educational Services | 595 (23.3%) | 1,963 (76.7%) |
| Health Care & Social Assistance | 1,216 (24.6%) | 3,717 (75.3%) |
| Arts, Entertainment & Recreation | 244 (39.2%) | 379 (60.8%) |
| Accommodation & Food Services | 1,159 (42.4%) | 1,574 (57.6%) |
| Public Administration | 1,006 (59.6%) | 681 (40.4%) |
| Total | 14,424 (50.0%) | 14,404 (50.0%) |
Education in Great Falls
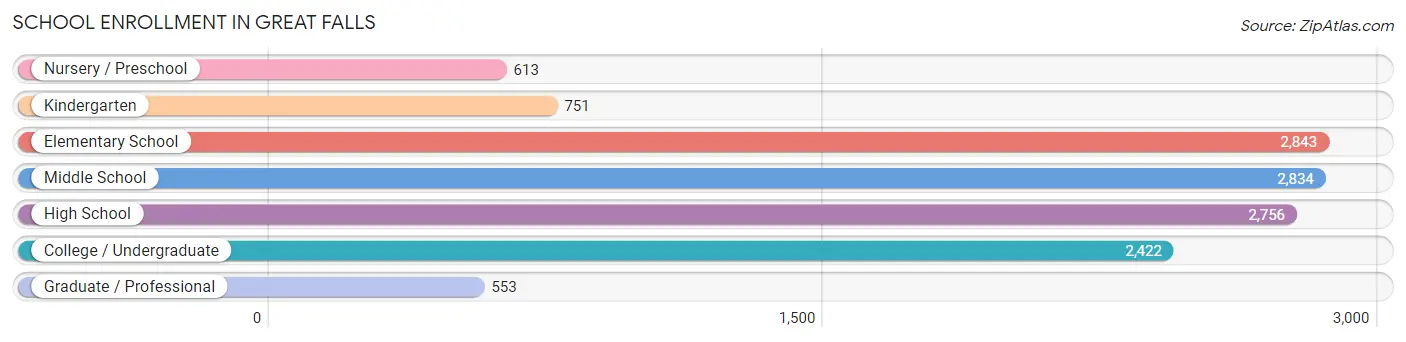
School Enrollment in Great Falls
The most common levels of schooling among the 12,772 students in Great Falls are elementary school (2,843 | 22.3%), middle school (2,834 | 22.2%), and high school (2,756 | 21.6%).
| School Level | # Students | % Students |
| Nursery / Preschool | 613 | 4.8% |
| Kindergarten | 751 | 5.9% |
| Elementary School | 2,843 | 22.3% |
| Middle School | 2,834 | 22.2% |
| High School | 2,756 | 21.6% |
| College / Undergraduate | 2,422 | 19.0% |
| Graduate / Professional | 553 | 4.3% |
| Total | 12,772 | 100.0% |
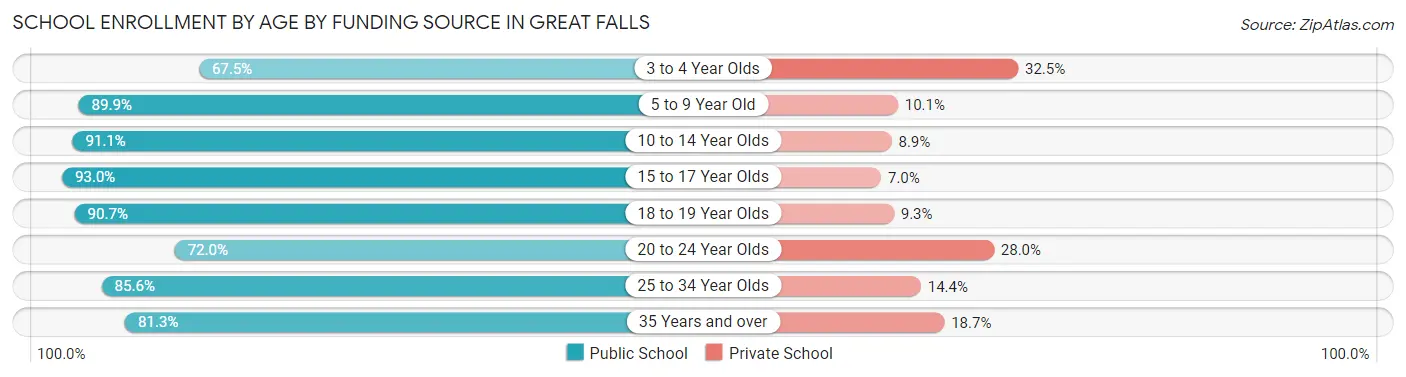
School Enrollment by Age by Funding Source in Great Falls
Out of a total of 12,772 students who are enrolled in schools in Great Falls, 1,596 (12.5%) attend a private institution, while the remaining 11,176 (87.5%) are enrolled in public schools. The age group of 3 to 4 year olds has the highest likelihood of being enrolled in private schools, with 165 (32.5% in the age bracket) enrolled. Conversely, the age group of 15 to 17 year olds has the lowest likelihood of being enrolled in a private school, with 1,778 (93.0% in the age bracket) attending a public institution.
| Age Bracket | Public School | Private School |
| 3 to 4 Year Olds | 343 (67.5%) | 165 (32.5%) |
| 5 to 9 Year Old | 3,061 (89.9%) | 343 (10.1%) |
| 10 to 14 Year Olds | 3,185 (91.1%) | 312 (8.9%) |
| 15 to 17 Year Olds | 1,778 (93.0%) | 133 (7.0%) |
| 18 to 19 Year Olds | 739 (90.7%) | 76 (9.3%) |
| 20 to 24 Year Olds | 850 (72.0%) | 330 (28.0%) |
| 25 to 34 Year Olds | 626 (85.6%) | 105 (14.4%) |
| 35 Years and over | 590 (81.3%) | 136 (18.7%) |
| Total | 11,176 (87.5%) | 1,596 (12.5%) |
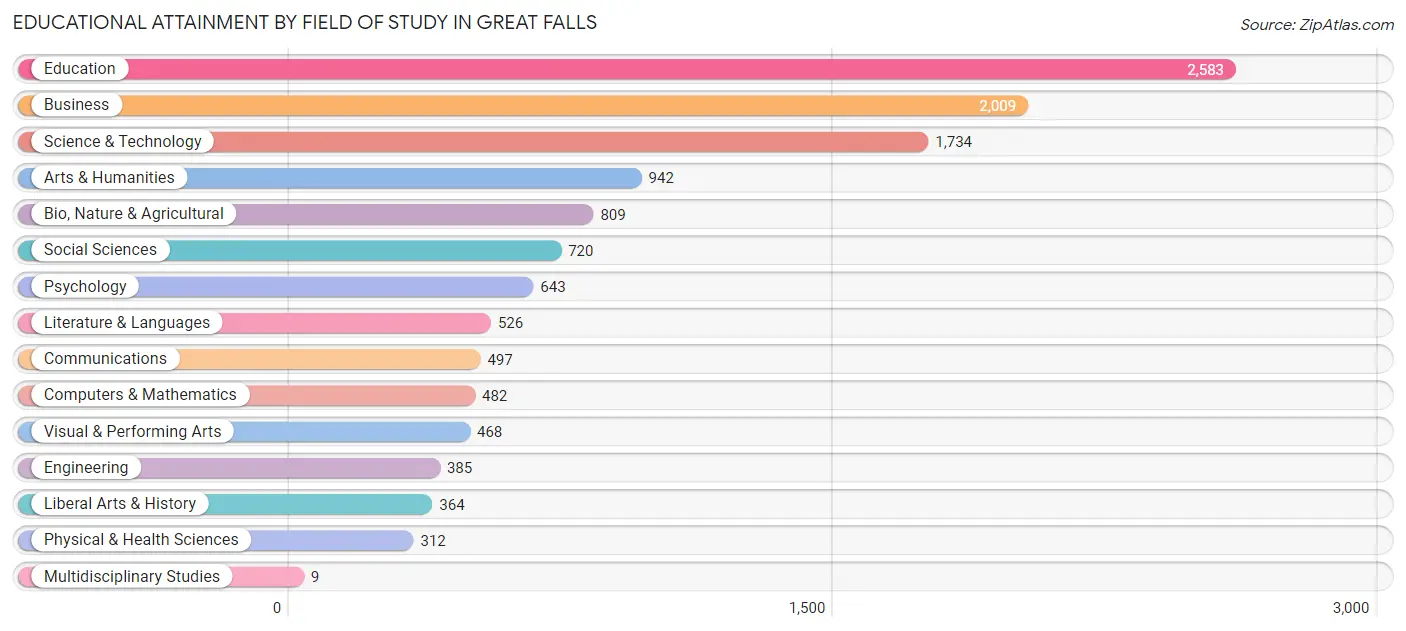
Educational Attainment by Field of Study in Great Falls
Education (2,583 | 20.7%), business (2,009 | 16.1%), science & technology (1,734 | 13.9%), arts & humanities (942 | 7.5%), and bio, nature & agricultural (809 | 6.5%) are the most common fields of study among 12,483 individuals in Great Falls who have obtained a bachelor's degree or higher.
| Field of Study | # Graduates | % Graduates |
| Computers & Mathematics | 482 | 3.9% |
| Bio, Nature & Agricultural | 809 | 6.5% |
| Physical & Health Sciences | 312 | 2.5% |
| Psychology | 643 | 5.1% |
| Social Sciences | 720 | 5.8% |
| Engineering | 385 | 3.1% |
| Multidisciplinary Studies | 9 | 0.1% |
| Science & Technology | 1,734 | 13.9% |
| Business | 2,009 | 16.1% |
| Education | 2,583 | 20.7% |
| Literature & Languages | 526 | 4.2% |
| Liberal Arts & History | 364 | 2.9% |
| Visual & Performing Arts | 468 | 3.7% |
| Communications | 497 | 4.0% |
| Arts & Humanities | 942 | 7.5% |
| Total | 12,483 | 100.0% |
Transportation & Commute in Great Falls
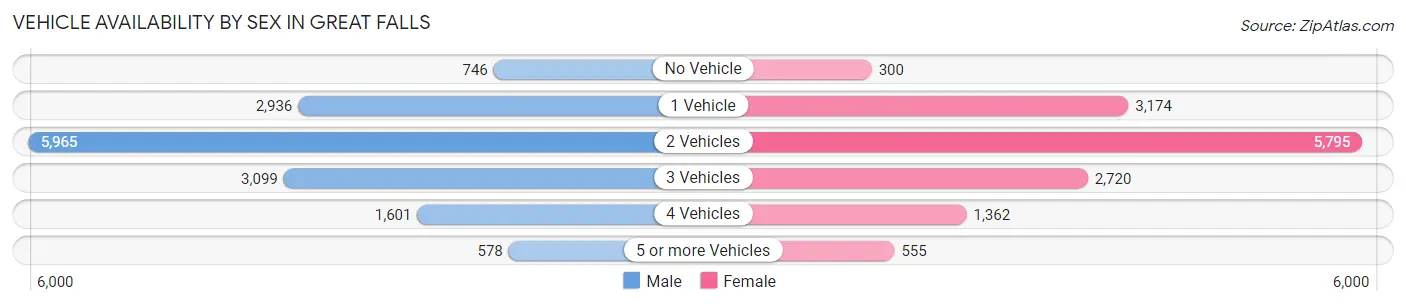
Vehicle Availability by Sex in Great Falls
The most prevalent vehicle ownership categories in Great Falls are males with 2 vehicles (5,965, accounting for 40.0%) and females with 2 vehicles (5,795, making up 42.9%).
| Vehicles Available | Male | Female |
| No Vehicle | 746 (5.0%) | 300 (2.2%) |
| 1 Vehicle | 2,936 (19.7%) | 3,174 (22.8%) |
| 2 Vehicles | 5,965 (40.0%) | 5,795 (41.7%) |
| 3 Vehicles | 3,099 (20.8%) | 2,720 (19.6%) |
| 4 Vehicles | 1,601 (10.7%) | 1,362 (9.8%) |
| 5 or more Vehicles | 578 (3.9%) | 555 (4.0%) |
| Total | 14,925 (100.0%) | 13,906 (100.0%) |
Commute Time in Great Falls
The most frequently occuring commute durations in Great Falls are 10 to 14 minutes (7,624 commuters, 27.8%), 15 to 19 minutes (7,118 commuters, 25.9%), and 5 to 9 minutes (6,022 commuters, 21.9%).
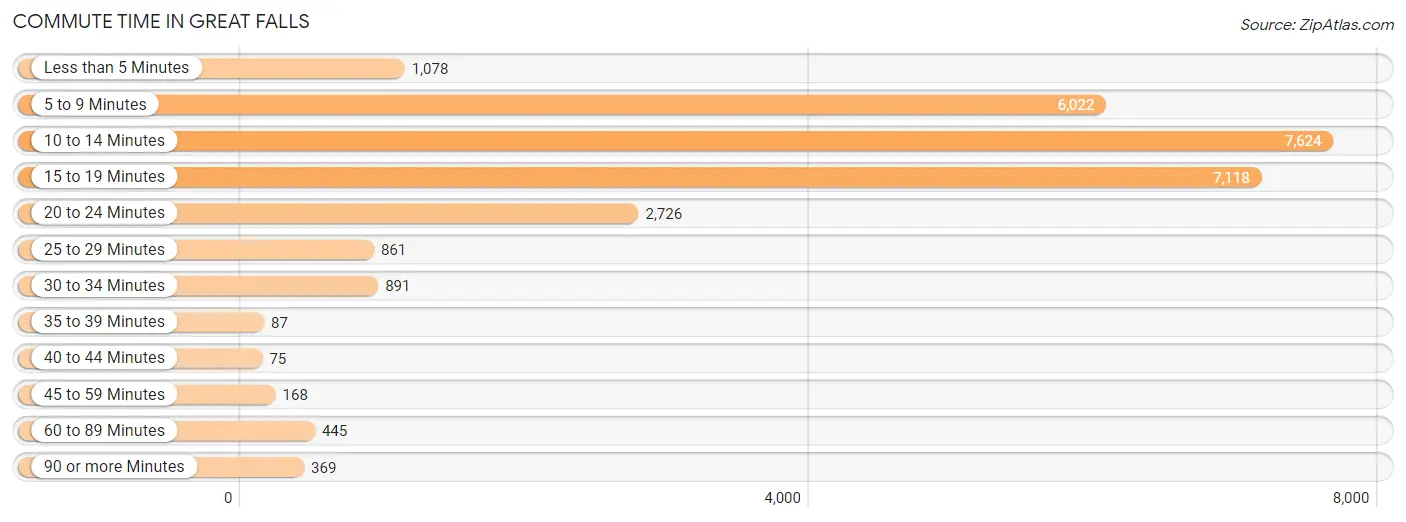
| Commute Time | # Commuters | % Commuters |
| Less than 5 Minutes | 1,078 | 3.9% |
| 5 to 9 Minutes | 6,022 | 21.9% |
| 10 to 14 Minutes | 7,624 | 27.8% |
| 15 to 19 Minutes | 7,118 | 25.9% |
| 20 to 24 Minutes | 2,726 | 9.9% |
| 25 to 29 Minutes | 861 | 3.1% |
| 30 to 34 Minutes | 891 | 3.2% |
| 35 to 39 Minutes | 87 | 0.3% |
| 40 to 44 Minutes | 75 | 0.3% |
| 45 to 59 Minutes | 168 | 0.6% |
| 60 to 89 Minutes | 445 | 1.6% |
| 90 or more Minutes | 369 | 1.3% |
Commute Time by Sex in Great Falls
The most common commute times in Great Falls are 10 to 14 minutes (4,162 commuters, 28.9%) for males and 10 to 14 minutes (3,462 commuters, 26.5%) for females.
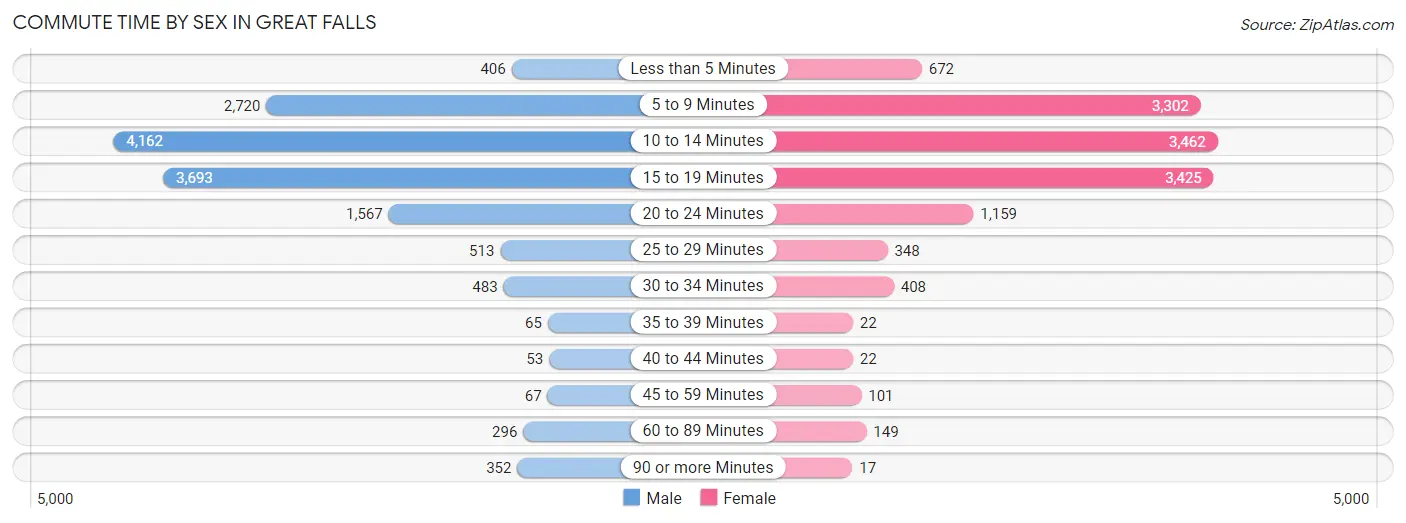
| Commute Time | Male | Female |
| Less than 5 Minutes | 406 (2.8%) | 672 (5.1%) |
| 5 to 9 Minutes | 2,720 (18.9%) | 3,302 (25.2%) |
| 10 to 14 Minutes | 4,162 (28.9%) | 3,462 (26.5%) |
| 15 to 19 Minutes | 3,693 (25.7%) | 3,425 (26.2%) |
| 20 to 24 Minutes | 1,567 (10.9%) | 1,159 (8.9%) |
| 25 to 29 Minutes | 513 (3.6%) | 348 (2.7%) |
| 30 to 34 Minutes | 483 (3.4%) | 408 (3.1%) |
| 35 to 39 Minutes | 65 (0.4%) | 22 (0.2%) |
| 40 to 44 Minutes | 53 (0.4%) | 22 (0.2%) |
| 45 to 59 Minutes | 67 (0.5%) | 101 (0.8%) |
| 60 to 89 Minutes | 296 (2.1%) | 149 (1.1%) |
| 90 or more Minutes | 352 (2.5%) | 17 (0.1%) |
Time of Departure to Work by Sex in Great Falls
The most frequent times of departure to work in Great Falls are 6:30 AM to 6:59 AM (2,426, 16.9%) for males and 7:30 AM to 7:59 AM (3,112, 23.8%) for females.
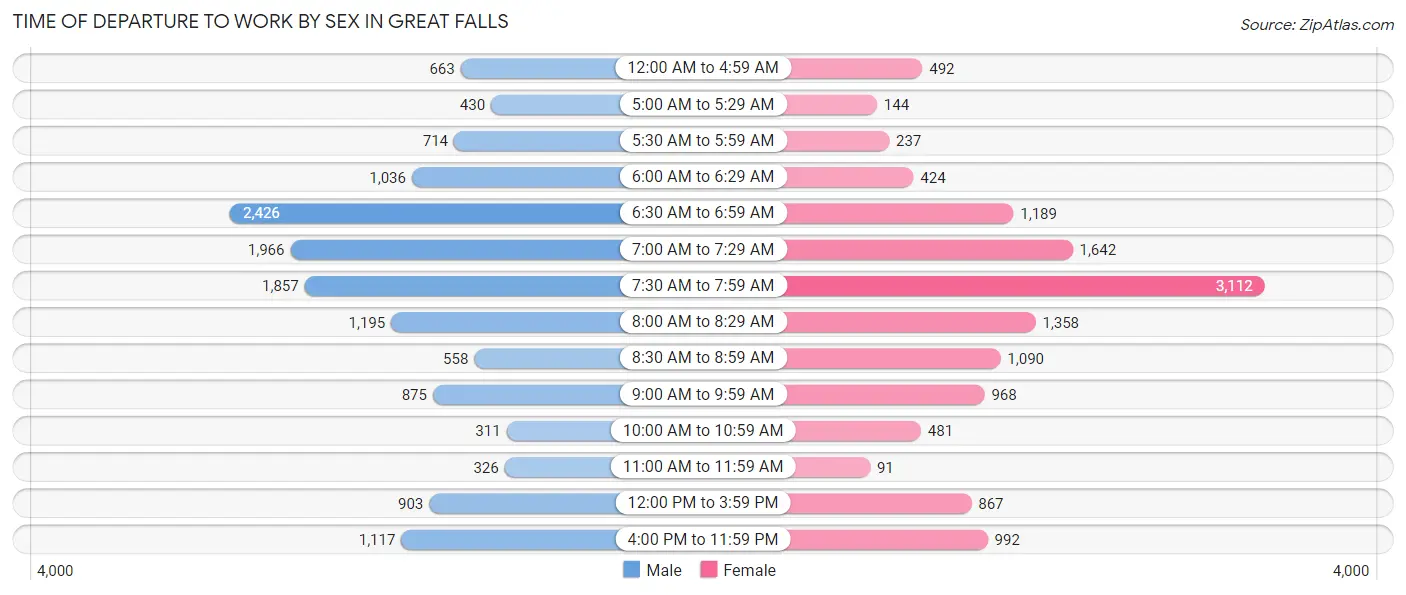
| Time of Departure | Male | Female |
| 12:00 AM to 4:59 AM | 663 (4.6%) | 492 (3.8%) |
| 5:00 AM to 5:29 AM | 430 (3.0%) | 144 (1.1%) |
| 5:30 AM to 5:59 AM | 714 (5.0%) | 237 (1.8%) |
| 6:00 AM to 6:29 AM | 1,036 (7.2%) | 424 (3.2%) |
| 6:30 AM to 6:59 AM | 2,426 (16.9%) | 1,189 (9.1%) |
| 7:00 AM to 7:29 AM | 1,966 (13.7%) | 1,642 (12.6%) |
| 7:30 AM to 7:59 AM | 1,857 (12.9%) | 3,112 (23.8%) |
| 8:00 AM to 8:29 AM | 1,195 (8.3%) | 1,358 (10.4%) |
| 8:30 AM to 8:59 AM | 558 (3.9%) | 1,090 (8.3%) |
| 9:00 AM to 9:59 AM | 875 (6.1%) | 968 (7.4%) |
| 10:00 AM to 10:59 AM | 311 (2.2%) | 481 (3.7%) |
| 11:00 AM to 11:59 AM | 326 (2.3%) | 91 (0.7%) |
| 12:00 PM to 3:59 PM | 903 (6.3%) | 867 (6.6%) |
| 4:00 PM to 11:59 PM | 1,117 (7.8%) | 992 (7.6%) |
| Total | 14,377 (100.0%) | 13,087 (100.0%) |
Housing Occupancy in Great Falls
Occupancy by Ownership in Great Falls
Of the total 25,720 dwellings in Great Falls, owner-occupied units account for 17,029 (66.2%), while renter-occupied units make up 8,691 (33.8%).
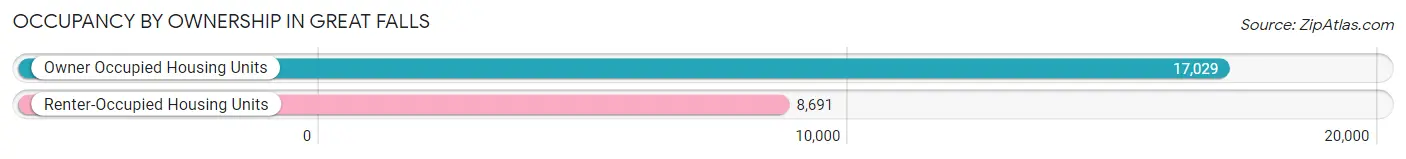
| Occupancy | # Housing Units | % Housing Units |
| Owner Occupied Housing Units | 17,029 | 66.2% |
| Renter-Occupied Housing Units | 8,691 | 33.8% |
| Total Occupied Housing Units | 25,720 | 100.0% |
Occupancy by Household Size in Great Falls
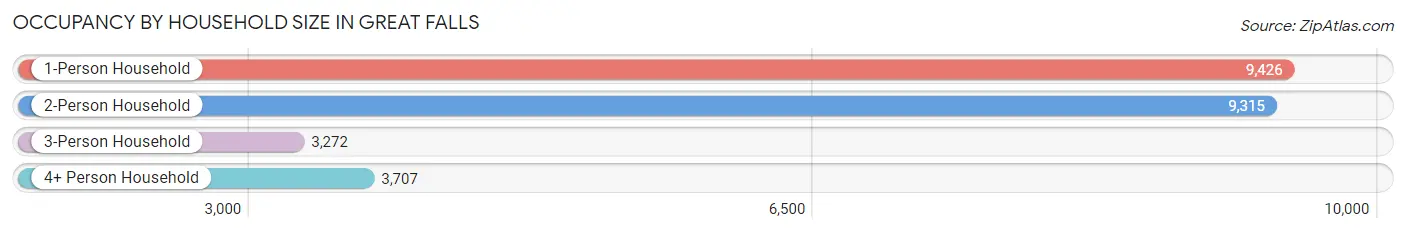
| Household Size | # Housing Units | % Housing Units |
| 1-Person Household | 9,426 | 36.6% |
| 2-Person Household | 9,315 | 36.2% |
| 3-Person Household | 3,272 | 12.7% |
| 4+ Person Household | 3,707 | 14.4% |
| Total Housing Units | 25,720 | 100.0% |
Occupancy by Ownership by Household Size in Great Falls
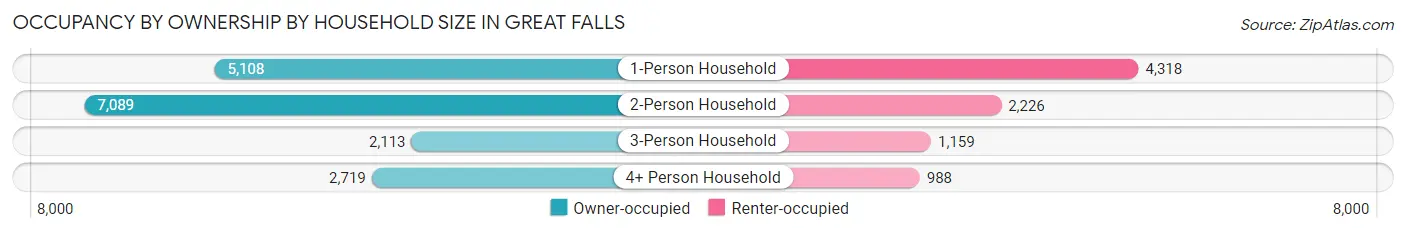
| Household Size | Owner-occupied | Renter-occupied |
| 1-Person Household | 5,108 (54.2%) | 4,318 (45.8%) |
| 2-Person Household | 7,089 (76.1%) | 2,226 (23.9%) |
| 3-Person Household | 2,113 (64.6%) | 1,159 (35.4%) |
| 4+ Person Household | 2,719 (73.4%) | 988 (26.7%) |
| Total Housing Units | 17,029 (66.2%) | 8,691 (33.8%) |
Occupancy by Educational Attainment in Great Falls
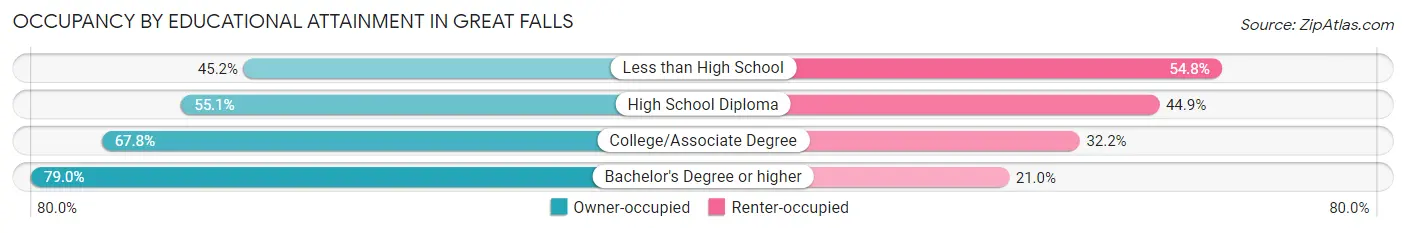
| Household Size | Owner-occupied | Renter-occupied |
| Less than High School | 530 (45.2%) | 642 (54.8%) |
| High School Diploma | 4,245 (55.1%) | 3,454 (44.9%) |
| College/Associate Degree | 6,359 (67.8%) | 3,025 (32.2%) |
| Bachelor's Degree or higher | 5,895 (79.0%) | 1,570 (21.0%) |
Occupancy by Age of Householder in Great Falls
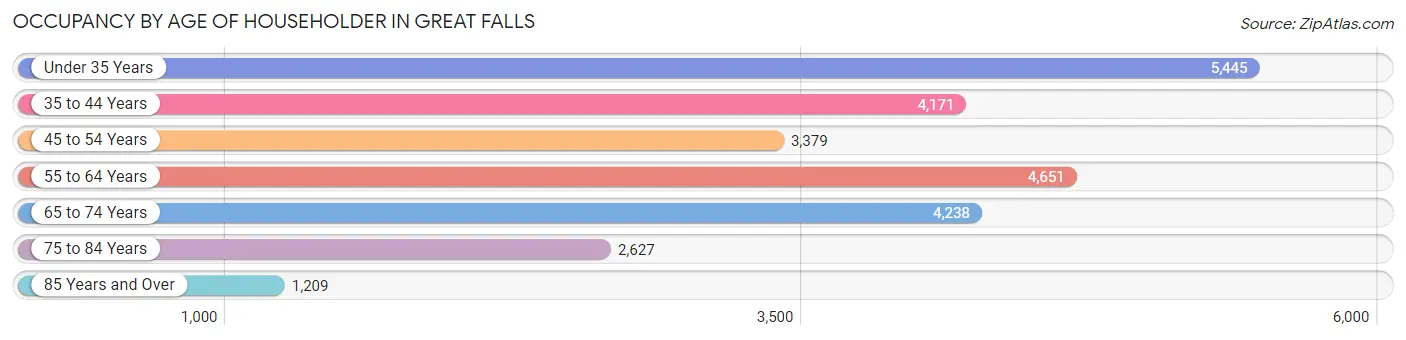
| Age Bracket | # Households | % Households |
| Under 35 Years | 5,445 | 21.2% |
| 35 to 44 Years | 4,171 | 16.2% |
| 45 to 54 Years | 3,379 | 13.1% |
| 55 to 64 Years | 4,651 | 18.1% |
| 65 to 74 Years | 4,238 | 16.5% |
| 75 to 84 Years | 2,627 | 10.2% |
| 85 Years and Over | 1,209 | 4.7% |
| Total | 25,720 | 100.0% |
Housing Finances in Great Falls
Median Income by Occupancy in Great Falls
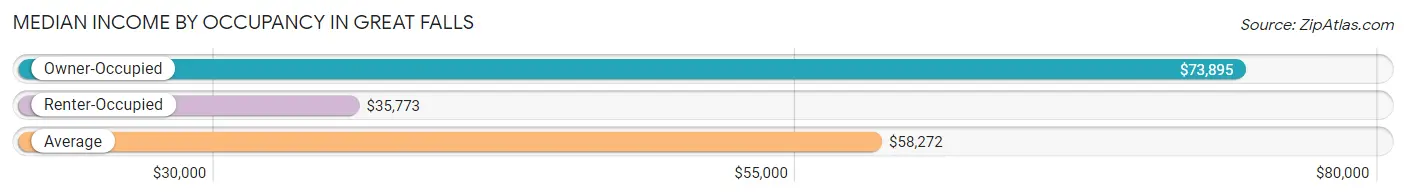
| Occupancy Type | # Households | Median Income |
| Owner-Occupied | 17,029 (66.2%) | $73,895 |
| Renter-Occupied | 8,691 (33.8%) | $35,773 |
| Average | 25,720 (100.0%) | $58,272 |
Occupancy by Householder Income Bracket in Great Falls
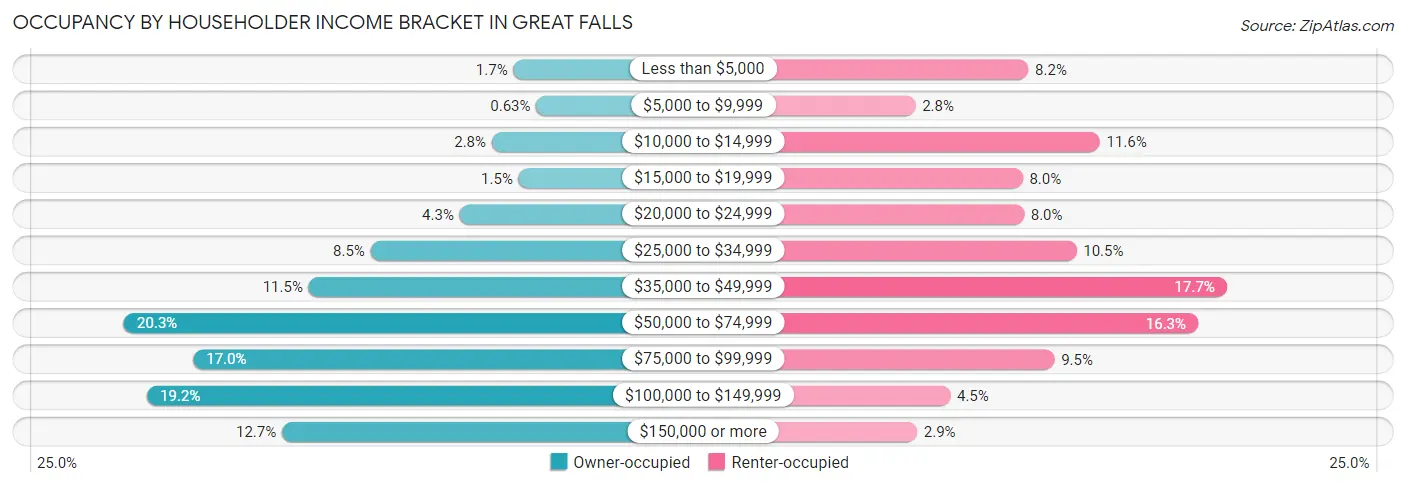
| Income Bracket | Owner-occupied | Renter-occupied |
| Less than $5,000 | 293 (1.7%) | 714 (8.2%) |
| $5,000 to $9,999 | 108 (0.6%) | 247 (2.8%) |
| $10,000 to $14,999 | 469 (2.8%) | 1,010 (11.6%) |
| $15,000 to $19,999 | 250 (1.5%) | 691 (8.0%) |
| $20,000 to $24,999 | 728 (4.3%) | 696 (8.0%) |
| $25,000 to $34,999 | 1,451 (8.5%) | 913 (10.5%) |
| $35,000 to $49,999 | 1,954 (11.5%) | 1,536 (17.7%) |
| $50,000 to $74,999 | 3,452 (20.3%) | 1,417 (16.3%) |
| $75,000 to $99,999 | 2,890 (17.0%) | 822 (9.5%) |
| $100,000 to $149,999 | 3,264 (19.2%) | 391 (4.5%) |
| $150,000 or more | 2,170 (12.7%) | 254 (2.9%) |
| Total | 17,029 (100.0%) | 8,691 (100.0%) |
Monthly Housing Cost Tiers in Great Falls
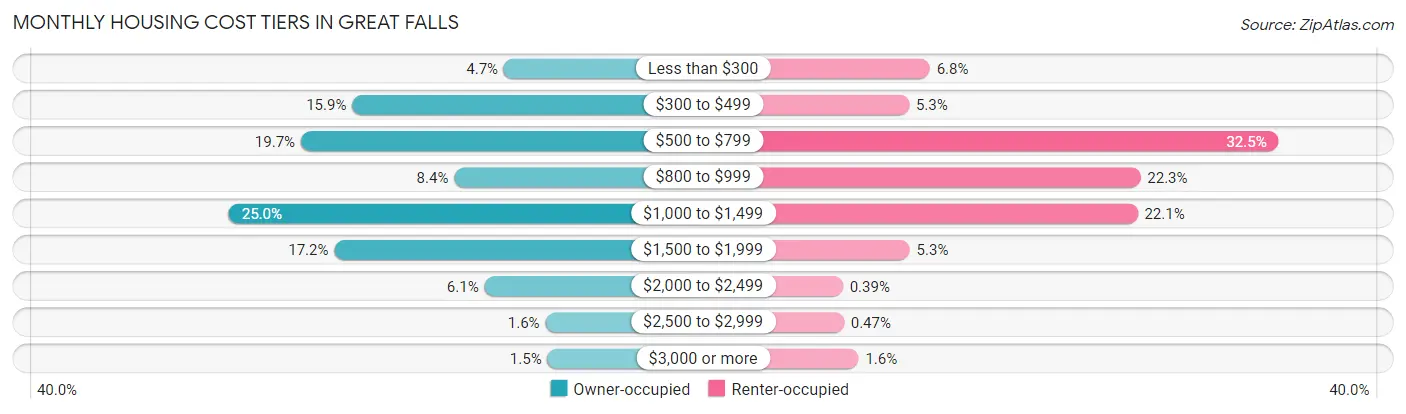
| Monthly Cost | Owner-occupied | Renter-occupied |
| Less than $300 | 801 (4.7%) | 591 (6.8%) |
| $300 to $499 | 2,703 (15.9%) | 458 (5.3%) |
| $500 to $799 | 3,346 (19.7%) | 2,823 (32.5%) |
| $800 to $999 | 1,423 (8.4%) | 1,939 (22.3%) |
| $1,000 to $1,499 | 4,251 (25.0%) | 1,921 (22.1%) |
| $1,500 to $1,999 | 2,928 (17.2%) | 462 (5.3%) |
| $2,000 to $2,499 | 1,044 (6.1%) | 34 (0.4%) |
| $2,500 to $2,999 | 279 (1.6%) | 41 (0.5%) |
| $3,000 or more | 254 (1.5%) | 135 (1.5%) |
| Total | 17,029 (100.0%) | 8,691 (100.0%) |
Physical Housing Characteristics in Great Falls
Housing Structures in Great Falls
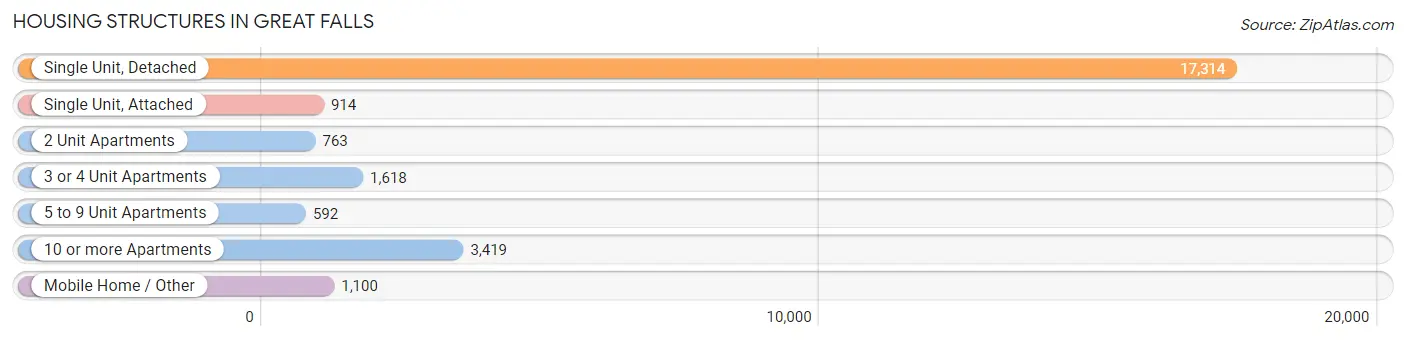
| Structure Type | # Housing Units | % Housing Units |
| Single Unit, Detached | 17,314 | 67.3% |
| Single Unit, Attached | 914 | 3.5% |
| 2 Unit Apartments | 763 | 3.0% |
| 3 or 4 Unit Apartments | 1,618 | 6.3% |
| 5 to 9 Unit Apartments | 592 | 2.3% |
| 10 or more Apartments | 3,419 | 13.3% |
| Mobile Home / Other | 1,100 | 4.3% |
| Total | 25,720 | 100.0% |
Housing Structures by Occupancy in Great Falls
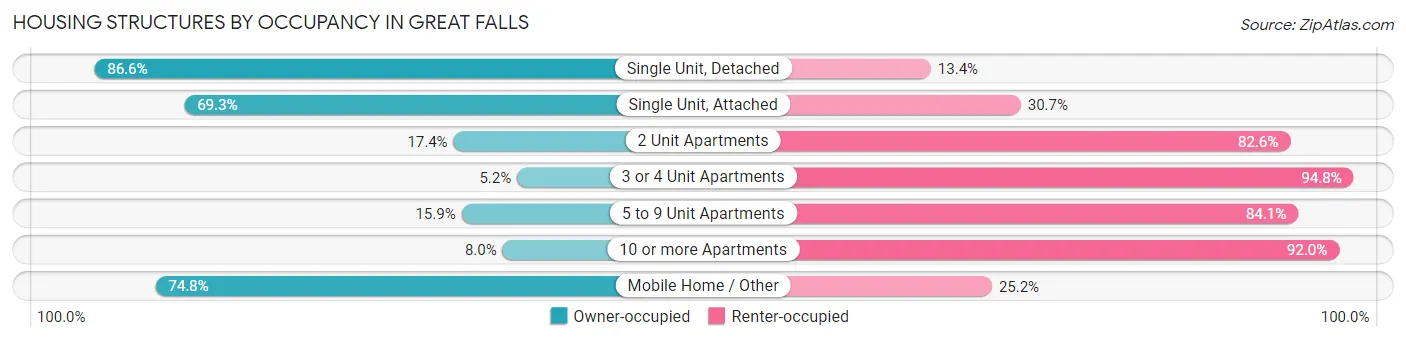
| Structure Type | Owner-occupied | Renter-occupied |
| Single Unit, Detached | 14,989 (86.6%) | 2,325 (13.4%) |
| Single Unit, Attached | 633 (69.3%) | 281 (30.7%) |
| 2 Unit Apartments | 133 (17.4%) | 630 (82.6%) |
| 3 or 4 Unit Apartments | 84 (5.2%) | 1,534 (94.8%) |
| 5 to 9 Unit Apartments | 94 (15.9%) | 498 (84.1%) |
| 10 or more Apartments | 273 (8.0%) | 3,146 (92.0%) |
| Mobile Home / Other | 823 (74.8%) | 277 (25.2%) |
| Total | 17,029 (66.2%) | 8,691 (33.8%) |
Housing Structures by Number of Rooms in Great Falls
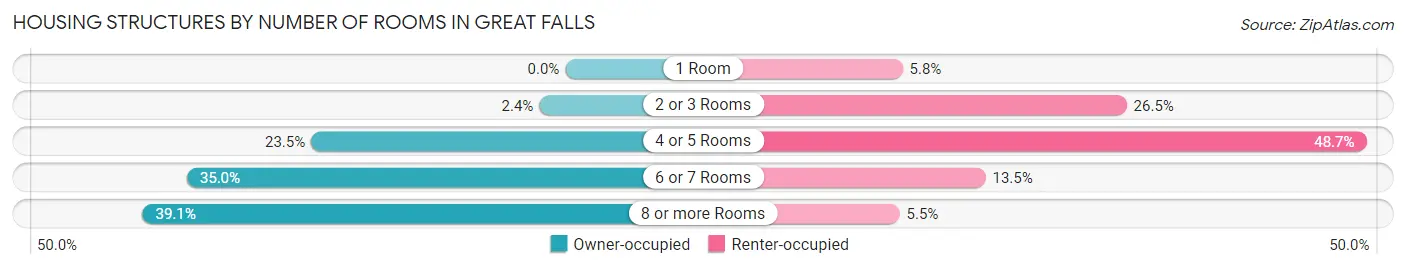
| Number of Rooms | Owner-occupied | Renter-occupied |
| 1 Room | 0 (0.0%) | 504 (5.8%) |
| 2 or 3 Rooms | 411 (2.4%) | 2,305 (26.5%) |
| 4 or 5 Rooms | 4,003 (23.5%) | 4,231 (48.7%) |
| 6 or 7 Rooms | 5,958 (35.0%) | 1,171 (13.5%) |
| 8 or more Rooms | 6,657 (39.1%) | 480 (5.5%) |
| Total | 17,029 (100.0%) | 8,691 (100.0%) |
Housing Structure by Heating Type in Great Falls
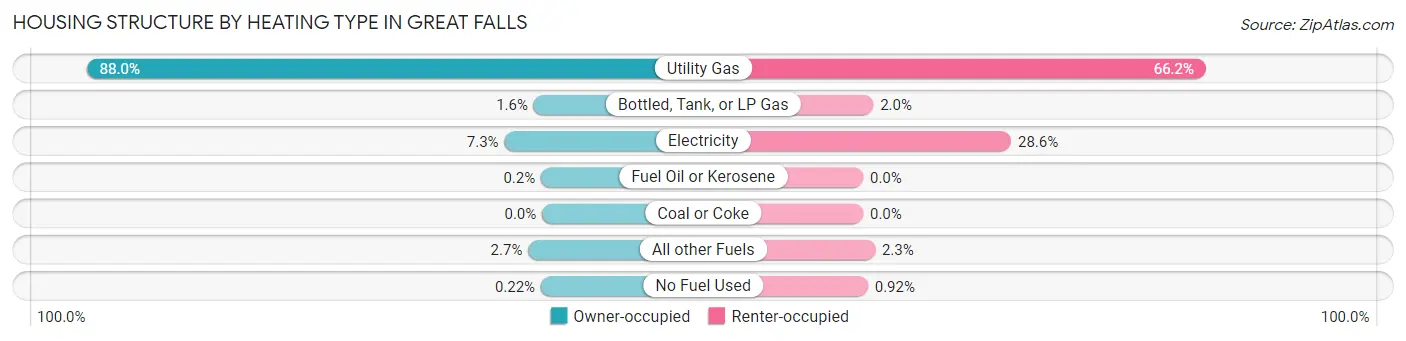
| Heating Type | Owner-occupied | Renter-occupied |
| Utility Gas | 14,987 (88.0%) | 5,755 (66.2%) |
| Bottled, Tank, or LP Gas | 275 (1.6%) | 170 (2.0%) |
| Electricity | 1,239 (7.3%) | 2,486 (28.6%) |
| Fuel Oil or Kerosene | 34 (0.2%) | 0 (0.0%) |
| Coal or Coke | 0 (0.0%) | 0 (0.0%) |
| All other Fuels | 456 (2.7%) | 200 (2.3%) |
| No Fuel Used | 38 (0.2%) | 80 (0.9%) |
| Total | 17,029 (100.0%) | 8,691 (100.0%) |
Household Vehicle Usage in Great Falls
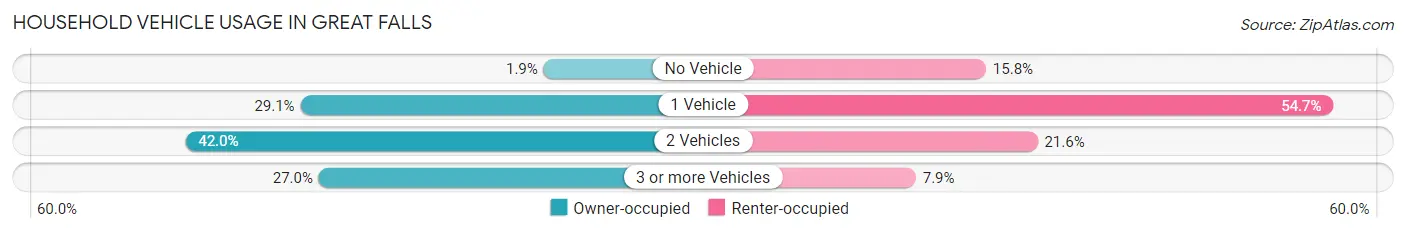
| Vehicles per Household | Owner-occupied | Renter-occupied |
| No Vehicle | 316 (1.9%) | 1,372 (15.8%) |
| 1 Vehicle | 4,955 (29.1%) | 4,754 (54.7%) |
| 2 Vehicles | 7,153 (42.0%) | 1,875 (21.6%) |
| 3 or more Vehicles | 4,605 (27.0%) | 690 (7.9%) |
| Total | 17,029 (100.0%) | 8,691 (100.0%) |
Real Estate & Mortgages in Great Falls
Real Estate and Mortgage Overview in Great Falls
| Characteristic | Without Mortgage | With Mortgage |
| Housing Units | 6,537 | 10,492 |
| Median Property Value | $222,300 | $224,600 |
| Median Household Income | $59,844 | $1,564 |
| Monthly Housing Costs | $489 | $211 |
| Real Estate Taxes | $2,145 | $227 |
Property Value by Mortgage Status in Great Falls
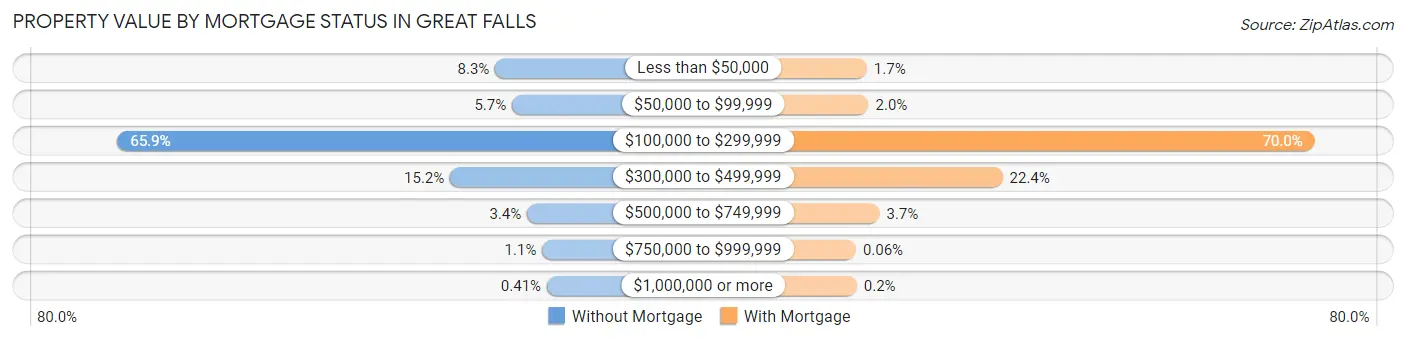
| Property Value | Without Mortgage | With Mortgage |
| Less than $50,000 | 542 (8.3%) | 181 (1.7%) |
| $50,000 to $99,999 | 374 (5.7%) | 209 (2.0%) |
| $100,000 to $299,999 | 4,306 (65.9%) | 7,340 (70.0%) |
| $300,000 to $499,999 | 991 (15.2%) | 2,351 (22.4%) |
| $500,000 to $749,999 | 224 (3.4%) | 384 (3.7%) |
| $750,000 to $999,999 | 73 (1.1%) | 6 (0.1%) |
| $1,000,000 or more | 27 (0.4%) | 21 (0.2%) |
| Total | 6,537 (100.0%) | 10,492 (100.0%) |
Household Income by Mortgage Status in Great Falls
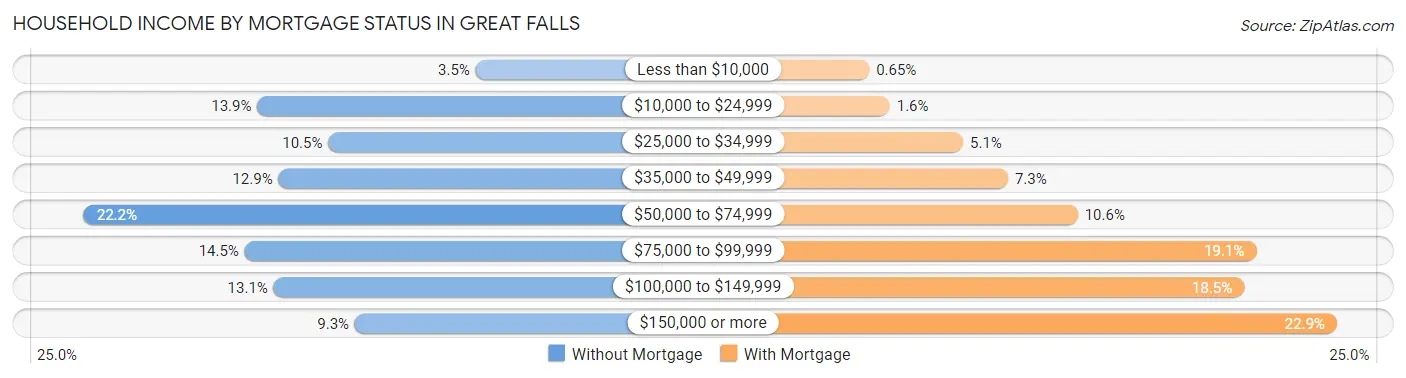
| Household Income | Without Mortgage | With Mortgage |
| Less than $10,000 | 230 (3.5%) | 68 (0.6%) |
| $10,000 to $24,999 | 910 (13.9%) | 171 (1.6%) |
| $25,000 to $34,999 | 689 (10.5%) | 537 (5.1%) |
| $35,000 to $49,999 | 844 (12.9%) | 762 (7.3%) |
| $50,000 to $74,999 | 1,450 (22.2%) | 1,110 (10.6%) |
| $75,000 to $99,999 | 949 (14.5%) | 2,002 (19.1%) |
| $100,000 to $149,999 | 859 (13.1%) | 1,941 (18.5%) |
| $150,000 or more | 606 (9.3%) | 2,405 (22.9%) |
| Total | 6,537 (100.0%) | 10,492 (100.0%) |
Property Value to Household Income Ratio in Great Falls
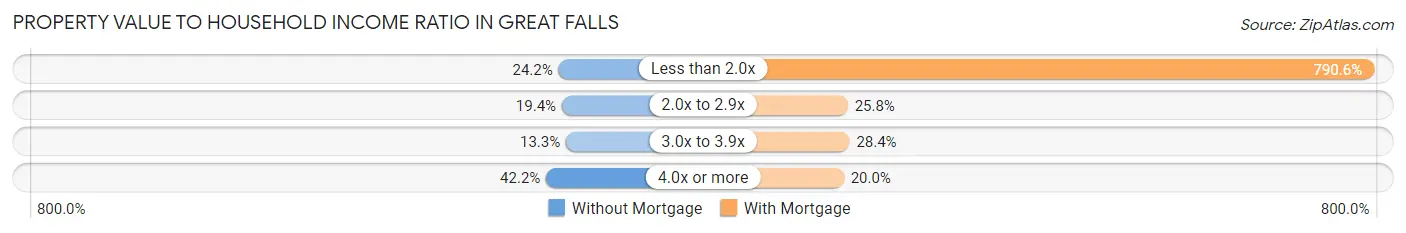
| Value-to-Income Ratio | Without Mortgage | With Mortgage |
| Less than 2.0x | 1,581 (24.2%) | 82,944 (790.5%) |
| 2.0x to 2.9x | 1,265 (19.4%) | 2,708 (25.8%) |
| 3.0x to 3.9x | 871 (13.3%) | 2,979 (28.4%) |
| 4.0x or more | 2,761 (42.2%) | 2,100 (20.0%) |
| Total | 6,537 (100.0%) | 10,492 (100.0%) |
Real Estate Taxes by Mortgage Status in Great Falls
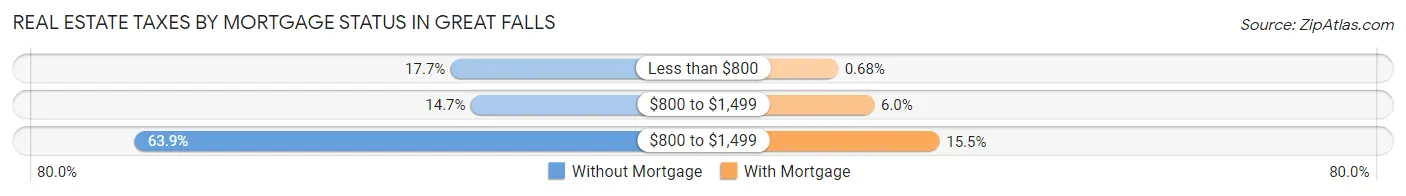
| Property Taxes | Without Mortgage | With Mortgage |
| Less than $800 | 1,155 (17.7%) | 71 (0.7%) |
| $800 to $1,499 | 962 (14.7%) | 628 (6.0%) |
| $800 to $1,499 | 4,176 (63.9%) | 1,629 (15.5%) |
| Total | 6,537 (100.0%) | 10,492 (100.0%) |
Health & Disability in Great Falls
Health Insurance Coverage by Age in Great Falls
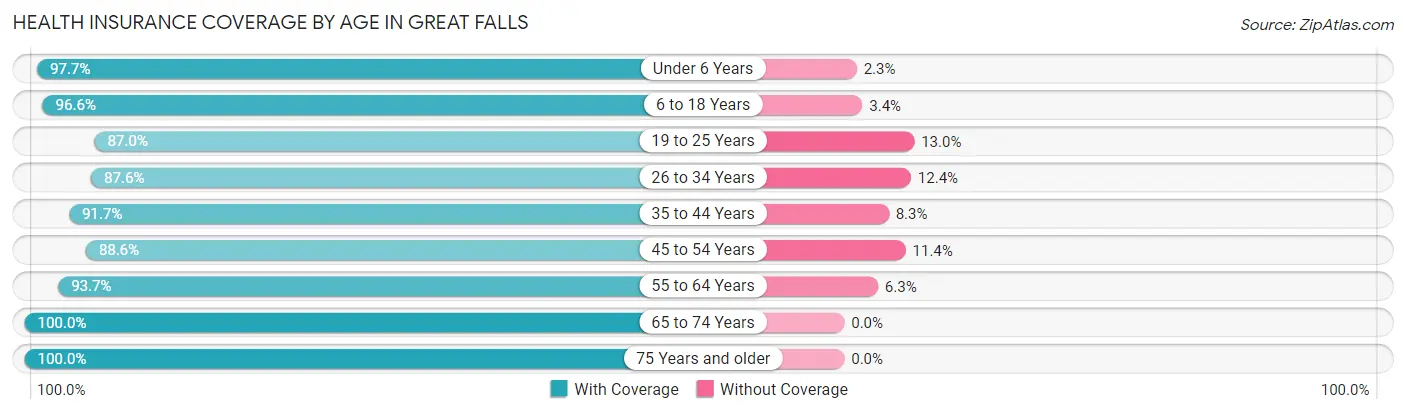
| Age Bracket | With Coverage | Without Coverage |
| Under 6 Years | 3,793 (97.7%) | 90 (2.3%) |
| 6 to 18 Years | 9,309 (96.6%) | 325 (3.4%) |
| 19 to 25 Years | 4,395 (87.0%) | 659 (13.0%) |
| 26 to 34 Years | 6,269 (87.6%) | 889 (12.4%) |
| 35 to 44 Years | 6,424 (91.7%) | 580 (8.3%) |
| 45 to 54 Years | 5,749 (88.6%) | 742 (11.4%) |
| 55 to 64 Years | 7,129 (93.7%) | 477 (6.3%) |
| 65 to 74 Years | 6,335 (100.0%) | 0 (0.0%) |
| 75 Years and older | 5,097 (100.0%) | 0 (0.0%) |
| Total | 54,500 (93.5%) | 3,762 (6.5%) |
Health Insurance Coverage by Citizenship Status in Great Falls
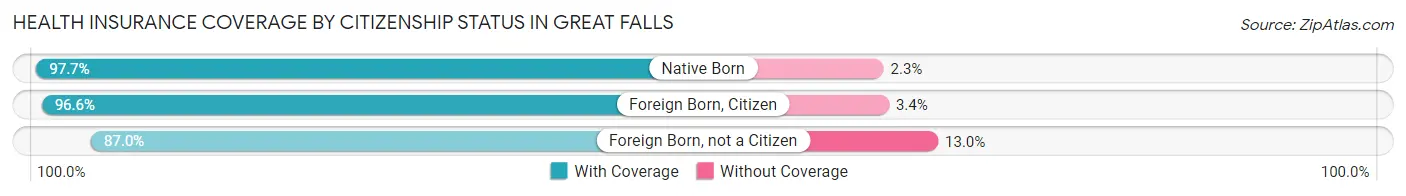
| Citizenship Status | With Coverage | Without Coverage |
| Native Born | 3,793 (97.7%) | 90 (2.3%) |
| Foreign Born, Citizen | 9,309 (96.6%) | 325 (3.4%) |
| Foreign Born, not a Citizen | 4,395 (87.0%) | 659 (13.0%) |
Health Insurance Coverage by Household Income in Great Falls
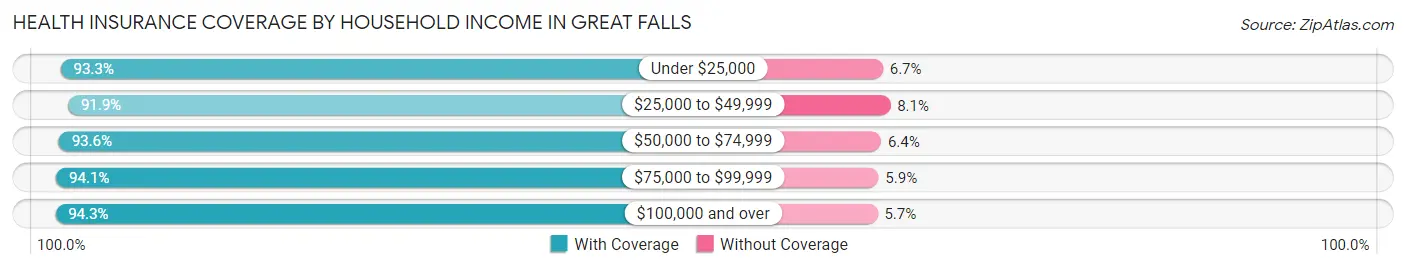
| Household Income | With Coverage | Without Coverage |
| Under $25,000 | 7,457 (93.3%) | 539 (6.7%) |
| $25,000 to $49,999 | 10,164 (91.9%) | 899 (8.1%) |
| $50,000 to $74,999 | 10,234 (93.6%) | 700 (6.4%) |
| $75,000 to $99,999 | 8,884 (94.1%) | 559 (5.9%) |
| $100,000 and over | 16,993 (94.3%) | 1,034 (5.7%) |
Public vs Private Health Insurance Coverage by Age in Great Falls
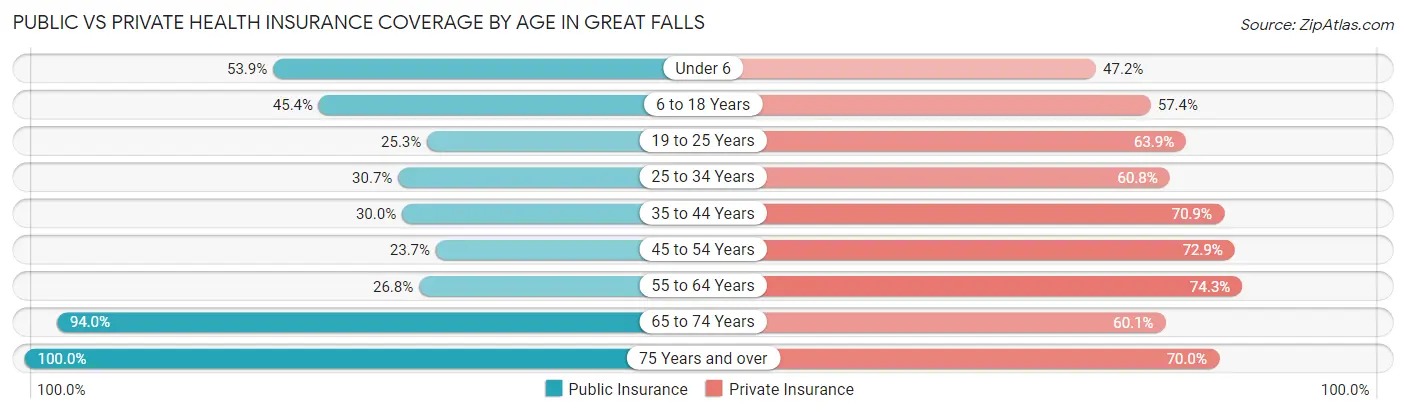
| Age Bracket | Public Insurance | Private Insurance |
| Under 6 | 2,092 (53.9%) | 1,833 (47.2%) |
| 6 to 18 Years | 4,372 (45.4%) | 5,525 (57.4%) |
| 19 to 25 Years | 1,278 (25.3%) | 3,229 (63.9%) |
| 25 to 34 Years | 2,195 (30.7%) | 4,355 (60.8%) |
| 35 to 44 Years | 2,098 (29.9%) | 4,966 (70.9%) |
| 45 to 54 Years | 1,536 (23.7%) | 4,733 (72.9%) |
| 55 to 64 Years | 2,037 (26.8%) | 5,652 (74.3%) |
| 65 to 74 Years | 5,956 (94.0%) | 3,805 (60.1%) |
| 75 Years and over | 5,097 (100.0%) | 3,566 (70.0%) |
| Total | 26,661 (45.8%) | 37,664 (64.6%) |
Disability Status by Sex by Age in Great Falls
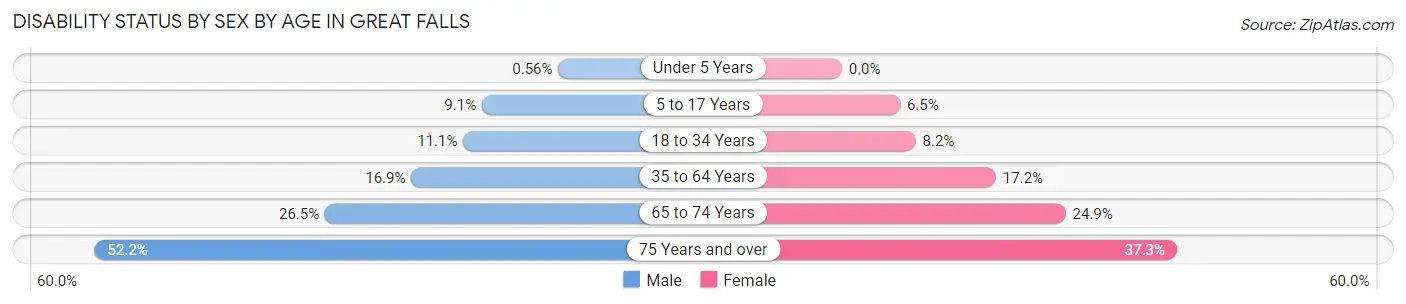
| Age Bracket | Male | Female |
| Under 5 Years | 9 (0.6%) | 0 (0.0%) |
| 5 to 17 Years | 435 (9.1%) | 299 (6.5%) |
| 18 to 34 Years | 734 (11.1%) | 528 (8.2%) |
| 35 to 64 Years | 1,755 (16.9%) | 1,842 (17.2%) |
| 65 to 74 Years | 792 (26.5%) | 835 (24.9%) |
| 75 Years and over | 1,048 (52.2%) | 1,153 (37.3%) |
Disability Class by Sex by Age in Great Falls
Disability Class: Hearing Difficulty
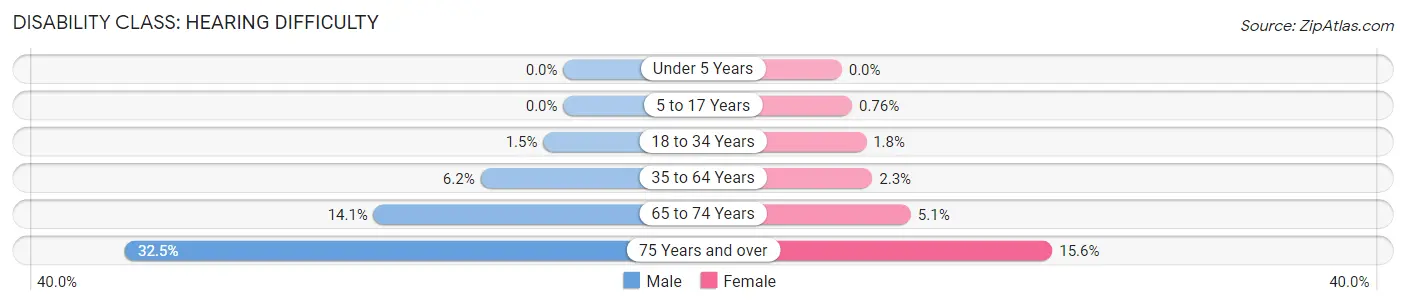
| Age Bracket | Male | Female |
| Under 5 Years | 0 (0.0%) | 0 (0.0%) |
| 5 to 17 Years | 0 (0.0%) | 35 (0.8%) |
| 18 to 34 Years | 98 (1.5%) | 116 (1.8%) |
| 35 to 64 Years | 638 (6.1%) | 244 (2.3%) |
| 65 to 74 Years | 420 (14.1%) | 172 (5.1%) |
| 75 Years and over | 653 (32.5%) | 483 (15.6%) |
Disability Class: Vision Difficulty
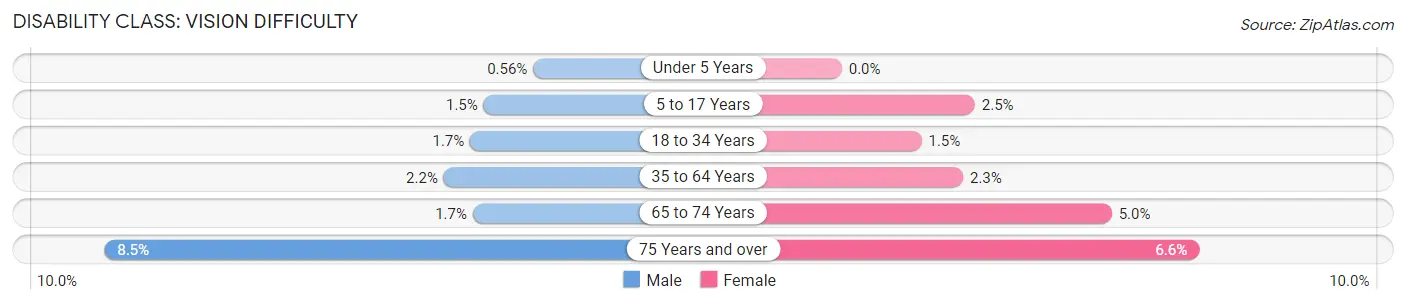
| Age Bracket | Male | Female |
| Under 5 Years | 9 (0.6%) | 0 (0.0%) |
| 5 to 17 Years | 71 (1.5%) | 114 (2.5%) |
| 18 to 34 Years | 114 (1.7%) | 95 (1.5%) |
| 35 to 64 Years | 230 (2.2%) | 242 (2.2%) |
| 65 to 74 Years | 50 (1.7%) | 168 (5.0%) |
| 75 Years and over | 171 (8.5%) | 205 (6.6%) |
Disability Class: Cognitive Difficulty
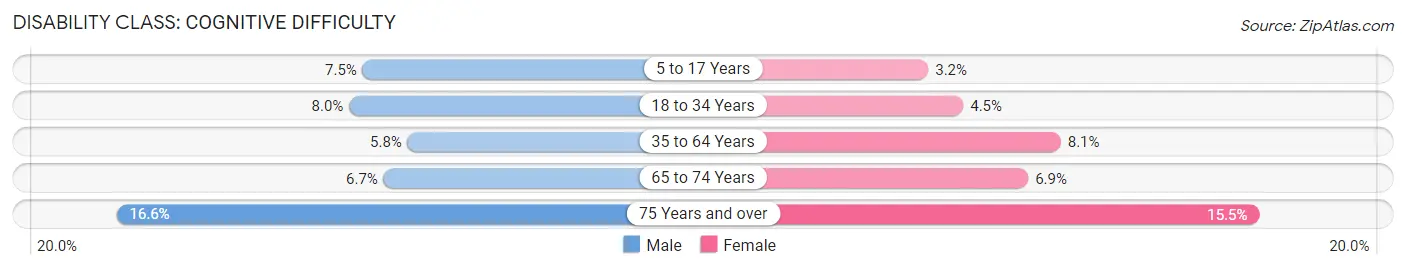
| Age Bracket | Male | Female |
| 5 to 17 Years | 358 (7.4%) | 148 (3.2%) |
| 18 to 34 Years | 524 (8.0%) | 290 (4.5%) |
| 35 to 64 Years | 599 (5.8%) | 872 (8.1%) |
| 65 to 74 Years | 199 (6.7%) | 232 (6.9%) |
| 75 Years and over | 333 (16.6%) | 479 (15.5%) |
Disability Class: Ambulatory Difficulty
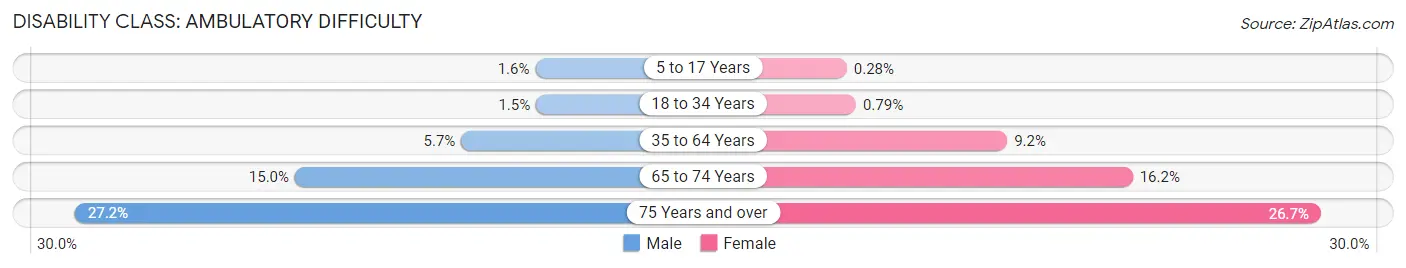
| Age Bracket | Male | Female |
| 5 to 17 Years | 75 (1.6%) | 13 (0.3%) |
| 18 to 34 Years | 100 (1.5%) | 51 (0.8%) |
| 35 to 64 Years | 590 (5.7%) | 988 (9.2%) |
| 65 to 74 Years | 446 (14.9%) | 543 (16.2%) |
| 75 Years and over | 546 (27.2%) | 824 (26.7%) |
Disability Class: Self-Care Difficulty
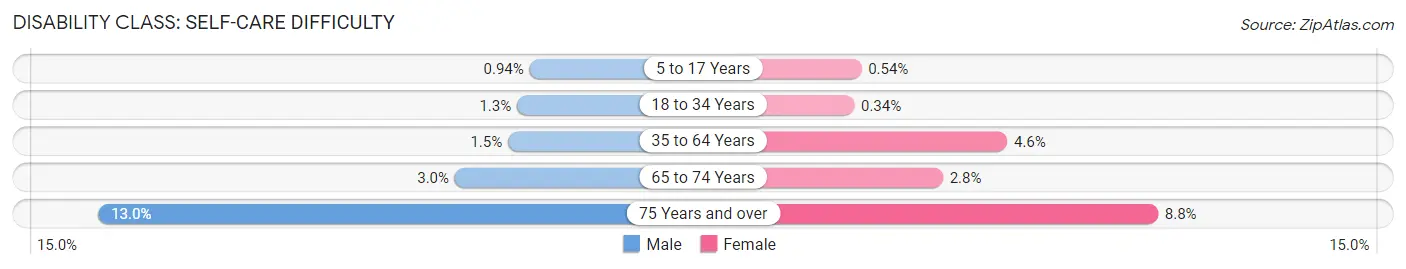
| Age Bracket | Male | Female |
| 5 to 17 Years | 45 (0.9%) | 25 (0.5%) |
| 18 to 34 Years | 85 (1.3%) | 22 (0.3%) |
| 35 to 64 Years | 160 (1.5%) | 494 (4.6%) |
| 65 to 74 Years | 90 (3.0%) | 94 (2.8%) |
| 75 Years and over | 260 (13.0%) | 272 (8.8%) |
Technology Access in Great Falls
Computing Device Access in Great Falls
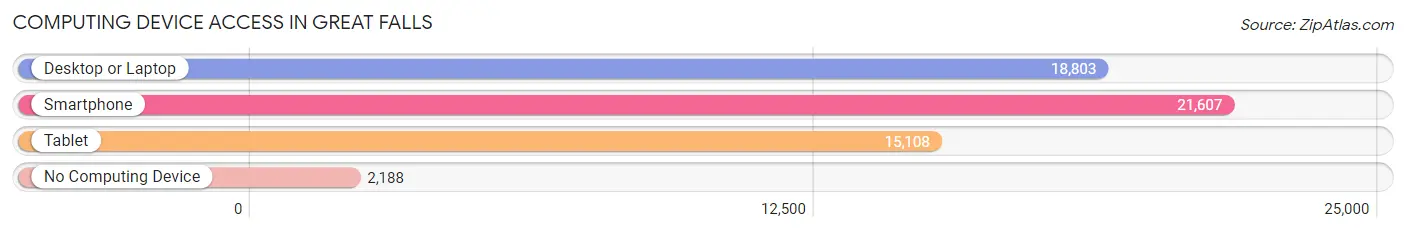
| Device Type | # Households | % Households |
| Desktop or Laptop | 18,803 | 73.1% |
| Smartphone | 21,607 | 84.0% |
| Tablet | 15,108 | 58.7% |
| No Computing Device | 2,188 | 8.5% |
| Total | 25,720 | 100.0% |
Internet Access in Great Falls
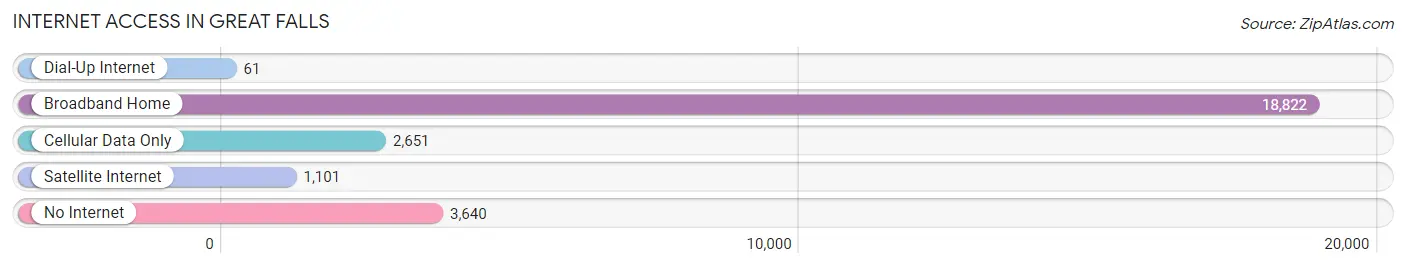
| Internet Type | # Households | % Households |
| Dial-Up Internet | 61 | 0.2% |
| Broadband Home | 18,822 | 73.2% |
| Cellular Data Only | 2,651 | 10.3% |
| Satellite Internet | 1,101 | 4.3% |
| No Internet | 3,640 | 14.1% |
| Total | 25,720 | 100.0% |
Great Falls Summary
Great Falls, Montana is a city located in Cascade County, Montana. It is the third largest city in the state, with a population of 58,505 as of the 2019 census. The city is situated along the Missouri River, and is the county seat of Cascade County. Great Falls is known for its spectacular waterfalls, which are the namesake of the city.
History
The area that is now Great Falls was first inhabited by the Blackfeet Native American tribe. The first European settlers arrived in the area in the late 1800s, and the city was officially founded in 1883. The city was named after the five waterfalls that are located along the Missouri River. The city quickly grew, and by the early 1900s, it had become an important industrial center. The city was home to several large factories, including a smelter, a woolen mill, and a paper mill.
Geography
Great Falls is located in north-central Montana, along the Missouri River. The city is situated at an elevation of 3,400 feet, and is surrounded by the Rocky Mountains. The city covers an area of 28.2 square miles, and has a humid continental climate, with cold winters and hot summers.
Economy
Great Falls is an important economic center in Montana. The city is home to several large industries, including manufacturing, healthcare, and tourism. The city is also home to Malmstrom Air Force Base, which is the largest employer in the city. The city is also home to several large companies, including Benefis Health System, Montana Rail Link, and the Great Falls Tribune.
Demographics
As of the 2019 census, Great Falls had a population of 58,505. The city has a median age of 38.7 years, and a median household income of $50,845. The city is predominantly white, with a population that is 87.3% white, 4.2% Native American, 2.3% Hispanic or Latino, and 1.7% Asian.
Great Falls is a vibrant and diverse city, with a rich history and a strong economy. The city is home to several large industries, and is an important economic center in Montana. The city is also home to several large companies, and is a popular tourist destination. Great Falls is a great place to live, work, and visit.
Common Questions
What is Per Capita Income in Great Falls?
Per Capita income in Great Falls is $33,437.
What is the Median Family Income in Great Falls?
Median Family Income in Great Falls is $78,799.
What is the Median Household income in Great Falls?
Median Household Income in Great Falls is $58,272.
What is Income or Wage Gap in Great Falls?
Income or Wage Gap in Great Falls is 30.5%.
Women in Great Falls earn 69.5 cents for every dollar earned by a man.
What is Family Income Deficit in Great Falls?
Family Income Deficit in Great Falls is $10,409.
Families that are below poverty line in Great Falls earn $10,409 less on average than the poverty threshold level.
What is Inequality or Gini Index in Great Falls?
Inequality or Gini Index in Great Falls is 0.45.
What is the Total Population of Great Falls?
Total Population of Great Falls is 60,373.
What is the Total Male Population of Great Falls?
Total Male Population of Great Falls is 29,876.
What is the Total Female Population of Great Falls?
Total Female Population of Great Falls is 30,497.
What is the Ratio of Males per 100 Females in Great Falls?
There are 97.96 Males per 100 Females in Great Falls.
What is the Ratio of Females per 100 Males in Great Falls?
There are 102.08 Females per 100 Males in Great Falls.
What is the Median Population Age in Great Falls?
Median Population Age in Great Falls is 38.8 Years.
What is the Average Family Size in Great Falls
Average Family Size in Great Falls is 3.0 People.
What is the Average Household Size in Great Falls
Average Household Size in Great Falls is 2.3 People.
How Large is the Labor Force in Great Falls?
There are 30,861 People in the Labor Forcein in Great Falls.
What is the Percentage of People in the Labor Force in Great Falls?
62.8% of People are in the Labor Force in Great Falls.
What is the Unemployment Rate in Great Falls?
Unemployment Rate in Great Falls is 3.4%.