Zip Codes with the Highest Percentage of Population Employed in Life, Physical & Social Science in Pearland, TX
RELATED REPORTS & OPTIONS
Life, Physical & Social Science
Pearland
Compare Zip Codes
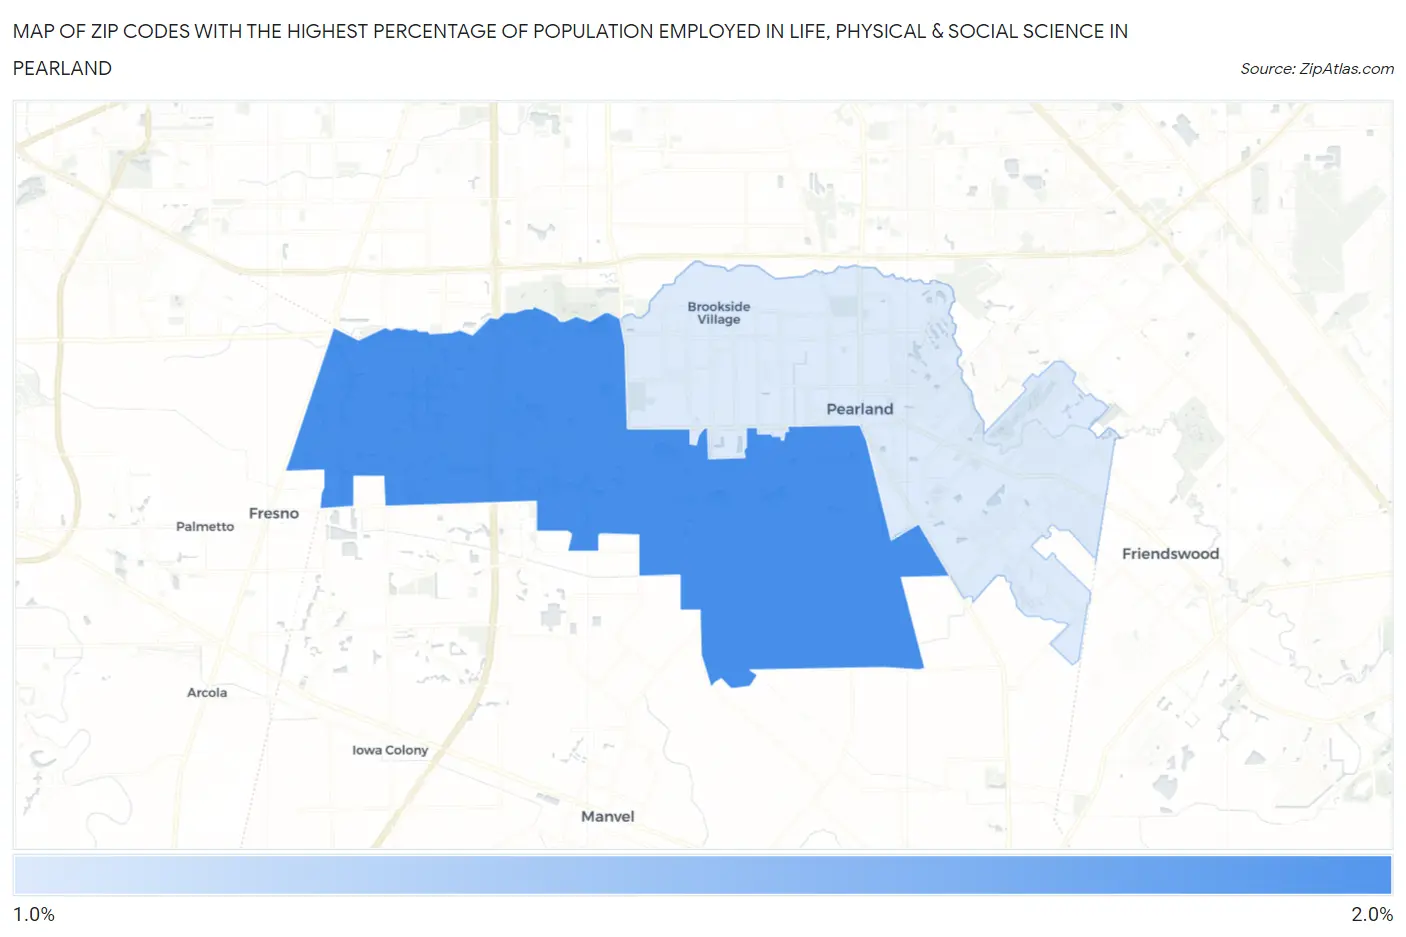
Map of Zip Codes with the Highest Percentage of Population Employed in Life, Physical & Social Science in Pearland
1.3%
1.8%
Zip Codes with the Highest Percentage of Population Employed in Life, Physical & Social Science in Pearland, TX
| Zip Code | % Employed | vs State | vs National | |
| 1. | 77584 | 1.8% | 0.84%(+0.968)#155 | 1.1%(+0.719)#4,290 |
| 2. | 77581 | 1.3% | 0.84%(+0.443)#289 | 1.1%(+0.194)#6,902 |
1
Common Questions
What are the Top Zip Codes with the Highest Percentage of Population Employed in Life, Physical & Social Science in Pearland, TX?
Top Zip Codes with the Highest Percentage of Population Employed in Life, Physical & Social Science in Pearland, TX are:
What zip code has the Highest Percentage of Population Employed in Life, Physical & Social Science in Pearland, TX?
77584 has the Highest Percentage of Population Employed in Life, Physical & Social Science in Pearland, TX with 1.8%.
What is the Percentage of Population Employed in Life, Physical & Social Science in Pearland, TX?
Percentage of Population Employed in Life, Physical & Social Science in Pearland is 1.6%.
What is the Percentage of Population Employed in Life, Physical & Social Science in Texas?
Percentage of Population Employed in Life, Physical & Social Science in Texas is 0.84%.
What is the Percentage of Population Employed in Life, Physical & Social Science in the United States?
Percentage of Population Employed in Life, Physical & Social Science in the United States is 1.1%.