Zip Codes with the Highest Percentage of Population Employed in Life, Physical & Social Science in Brownsville, TX
RELATED REPORTS & OPTIONS
Life, Physical & Social Science
Brownsville
Compare Zip Codes
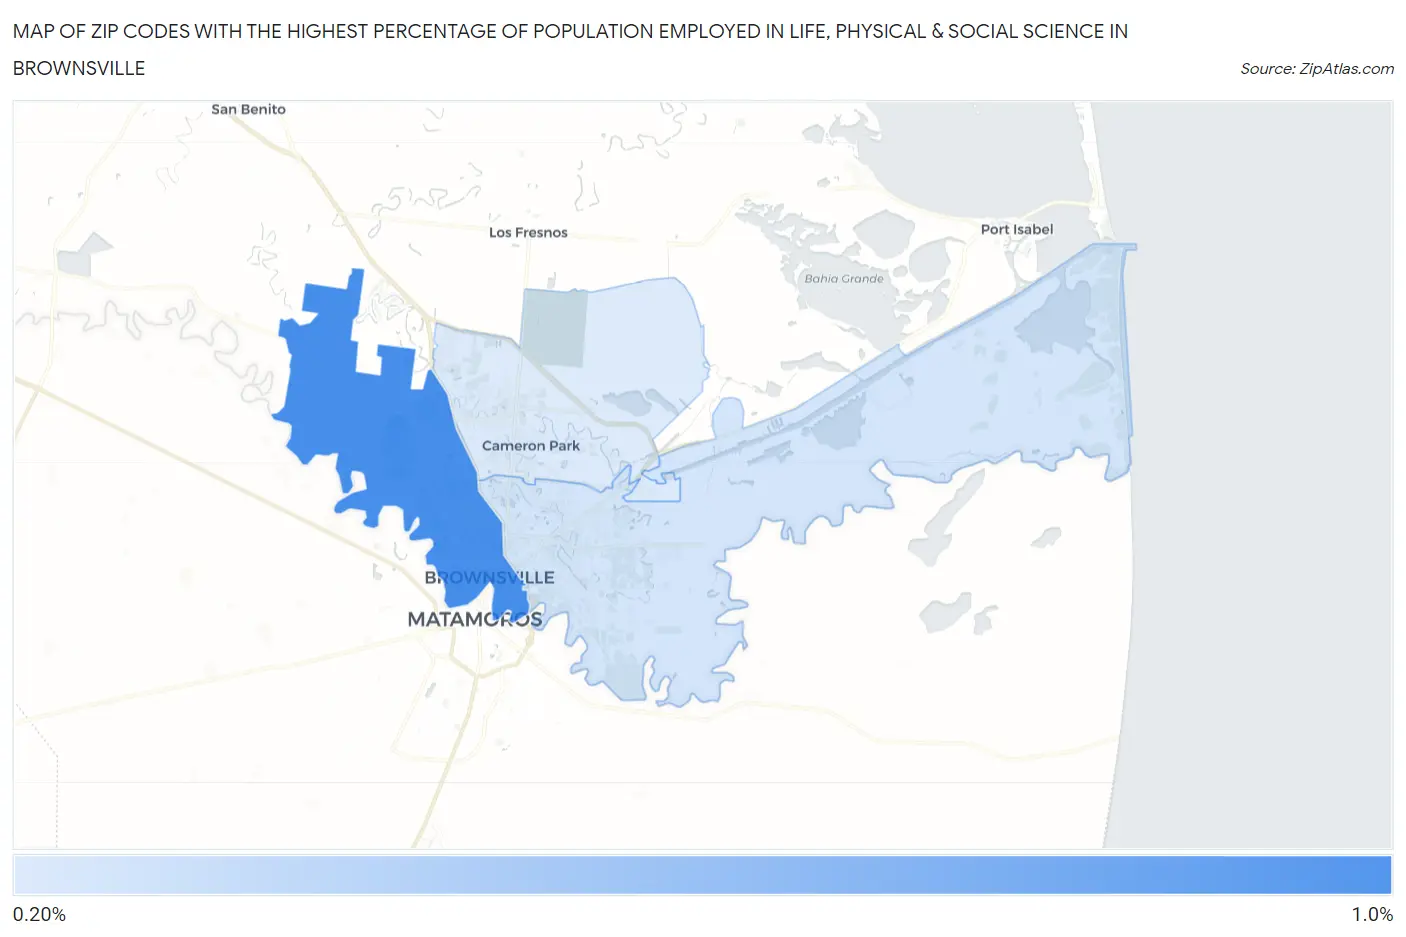
Map of Zip Codes with the Highest Percentage of Population Employed in Life, Physical & Social Science in Brownsville
0.29%
0.98%
Zip Codes with the Highest Percentage of Population Employed in Life, Physical & Social Science in Brownsville, TX
| Zip Code | % Employed | vs State | vs National | |
| 1. | 78520 | 0.98% | 0.84%(+0.135)#422 | 1.1%(-0.113)#9,253 |
| 2. | 78521 | 0.33% | 0.84%(-0.510)#887 | 1.1%(-0.758)#16,637 |
| 3. | 78526 | 0.29% | 0.84%(-0.554)#927 | 1.1%(-0.802)#17,197 |
1
Common Questions
What are the Top Zip Codes with the Highest Percentage of Population Employed in Life, Physical & Social Science in Brownsville, TX?
Top Zip Codes with the Highest Percentage of Population Employed in Life, Physical & Social Science in Brownsville, TX are:
What zip code has the Highest Percentage of Population Employed in Life, Physical & Social Science in Brownsville, TX?
78520 has the Highest Percentage of Population Employed in Life, Physical & Social Science in Brownsville, TX with 0.98%.
What is the Percentage of Population Employed in Life, Physical & Social Science in Brownsville, TX?
Percentage of Population Employed in Life, Physical & Social Science in Brownsville is 0.53%.
What is the Percentage of Population Employed in Life, Physical & Social Science in Texas?
Percentage of Population Employed in Life, Physical & Social Science in Texas is 0.84%.
What is the Percentage of Population Employed in Life, Physical & Social Science in the United States?
Percentage of Population Employed in Life, Physical & Social Science in the United States is 1.1%.