Palm Valley, TX Map & Demographics
Palm Valley Map
Palm Valley Overview
$42,143
PER CAPITA INCOME
$89,904
AVG FAMILY INCOME
$69,773
AVG HOUSEHOLD INCOME
29.0%
WAGE / INCOME GAP [ % ]
71.0¢/ $1
WAGE / INCOME GAP [ $ ]
0.42
INEQUALITY / GINI INDEX
1,876
TOTAL POPULATION
823
MALE POPULATION
1,053
FEMALE POPULATION
78.16
MALES / 100 FEMALES
127.95
FEMALES / 100 MALES
45.0
MEDIAN AGE
3.2
AVG FAMILY SIZE
2.5
AVG HOUSEHOLD SIZE
645
LABOR FORCE [ PEOPLE ]
46.1%
PERCENT IN LABOR FORCE
4.2%
UNEMPLOYMENT RATE
Palm Valley Area Codes
Income in Palm Valley
Income Overview in Palm Valley
Per Capita Income in Palm Valley is $42,143, while median incomes of families and households are $89,904 and $69,773 respectively.
| Characteristic | Number | Measure |
| Per Capita Income | 1,876 | $42,143 |
| Median Family Income | 511 | $89,904 |
| Mean Family Income | 511 | $111,181 |
| Median Household Income | 736 | $69,773 |
| Mean Household Income | 736 | $102,181 |
| Income Deficit | 511 | $0 |
| Wage / Income Gap (%) | 1,876 | 29.00% |
| Wage / Income Gap ($) | 1,876 | 71.00¢ per $1 |
| Gini / Inequality Index | 1,876 | 0.42 |
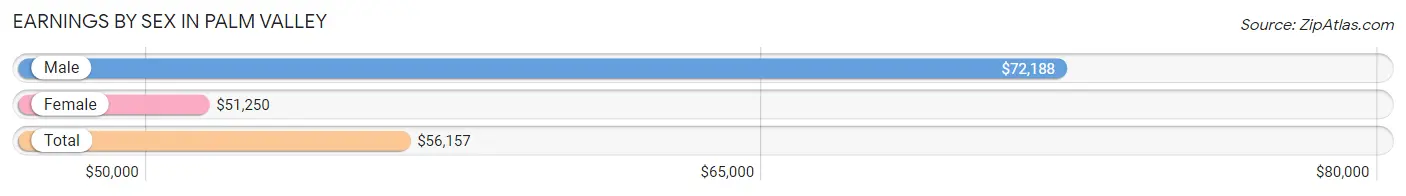
Earnings by Sex in Palm Valley
Average Earnings in Palm Valley are $56,157, $72,188 for men and $51,250 for women, a difference of 29.0%.
| Sex | Number | Average Earnings |
| Male | 343 (52.4%) | $72,188 |
| Female | 312 (47.6%) | $51,250 |
| Total | 655 (100.0%) | $56,157 |
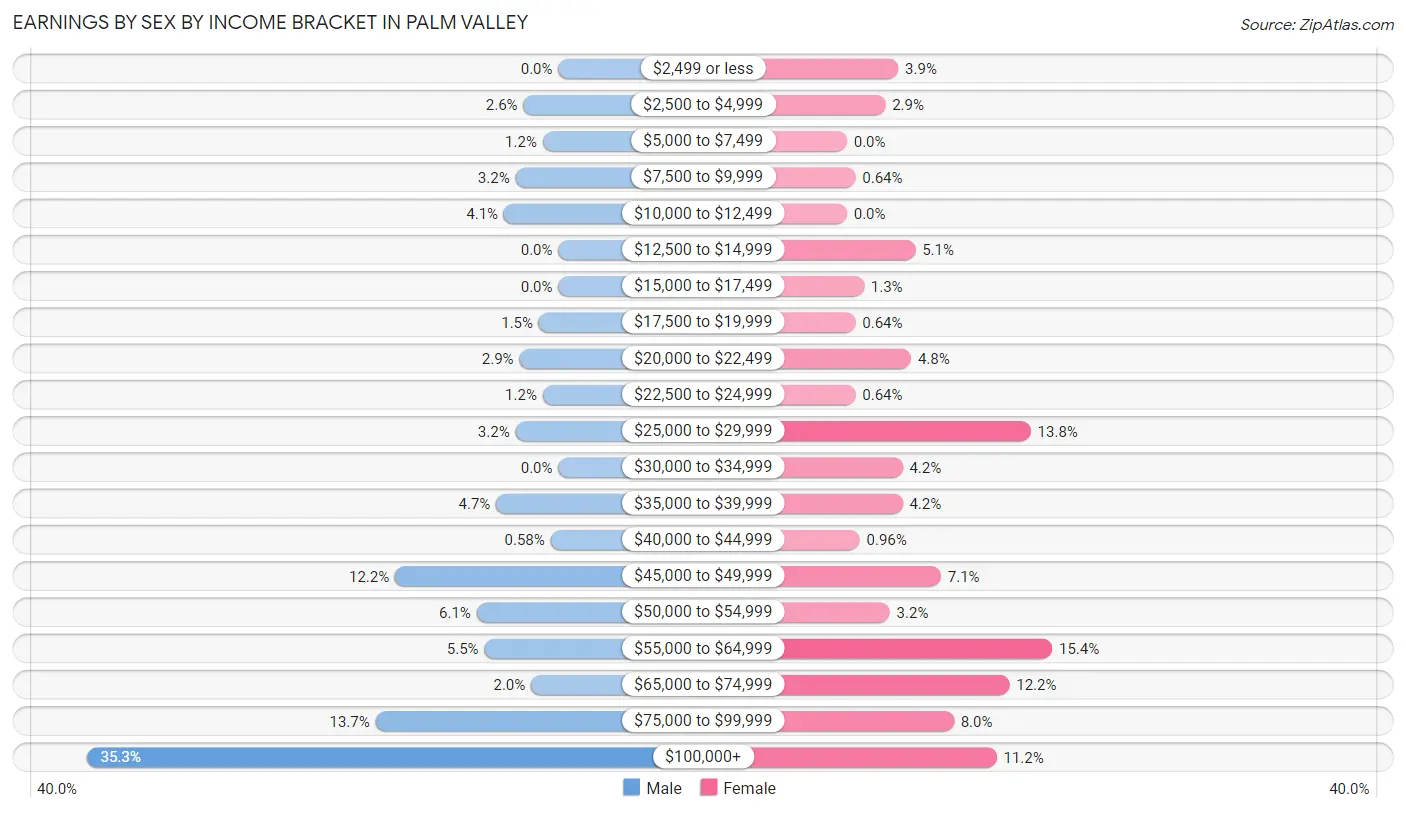
Earnings by Sex by Income Bracket in Palm Valley
The most common earnings brackets in Palm Valley are $100,000+ for men (121 | 35.3%) and $55,000 to $64,999 for women (48 | 15.4%).
| Income | Male | Female |
| $2,499 or less | 0 (0.0%) | 12 (3.8%) |
| $2,500 to $4,999 | 9 (2.6%) | 9 (2.9%) |
| $5,000 to $7,499 | 4 (1.2%) | 0 (0.0%) |
| $7,500 to $9,999 | 11 (3.2%) | 2 (0.6%) |
| $10,000 to $12,499 | 14 (4.1%) | 0 (0.0%) |
| $12,500 to $14,999 | 0 (0.0%) | 16 (5.1%) |
| $15,000 to $17,499 | 0 (0.0%) | 4 (1.3%) |
| $17,500 to $19,999 | 5 (1.5%) | 2 (0.6%) |
| $20,000 to $22,499 | 10 (2.9%) | 15 (4.8%) |
| $22,500 to $24,999 | 4 (1.2%) | 2 (0.6%) |
| $25,000 to $29,999 | 11 (3.2%) | 43 (13.8%) |
| $30,000 to $34,999 | 0 (0.0%) | 13 (4.2%) |
| $35,000 to $39,999 | 16 (4.7%) | 13 (4.2%) |
| $40,000 to $44,999 | 2 (0.6%) | 3 (1.0%) |
| $45,000 to $49,999 | 42 (12.2%) | 22 (7.0%) |
| $50,000 to $54,999 | 21 (6.1%) | 10 (3.2%) |
| $55,000 to $64,999 | 19 (5.5%) | 48 (15.4%) |
| $65,000 to $74,999 | 7 (2.0%) | 38 (12.2%) |
| $75,000 to $99,999 | 47 (13.7%) | 25 (8.0%) |
| $100,000+ | 121 (35.3%) | 35 (11.2%) |
| Total | 343 (100.0%) | 312 (100.0%) |
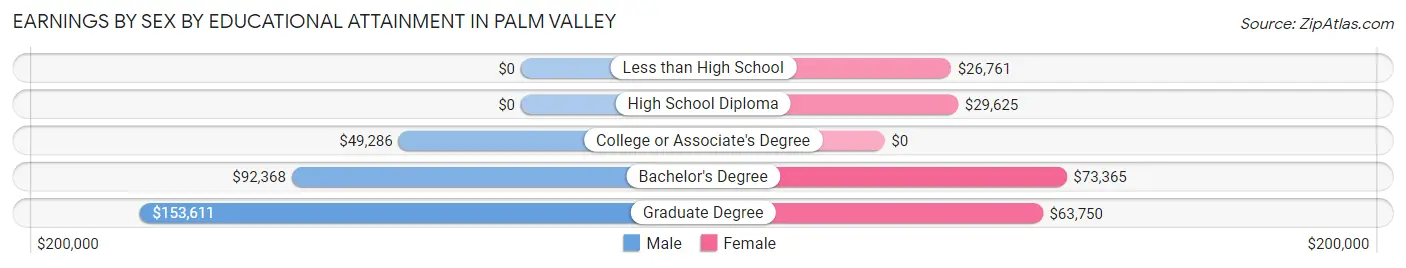
Earnings by Sex by Educational Attainment in Palm Valley
Average earnings in Palm Valley are $90,066 for men and $53,500 for women, a difference of 40.6%. Men with an educational attainment of graduate degree enjoy the highest average annual earnings of $153,611, while those with college or associate's degree education earn the least with $49,286. Women with an educational attainment of bachelor's degree earn the most with the average annual earnings of $73,365, while those with less than high school education have the smallest earnings of $26,761.
| Educational Attainment | Male Income | Female Income |
| Less than High School | - | - |
| High School Diploma | - | - |
| College or Associate's Degree | $49,286 | $0 |
| Bachelor's Degree | $92,368 | $73,365 |
| Graduate Degree | $153,611 | $63,750 |
| Total | $90,066 | $53,500 |
Family Income in Palm Valley
Family Income Brackets in Palm Valley
According to the Palm Valley family income data, there are 103 families falling into the $100,000 to $149,999 income range, which is the most common income bracket and makes up 20.2% of all families.
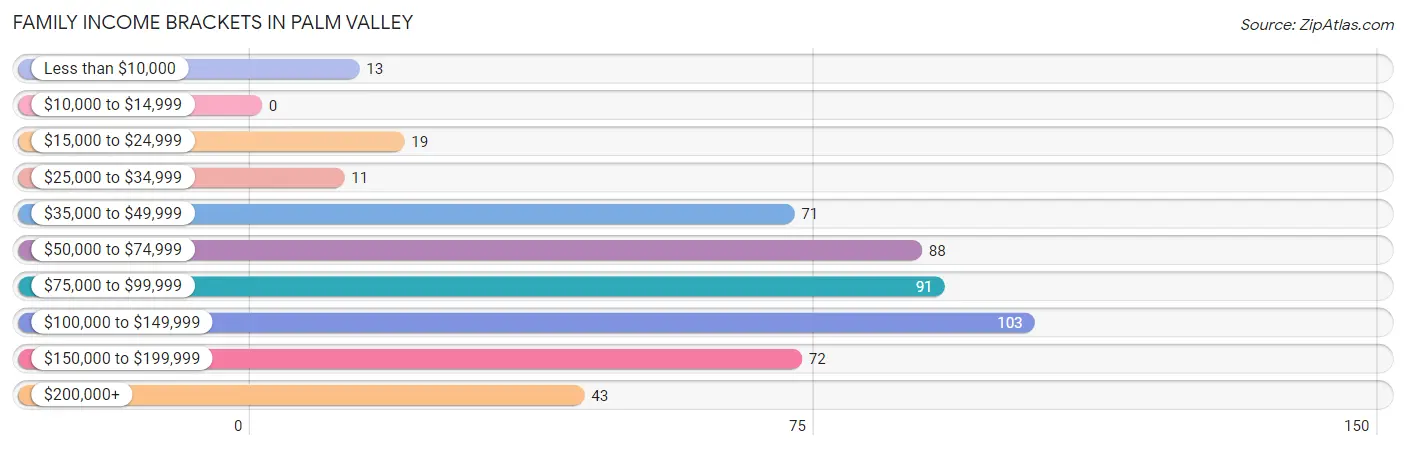
| Income Bracket | # Families | % Families |
| Less than $10,000 | 13 | 2.5% |
| $10,000 to $14,999 | 0 | 0.0% |
| $15,000 to $24,999 | 19 | 3.7% |
| $25,000 to $34,999 | 11 | 2.2% |
| $35,000 to $49,999 | 71 | 13.9% |
| $50,000 to $74,999 | 88 | 17.2% |
| $75,000 to $99,999 | 91 | 17.8% |
| $100,000 to $149,999 | 103 | 20.2% |
| $150,000 to $199,999 | 72 | 14.1% |
| $200,000+ | 43 | 8.4% |
Family Income by Famaliy Size in Palm Valley
4-person families (42 | 8.2%) account for the highest median family income in Palm Valley with $145,357 per family, while 3-person families (63 | 12.3%) have the highest median income of $46,250 per family member.
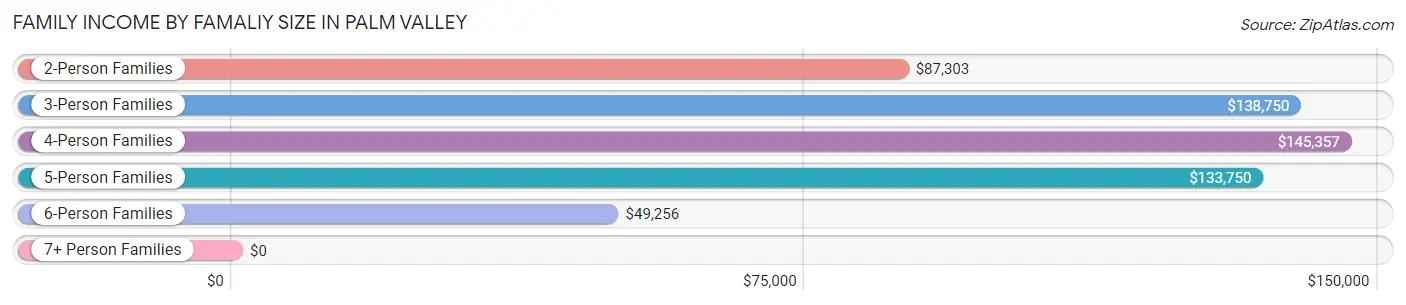
| Income Bracket | # Families | Median Income |
| 2-Person Families | 321 (62.8%) | $87,303 |
| 3-Person Families | 63 (12.3%) | $138,750 |
| 4-Person Families | 42 (8.2%) | $145,357 |
| 5-Person Families | 22 (4.3%) | $133,750 |
| 6-Person Families | 63 (12.3%) | $49,256 |
| 7+ Person Families | 0 (0.0%) | $0 |
| Total | 511 (100.0%) | $89,904 |
Family Income by Number of Earners in Palm Valley
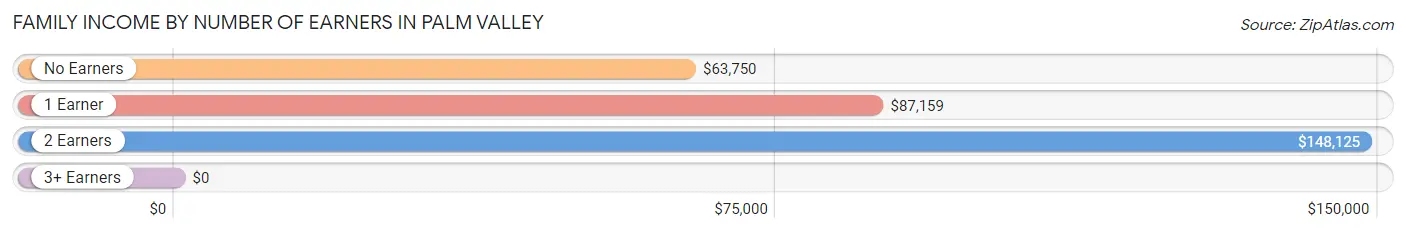
| Number of Earners | # Families | Median Income |
| No Earners | 143 (28.0%) | $63,750 |
| 1 Earner | 217 (42.5%) | $87,159 |
| 2 Earners | 140 (27.4%) | $148,125 |
| 3+ Earners | 11 (2.1%) | $0 |
| Total | 511 (100.0%) | $89,904 |
Household Income in Palm Valley
Household Income Brackets in Palm Valley
With 175 households falling in the category, the $50,000 to $74,999 income range is the most frequent in Palm Valley, accounting for 23.8% of all households. In contrast, only 3 households (0.4%) fall into the $10,000 to $14,999 income bracket, making it the least populous group.
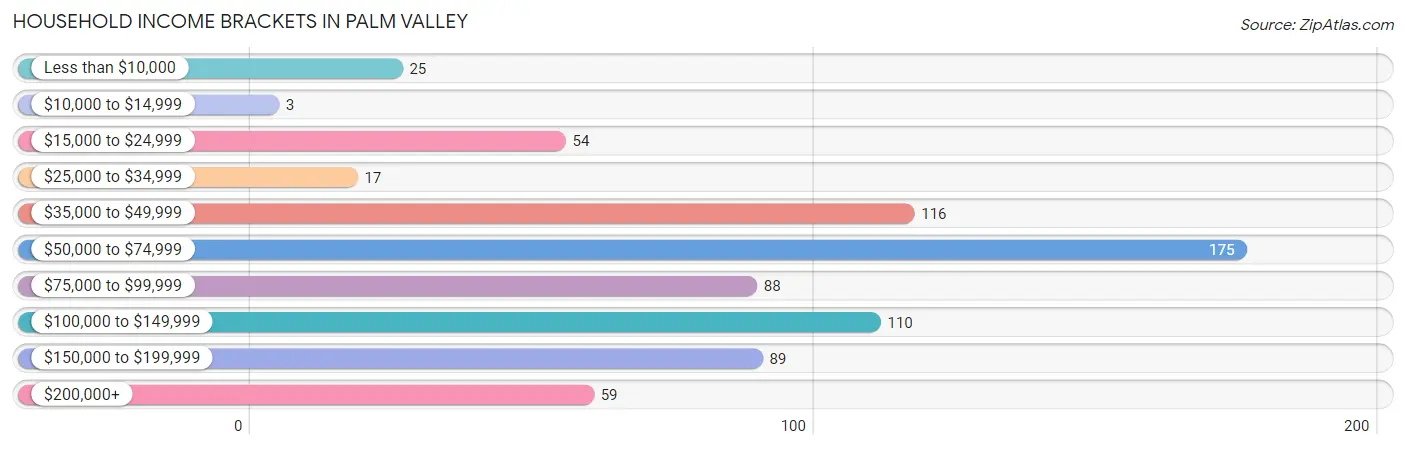
| Income Bracket | # Households | % Households |
| Less than $10,000 | 25 | 3.4% |
| $10,000 to $14,999 | 3 | 0.4% |
| $15,000 to $24,999 | 54 | 7.3% |
| $25,000 to $34,999 | 17 | 2.3% |
| $35,000 to $49,999 | 116 | 15.8% |
| $50,000 to $74,999 | 175 | 23.8% |
| $75,000 to $99,999 | 88 | 12.0% |
| $100,000 to $149,999 | 110 | 14.9% |
| $150,000 to $199,999 | 89 | 12.1% |
| $200,000+ | 59 | 8.0% |
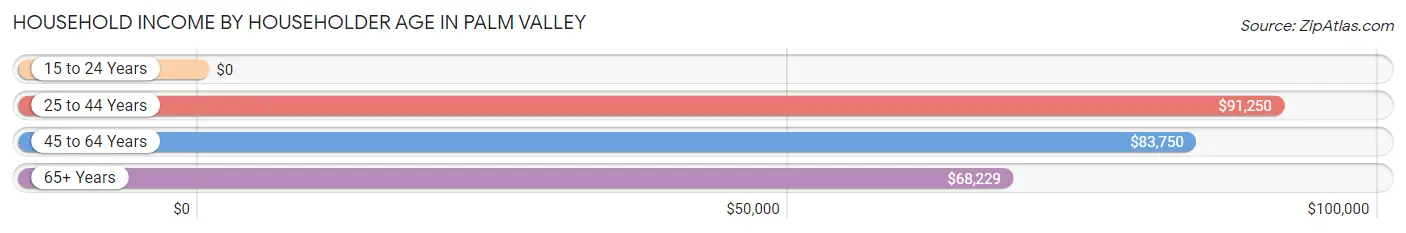
Household Income by Householder Age in Palm Valley
The median household income in Palm Valley is $69,773, with the highest median household income of $91,250 found in the 25 to 44 years age bracket for the primary householder. A total of 161 households (21.9%) fall into this category.
| Income Bracket | # Households | Median Income |
| 15 to 24 Years | 0 (0.0%) | $0 |
| 25 to 44 Years | 161 (21.9%) | $91,250 |
| 45 to 64 Years | 225 (30.6%) | $83,750 |
| 65+ Years | 350 (47.5%) | $68,229 |
| Total | 736 (100.0%) | $69,773 |
Poverty in Palm Valley
Income Below Poverty by Sex and Age in Palm Valley
With 3.6% poverty level for males and 4.9% for females among the residents of Palm Valley, 16 and 17 year old males and 18 to 24 year old females are the most vulnerable to poverty, with 5 males (16.7%) and 5 females (45.5%) in their respective age groups living below the poverty level.
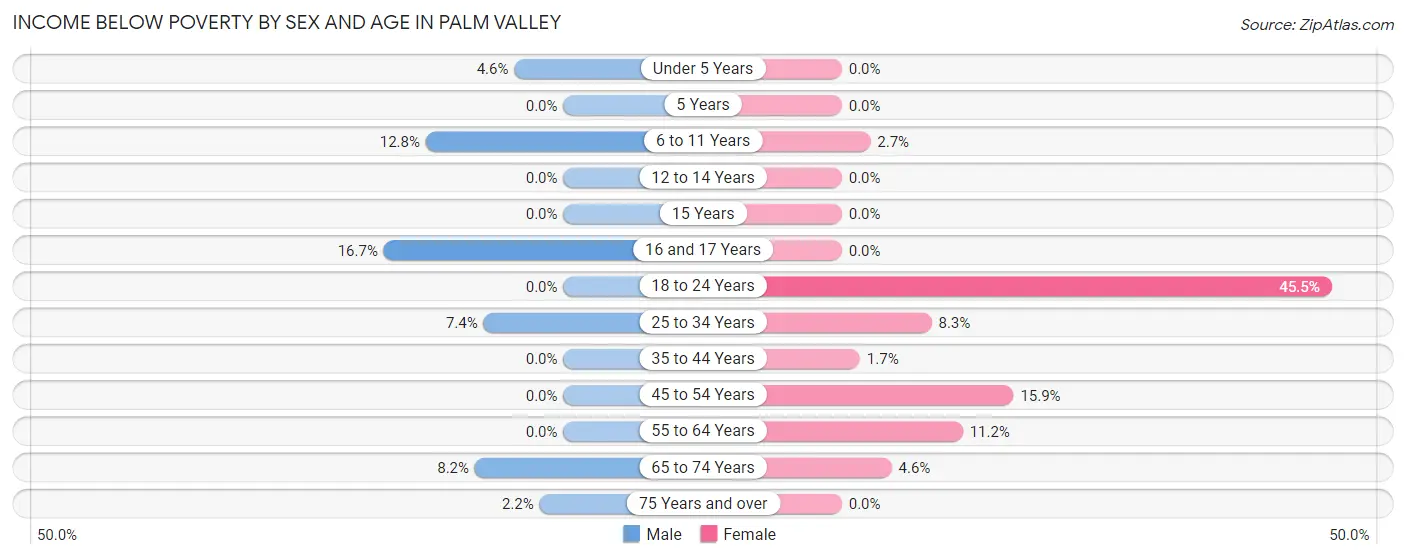
| Age Bracket | Male | Female |
| Under 5 Years | 3 (4.5%) | 0 (0.0%) |
| 5 Years | 0 (0.0%) | 0 (0.0%) |
| 6 to 11 Years | 6 (12.8%) | 3 (2.6%) |
| 12 to 14 Years | 0 (0.0%) | 0 (0.0%) |
| 15 Years | 0 (0.0%) | 0 (0.0%) |
| 16 and 17 Years | 5 (16.7%) | 0 (0.0%) |
| 18 to 24 Years | 0 (0.0%) | 5 (45.5%) |
| 25 to 34 Years | 2 (7.4%) | 7 (8.3%) |
| 35 to 44 Years | 0 (0.0%) | 2 (1.7%) |
| 45 to 54 Years | 0 (0.0%) | 18 (15.9%) |
| 55 to 64 Years | 0 (0.0%) | 11 (11.2%) |
| 65 to 74 Years | 11 (8.2%) | 6 (4.6%) |
| 75 Years and over | 3 (2.2%) | 0 (0.0%) |
| Total | 30 (3.6%) | 52 (4.9%) |
Income Above Poverty by Sex and Age in Palm Valley
According to the poverty statistics in Palm Valley, males aged 5 years and females aged under 5 years are the age groups that are most secure financially, with 100.0% of males and 100.0% of females in these age groups living above the poverty line.
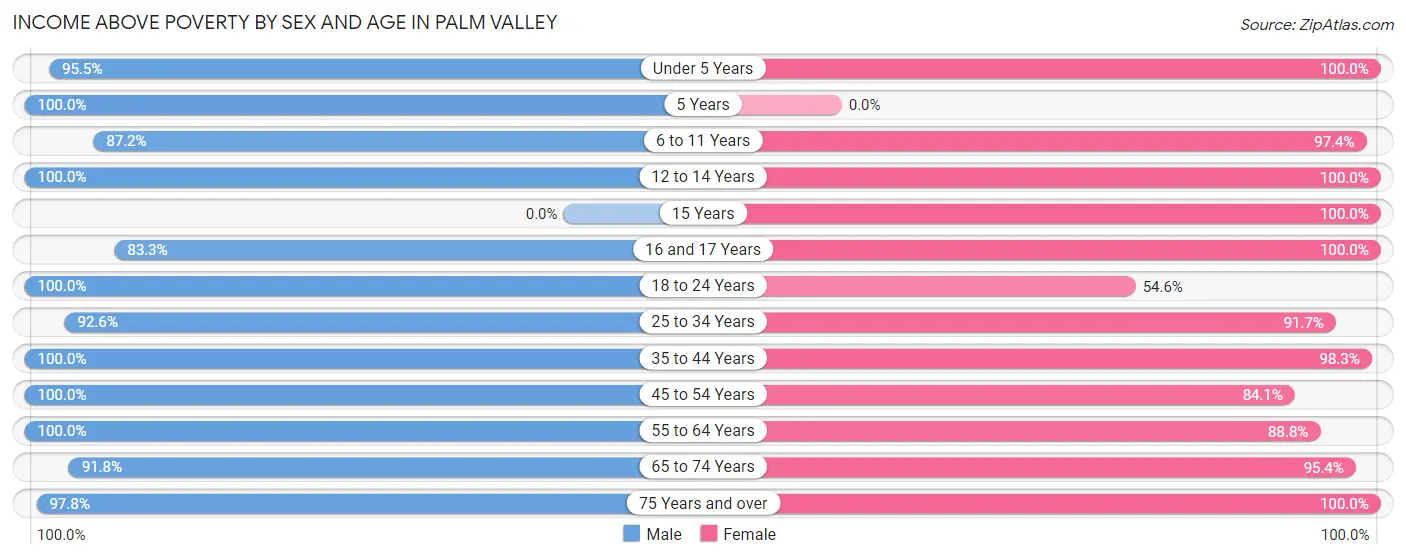
| Age Bracket | Male | Female |
| Under 5 Years | 63 (95.5%) | 52 (100.0%) |
| 5 Years | 3 (100.0%) | 0 (0.0%) |
| 6 to 11 Years | 41 (87.2%) | 110 (97.4%) |
| 12 to 14 Years | 25 (100.0%) | 126 (100.0%) |
| 15 Years | 0 (0.0%) | 44 (100.0%) |
| 16 and 17 Years | 25 (83.3%) | 8 (100.0%) |
| 18 to 24 Years | 44 (100.0%) | 6 (54.5%) |
| 25 to 34 Years | 25 (92.6%) | 77 (91.7%) |
| 35 to 44 Years | 139 (100.0%) | 117 (98.3%) |
| 45 to 54 Years | 59 (100.0%) | 95 (84.1%) |
| 55 to 64 Years | 113 (100.0%) | 87 (88.8%) |
| 65 to 74 Years | 123 (91.8%) | 124 (95.4%) |
| 75 Years and over | 133 (97.8%) | 155 (100.0%) |
| Total | 793 (96.4%) | 1,001 (95.1%) |
Income Below Poverty Among Married-Couple Families in Palm Valley
The poverty statistics for married-couple families in Palm Valley show that 1.9% or 8 of the total 429 families live below the poverty line. Families with 1 or 2 children have the highest poverty rate of 2.4%, comprising of 2 families. On the other hand, families with 3 or 4 children have the lowest poverty rate of 0.0%, which includes 0 families.
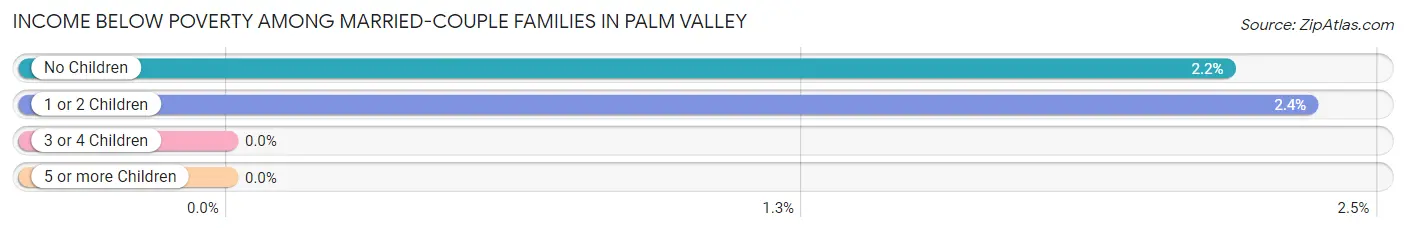
| Children | Above Poverty | Below Poverty |
| No Children | 270 (97.8%) | 6 (2.2%) |
| 1 or 2 Children | 83 (97.7%) | 2 (2.4%) |
| 3 or 4 Children | 68 (100.0%) | 0 (0.0%) |
| 5 or more Children | 0 (0.0%) | 0 (0.0%) |
| Total | 421 (98.1%) | 8 (1.9%) |
Income Below Poverty Among Single-Parent Households in Palm Valley
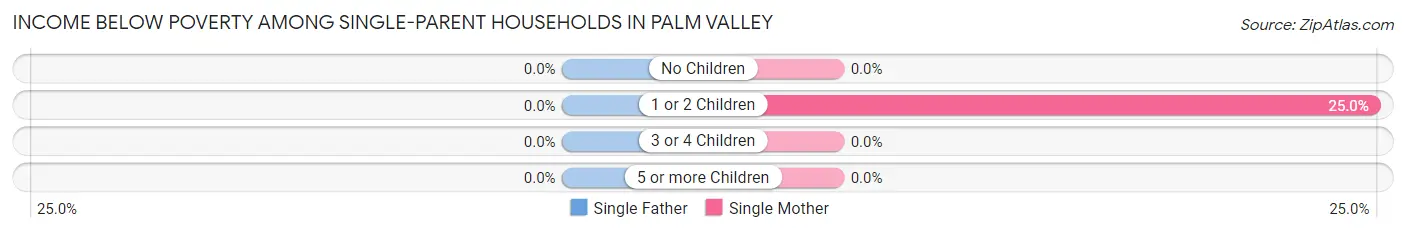
| Children | Single Father | Single Mother |
| No Children | 0 (0.0%) | 0 (0.0%) |
| 1 or 2 Children | 0 (0.0%) | 13 (25.0%) |
| 3 or 4 Children | 0 (0.0%) | 0 (0.0%) |
| 5 or more Children | 0 (0.0%) | 0 (0.0%) |
| Total | 0 (0.0%) | 13 (16.3%) |
Income Below Poverty Among Married-Couple vs Single-Parent Households in Palm Valley
The poverty data for Palm Valley shows that 8 of the married-couple family households (1.9%) and 13 of the single-parent households (15.9%) are living below the poverty level. Within the married-couple family households, those with 1 or 2 children have the highest poverty rate, with 2 households (2.4%) falling below the poverty line. Among the single-parent households, those with 1 or 2 children have the highest poverty rate, with 13 household (25.0%) living below poverty.
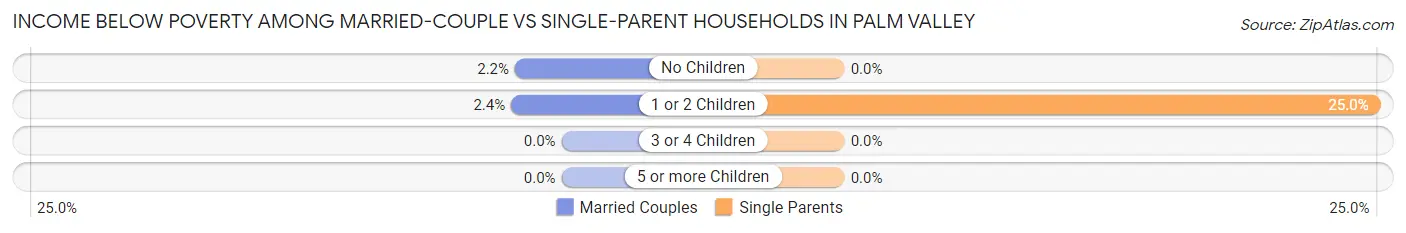
| Children | Married-Couple Families | Single-Parent Households |
| No Children | 6 (2.2%) | 0 (0.0%) |
| 1 or 2 Children | 2 (2.4%) | 13 (25.0%) |
| 3 or 4 Children | 0 (0.0%) | 0 (0.0%) |
| 5 or more Children | 0 (0.0%) | 0 (0.0%) |
| Total | 8 (1.9%) | 13 (15.9%) |
Race in Palm Valley
The most populous races in Palm Valley are White / Caucasian (1,348 | 71.9%), Hispanic or Latino (828 | 44.1%), and Two or more Races (308 | 16.4%).
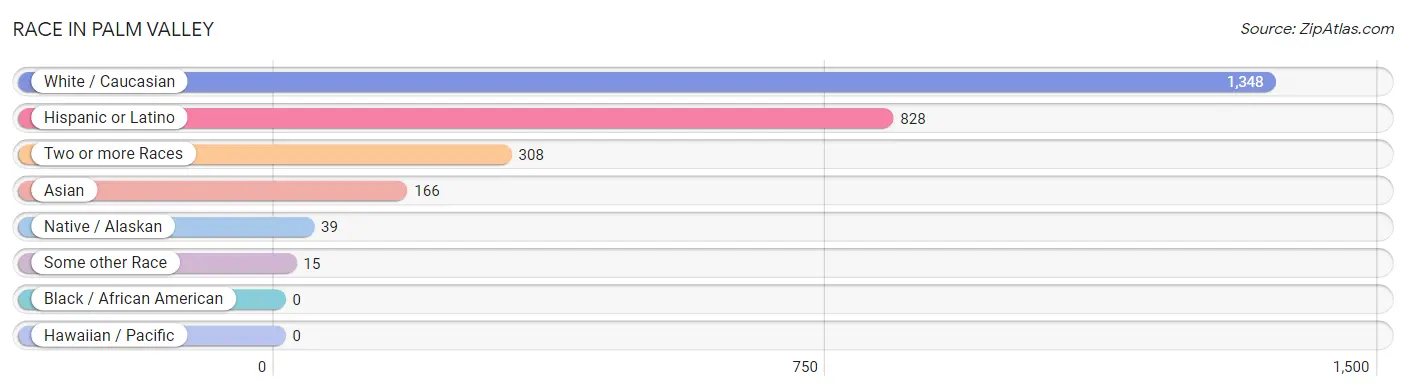
| Race | # Population | % Population |
| Asian | 166 | 8.8% |
| Black / African American | 0 | 0.0% |
| Hawaiian / Pacific | 0 | 0.0% |
| Hispanic or Latino | 828 | 44.1% |
| Native / Alaskan | 39 | 2.1% |
| White / Caucasian | 1,348 | 71.9% |
| Two or more Races | 308 | 16.4% |
| Some other Race | 15 | 0.8% |
| Total | 1,876 | 100.0% |
Ancestry in Palm Valley
The most populous ancestries reported in Palm Valley are Mexican (590 | 31.5%), German (293 | 15.6%), Spaniard (180 | 9.6%), English (151 | 8.1%), and Irish (113 | 6.0%), together accounting for 70.7% of all Palm Valley residents.
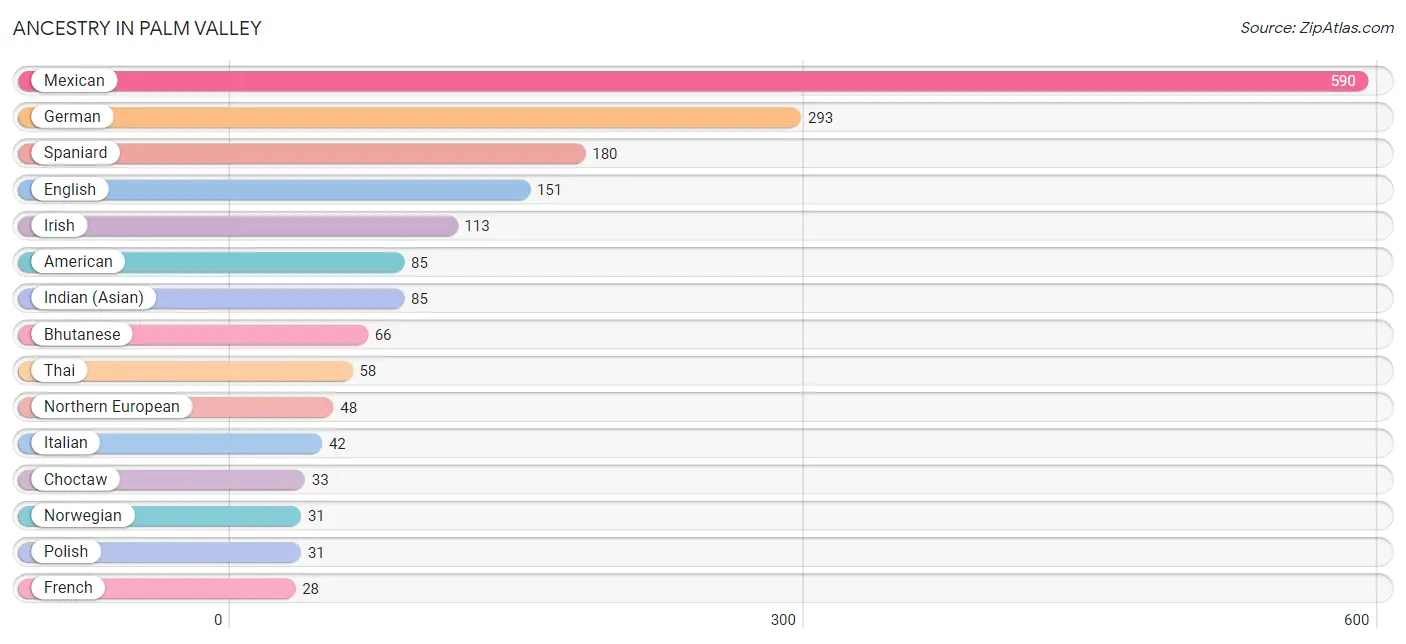
| Ancestry | # Population | % Population |
| American | 85 | 4.5% |
| Arab | 3 | 0.2% |
| Bhutanese | 66 | 3.5% |
| Blackfeet | 2 | 0.1% |
| British | 5 | 0.3% |
| Canadian | 7 | 0.4% |
| Central American | 5 | 0.3% |
| Cherokee | 15 | 0.8% |
| Choctaw | 33 | 1.8% |
| Creek | 6 | 0.3% |
| Danish | 10 | 0.5% |
| Dutch | 3 | 0.2% |
| Ecuadorian | 4 | 0.2% |
| English | 151 | 8.1% |
| European | 8 | 0.4% |
| French | 28 | 1.5% |
| French Canadian | 4 | 0.2% |
| German | 293 | 15.6% |
| Honduran | 5 | 0.3% |
| Hungarian | 3 | 0.2% |
| Indian (Asian) | 85 | 4.5% |
| Irish | 113 | 6.0% |
| Italian | 42 | 2.2% |
| Korean | 3 | 0.2% |
| Laotian | 5 | 0.3% |
| Lebanese | 3 | 0.2% |
| Mexican | 590 | 31.5% |
| Mexican American Indian | 2 | 0.1% |
| Northern European | 48 | 2.6% |
| Norwegian | 31 | 1.7% |
| Polish | 31 | 1.7% |
| Puerto Rican | 3 | 0.2% |
| Scotch-Irish | 23 | 1.2% |
| Scottish | 20 | 1.1% |
| South American | 4 | 0.2% |
| Spaniard | 180 | 9.6% |
| Spanish | 2 | 0.1% |
| Sri Lankan | 20 | 1.1% |
| Swedish | 17 | 0.9% |
| Swiss | 14 | 0.7% |
| Thai | 58 | 3.1% | View All 41 Rows |
Immigrants in Palm Valley
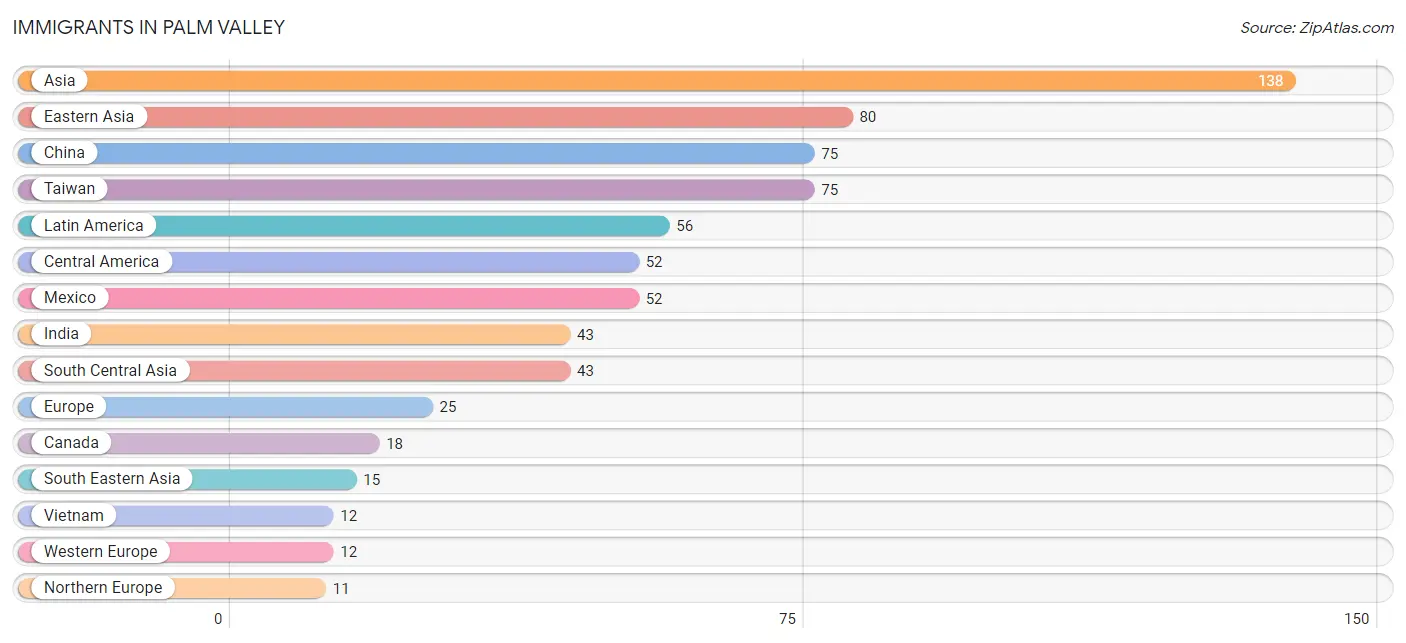
The most numerous immigrant groups reported in Palm Valley came from Asia (138 | 7.4%), Eastern Asia (80 | 4.3%), China (75 | 4.0%), Taiwan (75 | 4.0%), and Latin America (56 | 3.0%), together accounting for 22.6% of all Palm Valley residents.
| Immigration Origin | # Population | % Population |
| Asia | 138 | 7.4% |
| Canada | 18 | 1.0% |
| Central America | 52 | 2.8% |
| China | 75 | 4.0% |
| Eastern Asia | 80 | 4.3% |
| Ecuador | 4 | 0.2% |
| Europe | 25 | 1.3% |
| France | 7 | 0.4% |
| India | 43 | 2.3% |
| Japan | 5 | 0.3% |
| Latin America | 56 | 3.0% |
| Mexico | 52 | 2.8% |
| Netherlands | 5 | 0.3% |
| Northern Europe | 11 | 0.6% |
| Philippines | 3 | 0.2% |
| South America | 4 | 0.2% |
| South Central Asia | 43 | 2.3% |
| South Eastern Asia | 15 | 0.8% |
| Southern Europe | 2 | 0.1% |
| Spain | 2 | 0.1% |
| Sweden | 8 | 0.4% |
| Taiwan | 75 | 4.0% |
| Vietnam | 12 | 0.6% |
| Western Europe | 12 | 0.6% | View All 24 Rows |
Sex and Age in Palm Valley
Sex and Age in Palm Valley
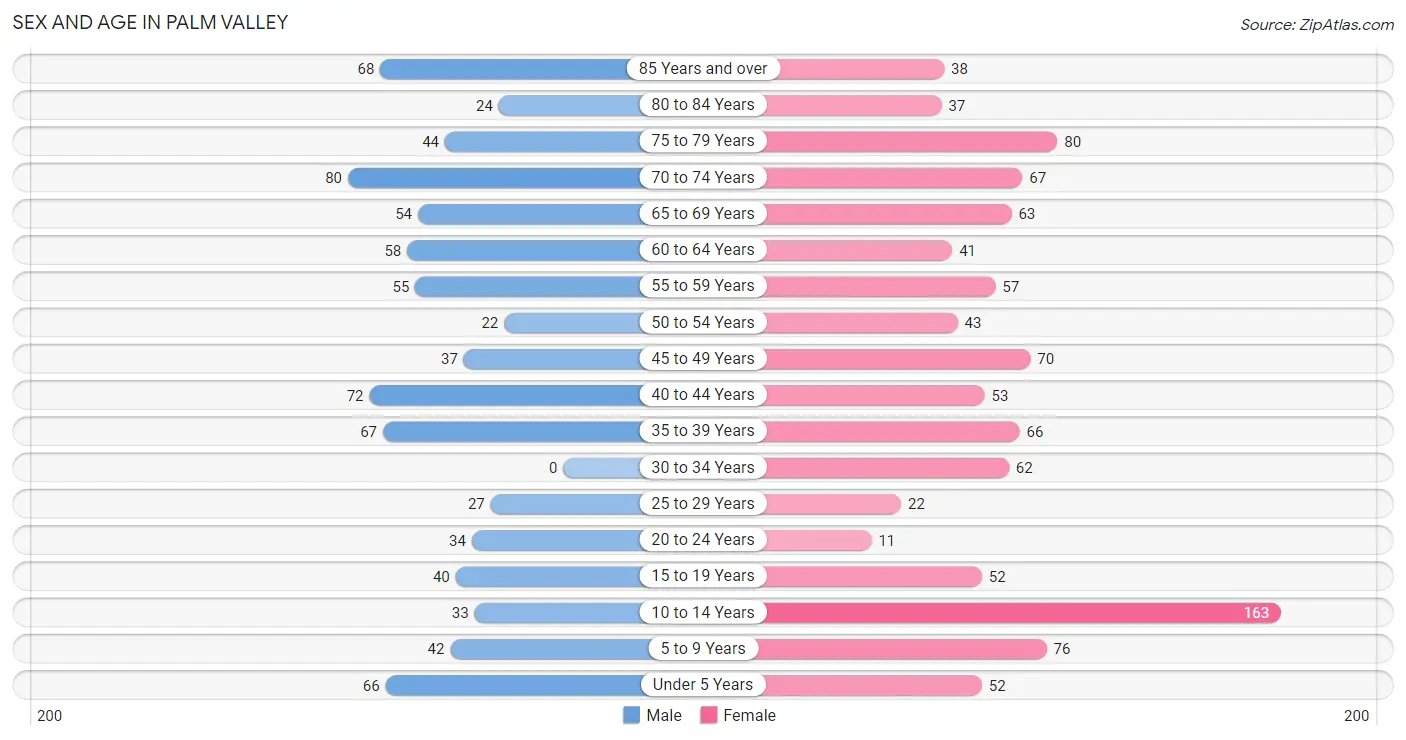
The most populous age groups in Palm Valley are 70 to 74 Years (80 | 9.7%) for men and 10 to 14 Years (163 | 15.5%) for women.
| Age Bracket | Male | Female |
| Under 5 Years | 66 (8.0%) | 52 (4.9%) |
| 5 to 9 Years | 42 (5.1%) | 76 (7.2%) |
| 10 to 14 Years | 33 (4.0%) | 163 (15.5%) |
| 15 to 19 Years | 40 (4.9%) | 52 (4.9%) |
| 20 to 24 Years | 34 (4.1%) | 11 (1.0%) |
| 25 to 29 Years | 27 (3.3%) | 22 (2.1%) |
| 30 to 34 Years | 0 (0.0%) | 62 (5.9%) |
| 35 to 39 Years | 67 (8.1%) | 66 (6.3%) |
| 40 to 44 Years | 72 (8.7%) | 53 (5.0%) |
| 45 to 49 Years | 37 (4.5%) | 70 (6.7%) |
| 50 to 54 Years | 22 (2.7%) | 43 (4.1%) |
| 55 to 59 Years | 55 (6.7%) | 57 (5.4%) |
| 60 to 64 Years | 58 (7.0%) | 41 (3.9%) |
| 65 to 69 Years | 54 (6.6%) | 63 (6.0%) |
| 70 to 74 Years | 80 (9.7%) | 67 (6.4%) |
| 75 to 79 Years | 44 (5.3%) | 80 (7.6%) |
| 80 to 84 Years | 24 (2.9%) | 37 (3.5%) |
| 85 Years and over | 68 (8.3%) | 38 (3.6%) |
| Total | 823 (100.0%) | 1,053 (100.0%) |
Families and Households in Palm Valley
Median Family Size in Palm Valley
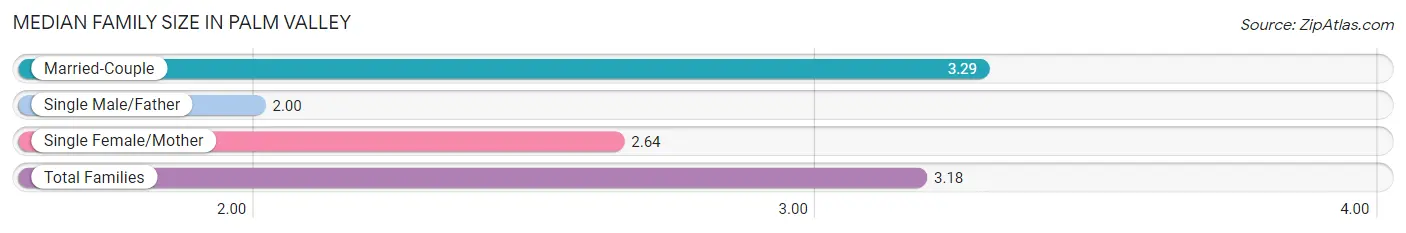
The median family size in Palm Valley is 3.18 persons per family, with married-couple families (429 | 84.0%) accounting for the largest median family size of 3.29 persons per family. On the other hand, single male/father families (2 | 0.4%) represent the smallest median family size with 2.00 persons per family.
| Family Type | # Families | Family Size |
| Married-Couple | 429 (84.0%) | 3.29 |
| Single Male/Father | 2 (0.4%) | 2.00 |
| Single Female/Mother | 80 (15.7%) | 2.64 |
| Total Families | 511 (100.0%) | 3.18 |
Median Household Size in Palm Valley
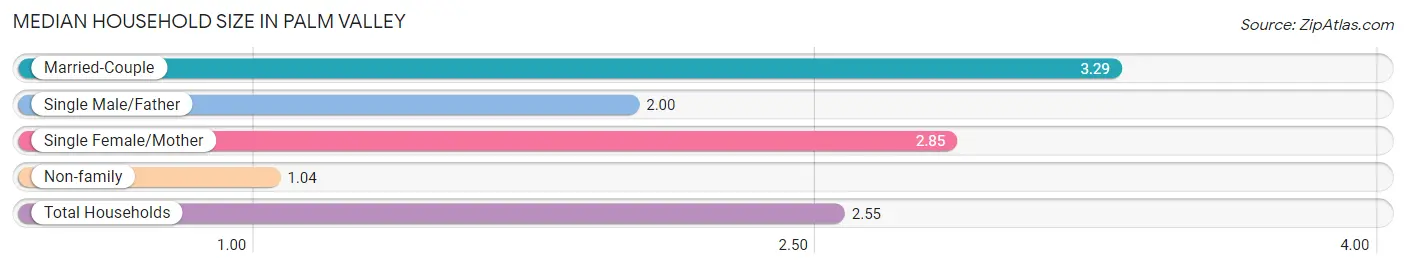
The median household size in Palm Valley is 2.55 persons per household, with married-couple households (429 | 58.3%) accounting for the largest median household size of 3.29 persons per household. non-family households (225 | 30.6%) represent the smallest median household size with 1.04 persons per household.
| Household Type | # Households | Household Size |
| Married-Couple | 429 (58.3%) | 3.29 |
| Single Male/Father | 2 (0.3%) | 2.00 |
| Single Female/Mother | 80 (10.9%) | 2.85 |
| Non-family | 225 (30.6%) | 1.04 |
| Total Households | 736 (100.0%) | 2.55 |
Household Size by Marriage Status in Palm Valley
Out of a total of 736 households in Palm Valley, 511 (69.4%) are family households, while 225 (30.6%) are nonfamily households. The most numerous type of family households are 2-person households, comprising 315, and the most common type of nonfamily households are 1-person households, comprising 220.
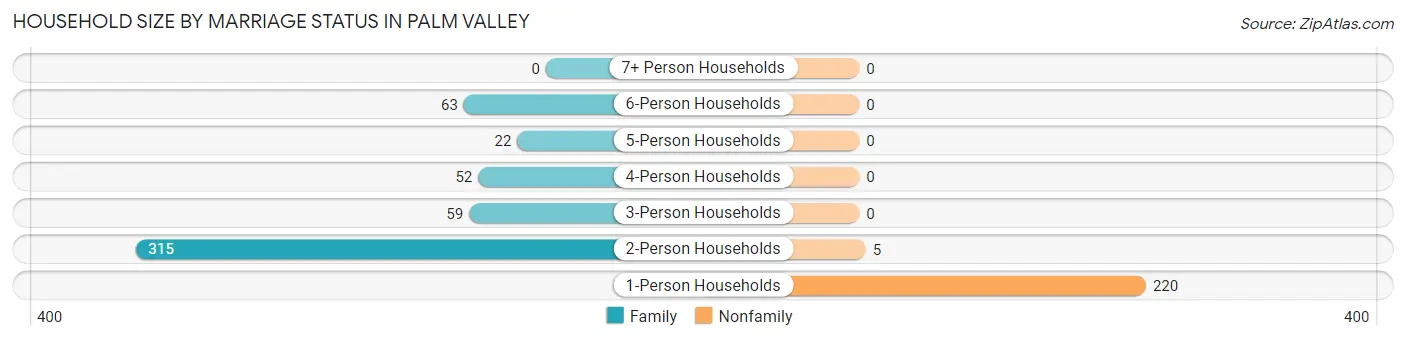
| Household Size | Family Households | Nonfamily Households |
| 1-Person Households | - | 220 (29.9%) |
| 2-Person Households | 315 (42.8%) | 5 (0.7%) |
| 3-Person Households | 59 (8.0%) | 0 (0.0%) |
| 4-Person Households | 52 (7.1%) | 0 (0.0%) |
| 5-Person Households | 22 (3.0%) | 0 (0.0%) |
| 6-Person Households | 63 (8.6%) | 0 (0.0%) |
| 7+ Person Households | 0 (0.0%) | 0 (0.0%) |
| Total | 511 (69.4%) | 225 (30.6%) |
Female Fertility in Palm Valley
Fertility by Age in Palm Valley
Average fertility rate in Palm Valley is 35.0 births per 1,000 women. Women in the age bracket of 20 to 34 years have the highest fertility rate with 126.0 births per 1,000 women. Women in the age bracket of 20 to 34 years acount for 100.0% of all women with births.
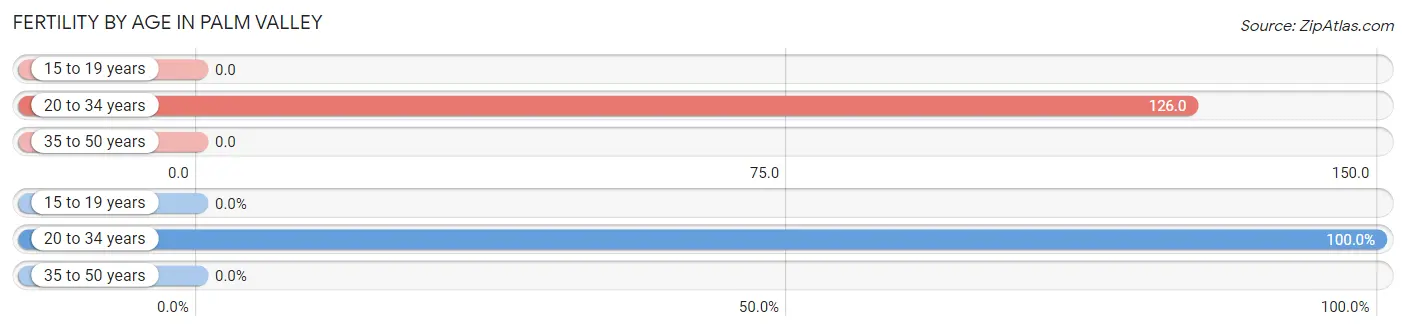
| Age Bracket | Women with Births | Births / 1,000 Women |
| 15 to 19 years | 0 (0.0%) | 0.0 |
| 20 to 34 years | 12 (100.0%) | 126.0 |
| 35 to 50 years | 0 (0.0%) | 0.0 |
| Total | 12 (100.0%) | 35.0 |
Fertility by Age by Marriage Status in Palm Valley
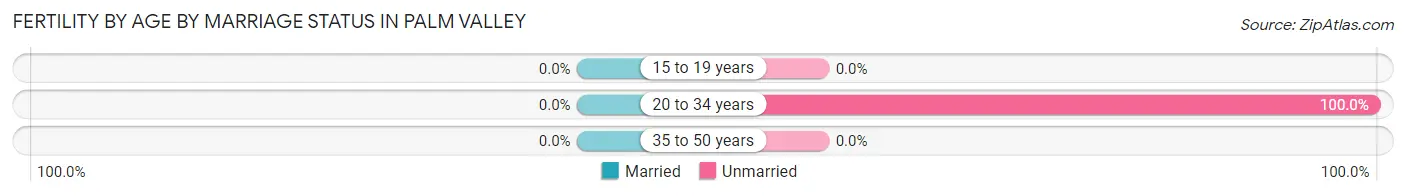
| Age Bracket | Married | Unmarried |
| 15 to 19 years | 0 (0.0%) | 0 (0.0%) |
| 20 to 34 years | 0 (0.0%) | 12 (100.0%) |
| 35 to 50 years | 0 (0.0%) | 0 (0.0%) |
| Total | 0 (0.0%) | 12 (100.0%) |
Fertility by Education in Palm Valley
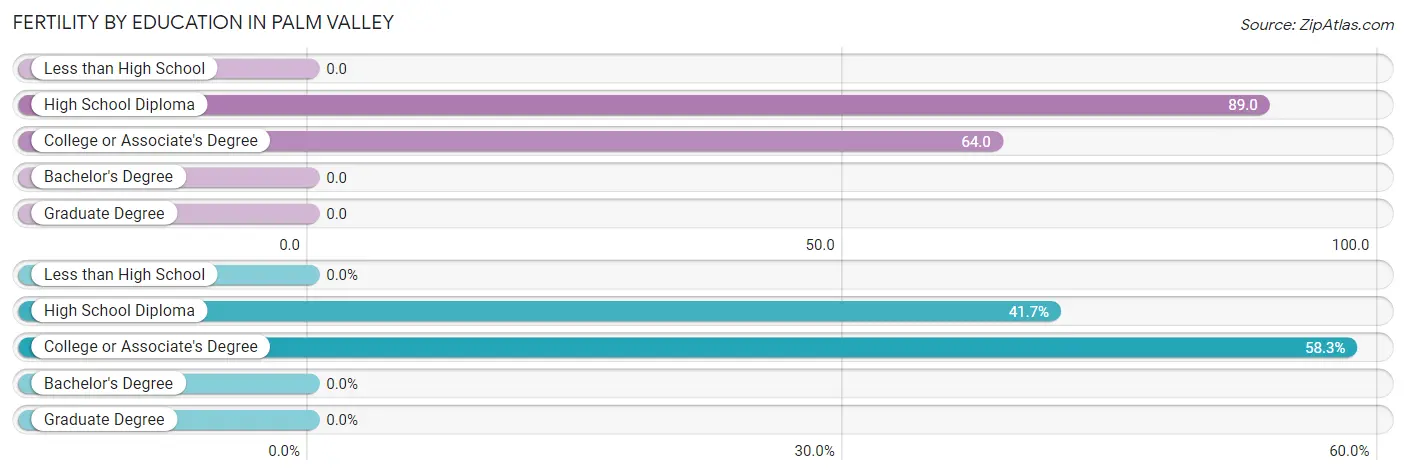
| Educational Attainment | Women with Births | Births / 1,000 Women |
| Less than High School | 0 (0.0%) | 0.0 |
| High School Diploma | 5 (41.7%) | 89.0 |
| College or Associate's Degree | 7 (58.3%) | 64.0 |
| Bachelor's Degree | 0 (0.0%) | 0.0 |
| Graduate Degree | 0 (0.0%) | 0.0 |
| Total | 12 (100.0%) | 35.0 |
Fertility by Education by Marriage Status in Palm Valley
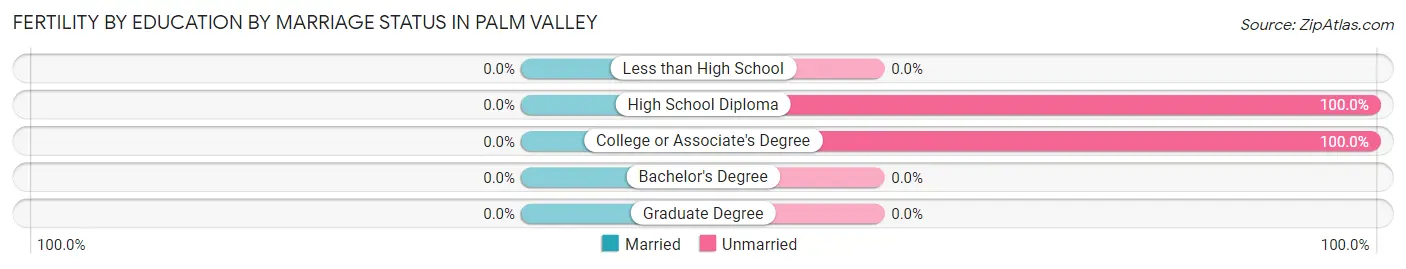
| Educational Attainment | Married | Unmarried |
| Less than High School | 0 (0.0%) | 0 (0.0%) |
| High School Diploma | 0 (0.0%) | 5 (100.0%) |
| College or Associate's Degree | 0 (0.0%) | 7 (100.0%) |
| Bachelor's Degree | 0 (0.0%) | 0 (0.0%) |
| Graduate Degree | 0 (0.0%) | 0 (0.0%) |
| Total | 0 (0.0%) | 12 (100.0%) |
Employment Characteristics in Palm Valley
Employment by Class of Employer in Palm Valley
Among the 618 employed individuals in Palm Valley, private company employees (295 | 47.7%), not-for-profit organizations (77 | 12.5%), and self-employed (incorporated) (70 | 11.3%) make up the most common classes of employment.
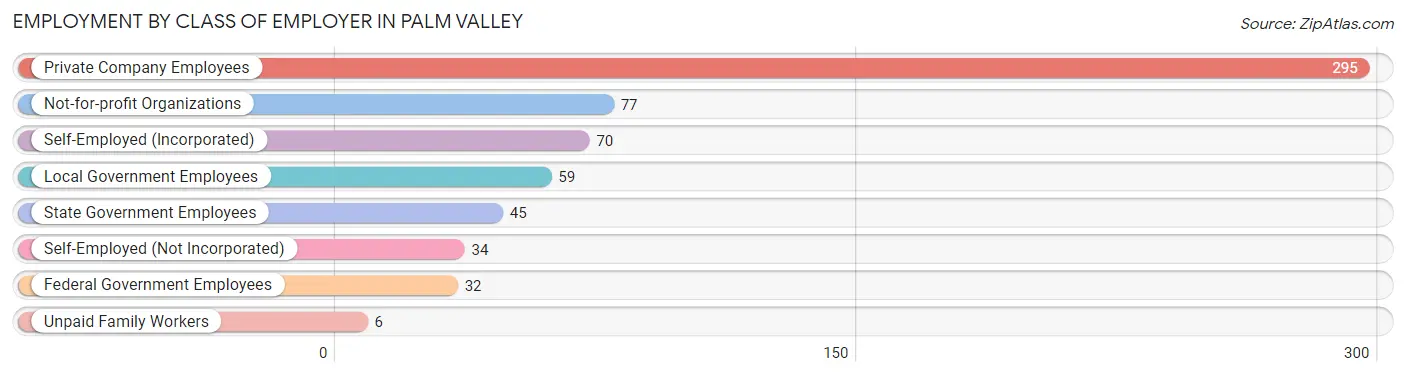
| Employer Class | # Employees | % Employees |
| Private Company Employees | 295 | 47.7% |
| Self-Employed (Incorporated) | 70 | 11.3% |
| Self-Employed (Not Incorporated) | 34 | 5.5% |
| Not-for-profit Organizations | 77 | 12.5% |
| Local Government Employees | 59 | 9.6% |
| State Government Employees | 45 | 7.3% |
| Federal Government Employees | 32 | 5.2% |
| Unpaid Family Workers | 6 | 1.0% |
| Total | 618 | 100.0% |
Employment Status by Age in Palm Valley
According to the labor force statistics for Palm Valley, out of the total population over 16 years of age (1,400), 46.1% or 645 individuals are in the labor force, with 4.2% or 27 of them unemployed. The age group with the highest labor force participation rate is 55 to 59 years, with 83.9% or 94 individuals in the labor force. Within the labor force, the 20 to 24 years age range has the highest percentage of unemployed individuals, with 33.3% or 8 of them being unemployed.
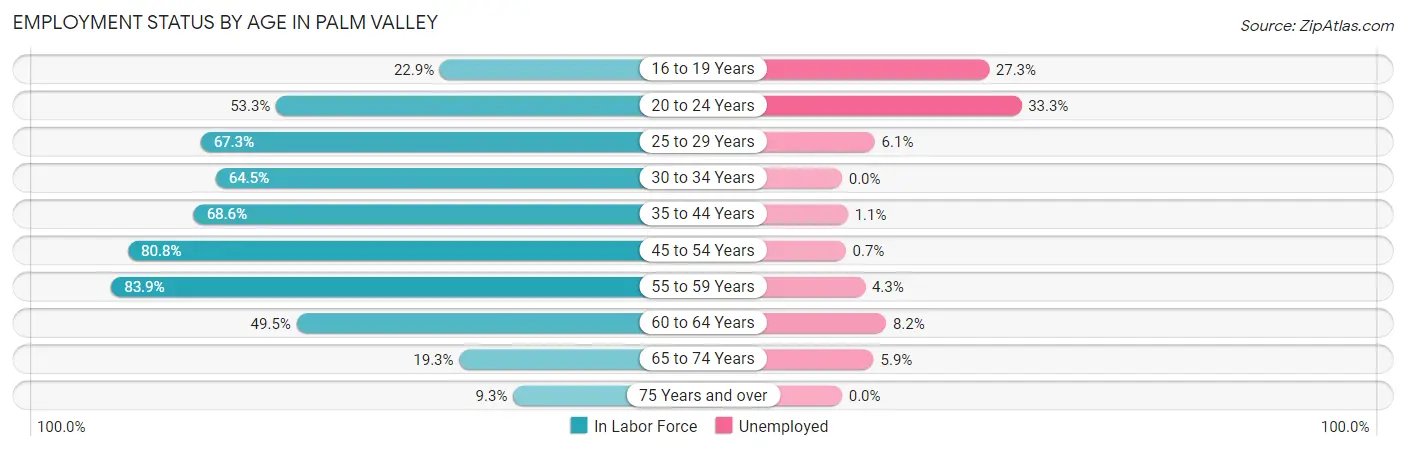
| Age Bracket | In Labor Force | Unemployed |
| 16 to 19 Years | 11 (22.9%) | 3 (27.3%) |
| 20 to 24 Years | 24 (53.3%) | 8 (33.3%) |
| 25 to 29 Years | 33 (67.3%) | 2 (6.1%) |
| 30 to 34 Years | 40 (64.5%) | 0 (0.0%) |
| 35 to 44 Years | 177 (68.6%) | 2 (1.1%) |
| 45 to 54 Years | 139 (80.8%) | 1 (0.7%) |
| 55 to 59 Years | 94 (83.9%) | 4 (4.3%) |
| 60 to 64 Years | 49 (49.5%) | 4 (8.2%) |
| 65 to 74 Years | 51 (19.3%) | 3 (5.9%) |
| 75 Years and over | 27 (9.3%) | 0 (0.0%) |
| Total | 645 (46.1%) | 27 (4.2%) |
Employment Status by Educational Attainment in Palm Valley
According to labor force statistics for Palm Valley, 70.7% of individuals (532) out of the total population between 25 and 64 years of age (752) are in the labor force, with 2.4% or 13 of them being unemployed. The group with the highest labor force participation rate are those with the educational attainment of less than high school, with 98.3% or 58 individuals in the labor force. Within the labor force, individuals with bachelor's degree or higher education have the highest percentage of unemployment, with 3.7% or 8 of them being unemployed.
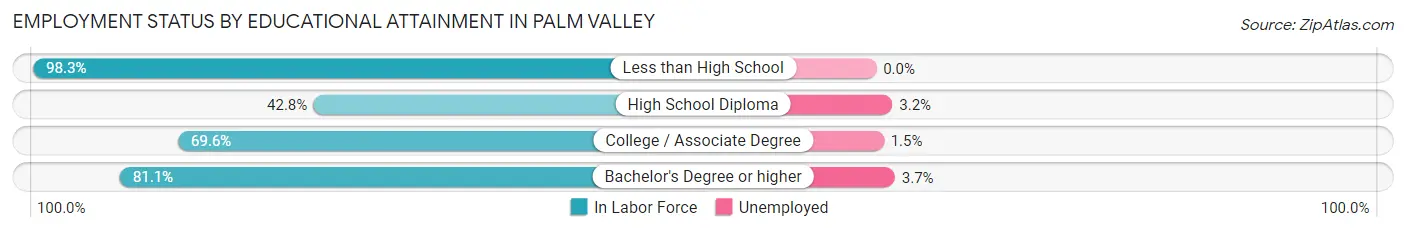
| Educational Attainment | In Labor Force | Unemployed |
| Less than High School | 58 (98.3%) | 0 (0.0%) |
| High School Diploma | 62 (42.8%) | 5 (3.2%) |
| College / Associate Degree | 197 (69.6%) | 4 (1.5%) |
| Bachelor's Degree or higher | 215 (81.1%) | 10 (3.7%) |
| Total | 532 (70.7%) | 18 (2.4%) |
Employment Occupations by Sex in Palm Valley
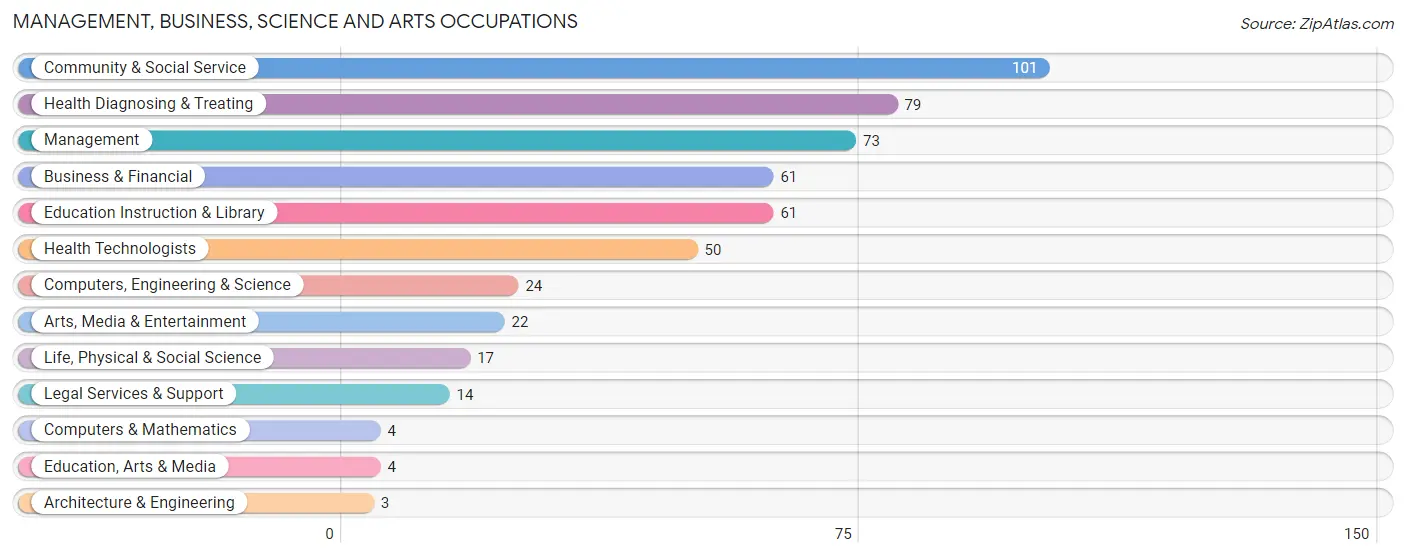
Management, Business, Science and Arts Occupations
The most common Management, Business, Science and Arts occupations in Palm Valley are Community & Social Service (101 | 16.3%), Health Diagnosing & Treating (79 | 12.8%), Management (73 | 11.8%), Business & Financial (61 | 9.9%), and Education Instruction & Library (61 | 9.9%).
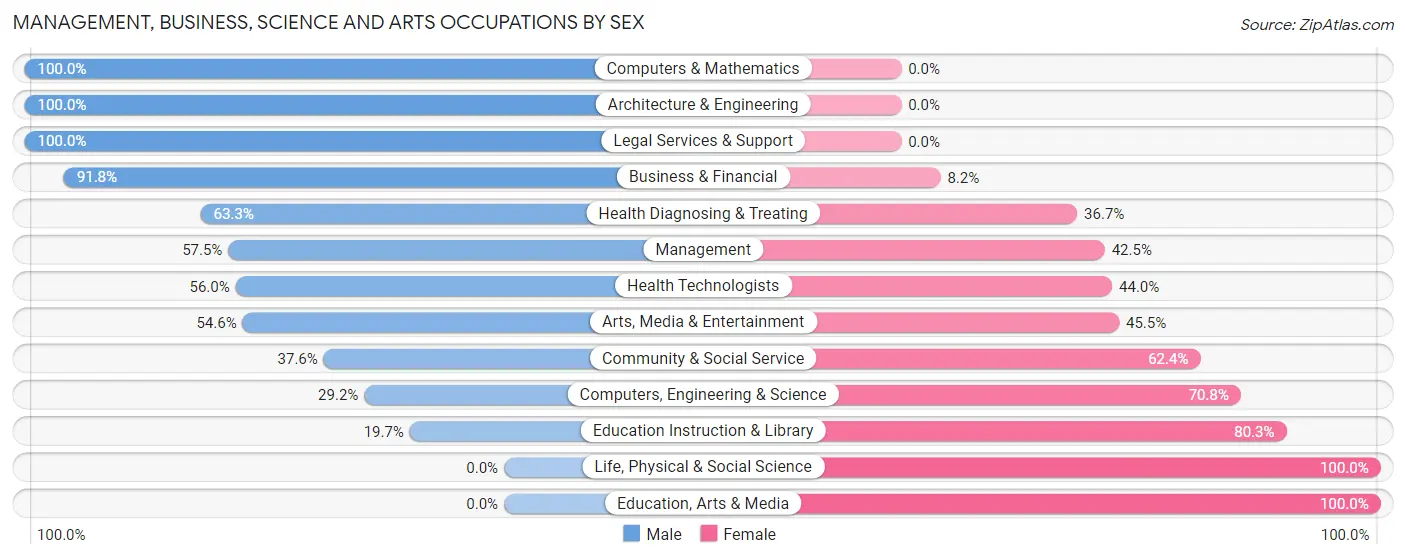
Management, Business, Science and Arts Occupations by Sex
Within the Management, Business, Science and Arts occupations in Palm Valley, the most male-oriented occupations are Computers & Mathematics (100.0%), Architecture & Engineering (100.0%), and Legal Services & Support (100.0%), while the most female-oriented occupations are Life, Physical & Social Science (100.0%), Education, Arts & Media (100.0%), and Education Instruction & Library (80.3%).
| Occupation | Male | Female |
| Management | 42 (57.5%) | 31 (42.5%) |
| Business & Financial | 56 (91.8%) | 5 (8.2%) |
| Computers, Engineering & Science | 7 (29.2%) | 17 (70.8%) |
| Computers & Mathematics | 4 (100.0%) | 0 (0.0%) |
| Architecture & Engineering | 3 (100.0%) | 0 (0.0%) |
| Life, Physical & Social Science | 0 (0.0%) | 17 (100.0%) |
| Community & Social Service | 38 (37.6%) | 63 (62.4%) |
| Education, Arts & Media | 0 (0.0%) | 4 (100.0%) |
| Legal Services & Support | 14 (100.0%) | 0 (0.0%) |
| Education Instruction & Library | 12 (19.7%) | 49 (80.3%) |
| Arts, Media & Entertainment | 12 (54.5%) | 10 (45.5%) |
| Health Diagnosing & Treating | 50 (63.3%) | 29 (36.7%) |
| Health Technologists | 28 (56.0%) | 22 (44.0%) |
| Total (Category) | 193 (57.1%) | 145 (42.9%) |
| Total (Overall) | 326 (52.7%) | 292 (47.2%) |
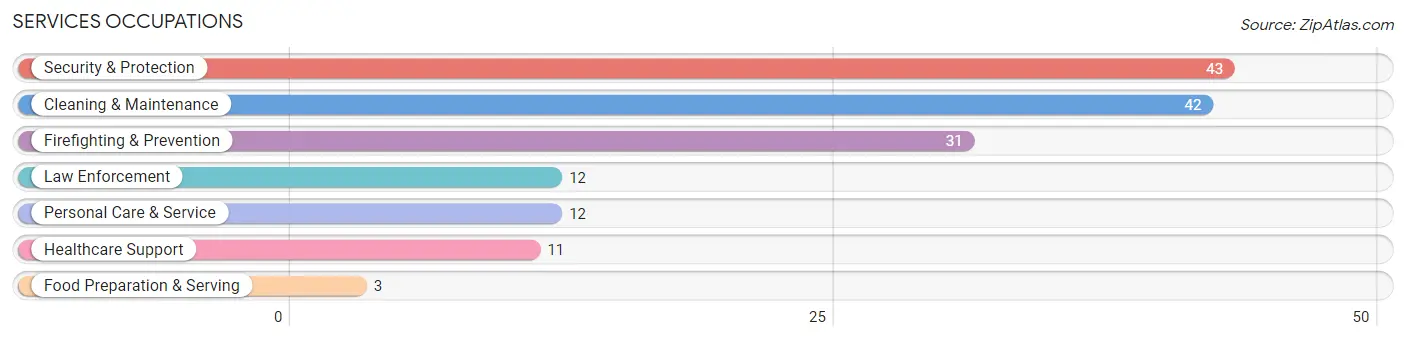
Services Occupations
The most common Services occupations in Palm Valley are Security & Protection (43 | 7.0%), Cleaning & Maintenance (42 | 6.8%), Firefighting & Prevention (31 | 5.0%), Law Enforcement (12 | 1.9%), and Personal Care & Service (12 | 1.9%).
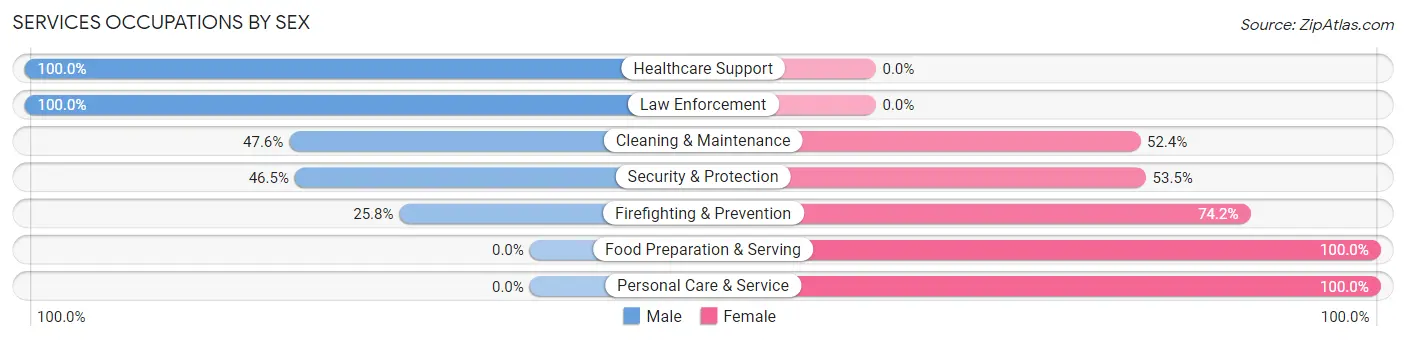
Services Occupations by Sex
Within the Services occupations in Palm Valley, the most male-oriented occupations are Healthcare Support (100.0%), Law Enforcement (100.0%), and Cleaning & Maintenance (47.6%), while the most female-oriented occupations are Food Preparation & Serving (100.0%), Personal Care & Service (100.0%), and Firefighting & Prevention (74.2%).
| Occupation | Male | Female |
| Healthcare Support | 11 (100.0%) | 0 (0.0%) |
| Security & Protection | 20 (46.5%) | 23 (53.5%) |
| Firefighting & Prevention | 8 (25.8%) | 23 (74.2%) |
| Law Enforcement | 12 (100.0%) | 0 (0.0%) |
| Food Preparation & Serving | 0 (0.0%) | 3 (100.0%) |
| Cleaning & Maintenance | 20 (47.6%) | 22 (52.4%) |
| Personal Care & Service | 0 (0.0%) | 12 (100.0%) |
| Total (Category) | 51 (46.0%) | 60 (54.0%) |
| Total (Overall) | 326 (52.7%) | 292 (47.2%) |
Sales and Office Occupations
The most common Sales and Office occupations in Palm Valley are Sales & Related (46 | 7.4%), and Office & Administration (40 | 6.5%).
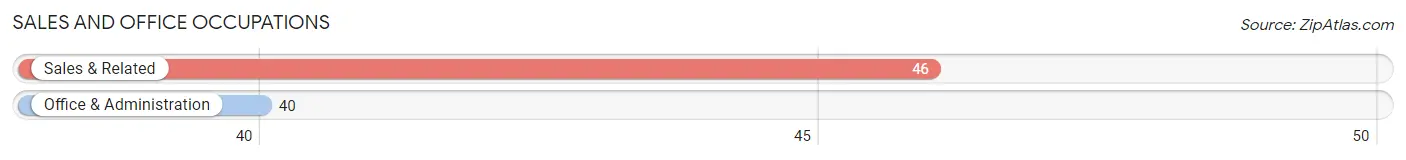
Sales and Office Occupations by Sex
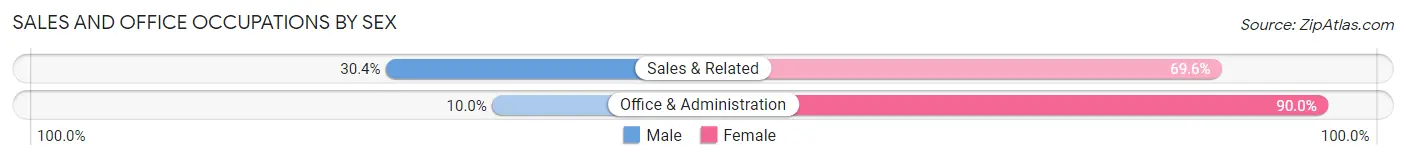
| Occupation | Male | Female |
| Sales & Related | 14 (30.4%) | 32 (69.6%) |
| Office & Administration | 4 (10.0%) | 36 (90.0%) |
| Total (Category) | 18 (20.9%) | 68 (79.1%) |
| Total (Overall) | 326 (52.7%) | 292 (47.2%) |
Natural Resources, Construction and Maintenance Occupations
The most common Natural Resources, Construction and Maintenance occupations in Palm Valley are , and Construction & Extraction (10 | 1.6%).
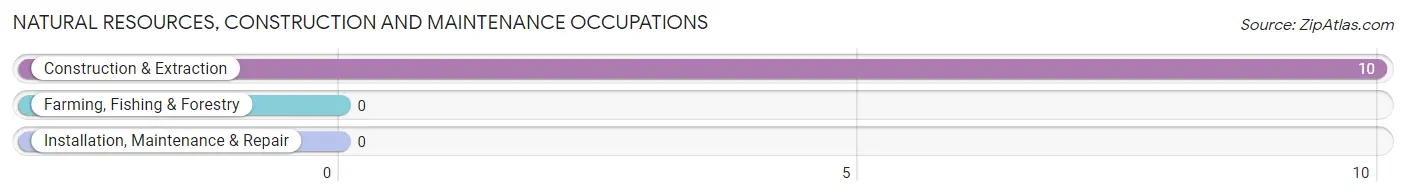
Natural Resources, Construction and Maintenance Occupations by Sex
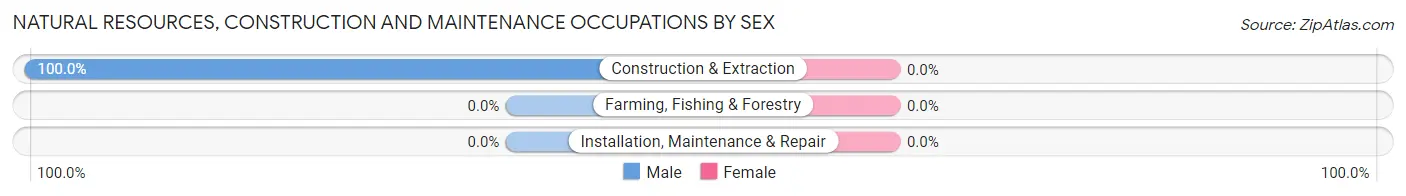
| Occupation | Male | Female |
| Farming, Fishing & Forestry | 0 (0.0%) | 0 (0.0%) |
| Construction & Extraction | 10 (100.0%) | 0 (0.0%) |
| Installation, Maintenance & Repair | 0 (0.0%) | 0 (0.0%) |
| Total (Category) | 10 (100.0%) | 0 (0.0%) |
| Total (Overall) | 326 (52.7%) | 292 (47.2%) |
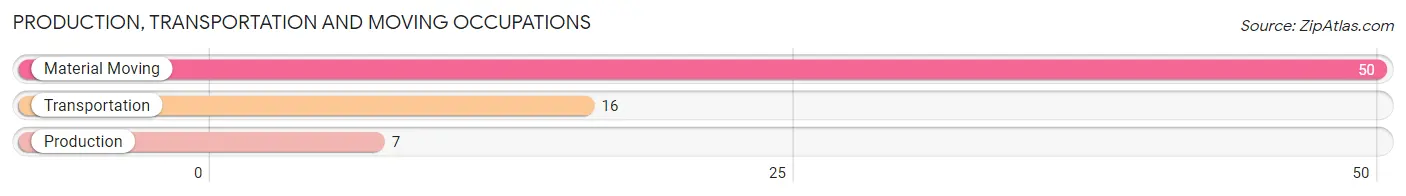
Production, Transportation and Moving Occupations
The most common Production, Transportation and Moving occupations in Palm Valley are Material Moving (50 | 8.1%), Transportation (16 | 2.6%), and Production (7 | 1.1%).
Production, Transportation and Moving Occupations by Sex
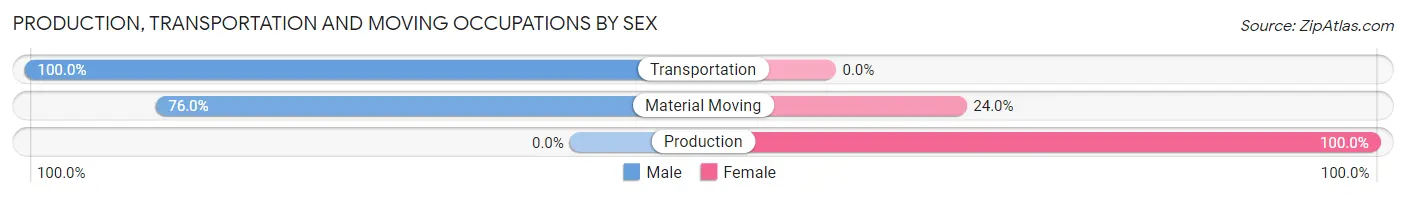
| Occupation | Male | Female |
| Production | 0 (0.0%) | 7 (100.0%) |
| Transportation | 16 (100.0%) | 0 (0.0%) |
| Material Moving | 38 (76.0%) | 12 (24.0%) |
| Total (Category) | 54 (74.0%) | 19 (26.0%) |
| Total (Overall) | 326 (52.7%) | 292 (47.2%) |
Employment Industries by Sex in Palm Valley
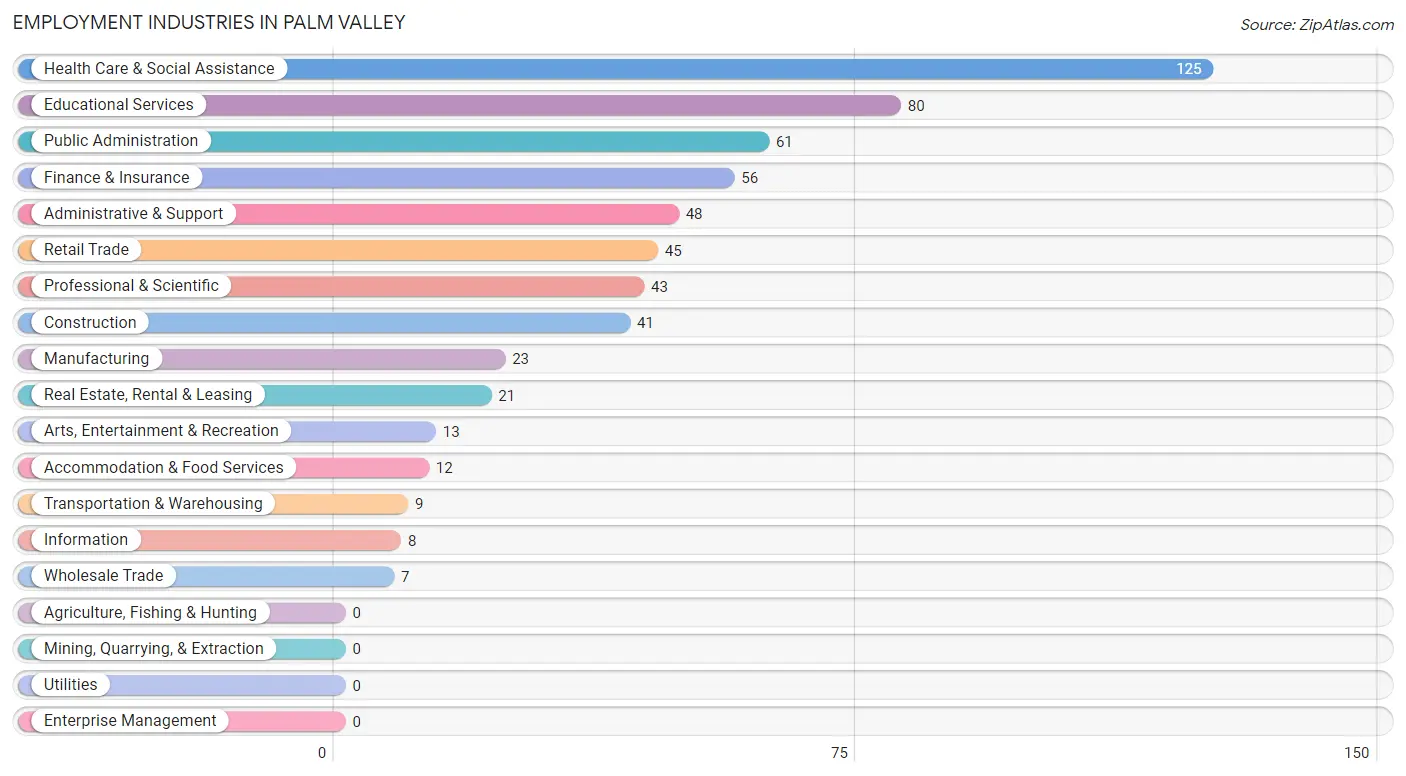
Employment Industries in Palm Valley
The major employment industries in Palm Valley include Health Care & Social Assistance (125 | 20.2%), Educational Services (80 | 12.9%), Public Administration (61 | 9.9%), Finance & Insurance (56 | 9.1%), and Administrative & Support (48 | 7.8%).
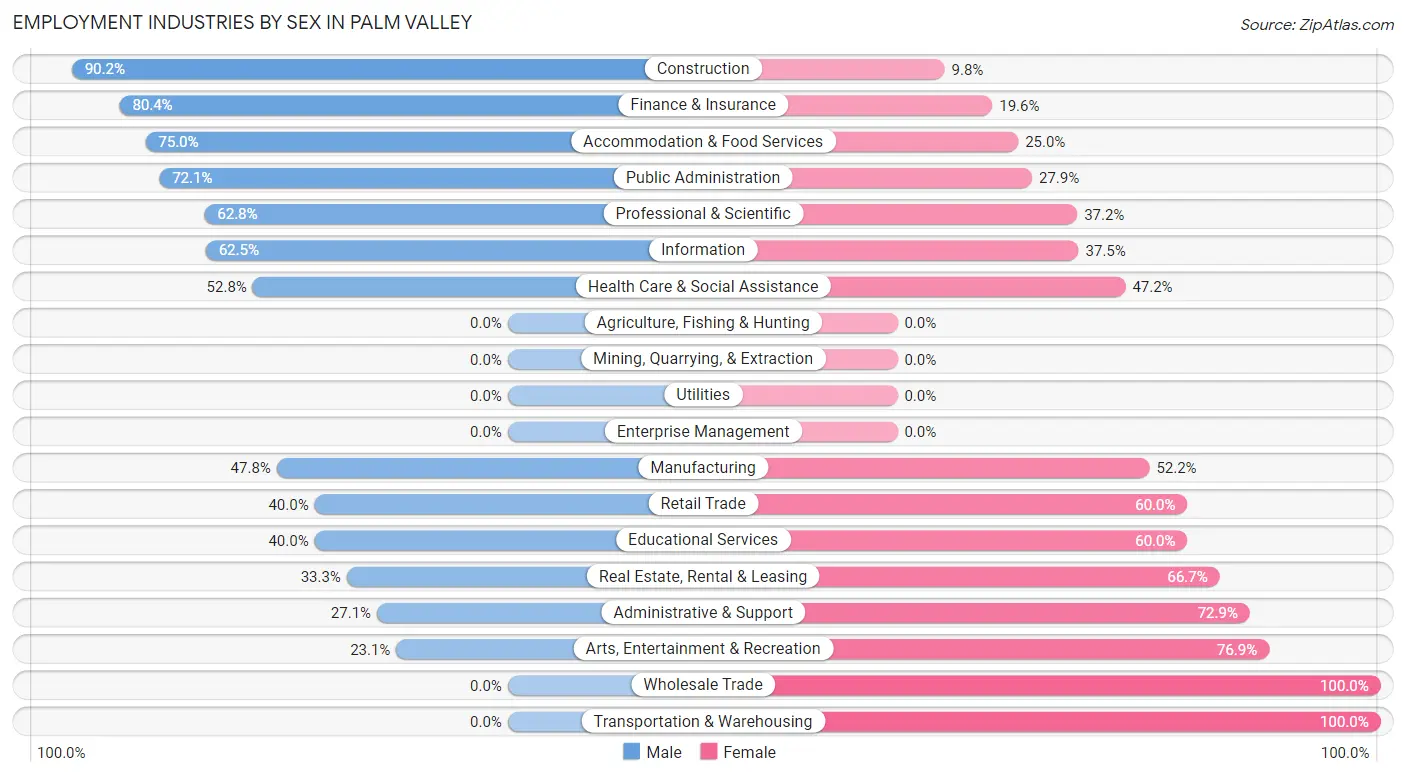
Employment Industries by Sex in Palm Valley
The Palm Valley industries that see more men than women are Construction (90.2%), Finance & Insurance (80.4%), and Accommodation & Food Services (75.0%), whereas the industries that tend to have a higher number of women are Wholesale Trade (100.0%), Transportation & Warehousing (100.0%), and Arts, Entertainment & Recreation (76.9%).
| Industry | Male | Female |
| Agriculture, Fishing & Hunting | 0 (0.0%) | 0 (0.0%) |
| Mining, Quarrying, & Extraction | 0 (0.0%) | 0 (0.0%) |
| Construction | 37 (90.2%) | 4 (9.8%) |
| Manufacturing | 11 (47.8%) | 12 (52.2%) |
| Wholesale Trade | 0 (0.0%) | 7 (100.0%) |
| Retail Trade | 18 (40.0%) | 27 (60.0%) |
| Transportation & Warehousing | 0 (0.0%) | 9 (100.0%) |
| Utilities | 0 (0.0%) | 0 (0.0%) |
| Information | 5 (62.5%) | 3 (37.5%) |
| Finance & Insurance | 45 (80.4%) | 11 (19.6%) |
| Real Estate, Rental & Leasing | 7 (33.3%) | 14 (66.7%) |
| Professional & Scientific | 27 (62.8%) | 16 (37.2%) |
| Enterprise Management | 0 (0.0%) | 0 (0.0%) |
| Administrative & Support | 13 (27.1%) | 35 (72.9%) |
| Educational Services | 32 (40.0%) | 48 (60.0%) |
| Health Care & Social Assistance | 66 (52.8%) | 59 (47.2%) |
| Arts, Entertainment & Recreation | 3 (23.1%) | 10 (76.9%) |
| Accommodation & Food Services | 9 (75.0%) | 3 (25.0%) |
| Public Administration | 44 (72.1%) | 17 (27.9%) |
| Total | 326 (52.7%) | 292 (47.2%) |
Education in Palm Valley
School Enrollment in Palm Valley
The most common levels of schooling among the 528 students in Palm Valley are high school (132 | 25.0%), middle school (120 | 22.7%), and elementary school (107 | 20.3%).
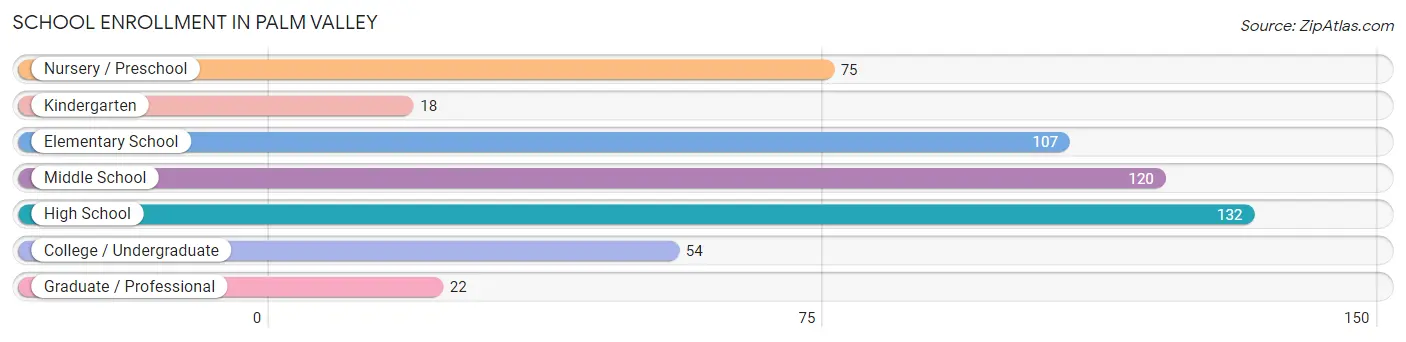
| School Level | # Students | % Students |
| Nursery / Preschool | 75 | 14.2% |
| Kindergarten | 18 | 3.4% |
| Elementary School | 107 | 20.3% |
| Middle School | 120 | 22.7% |
| High School | 132 | 25.0% |
| College / Undergraduate | 54 | 10.2% |
| Graduate / Professional | 22 | 4.2% |
| Total | 528 | 100.0% |
School Enrollment by Age by Funding Source in Palm Valley
Out of a total of 528 students who are enrolled in schools in Palm Valley, 16 (3.0%) attend a private institution, while the remaining 512 (97.0%) are enrolled in public schools. The age group of 25 to 34 year olds has the highest likelihood of being enrolled in private schools, with 2 (6.9% in the age bracket) enrolled. Conversely, the age group of 3 to 4 year olds has the lowest likelihood of being enrolled in a private school, with 75 (100.0% in the age bracket) attending a public institution.
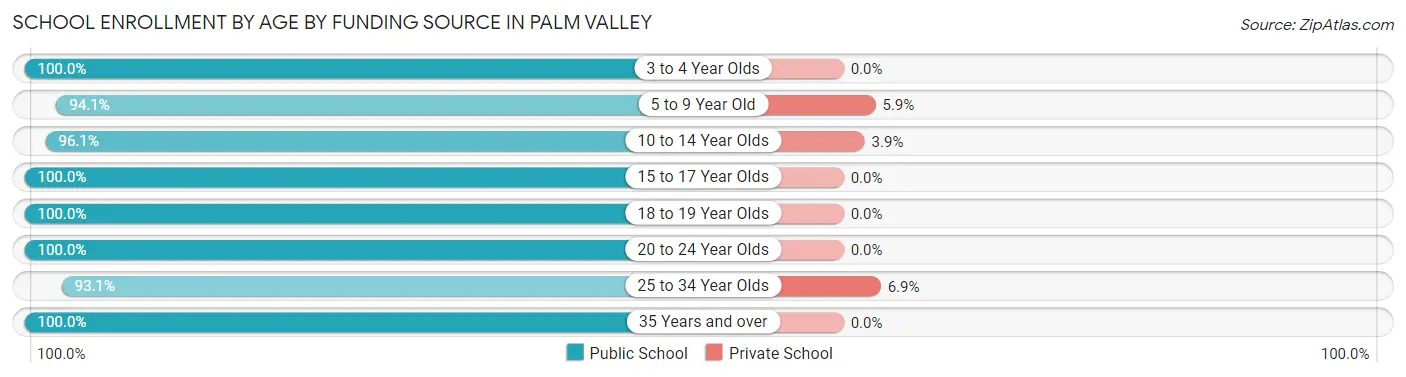
| Age Bracket | Public School | Private School |
| 3 to 4 Year Olds | 75 (100.0%) | 0 (0.0%) |
| 5 to 9 Year Old | 111 (94.1%) | 7 (5.9%) |
| 10 to 14 Year Olds | 172 (96.1%) | 7 (3.9%) |
| 15 to 17 Year Olds | 77 (100.0%) | 0 (0.0%) |
| 18 to 19 Year Olds | 10 (100.0%) | 0 (0.0%) |
| 20 to 24 Year Olds | 23 (100.0%) | 0 (0.0%) |
| 25 to 34 Year Olds | 27 (93.1%) | 2 (6.9%) |
| 35 Years and over | 17 (100.0%) | 0 (0.0%) |
| Total | 512 (97.0%) | 16 (3.0%) |
Educational Attainment by Field of Study in Palm Valley
Business (131 | 23.1%), education (108 | 19.1%), bio, nature & agricultural (62 | 11.0%), science & technology (41 | 7.2%), and arts & humanities (39 | 6.9%) are the most common fields of study among 566 individuals in Palm Valley who have obtained a bachelor's degree or higher.
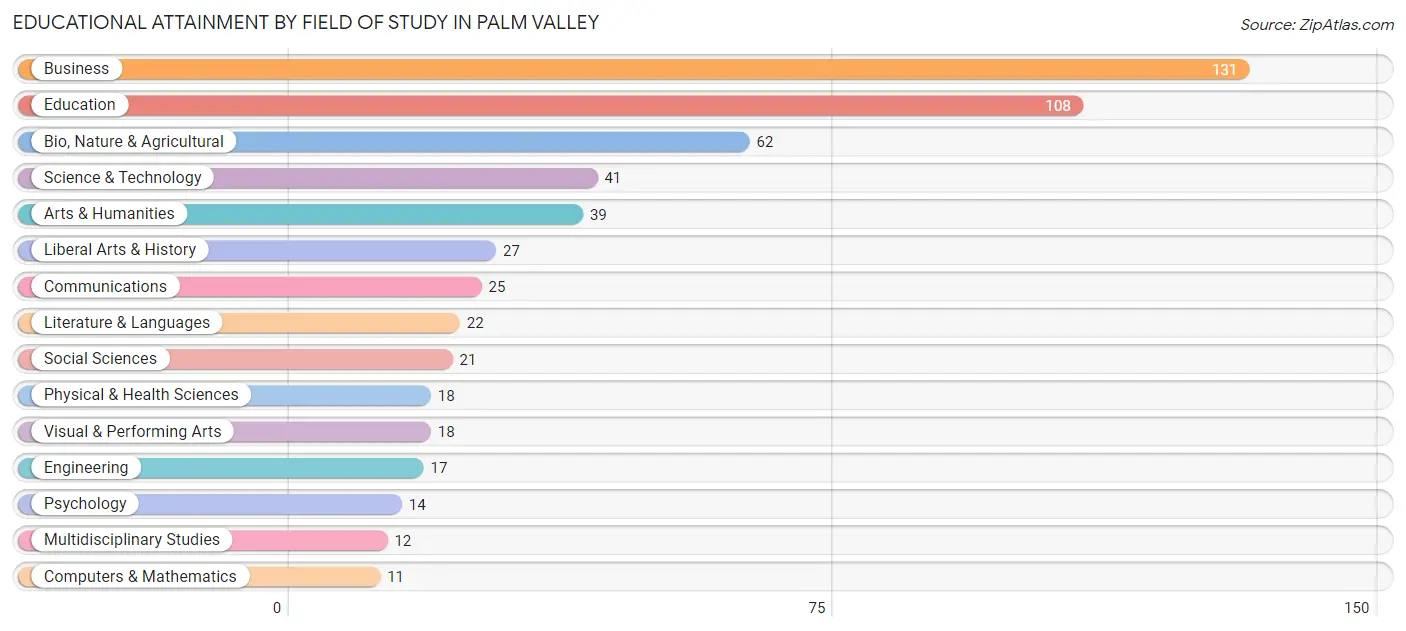
| Field of Study | # Graduates | % Graduates |
| Computers & Mathematics | 11 | 1.9% |
| Bio, Nature & Agricultural | 62 | 11.0% |
| Physical & Health Sciences | 18 | 3.2% |
| Psychology | 14 | 2.5% |
| Social Sciences | 21 | 3.7% |
| Engineering | 17 | 3.0% |
| Multidisciplinary Studies | 12 | 2.1% |
| Science & Technology | 41 | 7.2% |
| Business | 131 | 23.1% |
| Education | 108 | 19.1% |
| Literature & Languages | 22 | 3.9% |
| Liberal Arts & History | 27 | 4.8% |
| Visual & Performing Arts | 18 | 3.2% |
| Communications | 25 | 4.4% |
| Arts & Humanities | 39 | 6.9% |
| Total | 566 | 100.0% |
Transportation & Commute in Palm Valley
Vehicle Availability by Sex in Palm Valley
The most prevalent vehicle ownership categories in Palm Valley are males with 2 vehicles (241, accounting for 73.9%) and females with 2 vehicles (146, making up 82.5%).
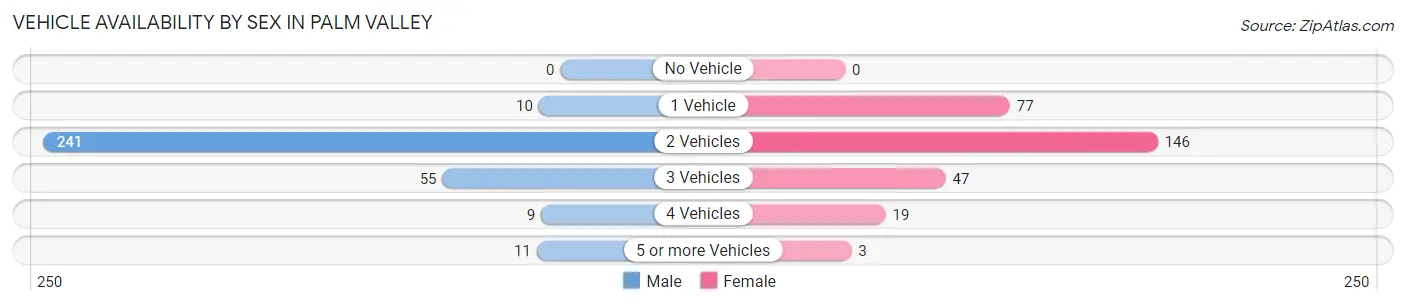
| Vehicles Available | Male | Female |
| No Vehicle | 0 (0.0%) | 0 (0.0%) |
| 1 Vehicle | 10 (3.1%) | 77 (26.4%) |
| 2 Vehicles | 241 (73.9%) | 146 (50.0%) |
| 3 Vehicles | 55 (16.9%) | 47 (16.1%) |
| 4 Vehicles | 9 (2.8%) | 19 (6.5%) |
| 5 or more Vehicles | 11 (3.4%) | 3 (1.0%) |
| Total | 326 (100.0%) | 292 (100.0%) |
Commute Time in Palm Valley
The most frequently occuring commute durations in Palm Valley are 15 to 19 minutes (184 commuters, 34.7%), 10 to 14 minutes (94 commuters, 17.7%), and 30 to 34 minutes (56 commuters, 10.6%).
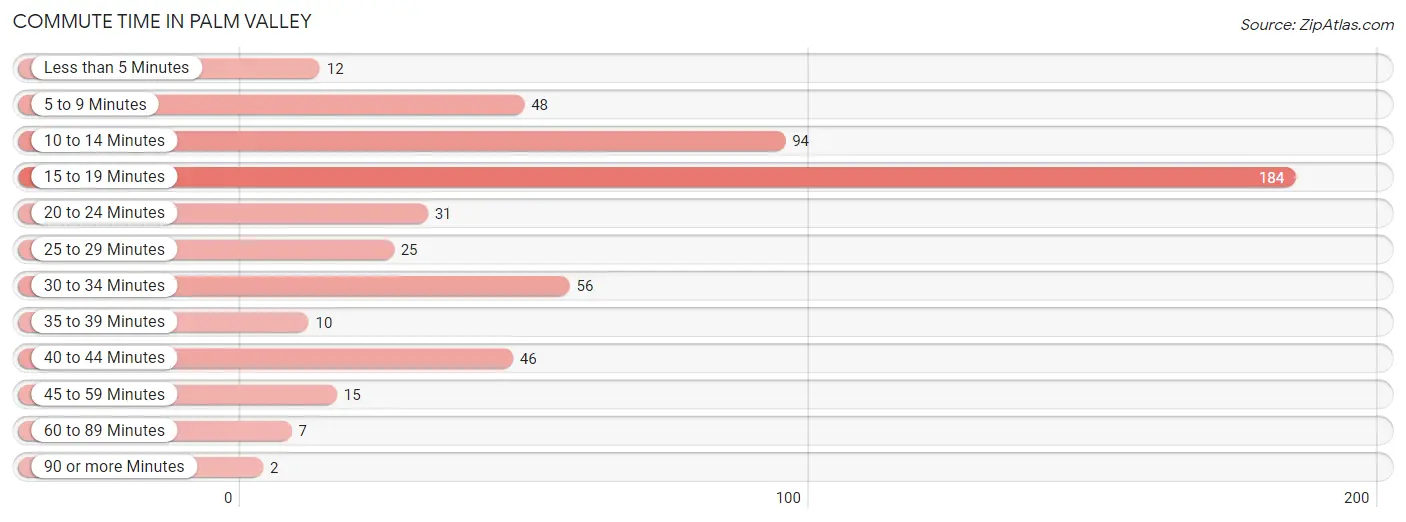
| Commute Time | # Commuters | % Commuters |
| Less than 5 Minutes | 12 | 2.3% |
| 5 to 9 Minutes | 48 | 9.1% |
| 10 to 14 Minutes | 94 | 17.7% |
| 15 to 19 Minutes | 184 | 34.7% |
| 20 to 24 Minutes | 31 | 5.9% |
| 25 to 29 Minutes | 25 | 4.7% |
| 30 to 34 Minutes | 56 | 10.6% |
| 35 to 39 Minutes | 10 | 1.9% |
| 40 to 44 Minutes | 46 | 8.7% |
| 45 to 59 Minutes | 15 | 2.8% |
| 60 to 89 Minutes | 7 | 1.3% |
| 90 or more Minutes | 2 | 0.4% |
Commute Time by Sex in Palm Valley
The most common commute times in Palm Valley are 15 to 19 minutes (112 commuters, 39.6%) for males and 15 to 19 minutes (72 commuters, 29.1%) for females.
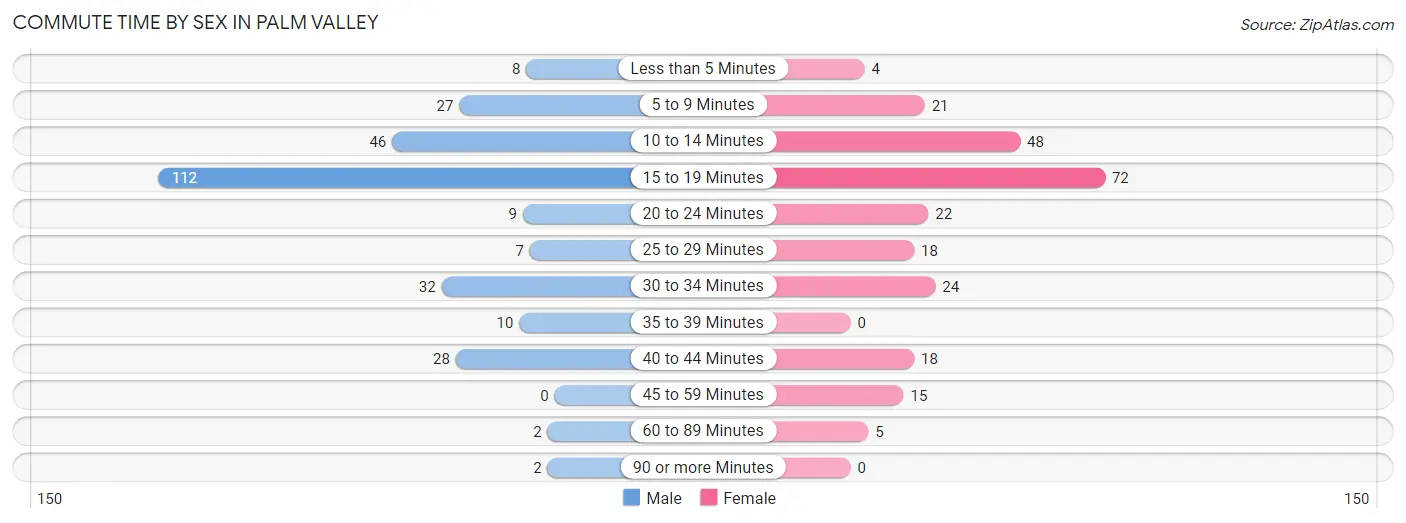
| Commute Time | Male | Female |
| Less than 5 Minutes | 8 (2.8%) | 4 (1.6%) |
| 5 to 9 Minutes | 27 (9.5%) | 21 (8.5%) |
| 10 to 14 Minutes | 46 (16.3%) | 48 (19.4%) |
| 15 to 19 Minutes | 112 (39.6%) | 72 (29.1%) |
| 20 to 24 Minutes | 9 (3.2%) | 22 (8.9%) |
| 25 to 29 Minutes | 7 (2.5%) | 18 (7.3%) |
| 30 to 34 Minutes | 32 (11.3%) | 24 (9.7%) |
| 35 to 39 Minutes | 10 (3.5%) | 0 (0.0%) |
| 40 to 44 Minutes | 28 (9.9%) | 18 (7.3%) |
| 45 to 59 Minutes | 0 (0.0%) | 15 (6.1%) |
| 60 to 89 Minutes | 2 (0.7%) | 5 (2.0%) |
| 90 or more Minutes | 2 (0.7%) | 0 (0.0%) |
Time of Departure to Work by Sex in Palm Valley
The most frequent times of departure to work in Palm Valley are 7:30 AM to 7:59 AM (91, 32.2%) for males and 7:30 AM to 7:59 AM (91, 36.8%) for females.
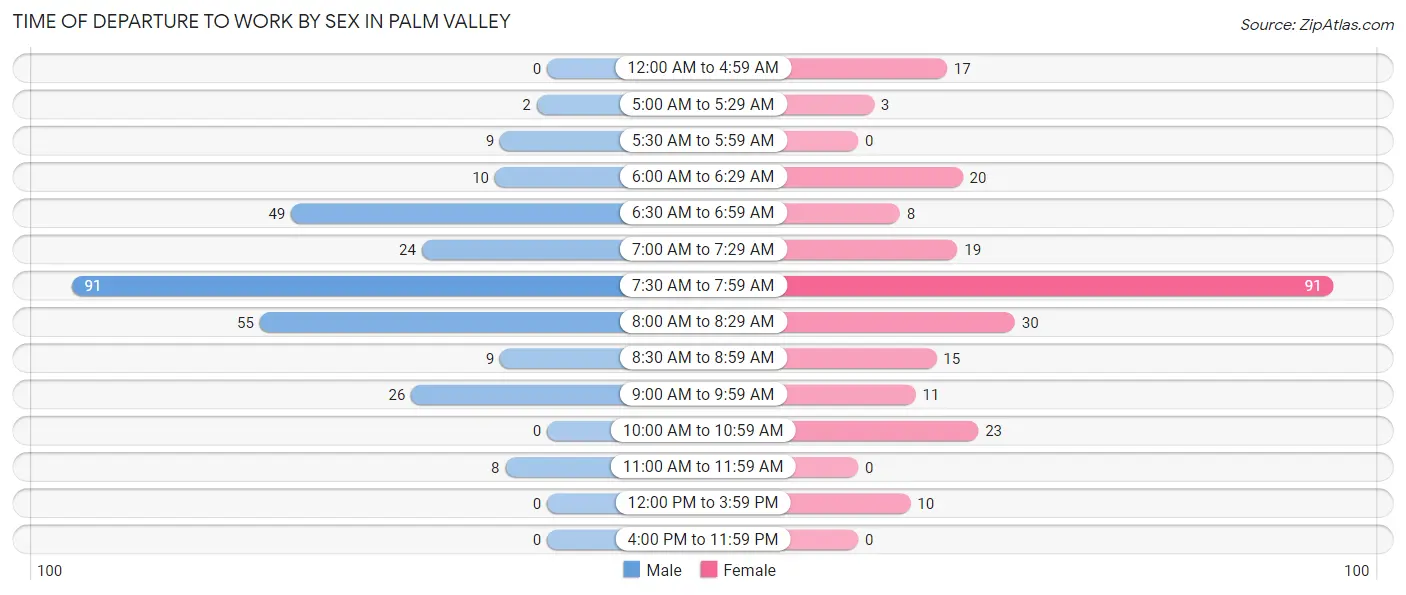
| Time of Departure | Male | Female |
| 12:00 AM to 4:59 AM | 0 (0.0%) | 17 (6.9%) |
| 5:00 AM to 5:29 AM | 2 (0.7%) | 3 (1.2%) |
| 5:30 AM to 5:59 AM | 9 (3.2%) | 0 (0.0%) |
| 6:00 AM to 6:29 AM | 10 (3.5%) | 20 (8.1%) |
| 6:30 AM to 6:59 AM | 49 (17.3%) | 8 (3.2%) |
| 7:00 AM to 7:29 AM | 24 (8.5%) | 19 (7.7%) |
| 7:30 AM to 7:59 AM | 91 (32.2%) | 91 (36.8%) |
| 8:00 AM to 8:29 AM | 55 (19.4%) | 30 (12.1%) |
| 8:30 AM to 8:59 AM | 9 (3.2%) | 15 (6.1%) |
| 9:00 AM to 9:59 AM | 26 (9.2%) | 11 (4.4%) |
| 10:00 AM to 10:59 AM | 0 (0.0%) | 23 (9.3%) |
| 11:00 AM to 11:59 AM | 8 (2.8%) | 0 (0.0%) |
| 12:00 PM to 3:59 PM | 0 (0.0%) | 10 (4.1%) |
| 4:00 PM to 11:59 PM | 0 (0.0%) | 0 (0.0%) |
| Total | 283 (100.0%) | 247 (100.0%) |
Housing Occupancy in Palm Valley
Occupancy by Ownership in Palm Valley
Of the total 736 dwellings in Palm Valley, owner-occupied units account for 583 (79.2%), while renter-occupied units make up 153 (20.8%).
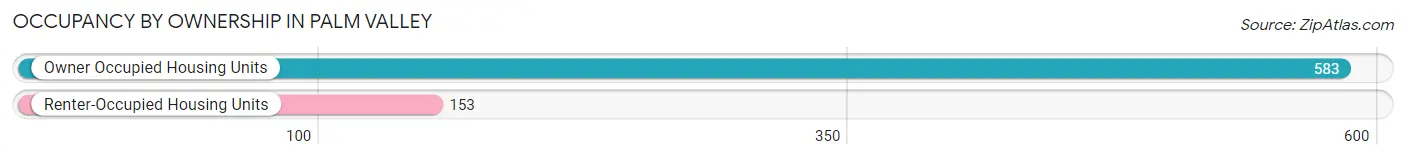
| Occupancy | # Housing Units | % Housing Units |
| Owner Occupied Housing Units | 583 | 79.2% |
| Renter-Occupied Housing Units | 153 | 20.8% |
| Total Occupied Housing Units | 736 | 100.0% |
Occupancy by Household Size in Palm Valley
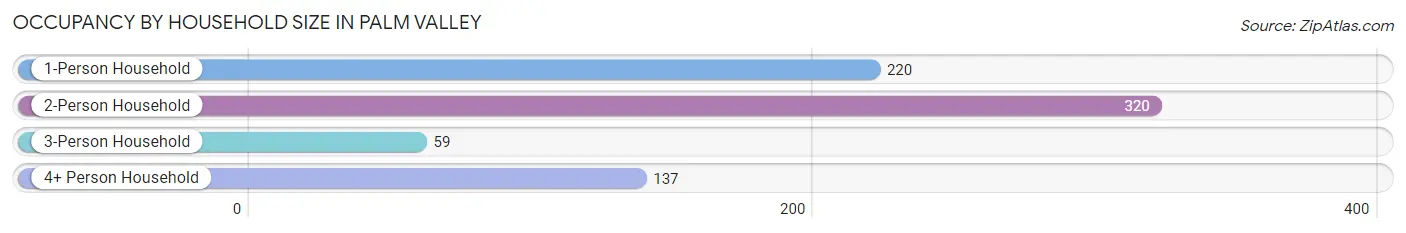
| Household Size | # Housing Units | % Housing Units |
| 1-Person Household | 220 | 29.9% |
| 2-Person Household | 320 | 43.5% |
| 3-Person Household | 59 | 8.0% |
| 4+ Person Household | 137 | 18.6% |
| Total Housing Units | 736 | 100.0% |
Occupancy by Ownership by Household Size in Palm Valley
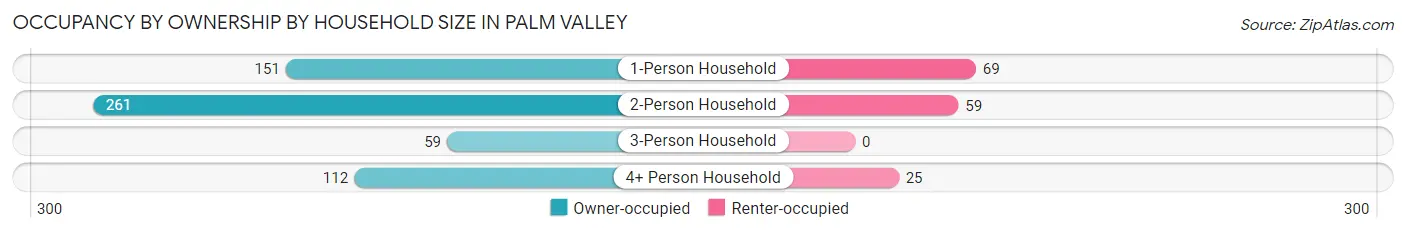
| Household Size | Owner-occupied | Renter-occupied |
| 1-Person Household | 151 (68.6%) | 69 (31.4%) |
| 2-Person Household | 261 (81.6%) | 59 (18.4%) |
| 3-Person Household | 59 (100.0%) | 0 (0.0%) |
| 4+ Person Household | 112 (81.8%) | 25 (18.2%) |
| Total Housing Units | 583 (79.2%) | 153 (20.8%) |
Occupancy by Educational Attainment in Palm Valley
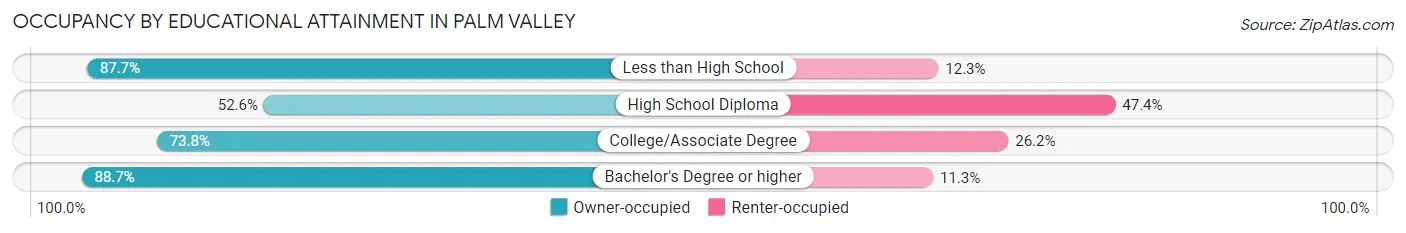
| Household Size | Owner-occupied | Renter-occupied |
| Less than High School | 64 (87.7%) | 9 (12.3%) |
| High School Diploma | 51 (52.6%) | 46 (47.4%) |
| College/Associate Degree | 169 (73.8%) | 60 (26.2%) |
| Bachelor's Degree or higher | 299 (88.7%) | 38 (11.3%) |
Occupancy by Age of Householder in Palm Valley
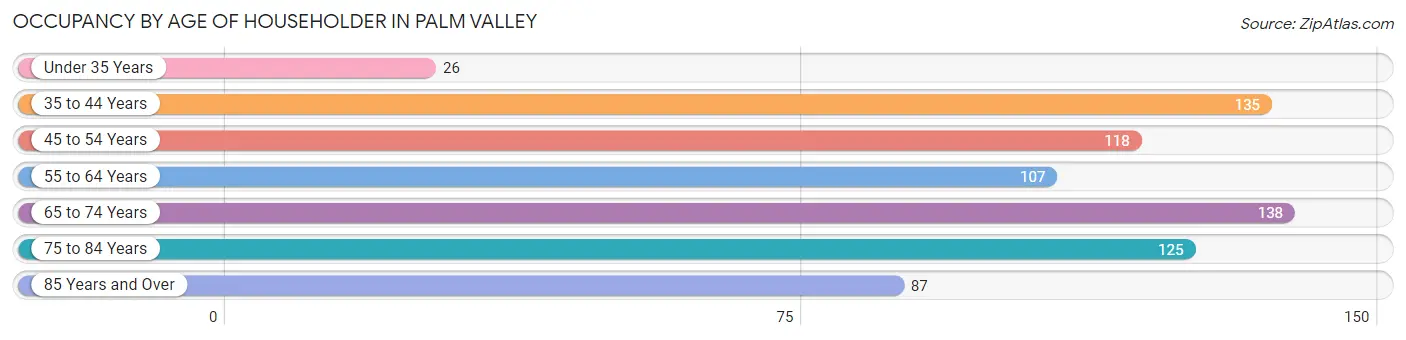
| Age Bracket | # Households | % Households |
| Under 35 Years | 26 | 3.5% |
| 35 to 44 Years | 135 | 18.3% |
| 45 to 54 Years | 118 | 16.0% |
| 55 to 64 Years | 107 | 14.5% |
| 65 to 74 Years | 138 | 18.8% |
| 75 to 84 Years | 125 | 17.0% |
| 85 Years and Over | 87 | 11.8% |
| Total | 736 | 100.0% |
Housing Finances in Palm Valley
Median Income by Occupancy in Palm Valley
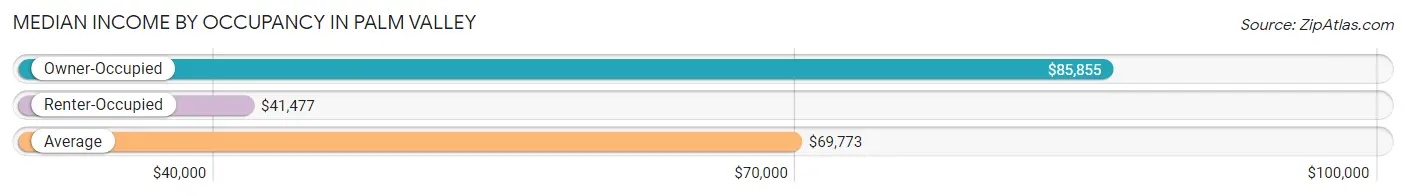
| Occupancy Type | # Households | Median Income |
| Owner-Occupied | 583 (79.2%) | $85,855 |
| Renter-Occupied | 153 (20.8%) | $41,477 |
| Average | 736 (100.0%) | $69,773 |
Occupancy by Householder Income Bracket in Palm Valley
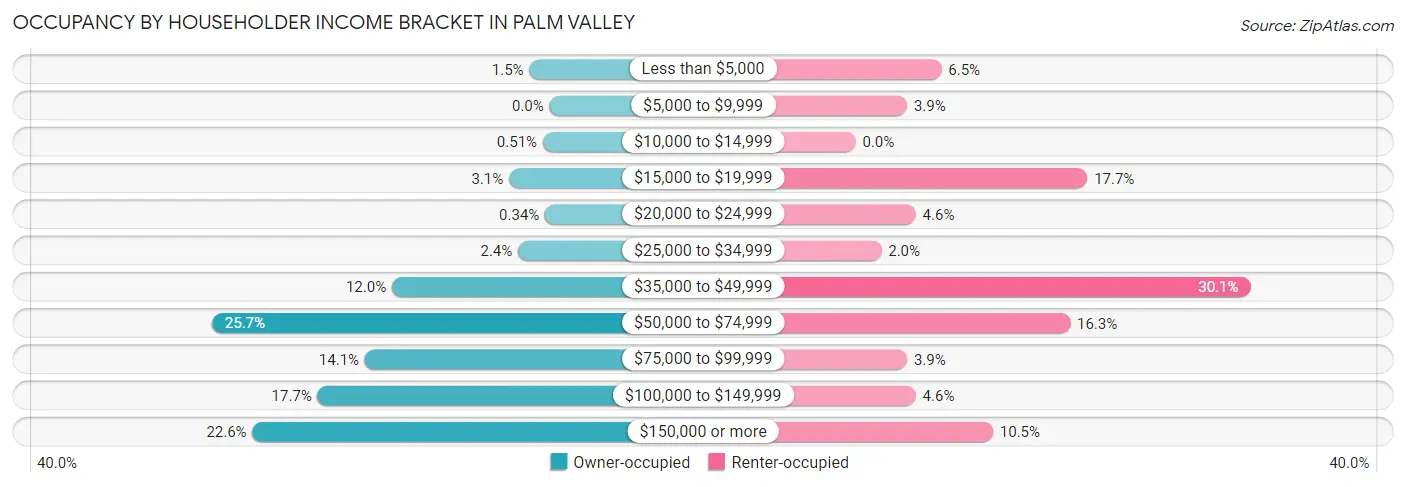
| Income Bracket | Owner-occupied | Renter-occupied |
| Less than $5,000 | 9 (1.5%) | 10 (6.5%) |
| $5,000 to $9,999 | 0 (0.0%) | 6 (3.9%) |
| $10,000 to $14,999 | 3 (0.5%) | 0 (0.0%) |
| $15,000 to $19,999 | 18 (3.1%) | 27 (17.6%) |
| $20,000 to $24,999 | 2 (0.3%) | 7 (4.6%) |
| $25,000 to $34,999 | 14 (2.4%) | 3 (2.0%) |
| $35,000 to $49,999 | 70 (12.0%) | 46 (30.1%) |
| $50,000 to $74,999 | 150 (25.7%) | 25 (16.3%) |
| $75,000 to $99,999 | 82 (14.1%) | 6 (3.9%) |
| $100,000 to $149,999 | 103 (17.7%) | 7 (4.6%) |
| $150,000 or more | 132 (22.6%) | 16 (10.5%) |
| Total | 583 (100.0%) | 153 (100.0%) |
Monthly Housing Cost Tiers in Palm Valley
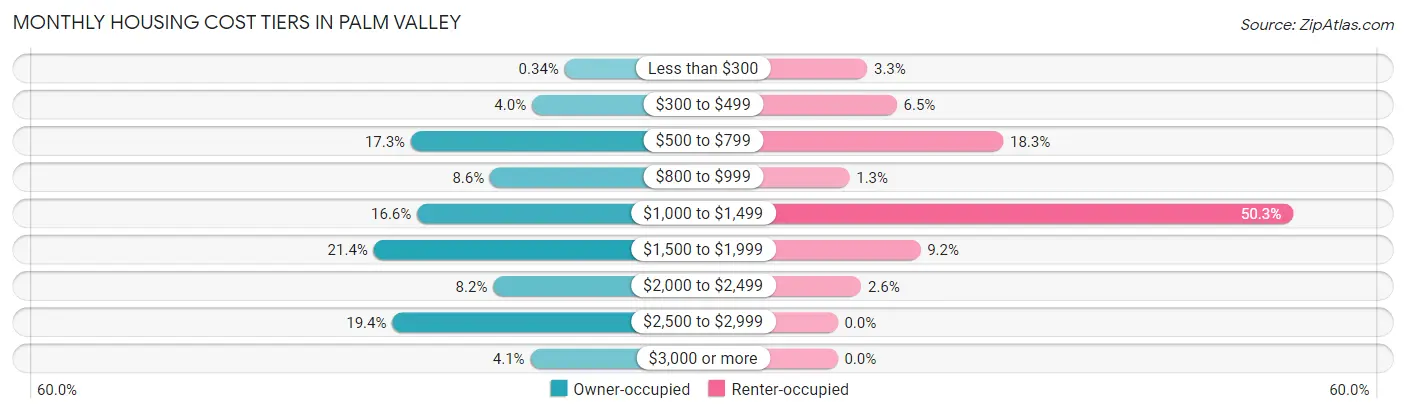
| Monthly Cost | Owner-occupied | Renter-occupied |
| Less than $300 | 2 (0.3%) | 5 (3.3%) |
| $300 to $499 | 23 (4.0%) | 10 (6.5%) |
| $500 to $799 | 101 (17.3%) | 28 (18.3%) |
| $800 to $999 | 50 (8.6%) | 2 (1.3%) |
| $1,000 to $1,499 | 97 (16.6%) | 77 (50.3%) |
| $1,500 to $1,999 | 125 (21.4%) | 14 (9.1%) |
| $2,000 to $2,499 | 48 (8.2%) | 4 (2.6%) |
| $2,500 to $2,999 | 113 (19.4%) | 0 (0.0%) |
| $3,000 or more | 24 (4.1%) | 0 (0.0%) |
| Total | 583 (100.0%) | 153 (100.0%) |
Physical Housing Characteristics in Palm Valley
Housing Structures in Palm Valley
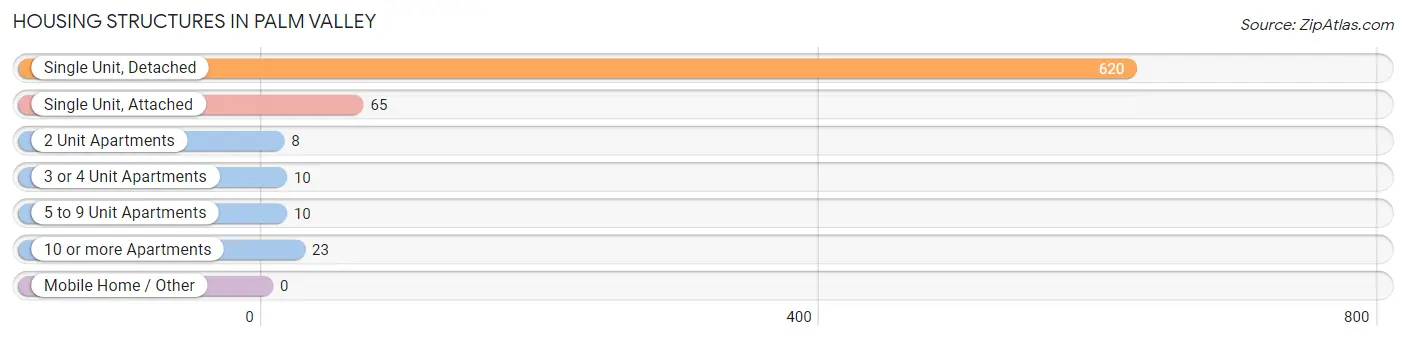
| Structure Type | # Housing Units | % Housing Units |
| Single Unit, Detached | 620 | 84.2% |
| Single Unit, Attached | 65 | 8.8% |
| 2 Unit Apartments | 8 | 1.1% |
| 3 or 4 Unit Apartments | 10 | 1.4% |
| 5 to 9 Unit Apartments | 10 | 1.4% |
| 10 or more Apartments | 23 | 3.1% |
| Mobile Home / Other | 0 | 0.0% |
| Total | 736 | 100.0% |
Housing Structures by Occupancy in Palm Valley
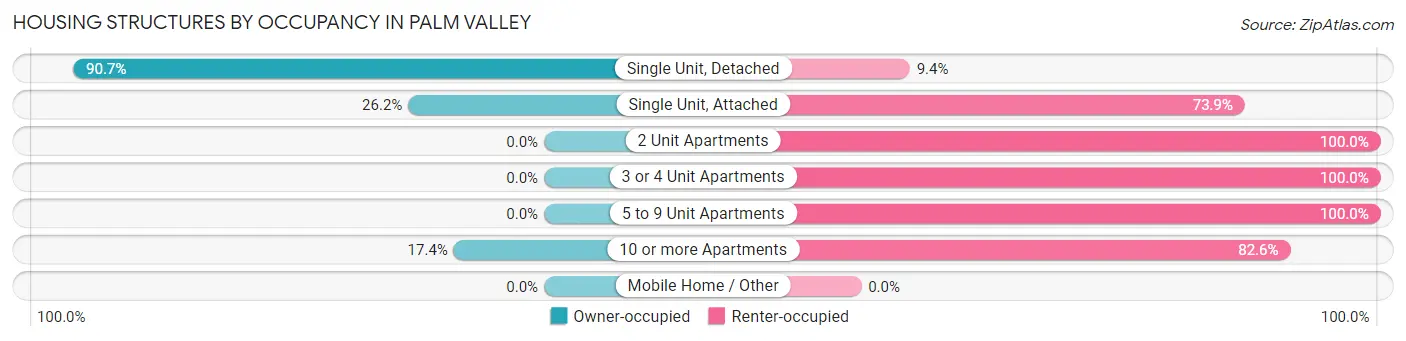
| Structure Type | Owner-occupied | Renter-occupied |
| Single Unit, Detached | 562 (90.6%) | 58 (9.3%) |
| Single Unit, Attached | 17 (26.2%) | 48 (73.9%) |
| 2 Unit Apartments | 0 (0.0%) | 8 (100.0%) |
| 3 or 4 Unit Apartments | 0 (0.0%) | 10 (100.0%) |
| 5 to 9 Unit Apartments | 0 (0.0%) | 10 (100.0%) |
| 10 or more Apartments | 4 (17.4%) | 19 (82.6%) |
| Mobile Home / Other | 0 (0.0%) | 0 (0.0%) |
| Total | 583 (79.2%) | 153 (20.8%) |
Housing Structures by Number of Rooms in Palm Valley
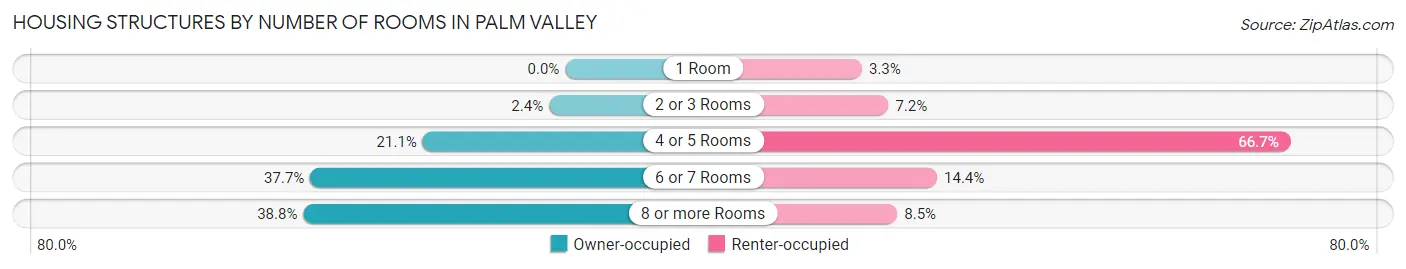
| Number of Rooms | Owner-occupied | Renter-occupied |
| 1 Room | 0 (0.0%) | 5 (3.3%) |
| 2 or 3 Rooms | 14 (2.4%) | 11 (7.2%) |
| 4 or 5 Rooms | 123 (21.1%) | 102 (66.7%) |
| 6 or 7 Rooms | 220 (37.7%) | 22 (14.4%) |
| 8 or more Rooms | 226 (38.8%) | 13 (8.5%) |
| Total | 583 (100.0%) | 153 (100.0%) |
Housing Structure by Heating Type in Palm Valley
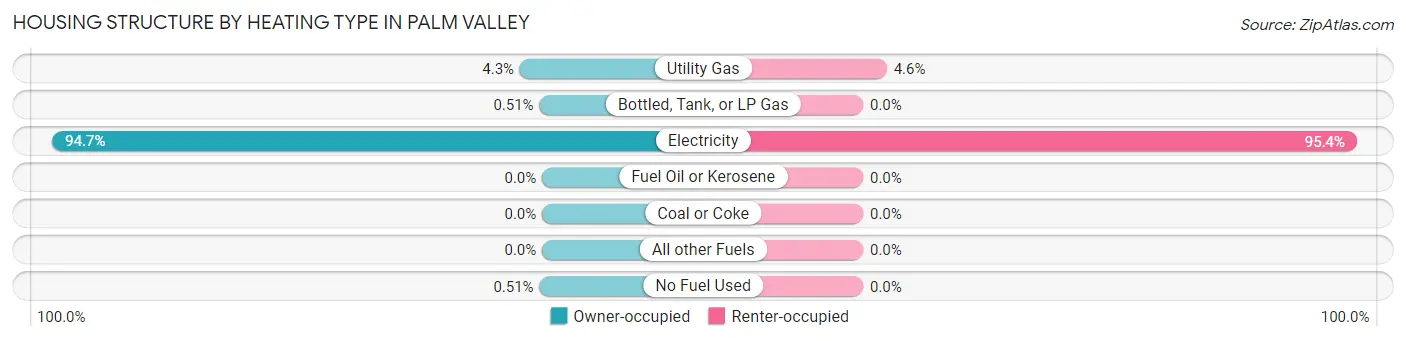
| Heating Type | Owner-occupied | Renter-occupied |
| Utility Gas | 25 (4.3%) | 7 (4.6%) |
| Bottled, Tank, or LP Gas | 3 (0.5%) | 0 (0.0%) |
| Electricity | 552 (94.7%) | 146 (95.4%) |
| Fuel Oil or Kerosene | 0 (0.0%) | 0 (0.0%) |
| Coal or Coke | 0 (0.0%) | 0 (0.0%) |
| All other Fuels | 0 (0.0%) | 0 (0.0%) |
| No Fuel Used | 3 (0.5%) | 0 (0.0%) |
| Total | 583 (100.0%) | 153 (100.0%) |
Household Vehicle Usage in Palm Valley
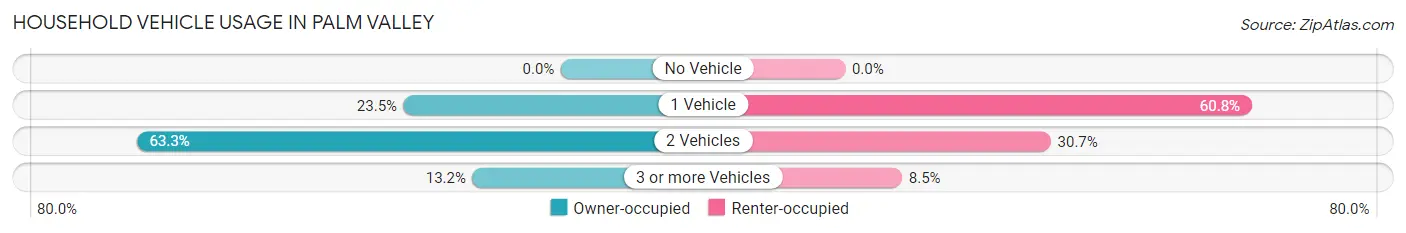
| Vehicles per Household | Owner-occupied | Renter-occupied |
| No Vehicle | 0 (0.0%) | 0 (0.0%) |
| 1 Vehicle | 137 (23.5%) | 93 (60.8%) |
| 2 Vehicles | 369 (63.3%) | 47 (30.7%) |
| 3 or more Vehicles | 77 (13.2%) | 13 (8.5%) |
| Total | 583 (100.0%) | 153 (100.0%) |
Real Estate & Mortgages in Palm Valley
Real Estate and Mortgage Overview in Palm Valley
| Characteristic | Without Mortgage | With Mortgage |
| Housing Units | 211 | 372 |
| Median Property Value | $226,100 | $290,200 |
| Median Household Income | $83,750 | $98 |
| Monthly Housing Costs | $773 | $24 |
| Real Estate Taxes | $3,385 | $43 |
Property Value by Mortgage Status in Palm Valley
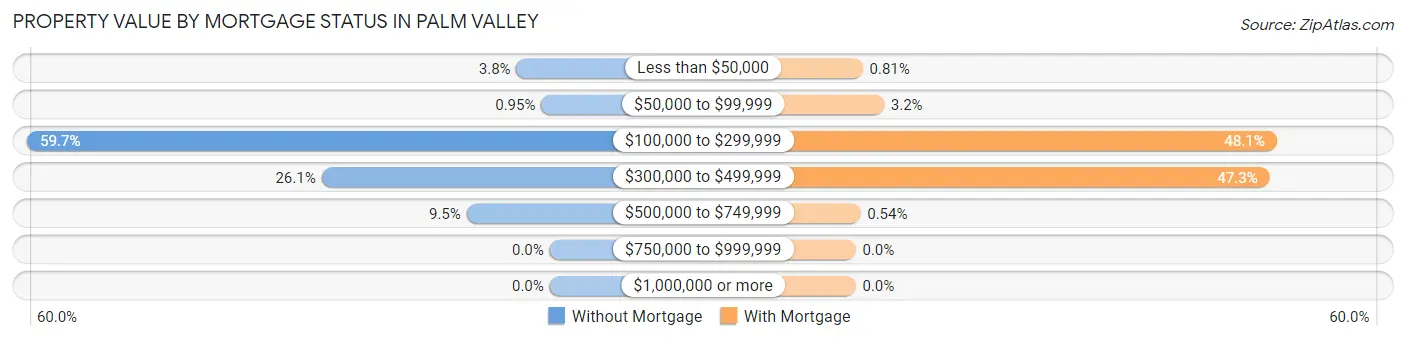
| Property Value | Without Mortgage | With Mortgage |
| Less than $50,000 | 8 (3.8%) | 3 (0.8%) |
| $50,000 to $99,999 | 2 (0.9%) | 12 (3.2%) |
| $100,000 to $299,999 | 126 (59.7%) | 179 (48.1%) |
| $300,000 to $499,999 | 55 (26.1%) | 176 (47.3%) |
| $500,000 to $749,999 | 20 (9.5%) | 2 (0.5%) |
| $750,000 to $999,999 | 0 (0.0%) | 0 (0.0%) |
| $1,000,000 or more | 0 (0.0%) | 0 (0.0%) |
| Total | 211 (100.0%) | 372 (100.0%) |
Household Income by Mortgage Status in Palm Valley
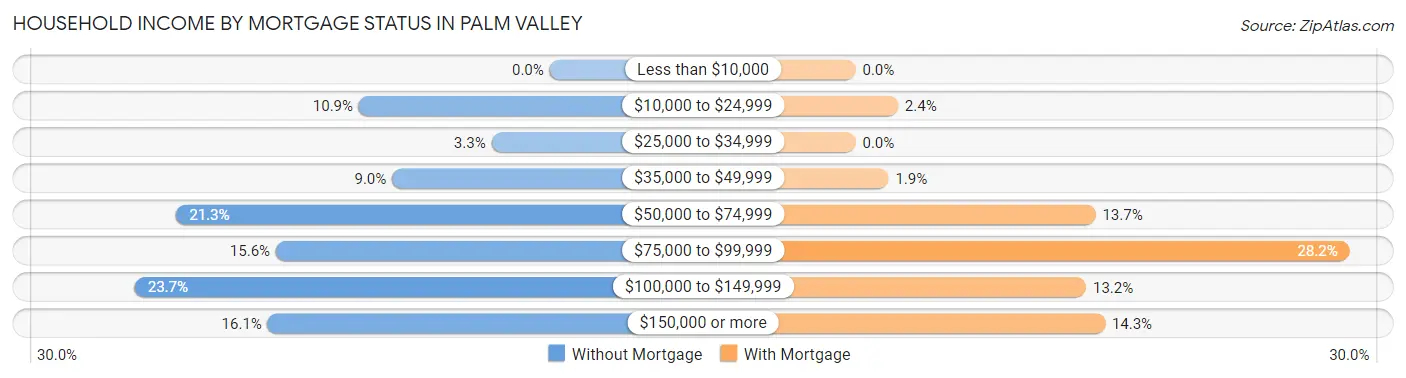
| Household Income | Without Mortgage | With Mortgage |
| Less than $10,000 | 0 (0.0%) | 0 (0.0%) |
| $10,000 to $24,999 | 23 (10.9%) | 9 (2.4%) |
| $25,000 to $34,999 | 7 (3.3%) | 0 (0.0%) |
| $35,000 to $49,999 | 19 (9.0%) | 7 (1.9%) |
| $50,000 to $74,999 | 45 (21.3%) | 51 (13.7%) |
| $75,000 to $99,999 | 33 (15.6%) | 105 (28.2%) |
| $100,000 to $149,999 | 50 (23.7%) | 49 (13.2%) |
| $150,000 or more | 34 (16.1%) | 53 (14.2%) |
| Total | 211 (100.0%) | 372 (100.0%) |
Property Value to Household Income Ratio in Palm Valley
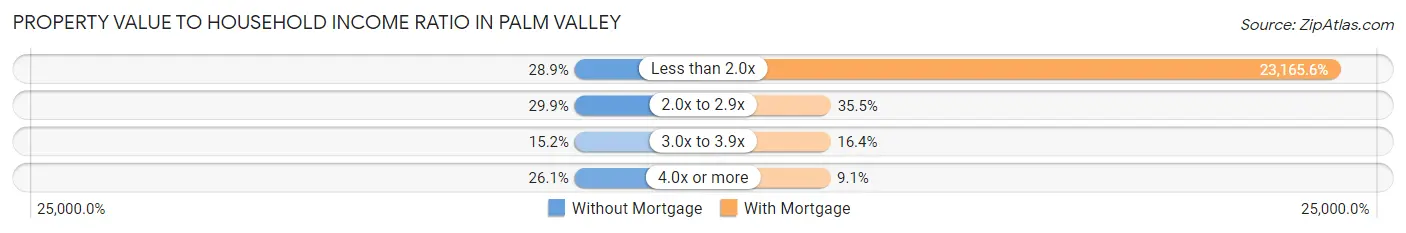
| Value-to-Income Ratio | Without Mortgage | With Mortgage |
| Less than 2.0x | 61 (28.9%) | 86,176 (23,165.6%) |
| 2.0x to 2.9x | 63 (29.9%) | 132 (35.5%) |
| 3.0x to 3.9x | 32 (15.2%) | 61 (16.4%) |
| 4.0x or more | 55 (26.1%) | 34 (9.1%) |
| Total | 211 (100.0%) | 372 (100.0%) |
Real Estate Taxes by Mortgage Status in Palm Valley
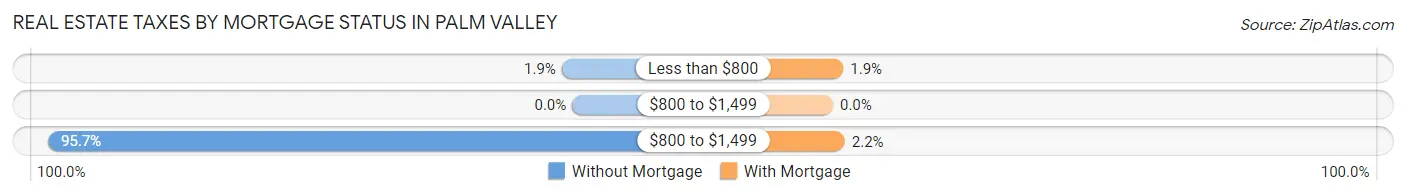
| Property Taxes | Without Mortgage | With Mortgage |
| Less than $800 | 4 (1.9%) | 7 (1.9%) |
| $800 to $1,499 | 0 (0.0%) | 0 (0.0%) |
| $800 to $1,499 | 202 (95.7%) | 8 (2.1%) |
| Total | 211 (100.0%) | 372 (100.0%) |
Health & Disability in Palm Valley
Health Insurance Coverage by Age in Palm Valley
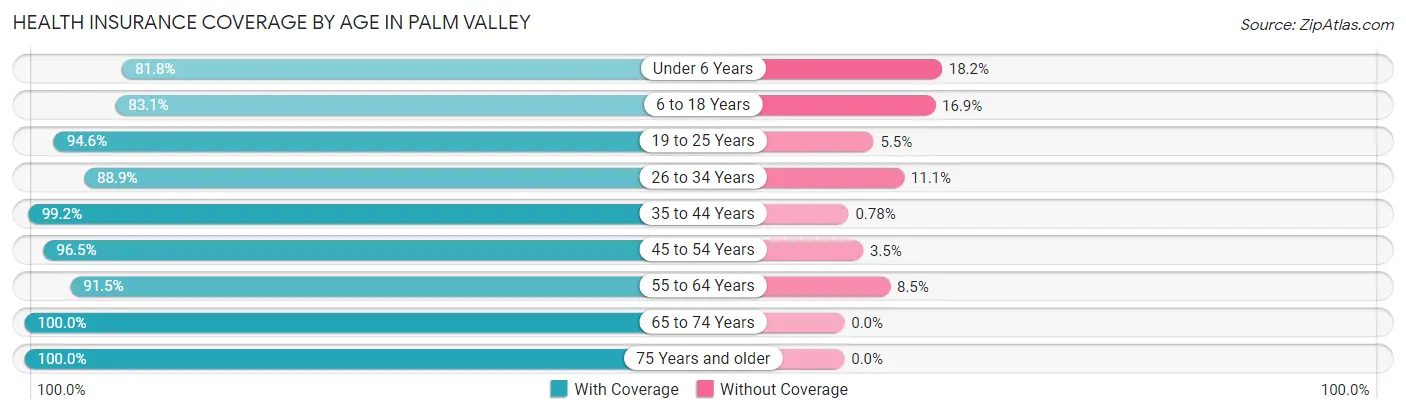
| Age Bracket | With Coverage | Without Coverage |
| Under 6 Years | 99 (81.8%) | 22 (18.2%) |
| 6 to 18 Years | 329 (83.1%) | 67 (16.9%) |
| 19 to 25 Years | 52 (94.6%) | 3 (5.4%) |
| 26 to 34 Years | 96 (88.9%) | 12 (11.1%) |
| 35 to 44 Years | 256 (99.2%) | 2 (0.8%) |
| 45 to 54 Years | 166 (96.5%) | 6 (3.5%) |
| 55 to 64 Years | 193 (91.5%) | 18 (8.5%) |
| 65 to 74 Years | 264 (100.0%) | 0 (0.0%) |
| 75 Years and older | 291 (100.0%) | 0 (0.0%) |
| Total | 1,746 (93.1%) | 130 (6.9%) |
Health Insurance Coverage by Citizenship Status in Palm Valley
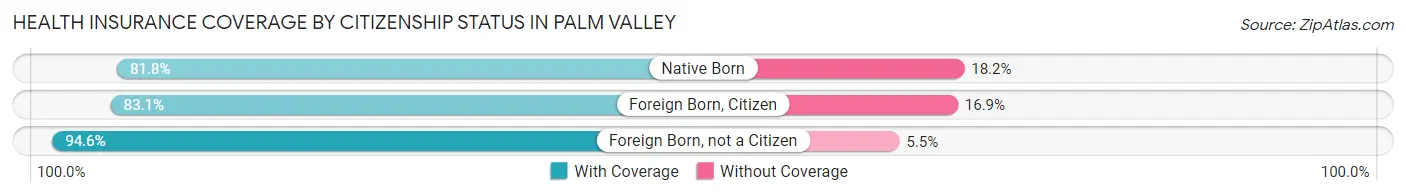
| Citizenship Status | With Coverage | Without Coverage |
| Native Born | 99 (81.8%) | 22 (18.2%) |
| Foreign Born, Citizen | 329 (83.1%) | 67 (16.9%) |
| Foreign Born, not a Citizen | 52 (94.6%) | 3 (5.4%) |
Health Insurance Coverage by Household Income in Palm Valley
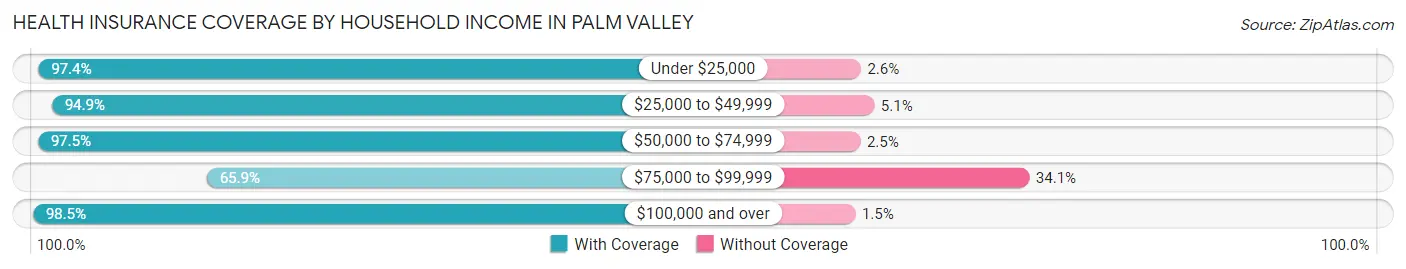
| Household Income | With Coverage | Without Coverage |
| Under $25,000 | 114 (97.4%) | 3 (2.6%) |
| $25,000 to $49,999 | 374 (94.9%) | 20 (5.1%) |
| $50,000 to $74,999 | 316 (97.5%) | 8 (2.5%) |
| $75,000 to $99,999 | 168 (65.9%) | 87 (34.1%) |
| $100,000 and over | 774 (98.5%) | 12 (1.5%) |
Public vs Private Health Insurance Coverage by Age in Palm Valley
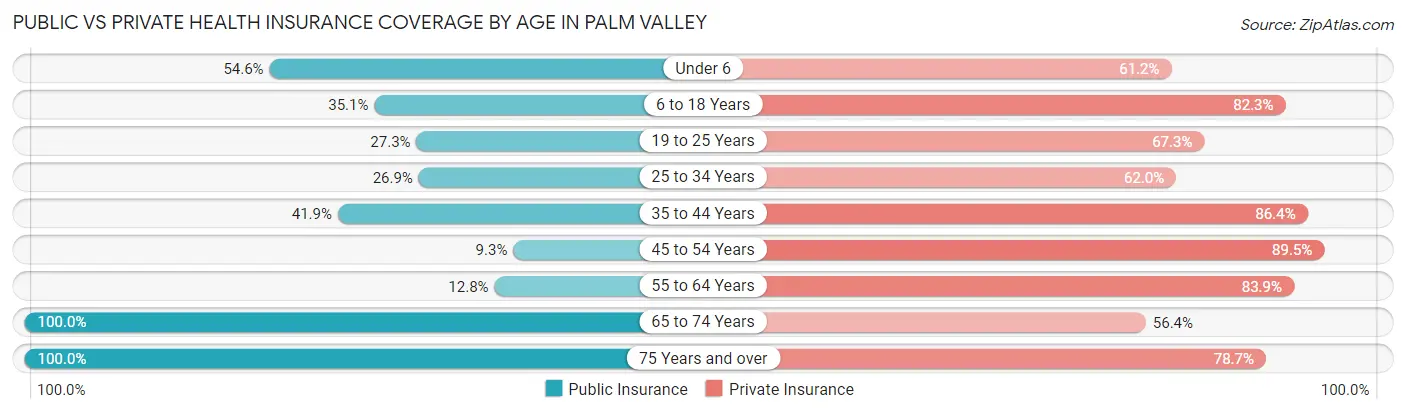
| Age Bracket | Public Insurance | Private Insurance |
| Under 6 | 66 (54.5%) | 74 (61.2%) |
| 6 to 18 Years | 139 (35.1%) | 326 (82.3%) |
| 19 to 25 Years | 15 (27.3%) | 37 (67.3%) |
| 25 to 34 Years | 29 (26.9%) | 67 (62.0%) |
| 35 to 44 Years | 108 (41.9%) | 223 (86.4%) |
| 45 to 54 Years | 16 (9.3%) | 154 (89.5%) |
| 55 to 64 Years | 27 (12.8%) | 177 (83.9%) |
| 65 to 74 Years | 264 (100.0%) | 149 (56.4%) |
| 75 Years and over | 291 (100.0%) | 229 (78.7%) |
| Total | 955 (50.9%) | 1,436 (76.5%) |
Disability Status by Sex by Age in Palm Valley
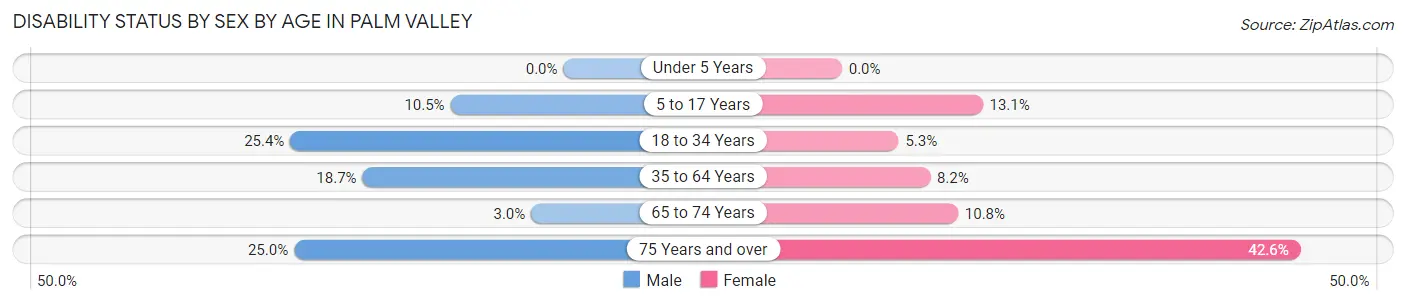
| Age Bracket | Male | Female |
| Under 5 Years | 0 (0.0%) | 0 (0.0%) |
| 5 to 17 Years | 11 (10.5%) | 38 (13.1%) |
| 18 to 34 Years | 18 (25.4%) | 5 (5.3%) |
| 35 to 64 Years | 58 (18.6%) | 27 (8.2%) |
| 65 to 74 Years | 4 (3.0%) | 14 (10.8%) |
| 75 Years and over | 34 (25.0%) | 66 (42.6%) |
Disability Class by Sex by Age in Palm Valley
Disability Class: Hearing Difficulty
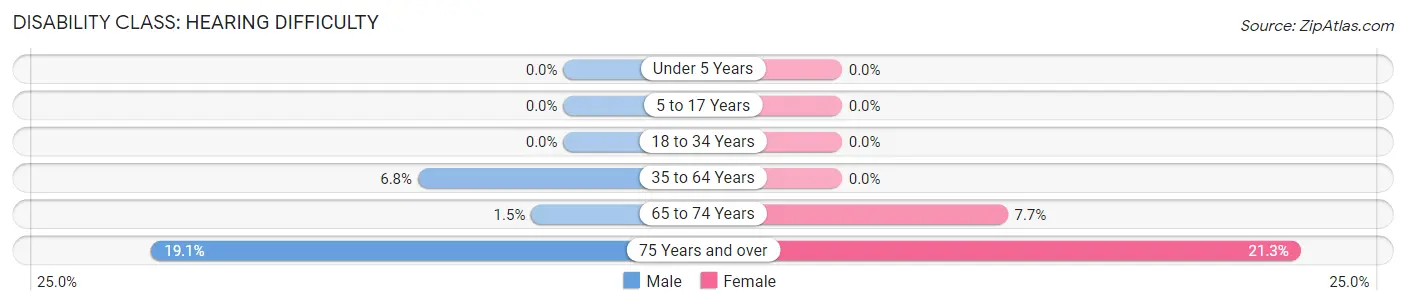
| Age Bracket | Male | Female |
| Under 5 Years | 0 (0.0%) | 0 (0.0%) |
| 5 to 17 Years | 0 (0.0%) | 0 (0.0%) |
| 18 to 34 Years | 0 (0.0%) | 0 (0.0%) |
| 35 to 64 Years | 21 (6.8%) | 0 (0.0%) |
| 65 to 74 Years | 2 (1.5%) | 10 (7.7%) |
| 75 Years and over | 26 (19.1%) | 33 (21.3%) |
Disability Class: Vision Difficulty
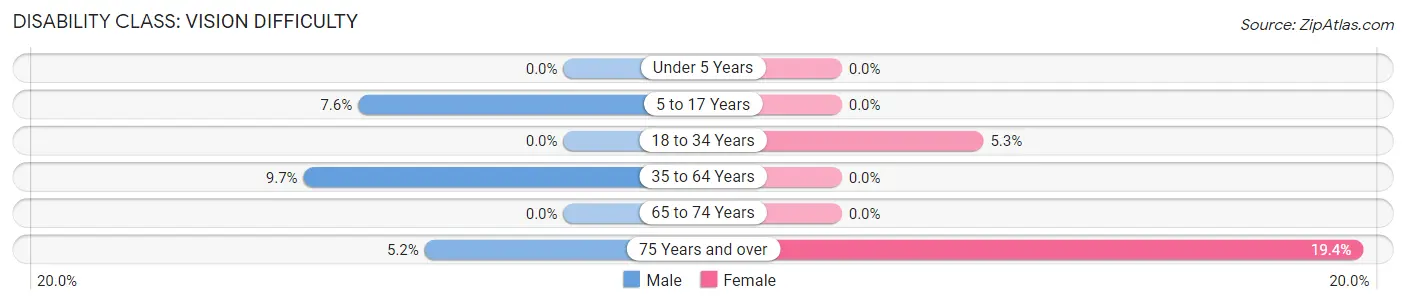
| Age Bracket | Male | Female |
| Under 5 Years | 0 (0.0%) | 0 (0.0%) |
| 5 to 17 Years | 8 (7.6%) | 0 (0.0%) |
| 18 to 34 Years | 0 (0.0%) | 5 (5.3%) |
| 35 to 64 Years | 30 (9.7%) | 0 (0.0%) |
| 65 to 74 Years | 0 (0.0%) | 0 (0.0%) |
| 75 Years and over | 7 (5.1%) | 30 (19.4%) |
Disability Class: Cognitive Difficulty
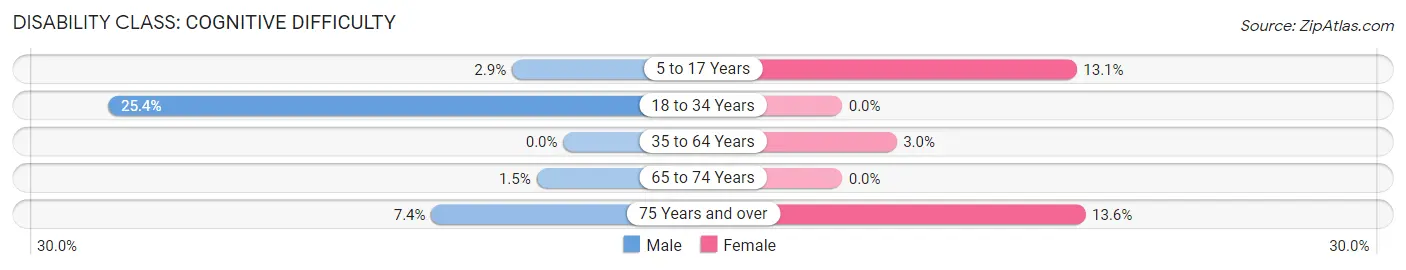
| Age Bracket | Male | Female |
| 5 to 17 Years | 3 (2.9%) | 38 (13.1%) |
| 18 to 34 Years | 18 (25.4%) | 0 (0.0%) |
| 35 to 64 Years | 0 (0.0%) | 10 (3.0%) |
| 65 to 74 Years | 2 (1.5%) | 0 (0.0%) |
| 75 Years and over | 10 (7.3%) | 21 (13.6%) |
Disability Class: Ambulatory Difficulty
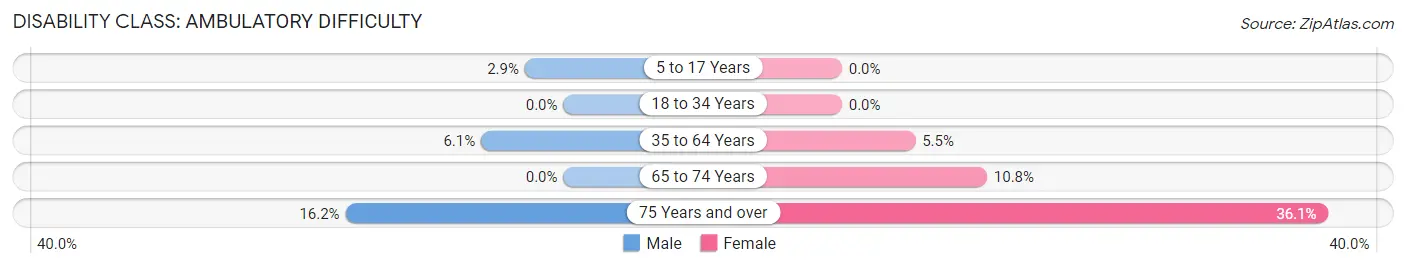
| Age Bracket | Male | Female |
| 5 to 17 Years | 3 (2.9%) | 0 (0.0%) |
| 18 to 34 Years | 0 (0.0%) | 0 (0.0%) |
| 35 to 64 Years | 19 (6.1%) | 18 (5.4%) |
| 65 to 74 Years | 0 (0.0%) | 14 (10.8%) |
| 75 Years and over | 22 (16.2%) | 56 (36.1%) |
Disability Class: Self-Care Difficulty
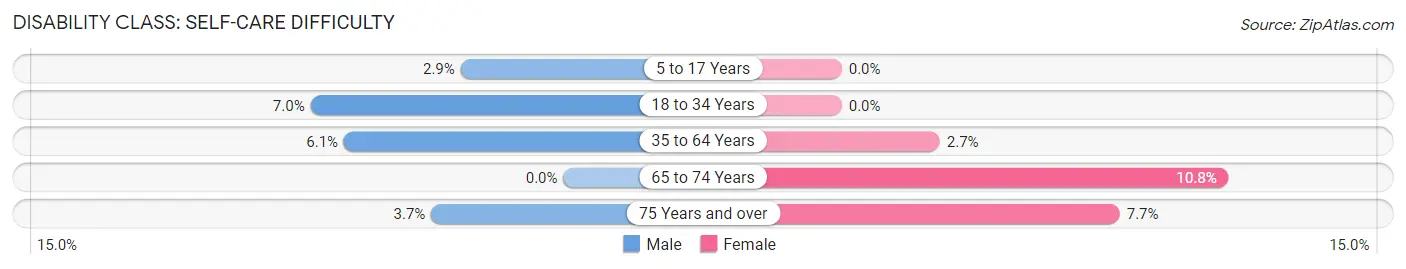
| Age Bracket | Male | Female |
| 5 to 17 Years | 3 (2.9%) | 0 (0.0%) |
| 18 to 34 Years | 5 (7.0%) | 0 (0.0%) |
| 35 to 64 Years | 19 (6.1%) | 9 (2.7%) |
| 65 to 74 Years | 0 (0.0%) | 14 (10.8%) |
| 75 Years and over | 5 (3.7%) | 12 (7.7%) |
Technology Access in Palm Valley
Computing Device Access in Palm Valley
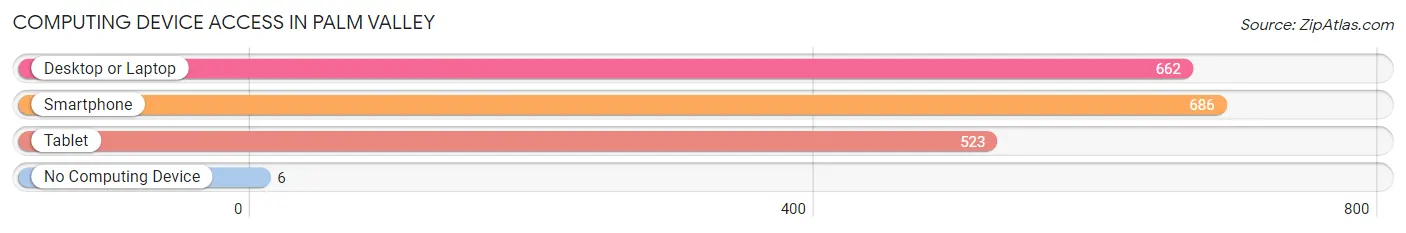
| Device Type | # Households | % Households |
| Desktop or Laptop | 662 | 89.9% |
| Smartphone | 686 | 93.2% |
| Tablet | 523 | 71.1% |
| No Computing Device | 6 | 0.8% |
| Total | 736 | 100.0% |
Internet Access in Palm Valley
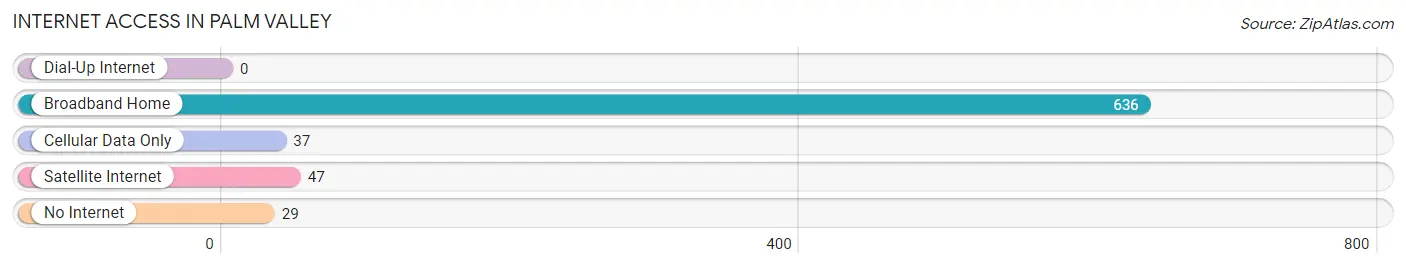
| Internet Type | # Households | % Households |
| Dial-Up Internet | 0 | 0.0% |
| Broadband Home | 636 | 86.4% |
| Cellular Data Only | 37 | 5.0% |
| Satellite Internet | 47 | 6.4% |
| No Internet | 29 | 3.9% |
| Total | 736 | 100.0% |
Palm Valley Summary
Palm Valley is a census-designated place (CDP) located in Hidalgo County, Texas, United States. The population was 2,845 at the 2010 census. It is part of the McAllen–Edinburg–Mission Metropolitan Statistical Area.
History
Palm Valley was originally part of the vast ranching empire of Richard King, who founded the King Ranch in 1853. The area was known as the "Palm Valley Ranch" and was used for cattle grazing. In the early 1900s, the area was settled by Mexican-American farmers who grew cotton, corn, and other crops. The area was known as "Palm Valley" because of the abundance of palm trees in the area.
In the 1950s, the area began to develop as a residential community. The first subdivision was built in 1956 and was named "Palm Valley Estates". The area continued to grow and by the 1970s, it had become a thriving community.
Geography
Palm Valley is located at 26 14 17 North 98 14 17 West 26 238 98 238
According to the United States Census Bureau, the CDP has a total area of 2.3 square miles (6.0 km2), all of it land.
Economy
The economy of Palm Valley is largely based on agriculture and tourism. The area is home to several large farms that produce cotton, corn, and other crops. The area is also popular with tourists, who come to enjoy the warm climate and the nearby beaches.
Demographics
As of the census of 2000, there were 2,845 people, 890 households, and 745 families residing in the CDP. The population density was 1,233.2 people per square mile (476.2/km2). There were 990 housing units at an average density of 428.3/sq mi (165.3/km2). The racial makeup of the CDP was 79.45% White, 0.21% African American, 0.14% Native American, 0.14% Asian, 0.00% Pacific Islander, 18.90% from other races, and 1.17% from two or more races. Hispanic or Latino of any race were 97.90% of the population.
There were 890 households, out of which 44.3% had children under the age of 18 living with them, 63.6% were married couples living together, 13.7% had a female householder with no husband present, and 17.7% were non-families. 14.3% of all households were made up of individuals, and 6.3% had someone living alone who was 65 years of age or older. The average household size was 3.19 and the average family size was 3.51.
In the CDP, the population was spread out, with 32.2% under the age of 18, 10.2% from 18 to 24, 27.2% from 25 to 44, 19.7% from 45 to 64, and 10.7% who were 65 years of age or older. The median age was 31 years. For every 100 females, there were 97.2 males. For every 100 females age 18 and over, there were 94.2 males.
The median income for a household in the CDP was $25,938, and the median income for a family was $27,917. Males had a median income of $20,938 versus $17,500 for females. The per capita income for the CDP was $9,845. About 24.2% of families and 28.2% of the population were below the poverty line, including 36.2% of those under age 18 and 24.2% of those age 65 or over.
Common Questions
What is Per Capita Income in Palm Valley?
Per Capita income in Palm Valley is $42,143.
What is the Median Family Income in Palm Valley?
Median Family Income in Palm Valley is $89,904.
What is the Median Household income in Palm Valley?
Median Household Income in Palm Valley is $69,773.
What is Income or Wage Gap in Palm Valley?
Income or Wage Gap in Palm Valley is 29.0%.
Women in Palm Valley earn 71.0 cents for every dollar earned by a man.
What is Inequality or Gini Index in Palm Valley?
Inequality or Gini Index in Palm Valley is 0.42.
What is the Total Population of Palm Valley?
Total Population of Palm Valley is 1,876.
What is the Total Male Population of Palm Valley?
Total Male Population of Palm Valley is 823.
What is the Total Female Population of Palm Valley?
Total Female Population of Palm Valley is 1,053.
What is the Ratio of Males per 100 Females in Palm Valley?
There are 78.16 Males per 100 Females in Palm Valley.
What is the Ratio of Females per 100 Males in Palm Valley?
There are 127.95 Females per 100 Males in Palm Valley.
What is the Median Population Age in Palm Valley?
Median Population Age in Palm Valley is 45.0 Years.
What is the Average Family Size in Palm Valley
Average Family Size in Palm Valley is 3.2 People.
What is the Average Household Size in Palm Valley
Average Household Size in Palm Valley is 2.5 People.
How Large is the Labor Force in Palm Valley?
There are 645 People in the Labor Forcein in Palm Valley.
What is the Percentage of People in the Labor Force in Palm Valley?
46.1% of People are in the Labor Force in Palm Valley.
What is the Unemployment Rate in Palm Valley?
Unemployment Rate in Palm Valley is 4.2%.