Zip Codes with the Highest Percentage of Population Employed in Life, Physical & Social Science in Texas
RELATED REPORTS & OPTIONS
Life, Physical & Social Science
Texas
Compare Zip Codes
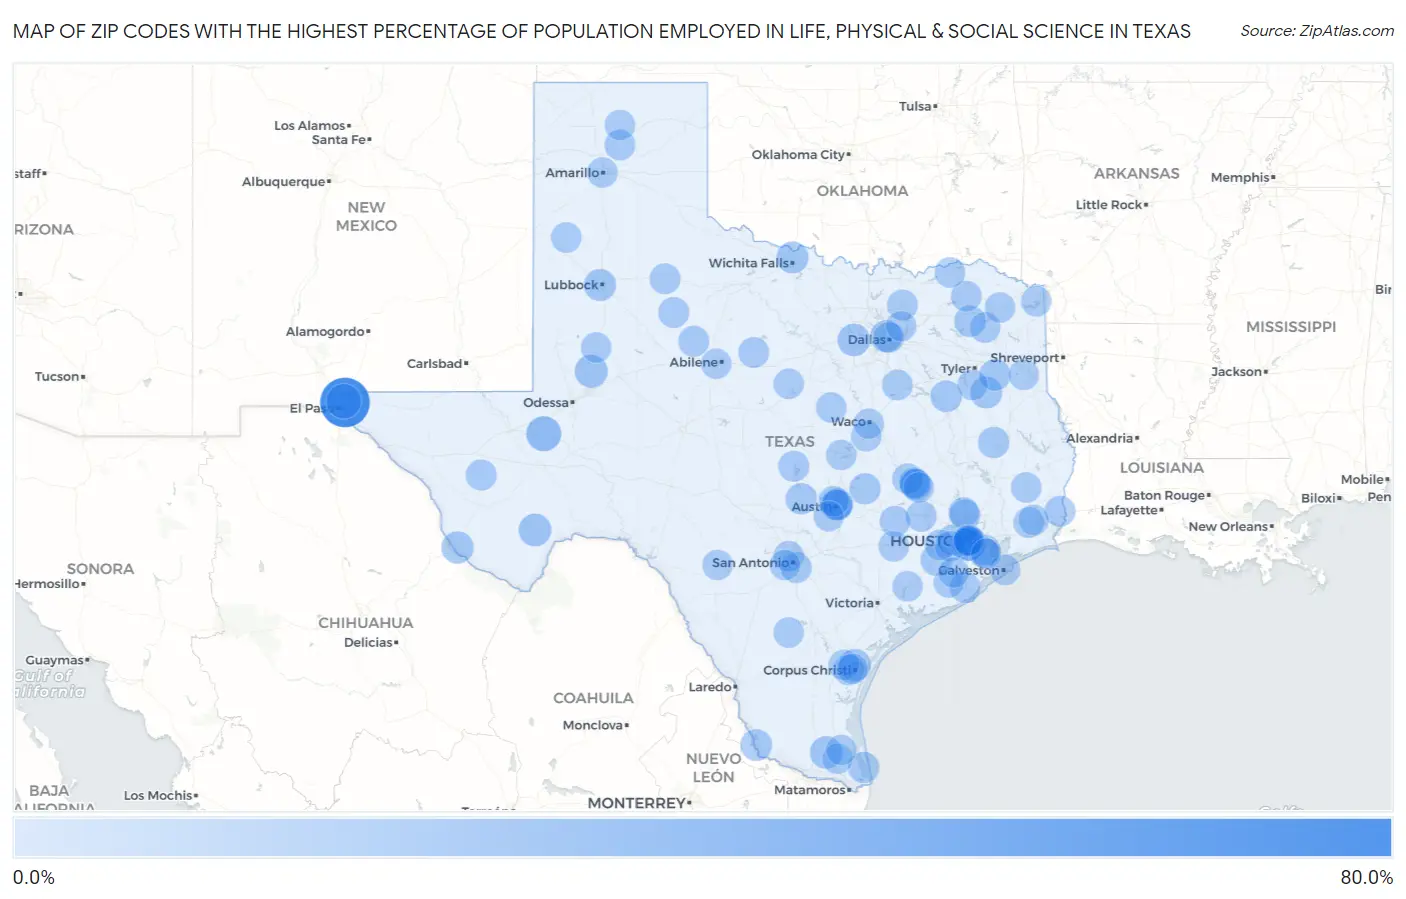
Map of Zip Codes with the Highest Percentage of Population Employed in Life, Physical & Social Science in Texas
0.0%
80.0%
Zip Codes with the Highest Percentage of Population Employed in Life, Physical & Social Science in Texas
| Zip Code | % Employed | vs State | vs National | |
| 1. | 79918 | 80.0% | 0.84%(+79.2)#1 | 1.1%(+78.9)#1 |
| 2. | 79916 | 20.6% | 0.84%(+19.7)#2 | 1.1%(+19.5)#58 |
| 3. | 79742 | 20.3% | 0.84%(+19.5)#3 | 1.1%(+19.2)#59 |
| 4. | 79783 | 12.3% | 0.84%(+11.5)#4 | 1.1%(+11.2)#142 |
| 5. | 79842 | 11.0% | 0.84%(+10.1)#5 | 1.1%(+9.89)#171 |
| 6. | 78561 | 10.7% | 0.84%(+9.90)#6 | 1.1%(+9.66)#180 |
| 7. | 76127 | 10.3% | 0.84%(+9.47)#7 | 1.1%(+9.22)#201 |
| 8. | 77030 | 9.6% | 0.84%(+8.78)#8 | 1.1%(+8.53)#222 |
| 9. | 79845 | 9.1% | 0.84%(+8.23)#9 | 1.1%(+7.98)#252 |
| 10. | 78402 | 8.7% | 0.84%(+7.81)#10 | 1.1%(+7.56)#272 |
| 11. | 79406 | 8.6% | 0.84%(+7.76)#11 | 1.1%(+7.51)#275 |
| 12. | 75780 | 8.4% | 0.84%(+7.60)#12 | 1.1%(+7.35)#290 |
| 13. | 75235 | 8.3% | 0.84%(+7.48)#13 | 1.1%(+7.24)#303 |
| 14. | 76311 | 8.1% | 0.84%(+7.27)#14 | 1.1%(+7.02)#314 |
| 15. | 77025 | 7.3% | 0.84%(+6.44)#15 | 1.1%(+6.19)#382 |
| 16. | 78545 | 7.1% | 0.84%(+6.24)#16 | 1.1%(+5.99)#399 |
| 17. | 75853 | 6.7% | 0.84%(+5.81)#17 | 1.1%(+5.56)#450 |
| 18. | 77054 | 6.6% | 0.84%(+5.77)#18 | 1.1%(+5.52)#455 |
| 19. | 75471 | 6.4% | 0.84%(+5.59)#19 | 1.1%(+5.34)#484 |
| 20. | 75682 | 6.3% | 0.84%(+5.47)#20 | 1.1%(+5.22)#499 |
| 21. | 77417 | 6.0% | 0.84%(+5.18)#21 | 1.1%(+4.93)#546 |
| 22. | 78597 | 5.8% | 0.84%(+5.01)#22 | 1.1%(+4.76)#563 |
| 23. | 78663 | 5.7% | 0.84%(+4.85)#23 | 1.1%(+4.60)#591 |
| 24. | 76578 | 5.3% | 0.84%(+4.51)#24 | 1.1%(+4.26)#667 |
| 25. | 75926 | 5.3% | 0.84%(+4.46)#25 | 1.1%(+4.21)#685 |
| 26. | 78751 | 5.0% | 0.84%(+4.21)#26 | 1.1%(+3.96)#750 |
| 27. | 77004 | 4.8% | 0.84%(+3.93)#27 | 1.1%(+3.69)#823 |
| 28. | 78235 | 4.7% | 0.84%(+3.88)#28 | 1.1%(+3.63)#842 |
| 29. | 77006 | 4.7% | 0.84%(+3.87)#29 | 1.1%(+3.63)#845 |
| 30. | 77840 | 4.6% | 0.84%(+3.80)#30 | 1.1%(+3.55)#869 |
| 31. | 79734 | 4.6% | 0.84%(+3.74)#31 | 1.1%(+3.49)#894 |
| 32. | 77426 | 4.4% | 0.84%(+3.60)#32 | 1.1%(+3.36)#944 |
| 33. | 78672 | 4.4% | 0.84%(+3.56)#33 | 1.1%(+3.31)#963 |
| 34. | 77632 | 4.2% | 0.84%(+3.39)#34 | 1.1%(+3.14)#1,033 |
| 35. | 79534 | 4.2% | 0.84%(+3.36)#35 | 1.1%(+3.11)#1,046 |
| 36. | 77401 | 4.2% | 0.84%(+3.34)#36 | 1.1%(+3.10)#1,054 |
| 37. | 77094 | 4.1% | 0.84%(+3.23)#37 | 1.1%(+2.98)#1,113 |
| 38. | 79528 | 4.0% | 0.84%(+3.20)#38 | 1.1%(+2.96)#1,127 |
| 39. | 77380 | 4.0% | 0.84%(+3.16)#39 | 1.1%(+2.91)#1,156 |
| 40. | 75454 | 4.0% | 0.84%(+3.14)#40 | 1.1%(+2.89)#1,160 |
| 41. | 77566 | 4.0% | 0.84%(+3.11)#41 | 1.1%(+2.86)#1,180 |
| 42. | 78705 | 3.9% | 0.84%(+3.10)#42 | 1.1%(+2.86)#1,184 |
| 43. | 78406 | 3.8% | 0.84%(+2.99)#43 | 1.1%(+2.74)#1,242 |
| 44. | 79036 | 3.8% | 0.84%(+2.93)#44 | 1.1%(+2.68)#1,282 |
| 45. | 79229 | 3.7% | 0.84%(+2.86)#45 | 1.1%(+2.61)#1,313 |
| 46. | 75451 | 3.6% | 0.84%(+2.80)#46 | 1.1%(+2.55)#1,350 |
| 47. | 78229 | 3.6% | 0.84%(+2.79)#47 | 1.1%(+2.54)#1,355 |
| 48. | 77613 | 3.5% | 0.84%(+2.66)#48 | 1.1%(+2.41)#1,422 |
| 49. | 78722 | 3.4% | 0.84%(+2.60)#49 | 1.1%(+2.35)#1,464 |
| 50. | 77441 | 3.4% | 0.84%(+2.60)#50 | 1.1%(+2.35)#1,467 |
| 51. | 75450 | 3.4% | 0.84%(+2.59)#51 | 1.1%(+2.34)#1,472 |
| 52. | 77005 | 3.4% | 0.84%(+2.58)#52 | 1.1%(+2.33)#1,488 |
| 53. | 75102 | 3.4% | 0.84%(+2.57)#53 | 1.1%(+2.33)#1,491 |
| 54. | 77807 | 3.3% | 0.84%(+2.49)#54 | 1.1%(+2.24)#1,550 |
| 55. | 76464 | 3.3% | 0.84%(+2.46)#55 | 1.1%(+2.21)#1,575 |
| 56. | 77059 | 3.3% | 0.84%(+2.45)#56 | 1.1%(+2.21)#1,580 |
| 57. | 78954 | 3.3% | 0.84%(+2.44)#57 | 1.1%(+2.19)#1,598 |
| 58. | 77550 | 3.2% | 0.84%(+2.39)#58 | 1.1%(+2.14)#1,639 |
| 59. | 78731 | 3.2% | 0.84%(+2.35)#59 | 1.1%(+2.10)#1,673 |
| 60. | 78410 | 3.2% | 0.84%(+2.33)#60 | 1.1%(+2.08)#1,689 |
| 61. | 77062 | 3.2% | 0.84%(+2.31)#61 | 1.1%(+2.07)#1,701 |
| 62. | 76630 | 3.0% | 0.84%(+2.18)#62 | 1.1%(+1.94)#1,846 |
| 63. | 77801 | 3.0% | 0.84%(+2.15)#63 | 1.1%(+1.90)#1,884 |
| 64. | 77027 | 2.9% | 0.84%(+2.07)#64 | 1.1%(+1.83)#1,980 |
| 65. | 79031 | 2.8% | 0.84%(+1.98)#65 | 1.1%(+1.73)#2,090 |
| 66. | 77407 | 2.8% | 0.84%(+1.98)#66 | 1.1%(+1.73)#2,092 |
| 67. | 76444 | 2.8% | 0.84%(+1.96)#67 | 1.1%(+1.71)#2,114 |
| 68. | 76548 | 2.7% | 0.84%(+1.90)#68 | 1.1%(+1.65)#2,192 |
| 69. | 78072 | 2.7% | 0.84%(+1.86)#69 | 1.1%(+1.61)#2,245 |
| 70. | 77713 | 2.7% | 0.84%(+1.85)#70 | 1.1%(+1.60)#2,258 |
| 71. | 77381 | 2.7% | 0.84%(+1.84)#71 | 1.1%(+1.59)#2,270 |
| 72. | 77007 | 2.7% | 0.84%(+1.84)#72 | 1.1%(+1.59)#2,272 |
| 73. | 79607 | 2.7% | 0.84%(+1.83)#73 | 1.1%(+1.58)#2,278 |
| 74. | 77843 | 2.7% | 0.84%(+1.83)#74 | 1.1%(+1.58)#2,284 |
| 75. | 77019 | 2.6% | 0.84%(+1.80)#75 | 1.1%(+1.55)#2,326 |
| 76. | 75573 | 2.6% | 0.84%(+1.79)#76 | 1.1%(+1.54)#2,350 |
| 77. | 78962 | 2.6% | 0.84%(+1.72)#77 | 1.1%(+1.47)#2,464 |
| 78. | 77058 | 2.5% | 0.84%(+1.71)#78 | 1.1%(+1.46)#2,483 |
| 79. | 77845 | 2.5% | 0.84%(+1.70)#79 | 1.1%(+1.46)#2,490 |
| 80. | 75486 | 2.5% | 0.84%(+1.70)#80 | 1.1%(+1.45)#2,496 |
| 81. | 77480 | 2.5% | 0.84%(+1.67)#81 | 1.1%(+1.43)#2,543 |
| 82. | 75219 | 2.5% | 0.84%(+1.65)#82 | 1.1%(+1.40)#2,591 |
| 83. | 77664 | 2.5% | 0.84%(+1.65)#83 | 1.1%(+1.40)#2,595 |
| 84. | 78569 | 2.5% | 0.84%(+1.62)#84 | 1.1%(+1.38)#2,632 |
| 85. | 75757 | 2.5% | 0.84%(+1.61)#85 | 1.1%(+1.36)#2,651 |
| 86. | 79101 | 2.5% | 0.84%(+1.61)#86 | 1.1%(+1.36)#2,656 |
| 87. | 78236 | 2.5% | 0.84%(+1.61)#87 | 1.1%(+1.36)#2,658 |
| 88. | 79331 | 2.5% | 0.84%(+1.61)#88 | 1.1%(+1.36)#2,659 |
| 89. | 77962 | 2.4% | 0.84%(+1.60)#89 | 1.1%(+1.36)#2,668 |
| 90. | 75558 | 2.4% | 0.84%(+1.60)#90 | 1.1%(+1.35)#2,675 |
| 91. | 78652 | 2.4% | 0.84%(+1.57)#91 | 1.1%(+1.32)#2,739 |
| 92. | 76711 | 2.4% | 0.84%(+1.57)#92 | 1.1%(+1.32)#2,746 |
| 93. | 78590 | 2.4% | 0.84%(+1.56)#93 | 1.1%(+1.31)#2,762 |
| 94. | 75631 | 2.4% | 0.84%(+1.55)#94 | 1.1%(+1.30)#2,779 |
| 95. | 78801 | 2.4% | 0.84%(+1.53)#95 | 1.1%(+1.29)#2,802 |
| 96. | 75048 | 2.4% | 0.84%(+1.53)#96 | 1.1%(+1.28)#2,805 |
| 97. | 78405 | 2.3% | 0.84%(+1.51)#97 | 1.1%(+1.26)#2,846 |
| 98. | 79083 | 2.3% | 0.84%(+1.50)#98 | 1.1%(+1.25)#2,852 |
| 99. | 77430 | 2.3% | 0.84%(+1.49)#99 | 1.1%(+1.24)#2,872 |
| 100. | 76637 | 2.3% | 0.84%(+1.48)#100 | 1.1%(+1.23)#2,891 |
Common Questions
What are the Top 10 Zip Codes with the Highest Percentage of Population Employed in Life, Physical & Social Science in Texas?
Top 10 Zip Codes with the Highest Percentage of Population Employed in Life, Physical & Social Science in Texas are:
What zip code has the Highest Percentage of Population Employed in Life, Physical & Social Science in Texas?
79918 has the Highest Percentage of Population Employed in Life, Physical & Social Science in Texas with 80.0%.
What is the Percentage of Population Employed in Life, Physical & Social Science in the State of Texas?
Percentage of Population Employed in Life, Physical & Social Science in Texas is 0.84%.
What is the Percentage of Population Employed in Life, Physical & Social Science in the United States?
Percentage of Population Employed in Life, Physical & Social Science in the United States is 1.1%.