Zip Codes with the Highest Percentage of Population Employed in Life, Physical & Social Science in North Richland Hills, TX
RELATED REPORTS & OPTIONS
Life, Physical & Social Science
North Richland Hills
Compare Zip Codes
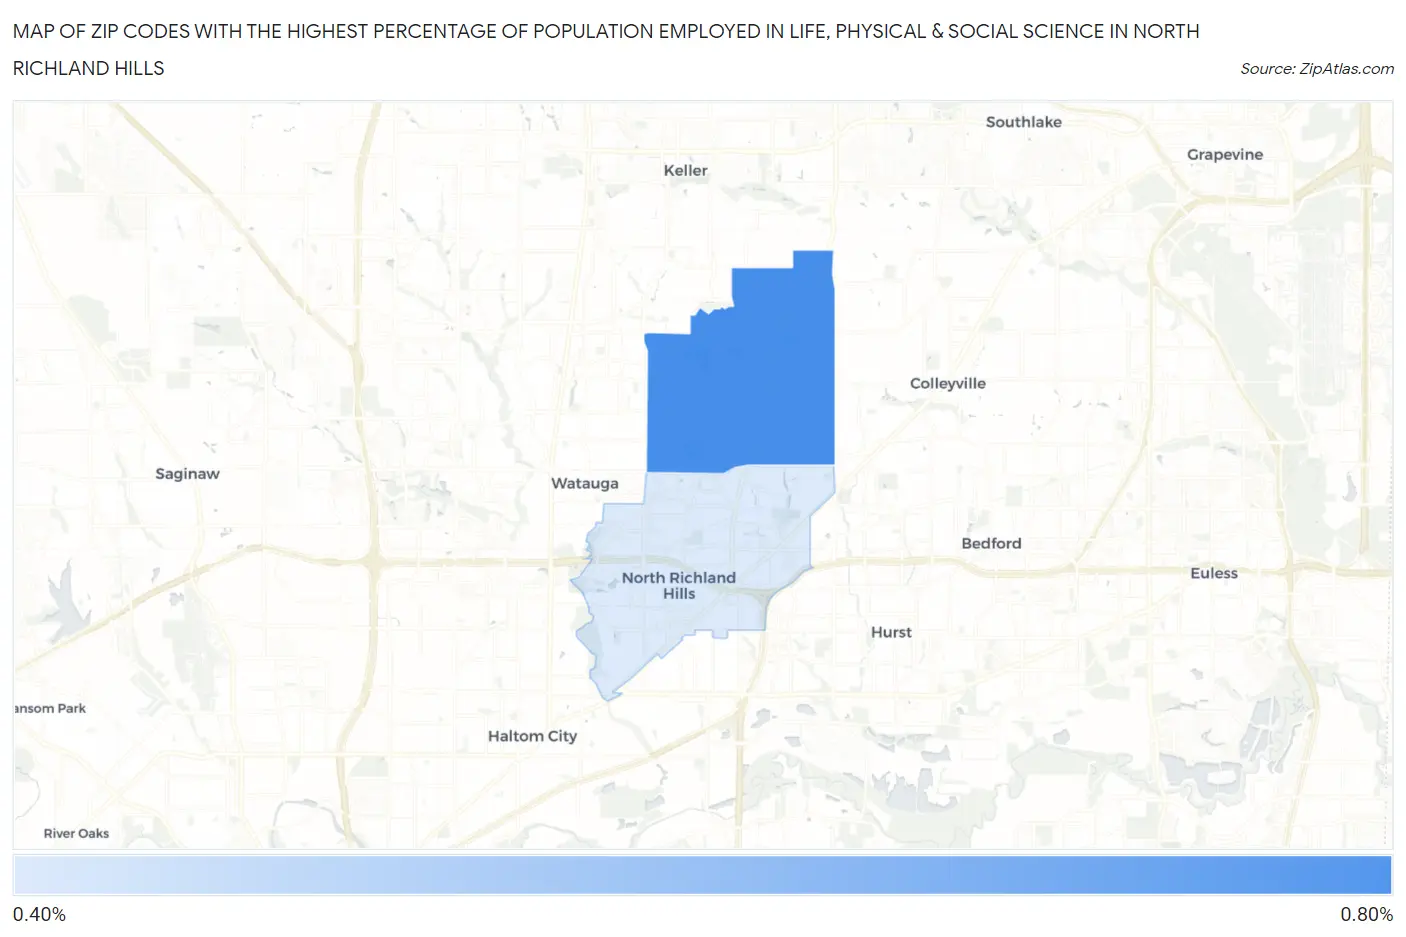
Map of Zip Codes with the Highest Percentage of Population Employed in Life, Physical & Social Science in North Richland Hills
0.42%
0.62%
Zip Codes with the Highest Percentage of Population Employed in Life, Physical & Social Science in North Richland Hills, TX
| Zip Code | % Employed | vs State | vs National | |
| 1. | 76182 | 0.62% | 0.84%(-0.220)#638 | 1.1%(-0.468)#13,012 |
| 2. | 76180 | 0.42% | 0.84%(-0.423)#808 | 1.1%(-0.671)#15,506 |
1
Common Questions
What are the Top Zip Codes with the Highest Percentage of Population Employed in Life, Physical & Social Science in North Richland Hills, TX?
Top Zip Codes with the Highest Percentage of Population Employed in Life, Physical & Social Science in North Richland Hills, TX are:
What zip code has the Highest Percentage of Population Employed in Life, Physical & Social Science in North Richland Hills, TX?
76182 has the Highest Percentage of Population Employed in Life, Physical & Social Science in North Richland Hills, TX with 0.62%.
What is the Percentage of Population Employed in Life, Physical & Social Science in North Richland Hills, TX?
Percentage of Population Employed in Life, Physical & Social Science in North Richland Hills is 0.50%.
What is the Percentage of Population Employed in Life, Physical & Social Science in Texas?
Percentage of Population Employed in Life, Physical & Social Science in Texas is 0.84%.
What is the Percentage of Population Employed in Life, Physical & Social Science in the United States?
Percentage of Population Employed in Life, Physical & Social Science in the United States is 1.1%.