Chula Vista CDP Maverick County, TX Map & Demographics
Chula Vista CDP Maverick County Overview
$19,082
PER CAPITA INCOME
$43,254
AVG FAMILY INCOME
$28,975
AVG HOUSEHOLD INCOME
0.55
INEQUALITY / GINI INDEX
4,317
TOTAL POPULATION
2,379
MALE POPULATION
1,938
FEMALE POPULATION
122.76
MALES / 100 FEMALES
81.46
FEMALES / 100 MALES
37.2
MEDIAN AGE
3.5
AVG FAMILY SIZE
2.7
AVG HOUSEHOLD SIZE
1,231
LABOR FORCE [ PEOPLE ]
41.5%
PERCENT IN LABOR FORCE
1.5%
UNEMPLOYMENT RATE
Income in Chula Vista CDP Maverick County
Income Overview in Chula Vista CDP Maverick County
Per Capita Income in Chula Vista CDP Maverick County is $19,082, while median incomes of families and households are $43,254 and $28,975 respectively.
| Characteristic | Number | Measure |
| Per Capita Income | 4,317 | $19,082 |
| Median Family Income | 1,055 | $43,254 |
| Mean Family Income | 1,055 | $64,910 |
| Median Household Income | 1,622 | $28,975 |
| Mean Household Income | 1,622 | $48,427 |
| Income Deficit | 1,055 | $0 |
| Wage / Income Gap (%) | 4,317 | 0.00% |
| Wage / Income Gap ($) | 4,317 | 100.00¢ per $1 |
| Gini / Inequality Index | 4,317 | 0.55 |
Earnings by Sex in Chula Vista CDP Maverick County
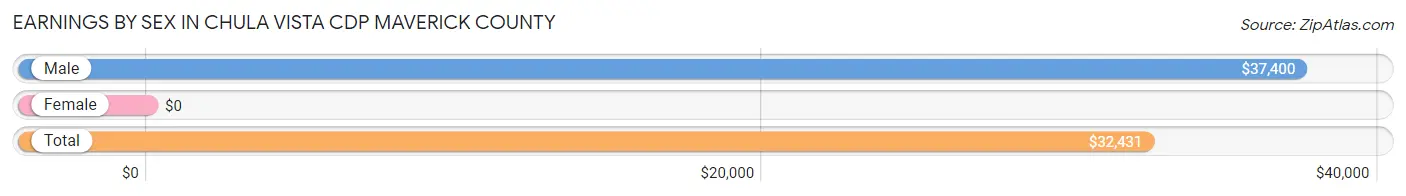
| Sex | Number | Average Earnings |
| Male | 952 (69.4%) | $37,400 |
| Female | 420 (30.6%) | $0 |
| Total | 1,372 (100.0%) | $32,431 |
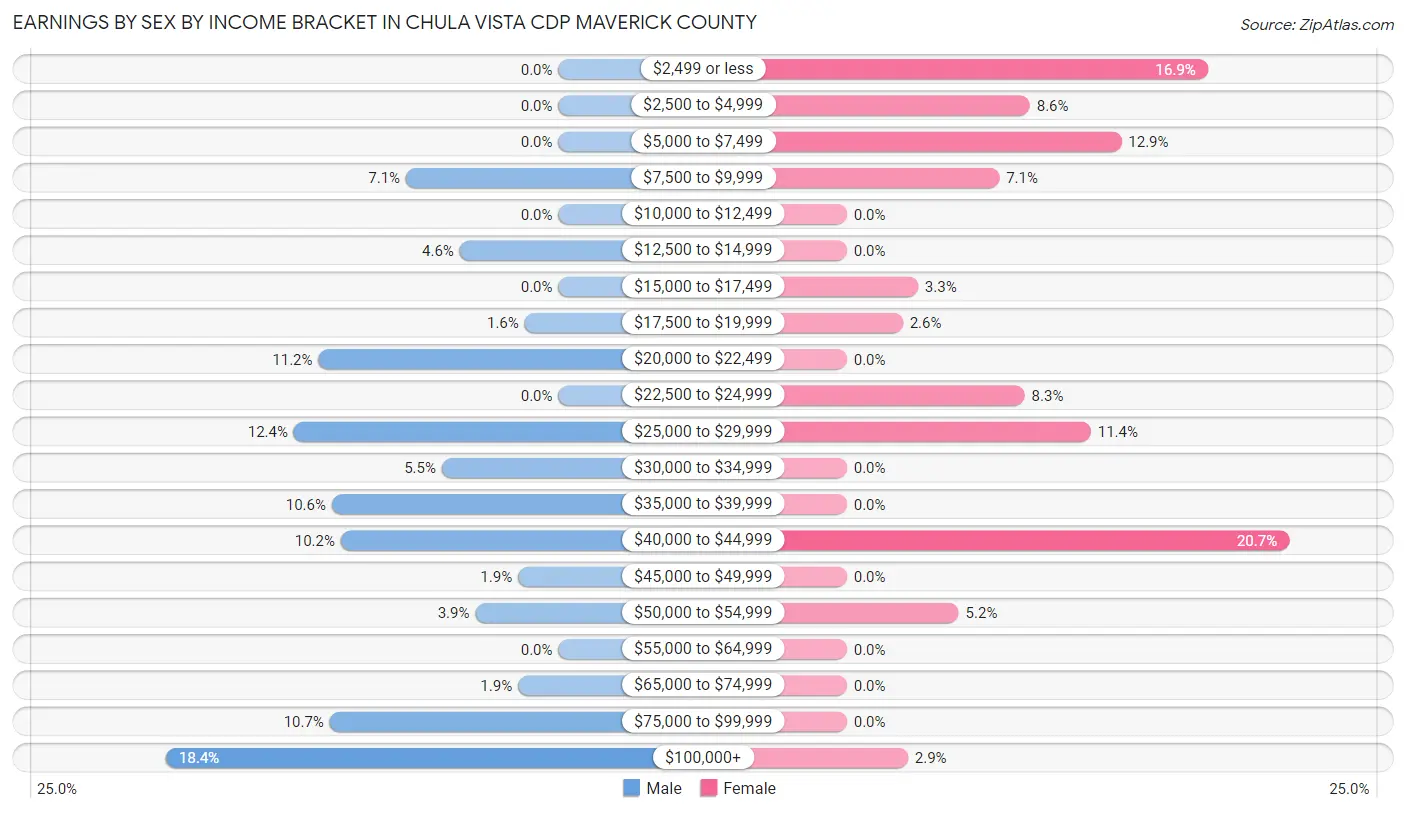
Earnings by Sex by Income Bracket in Chula Vista CDP Maverick County
The most common earnings brackets in Chula Vista CDP Maverick County are $100,000+ for men (175 | 18.4%) and $40,000 to $44,999 for women (87 | 20.7%).
| Income | Male | Female |
| $2,499 or less | 0 (0.0%) | 71 (16.9%) |
| $2,500 to $4,999 | 0 (0.0%) | 36 (8.6%) |
| $5,000 to $7,499 | 0 (0.0%) | 54 (12.9%) |
| $7,500 to $9,999 | 68 (7.1%) | 30 (7.1%) |
| $10,000 to $12,499 | 0 (0.0%) | 0 (0.0%) |
| $12,500 to $14,999 | 44 (4.6%) | 0 (0.0%) |
| $15,000 to $17,499 | 0 (0.0%) | 14 (3.3%) |
| $17,500 to $19,999 | 15 (1.6%) | 11 (2.6%) |
| $20,000 to $22,499 | 107 (11.2%) | 0 (0.0%) |
| $22,500 to $24,999 | 0 (0.0%) | 35 (8.3%) |
| $25,000 to $29,999 | 118 (12.4%) | 48 (11.4%) |
| $30,000 to $34,999 | 52 (5.5%) | 0 (0.0%) |
| $35,000 to $39,999 | 101 (10.6%) | 0 (0.0%) |
| $40,000 to $44,999 | 97 (10.2%) | 87 (20.7%) |
| $45,000 to $49,999 | 18 (1.9%) | 0 (0.0%) |
| $50,000 to $54,999 | 37 (3.9%) | 22 (5.2%) |
| $55,000 to $64,999 | 0 (0.0%) | 0 (0.0%) |
| $65,000 to $74,999 | 18 (1.9%) | 0 (0.0%) |
| $75,000 to $99,999 | 102 (10.7%) | 0 (0.0%) |
| $100,000+ | 175 (18.4%) | 12 (2.9%) |
| Total | 952 (100.0%) | 420 (100.0%) |
Earnings by Sex by Educational Attainment in Chula Vista CDP Maverick County
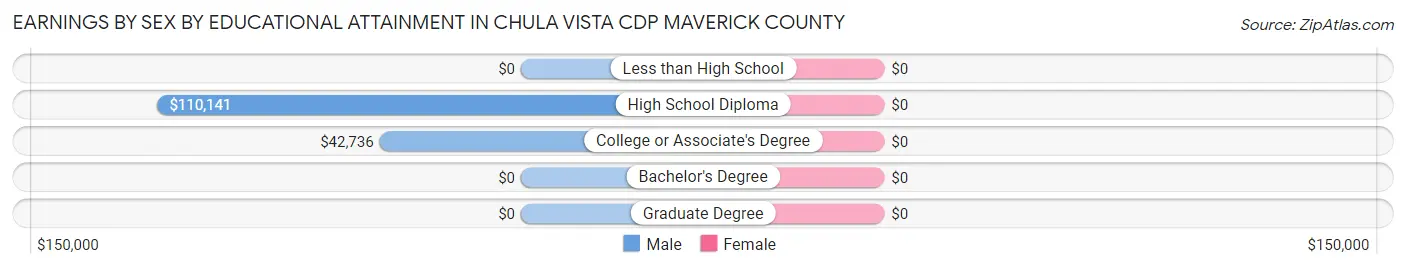
| Educational Attainment | Male Income | Female Income |
| Less than High School | - | - |
| High School Diploma | $110,141 | $0 |
| College or Associate's Degree | $42,736 | $0 |
| Bachelor's Degree | - | - |
| Graduate Degree | - | - |
| Total | $42,590 | $0 |
Family Income in Chula Vista CDP Maverick County
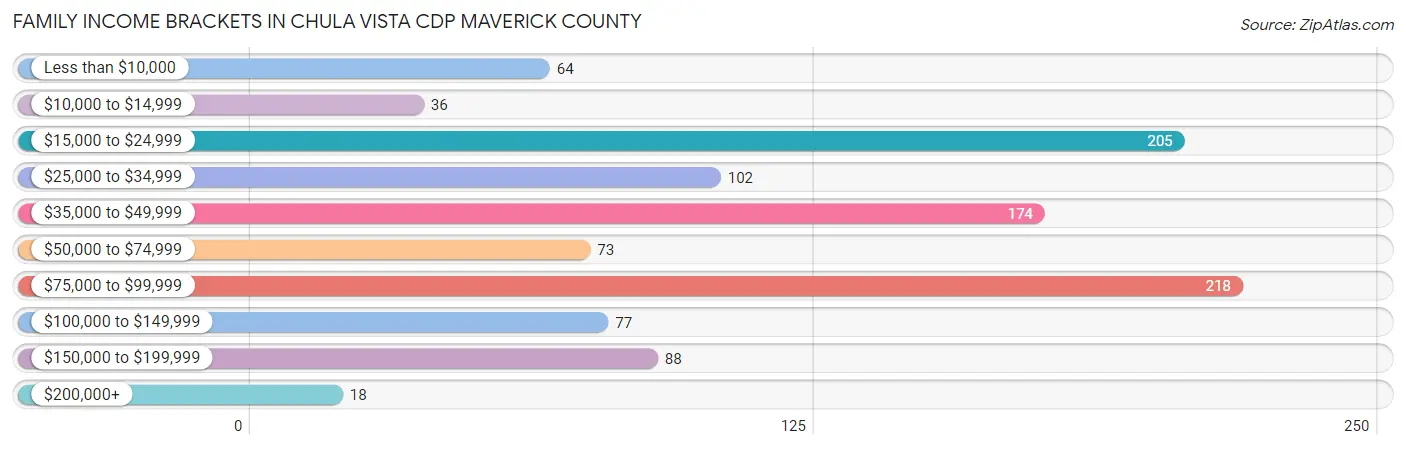
Family Income Brackets in Chula Vista CDP Maverick County
According to the Chula Vista CDP Maverick County family income data, there are 218 families falling into the $75,000 to $99,999 income range, which is the most common income bracket and makes up 20.7% of all families. Conversely, the $200,000+ income bracket is the least frequent group with only 18 families (1.7%) belonging to this category.
| Income Bracket | # Families | % Families |
| Less than $10,000 | 64 | 6.1% |
| $10,000 to $14,999 | 36 | 3.4% |
| $15,000 to $24,999 | 205 | 19.4% |
| $25,000 to $34,999 | 102 | 9.7% |
| $35,000 to $49,999 | 174 | 16.5% |
| $50,000 to $74,999 | 73 | 6.9% |
| $75,000 to $99,999 | 218 | 20.7% |
| $100,000 to $149,999 | 77 | 7.3% |
| $150,000 to $199,999 | 88 | 8.3% |
| $200,000+ | 18 | 1.7% |
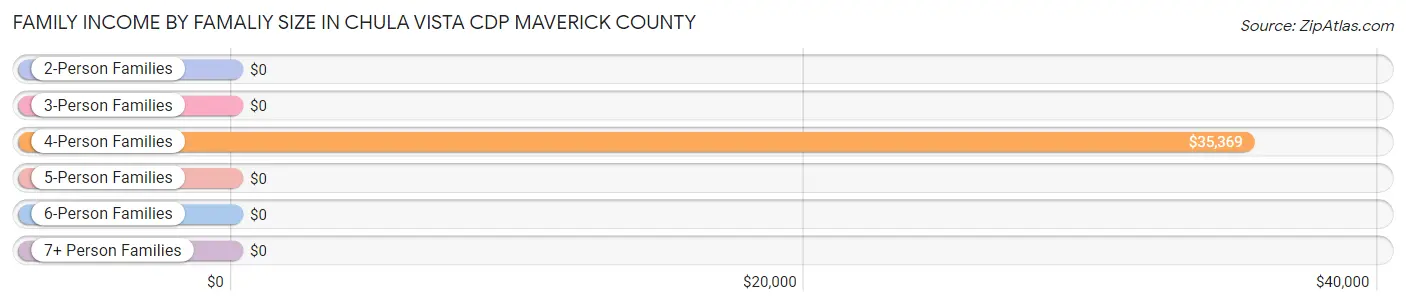
Family Income by Famaliy Size in Chula Vista CDP Maverick County
4-person families (374 | 35.4%) account for the highest median family income in Chula Vista CDP Maverick County with $35,369 per family, while 4-person families (374 | 35.4%) have the highest median income of $8,842 per family member.
| Income Bracket | # Families | Median Income |
| 2-Person Families | 421 (39.9%) | $0 |
| 3-Person Families | 52 (4.9%) | $0 |
| 4-Person Families | 374 (35.4%) | $35,369 |
| 5-Person Families | 64 (6.1%) | $0 |
| 6-Person Families | 89 (8.4%) | $0 |
| 7+ Person Families | 55 (5.2%) | $0 |
| Total | 1,055 (100.0%) | $43,254 |
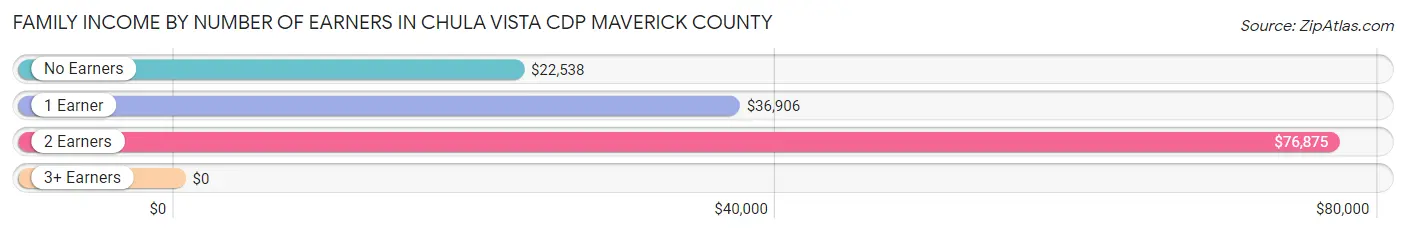
Family Income by Number of Earners in Chula Vista CDP Maverick County
| Number of Earners | # Families | Median Income |
| No Earners | 241 (22.8%) | $22,538 |
| 1 Earner | 479 (45.4%) | $36,906 |
| 2 Earners | 323 (30.6%) | $76,875 |
| 3+ Earners | 12 (1.1%) | $0 |
| Total | 1,055 (100.0%) | $43,254 |
Household Income in Chula Vista CDP Maverick County
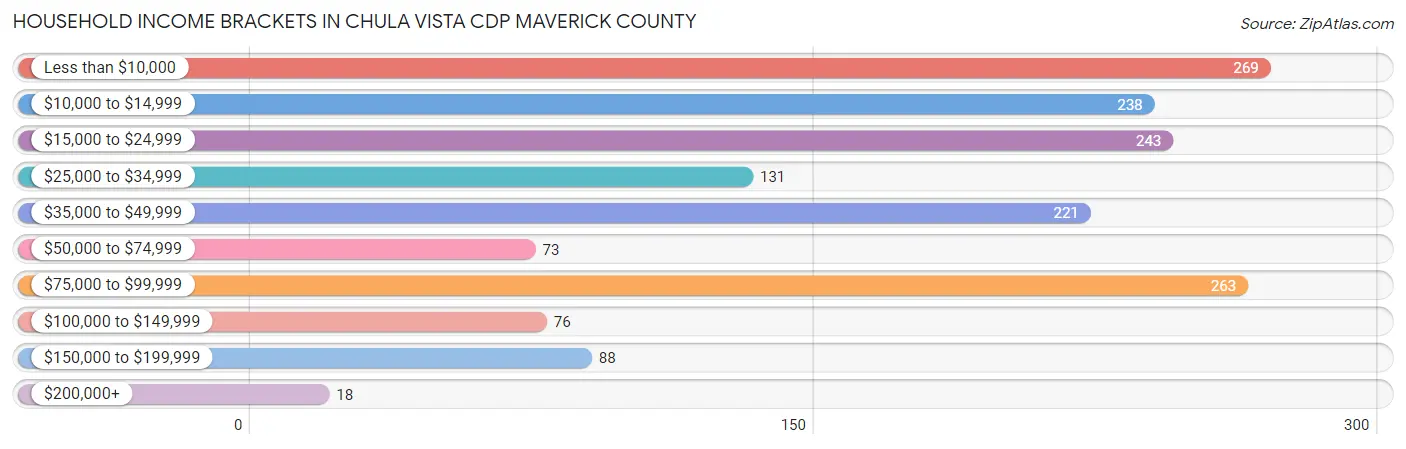
Household Income Brackets in Chula Vista CDP Maverick County
With 269 households falling in the category, the less than $10,000 income range is the most frequent in Chula Vista CDP Maverick County, accounting for 16.6% of all households. In contrast, only 18 households (1.1%) fall into the $200,000+ income bracket, making it the least populous group.
| Income Bracket | # Households | % Households |
| Less than $10,000 | 269 | 16.6% |
| $10,000 to $14,999 | 238 | 14.7% |
| $15,000 to $24,999 | 243 | 15.0% |
| $25,000 to $34,999 | 131 | 8.1% |
| $35,000 to $49,999 | 221 | 13.6% |
| $50,000 to $74,999 | 73 | 4.5% |
| $75,000 to $99,999 | 263 | 16.2% |
| $100,000 to $149,999 | 76 | 4.7% |
| $150,000 to $199,999 | 88 | 5.4% |
| $200,000+ | 18 | 1.1% |
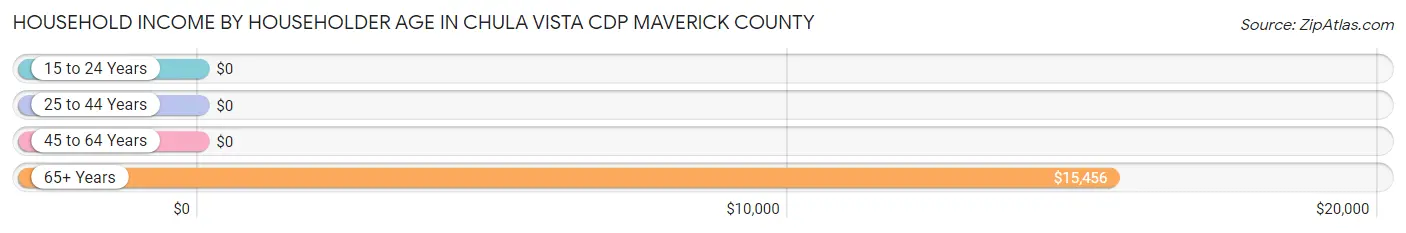
Household Income by Householder Age in Chula Vista CDP Maverick County
The median household income in Chula Vista CDP Maverick County is $28,975, with the highest median household income of $15,456 found in the 65+ years age bracket for the primary householder. A total of 543 households (33.5%) fall into this category.
| Income Bracket | # Households | Median Income |
| 15 to 24 Years | 0 (0.0%) | $0 |
| 25 to 44 Years | 637 (39.3%) | $0 |
| 45 to 64 Years | 442 (27.3%) | $0 |
| 65+ Years | 543 (33.5%) | $15,456 |
| Total | 1,622 (100.0%) | $28,975 |
Poverty in Chula Vista CDP Maverick County
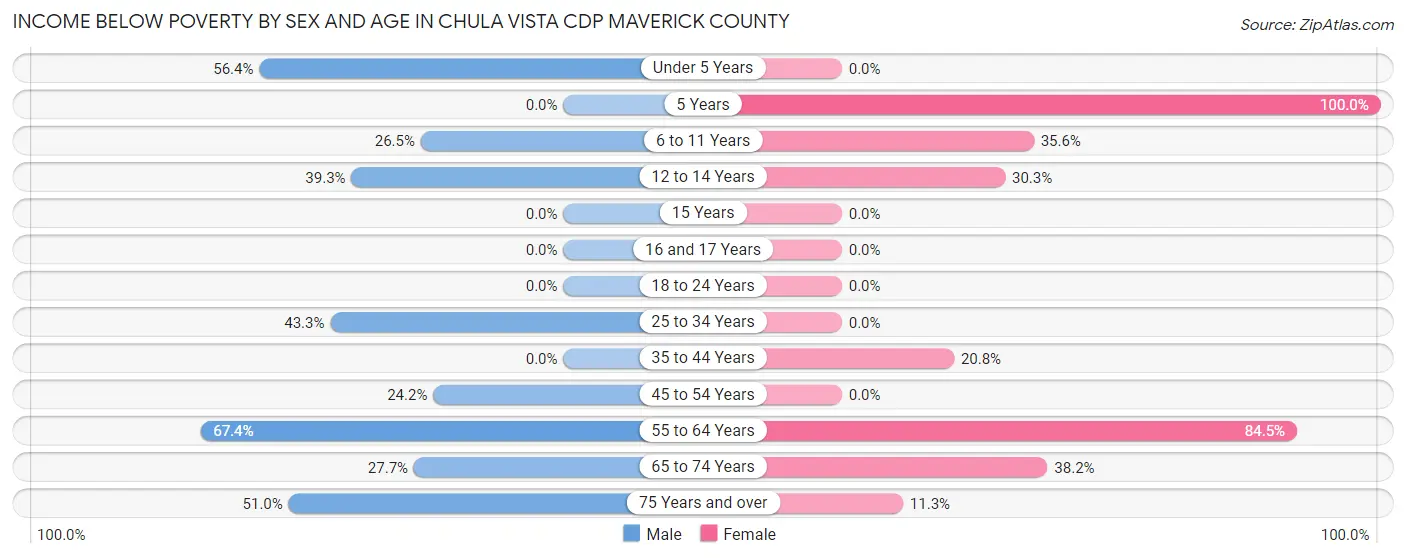
Income Below Poverty by Sex and Age in Chula Vista CDP Maverick County
With 28.7% poverty level for males and 37.8% for females among the residents of Chula Vista CDP Maverick County, 55 to 64 year old males and 5 year old females are the most vulnerable to poverty, with 126 males (67.4%) and 68 females (100.0%) in their respective age groups living below the poverty level.
| Age Bracket | Male | Female |
| Under 5 Years | 92 (56.4%) | 0 (0.0%) |
| 5 Years | 0 (0.0%) | 68 (100.0%) |
| 6 to 11 Years | 95 (26.5%) | 156 (35.6%) |
| 12 to 14 Years | 72 (39.3%) | 10 (30.3%) |
| 15 Years | 0 (0.0%) | 0 (0.0%) |
| 16 and 17 Years | 0 (0.0%) | 0 (0.0%) |
| 18 to 24 Years | 0 (0.0%) | 0 (0.0%) |
| 25 to 34 Years | 122 (43.3%) | 0 (0.0%) |
| 35 to 44 Years | 0 (0.0%) | 71 (20.8%) |
| 45 to 54 Years | 50 (24.1%) | 0 (0.0%) |
| 55 to 64 Years | 126 (67.4%) | 272 (84.5%) |
| 65 to 74 Years | 76 (27.7%) | 145 (38.2%) |
| 75 Years and over | 51 (51.0%) | 11 (11.3%) |
| Total | 684 (28.7%) | 733 (37.8%) |
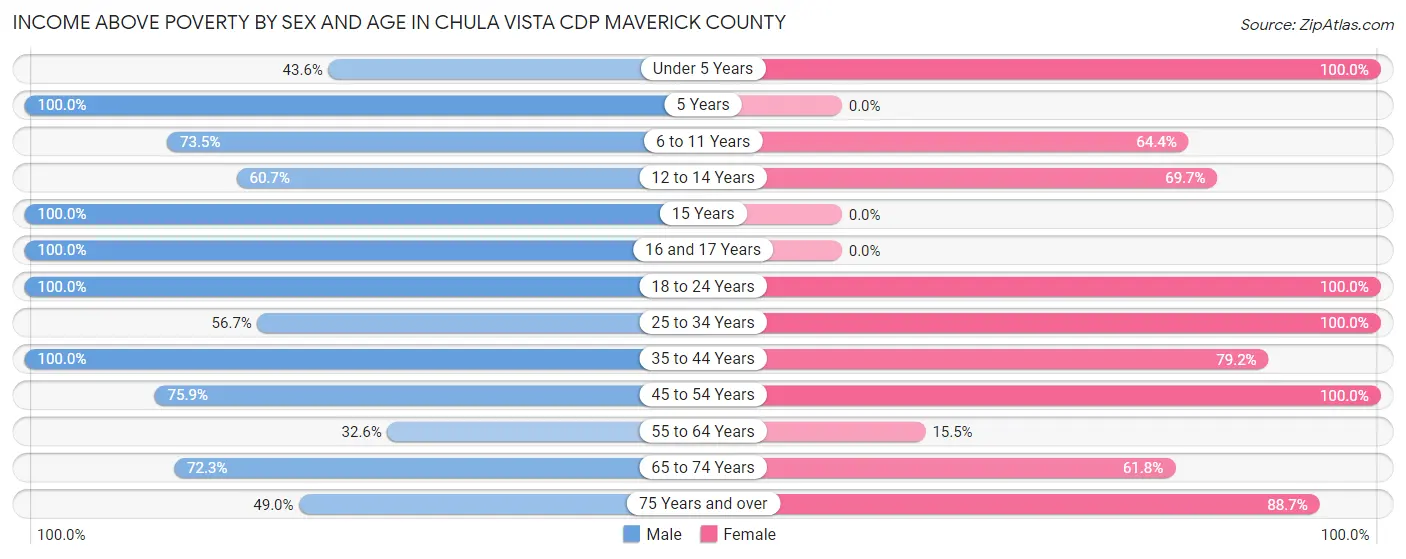
Income Above Poverty by Sex and Age in Chula Vista CDP Maverick County
According to the poverty statistics in Chula Vista CDP Maverick County, males aged 5 years and females aged under 5 years are the age groups that are most secure financially, with 100.0% of males and 100.0% of females in these age groups living above the poverty line.
| Age Bracket | Male | Female |
| Under 5 Years | 71 (43.6%) | 28 (100.0%) |
| 5 Years | 68 (100.0%) | 0 (0.0%) |
| 6 to 11 Years | 264 (73.5%) | 282 (64.4%) |
| 12 to 14 Years | 111 (60.7%) | 23 (69.7%) |
| 15 Years | 11 (100.0%) | 0 (0.0%) |
| 16 and 17 Years | 12 (100.0%) | 0 (0.0%) |
| 18 to 24 Years | 137 (100.0%) | 14 (100.0%) |
| 25 to 34 Years | 160 (56.7%) | 149 (100.0%) |
| 35 to 44 Years | 396 (100.0%) | 270 (79.2%) |
| 45 to 54 Years | 157 (75.8%) | 68 (100.0%) |
| 55 to 64 Years | 61 (32.6%) | 50 (15.5%) |
| 65 to 74 Years | 198 (72.3%) | 235 (61.8%) |
| 75 Years and over | 49 (49.0%) | 86 (88.7%) |
| Total | 1,695 (71.3%) | 1,205 (62.2%) |
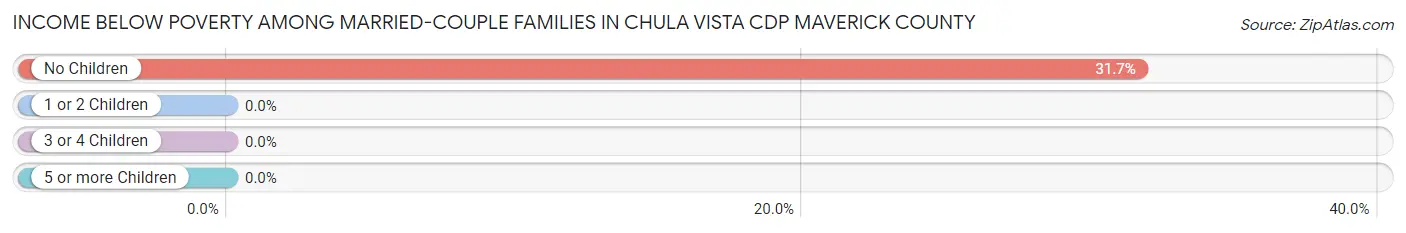
Income Below Poverty Among Married-Couple Families in Chula Vista CDP Maverick County
The poverty statistics for married-couple families in Chula Vista CDP Maverick County show that 16.1% or 127 of the total 789 families live below the poverty line. Families with no children have the highest poverty rate of 31.7%, comprising of 127 families. On the other hand, families with 1 or 2 children have the lowest poverty rate of 0.0%, which includes 0 families.
| Children | Above Poverty | Below Poverty |
| No Children | 274 (68.3%) | 127 (31.7%) |
| 1 or 2 Children | 319 (100.0%) | 0 (0.0%) |
| 3 or 4 Children | 56 (100.0%) | 0 (0.0%) |
| 5 or more Children | 13 (100.0%) | 0 (0.0%) |
| Total | 662 (83.9%) | 127 (16.1%) |
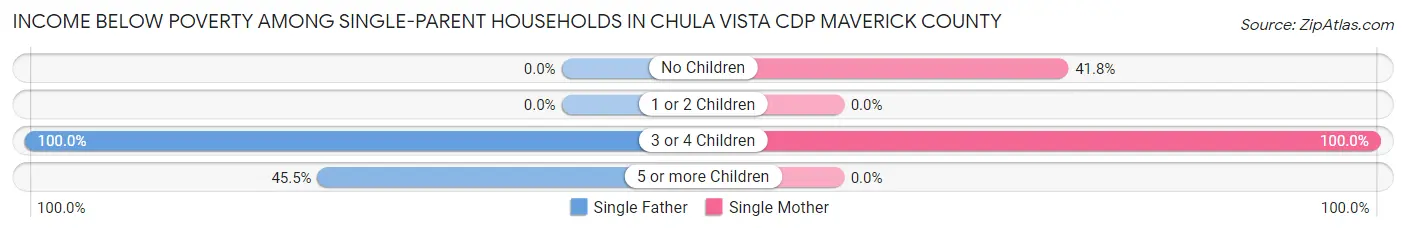
Income Below Poverty Among Single-Parent Households in Chula Vista CDP Maverick County
According to the poverty data in Chula Vista CDP Maverick County, 87.1% or 122 single-father households and 74.6% or 94 single-mother households are living below the poverty line. Among single-father households, those with 3 or 4 children have the highest poverty rate, with 107 households (100.0%) experiencing poverty. Likewise, among single-mother households, those with 3 or 4 children have the highest poverty rate, with 71 households (100.0%) falling below the poverty line.
| Children | Single Father | Single Mother |
| No Children | 0 (0.0%) | 23 (41.8%) |
| 1 or 2 Children | 0 (0.0%) | 0 (0.0%) |
| 3 or 4 Children | 107 (100.0%) | 71 (100.0%) |
| 5 or more Children | 15 (45.5%) | 0 (0.0%) |
| Total | 122 (87.1%) | 94 (74.6%) |
Income Below Poverty Among Married-Couple vs Single-Parent Households in Chula Vista CDP Maverick County
The poverty data for Chula Vista CDP Maverick County shows that 127 of the married-couple family households (16.1%) and 216 of the single-parent households (81.2%) are living below the poverty level. Within the married-couple family households, those with no children have the highest poverty rate, with 127 households (31.7%) falling below the poverty line. Among the single-parent households, those with 3 or 4 children have the highest poverty rate, with 178 household (100.0%) living below poverty.
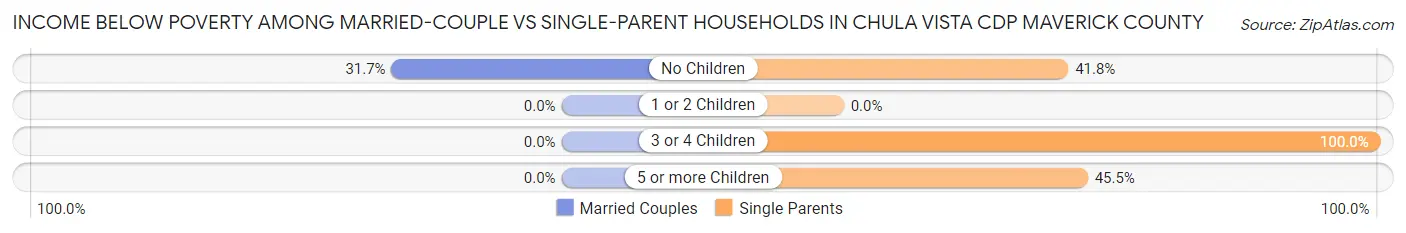
| Children | Married-Couple Families | Single-Parent Households |
| No Children | 127 (31.7%) | 23 (41.8%) |
| 1 or 2 Children | 0 (0.0%) | 0 (0.0%) |
| 3 or 4 Children | 0 (0.0%) | 178 (100.0%) |
| 5 or more Children | 0 (0.0%) | 15 (45.5%) |
| Total | 127 (16.1%) | 216 (81.2%) |
Race in Chula Vista CDP Maverick County
The most populous races in Chula Vista CDP Maverick County are Hispanic or Latino (4,317 | 100.0%), Two or more Races (1,576 | 36.5%), and White / Caucasian (1,542 | 35.7%).
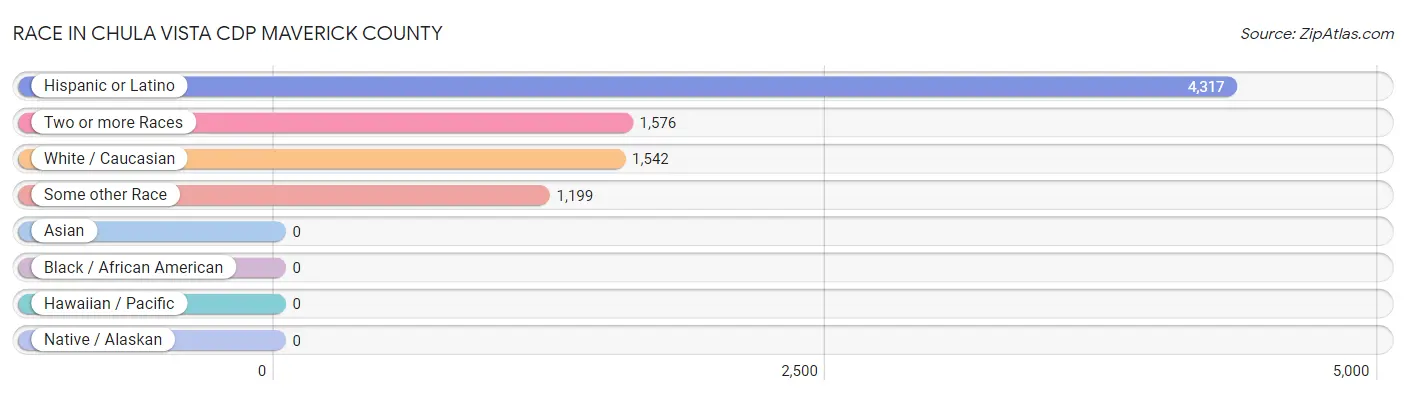
| Race | # Population | % Population |
| Asian | 0 | 0.0% |
| Black / African American | 0 | 0.0% |
| Hawaiian / Pacific | 0 | 0.0% |
| Hispanic or Latino | 4,317 | 100.0% |
| Native / Alaskan | 0 | 0.0% |
| White / Caucasian | 1,542 | 35.7% |
| Two or more Races | 1,576 | 36.5% |
| Some other Race | 1,199 | 27.8% |
| Total | 4,317 | 100.0% |
Ancestry in Chula Vista CDP Maverick County
The most populous ancestries reported in Chula Vista CDP Maverick County are Mexican (4,183 | 96.9%), American (163 | 3.8%), and Puerto Rican (45 | 1.0%), together accounting for 101.7% of all Chula Vista CDP Maverick County residents.
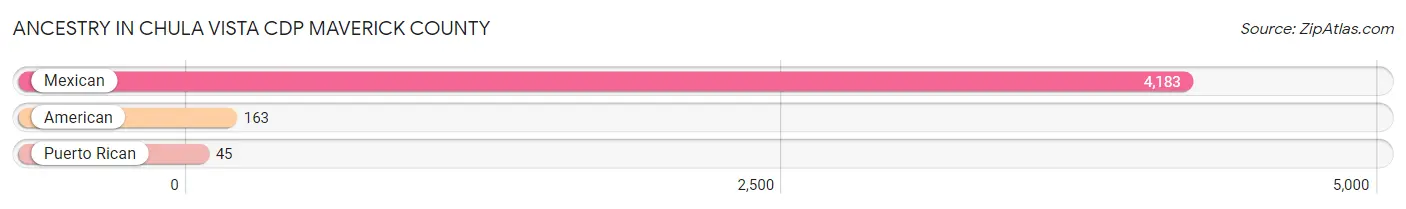
| Ancestry | # Population | % Population |
| American | 163 | 3.8% |
| Mexican | 4,183 | 96.9% |
| Puerto Rican | 45 | 1.0% | View All 3 Rows |
Immigrants in Chula Vista CDP Maverick County
The most numerous immigrant groups reported in Chula Vista CDP Maverick County came from Central America (1,642 | 38.0%), Latin America (1,642 | 38.0%), and Mexico (1,642 | 38.0%), together accounting for 114.1% of all Chula Vista CDP Maverick County residents.
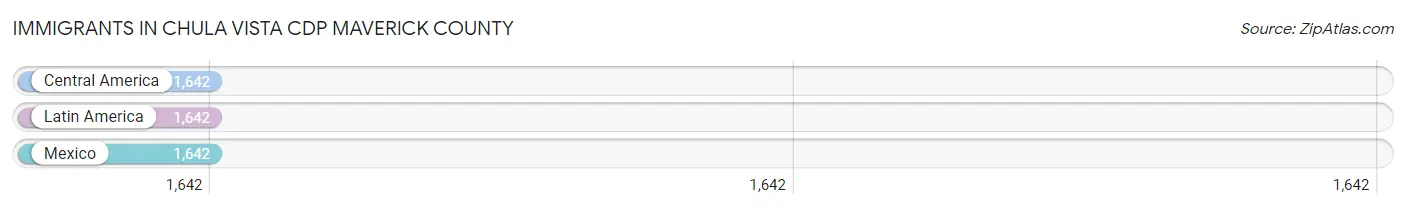
| Immigration Origin | # Population | % Population |
| Central America | 1,642 | 38.0% |
| Latin America | 1,642 | 38.0% |
| Mexico | 1,642 | 38.0% | View All 3 Rows |
Sex and Age in Chula Vista CDP Maverick County
Sex and Age in Chula Vista CDP Maverick County
The most populous age groups in Chula Vista CDP Maverick County are 5 to 9 Years (323 | 13.6%) for men and 5 to 9 Years (411 | 21.2%) for women.
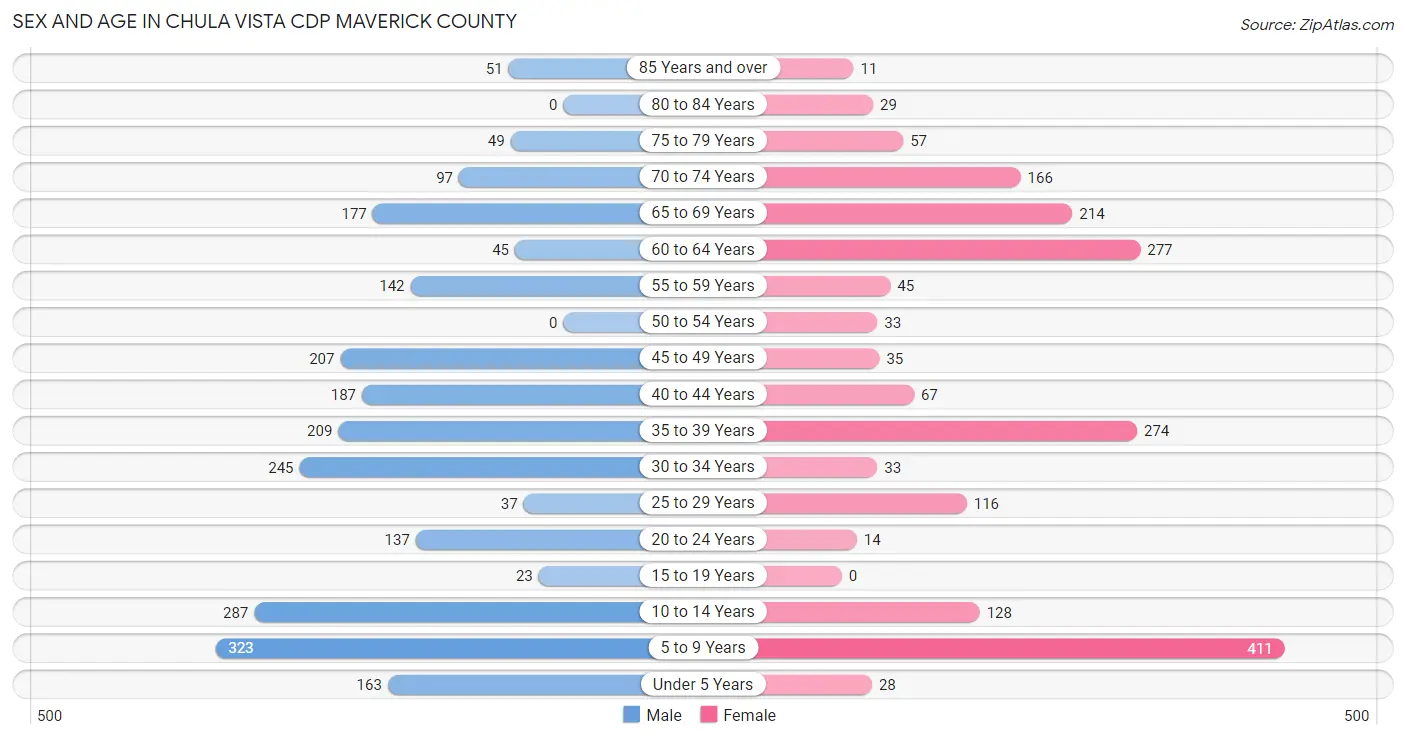
| Age Bracket | Male | Female |
| Under 5 Years | 163 (6.9%) | 28 (1.4%) |
| 5 to 9 Years | 323 (13.6%) | 411 (21.2%) |
| 10 to 14 Years | 287 (12.1%) | 128 (6.6%) |
| 15 to 19 Years | 23 (1.0%) | 0 (0.0%) |
| 20 to 24 Years | 137 (5.8%) | 14 (0.7%) |
| 25 to 29 Years | 37 (1.6%) | 116 (6.0%) |
| 30 to 34 Years | 245 (10.3%) | 33 (1.7%) |
| 35 to 39 Years | 209 (8.8%) | 274 (14.1%) |
| 40 to 44 Years | 187 (7.9%) | 67 (3.5%) |
| 45 to 49 Years | 207 (8.7%) | 35 (1.8%) |
| 50 to 54 Years | 0 (0.0%) | 33 (1.7%) |
| 55 to 59 Years | 142 (6.0%) | 45 (2.3%) |
| 60 to 64 Years | 45 (1.9%) | 277 (14.3%) |
| 65 to 69 Years | 177 (7.4%) | 214 (11.0%) |
| 70 to 74 Years | 97 (4.1%) | 166 (8.6%) |
| 75 to 79 Years | 49 (2.1%) | 57 (2.9%) |
| 80 to 84 Years | 0 (0.0%) | 29 (1.5%) |
| 85 Years and over | 51 (2.1%) | 11 (0.6%) |
| Total | 2,379 (100.0%) | 1,938 (100.0%) |
Families and Households in Chula Vista CDP Maverick County
Median Family Size in Chula Vista CDP Maverick County
The median family size in Chula Vista CDP Maverick County is 3.52 persons per family, with single female/mother families (126 | 11.9%) accounting for the largest median family size of 3.62 persons per family. On the other hand, married-couple families (789 | 74.8%) represent the smallest median family size with 3.50 persons per family.
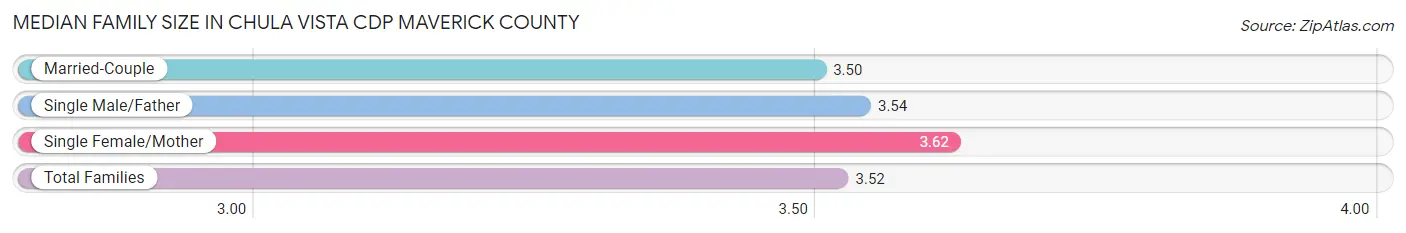
| Family Type | # Families | Family Size |
| Married-Couple | 789 (74.8%) | 3.50 |
| Single Male/Father | 140 (13.3%) | 3.54 |
| Single Female/Mother | 126 (11.9%) | 3.62 |
| Total Families | 1,055 (100.0%) | 3.52 |
Median Household Size in Chula Vista CDP Maverick County
The median household size in Chula Vista CDP Maverick County is 2.66 persons per household, with single female/mother households (126 | 7.8%) accounting for the largest median household size of 3.62 persons per household. non-family households (567 | 35.0%) represent the smallest median household size with 1.05 persons per household.
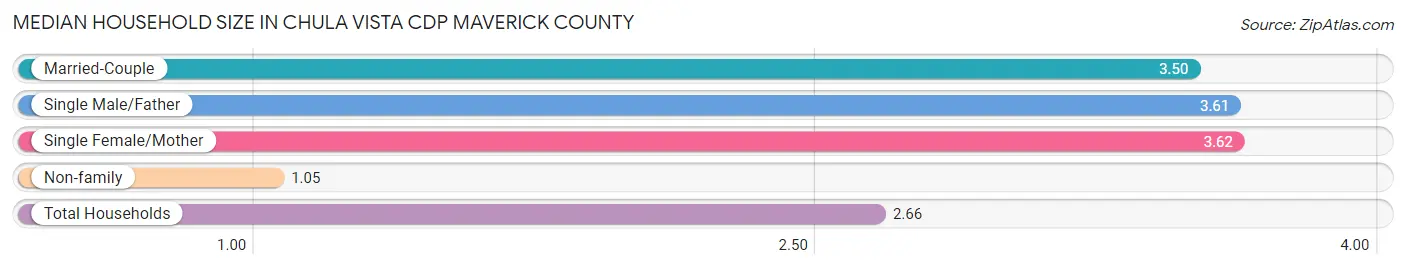
| Household Type | # Households | Household Size |
| Married-Couple | 789 (48.6%) | 3.50 |
| Single Male/Father | 140 (8.6%) | 3.61 |
| Single Female/Mother | 126 (7.8%) | 3.62 |
| Non-family | 567 (35.0%) | 1.05 |
| Total Households | 1,622 (100.0%) | 2.66 |
Household Size by Marriage Status in Chula Vista CDP Maverick County
Out of a total of 1,622 households in Chula Vista CDP Maverick County, 1,055 (65.0%) are family households, while 567 (35.0%) are nonfamily households. The most numerous type of family households are 2-person households, comprising 421, and the most common type of nonfamily households are 1-person households, comprising 522.
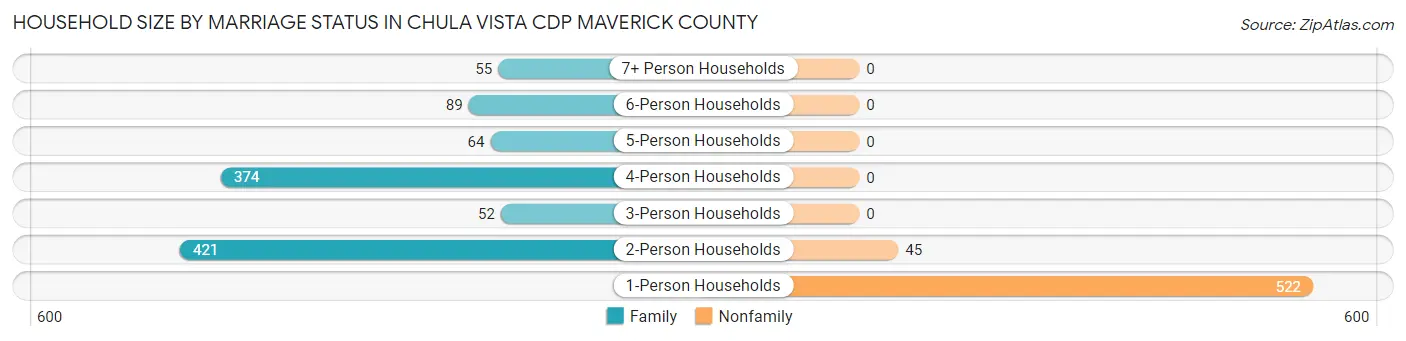
| Household Size | Family Households | Nonfamily Households |
| 1-Person Households | - | 522 (32.2%) |
| 2-Person Households | 421 (26.0%) | 45 (2.8%) |
| 3-Person Households | 52 (3.2%) | 0 (0.0%) |
| 4-Person Households | 374 (23.1%) | 0 (0.0%) |
| 5-Person Households | 64 (4.0%) | 0 (0.0%) |
| 6-Person Households | 89 (5.5%) | 0 (0.0%) |
| 7+ Person Households | 55 (3.4%) | 0 (0.0%) |
| Total | 1,055 (65.0%) | 567 (35.0%) |
Female Fertility in Chula Vista CDP Maverick County
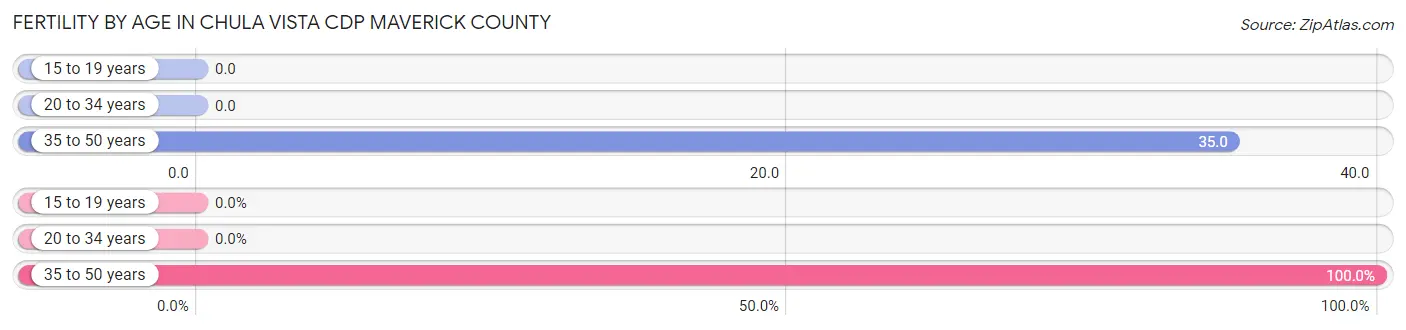
Fertility by Age in Chula Vista CDP Maverick County
Average fertility rate in Chula Vista CDP Maverick County is 24.0 births per 1,000 women. Women in the age bracket of 35 to 50 years have the highest fertility rate with 35.0 births per 1,000 women. Women in the age bracket of 35 to 50 years acount for 100.0% of all women with births.
| Age Bracket | Women with Births | Births / 1,000 Women |
| 15 to 19 years | 0 (0.0%) | 0.0 |
| 20 to 34 years | 0 (0.0%) | 0.0 |
| 35 to 50 years | 13 (100.0%) | 35.0 |
| Total | 13 (100.0%) | 24.0 |
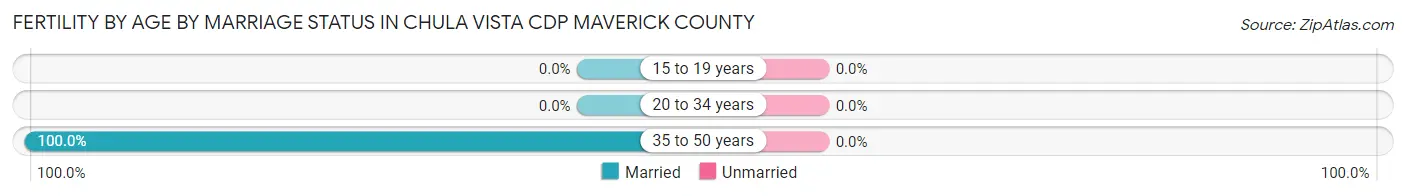
Fertility by Age by Marriage Status in Chula Vista CDP Maverick County
| Age Bracket | Married | Unmarried |
| 15 to 19 years | 0 (0.0%) | 0 (0.0%) |
| 20 to 34 years | 0 (0.0%) | 0 (0.0%) |
| 35 to 50 years | 13 (100.0%) | 0 (0.0%) |
| Total | 13 (100.0%) | 0 (0.0%) |
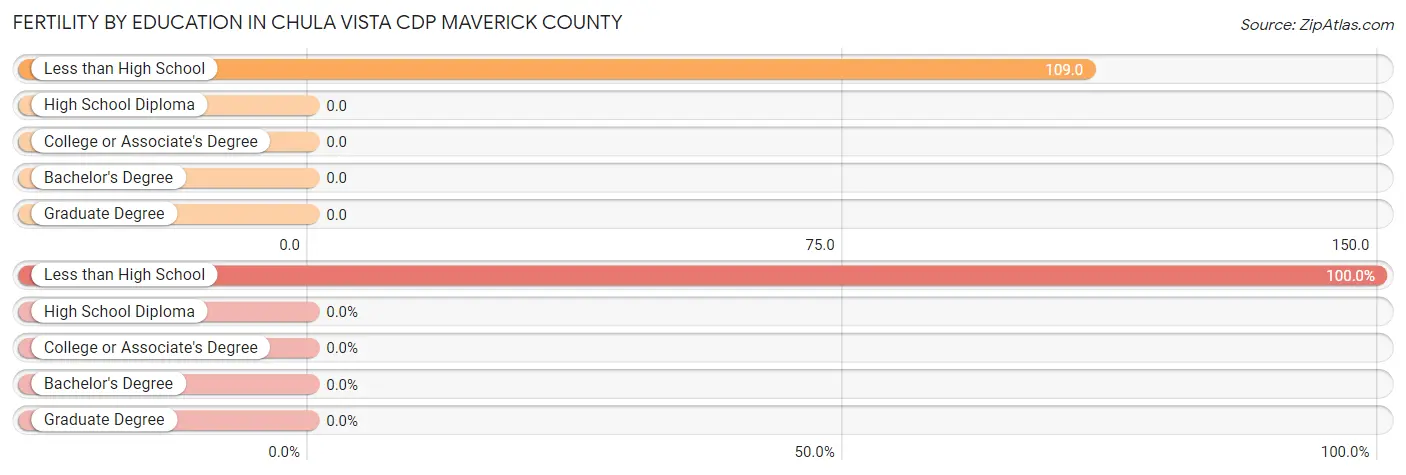
Fertility by Education in Chula Vista CDP Maverick County
| Educational Attainment | Women with Births | Births / 1,000 Women |
| Less than High School | 13 (100.0%) | 109.0 |
| High School Diploma | 0 (0.0%) | 0.0 |
| College or Associate's Degree | 0 (0.0%) | 0.0 |
| Bachelor's Degree | 0 (0.0%) | 0.0 |
| Graduate Degree | 0 (0.0%) | 0.0 |
| Total | 13 (100.0%) | 24.0 |
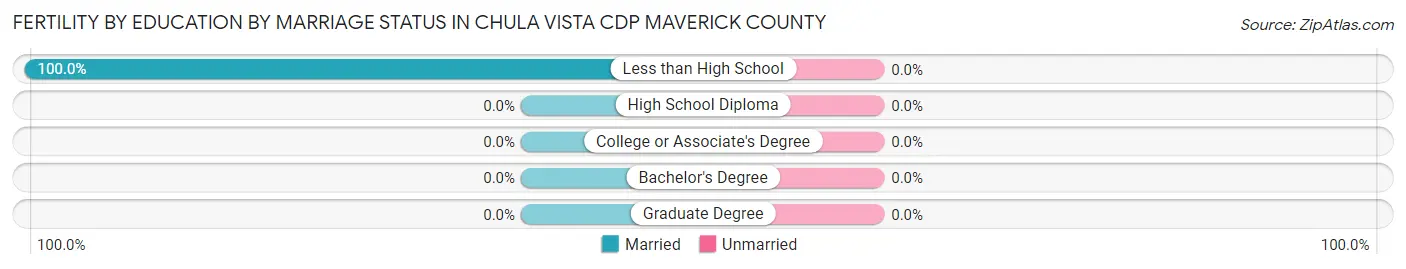
Fertility by Education by Marriage Status in Chula Vista CDP Maverick County
| Educational Attainment | Married | Unmarried |
| Less than High School | 13 (100.0%) | 0 (0.0%) |
| High School Diploma | 0 (0.0%) | 0 (0.0%) |
| College or Associate's Degree | 0 (0.0%) | 0 (0.0%) |
| Bachelor's Degree | 0 (0.0%) | 0 (0.0%) |
| Graduate Degree | 0 (0.0%) | 0 (0.0%) |
| Total | 13 (100.0%) | 0 (0.0%) |
Employment Characteristics in Chula Vista CDP Maverick County
Employment by Class of Employer in Chula Vista CDP Maverick County
Among the 1,195 employed individuals in Chula Vista CDP Maverick County, private company employees (715 | 59.8%), self-employed (not incorporated) (173 | 14.5%), and local government employees (89 | 7.4%) make up the most common classes of employment.
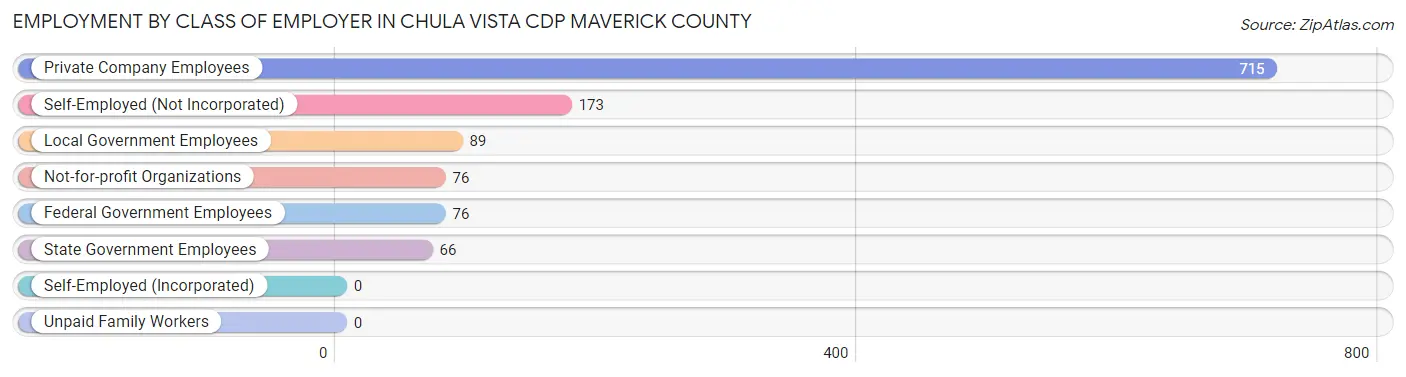
| Employer Class | # Employees | % Employees |
| Private Company Employees | 715 | 59.8% |
| Self-Employed (Incorporated) | 0 | 0.0% |
| Self-Employed (Not Incorporated) | 173 | 14.5% |
| Not-for-profit Organizations | 76 | 6.4% |
| Local Government Employees | 89 | 7.4% |
| State Government Employees | 66 | 5.5% |
| Federal Government Employees | 76 | 6.4% |
| Unpaid Family Workers | 0 | 0.0% |
| Total | 1,195 | 100.0% |
Employment Status by Age in Chula Vista CDP Maverick County
According to the labor force statistics for Chula Vista CDP Maverick County, out of the total population over 16 years of age (2,966), 41.5% or 1,231 individuals are in the labor force, with 1.5% or 18 of them unemployed. The age group with the highest labor force participation rate is 30 to 34 years, with 92.1% or 256 individuals in the labor force. Within the labor force, the 35 to 44 years age range has the highest percentage of unemployed individuals, with 4.2% or 18 of them being unemployed.
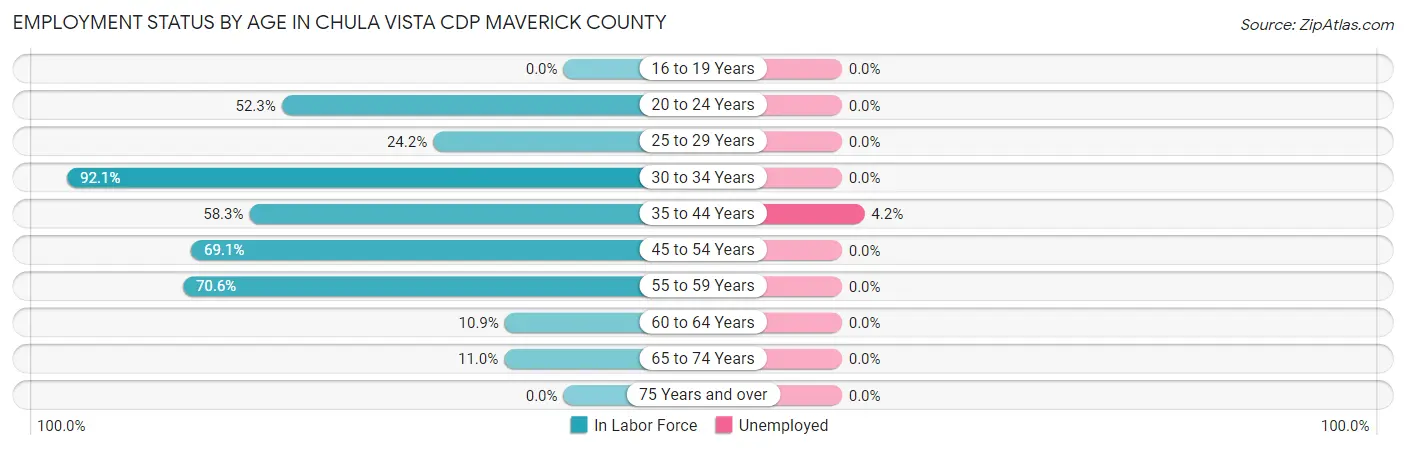
| Age Bracket | In Labor Force | Unemployed |
| 16 to 19 Years | 0 (0.0%) | 0 (0.0%) |
| 20 to 24 Years | 79 (52.3%) | 0 (0.0%) |
| 25 to 29 Years | 37 (24.2%) | 0 (0.0%) |
| 30 to 34 Years | 256 (92.1%) | 0 (0.0%) |
| 35 to 44 Years | 430 (58.3%) | 18 (4.2%) |
| 45 to 54 Years | 190 (69.1%) | 0 (0.0%) |
| 55 to 59 Years | 132 (70.6%) | 0 (0.0%) |
| 60 to 64 Years | 35 (10.9%) | 0 (0.0%) |
| 65 to 74 Years | 72 (11.0%) | 0 (0.0%) |
| 75 Years and over | 0 (0.0%) | 0 (0.0%) |
| Total | 1,231 (41.5%) | 18 (1.5%) |
Employment Status by Educational Attainment in Chula Vista CDP Maverick County
According to labor force statistics for Chula Vista CDP Maverick County, 55.3% of individuals (1,079) out of the total population between 25 and 64 years of age (1,952) are in the labor force, with 1.7% or 18 of them being unemployed. The group with the highest labor force participation rate are those with the educational attainment of college / associate degree, with 71.0% or 389 individuals in the labor force. Within the labor force, individuals with less than high school education have the highest percentage of unemployment, with 3.8% or 18 of them being unemployed.
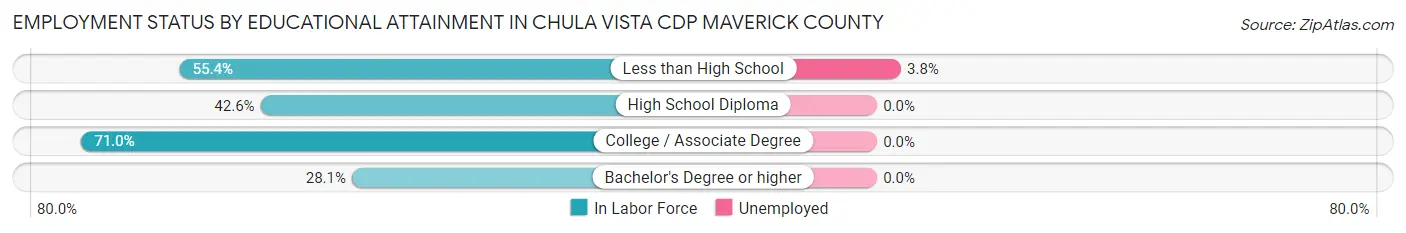
| Educational Attainment | In Labor Force | Unemployed |
| Less than High School | 478 (55.4%) | 33 (3.8%) |
| High School Diploma | 179 (42.6%) | 0 (0.0%) |
| College / Associate Degree | 389 (71.0%) | 0 (0.0%) |
| Bachelor's Degree or higher | 34 (28.1%) | 0 (0.0%) |
| Total | 1,079 (55.3%) | 33 (1.7%) |
Employment Occupations by Sex in Chula Vista CDP Maverick County
Management, Business, Science and Arts Occupations
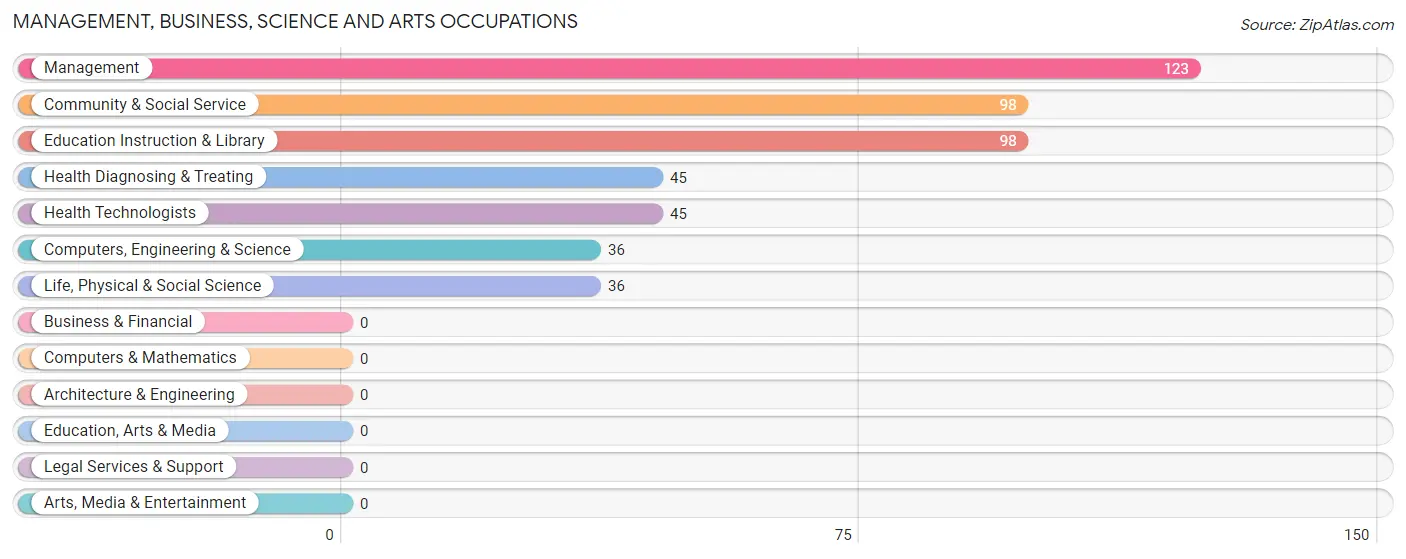
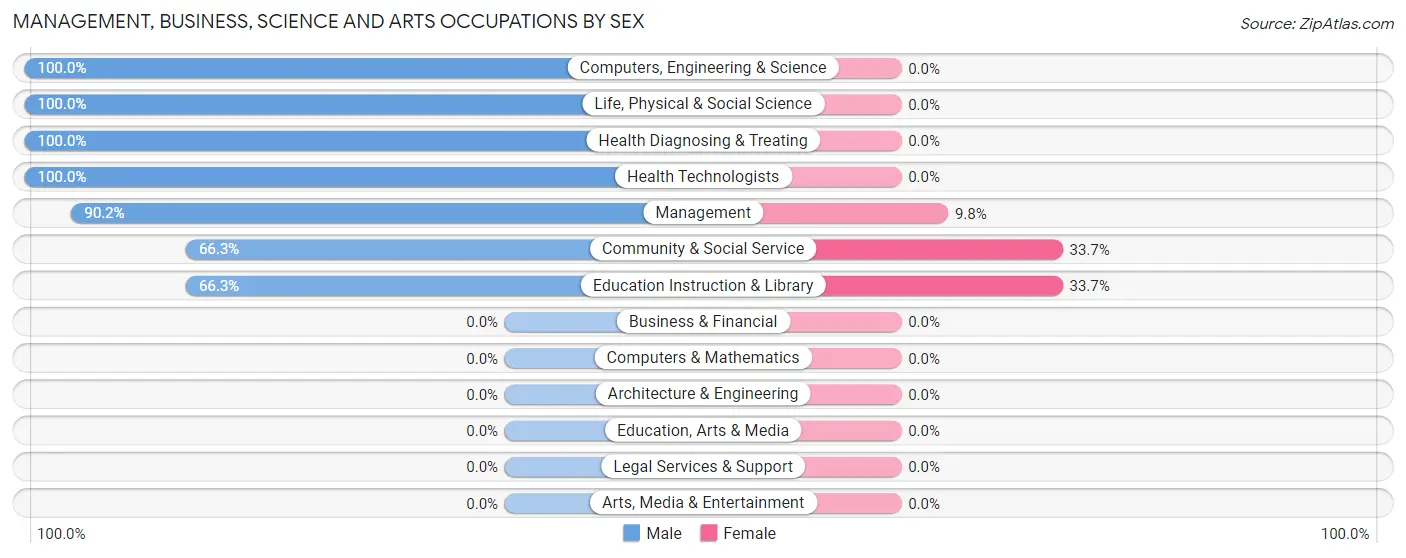
The most common Management, Business, Science and Arts occupations in Chula Vista CDP Maverick County are Management (123 | 10.1%), Community & Social Service (98 | 8.1%), Education Instruction & Library (98 | 8.1%), Health Diagnosing & Treating (45 | 3.7%), and Health Technologists (45 | 3.7%).
Management, Business, Science and Arts Occupations by Sex
Within the Management, Business, Science and Arts occupations in Chula Vista CDP Maverick County, the most male-oriented occupations are Computers, Engineering & Science (100.0%), Life, Physical & Social Science (100.0%), and Health Diagnosing & Treating (100.0%), while the most female-oriented occupations are Community & Social Service (33.7%), Education Instruction & Library (33.7%), and Management (9.8%).
| Occupation | Male | Female |
| Management | 111 (90.2%) | 12 (9.8%) |
| Business & Financial | 0 (0.0%) | 0 (0.0%) |
| Computers, Engineering & Science | 36 (100.0%) | 0 (0.0%) |
| Computers & Mathematics | 0 (0.0%) | 0 (0.0%) |
| Architecture & Engineering | 0 (0.0%) | 0 (0.0%) |
| Life, Physical & Social Science | 36 (100.0%) | 0 (0.0%) |
| Community & Social Service | 65 (66.3%) | 33 (33.7%) |
| Education, Arts & Media | 0 (0.0%) | 0 (0.0%) |
| Legal Services & Support | 0 (0.0%) | 0 (0.0%) |
| Education Instruction & Library | 65 (66.3%) | 33 (33.7%) |
| Arts, Media & Entertainment | 0 (0.0%) | 0 (0.0%) |
| Health Diagnosing & Treating | 45 (100.0%) | 0 (0.0%) |
| Health Technologists | 45 (100.0%) | 0 (0.0%) |
| Total (Category) | 257 (85.1%) | 45 (14.9%) |
| Total (Overall) | 934 (77.0%) | 279 (23.0%) |
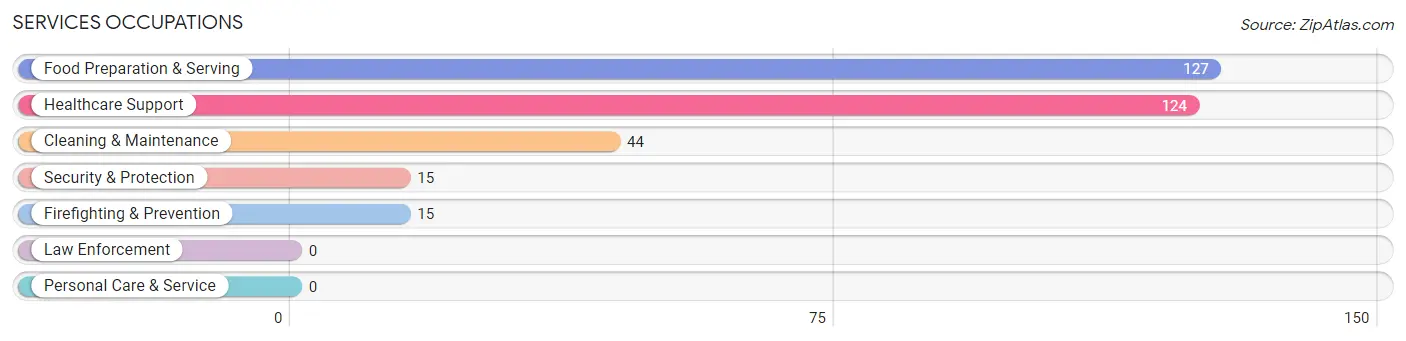
Services Occupations
The most common Services occupations in Chula Vista CDP Maverick County are Food Preparation & Serving (127 | 10.5%), Healthcare Support (124 | 10.2%), Cleaning & Maintenance (44 | 3.6%), Security & Protection (15 | 1.2%), and Firefighting & Prevention (15 | 1.2%).
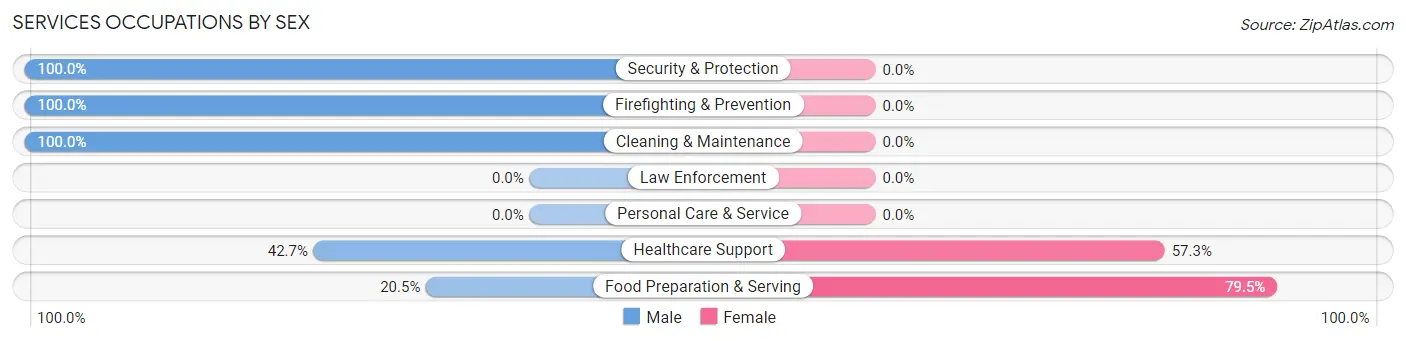
Services Occupations by Sex
Within the Services occupations in Chula Vista CDP Maverick County, the most male-oriented occupations are Security & Protection (100.0%), Firefighting & Prevention (100.0%), and Cleaning & Maintenance (100.0%), while the most female-oriented occupations are Food Preparation & Serving (79.5%), and Healthcare Support (57.3%).
| Occupation | Male | Female |
| Healthcare Support | 53 (42.7%) | 71 (57.3%) |
| Security & Protection | 15 (100.0%) | 0 (0.0%) |
| Firefighting & Prevention | 15 (100.0%) | 0 (0.0%) |
| Law Enforcement | 0 (0.0%) | 0 (0.0%) |
| Food Preparation & Serving | 26 (20.5%) | 101 (79.5%) |
| Cleaning & Maintenance | 44 (100.0%) | 0 (0.0%) |
| Personal Care & Service | 0 (0.0%) | 0 (0.0%) |
| Total (Category) | 138 (44.5%) | 172 (55.5%) |
| Total (Overall) | 934 (77.0%) | 279 (23.0%) |
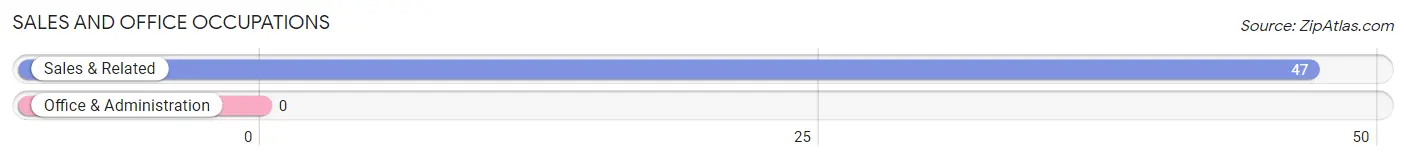
Sales and Office Occupations
The most common Sales and Office occupations in Chula Vista CDP Maverick County are , and Sales & Related (47 | 3.9%).
Sales and Office Occupations by Sex

| Occupation | Male | Female |
| Sales & Related | 0 (0.0%) | 47 (100.0%) |
| Office & Administration | 0 (0.0%) | 0 (0.0%) |
| Total (Category) | 0 (0.0%) | 47 (100.0%) |
| Total (Overall) | 934 (77.0%) | 279 (23.0%) |
Natural Resources, Construction and Maintenance Occupations
The most common Natural Resources, Construction and Maintenance occupations in Chula Vista CDP Maverick County are , and Construction & Extraction (130 | 10.7%).
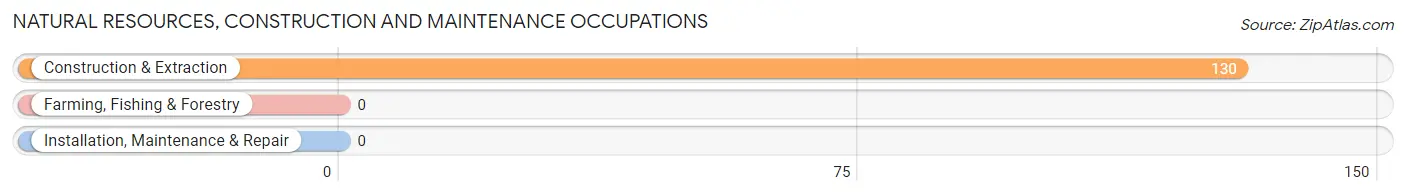
Natural Resources, Construction and Maintenance Occupations by Sex

| Occupation | Male | Female |
| Farming, Fishing & Forestry | 0 (0.0%) | 0 (0.0%) |
| Construction & Extraction | 130 (100.0%) | 0 (0.0%) |
| Installation, Maintenance & Repair | 0 (0.0%) | 0 (0.0%) |
| Total (Category) | 130 (100.0%) | 0 (0.0%) |
| Total (Overall) | 934 (77.0%) | 279 (23.0%) |
Production, Transportation and Moving Occupations
The most common Production, Transportation and Moving occupations in Chula Vista CDP Maverick County are Production (216 | 17.8%), Transportation (155 | 12.8%), and Material Moving (53 | 4.4%).
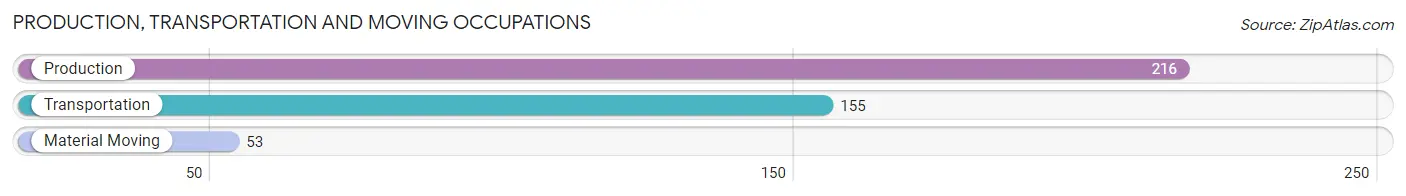
Production, Transportation and Moving Occupations by Sex
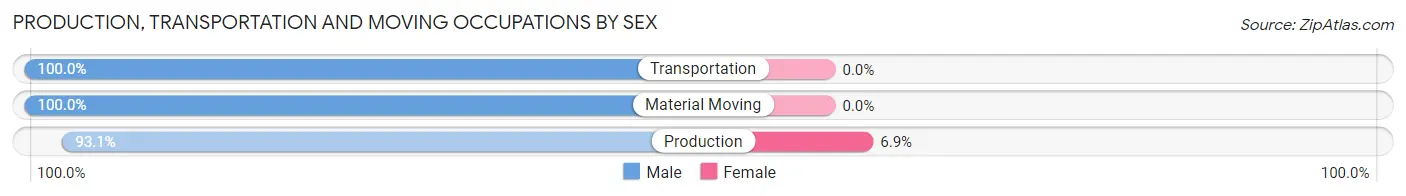
| Occupation | Male | Female |
| Production | 201 (93.1%) | 15 (6.9%) |
| Transportation | 155 (100.0%) | 0 (0.0%) |
| Material Moving | 53 (100.0%) | 0 (0.0%) |
| Total (Category) | 409 (96.5%) | 15 (3.5%) |
| Total (Overall) | 934 (77.0%) | 279 (23.0%) |
Employment Industries by Sex in Chula Vista CDP Maverick County
Employment Industries in Chula Vista CDP Maverick County
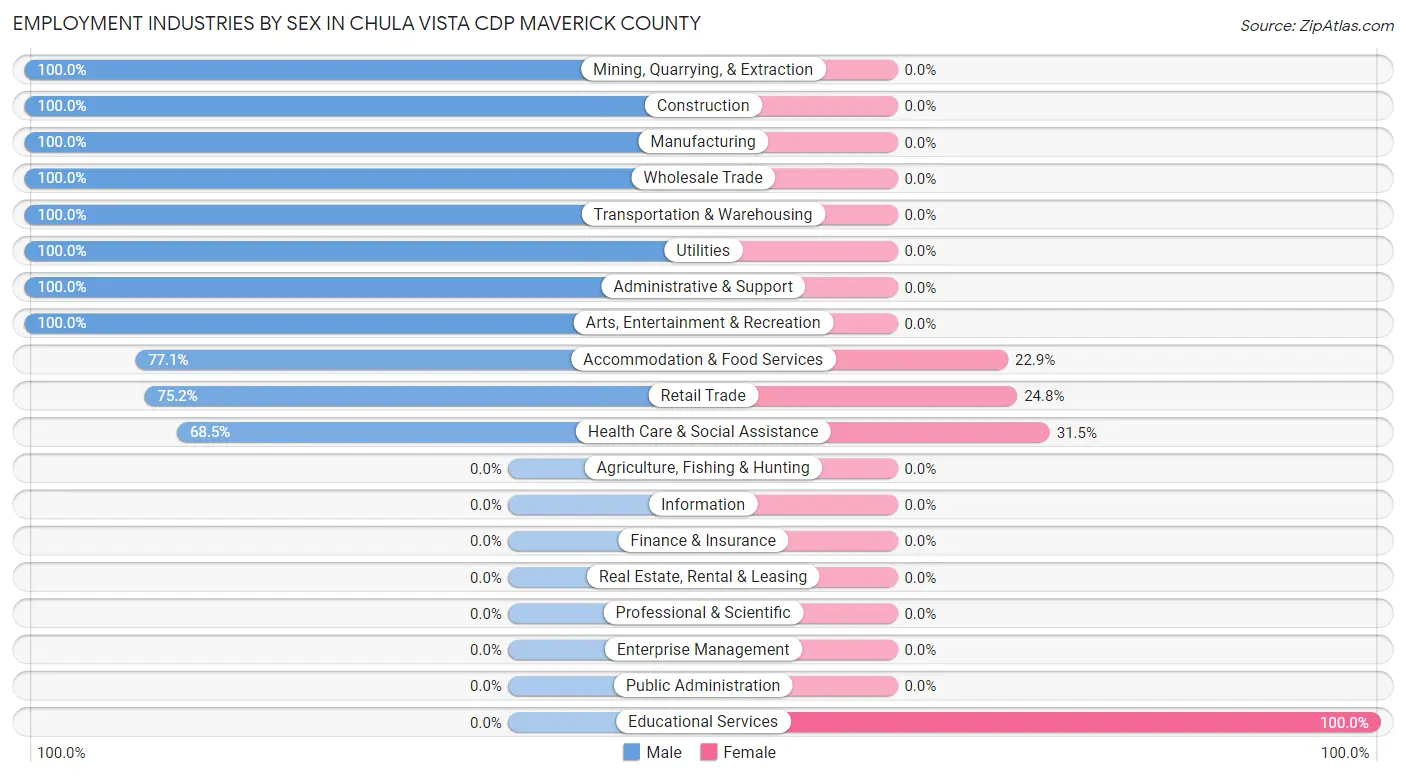
The major employment industries in Chula Vista CDP Maverick County include Health Care & Social Assistance (260 | 21.4%), Retail Trade (250 | 20.6%), Construction (159 | 13.1%), Accommodation & Food Services (131 | 10.8%), and Transportation & Warehousing (126 | 10.4%).
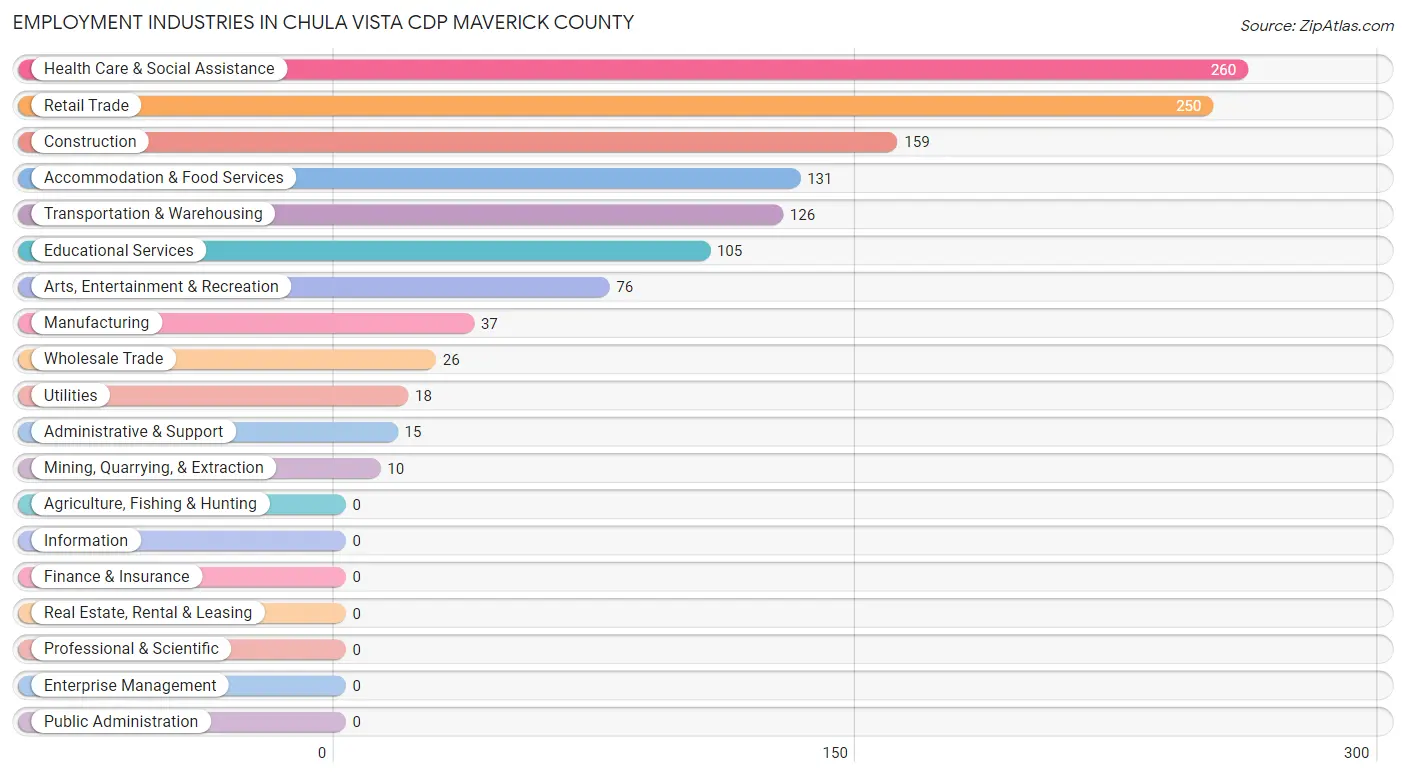
Employment Industries by Sex in Chula Vista CDP Maverick County
The Chula Vista CDP Maverick County industries that see more men than women are Mining, Quarrying, & Extraction (100.0%), Construction (100.0%), and Manufacturing (100.0%), whereas the industries that tend to have a higher number of women are Educational Services (100.0%), Health Care & Social Assistance (31.5%), and Retail Trade (24.8%).
| Industry | Male | Female |
| Agriculture, Fishing & Hunting | 0 (0.0%) | 0 (0.0%) |
| Mining, Quarrying, & Extraction | 10 (100.0%) | 0 (0.0%) |
| Construction | 159 (100.0%) | 0 (0.0%) |
| Manufacturing | 37 (100.0%) | 0 (0.0%) |
| Wholesale Trade | 26 (100.0%) | 0 (0.0%) |
| Retail Trade | 188 (75.2%) | 62 (24.8%) |
| Transportation & Warehousing | 126 (100.0%) | 0 (0.0%) |
| Utilities | 18 (100.0%) | 0 (0.0%) |
| Information | 0 (0.0%) | 0 (0.0%) |
| Finance & Insurance | 0 (0.0%) | 0 (0.0%) |
| Real Estate, Rental & Leasing | 0 (0.0%) | 0 (0.0%) |
| Professional & Scientific | 0 (0.0%) | 0 (0.0%) |
| Enterprise Management | 0 (0.0%) | 0 (0.0%) |
| Administrative & Support | 15 (100.0%) | 0 (0.0%) |
| Educational Services | 0 (0.0%) | 105 (100.0%) |
| Health Care & Social Assistance | 178 (68.5%) | 82 (31.5%) |
| Arts, Entertainment & Recreation | 76 (100.0%) | 0 (0.0%) |
| Accommodation & Food Services | 101 (77.1%) | 30 (22.9%) |
| Public Administration | 0 (0.0%) | 0 (0.0%) |
| Total | 934 (77.0%) | 279 (23.0%) |
Education in Chula Vista CDP Maverick County
School Enrollment in Chula Vista CDP Maverick County
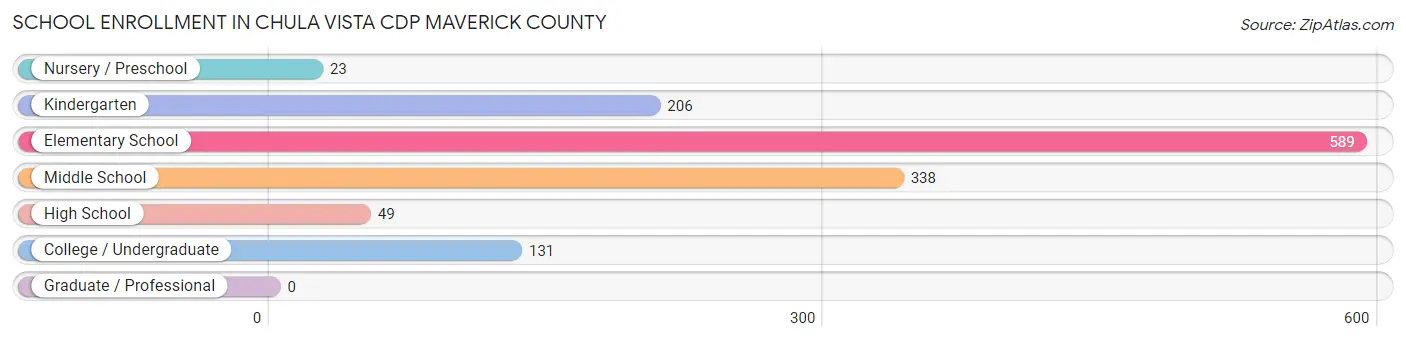
The most common levels of schooling among the 1,336 students in Chula Vista CDP Maverick County are elementary school (589 | 44.1%), middle school (338 | 25.3%), and kindergarten (206 | 15.4%).
| School Level | # Students | % Students |
| Nursery / Preschool | 23 | 1.7% |
| Kindergarten | 206 | 15.4% |
| Elementary School | 589 | 44.1% |
| Middle School | 338 | 25.3% |
| High School | 49 | 3.7% |
| College / Undergraduate | 131 | 9.8% |
| Graduate / Professional | 0 | 0.0% |
| Total | 1,336 | 100.0% |
School Enrollment by Age by Funding Source in Chula Vista CDP Maverick County
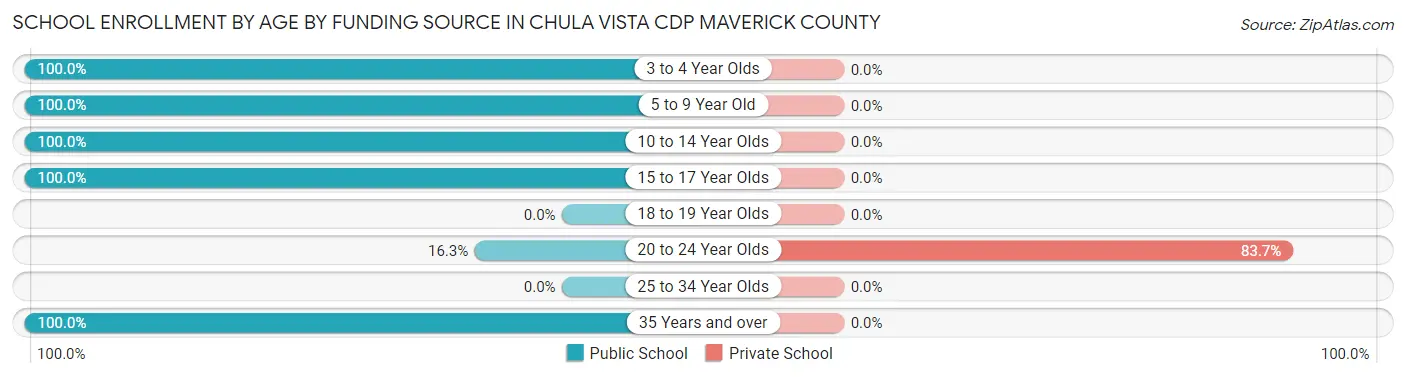
Out of a total of 1,336 students who are enrolled in schools in Chula Vista CDP Maverick County, 72 (5.4%) attend a private institution, while the remaining 1,264 (94.6%) are enrolled in public schools. The age group of 20 to 24 year olds has the highest likelihood of being enrolled in private schools, with 72 (83.7% in the age bracket) enrolled. Conversely, the age group of 3 to 4 year olds has the lowest likelihood of being enrolled in a private school, with 101 (100.0% in the age bracket) attending a public institution.
| Age Bracket | Public School | Private School |
| 3 to 4 Year Olds | 101 (100.0%) | 0 (0.0%) |
| 5 to 9 Year Old | 666 (100.0%) | 0 (0.0%) |
| 10 to 14 Year Olds | 415 (100.0%) | 0 (0.0%) |
| 15 to 17 Year Olds | 23 (100.0%) | 0 (0.0%) |
| 18 to 19 Year Olds | 0 (0.0%) | 0 (0.0%) |
| 20 to 24 Year Olds | 14 (16.3%) | 72 (83.7%) |
| 25 to 34 Year Olds | 0 (0.0%) | 0 (0.0%) |
| 35 Years and over | 45 (100.0%) | 0 (0.0%) |
| Total | 1,264 (94.6%) | 72 (5.4%) |
Educational Attainment by Field of Study in Chula Vista CDP Maverick County
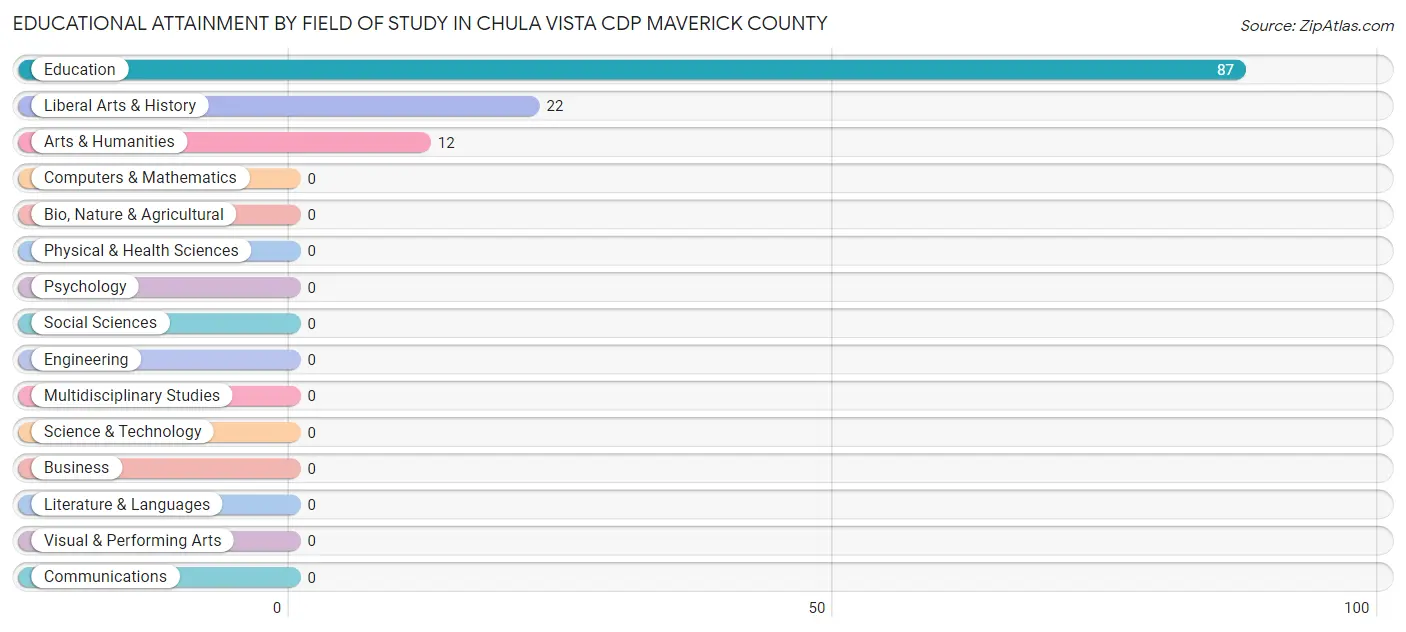
Education (87 | 71.9%), liberal arts & history (22 | 18.2%), and arts & humanities (12 | 9.9%) are the most common fields of study among 121 individuals in Chula Vista CDP Maverick County who have obtained a bachelor's degree or higher.
| Field of Study | # Graduates | % Graduates |
| Computers & Mathematics | 0 | 0.0% |
| Bio, Nature & Agricultural | 0 | 0.0% |
| Physical & Health Sciences | 0 | 0.0% |
| Psychology | 0 | 0.0% |
| Social Sciences | 0 | 0.0% |
| Engineering | 0 | 0.0% |
| Multidisciplinary Studies | 0 | 0.0% |
| Science & Technology | 0 | 0.0% |
| Business | 0 | 0.0% |
| Education | 87 | 71.9% |
| Literature & Languages | 0 | 0.0% |
| Liberal Arts & History | 22 | 18.2% |
| Visual & Performing Arts | 0 | 0.0% |
| Communications | 0 | 0.0% |
| Arts & Humanities | 12 | 9.9% |
| Total | 121 | 100.0% |
Transportation & Commute in Chula Vista CDP Maverick County
Vehicle Availability by Sex in Chula Vista CDP Maverick County
The most prevalent vehicle ownership categories in Chula Vista CDP Maverick County are males with 2 vehicles (562, accounting for 61.4%) and females with 2 vehicles (242, making up 201.4%).
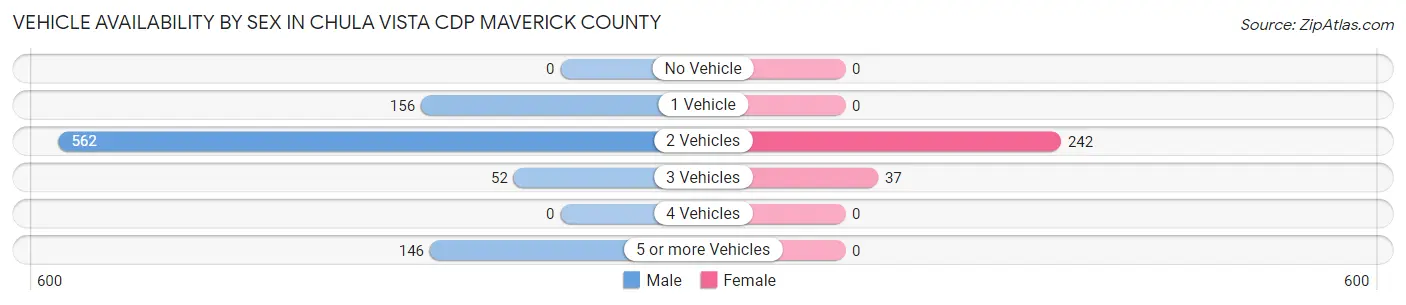
| Vehicles Available | Male | Female |
| No Vehicle | 0 (0.0%) | 0 (0.0%) |
| 1 Vehicle | 156 (17.0%) | 0 (0.0%) |
| 2 Vehicles | 562 (61.4%) | 242 (86.7%) |
| 3 Vehicles | 52 (5.7%) | 37 (13.3%) |
| 4 Vehicles | 0 (0.0%) | 0 (0.0%) |
| 5 or more Vehicles | 146 (15.9%) | 0 (0.0%) |
| Total | 916 (100.0%) | 279 (100.0%) |
Commute Time in Chula Vista CDP Maverick County
The most frequently occuring commute durations in Chula Vista CDP Maverick County are 10 to 14 minutes (212 commuters, 17.7%), 5 to 9 minutes (196 commuters, 16.4%), and 20 to 24 minutes (192 commuters, 16.1%).
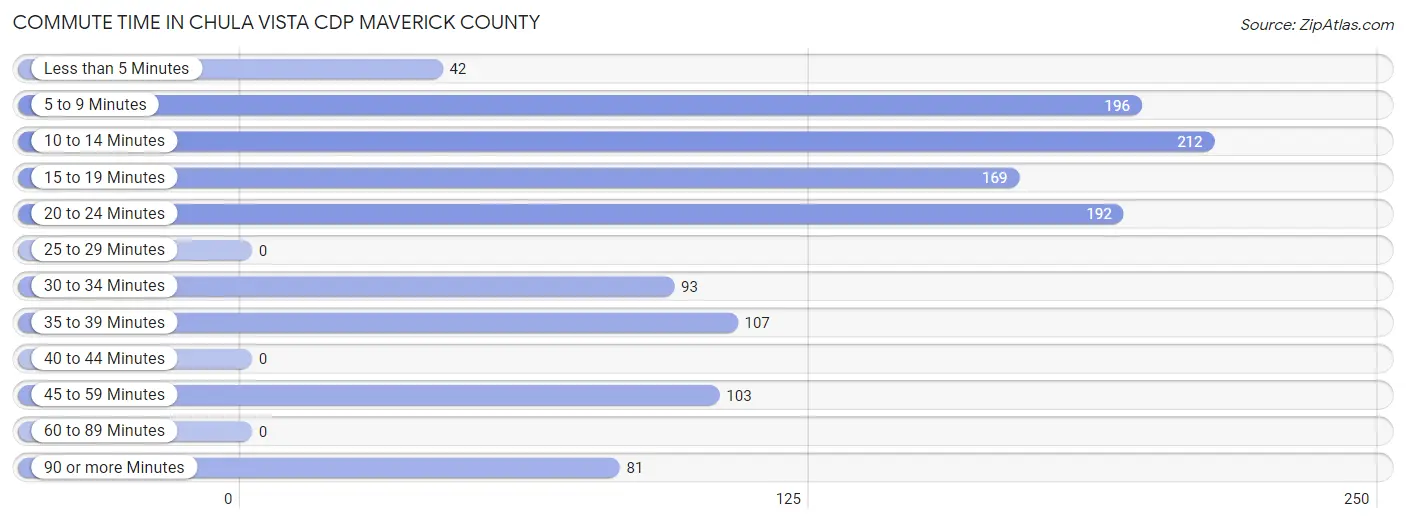
| Commute Time | # Commuters | % Commuters |
| Less than 5 Minutes | 42 | 3.5% |
| 5 to 9 Minutes | 196 | 16.4% |
| 10 to 14 Minutes | 212 | 17.7% |
| 15 to 19 Minutes | 169 | 14.1% |
| 20 to 24 Minutes | 192 | 16.1% |
| 25 to 29 Minutes | 0 | 0.0% |
| 30 to 34 Minutes | 93 | 7.8% |
| 35 to 39 Minutes | 107 | 8.9% |
| 40 to 44 Minutes | 0 | 0.0% |
| 45 to 59 Minutes | 103 | 8.6% |
| 60 to 89 Minutes | 0 | 0.0% |
| 90 or more Minutes | 81 | 6.8% |
Commute Time by Sex in Chula Vista CDP Maverick County
The most common commute times in Chula Vista CDP Maverick County are 5 to 9 minutes (196 commuters, 21.4%) for males and 35 to 39 minutes (107 commuters, 38.4%) for females.
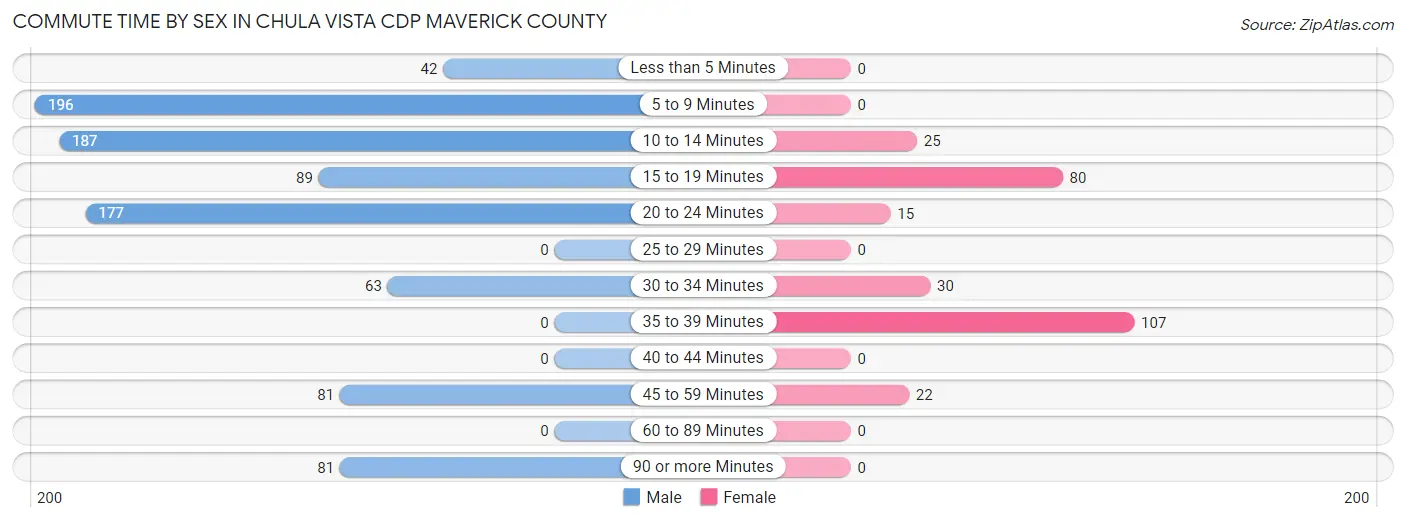
| Commute Time | Male | Female |
| Less than 5 Minutes | 42 (4.6%) | 0 (0.0%) |
| 5 to 9 Minutes | 196 (21.4%) | 0 (0.0%) |
| 10 to 14 Minutes | 187 (20.4%) | 25 (9.0%) |
| 15 to 19 Minutes | 89 (9.7%) | 80 (28.7%) |
| 20 to 24 Minutes | 177 (19.3%) | 15 (5.4%) |
| 25 to 29 Minutes | 0 (0.0%) | 0 (0.0%) |
| 30 to 34 Minutes | 63 (6.9%) | 30 (10.7%) |
| 35 to 39 Minutes | 0 (0.0%) | 107 (38.4%) |
| 40 to 44 Minutes | 0 (0.0%) | 0 (0.0%) |
| 45 to 59 Minutes | 81 (8.8%) | 22 (7.9%) |
| 60 to 89 Minutes | 0 (0.0%) | 0 (0.0%) |
| 90 or more Minutes | 81 (8.8%) | 0 (0.0%) |
Time of Departure to Work by Sex in Chula Vista CDP Maverick County
The most frequent times of departure to work in Chula Vista CDP Maverick County are 8:00 AM to 8:29 AM (365, 39.9%) for males and 10:00 AM to 10:59 AM (142, 50.9%) for females.
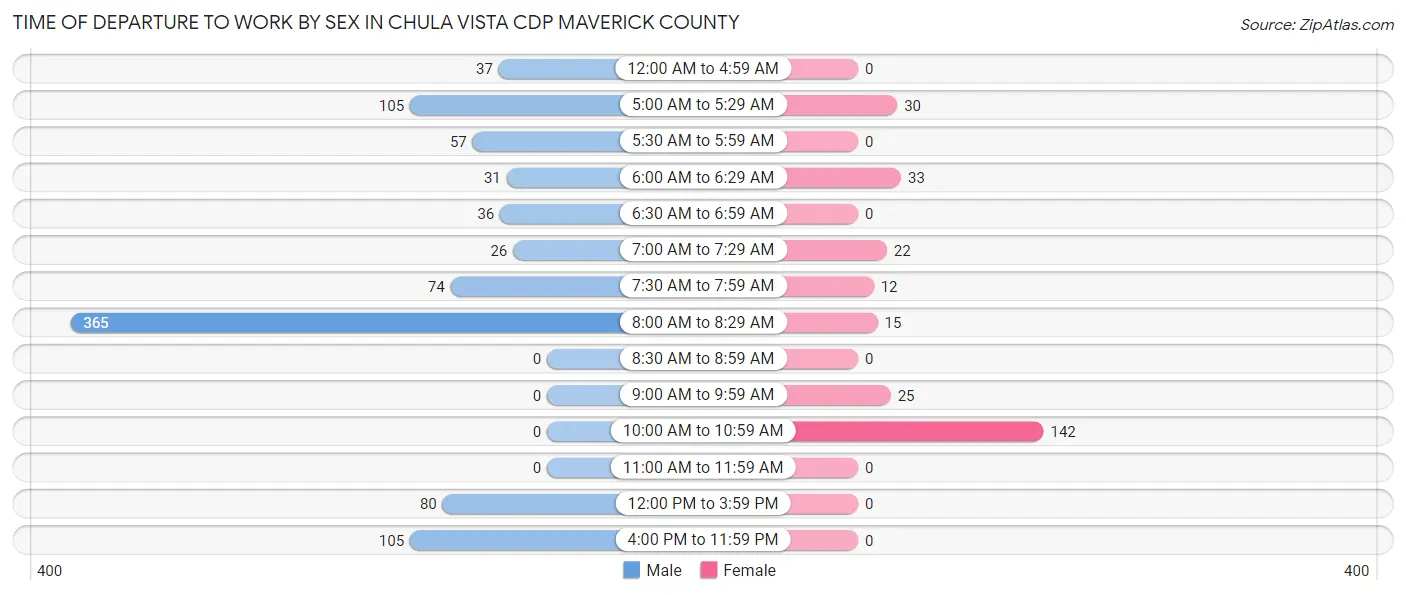
| Time of Departure | Male | Female |
| 12:00 AM to 4:59 AM | 37 (4.0%) | 0 (0.0%) |
| 5:00 AM to 5:29 AM | 105 (11.5%) | 30 (10.7%) |
| 5:30 AM to 5:59 AM | 57 (6.2%) | 0 (0.0%) |
| 6:00 AM to 6:29 AM | 31 (3.4%) | 33 (11.8%) |
| 6:30 AM to 6:59 AM | 36 (3.9%) | 0 (0.0%) |
| 7:00 AM to 7:29 AM | 26 (2.8%) | 22 (7.9%) |
| 7:30 AM to 7:59 AM | 74 (8.1%) | 12 (4.3%) |
| 8:00 AM to 8:29 AM | 365 (39.9%) | 15 (5.4%) |
| 8:30 AM to 8:59 AM | 0 (0.0%) | 0 (0.0%) |
| 9:00 AM to 9:59 AM | 0 (0.0%) | 25 (9.0%) |
| 10:00 AM to 10:59 AM | 0 (0.0%) | 142 (50.9%) |
| 11:00 AM to 11:59 AM | 0 (0.0%) | 0 (0.0%) |
| 12:00 PM to 3:59 PM | 80 (8.7%) | 0 (0.0%) |
| 4:00 PM to 11:59 PM | 105 (11.5%) | 0 (0.0%) |
| Total | 916 (100.0%) | 279 (100.0%) |
Housing Occupancy in Chula Vista CDP Maverick County
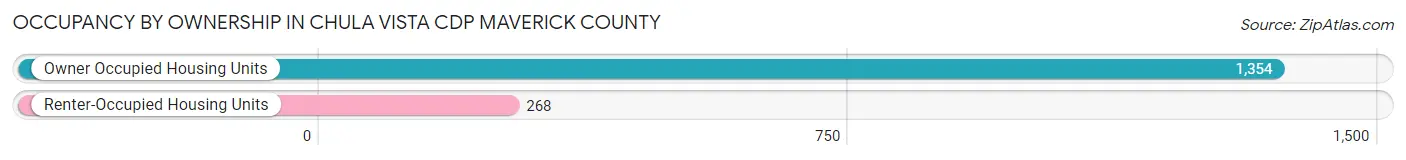
Occupancy by Ownership in Chula Vista CDP Maverick County
Of the total 1,622 dwellings in Chula Vista CDP Maverick County, owner-occupied units account for 1,354 (83.5%), while renter-occupied units make up 268 (16.5%).
| Occupancy | # Housing Units | % Housing Units |
| Owner Occupied Housing Units | 1,354 | 83.5% |
| Renter-Occupied Housing Units | 268 | 16.5% |
| Total Occupied Housing Units | 1,622 | 100.0% |
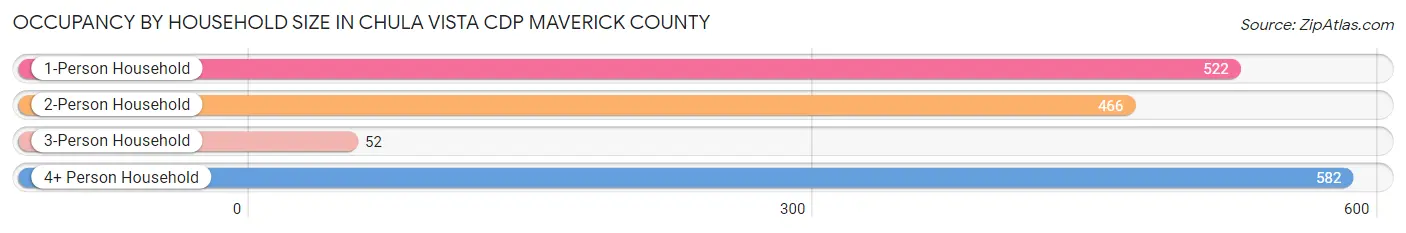
Occupancy by Household Size in Chula Vista CDP Maverick County
| Household Size | # Housing Units | % Housing Units |
| 1-Person Household | 522 | 32.2% |
| 2-Person Household | 466 | 28.7% |
| 3-Person Household | 52 | 3.2% |
| 4+ Person Household | 582 | 35.9% |
| Total Housing Units | 1,622 | 100.0% |
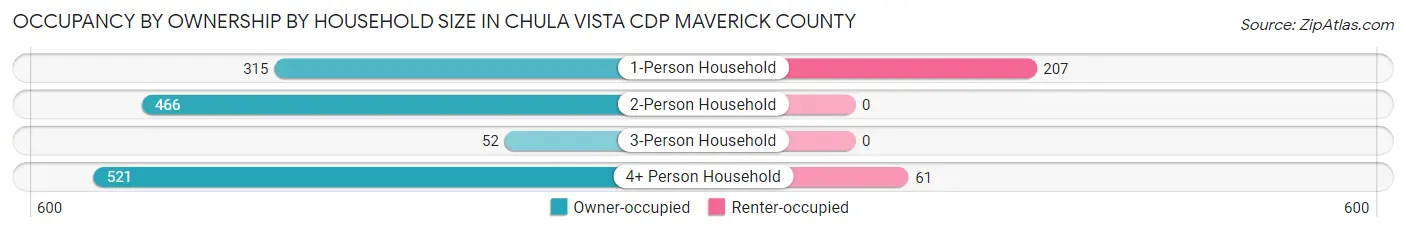
Occupancy by Ownership by Household Size in Chula Vista CDP Maverick County
| Household Size | Owner-occupied | Renter-occupied |
| 1-Person Household | 315 (60.3%) | 207 (39.7%) |
| 2-Person Household | 466 (100.0%) | 0 (0.0%) |
| 3-Person Household | 52 (100.0%) | 0 (0.0%) |
| 4+ Person Household | 521 (89.5%) | 61 (10.5%) |
| Total Housing Units | 1,354 (83.5%) | 268 (16.5%) |
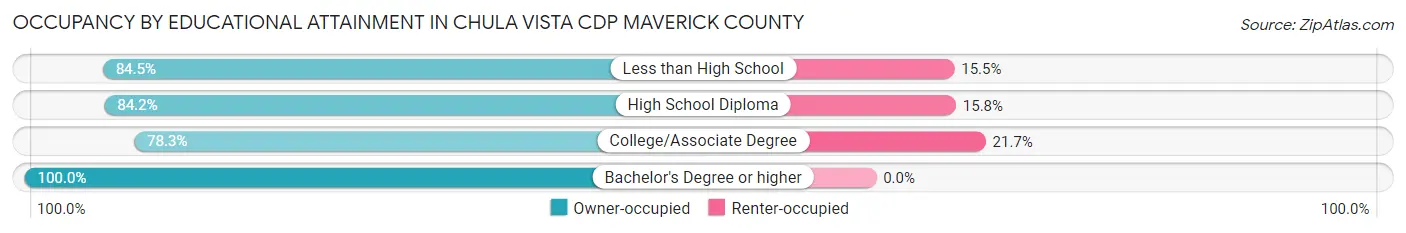
Occupancy by Educational Attainment in Chula Vista CDP Maverick County
| Household Size | Owner-occupied | Renter-occupied |
| Less than High School | 829 (84.5%) | 152 (15.5%) |
| High School Diploma | 293 (84.2%) | 55 (15.8%) |
| College/Associate Degree | 220 (78.3%) | 61 (21.7%) |
| Bachelor's Degree or higher | 12 (100.0%) | 0 (0.0%) |
Occupancy by Age of Householder in Chula Vista CDP Maverick County
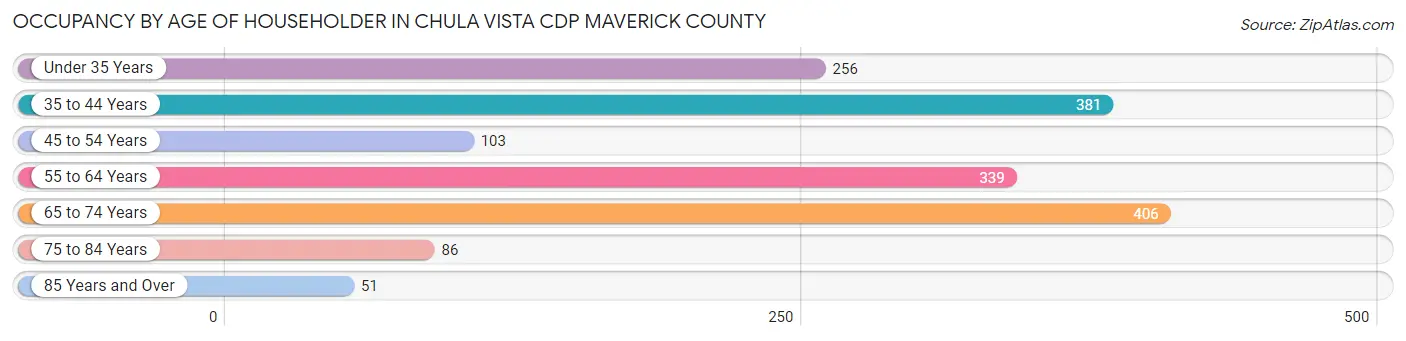
| Age Bracket | # Households | % Households |
| Under 35 Years | 256 | 15.8% |
| 35 to 44 Years | 381 | 23.5% |
| 45 to 54 Years | 103 | 6.4% |
| 55 to 64 Years | 339 | 20.9% |
| 65 to 74 Years | 406 | 25.0% |
| 75 to 84 Years | 86 | 5.3% |
| 85 Years and Over | 51 | 3.1% |
| Total | 1,622 | 100.0% |
Housing Finances in Chula Vista CDP Maverick County
Median Income by Occupancy in Chula Vista CDP Maverick County
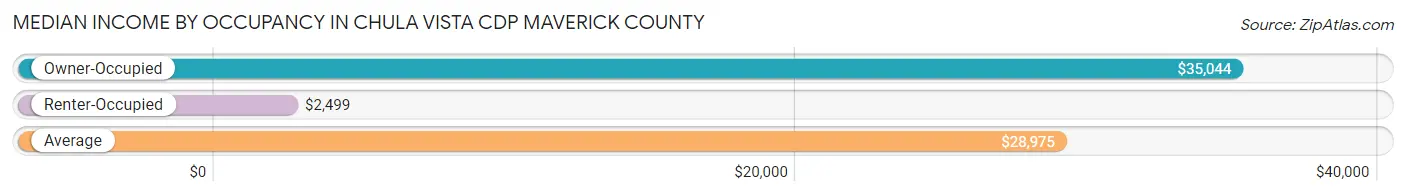
| Occupancy Type | # Households | Median Income |
| Owner-Occupied | 1,354 (83.5%) | $35,044 |
| Renter-Occupied | 268 (16.5%) | $2,499 |
| Average | 1,622 (100.0%) | $28,975 |
Occupancy by Householder Income Bracket in Chula Vista CDP Maverick County
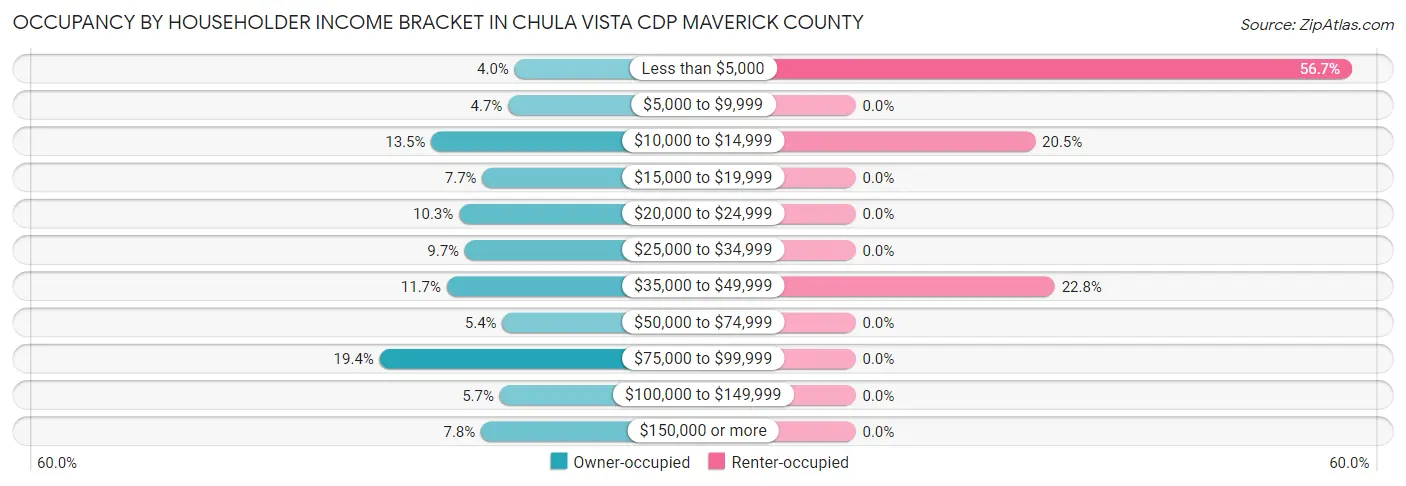
| Income Bracket | Owner-occupied | Renter-occupied |
| Less than $5,000 | 54 (4.0%) | 152 (56.7%) |
| $5,000 to $9,999 | 64 (4.7%) | 0 (0.0%) |
| $10,000 to $14,999 | 183 (13.5%) | 55 (20.5%) |
| $15,000 to $19,999 | 104 (7.7%) | 0 (0.0%) |
| $20,000 to $24,999 | 140 (10.3%) | 0 (0.0%) |
| $25,000 to $34,999 | 131 (9.7%) | 0 (0.0%) |
| $35,000 to $49,999 | 159 (11.7%) | 61 (22.8%) |
| $50,000 to $74,999 | 73 (5.4%) | 0 (0.0%) |
| $75,000 to $99,999 | 263 (19.4%) | 0 (0.0%) |
| $100,000 to $149,999 | 77 (5.7%) | 0 (0.0%) |
| $150,000 or more | 106 (7.8%) | 0 (0.0%) |
| Total | 1,354 (100.0%) | 268 (100.0%) |
Monthly Housing Cost Tiers in Chula Vista CDP Maverick County
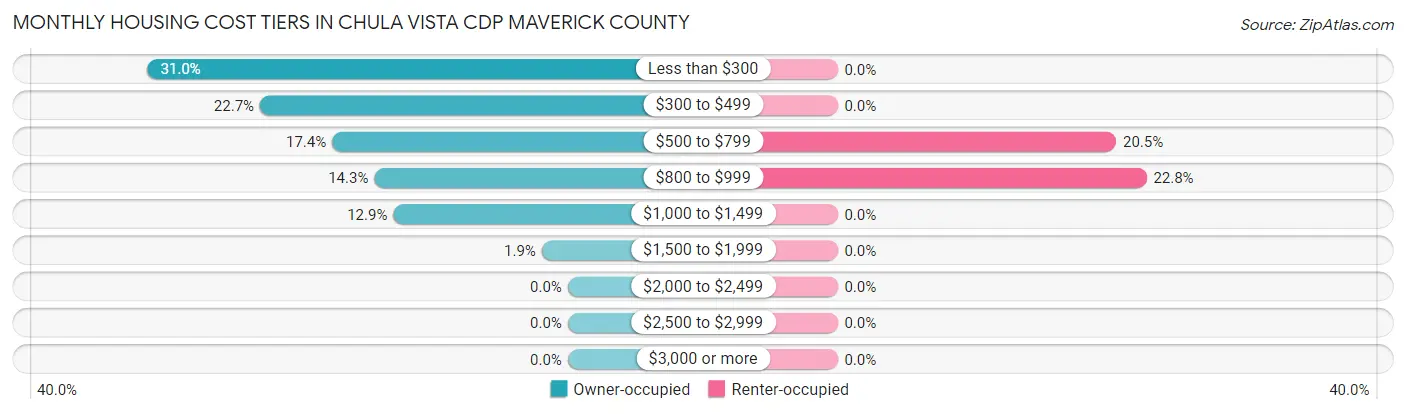
| Monthly Cost | Owner-occupied | Renter-occupied |
| Less than $300 | 419 (30.9%) | 0 (0.0%) |
| $300 to $499 | 307 (22.7%) | 0 (0.0%) |
| $500 to $799 | 235 (17.4%) | 55 (20.5%) |
| $800 to $999 | 193 (14.2%) | 61 (22.8%) |
| $1,000 to $1,499 | 174 (12.9%) | 0 (0.0%) |
| $1,500 to $1,999 | 26 (1.9%) | 0 (0.0%) |
| $2,000 to $2,499 | 0 (0.0%) | 0 (0.0%) |
| $2,500 to $2,999 | 0 (0.0%) | 0 (0.0%) |
| $3,000 or more | 0 (0.0%) | 0 (0.0%) |
| Total | 1,354 (100.0%) | 268 (100.0%) |
Physical Housing Characteristics in Chula Vista CDP Maverick County
Housing Structures in Chula Vista CDP Maverick County
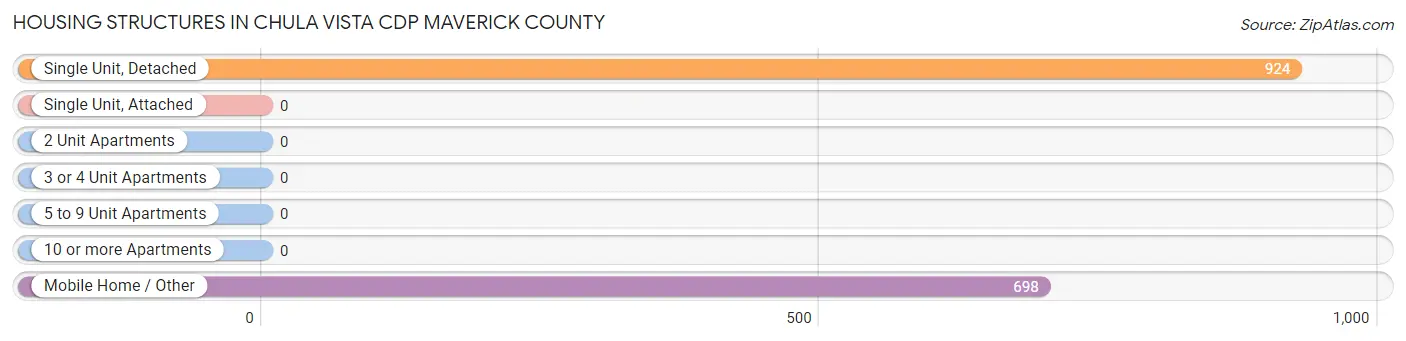
| Structure Type | # Housing Units | % Housing Units |
| Single Unit, Detached | 924 | 57.0% |
| Single Unit, Attached | 0 | 0.0% |
| 2 Unit Apartments | 0 | 0.0% |
| 3 or 4 Unit Apartments | 0 | 0.0% |
| 5 to 9 Unit Apartments | 0 | 0.0% |
| 10 or more Apartments | 0 | 0.0% |
| Mobile Home / Other | 698 | 43.0% |
| Total | 1,622 | 100.0% |
Housing Structures by Occupancy in Chula Vista CDP Maverick County
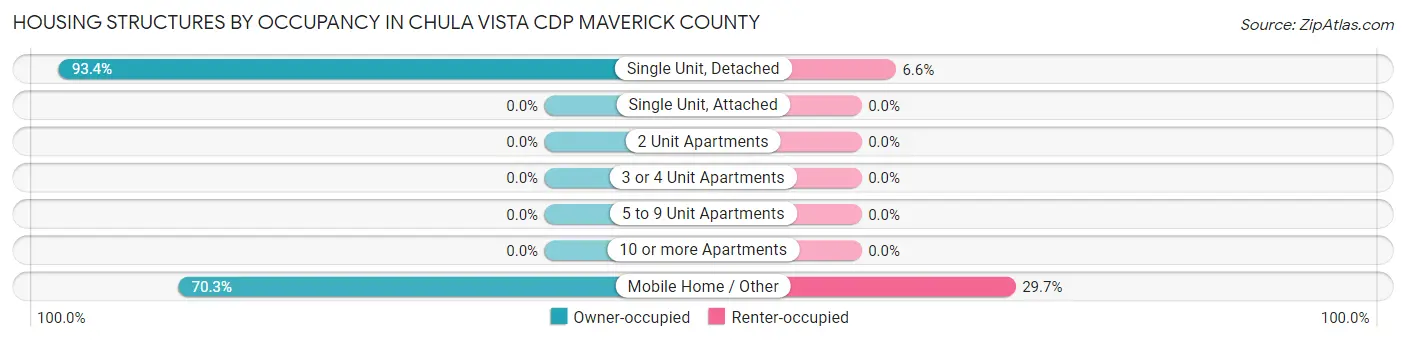
| Structure Type | Owner-occupied | Renter-occupied |
| Single Unit, Detached | 863 (93.4%) | 61 (6.6%) |
| Single Unit, Attached | 0 (0.0%) | 0 (0.0%) |
| 2 Unit Apartments | 0 (0.0%) | 0 (0.0%) |
| 3 or 4 Unit Apartments | 0 (0.0%) | 0 (0.0%) |
| 5 to 9 Unit Apartments | 0 (0.0%) | 0 (0.0%) |
| 10 or more Apartments | 0 (0.0%) | 0 (0.0%) |
| Mobile Home / Other | 491 (70.3%) | 207 (29.7%) |
| Total | 1,354 (83.5%) | 268 (16.5%) |
Housing Structures by Number of Rooms in Chula Vista CDP Maverick County
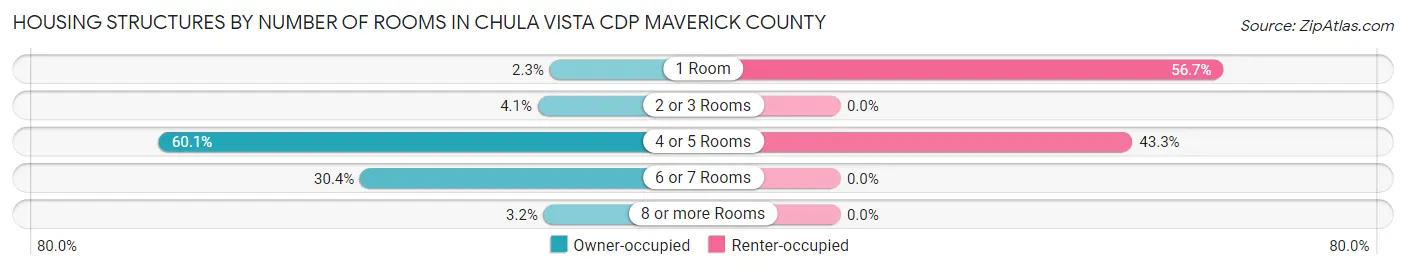
| Number of Rooms | Owner-occupied | Renter-occupied |
| 1 Room | 31 (2.3%) | 152 (56.7%) |
| 2 or 3 Rooms | 55 (4.1%) | 0 (0.0%) |
| 4 or 5 Rooms | 814 (60.1%) | 116 (43.3%) |
| 6 or 7 Rooms | 411 (30.3%) | 0 (0.0%) |
| 8 or more Rooms | 43 (3.2%) | 0 (0.0%) |
| Total | 1,354 (100.0%) | 268 (100.0%) |
Housing Structure by Heating Type in Chula Vista CDP Maverick County
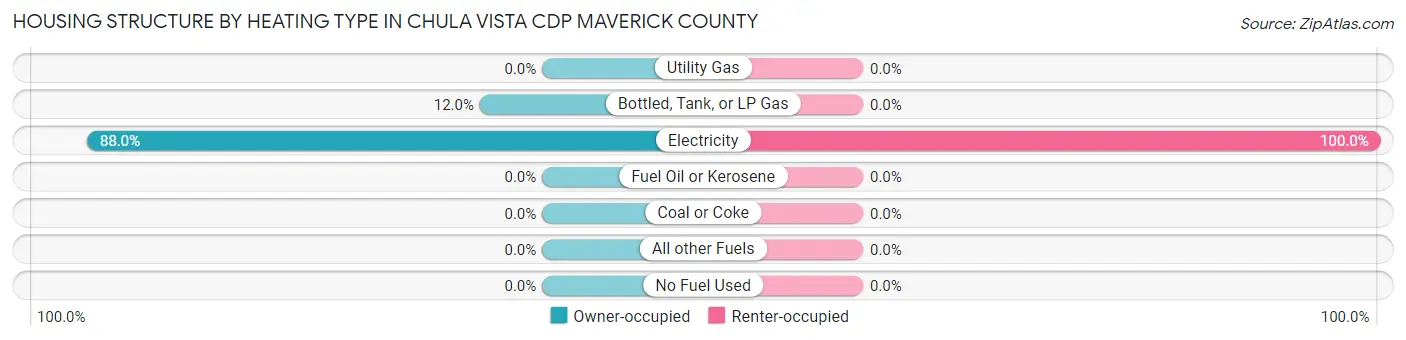
| Heating Type | Owner-occupied | Renter-occupied |
| Utility Gas | 0 (0.0%) | 0 (0.0%) |
| Bottled, Tank, or LP Gas | 163 (12.0%) | 0 (0.0%) |
| Electricity | 1,191 (88.0%) | 268 (100.0%) |
| Fuel Oil or Kerosene | 0 (0.0%) | 0 (0.0%) |
| Coal or Coke | 0 (0.0%) | 0 (0.0%) |
| All other Fuels | 0 (0.0%) | 0 (0.0%) |
| No Fuel Used | 0 (0.0%) | 0 (0.0%) |
| Total | 1,354 (100.0%) | 268 (100.0%) |
Household Vehicle Usage in Chula Vista CDP Maverick County
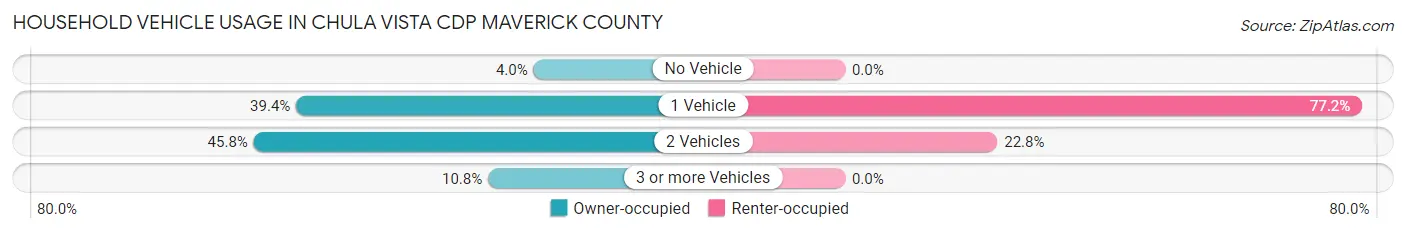
| Vehicles per Household | Owner-occupied | Renter-occupied |
| No Vehicle | 54 (4.0%) | 0 (0.0%) |
| 1 Vehicle | 534 (39.4%) | 207 (77.2%) |
| 2 Vehicles | 620 (45.8%) | 61 (22.8%) |
| 3 or more Vehicles | 146 (10.8%) | 0 (0.0%) |
| Total | 1,354 (100.0%) | 268 (100.0%) |
Real Estate & Mortgages in Chula Vista CDP Maverick County
Real Estate and Mortgage Overview in Chula Vista CDP Maverick County
| Characteristic | Without Mortgage | With Mortgage |
| Housing Units | 931 | 423 |
| Median Property Value | $76,900 | $0 |
| Median Household Income | $22,371 | $76 |
| Monthly Housing Costs | $325 | $0 |
| Real Estate Taxes | $574 | $147 |
Property Value by Mortgage Status in Chula Vista CDP Maverick County
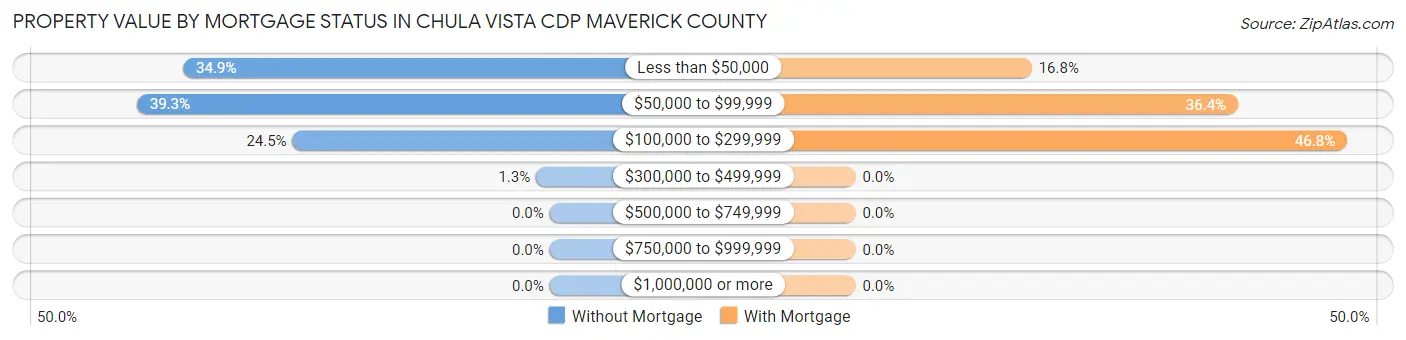
| Property Value | Without Mortgage | With Mortgage |
| Less than $50,000 | 325 (34.9%) | 71 (16.8%) |
| $50,000 to $99,999 | 366 (39.3%) | 154 (36.4%) |
| $100,000 to $299,999 | 228 (24.5%) | 198 (46.8%) |
| $300,000 to $499,999 | 12 (1.3%) | 0 (0.0%) |
| $500,000 to $749,999 | 0 (0.0%) | 0 (0.0%) |
| $750,000 to $999,999 | 0 (0.0%) | 0 (0.0%) |
| $1,000,000 or more | 0 (0.0%) | 0 (0.0%) |
| Total | 931 (100.0%) | 423 (100.0%) |
Household Income by Mortgage Status in Chula Vista CDP Maverick County
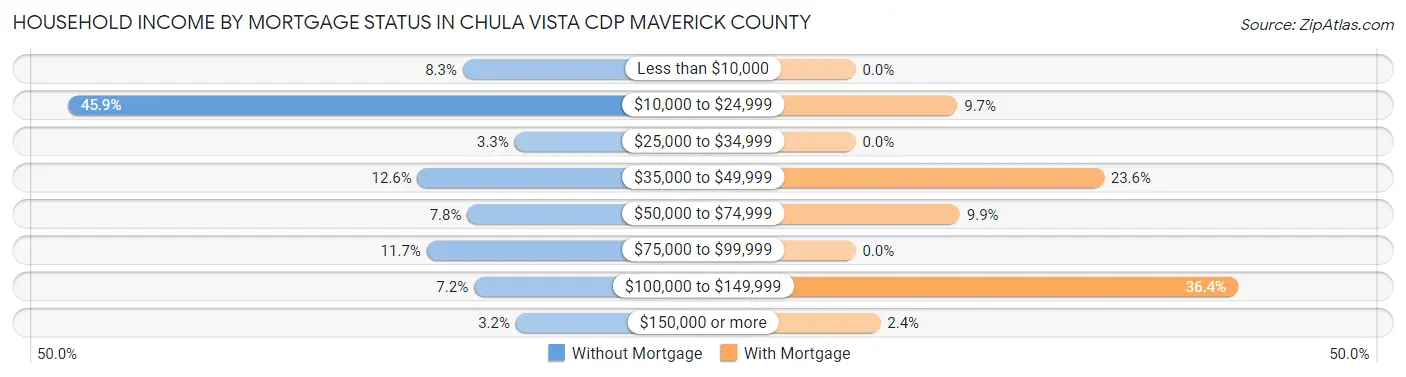
| Household Income | Without Mortgage | With Mortgage |
| Less than $10,000 | 77 (8.3%) | 0 (0.0%) |
| $10,000 to $24,999 | 427 (45.9%) | 41 (9.7%) |
| $25,000 to $34,999 | 31 (3.3%) | 0 (0.0%) |
| $35,000 to $49,999 | 117 (12.6%) | 100 (23.6%) |
| $50,000 to $74,999 | 73 (7.8%) | 42 (9.9%) |
| $75,000 to $99,999 | 109 (11.7%) | 0 (0.0%) |
| $100,000 to $149,999 | 67 (7.2%) | 154 (36.4%) |
| $150,000 or more | 30 (3.2%) | 10 (2.4%) |
| Total | 931 (100.0%) | 423 (100.0%) |
Property Value to Household Income Ratio in Chula Vista CDP Maverick County
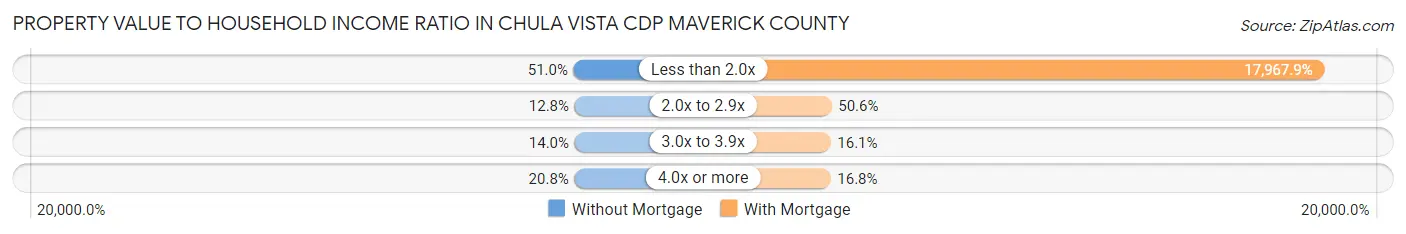
| Value-to-Income Ratio | Without Mortgage | With Mortgage |
| Less than 2.0x | 475 (51.0%) | 76,004 (17,967.9%) |
| 2.0x to 2.9x | 119 (12.8%) | 214 (50.6%) |
| 3.0x to 3.9x | 130 (14.0%) | 68 (16.1%) |
| 4.0x or more | 194 (20.8%) | 71 (16.8%) |
| Total | 931 (100.0%) | 423 (100.0%) |
Real Estate Taxes by Mortgage Status in Chula Vista CDP Maverick County

| Property Taxes | Without Mortgage | With Mortgage |
| Less than $800 | 475 (51.0%) | 0 (0.0%) |
| $800 to $1,499 | 134 (14.4%) | 10 (2.4%) |
| $800 to $1,499 | 234 (25.1%) | 139 (32.9%) |
| Total | 931 (100.0%) | 423 (100.0%) |
Health & Disability in Chula Vista CDP Maverick County
Health Insurance Coverage by Age in Chula Vista CDP Maverick County
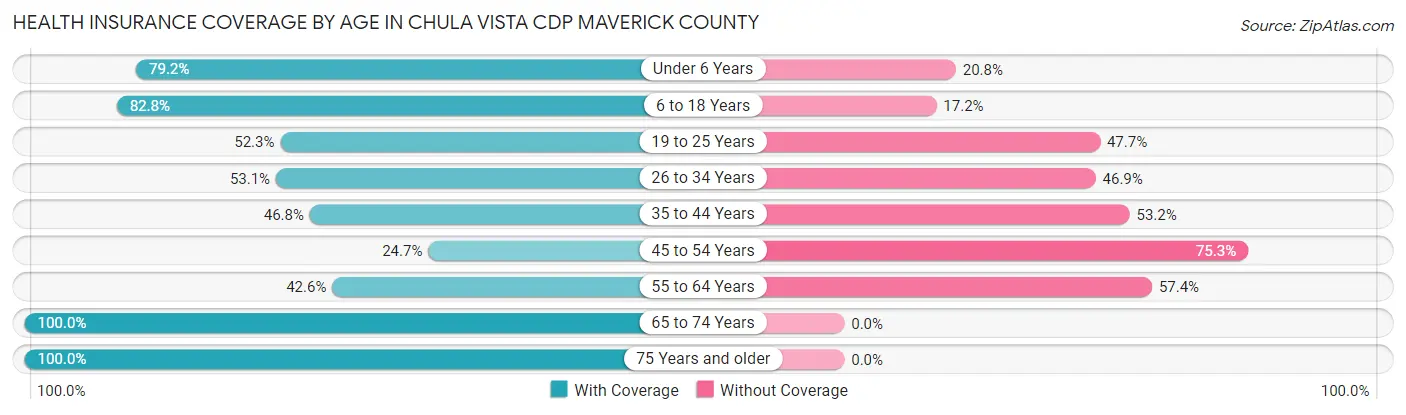
| Age Bracket | With Coverage | Without Coverage |
| Under 6 Years | 259 (79.2%) | 68 (20.8%) |
| 6 to 18 Years | 858 (82.8%) | 178 (17.2%) |
| 19 to 25 Years | 79 (52.3%) | 72 (47.7%) |
| 26 to 34 Years | 229 (53.1%) | 202 (46.9%) |
| 35 to 44 Years | 345 (46.8%) | 392 (53.2%) |
| 45 to 54 Years | 68 (24.7%) | 207 (75.3%) |
| 55 to 64 Years | 217 (42.6%) | 292 (57.4%) |
| 65 to 74 Years | 654 (100.0%) | 0 (0.0%) |
| 75 Years and older | 197 (100.0%) | 0 (0.0%) |
| Total | 2,906 (67.3%) | 1,411 (32.7%) |
Health Insurance Coverage by Citizenship Status in Chula Vista CDP Maverick County

| Citizenship Status | With Coverage | Without Coverage |
| Native Born | 259 (79.2%) | 68 (20.8%) |
| Foreign Born, Citizen | 858 (82.8%) | 178 (17.2%) |
| Foreign Born, not a Citizen | 79 (52.3%) | 72 (47.7%) |
Health Insurance Coverage by Household Income in Chula Vista CDP Maverick County
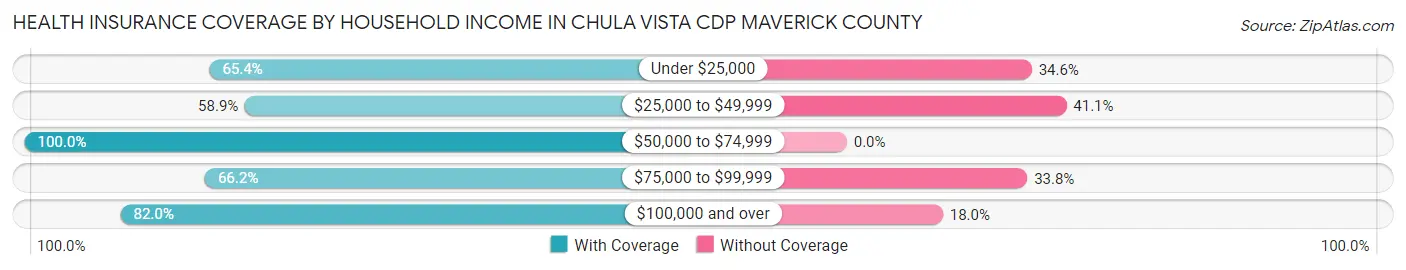
| Household Income | With Coverage | Without Coverage |
| Under $25,000 | 781 (65.4%) | 414 (34.6%) |
| $25,000 to $49,999 | 710 (58.9%) | 496 (41.1%) |
| $50,000 to $74,999 | 137 (100.0%) | 0 (0.0%) |
| $75,000 to $99,999 | 758 (66.2%) | 387 (33.8%) |
| $100,000 and over | 520 (82.0%) | 114 (18.0%) |
Public vs Private Health Insurance Coverage by Age in Chula Vista CDP Maverick County
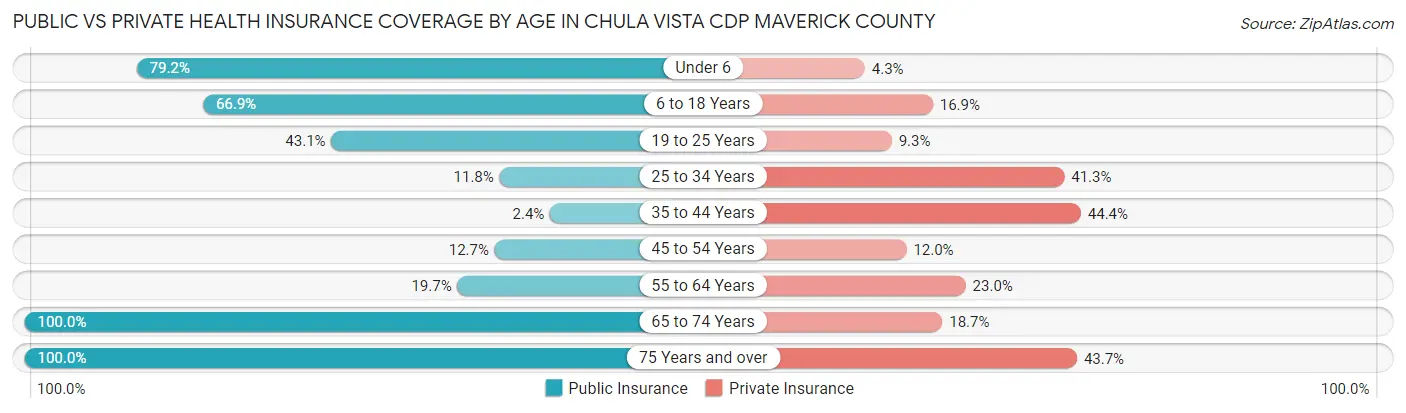
| Age Bracket | Public Insurance | Private Insurance |
| Under 6 | 259 (79.2%) | 14 (4.3%) |
| 6 to 18 Years | 693 (66.9%) | 175 (16.9%) |
| 19 to 25 Years | 65 (43.0%) | 14 (9.3%) |
| 25 to 34 Years | 51 (11.8%) | 178 (41.3%) |
| 35 to 44 Years | 18 (2.4%) | 327 (44.4%) |
| 45 to 54 Years | 35 (12.7%) | 33 (12.0%) |
| 55 to 64 Years | 100 (19.7%) | 117 (23.0%) |
| 65 to 74 Years | 654 (100.0%) | 122 (18.6%) |
| 75 Years and over | 197 (100.0%) | 86 (43.6%) |
| Total | 2,072 (48.0%) | 1,066 (24.7%) |
Disability Status by Sex by Age in Chula Vista CDP Maverick County
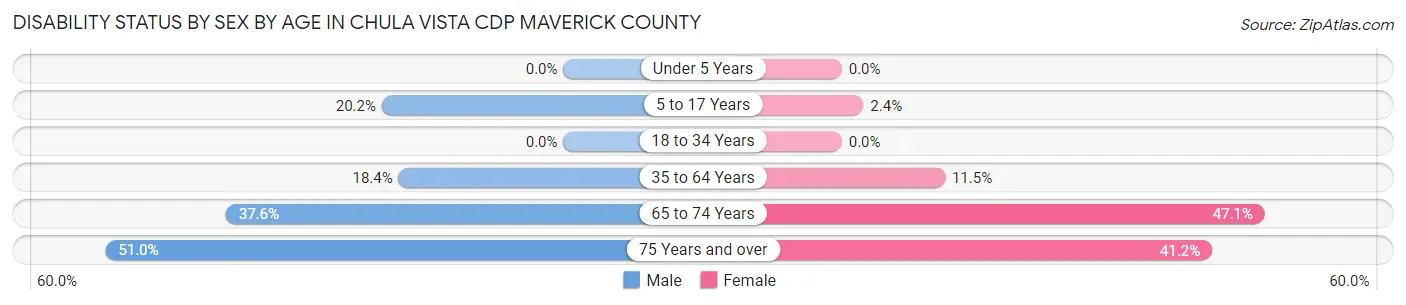
| Age Bracket | Male | Female |
| Under 5 Years | 0 (0.0%) | 0 (0.0%) |
| 5 to 17 Years | 128 (20.2%) | 13 (2.4%) |
| 18 to 34 Years | 0 (0.0%) | 0 (0.0%) |
| 35 to 64 Years | 145 (18.3%) | 84 (11.5%) |
| 65 to 74 Years | 103 (37.6%) | 179 (47.1%) |
| 75 Years and over | 51 (51.0%) | 40 (41.2%) |
Disability Class by Sex by Age in Chula Vista CDP Maverick County
Disability Class: Hearing Difficulty
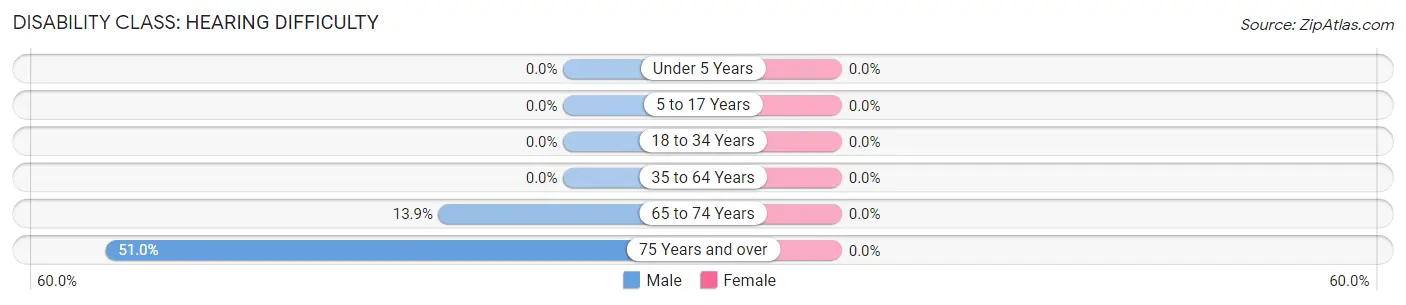
| Age Bracket | Male | Female |
| Under 5 Years | 0 (0.0%) | 0 (0.0%) |
| 5 to 17 Years | 0 (0.0%) | 0 (0.0%) |
| 18 to 34 Years | 0 (0.0%) | 0 (0.0%) |
| 35 to 64 Years | 0 (0.0%) | 0 (0.0%) |
| 65 to 74 Years | 38 (13.9%) | 0 (0.0%) |
| 75 Years and over | 51 (51.0%) | 0 (0.0%) |
Disability Class: Vision Difficulty
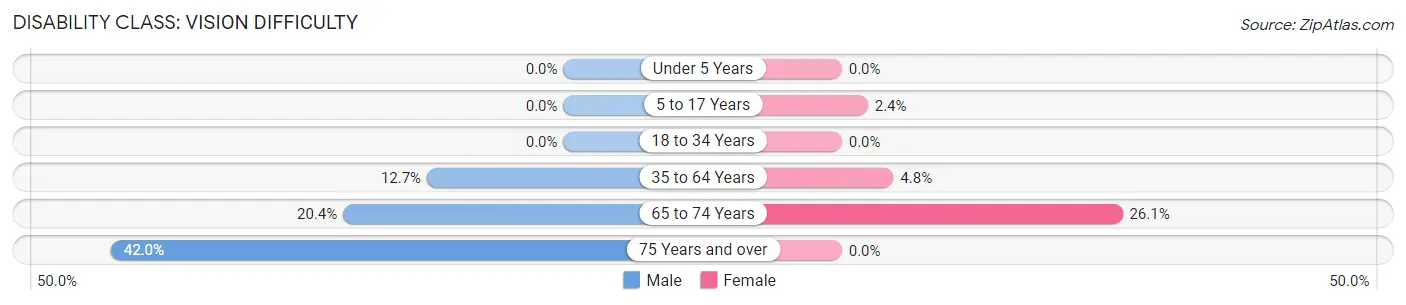
| Age Bracket | Male | Female |
| Under 5 Years | 0 (0.0%) | 0 (0.0%) |
| 5 to 17 Years | 0 (0.0%) | 13 (2.4%) |
| 18 to 34 Years | 0 (0.0%) | 0 (0.0%) |
| 35 to 64 Years | 100 (12.7%) | 35 (4.8%) |
| 65 to 74 Years | 56 (20.4%) | 99 (26.1%) |
| 75 Years and over | 42 (42.0%) | 0 (0.0%) |
Disability Class: Cognitive Difficulty
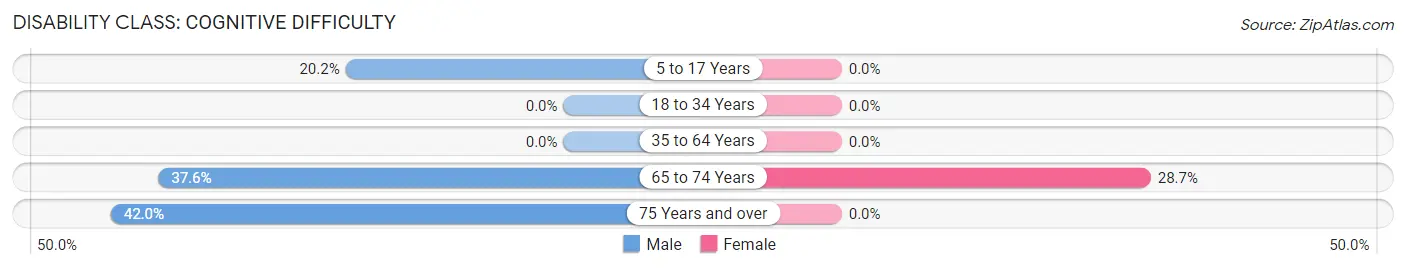
| Age Bracket | Male | Female |
| 5 to 17 Years | 128 (20.2%) | 0 (0.0%) |
| 18 to 34 Years | 0 (0.0%) | 0 (0.0%) |
| 35 to 64 Years | 0 (0.0%) | 0 (0.0%) |
| 65 to 74 Years | 103 (37.6%) | 109 (28.7%) |
| 75 Years and over | 42 (42.0%) | 0 (0.0%) |
Disability Class: Ambulatory Difficulty
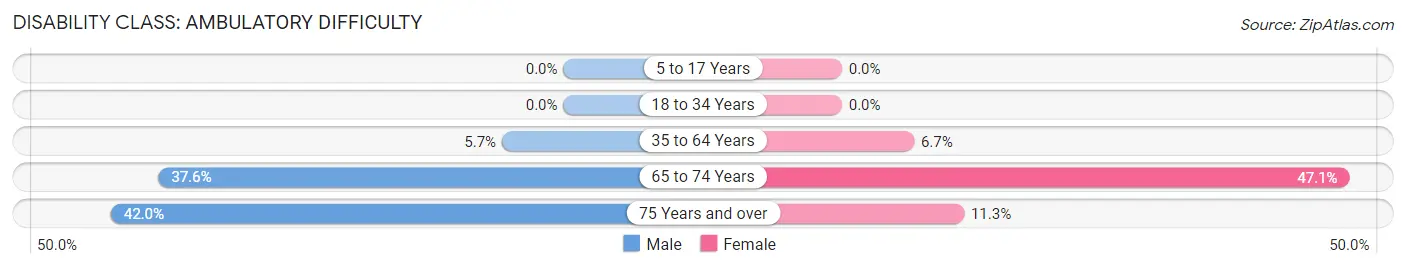
| Age Bracket | Male | Female |
| 5 to 17 Years | 0 (0.0%) | 0 (0.0%) |
| 18 to 34 Years | 0 (0.0%) | 0 (0.0%) |
| 35 to 64 Years | 45 (5.7%) | 49 (6.7%) |
| 65 to 74 Years | 103 (37.6%) | 179 (47.1%) |
| 75 Years and over | 42 (42.0%) | 11 (11.3%) |
Disability Class: Self-Care Difficulty
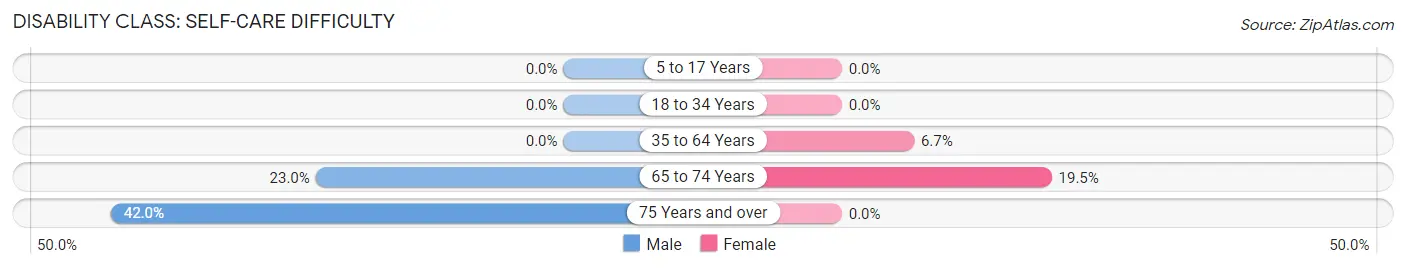
| Age Bracket | Male | Female |
| 5 to 17 Years | 0 (0.0%) | 0 (0.0%) |
| 18 to 34 Years | 0 (0.0%) | 0 (0.0%) |
| 35 to 64 Years | 0 (0.0%) | 49 (6.7%) |
| 65 to 74 Years | 63 (23.0%) | 74 (19.5%) |
| 75 Years and over | 42 (42.0%) | 0 (0.0%) |
Technology Access in Chula Vista CDP Maverick County
Computing Device Access in Chula Vista CDP Maverick County
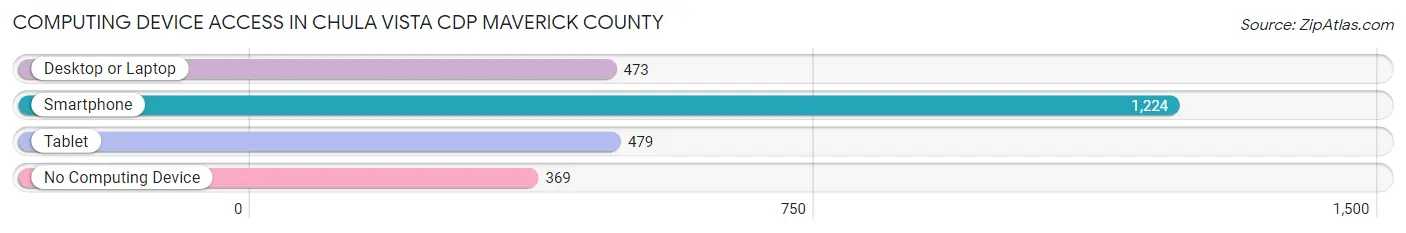
| Device Type | # Households | % Households |
| Desktop or Laptop | 473 | 29.2% |
| Smartphone | 1,224 | 75.5% |
| Tablet | 479 | 29.5% |
| No Computing Device | 369 | 22.8% |
| Total | 1,622 | 100.0% |
Internet Access in Chula Vista CDP Maverick County
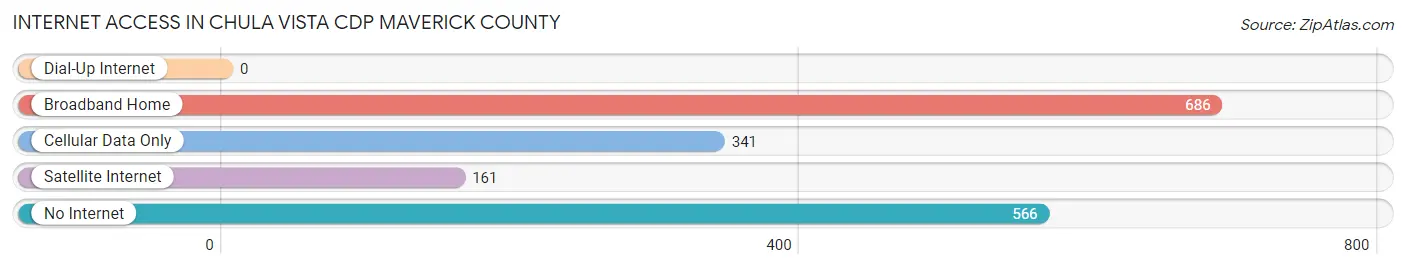
| Internet Type | # Households | % Households |
| Dial-Up Internet | 0 | 0.0% |
| Broadband Home | 686 | 42.3% |
| Cellular Data Only | 341 | 21.0% |
| Satellite Internet | 161 | 9.9% |
| No Internet | 566 | 34.9% |
| Total | 1,622 | 100.0% |
Chula Vista CDP Maverick County Summary
Chula Vista Cdp is a census-designated place (CDP) located in Maverick County, Texas. It is situated in the western part of the county, about 10 miles east of Eagle Pass. The population of Chula Vista Cdp was 1,845 at the 2010 census.
Geography
Chula Vista Cdp is located at 28°45'25"N 100°30'17"W (28.756944, -100.504722). It has an elevation of 545 feet above sea level. The CDP covers an area of 1.2 square miles, all of which is land.
History
Chula Vista Cdp was first settled in the late 19th century by Mexican immigrants. The area was originally known as "Chula Vista Ranch" and was used for cattle ranching. The name "Chula Vista" is Spanish for "beautiful view".
In the early 20th century, the area began to be developed for agriculture. The first school in the area was built in 1915. The population of Chula Vista Cdp grew steadily throughout the 20th century, reaching 1,845 in 2010.
Economy
The economy of Chula Vista Cdp is largely based on agriculture. The area is known for its production of cotton, corn, sorghum, and wheat. The area also produces cattle, sheep, and goats.
In addition to agriculture, Chula Vista Cdp is home to several businesses, including a grocery store, a gas station, and a restaurant. The area also has a post office and a library.
Demographics
As of the 2010 census, the population of Chula Vista Cdp was 1,845. The racial makeup of the CDP was 94.3% Hispanic or Latino, 4.2% White, 0.2% African American, 0.2% Native American, 0.2% Asian, and 0.9% from other races.
The median household income in Chula Vista Cdp was $20,938 in 2010. The per capita income was $9,845. About 28.3% of the population was below the poverty line.
Education
Chula Vista Cdp is served by the Eagle Pass Independent School District. The area is home to two schools: Chula Vista Elementary School and Chula Vista High School.
Conclusion
Chula Vista Cdp is a census-designated place located in Maverick County, Texas. It is situated in the western part of the county, about 10 miles east of Eagle Pass. The population of Chula Vista Cdp was 1,845 at the 2010 census. The economy of Chula Vista Cdp is largely based on agriculture, and the area is also home to several businesses. The racial makeup of the CDP was 94.3% Hispanic or Latino, 4.2% White, 0.2% African American, 0.2% Native American, 0.2% Asian, and 0.9% from other races. The median household income in Chula Vista Cdp was $20,938 in 2010. The area is served by the Eagle Pass Independent School District.
Common Questions
What is Per Capita Income in Chula Vista CDP Maverick County?
Per Capita income in Chula Vista CDP Maverick County is $19,082.
What is the Median Family Income in Chula Vista CDP Maverick County?
Median Family Income in Chula Vista CDP Maverick County is $43,254.
What is the Median Household income in Chula Vista CDP Maverick County?
Median Household Income in Chula Vista CDP Maverick County is $28,975.
What is Inequality or Gini Index in Chula Vista CDP Maverick County?
Inequality or Gini Index in Chula Vista CDP Maverick County is 0.55.
What is the Total Population of Chula Vista CDP Maverick County?
Total Population of Chula Vista CDP Maverick County is 4,317.
What is the Total Male Population of Chula Vista CDP Maverick County?
Total Male Population of Chula Vista CDP Maverick County is 2,379.
What is the Total Female Population of Chula Vista CDP Maverick County?
Total Female Population of Chula Vista CDP Maverick County is 1,938.
What is the Ratio of Males per 100 Females in Chula Vista CDP Maverick County?
There are 122.76 Males per 100 Females in Chula Vista CDP Maverick County.
What is the Ratio of Females per 100 Males in Chula Vista CDP Maverick County?
There are 81.46 Females per 100 Males in Chula Vista CDP Maverick County.
What is the Median Population Age in Chula Vista CDP Maverick County?
Median Population Age in Chula Vista CDP Maverick County is 37.2 Years.
What is the Average Family Size in Chula Vista CDP Maverick County
Average Family Size in Chula Vista CDP Maverick County is 3.5 People.
What is the Average Household Size in Chula Vista CDP Maverick County
Average Household Size in Chula Vista CDP Maverick County is 2.7 People.
How Large is the Labor Force in Chula Vista CDP Maverick County?
There are 1,231 People in the Labor Forcein in Chula Vista CDP Maverick County.
What is the Percentage of People in the Labor Force in Chula Vista CDP Maverick County?
41.5% of People are in the Labor Force in Chula Vista CDP Maverick County.
What is the Unemployment Rate in Chula Vista CDP Maverick County?
Unemployment Rate in Chula Vista CDP Maverick County is 1.5%.