Zip Codes with the Highest Percentage of Population Employed in Life, Physical & Social Science in Magnolia, TX
RELATED REPORTS & OPTIONS
Life, Physical & Social Science
Magnolia
Compare Zip Codes
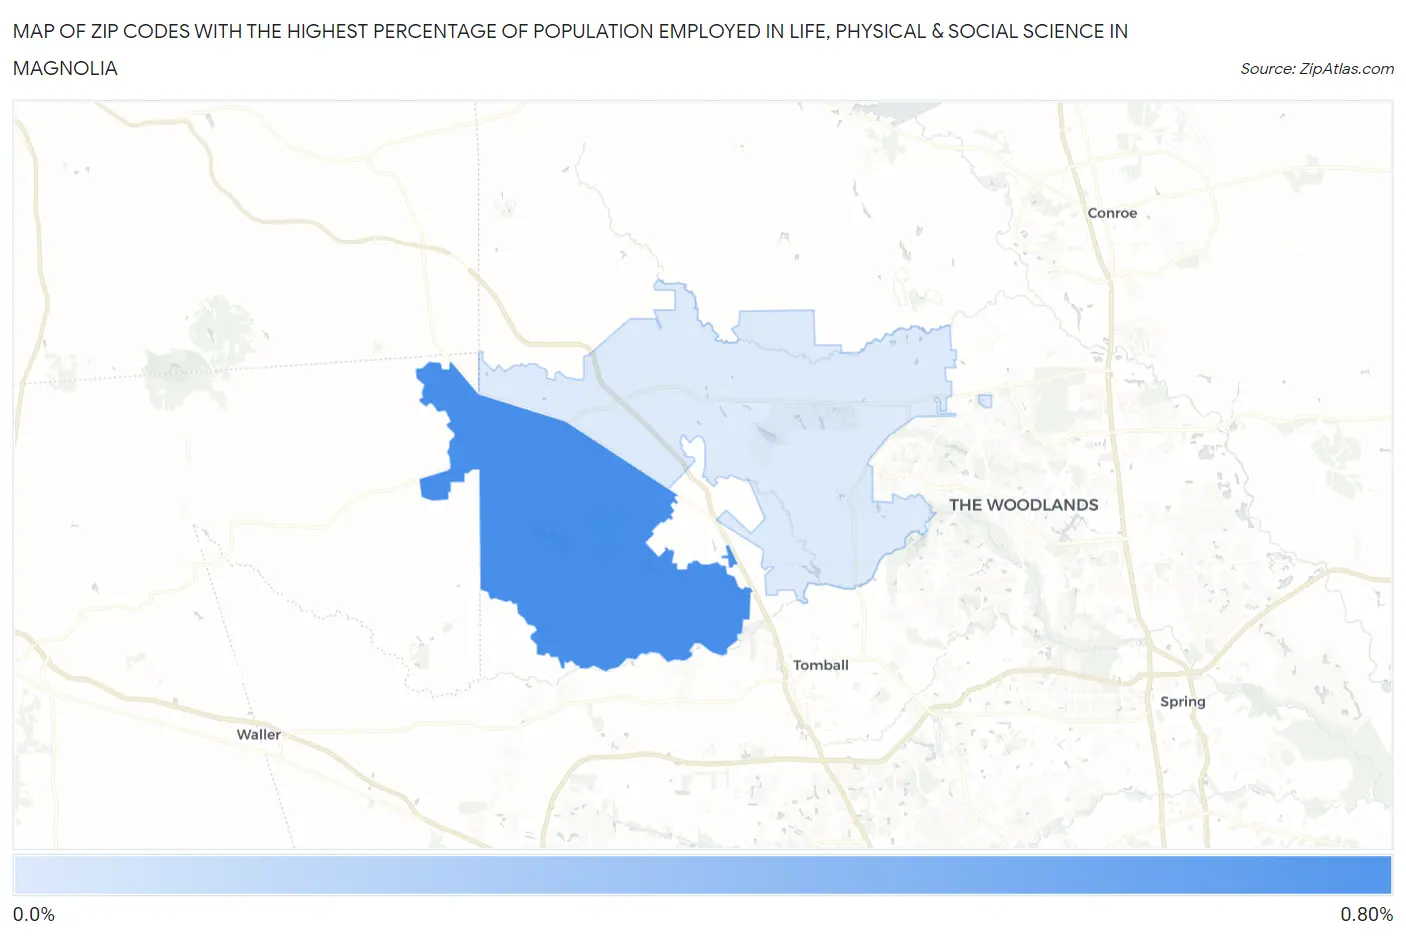
Map of Zip Codes with the Highest Percentage of Population Employed in Life, Physical & Social Science in Magnolia
0.12%
0.65%
Zip Codes with the Highest Percentage of Population Employed in Life, Physical & Social Science in Magnolia, TX
| Zip Code | % Employed | vs State | vs National | |
| 1. | 77355 | 0.65% | 0.84%(-0.191)#618 | 1.1%(-0.439)#12,634 |
| 2. | 77354 | 0.12% | 0.84%(-0.719)#1,063 | 1.1%(-0.967)#18,908 |
1
Common Questions
What are the Top Zip Codes with the Highest Percentage of Population Employed in Life, Physical & Social Science in Magnolia, TX?
Top Zip Codes with the Highest Percentage of Population Employed in Life, Physical & Social Science in Magnolia, TX are:
What zip code has the Highest Percentage of Population Employed in Life, Physical & Social Science in Magnolia, TX?
77355 has the Highest Percentage of Population Employed in Life, Physical & Social Science in Magnolia, TX with 0.65%.
What is the Percentage of Population Employed in Life, Physical & Social Science in Magnolia, TX?
Percentage of Population Employed in Life, Physical & Social Science in Magnolia is 0.32%.
What is the Percentage of Population Employed in Life, Physical & Social Science in Texas?
Percentage of Population Employed in Life, Physical & Social Science in Texas is 0.84%.
What is the Percentage of Population Employed in Life, Physical & Social Science in the United States?
Percentage of Population Employed in Life, Physical & Social Science in the United States is 1.1%.