Zip Codes with the Highest Percentage of Population Employed in Life, Physical & Social Science in San Antonio, TX
RELATED REPORTS & OPTIONS
Life, Physical & Social Science
San Antonio
Compare Zip Codes
Map of Zip Codes with the Highest Percentage of Population Employed in Life, Physical & Social Science in San Antonio
0.041%
4.7%
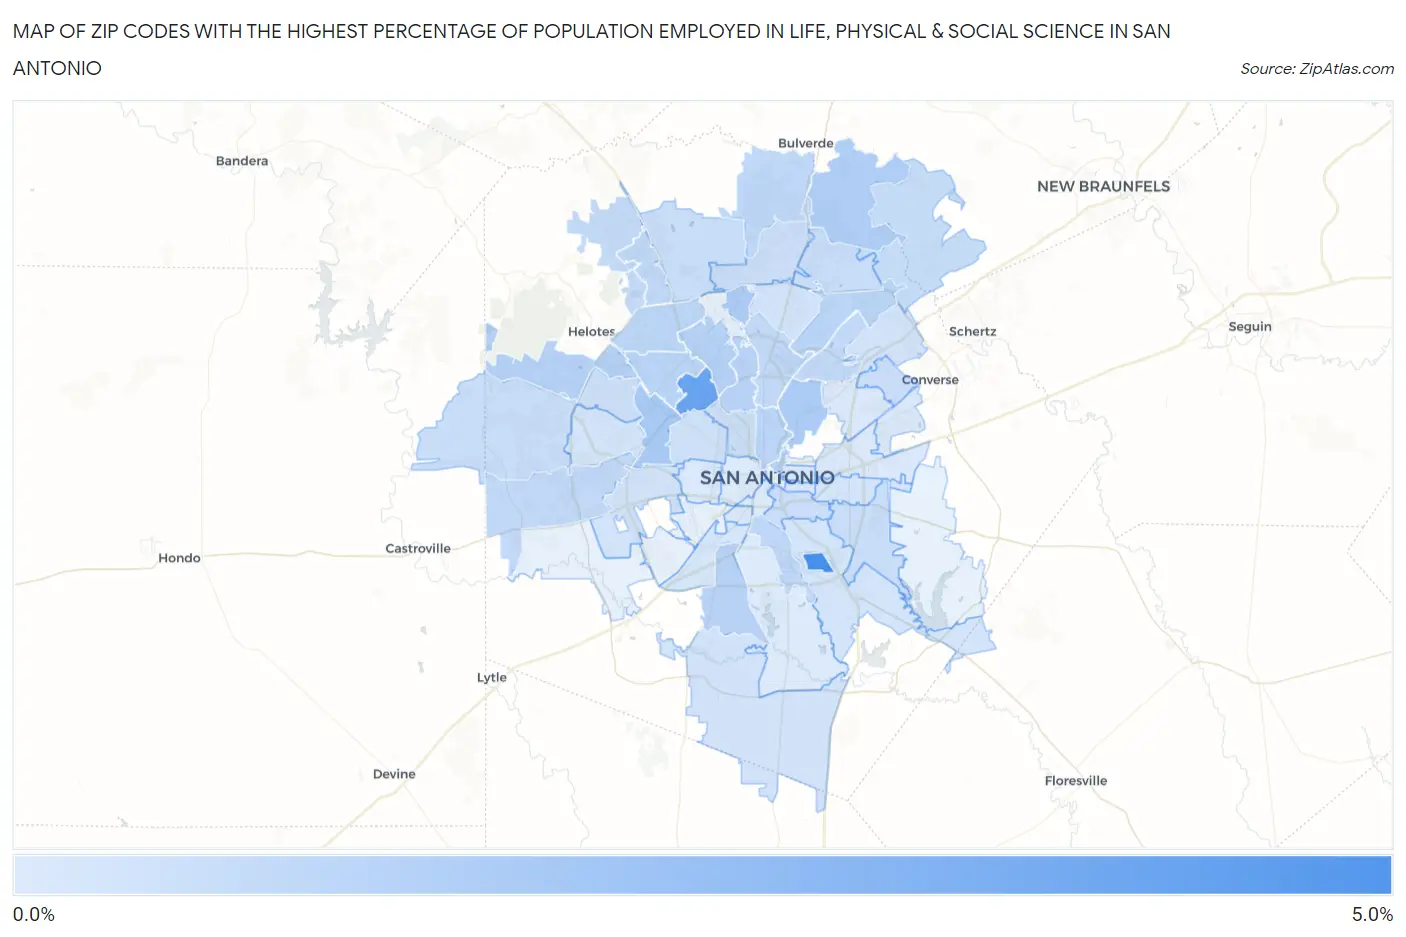
Zip Codes with the Highest Percentage of Population Employed in Life, Physical & Social Science in San Antonio, TX
| Zip Code | % Employed | vs State | vs National | |
| 1. | 78235 | 4.7% | 0.84%(+3.88)#28 | 1.1%(+3.63)#842 |
| 2. | 78229 | 3.6% | 0.84%(+2.79)#47 | 1.1%(+2.54)#1,355 |
| 3. | 78238 | 1.7% | 0.84%(+0.835)#184 | 1.1%(+0.587)#4,824 |
| 4. | 78209 | 1.5% | 0.84%(+0.688)#219 | 1.1%(+0.440)#5,496 |
| 5. | 78248 | 1.5% | 0.84%(+0.672)#224 | 1.1%(+0.423)#5,584 |
| 6. | 78261 | 1.4% | 0.84%(+0.596)#239 | 1.1%(+0.348)#5,968 |
| 7. | 78254 | 1.3% | 0.84%(+0.437)#291 | 1.1%(+0.188)#6,933 |
| 8. | 78230 | 1.3% | 0.84%(+0.429)#295 | 1.1%(+0.181)#6,988 |
| 9. | 78224 | 1.2% | 0.84%(+0.361)#323 | 1.1%(+0.113)#7,469 |
| 10. | 78213 | 1.2% | 0.84%(+0.354)#330 | 1.1%(+0.105)#7,523 |
| 11. | 78215 | 1.1% | 0.84%(+0.291)#352 | 1.1%(+0.042)#7,982 |
| 12. | 78247 | 1.1% | 0.84%(+0.290)#353 | 1.1%(+0.041)#7,992 |
| 13. | 78212 | 1.1% | 0.84%(+0.239)#376 | 1.1%(-0.009)#8,378 |
| 14. | 78240 | 1.1% | 0.84%(+0.233)#379 | 1.1%(-0.015)#8,424 |
| 15. | 78249 | 1.1% | 0.84%(+0.224)#384 | 1.1%(-0.025)#8,502 |
| 16. | 78260 | 0.98% | 0.84%(+0.140)#416 | 1.1%(-0.108)#9,208 |
| 17. | 78214 | 0.98% | 0.84%(+0.138)#419 | 1.1%(-0.110)#9,224 |
| 18. | 78217 | 0.91% | 0.84%(+0.071)#452 | 1.1%(-0.177)#9,832 |
| 19. | 78256 | 0.91% | 0.84%(+0.068)#455 | 1.1%(-0.180)#9,863 |
| 20. | 78216 | 0.91% | 0.84%(+0.064)#457 | 1.1%(-0.185)#9,901 |
| 21. | 78245 | 0.86% | 0.84%(+0.014)#481 | 1.1%(-0.234)#10,418 |
| 22. | 78255 | 0.81% | 0.84%(-0.036)#510 | 1.1%(-0.284)#10,924 |
| 23. | 78266 | 0.74% | 0.84%(-0.098)#544 | 1.1%(-0.346)#11,568 |
| 24. | 78253 | 0.69% | 0.84%(-0.148)#577 | 1.1%(-0.397)#12,106 |
| 25. | 78222 | 0.69% | 0.84%(-0.153)#580 | 1.1%(-0.401)#12,156 |
| 26. | 78257 | 0.68% | 0.84%(-0.160)#587 | 1.1%(-0.408)#12,259 |
| 27. | 78259 | 0.65% | 0.84%(-0.188)#615 | 1.1%(-0.437)#12,610 |
| 28. | 78239 | 0.60% | 0.84%(-0.238)#652 | 1.1%(-0.487)#13,237 |
| 29. | 78210 | 0.59% | 0.84%(-0.248)#660 | 1.1%(-0.497)#13,369 |
| 30. | 78258 | 0.58% | 0.84%(-0.263)#668 | 1.1%(-0.512)#13,556 |
| 31. | 78201 | 0.54% | 0.84%(-0.306)#704 | 1.1%(-0.554)#14,066 |
| 32. | 78250 | 0.51% | 0.84%(-0.332)#719 | 1.1%(-0.580)#14,370 |
| 33. | 78228 | 0.44% | 0.84%(-0.403)#789 | 1.1%(-0.652)#15,273 |
| 34. | 78233 | 0.41% | 0.84%(-0.428)#811 | 1.1%(-0.676)#15,570 |
| 35. | 78232 | 0.40% | 0.84%(-0.446)#827 | 1.1%(-0.694)#15,799 |
| 36. | 78227 | 0.37% | 0.84%(-0.476)#854 | 1.1%(-0.724)#16,180 |
| 37. | 78264 | 0.37% | 0.84%(-0.476)#855 | 1.1%(-0.725)#16,186 |
| 38. | 78223 | 0.36% | 0.84%(-0.487)#864 | 1.1%(-0.735)#16,342 |
| 39. | 78251 | 0.35% | 0.84%(-0.495)#871 | 1.1%(-0.743)#16,430 |
| 40. | 78220 | 0.29% | 0.84%(-0.554)#926 | 1.1%(-0.802)#17,196 |
| 41. | 78203 | 0.26% | 0.84%(-0.580)#943 | 1.1%(-0.828)#17,501 |
| 42. | 78211 | 0.23% | 0.84%(-0.614)#973 | 1.1%(-0.862)#17,876 |
| 43. | 78225 | 0.19% | 0.84%(-0.651)#1,003 | 1.1%(-0.900)#18,289 |
| 44. | 78202 | 0.19% | 0.84%(-0.657)#1,011 | 1.1%(-0.906)#18,349 |
| 45. | 78218 | 0.15% | 0.84%(-0.697)#1,039 | 1.1%(-0.945)#18,715 |
| 46. | 78219 | 0.11% | 0.84%(-0.728)#1,071 | 1.1%(-0.976)#18,974 |
| 47. | 78237 | 0.10% | 0.84%(-0.740)#1,085 | 1.1%(-0.988)#19,060 |
| 48. | 78244 | 0.090% | 0.84%(-0.753)#1,092 | 1.1%(-1.00)#19,133 |
| 49. | 78204 | 0.072% | 0.84%(-0.771)#1,102 | 1.1%(-1.02)#19,239 |
| 50. | 78221 | 0.071% | 0.84%(-0.771)#1,103 | 1.1%(-1.02)#19,241 |
| 51. | 78207 | 0.041% | 0.84%(-0.802)#1,117 | 1.1%(-1.05)#19,365 |
1
Common Questions
What are the Top 10 Zip Codes with the Highest Percentage of Population Employed in Life, Physical & Social Science in San Antonio, TX?
Top 10 Zip Codes with the Highest Percentage of Population Employed in Life, Physical & Social Science in San Antonio, TX are:
What zip code has the Highest Percentage of Population Employed in Life, Physical & Social Science in San Antonio, TX?
78235 has the Highest Percentage of Population Employed in Life, Physical & Social Science in San Antonio, TX with 4.7%.
What is the Percentage of Population Employed in Life, Physical & Social Science in San Antonio, TX?
Percentage of Population Employed in Life, Physical & Social Science in San Antonio is 0.76%.
What is the Percentage of Population Employed in Life, Physical & Social Science in Texas?
Percentage of Population Employed in Life, Physical & Social Science in Texas is 0.84%.
What is the Percentage of Population Employed in Life, Physical & Social Science in the United States?
Percentage of Population Employed in Life, Physical & Social Science in the United States is 1.1%.