Randolph AFB, TX Map & Demographics
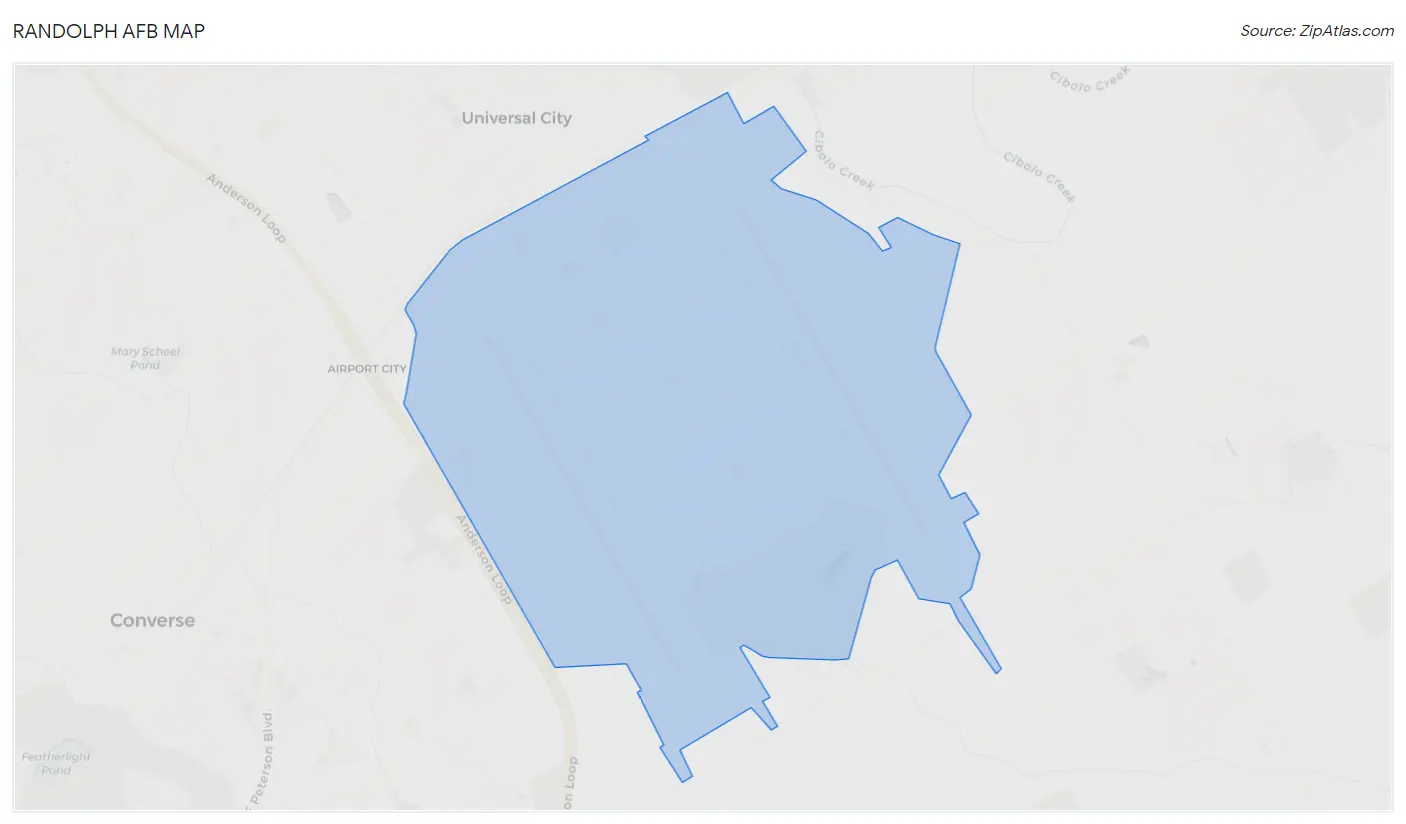
Randolph AFB Map
Randolph AFB Overview
$36,648
PER CAPITA INCOME
$127,875
AVG FAMILY INCOME
$127,625
AVG HOUSEHOLD INCOME
86.6%
WAGE / INCOME GAP [ % ]
13.4¢/ $1
WAGE / INCOME GAP [ $ ]
0.28
INEQUALITY / GINI INDEX
1,195
TOTAL POPULATION
648
MALE POPULATION
547
FEMALE POPULATION
118.46
MALES / 100 FEMALES
84.41
FEMALES / 100 MALES
27.2
MEDIAN AGE
3.6
AVG FAMILY SIZE
3.5
AVG HOUSEHOLD SIZE
571
LABOR FORCE [ PEOPLE ]
71.5%
PERCENT IN LABOR FORCE
13.1%
UNEMPLOYMENT RATE
Randolph AFB Area Codes
Income in Randolph AFB
Income Overview in Randolph AFB
Per Capita Income in Randolph AFB is $36,648, while median incomes of families and households are $127,875 and $127,625 respectively.
| Characteristic | Number | Measure |
| Per Capita Income | 1,195 | $36,648 |
| Median Family Income | 309 | $127,875 |
| Mean Family Income | 309 | $131,750 |
| Median Household Income | 319 | $127,625 |
| Mean Household Income | 319 | $133,346 |
| Income Deficit | 309 | $0 |
| Wage / Income Gap (%) | 1,195 | 86.57% |
| Wage / Income Gap ($) | 1,195 | 13.43¢ per $1 |
| Gini / Inequality Index | 1,195 | 0.28 |
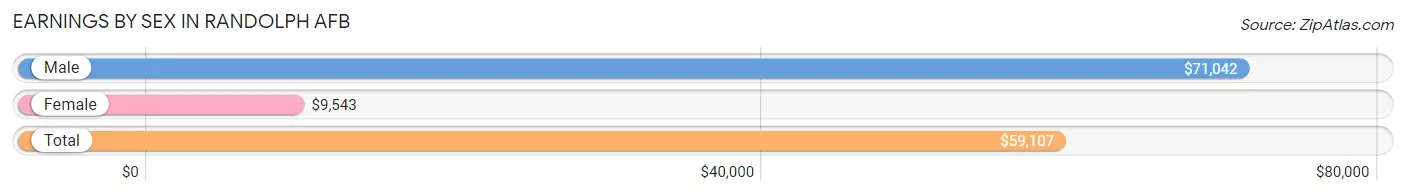
Earnings by Sex in Randolph AFB
Average Earnings in Randolph AFB are $59,107, $71,042 for men and $9,543 for women, a difference of 86.6%.
| Sex | Number | Average Earnings |
| Male | 389 (65.3%) | $71,042 |
| Female | 207 (34.7%) | $9,543 |
| Total | 596 (100.0%) | $59,107 |
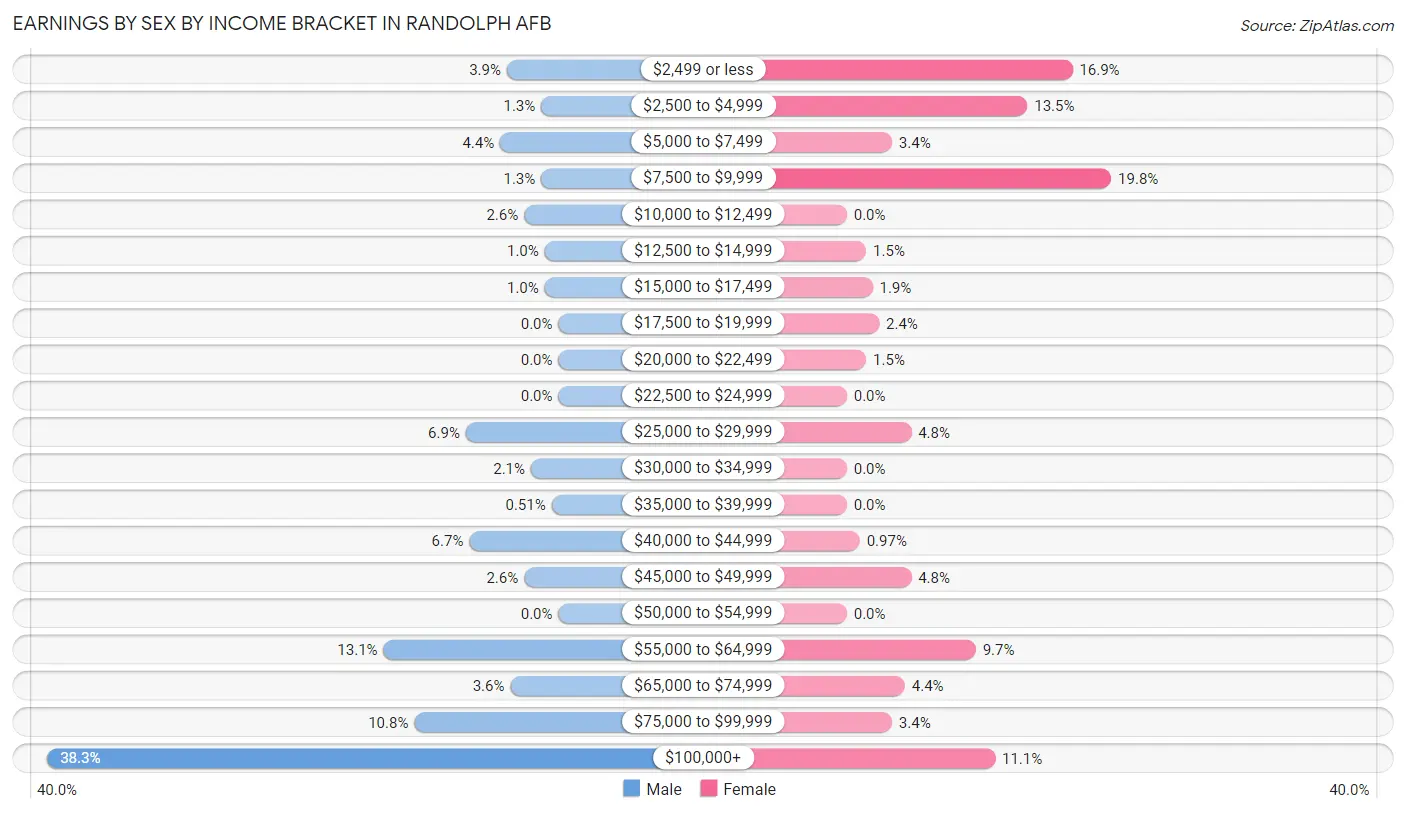
Earnings by Sex by Income Bracket in Randolph AFB
The most common earnings brackets in Randolph AFB are $100,000+ for men (149 | 38.3%) and $7,500 to $9,999 for women (41 | 19.8%).
| Income | Male | Female |
| $2,499 or less | 15 (3.9%) | 35 (16.9%) |
| $2,500 to $4,999 | 5 (1.3%) | 28 (13.5%) |
| $5,000 to $7,499 | 17 (4.4%) | 7 (3.4%) |
| $7,500 to $9,999 | 5 (1.3%) | 41 (19.8%) |
| $10,000 to $12,499 | 10 (2.6%) | 0 (0.0%) |
| $12,500 to $14,999 | 4 (1.0%) | 3 (1.5%) |
| $15,000 to $17,499 | 4 (1.0%) | 4 (1.9%) |
| $17,500 to $19,999 | 0 (0.0%) | 5 (2.4%) |
| $20,000 to $22,499 | 0 (0.0%) | 3 (1.5%) |
| $22,500 to $24,999 | 0 (0.0%) | 0 (0.0%) |
| $25,000 to $29,999 | 27 (6.9%) | 10 (4.8%) |
| $30,000 to $34,999 | 8 (2.1%) | 0 (0.0%) |
| $35,000 to $39,999 | 2 (0.5%) | 0 (0.0%) |
| $40,000 to $44,999 | 26 (6.7%) | 2 (1.0%) |
| $45,000 to $49,999 | 10 (2.6%) | 10 (4.8%) |
| $50,000 to $54,999 | 0 (0.0%) | 0 (0.0%) |
| $55,000 to $64,999 | 51 (13.1%) | 20 (9.7%) |
| $65,000 to $74,999 | 14 (3.6%) | 9 (4.3%) |
| $75,000 to $99,999 | 42 (10.8%) | 7 (3.4%) |
| $100,000+ | 149 (38.3%) | 23 (11.1%) |
| Total | 389 (100.0%) | 207 (100.0%) |
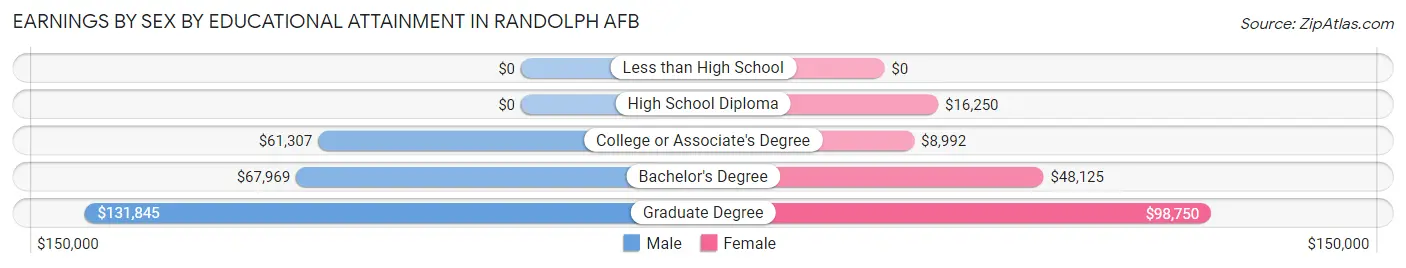
Earnings by Sex by Educational Attainment in Randolph AFB
| Educational Attainment | Male Income | Female Income |
| Less than High School | - | - |
| High School Diploma | - | - |
| College or Associate's Degree | $61,307 | $8,992 |
| Bachelor's Degree | $67,969 | $48,125 |
| Graduate Degree | $131,845 | $98,750 |
| Total | $91,023 | $0 |
Family Income in Randolph AFB
Family Income Brackets in Randolph AFB
According to the Randolph AFB family income data, there are 90 families falling into the $150,000 to $199,999 income range, which is the most common income bracket and makes up 29.1% of all families.
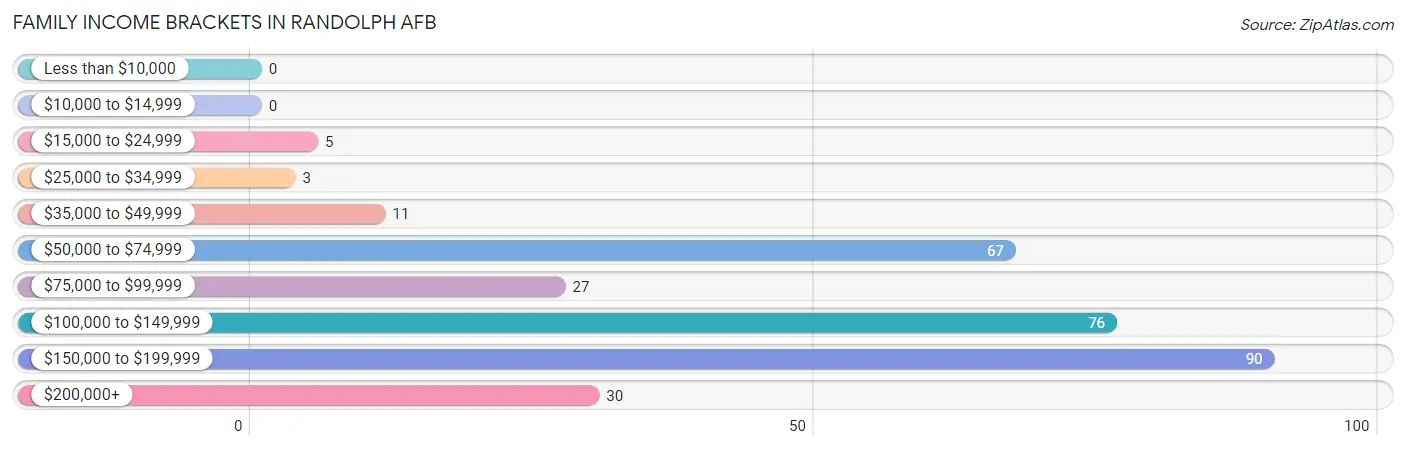
| Income Bracket | # Families | % Families |
| Less than $10,000 | 0 | 0.0% |
| $10,000 to $14,999 | 0 | 0.0% |
| $15,000 to $24,999 | 5 | 1.6% |
| $25,000 to $34,999 | 3 | 1.0% |
| $35,000 to $49,999 | 11 | 3.6% |
| $50,000 to $74,999 | 67 | 21.7% |
| $75,000 to $99,999 | 27 | 8.7% |
| $100,000 to $149,999 | 76 | 24.6% |
| $150,000 to $199,999 | 90 | 29.1% |
| $200,000+ | 30 | 9.7% |
Family Income by Famaliy Size in Randolph AFB
3-person families (74 | 23.9%) account for the highest median family income in Randolph AFB with $171,250 per family, while 3-person families (74 | 23.9%) have the highest median income of $57,083 per family member.
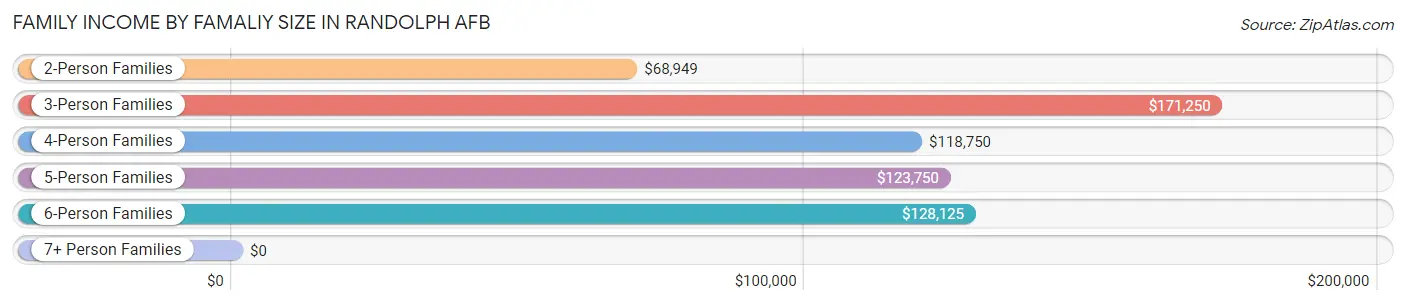
| Income Bracket | # Families | Median Income |
| 2-Person Families | 103 (33.3%) | $68,949 |
| 3-Person Families | 74 (23.9%) | $171,250 |
| 4-Person Families | 57 (18.4%) | $118,750 |
| 5-Person Families | 51 (16.5%) | $123,750 |
| 6-Person Families | 19 (6.1%) | $128,125 |
| 7+ Person Families | 5 (1.6%) | $0 |
| Total | 309 (100.0%) | $127,875 |
Family Income by Number of Earners in Randolph AFB
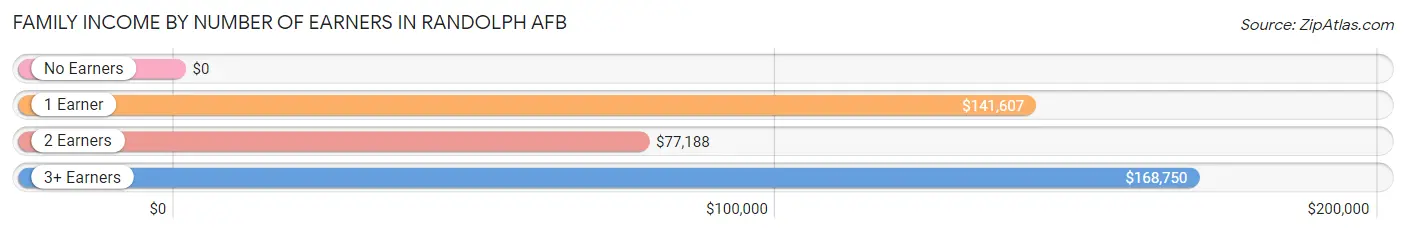
| Number of Earners | # Families | Median Income |
| No Earners | 0 (0.0%) | $0 |
| 1 Earner | 131 (42.4%) | $141,607 |
| 2 Earners | 142 (46.0%) | $77,188 |
| 3+ Earners | 36 (11.7%) | $168,750 |
| Total | 309 (100.0%) | $127,875 |
Household Income in Randolph AFB
Household Income Brackets in Randolph AFB
With 92 households falling in the category, the $150,000 to $199,999 income range is the most frequent in Randolph AFB, accounting for 28.8% of all households.
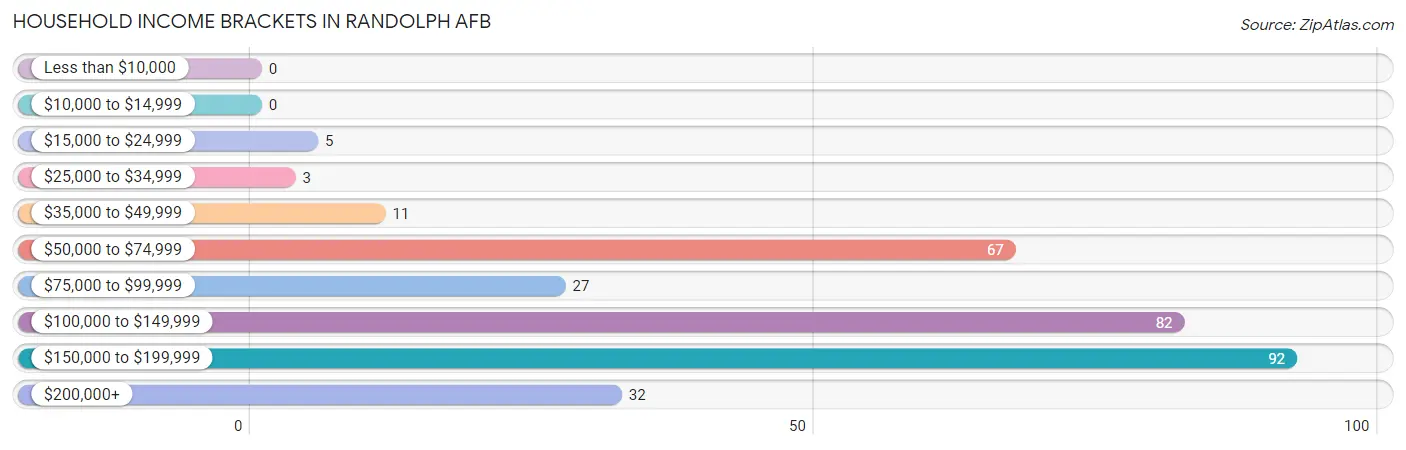
| Income Bracket | # Households | % Households |
| Less than $10,000 | 0 | 0.0% |
| $10,000 to $14,999 | 0 | 0.0% |
| $15,000 to $24,999 | 5 | 1.6% |
| $25,000 to $34,999 | 3 | 0.9% |
| $35,000 to $49,999 | 11 | 3.4% |
| $50,000 to $74,999 | 67 | 21.0% |
| $75,000 to $99,999 | 27 | 8.5% |
| $100,000 to $149,999 | 82 | 25.7% |
| $150,000 to $199,999 | 92 | 28.8% |
| $200,000+ | 32 | 10.0% |
Household Income by Householder Age in Randolph AFB
The median household income in Randolph AFB is $127,625, with the highest median household income of $175,000 found in the 45 to 64 years age bracket for the primary householder. A total of 110 households (34.5%) fall into this category. Meanwhile, the 15 to 24 years age bracket for the primary householder has the lowest median household income of $0, with 10 households (3.1%) in this group.
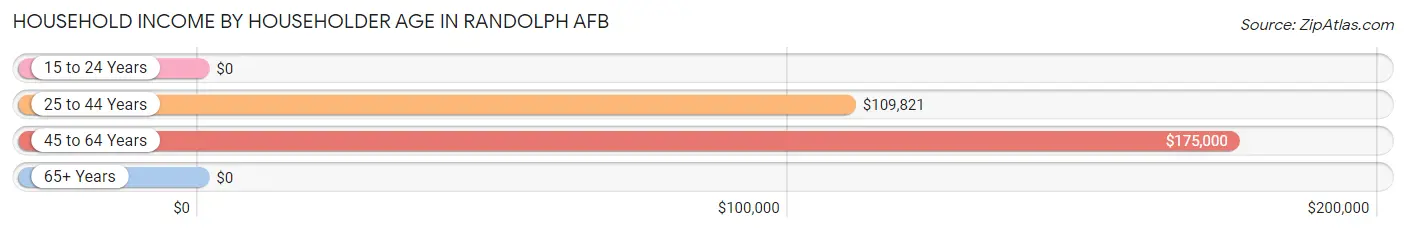
| Income Bracket | # Households | Median Income |
| 15 to 24 Years | 10 (3.1%) | $0 |
| 25 to 44 Years | 199 (62.4%) | $109,821 |
| 45 to 64 Years | 110 (34.5%) | $175,000 |
| 65+ Years | 0 (0.0%) | $0 |
| Total | 319 (100.0%) | $127,625 |
Poverty in Randolph AFB
Income Below Poverty by Sex and Age in Randolph AFB
With 1.4% poverty level for males and 3.3% for females among the residents of Randolph AFB, 12 to 14 year old males and 18 to 24 year old females are the most vulnerable to poverty, with 5 males (11.1%) and 12 females (25.5%) in their respective age groups living below the poverty level.
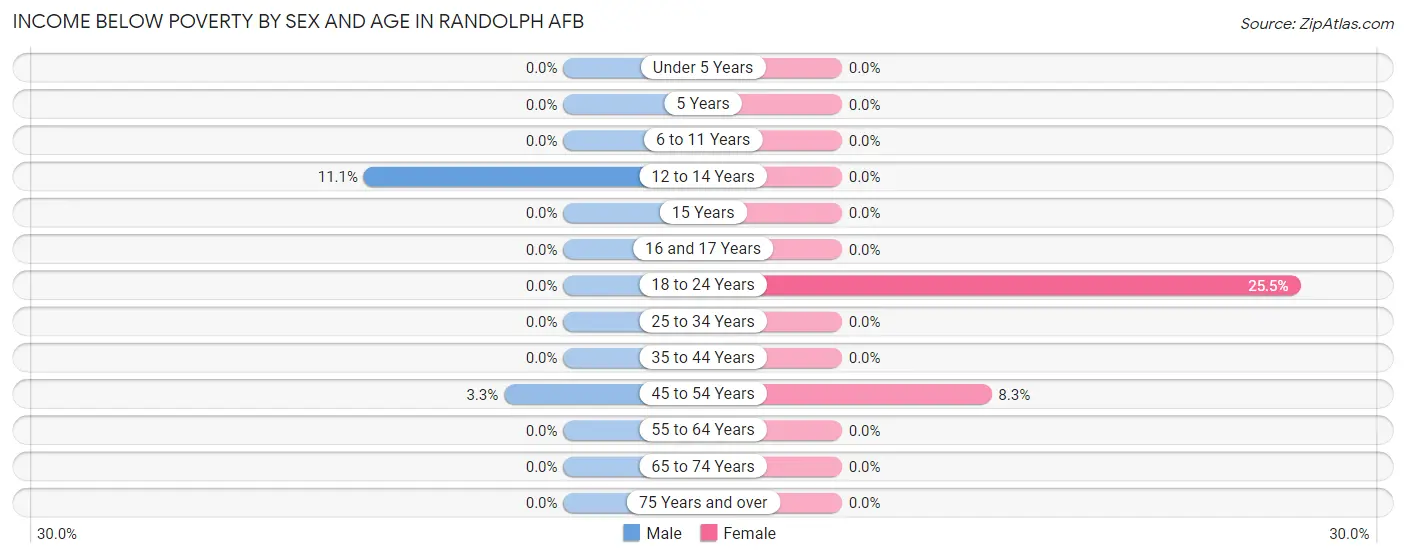
| Age Bracket | Male | Female |
| Under 5 Years | 0 (0.0%) | 0 (0.0%) |
| 5 Years | 0 (0.0%) | 0 (0.0%) |
| 6 to 11 Years | 0 (0.0%) | 0 (0.0%) |
| 12 to 14 Years | 5 (11.1%) | 0 (0.0%) |
| 15 Years | 0 (0.0%) | 0 (0.0%) |
| 16 and 17 Years | 0 (0.0%) | 0 (0.0%) |
| 18 to 24 Years | 0 (0.0%) | 12 (25.5%) |
| 25 to 34 Years | 0 (0.0%) | 0 (0.0%) |
| 35 to 44 Years | 0 (0.0%) | 0 (0.0%) |
| 45 to 54 Years | 3 (3.3%) | 6 (8.3%) |
| 55 to 64 Years | 0 (0.0%) | 0 (0.0%) |
| 65 to 74 Years | 0 (0.0%) | 0 (0.0%) |
| 75 Years and over | 0 (0.0%) | 0 (0.0%) |
| Total | 8 (1.4%) | 18 (3.3%) |
Income Above Poverty by Sex and Age in Randolph AFB
According to the poverty statistics in Randolph AFB, males aged under 5 years and females aged under 5 years are the age groups that are most secure financially, with 100.0% of males and 100.0% of females in these age groups living above the poverty line.
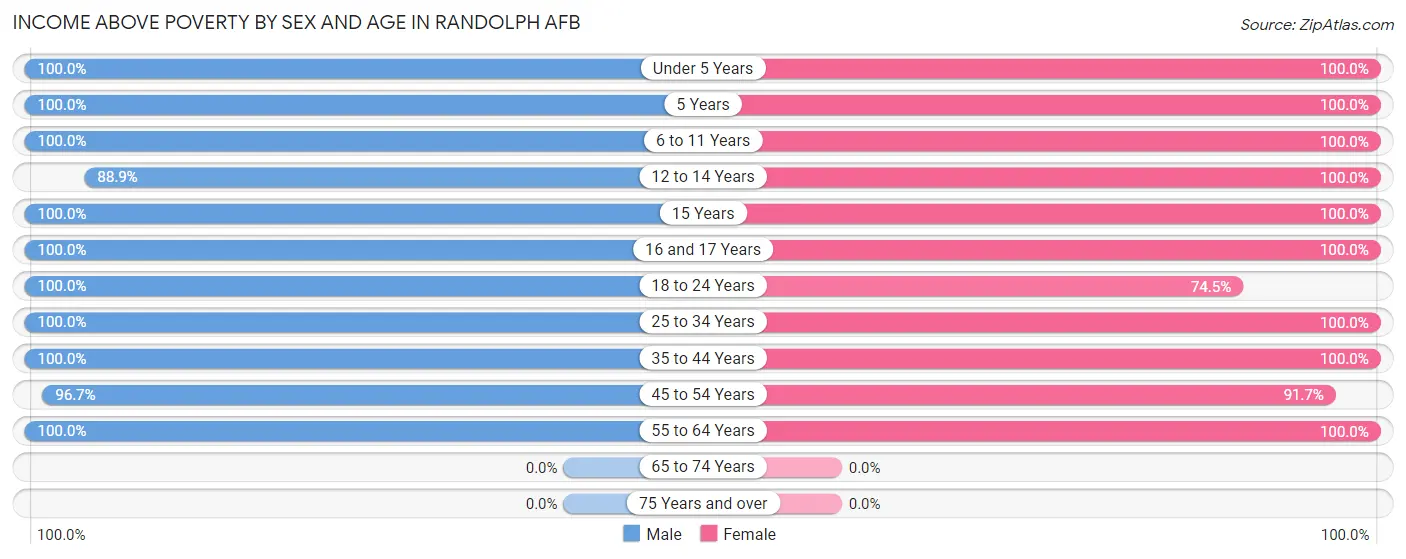
| Age Bracket | Male | Female |
| Under 5 Years | 25 (100.0%) | 58 (100.0%) |
| 5 Years | 17 (100.0%) | 5 (100.0%) |
| 6 to 11 Years | 105 (100.0%) | 84 (100.0%) |
| 12 to 14 Years | 40 (88.9%) | 36 (100.0%) |
| 15 Years | 6 (100.0%) | 15 (100.0%) |
| 16 and 17 Years | 29 (100.0%) | 17 (100.0%) |
| 18 to 24 Years | 44 (100.0%) | 35 (74.5%) |
| 25 to 34 Years | 70 (100.0%) | 25 (100.0%) |
| 35 to 44 Years | 117 (100.0%) | 168 (100.0%) |
| 45 to 54 Years | 88 (96.7%) | 66 (91.7%) |
| 55 to 64 Years | 18 (100.0%) | 20 (100.0%) |
| 65 to 74 Years | 0 (0.0%) | 0 (0.0%) |
| 75 Years and over | 0 (0.0%) | 0 (0.0%) |
| Total | 559 (98.6%) | 529 (96.7%) |
Income Below Poverty Among Married-Couple Families in Randolph AFB
The poverty statistics for married-couple families in Randolph AFB show that 1.0% or 3 of the total 295 families live below the poverty line. Families with 1 or 2 children have the highest poverty rate of 2.4%, comprising of 3 families. On the other hand, families with no children have the lowest poverty rate of 0.0%, which includes 0 families.
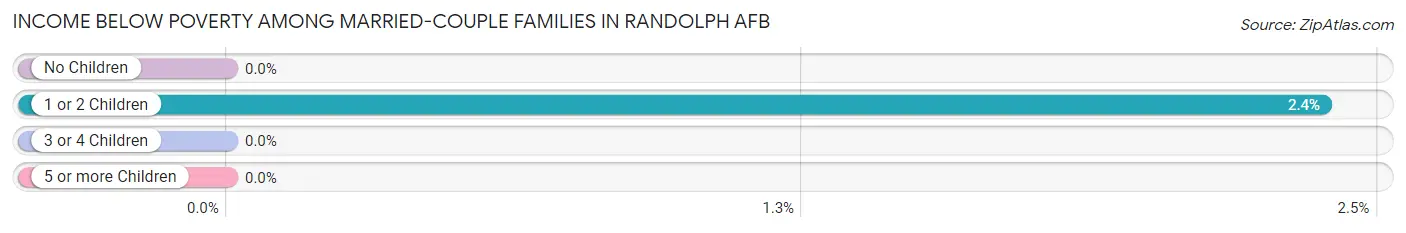
| Children | Above Poverty | Below Poverty |
| No Children | 108 (100.0%) | 0 (0.0%) |
| 1 or 2 Children | 123 (97.6%) | 3 (2.4%) |
| 3 or 4 Children | 56 (100.0%) | 0 (0.0%) |
| 5 or more Children | 5 (100.0%) | 0 (0.0%) |
| Total | 292 (99.0%) | 3 (1.0%) |
Income Below Poverty Among Single-Parent Households in Randolph AFB
| Children | Single Father | Single Mother |
| No Children | 0 (0.0%) | 0 (0.0%) |
| 1 or 2 Children | 0 (0.0%) | 0 (0.0%) |
| 3 or 4 Children | 0 (0.0%) | 0 (0.0%) |
| 5 or more Children | 0 (0.0%) | 0 (0.0%) |
| Total | 0 (0.0%) | 0 (0.0%) |
Income Below Poverty Among Married-Couple vs Single-Parent Households in Randolph AFB
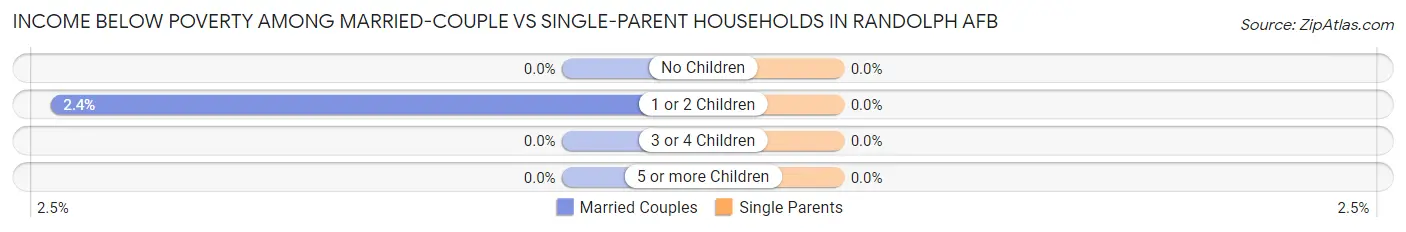
| Children | Married-Couple Families | Single-Parent Households |
| No Children | 0 (0.0%) | 0 (0.0%) |
| 1 or 2 Children | 3 (2.4%) | 0 (0.0%) |
| 3 or 4 Children | 0 (0.0%) | 0 (0.0%) |
| 5 or more Children | 0 (0.0%) | 0 (0.0%) |
| Total | 3 (1.0%) | 0 (0.0%) |
Race in Randolph AFB
The most populous races in Randolph AFB are White / Caucasian (942 | 78.8%), Hispanic or Latino (237 | 19.8%), and Black / African American (104 | 8.7%).
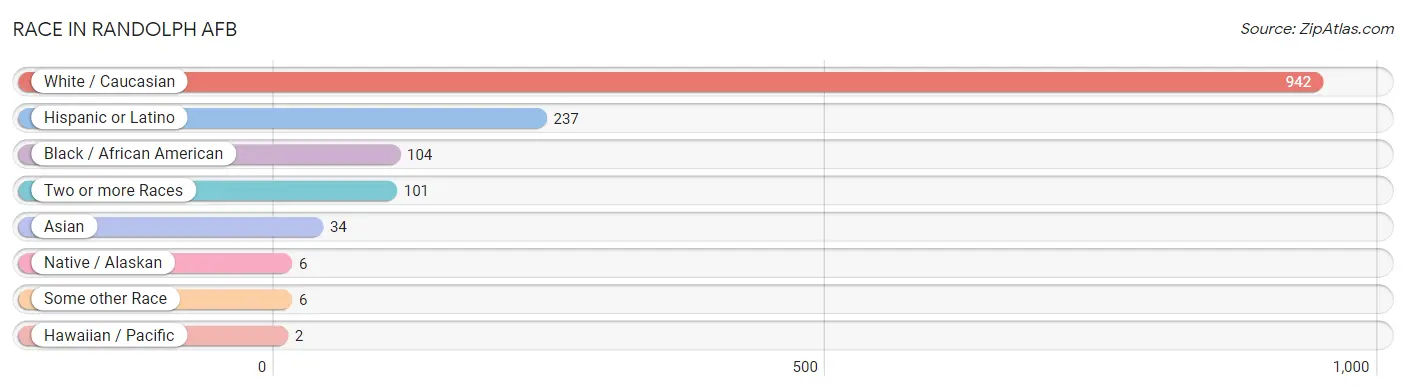
| Race | # Population | % Population |
| Asian | 34 | 2.9% |
| Black / African American | 104 | 8.7% |
| Hawaiian / Pacific | 2 | 0.2% |
| Hispanic or Latino | 237 | 19.8% |
| Native / Alaskan | 6 | 0.5% |
| White / Caucasian | 942 | 78.8% |
| Two or more Races | 101 | 8.5% |
| Some other Race | 6 | 0.5% |
| Total | 1,195 | 100.0% |
Ancestry in Randolph AFB
The most populous ancestries reported in Randolph AFB are German (252 | 21.1%), Irish (160 | 13.4%), Mexican (152 | 12.7%), English (126 | 10.5%), and American (81 | 6.8%), together accounting for 64.5% of all Randolph AFB residents.
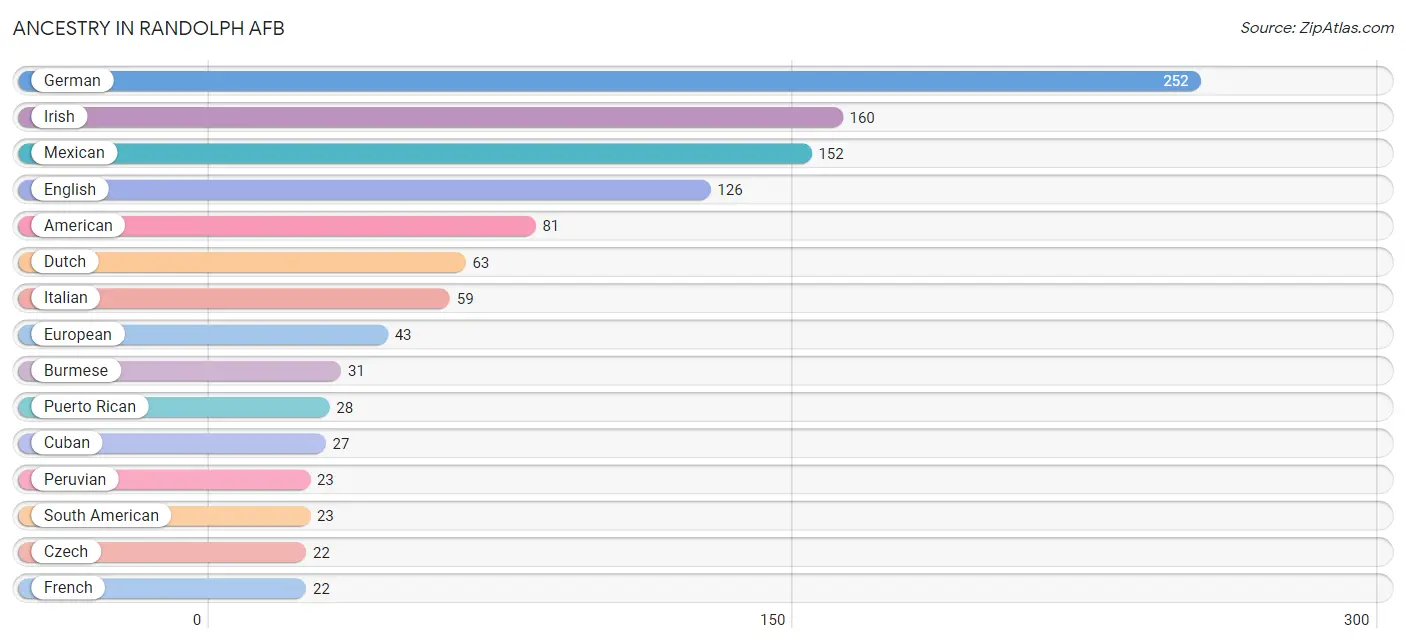
| Ancestry | # Population | % Population |
| American | 81 | 6.8% |
| Apache | 2 | 0.2% |
| Arab | 3 | 0.3% |
| Australian | 3 | 0.3% |
| British | 4 | 0.3% |
| Burmese | 31 | 2.6% |
| Canadian | 6 | 0.5% |
| Chippewa | 5 | 0.4% |
| Cuban | 27 | 2.3% |
| Czech | 22 | 1.8% |
| Dutch | 63 | 5.3% |
| Eastern European | 7 | 0.6% |
| English | 126 | 10.5% |
| European | 43 | 3.6% |
| French | 22 | 1.8% |
| French Canadian | 5 | 0.4% |
| German | 252 | 21.1% |
| Guamanian / Chamorro | 10 | 0.8% |
| Irish | 160 | 13.4% |
| Italian | 59 | 4.9% |
| Korean | 3 | 0.3% |
| Lebanese | 3 | 0.3% |
| Mexican | 152 | 12.7% |
| Mexican American Indian | 22 | 1.8% |
| Norwegian | 8 | 0.7% |
| Peruvian | 23 | 1.9% |
| Polish | 15 | 1.3% |
| Pueblo | 4 | 0.3% |
| Puerto Rican | 28 | 2.3% |
| Scotch-Irish | 17 | 1.4% |
| Scottish | 7 | 0.6% |
| South American | 23 | 1.9% |
| Spaniard | 4 | 0.3% |
| Swedish | 17 | 1.4% |
| Swiss | 12 | 1.0% |
| Ukrainian | 17 | 1.4% |
| Welsh | 17 | 1.4% |
| Yugoslavian | 3 | 0.3% | View All 38 Rows |
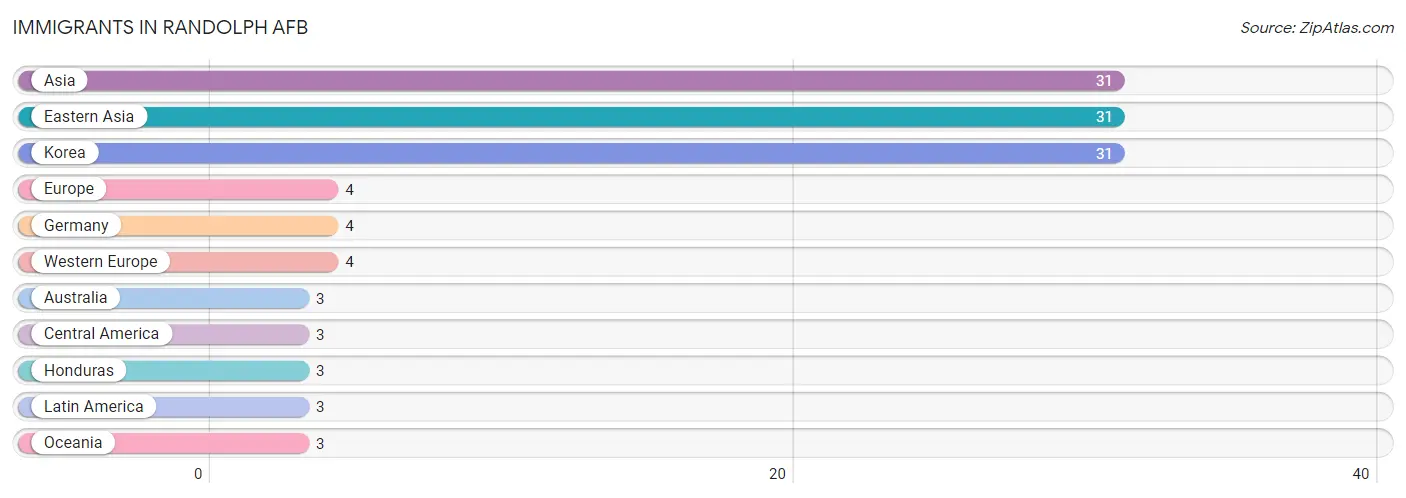
Immigrants in Randolph AFB
The most numerous immigrant groups reported in Randolph AFB came from Asia (31 | 2.6%), Eastern Asia (31 | 2.6%), Korea (31 | 2.6%), Europe (4 | 0.3%), and Germany (4 | 0.3%), together accounting for 8.4% of all Randolph AFB residents.
| Immigration Origin | # Population | % Population |
| Asia | 31 | 2.6% |
| Australia | 3 | 0.3% |
| Central America | 3 | 0.3% |
| Eastern Asia | 31 | 2.6% |
| Europe | 4 | 0.3% |
| Germany | 4 | 0.3% |
| Honduras | 3 | 0.3% |
| Korea | 31 | 2.6% |
| Latin America | 3 | 0.3% |
| Oceania | 3 | 0.3% |
| Western Europe | 4 | 0.3% | View All 11 Rows |
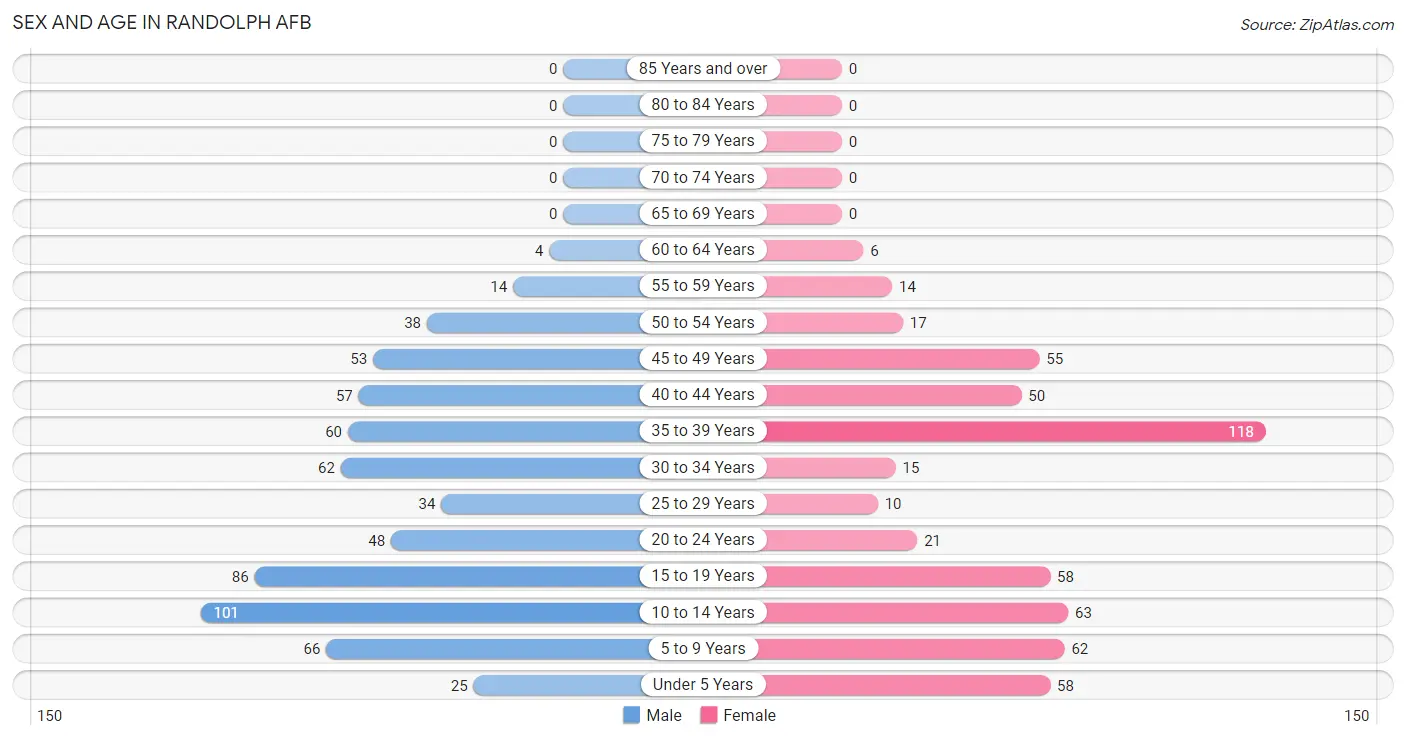
Sex and Age in Randolph AFB
Sex and Age in Randolph AFB
The most populous age groups in Randolph AFB are 10 to 14 Years (101 | 15.6%) for men and 35 to 39 Years (118 | 21.6%) for women.
| Age Bracket | Male | Female |
| Under 5 Years | 25 (3.9%) | 58 (10.6%) |
| 5 to 9 Years | 66 (10.2%) | 62 (11.3%) |
| 10 to 14 Years | 101 (15.6%) | 63 (11.5%) |
| 15 to 19 Years | 86 (13.3%) | 58 (10.6%) |
| 20 to 24 Years | 48 (7.4%) | 21 (3.8%) |
| 25 to 29 Years | 34 (5.2%) | 10 (1.8%) |
| 30 to 34 Years | 62 (9.6%) | 15 (2.7%) |
| 35 to 39 Years | 60 (9.3%) | 118 (21.6%) |
| 40 to 44 Years | 57 (8.8%) | 50 (9.1%) |
| 45 to 49 Years | 53 (8.2%) | 55 (10.1%) |
| 50 to 54 Years | 38 (5.9%) | 17 (3.1%) |
| 55 to 59 Years | 14 (2.2%) | 14 (2.6%) |
| 60 to 64 Years | 4 (0.6%) | 6 (1.1%) |
| 65 to 69 Years | 0 (0.0%) | 0 (0.0%) |
| 70 to 74 Years | 0 (0.0%) | 0 (0.0%) |
| 75 to 79 Years | 0 (0.0%) | 0 (0.0%) |
| 80 to 84 Years | 0 (0.0%) | 0 (0.0%) |
| 85 Years and over | 0 (0.0%) | 0 (0.0%) |
| Total | 648 (100.0%) | 547 (100.0%) |
Families and Households in Randolph AFB
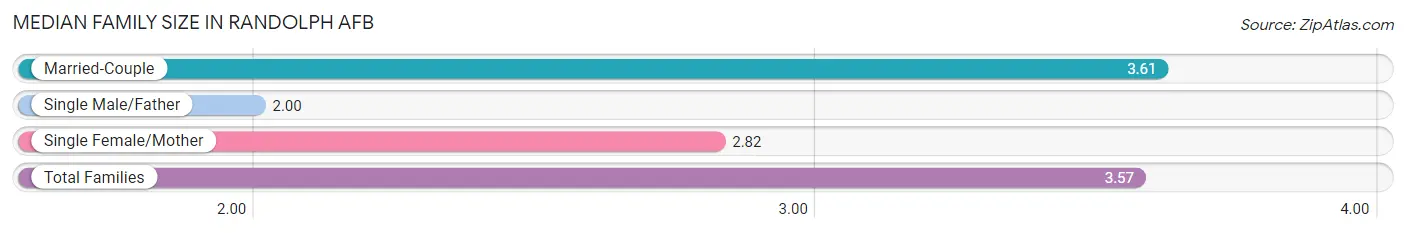
Median Family Size in Randolph AFB
The median family size in Randolph AFB is 3.57 persons per family, with married-couple families (295 | 95.5%) accounting for the largest median family size of 3.61 persons per family. On the other hand, single male/father families (3 | 1.0%) represent the smallest median family size with 2.00 persons per family.
| Family Type | # Families | Family Size |
| Married-Couple | 295 (95.5%) | 3.61 |
| Single Male/Father | 3 (1.0%) | 2.00 |
| Single Female/Mother | 11 (3.6%) | 2.82 |
| Total Families | 309 (100.0%) | 3.57 |
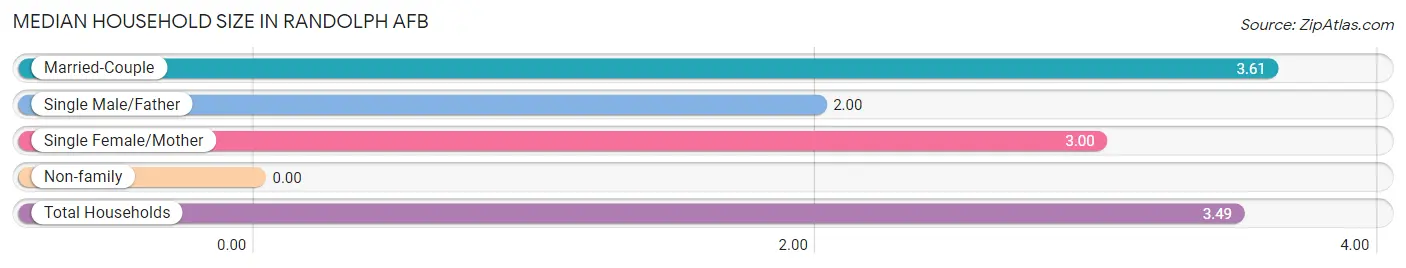
Median Household Size in Randolph AFB
| Household Type | # Households | Household Size |
| Married-Couple | 295 (92.5%) | 3.61 |
| Single Male/Father | 3 (0.9%) | 2.00 |
| Single Female/Mother | 11 (3.5%) | 3.00 |
| Non-family | 10 (3.1%) | - |
| Total Households | 319 (100.0%) | 3.49 |
Household Size by Marriage Status in Randolph AFB
Out of a total of 319 households in Randolph AFB, 309 (96.9%) are family households, while 10 (3.1%) are nonfamily households. The most numerous type of family households are 2-person households, comprising 103, and the most common type of nonfamily households are 1-person households, comprising 10.
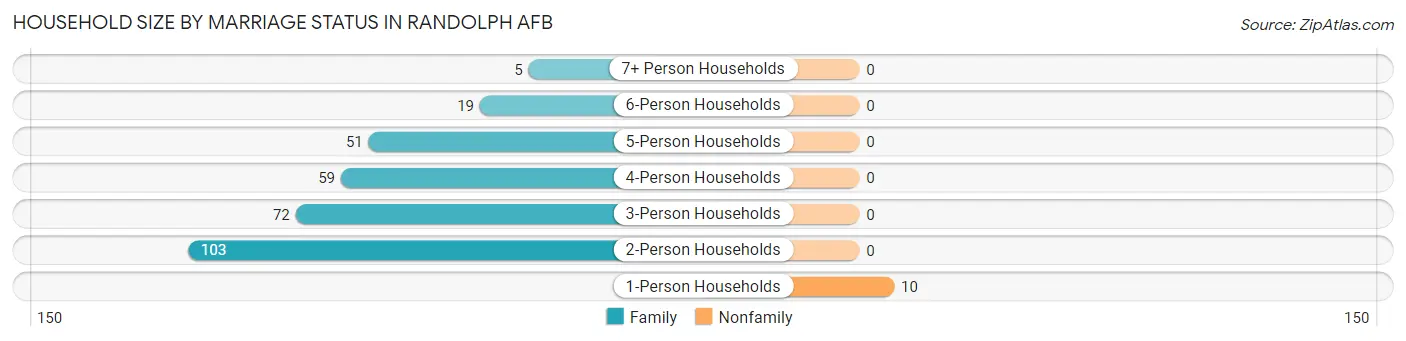
| Household Size | Family Households | Nonfamily Households |
| 1-Person Households | - | 10 (3.1%) |
| 2-Person Households | 103 (32.3%) | 0 (0.0%) |
| 3-Person Households | 72 (22.6%) | 0 (0.0%) |
| 4-Person Households | 59 (18.5%) | 0 (0.0%) |
| 5-Person Households | 51 (16.0%) | 0 (0.0%) |
| 6-Person Households | 19 (6.0%) | 0 (0.0%) |
| 7+ Person Households | 5 (1.6%) | 0 (0.0%) |
| Total | 309 (96.9%) | 10 (3.1%) |
Female Fertility in Randolph AFB
Fertility by Age in Randolph AFB
Average fertility rate in Randolph AFB is 21.0 births per 1,000 women. Women in the age bracket of 20 to 34 years have the highest fertility rate with 65.0 births per 1,000 women. Women in the age bracket of 35 to 50 years acount for 57.1% of all women with births.
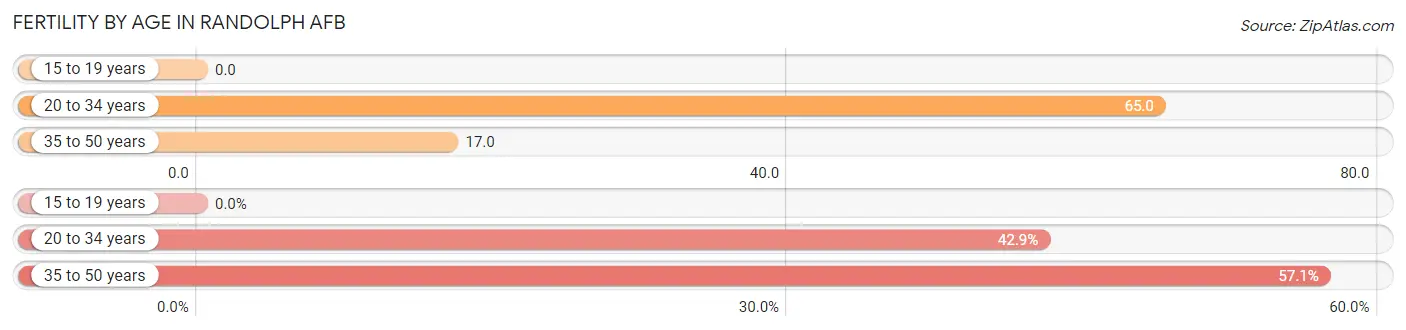
| Age Bracket | Women with Births | Births / 1,000 Women |
| 15 to 19 years | 0 (0.0%) | 0.0 |
| 20 to 34 years | 3 (42.9%) | 65.0 |
| 35 to 50 years | 4 (57.1%) | 17.0 |
| Total | 7 (100.0%) | 21.0 |
Fertility by Age by Marriage Status in Randolph AFB
71.4% of women with births (7) in Randolph AFB are married. The highest percentage of unmarried women with births falls into 35 to 50 years age bracket with 50.0% of them unmarried at the time of birth, while the lowest percentage of unmarried women with births belong to 20 to 34 years age bracket with 0.0% of them unmarried.
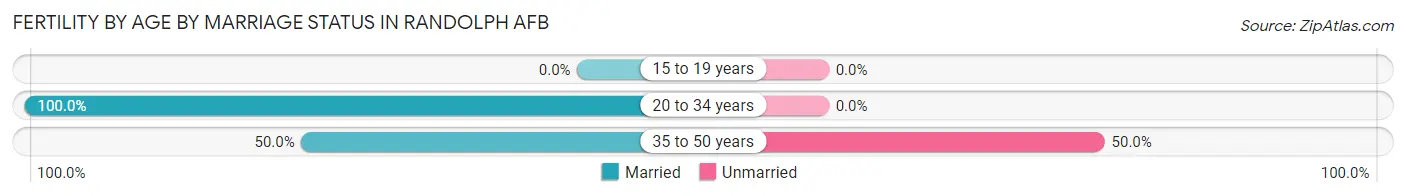
| Age Bracket | Married | Unmarried |
| 15 to 19 years | 0 (0.0%) | 0 (0.0%) |
| 20 to 34 years | 3 (100.0%) | 0 (0.0%) |
| 35 to 50 years | 2 (50.0%) | 2 (50.0%) |
| Total | 5 (71.4%) | 2 (28.6%) |
Fertility by Education in Randolph AFB
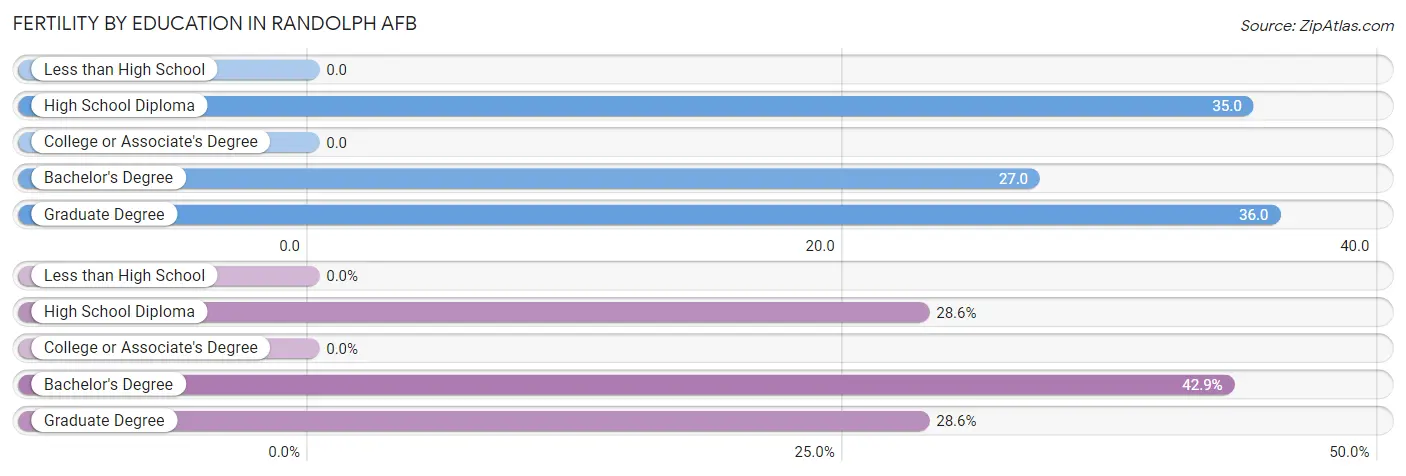
| Educational Attainment | Women with Births | Births / 1,000 Women |
| Less than High School | 0 (0.0%) | 0.0 |
| High School Diploma | 2 (28.6%) | 35.0 |
| College or Associate's Degree | 0 (0.0%) | 0.0 |
| Bachelor's Degree | 3 (42.9%) | 27.0 |
| Graduate Degree | 2 (28.6%) | 36.0 |
| Total | 7 (100.0%) | 21.0 |
Fertility by Education by Marriage Status in Randolph AFB
28.6% of women with births in Randolph AFB are unmarried. Women with the educational attainment of high school diploma are most likely to be married with 100.0% of them married at childbirth, while women with the educational attainment of graduate degree are least likely to be married with 100.0% of them unmarried at childbirth.
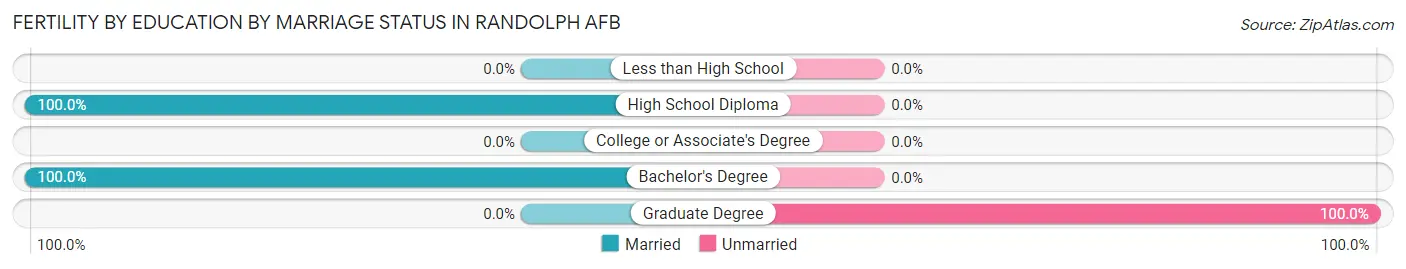
| Educational Attainment | Married | Unmarried |
| Less than High School | 0 (0.0%) | 0 (0.0%) |
| High School Diploma | 2 (100.0%) | 0 (0.0%) |
| College or Associate's Degree | 0 (0.0%) | 0 (0.0%) |
| Bachelor's Degree | 3 (100.0%) | 0 (0.0%) |
| Graduate Degree | 0 (0.0%) | 2 (100.0%) |
| Total | 5 (71.4%) | 2 (28.6%) |
Employment Characteristics in Randolph AFB
Employment by Class of Employer in Randolph AFB
Among the 535 employed individuals in Randolph AFB, federal government employees (383 | 71.6%), private company employees (116 | 21.7%), and not-for-profit organizations (17 | 3.2%) make up the most common classes of employment.
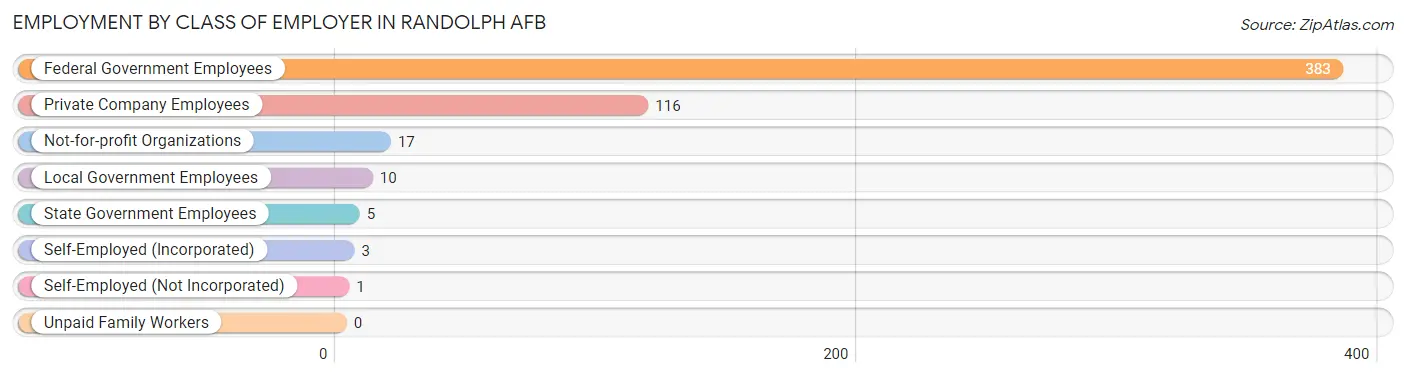
| Employer Class | # Employees | % Employees |
| Private Company Employees | 116 | 21.7% |
| Self-Employed (Incorporated) | 3 | 0.6% |
| Self-Employed (Not Incorporated) | 1 | 0.2% |
| Not-for-profit Organizations | 17 | 3.2% |
| Local Government Employees | 10 | 1.9% |
| State Government Employees | 5 | 0.9% |
| Federal Government Employees | 383 | 71.6% |
| Unpaid Family Workers | 0 | 0.0% |
| Total | 535 | 100.0% |
Employment Status by Age in Randolph AFB
According to the labor force statistics for Randolph AFB, out of the total population over 16 years of age (799), 71.5% or 571 individuals are in the labor force, with 13.1% or 75 of them unemployed. The age group with the highest labor force participation rate is 30 to 34 years, with 92.2% or 71 individuals in the labor force. Within the labor force, the 25 to 29 years age range has the highest percentage of unemployed individuals, with 100.0% or 40 of them being unemployed.
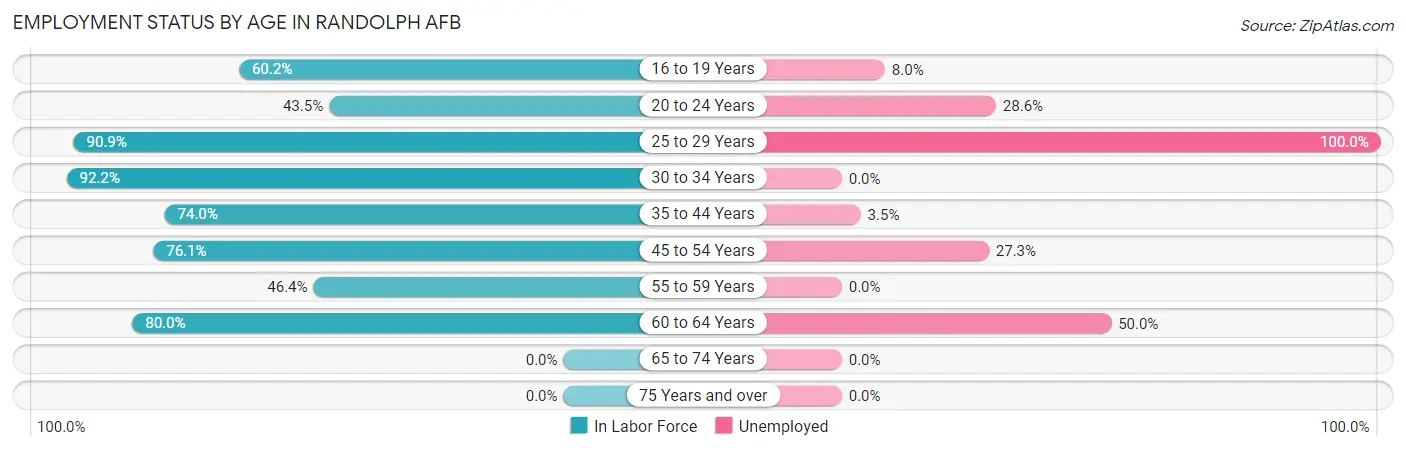
| Age Bracket | In Labor Force | Unemployed |
| 16 to 19 Years | 74 (60.2%) | 6 (8.0%) |
| 20 to 24 Years | 30 (43.5%) | 9 (28.6%) |
| 25 to 29 Years | 40 (90.9%) | 40 (100.0%) |
| 30 to 34 Years | 71 (92.2%) | 0 (0.0%) |
| 35 to 44 Years | 211 (74.0%) | 7 (3.5%) |
| 45 to 54 Years | 124 (76.1%) | 34 (27.3%) |
| 55 to 59 Years | 13 (46.4%) | 0 (0.0%) |
| 60 to 64 Years | 8 (80.0%) | 4 (50.0%) |
| 65 to 74 Years | 0 (0.0%) | 0 (0.0%) |
| 75 Years and over | 0 (0.0%) | 0 (0.0%) |
| Total | 571 (71.5%) | 75 (13.1%) |
Employment Status by Educational Attainment in Randolph AFB
According to labor force statistics for Randolph AFB, 76.9% of individuals (467) out of the total population between 25 and 64 years of age (607) are in the labor force, with 12.8% or 60 of them being unemployed. The group with the highest labor force participation rate are those with the educational attainment of college / associate degree, with 81.2% or 121 individuals in the labor force. Within the labor force, individuals with high school diploma education have the highest percentage of unemployment, with 21.1% or 4 of them being unemployed.
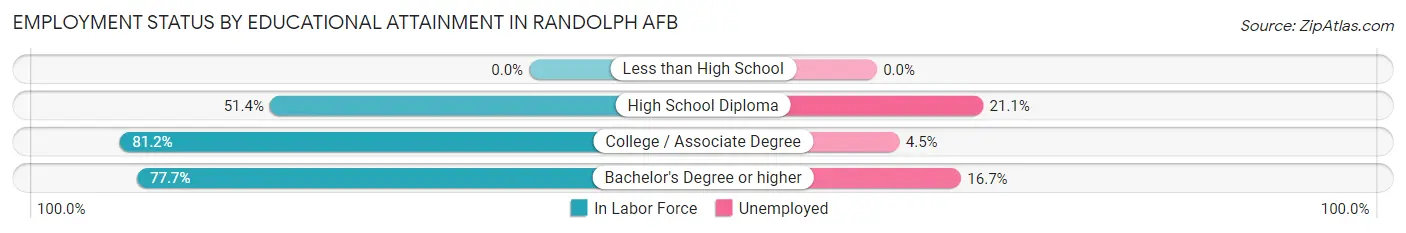
| Educational Attainment | In Labor Force | Unemployed |
| Less than High School | 0 (0.0%) | 0 (0.0%) |
| High School Diploma | 19 (51.4%) | 8 (21.1%) |
| College / Associate Degree | 121 (81.2%) | 7 (4.5%) |
| Bachelor's Degree or higher | 327 (77.7%) | 70 (16.7%) |
| Total | 467 (76.9%) | 78 (12.8%) |
Employment Occupations by Sex in Randolph AFB
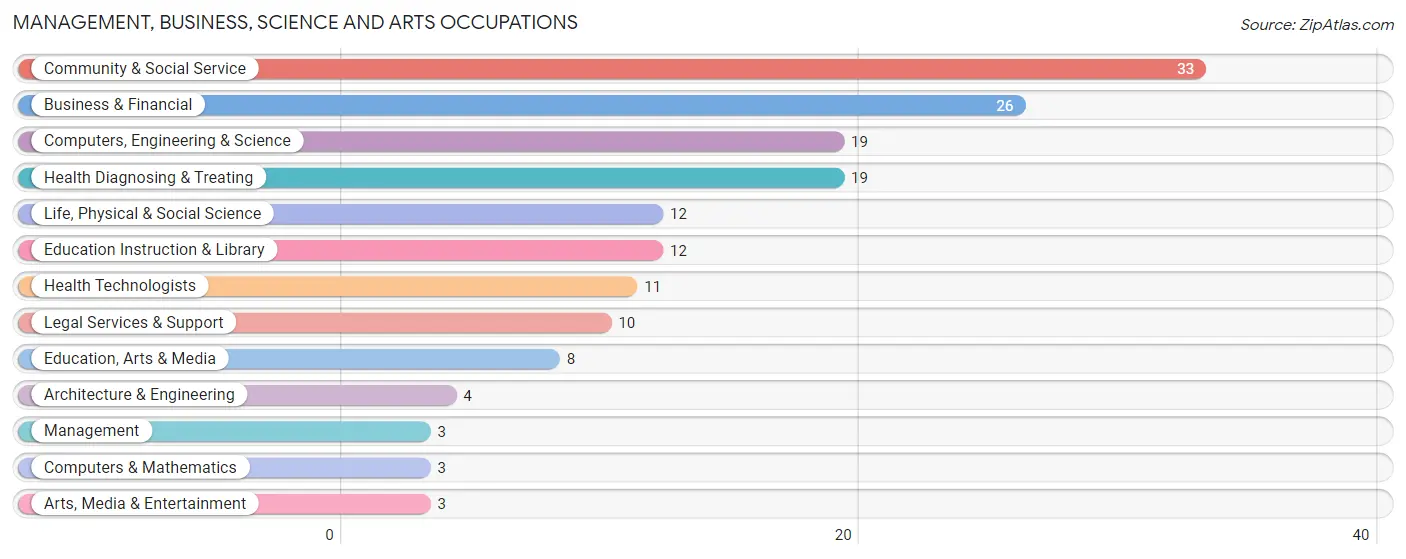
Management, Business, Science and Arts Occupations
The most common Management, Business, Science and Arts occupations in Randolph AFB are Community & Social Service (33 | 14.7%), Business & Financial (26 | 11.6%), Computers, Engineering & Science (19 | 8.4%), Health Diagnosing & Treating (19 | 8.4%), and Life, Physical & Social Science (12 | 5.3%).
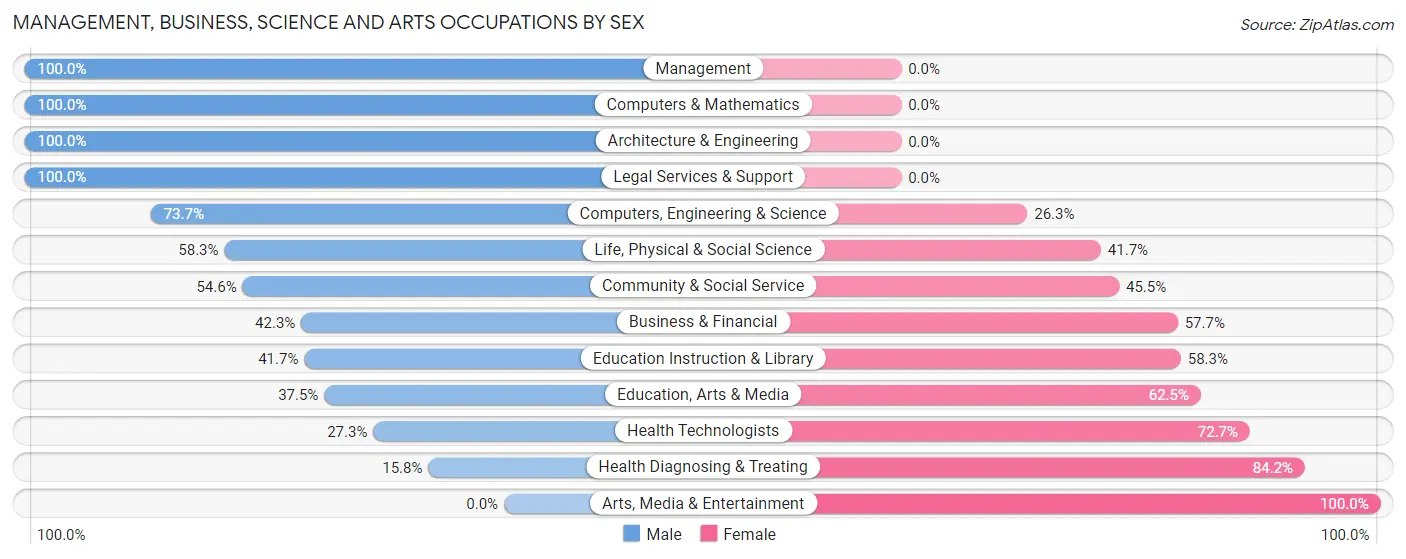
Management, Business, Science and Arts Occupations by Sex
Within the Management, Business, Science and Arts occupations in Randolph AFB, the most male-oriented occupations are Management (100.0%), Computers & Mathematics (100.0%), and Architecture & Engineering (100.0%), while the most female-oriented occupations are Arts, Media & Entertainment (100.0%), Health Diagnosing & Treating (84.2%), and Health Technologists (72.7%).
| Occupation | Male | Female |
| Management | 3 (100.0%) | 0 (0.0%) |
| Business & Financial | 11 (42.3%) | 15 (57.7%) |
| Computers, Engineering & Science | 14 (73.7%) | 5 (26.3%) |
| Computers & Mathematics | 3 (100.0%) | 0 (0.0%) |
| Architecture & Engineering | 4 (100.0%) | 0 (0.0%) |
| Life, Physical & Social Science | 7 (58.3%) | 5 (41.7%) |
| Community & Social Service | 18 (54.5%) | 15 (45.5%) |
| Education, Arts & Media | 3 (37.5%) | 5 (62.5%) |
| Legal Services & Support | 10 (100.0%) | 0 (0.0%) |
| Education Instruction & Library | 5 (41.7%) | 7 (58.3%) |
| Arts, Media & Entertainment | 0 (0.0%) | 3 (100.0%) |
| Health Diagnosing & Treating | 3 (15.8%) | 16 (84.2%) |
| Health Technologists | 3 (27.3%) | 8 (72.7%) |
| Total (Category) | 49 (49.0%) | 51 (51.0%) |
| Total (Overall) | 81 (36.0%) | 144 (64.0%) |
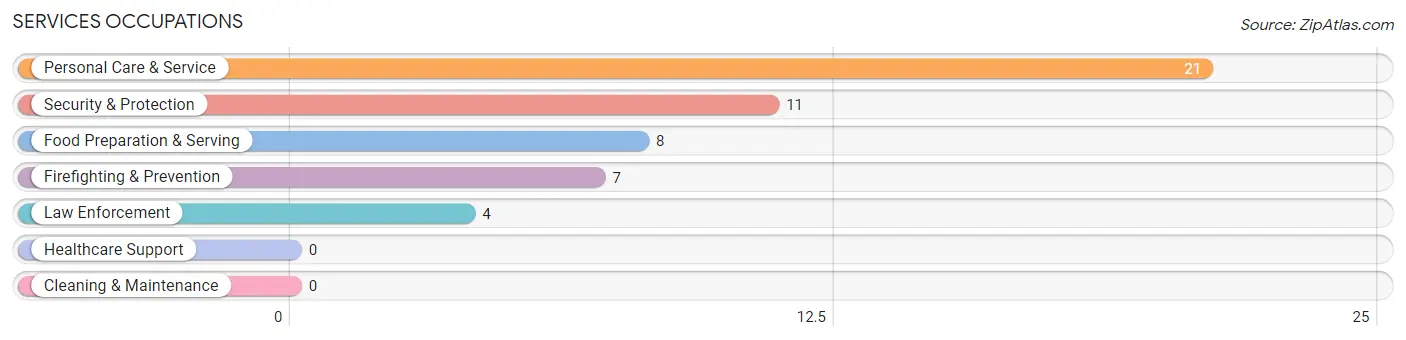
Services Occupations
The most common Services occupations in Randolph AFB are Personal Care & Service (21 | 9.3%), Security & Protection (11 | 4.9%), Food Preparation & Serving (8 | 3.6%), Firefighting & Prevention (7 | 3.1%), and Law Enforcement (4 | 1.8%).
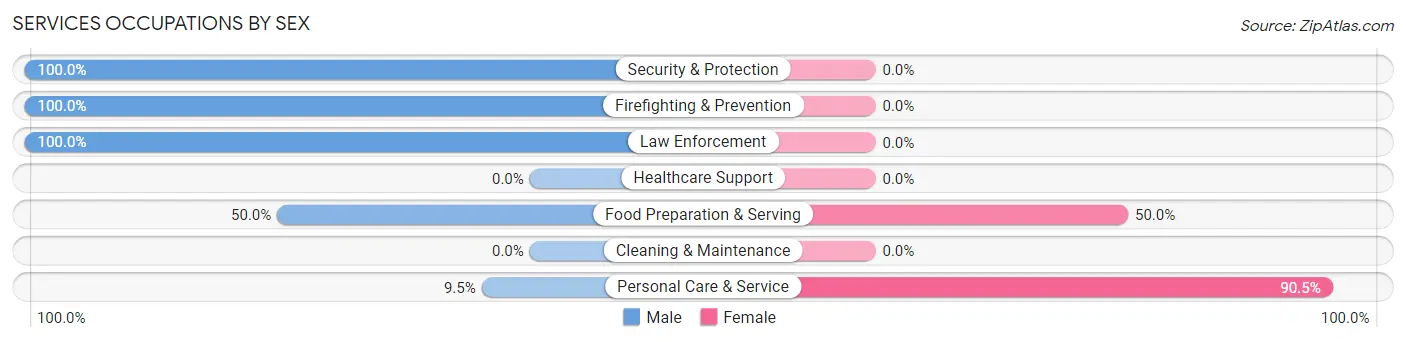
Services Occupations by Sex
Within the Services occupations in Randolph AFB, the most male-oriented occupations are Security & Protection (100.0%), Firefighting & Prevention (100.0%), and Law Enforcement (100.0%), while the most female-oriented occupations are Personal Care & Service (90.5%), and Food Preparation & Serving (50.0%).
| Occupation | Male | Female |
| Healthcare Support | 0 (0.0%) | 0 (0.0%) |
| Security & Protection | 11 (100.0%) | 0 (0.0%) |
| Firefighting & Prevention | 7 (100.0%) | 0 (0.0%) |
| Law Enforcement | 4 (100.0%) | 0 (0.0%) |
| Food Preparation & Serving | 4 (50.0%) | 4 (50.0%) |
| Cleaning & Maintenance | 0 (0.0%) | 0 (0.0%) |
| Personal Care & Service | 2 (9.5%) | 19 (90.5%) |
| Total (Category) | 17 (42.5%) | 23 (57.5%) |
| Total (Overall) | 81 (36.0%) | 144 (64.0%) |
Sales and Office Occupations
The most common Sales and Office occupations in Randolph AFB are Sales & Related (58 | 25.8%), and Office & Administration (7 | 3.1%).
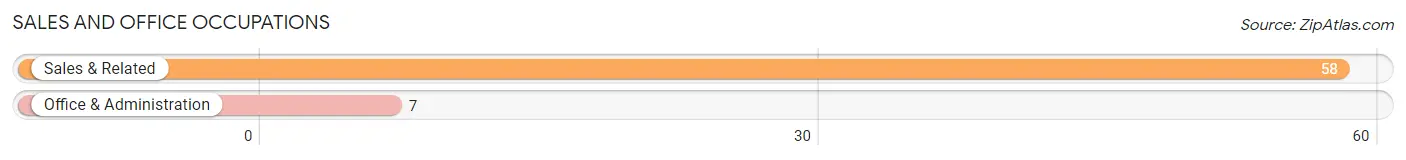
Sales and Office Occupations by Sex
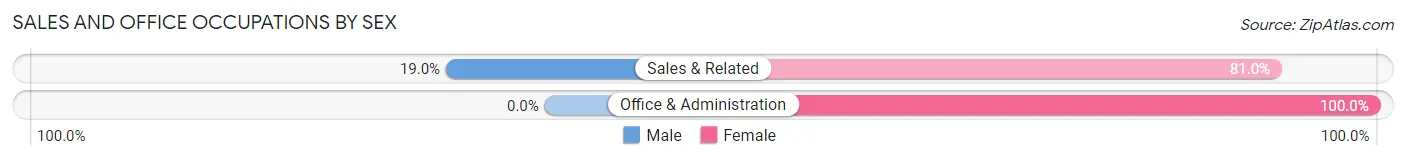
| Occupation | Male | Female |
| Sales & Related | 11 (19.0%) | 47 (81.0%) |
| Office & Administration | 0 (0.0%) | 7 (100.0%) |
| Total (Category) | 11 (16.9%) | 54 (83.1%) |
| Total (Overall) | 81 (36.0%) | 144 (64.0%) |
Natural Resources, Construction and Maintenance Occupations
The most common Natural Resources, Construction and Maintenance occupations in Randolph AFB are , and Construction & Extraction (5 | 2.2%).
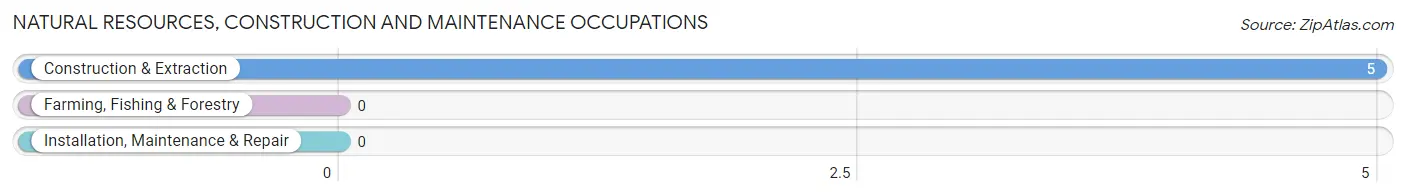
Natural Resources, Construction and Maintenance Occupations by Sex
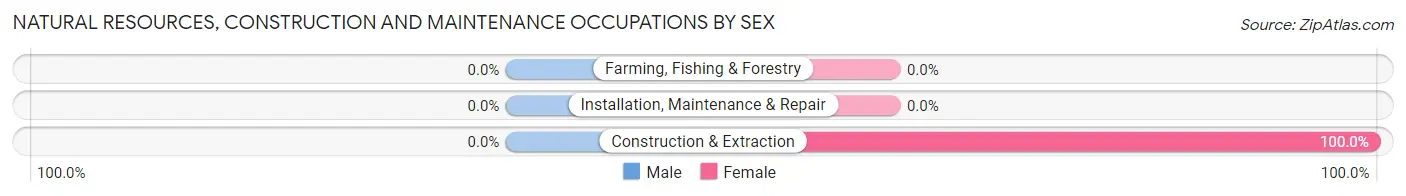
| Occupation | Male | Female |
| Farming, Fishing & Forestry | 0 (0.0%) | 0 (0.0%) |
| Construction & Extraction | 0 (0.0%) | 5 (100.0%) |
| Installation, Maintenance & Repair | 0 (0.0%) | 0 (0.0%) |
| Total (Category) | 0 (0.0%) | 5 (100.0%) |
| Total (Overall) | 81 (36.0%) | 144 (64.0%) |
Production, Transportation and Moving Occupations
The most common Production, Transportation and Moving occupations in Randolph AFB are Material Moving (13 | 5.8%), and Transportation (2 | 0.9%).
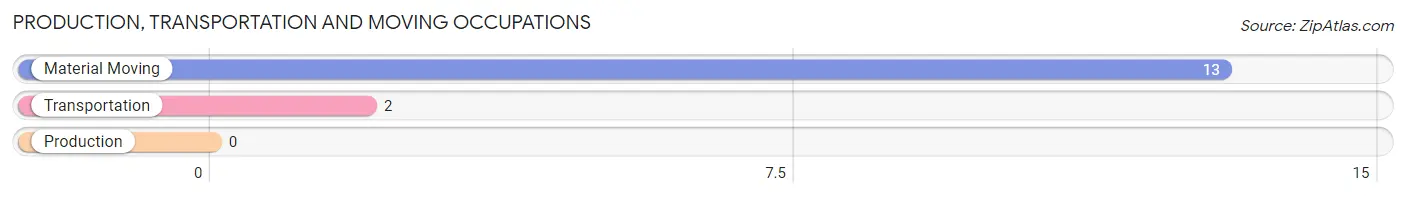
Production, Transportation and Moving Occupations by Sex
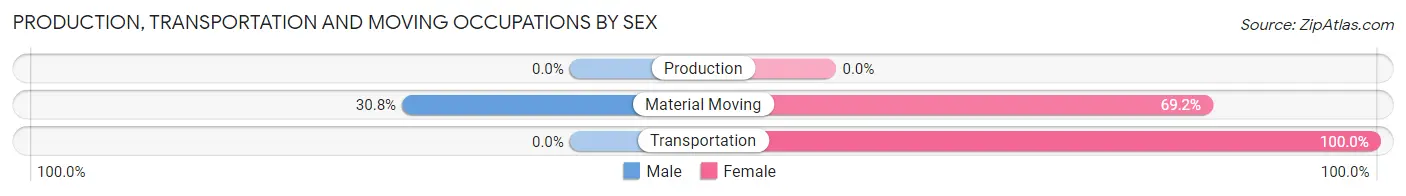
| Occupation | Male | Female |
| Production | 0 (0.0%) | 0 (0.0%) |
| Transportation | 0 (0.0%) | 2 (100.0%) |
| Material Moving | 4 (30.8%) | 9 (69.2%) |
| Total (Category) | 4 (26.7%) | 11 (73.3%) |
| Total (Overall) | 81 (36.0%) | 144 (64.0%) |
Employment Industries by Sex in Randolph AFB
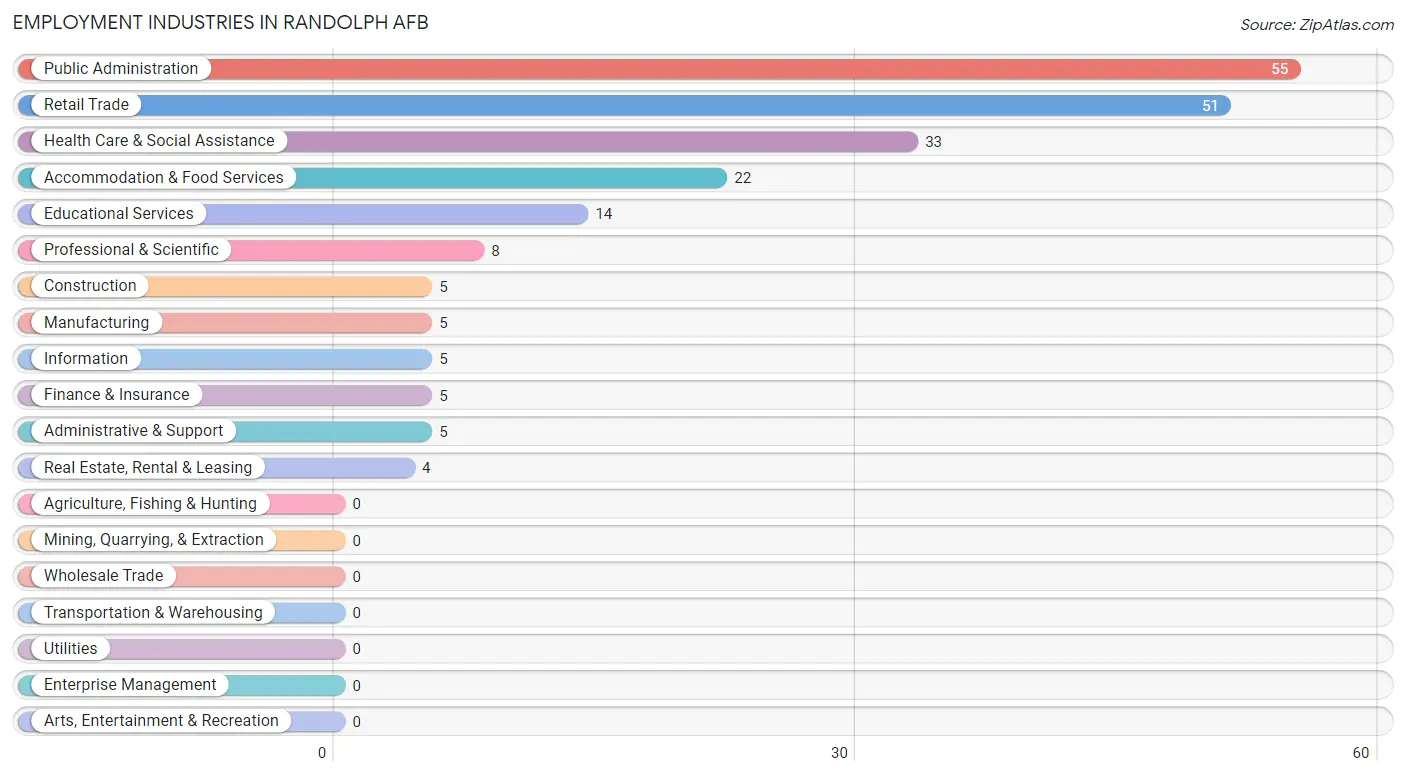
Employment Industries in Randolph AFB
The major employment industries in Randolph AFB include Public Administration (55 | 24.4%), Retail Trade (51 | 22.7%), Health Care & Social Assistance (33 | 14.7%), Accommodation & Food Services (22 | 9.8%), and Educational Services (14 | 6.2%).
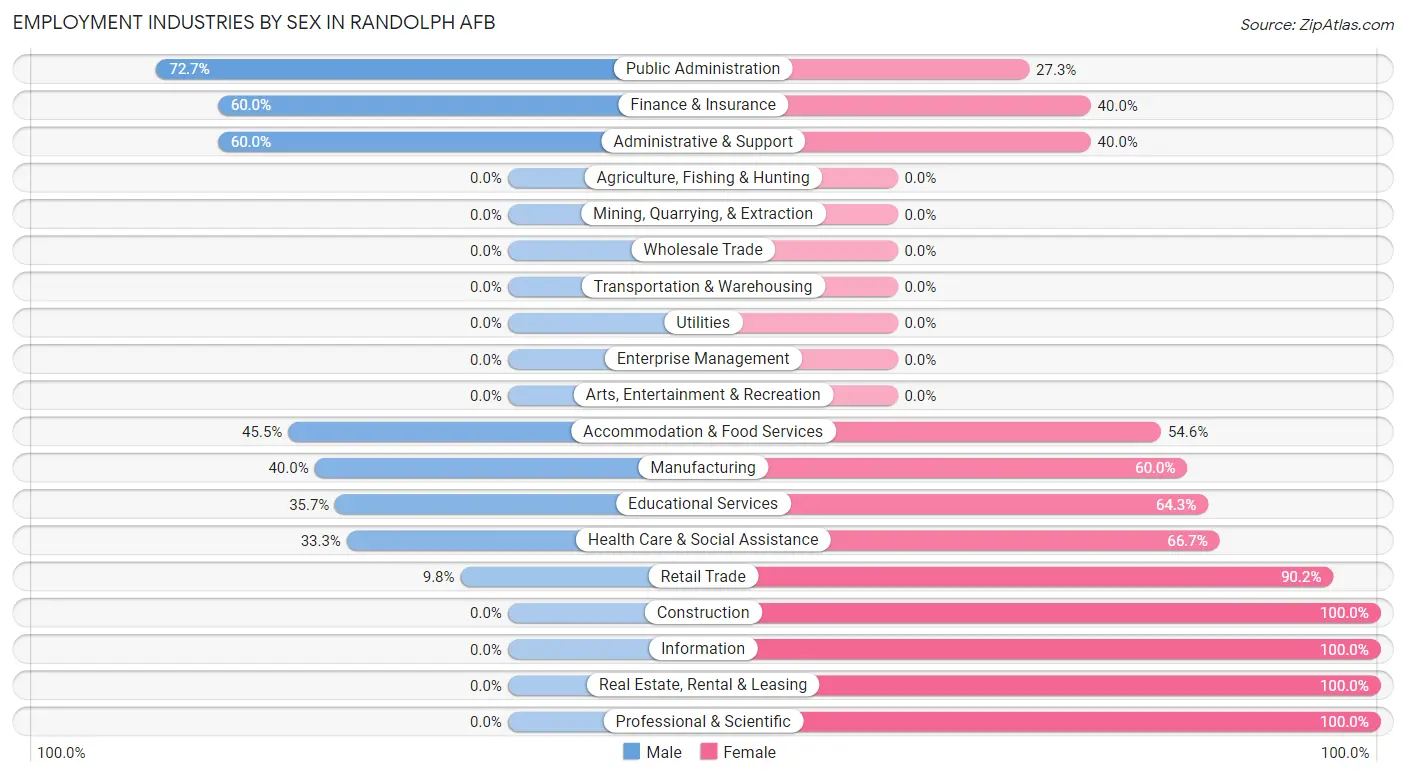
Employment Industries by Sex in Randolph AFB
The Randolph AFB industries that see more men than women are Public Administration (72.7%), Finance & Insurance (60.0%), and Administrative & Support (60.0%), whereas the industries that tend to have a higher number of women are Construction (100.0%), Information (100.0%), and Real Estate, Rental & Leasing (100.0%).
| Industry | Male | Female |
| Agriculture, Fishing & Hunting | 0 (0.0%) | 0 (0.0%) |
| Mining, Quarrying, & Extraction | 0 (0.0%) | 0 (0.0%) |
| Construction | 0 (0.0%) | 5 (100.0%) |
| Manufacturing | 2 (40.0%) | 3 (60.0%) |
| Wholesale Trade | 0 (0.0%) | 0 (0.0%) |
| Retail Trade | 5 (9.8%) | 46 (90.2%) |
| Transportation & Warehousing | 0 (0.0%) | 0 (0.0%) |
| Utilities | 0 (0.0%) | 0 (0.0%) |
| Information | 0 (0.0%) | 5 (100.0%) |
| Finance & Insurance | 3 (60.0%) | 2 (40.0%) |
| Real Estate, Rental & Leasing | 0 (0.0%) | 4 (100.0%) |
| Professional & Scientific | 0 (0.0%) | 8 (100.0%) |
| Enterprise Management | 0 (0.0%) | 0 (0.0%) |
| Administrative & Support | 3 (60.0%) | 2 (40.0%) |
| Educational Services | 5 (35.7%) | 9 (64.3%) |
| Health Care & Social Assistance | 11 (33.3%) | 22 (66.7%) |
| Arts, Entertainment & Recreation | 0 (0.0%) | 0 (0.0%) |
| Accommodation & Food Services | 10 (45.5%) | 12 (54.5%) |
| Public Administration | 40 (72.7%) | 15 (27.3%) |
| Total | 81 (36.0%) | 144 (64.0%) |
Education in Randolph AFB
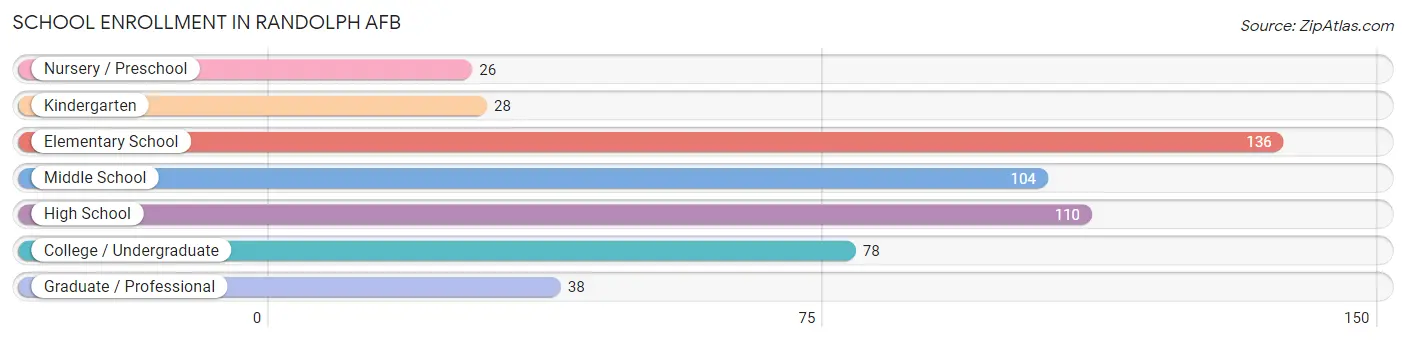
School Enrollment in Randolph AFB
The most common levels of schooling among the 520 students in Randolph AFB are elementary school (136 | 26.2%), high school (110 | 21.1%), and middle school (104 | 20.0%).
| School Level | # Students | % Students |
| Nursery / Preschool | 26 | 5.0% |
| Kindergarten | 28 | 5.4% |
| Elementary School | 136 | 26.2% |
| Middle School | 104 | 20.0% |
| High School | 110 | 21.1% |
| College / Undergraduate | 78 | 15.0% |
| Graduate / Professional | 38 | 7.3% |
| Total | 520 | 100.0% |
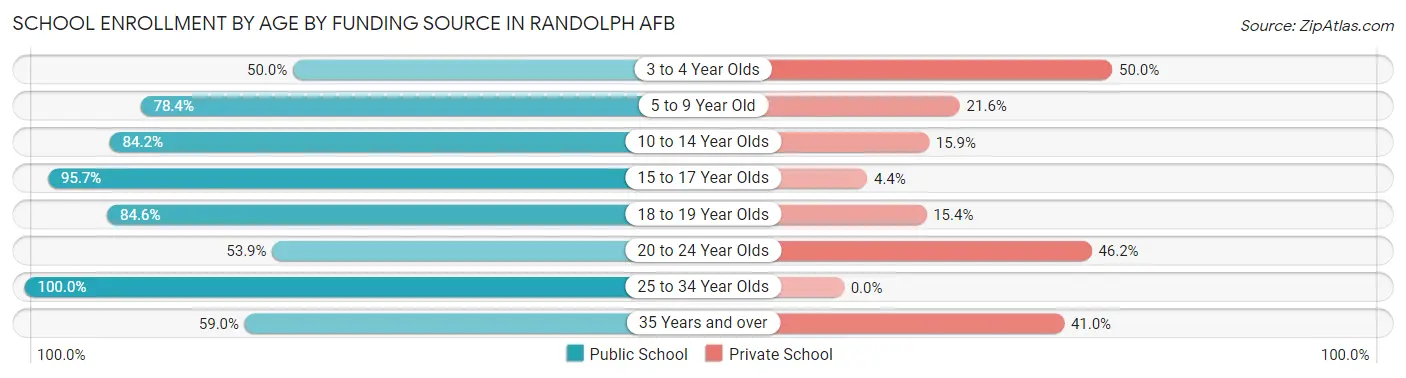
School Enrollment by Age by Funding Source in Randolph AFB
Out of a total of 520 students who are enrolled in schools in Randolph AFB, 94 (18.1%) attend a private institution, while the remaining 426 (81.9%) are enrolled in public schools. The age group of 3 to 4 year olds has the highest likelihood of being enrolled in private schools, with 10 (50.0% in the age bracket) enrolled. Conversely, the age group of 25 to 34 year olds has the lowest likelihood of being enrolled in a private school, with 51 (100.0% in the age bracket) attending a public institution.
| Age Bracket | Public School | Private School |
| 3 to 4 Year Olds | 10 (50.0%) | 10 (50.0%) |
| 5 to 9 Year Old | 98 (78.4%) | 27 (21.6%) |
| 10 to 14 Year Olds | 138 (84.2%) | 26 (15.9%) |
| 15 to 17 Year Olds | 66 (95.7%) | 3 (4.3%) |
| 18 to 19 Year Olds | 33 (84.6%) | 6 (15.4%) |
| 20 to 24 Year Olds | 7 (53.8%) | 6 (46.2%) |
| 25 to 34 Year Olds | 51 (100.0%) | 0 (0.0%) |
| 35 Years and over | 23 (59.0%) | 16 (41.0%) |
| Total | 426 (81.9%) | 94 (18.1%) |
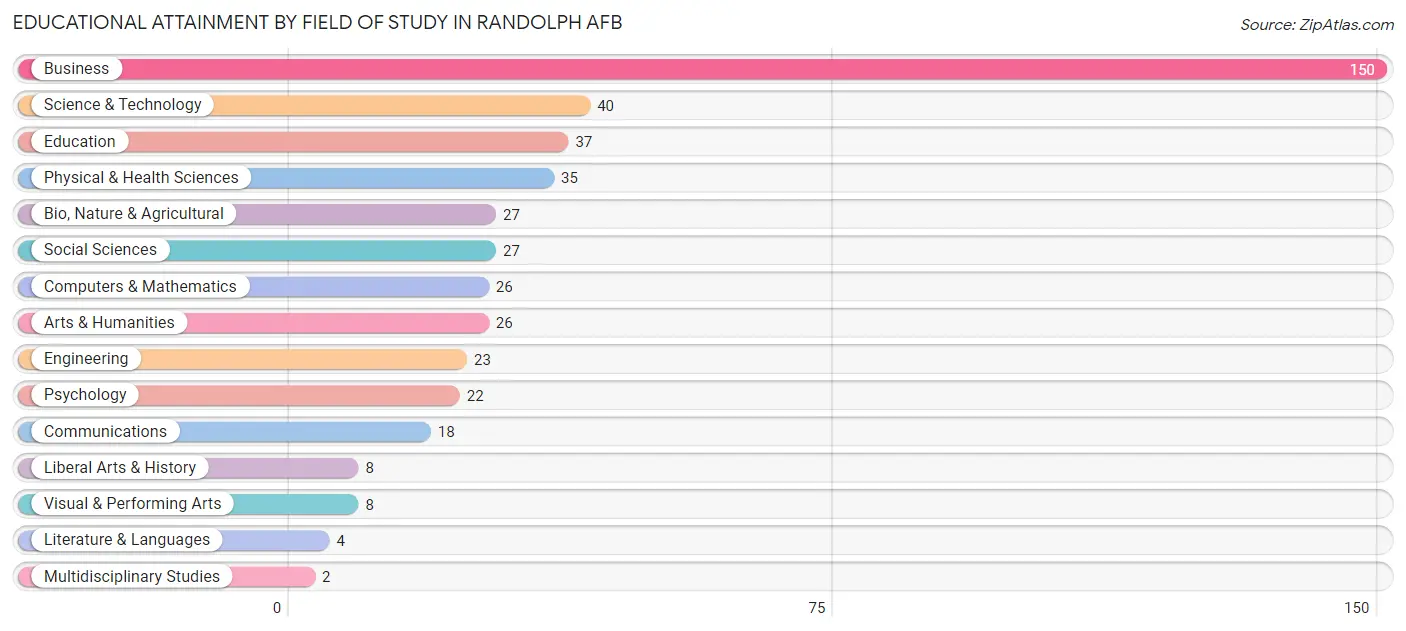
Educational Attainment by Field of Study in Randolph AFB
Business (150 | 33.1%), science & technology (40 | 8.8%), education (37 | 8.2%), physical & health sciences (35 | 7.7%), and bio, nature & agricultural (27 | 6.0%) are the most common fields of study among 453 individuals in Randolph AFB who have obtained a bachelor's degree or higher.
| Field of Study | # Graduates | % Graduates |
| Computers & Mathematics | 26 | 5.7% |
| Bio, Nature & Agricultural | 27 | 6.0% |
| Physical & Health Sciences | 35 | 7.7% |
| Psychology | 22 | 4.9% |
| Social Sciences | 27 | 6.0% |
| Engineering | 23 | 5.1% |
| Multidisciplinary Studies | 2 | 0.4% |
| Science & Technology | 40 | 8.8% |
| Business | 150 | 33.1% |
| Education | 37 | 8.2% |
| Literature & Languages | 4 | 0.9% |
| Liberal Arts & History | 8 | 1.8% |
| Visual & Performing Arts | 8 | 1.8% |
| Communications | 18 | 4.0% |
| Arts & Humanities | 26 | 5.7% |
| Total | 453 | 100.0% |
Transportation & Commute in Randolph AFB
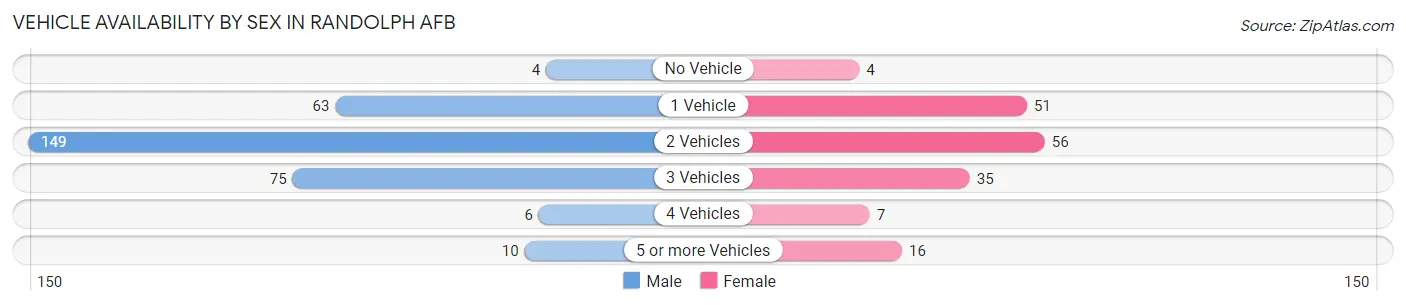
Vehicle Availability by Sex in Randolph AFB
The most prevalent vehicle ownership categories in Randolph AFB are males with 2 vehicles (149, accounting for 48.5%) and females with 2 vehicles (56, making up 88.2%).
| Vehicles Available | Male | Female |
| No Vehicle | 4 (1.3%) | 4 (2.4%) |
| 1 Vehicle | 63 (20.5%) | 51 (30.2%) |
| 2 Vehicles | 149 (48.5%) | 56 (33.1%) |
| 3 Vehicles | 75 (24.4%) | 35 (20.7%) |
| 4 Vehicles | 6 (1.9%) | 7 (4.1%) |
| 5 or more Vehicles | 10 (3.3%) | 16 (9.5%) |
| Total | 307 (100.0%) | 169 (100.0%) |
Commute Time in Randolph AFB
The most frequently occuring commute durations in Randolph AFB are 5 to 9 minutes (106 commuters, 25.2%), less than 5 minutes (78 commuters, 18.6%), and 30 to 34 minutes (68 commuters, 16.2%).
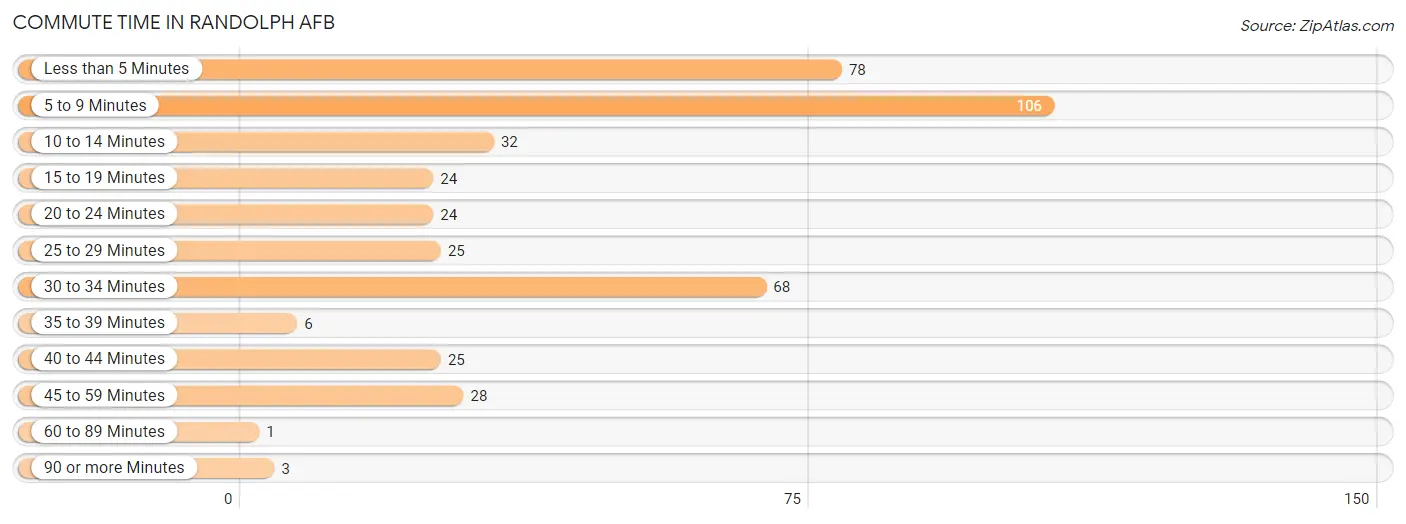
| Commute Time | # Commuters | % Commuters |
| Less than 5 Minutes | 78 | 18.6% |
| 5 to 9 Minutes | 106 | 25.2% |
| 10 to 14 Minutes | 32 | 7.6% |
| 15 to 19 Minutes | 24 | 5.7% |
| 20 to 24 Minutes | 24 | 5.7% |
| 25 to 29 Minutes | 25 | 5.9% |
| 30 to 34 Minutes | 68 | 16.2% |
| 35 to 39 Minutes | 6 | 1.4% |
| 40 to 44 Minutes | 25 | 5.9% |
| 45 to 59 Minutes | 28 | 6.7% |
| 60 to 89 Minutes | 1 | 0.2% |
| 90 or more Minutes | 3 | 0.7% |
Commute Time by Sex in Randolph AFB
The most common commute times in Randolph AFB are less than 5 minutes (70 commuters, 26.7%) for males and 30 to 34 minutes (51 commuters, 32.3%) for females.
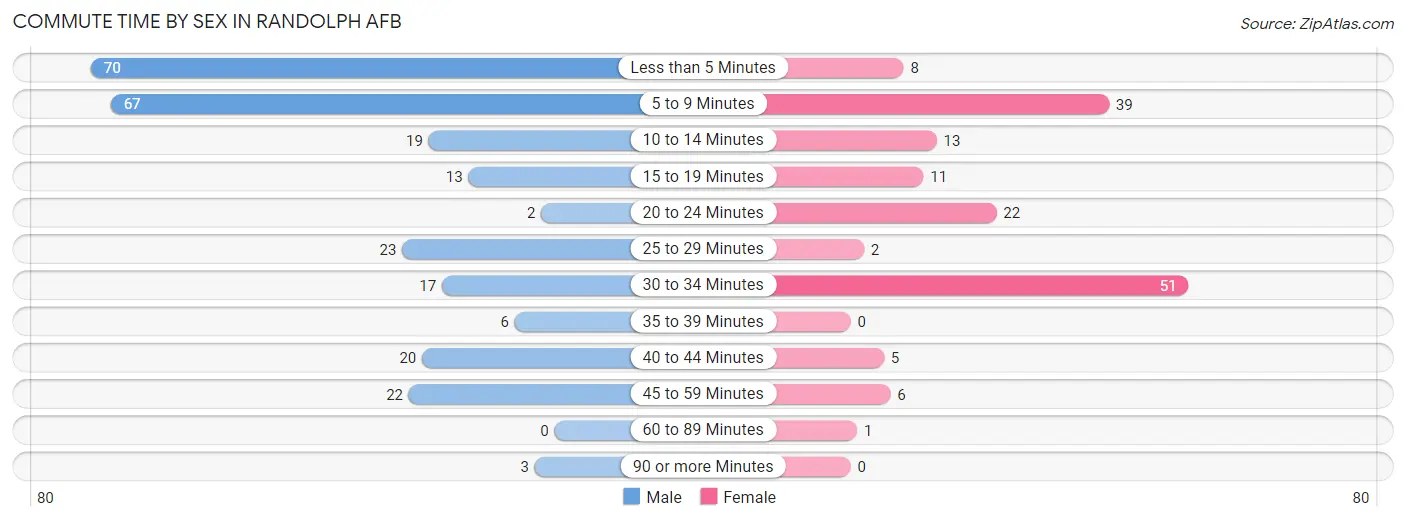
| Commute Time | Male | Female |
| Less than 5 Minutes | 70 (26.7%) | 8 (5.1%) |
| 5 to 9 Minutes | 67 (25.6%) | 39 (24.7%) |
| 10 to 14 Minutes | 19 (7.2%) | 13 (8.2%) |
| 15 to 19 Minutes | 13 (5.0%) | 11 (7.0%) |
| 20 to 24 Minutes | 2 (0.8%) | 22 (13.9%) |
| 25 to 29 Minutes | 23 (8.8%) | 2 (1.3%) |
| 30 to 34 Minutes | 17 (6.5%) | 51 (32.3%) |
| 35 to 39 Minutes | 6 (2.3%) | 0 (0.0%) |
| 40 to 44 Minutes | 20 (7.6%) | 5 (3.2%) |
| 45 to 59 Minutes | 22 (8.4%) | 6 (3.8%) |
| 60 to 89 Minutes | 0 (0.0%) | 1 (0.6%) |
| 90 or more Minutes | 3 (1.1%) | 0 (0.0%) |
Time of Departure to Work by Sex in Randolph AFB
The most frequent times of departure to work in Randolph AFB are 7:00 AM to 7:29 AM (75, 28.6%) for males and 9:00 AM to 9:59 AM (36, 22.8%) for females.
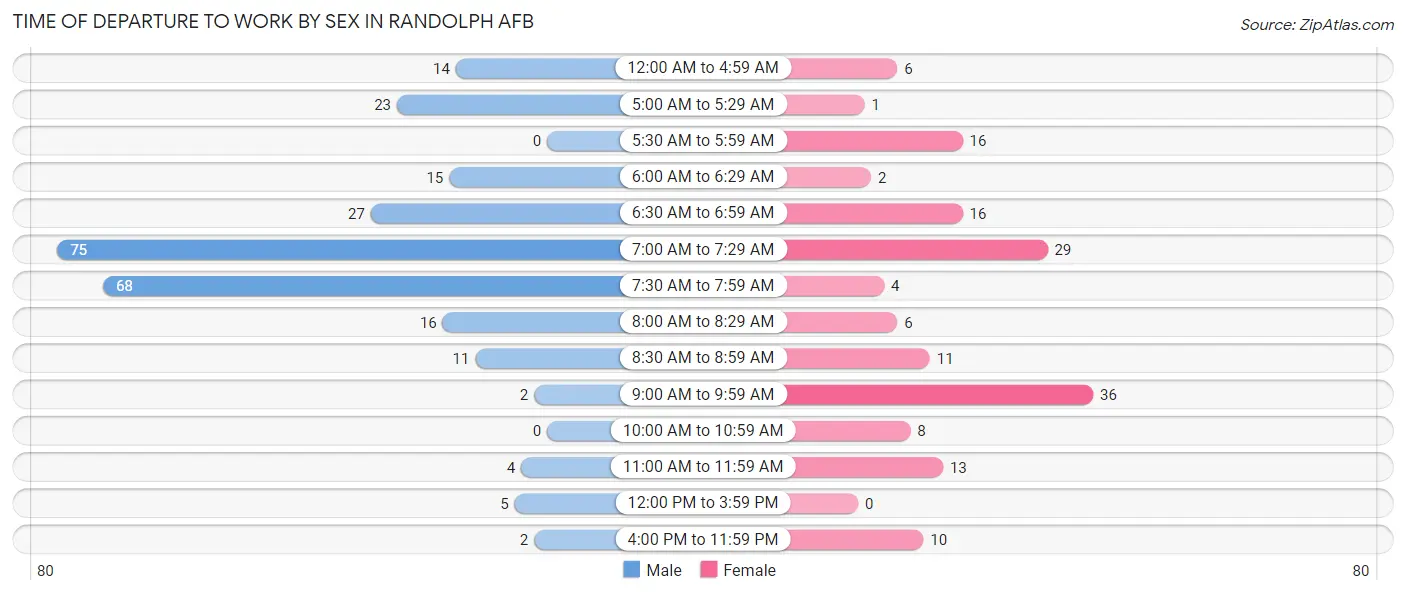
| Time of Departure | Male | Female |
| 12:00 AM to 4:59 AM | 14 (5.3%) | 6 (3.8%) |
| 5:00 AM to 5:29 AM | 23 (8.8%) | 1 (0.6%) |
| 5:30 AM to 5:59 AM | 0 (0.0%) | 16 (10.1%) |
| 6:00 AM to 6:29 AM | 15 (5.7%) | 2 (1.3%) |
| 6:30 AM to 6:59 AM | 27 (10.3%) | 16 (10.1%) |
| 7:00 AM to 7:29 AM | 75 (28.6%) | 29 (18.3%) |
| 7:30 AM to 7:59 AM | 68 (26.0%) | 4 (2.5%) |
| 8:00 AM to 8:29 AM | 16 (6.1%) | 6 (3.8%) |
| 8:30 AM to 8:59 AM | 11 (4.2%) | 11 (7.0%) |
| 9:00 AM to 9:59 AM | 2 (0.8%) | 36 (22.8%) |
| 10:00 AM to 10:59 AM | 0 (0.0%) | 8 (5.1%) |
| 11:00 AM to 11:59 AM | 4 (1.5%) | 13 (8.2%) |
| 12:00 PM to 3:59 PM | 5 (1.9%) | 0 (0.0%) |
| 4:00 PM to 11:59 PM | 2 (0.8%) | 10 (6.3%) |
| Total | 262 (100.0%) | 158 (100.0%) |
Housing Occupancy in Randolph AFB
Occupancy by Ownership in Randolph AFB
Of the total 319 dwellings in Randolph AFB, owner-occupied units account for 0 (0.0%), while renter-occupied units make up 319 (100.0%).
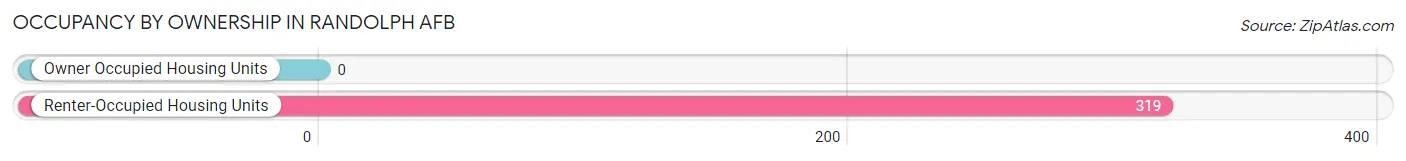
| Occupancy | # Housing Units | % Housing Units |
| Owner Occupied Housing Units | 0 | 0.0% |
| Renter-Occupied Housing Units | 319 | 100.0% |
| Total Occupied Housing Units | 319 | 100.0% |
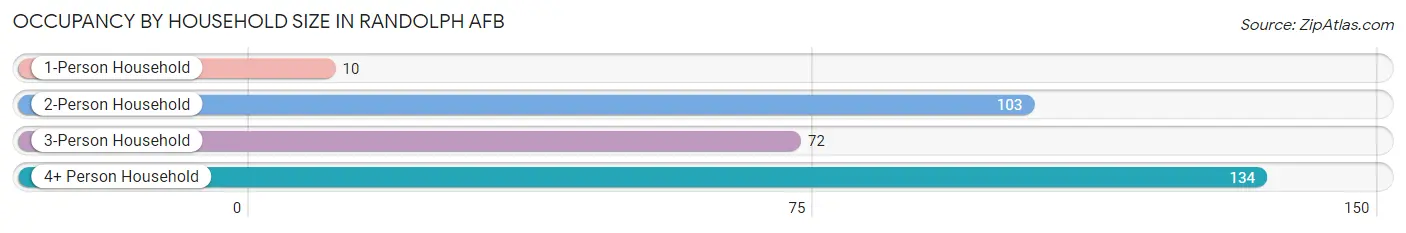
Occupancy by Household Size in Randolph AFB
| Household Size | # Housing Units | % Housing Units |
| 1-Person Household | 10 | 3.1% |
| 2-Person Household | 103 | 32.3% |
| 3-Person Household | 72 | 22.6% |
| 4+ Person Household | 134 | 42.0% |
| Total Housing Units | 319 | 100.0% |
Occupancy by Ownership by Household Size in Randolph AFB
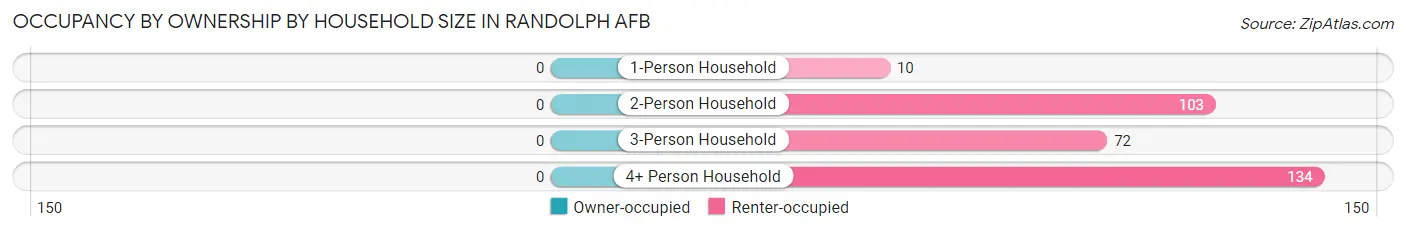
| Household Size | Owner-occupied | Renter-occupied |
| 1-Person Household | 0 (0.0%) | 10 (100.0%) |
| 2-Person Household | 0 (0.0%) | 103 (100.0%) |
| 3-Person Household | 0 (0.0%) | 72 (100.0%) |
| 4+ Person Household | 0 (0.0%) | 134 (100.0%) |
| Total Housing Units | 0 (0.0%) | 319 (100.0%) |
Occupancy by Educational Attainment in Randolph AFB

| Household Size | Owner-occupied | Renter-occupied |
| Less than High School | 0 (0.0%) | 0 (0.0%) |
| High School Diploma | 0 (0.0%) | 14 (100.0%) |
| College/Associate Degree | 0 (0.0%) | 68 (100.0%) |
| Bachelor's Degree or higher | 0 (0.0%) | 237 (100.0%) |
Occupancy by Age of Householder in Randolph AFB
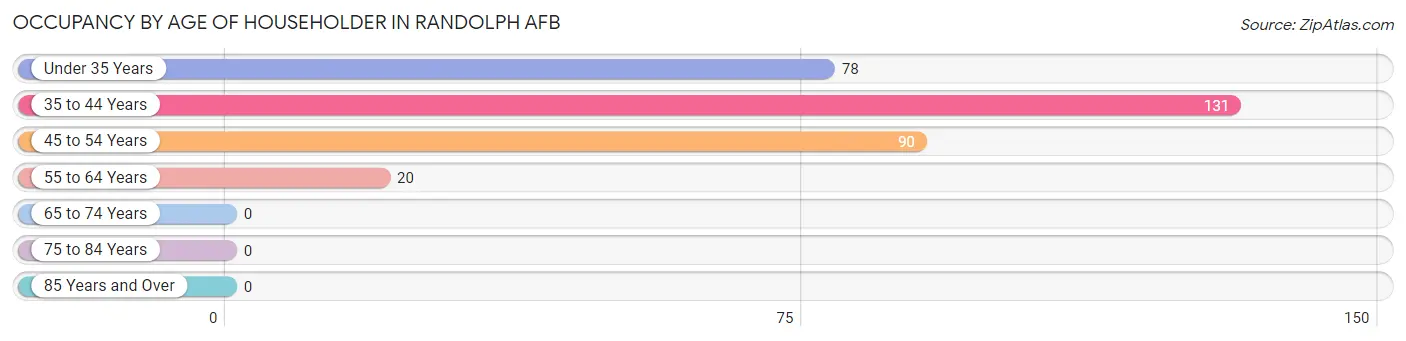
| Age Bracket | # Households | % Households |
| Under 35 Years | 78 | 24.4% |
| 35 to 44 Years | 131 | 41.1% |
| 45 to 54 Years | 90 | 28.2% |
| 55 to 64 Years | 20 | 6.3% |
| 65 to 74 Years | 0 | 0.0% |
| 75 to 84 Years | 0 | 0.0% |
| 85 Years and Over | 0 | 0.0% |
| Total | 319 | 100.0% |
Housing Finances in Randolph AFB
Median Income by Occupancy in Randolph AFB
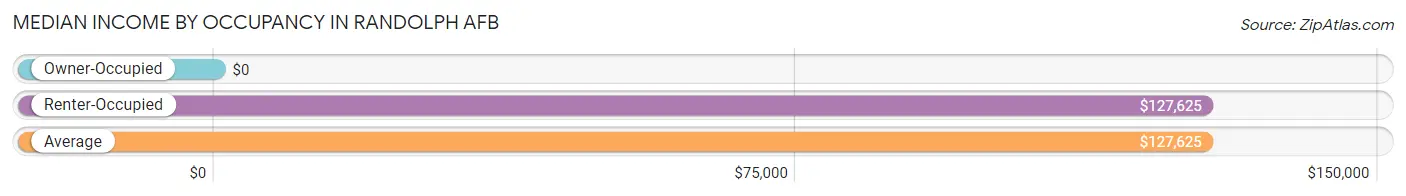
| Occupancy Type | # Households | Median Income |
| Owner-Occupied | 0 (0.0%) | $0 |
| Renter-Occupied | 319 (100.0%) | $127,625 |
| Average | 319 (100.0%) | $127,625 |
Occupancy by Householder Income Bracket in Randolph AFB
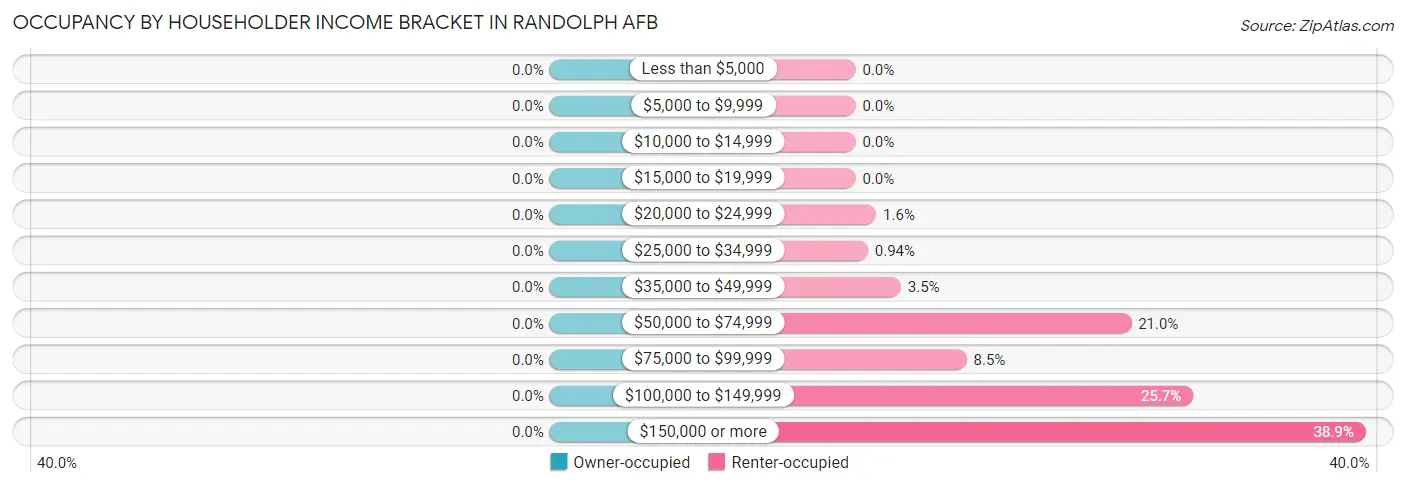
| Income Bracket | Owner-occupied | Renter-occupied |
| Less than $5,000 | 0 (0.0%) | 0 (0.0%) |
| $5,000 to $9,999 | 0 (0.0%) | 0 (0.0%) |
| $10,000 to $14,999 | 0 (0.0%) | 0 (0.0%) |
| $15,000 to $19,999 | 0 (0.0%) | 0 (0.0%) |
| $20,000 to $24,999 | 0 (0.0%) | 5 (1.6%) |
| $25,000 to $34,999 | 0 (0.0%) | 3 (0.9%) |
| $35,000 to $49,999 | 0 (0.0%) | 11 (3.5%) |
| $50,000 to $74,999 | 0 (0.0%) | 67 (21.0%) |
| $75,000 to $99,999 | 0 (0.0%) | 27 (8.5%) |
| $100,000 to $149,999 | 0 (0.0%) | 82 (25.7%) |
| $150,000 or more | 0 (0.0%) | 124 (38.9%) |
| Total | 0 (0.0%) | 319 (100.0%) |
Monthly Housing Cost Tiers in Randolph AFB
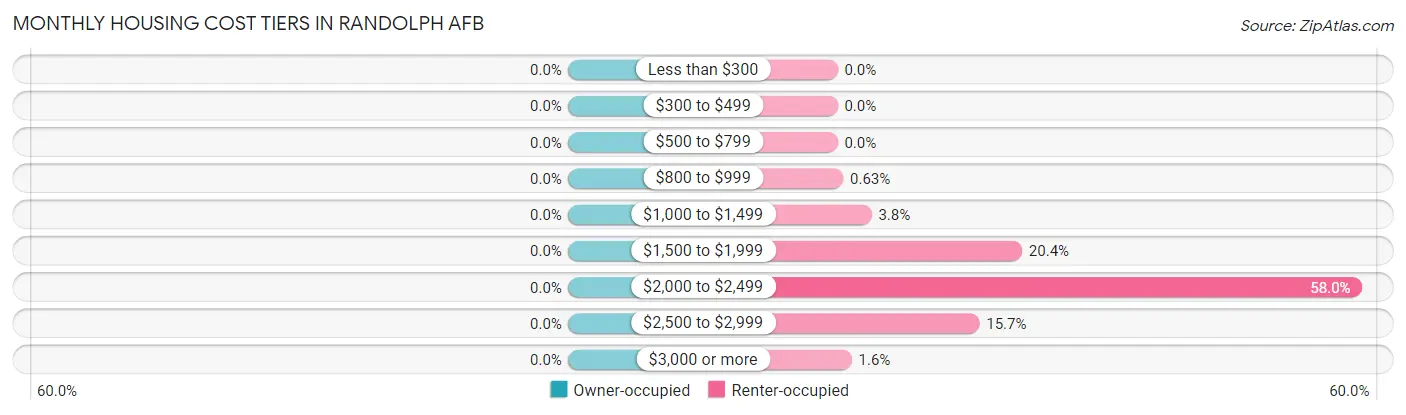
| Monthly Cost | Owner-occupied | Renter-occupied |
| Less than $300 | 0 (0.0%) | 0 (0.0%) |
| $300 to $499 | 0 (0.0%) | 0 (0.0%) |
| $500 to $799 | 0 (0.0%) | 0 (0.0%) |
| $800 to $999 | 0 (0.0%) | 2 (0.6%) |
| $1,000 to $1,499 | 0 (0.0%) | 12 (3.8%) |
| $1,500 to $1,999 | 0 (0.0%) | 65 (20.4%) |
| $2,000 to $2,499 | 0 (0.0%) | 185 (58.0%) |
| $2,500 to $2,999 | 0 (0.0%) | 50 (15.7%) |
| $3,000 or more | 0 (0.0%) | 5 (1.6%) |
| Total | 0 (0.0%) | 319 (100.0%) |
Physical Housing Characteristics in Randolph AFB
Housing Structures in Randolph AFB
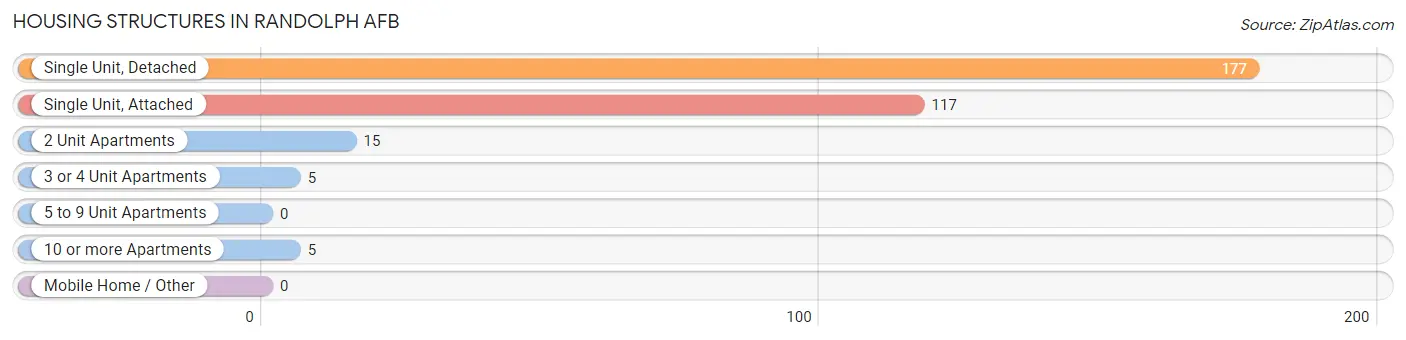
| Structure Type | # Housing Units | % Housing Units |
| Single Unit, Detached | 177 | 55.5% |
| Single Unit, Attached | 117 | 36.7% |
| 2 Unit Apartments | 15 | 4.7% |
| 3 or 4 Unit Apartments | 5 | 1.6% |
| 5 to 9 Unit Apartments | 0 | 0.0% |
| 10 or more Apartments | 5 | 1.6% |
| Mobile Home / Other | 0 | 0.0% |
| Total | 319 | 100.0% |
Housing Structures by Occupancy in Randolph AFB
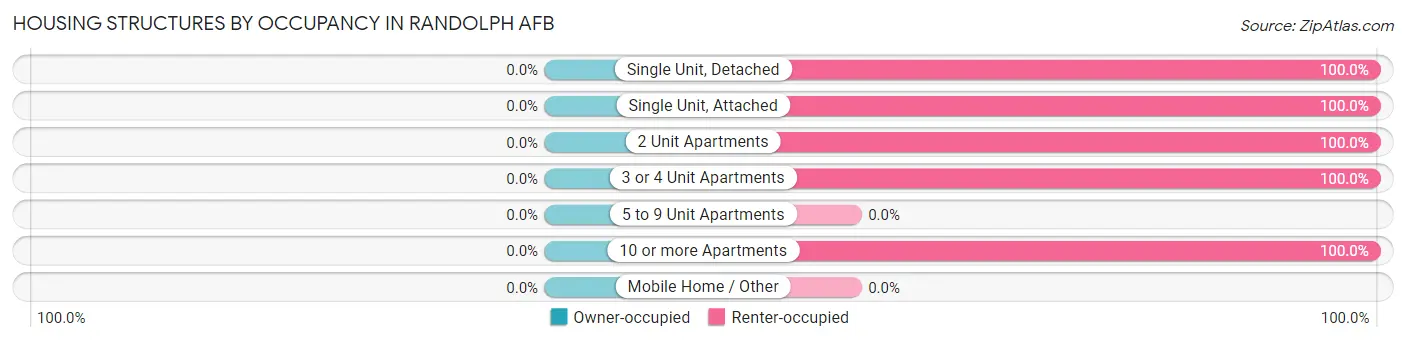
| Structure Type | Owner-occupied | Renter-occupied |
| Single Unit, Detached | 0 (0.0%) | 177 (100.0%) |
| Single Unit, Attached | 0 (0.0%) | 117 (100.0%) |
| 2 Unit Apartments | 0 (0.0%) | 15 (100.0%) |
| 3 or 4 Unit Apartments | 0 (0.0%) | 5 (100.0%) |
| 5 to 9 Unit Apartments | 0 (0.0%) | 0 (0.0%) |
| 10 or more Apartments | 0 (0.0%) | 5 (100.0%) |
| Mobile Home / Other | 0 (0.0%) | 0 (0.0%) |
| Total | 0 (0.0%) | 319 (100.0%) |
Housing Structures by Number of Rooms in Randolph AFB
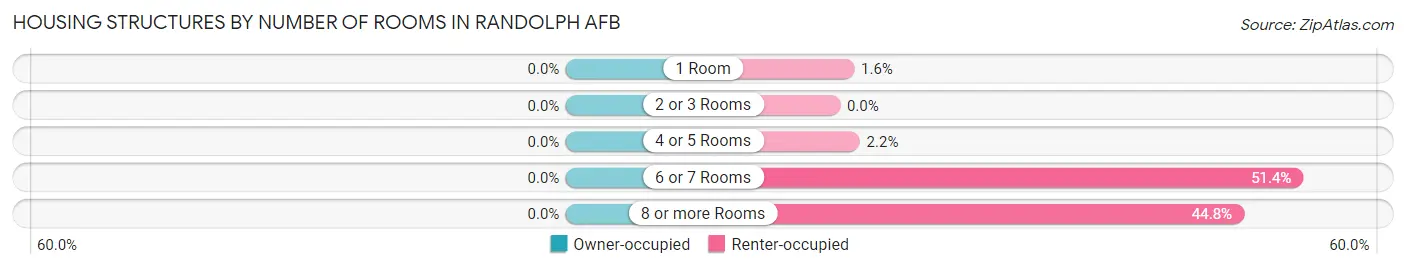
| Number of Rooms | Owner-occupied | Renter-occupied |
| 1 Room | 0 (0.0%) | 5 (1.6%) |
| 2 or 3 Rooms | 0 (0.0%) | 0 (0.0%) |
| 4 or 5 Rooms | 0 (0.0%) | 7 (2.2%) |
| 6 or 7 Rooms | 0 (0.0%) | 164 (51.4%) |
| 8 or more Rooms | 0 (0.0%) | 143 (44.8%) |
| Total | 0 (0.0%) | 319 (100.0%) |
Housing Structure by Heating Type in Randolph AFB
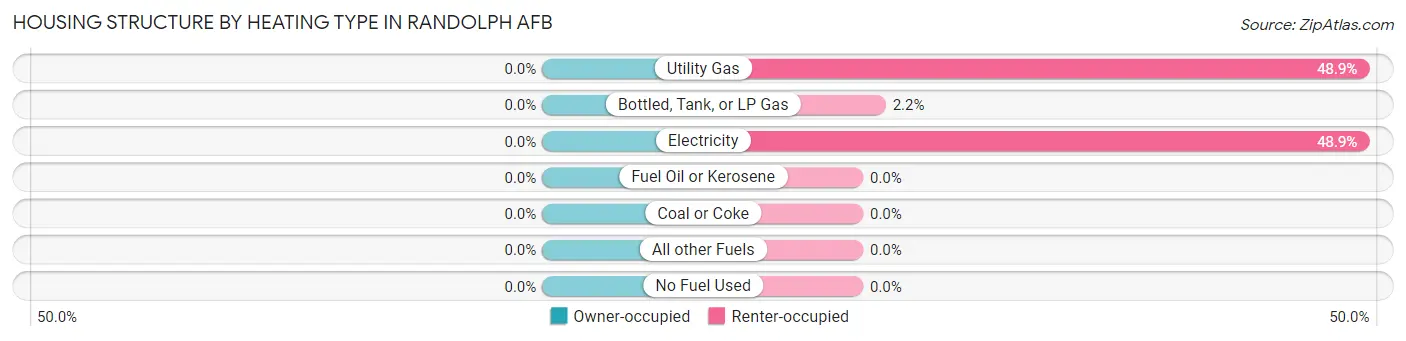
| Heating Type | Owner-occupied | Renter-occupied |
| Utility Gas | 0 (0.0%) | 156 (48.9%) |
| Bottled, Tank, or LP Gas | 0 (0.0%) | 7 (2.2%) |
| Electricity | 0 (0.0%) | 156 (48.9%) |
| Fuel Oil or Kerosene | 0 (0.0%) | 0 (0.0%) |
| Coal or Coke | 0 (0.0%) | 0 (0.0%) |
| All other Fuels | 0 (0.0%) | 0 (0.0%) |
| No Fuel Used | 0 (0.0%) | 0 (0.0%) |
| Total | 0 (0.0%) | 319 (100.0%) |
Household Vehicle Usage in Randolph AFB
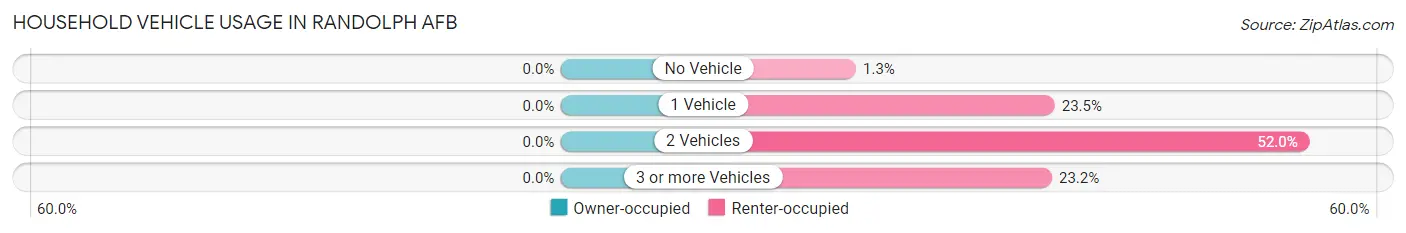
| Vehicles per Household | Owner-occupied | Renter-occupied |
| No Vehicle | 0 (0.0%) | 4 (1.3%) |
| 1 Vehicle | 0 (0.0%) | 75 (23.5%) |
| 2 Vehicles | 0 (0.0%) | 166 (52.0%) |
| 3 or more Vehicles | 0 (0.0%) | 74 (23.2%) |
| Total | 0 (0.0%) | 319 (100.0%) |
Real Estate & Mortgages in Randolph AFB
Real Estate and Mortgage Overview in Randolph AFB
| Characteristic | Without Mortgage | With Mortgage |
| Housing Units | 0 | 0 |
| Median Property Value | - | - |
| Median Household Income | - | - |
| Monthly Housing Costs | - | - |
| Real Estate Taxes | - | - |
Property Value by Mortgage Status in Randolph AFB
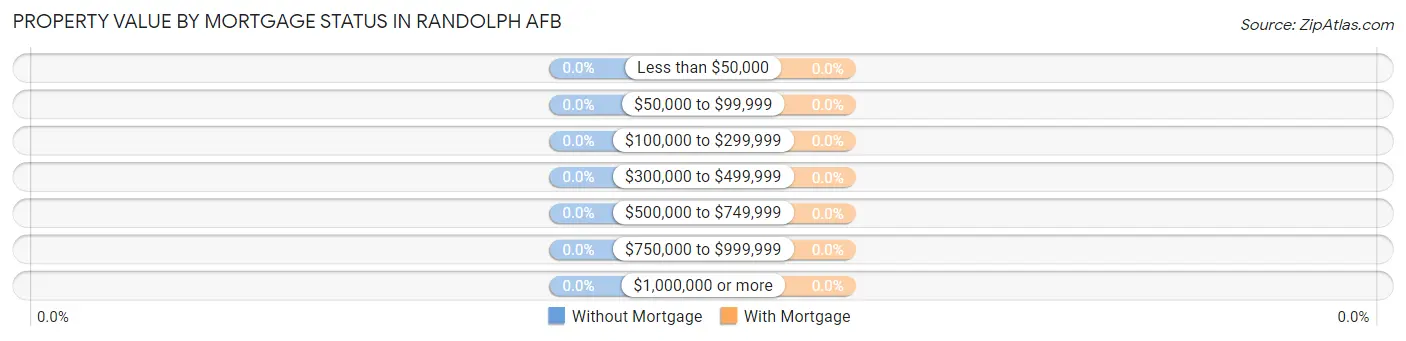
| Property Value | Without Mortgage | With Mortgage |
| Less than $50,000 | 0 (0.0%) | 0 (0.0%) |
| $50,000 to $99,999 | 0 (0.0%) | 0 (0.0%) |
| $100,000 to $299,999 | 0 (0.0%) | 0 (0.0%) |
| $300,000 to $499,999 | 0 (0.0%) | 0 (0.0%) |
| $500,000 to $749,999 | 0 (0.0%) | 0 (0.0%) |
| $750,000 to $999,999 | 0 (0.0%) | 0 (0.0%) |
| $1,000,000 or more | 0 (0.0%) | 0 (0.0%) |
| Total | 0 (0.0%) | 0 (0.0%) |
Household Income by Mortgage Status in Randolph AFB
| Household Income | Without Mortgage | With Mortgage |
| Less than $10,000 | 0 (0.0%) | 0 (0.0%) |
| $10,000 to $24,999 | 0 (0.0%) | 0 (0.0%) |
| $25,000 to $34,999 | 0 (0.0%) | 0 (0.0%) |
| $35,000 to $49,999 | 0 (0.0%) | 0 (0.0%) |
| $50,000 to $74,999 | 0 (0.0%) | 0 (0.0%) |
| $75,000 to $99,999 | 0 (0.0%) | 0 (0.0%) |
| $100,000 to $149,999 | 0 (0.0%) | 0 (0.0%) |
| $150,000 or more | 0 (0.0%) | 0 (0.0%) |
| Total | 0 (0.0%) | 0 (0.0%) |
Property Value to Household Income Ratio in Randolph AFB
| Value-to-Income Ratio | Without Mortgage | With Mortgage |
| Less than 2.0x | 0 (0.0%) | 0 (0.0%) |
| 2.0x to 2.9x | 0 (0.0%) | 0 (0.0%) |
| 3.0x to 3.9x | 0 (0.0%) | 0 (0.0%) |
| 4.0x or more | 0 (0.0%) | 0 (0.0%) |
| Total | 0 (0.0%) | 0 (0.0%) |
Real Estate Taxes by Mortgage Status in Randolph AFB
| Property Taxes | Without Mortgage | With Mortgage |
| Less than $800 | 0 (0.0%) | 0 (0.0%) |
| $800 to $1,499 | 0 (0.0%) | 0 (0.0%) |
| $800 to $1,499 | 0 (0.0%) | 0 (0.0%) |
| Total | 0 (0.0%) | 0 (0.0%) |
Health & Disability in Randolph AFB
Health Insurance Coverage by Age in Randolph AFB
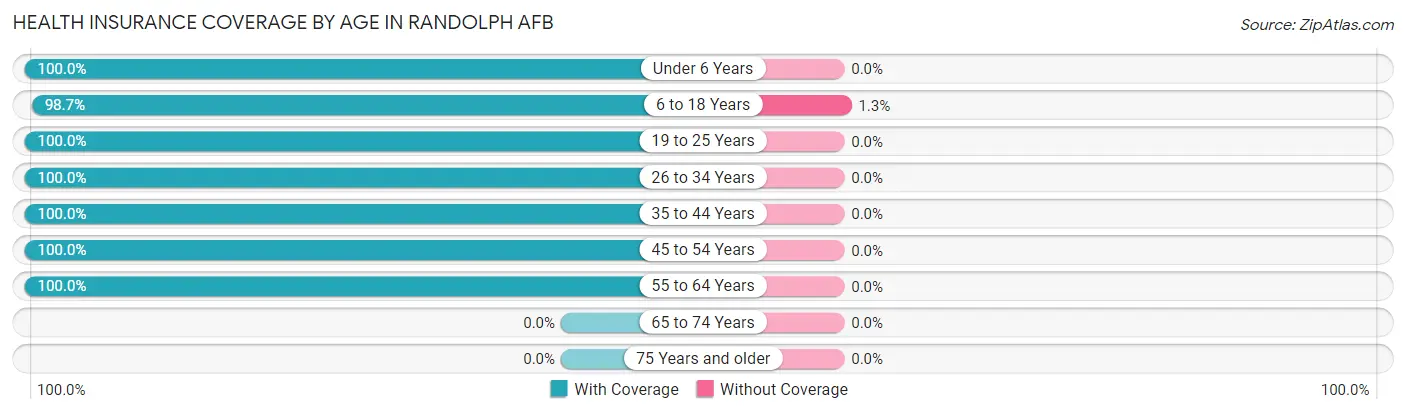
| Age Bracket | With Coverage | Without Coverage |
| Under 6 Years | 105 (100.0%) | 0 (0.0%) |
| 6 to 18 Years | 367 (98.7%) | 5 (1.3%) |
| 19 to 25 Years | 55 (100.0%) | 0 (0.0%) |
| 26 to 34 Years | 23 (100.0%) | 0 (0.0%) |
| 35 to 44 Years | 189 (100.0%) | 0 (0.0%) |
| 45 to 54 Years | 83 (100.0%) | 0 (0.0%) |
| 55 to 64 Years | 29 (100.0%) | 0 (0.0%) |
| 65 to 74 Years | 0 (0.0%) | 0 (0.0%) |
| 75 Years and older | 0 (0.0%) | 0 (0.0%) |
| Total | 851 (99.4%) | 5 (0.6%) |
Health Insurance Coverage by Citizenship Status in Randolph AFB
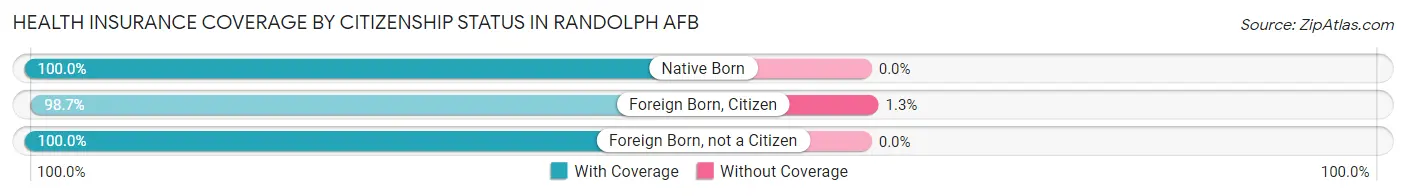
| Citizenship Status | With Coverage | Without Coverage |
| Native Born | 105 (100.0%) | 0 (0.0%) |
| Foreign Born, Citizen | 367 (98.7%) | 5 (1.3%) |
| Foreign Born, not a Citizen | 55 (100.0%) | 0 (0.0%) |
Health Insurance Coverage by Household Income in Randolph AFB
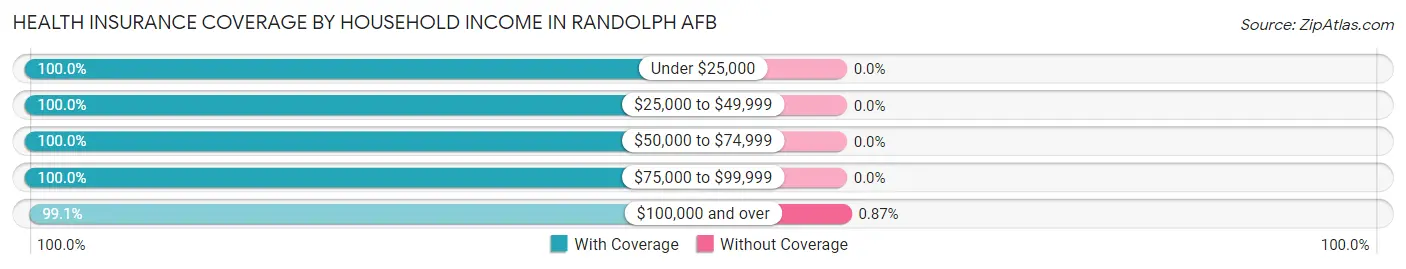
| Household Income | With Coverage | Without Coverage |
| Under $25,000 | 9 (100.0%) | 0 (0.0%) |
| $25,000 to $49,999 | 59 (100.0%) | 0 (0.0%) |
| $50,000 to $74,999 | 101 (100.0%) | 0 (0.0%) |
| $75,000 to $99,999 | 109 (100.0%) | 0 (0.0%) |
| $100,000 and over | 573 (99.1%) | 5 (0.9%) |
Public vs Private Health Insurance Coverage by Age in Randolph AFB
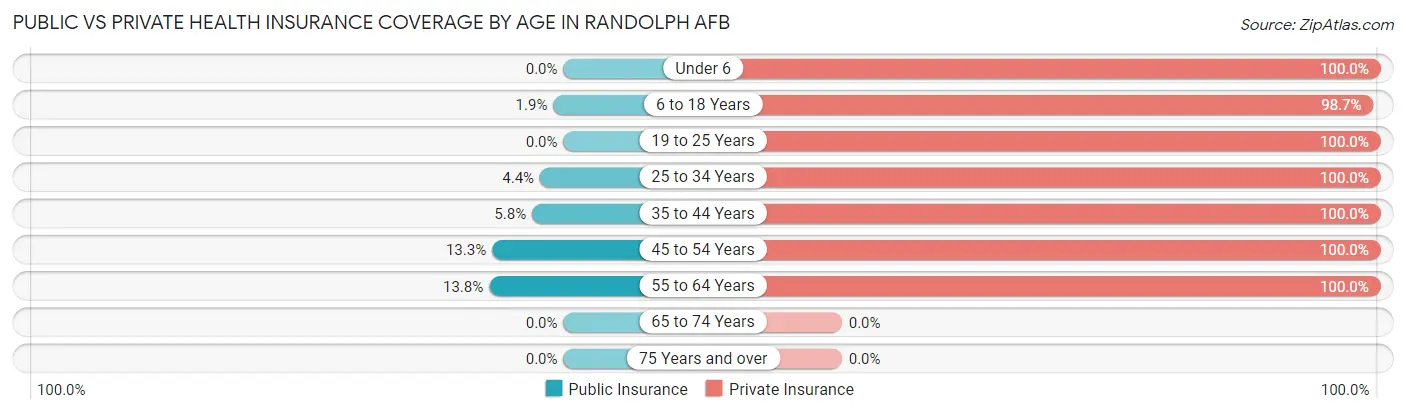
| Age Bracket | Public Insurance | Private Insurance |
| Under 6 | 0 (0.0%) | 105 (100.0%) |
| 6 to 18 Years | 7 (1.9%) | 367 (98.7%) |
| 19 to 25 Years | 0 (0.0%) | 55 (100.0%) |
| 25 to 34 Years | 1 (4.3%) | 23 (100.0%) |
| 35 to 44 Years | 11 (5.8%) | 189 (100.0%) |
| 45 to 54 Years | 11 (13.3%) | 83 (100.0%) |
| 55 to 64 Years | 4 (13.8%) | 29 (100.0%) |
| 65 to 74 Years | 0 (0.0%) | 0 (0.0%) |
| 75 Years and over | 0 (0.0%) | 0 (0.0%) |
| Total | 34 (4.0%) | 851 (99.4%) |
Disability Status by Sex by Age in Randolph AFB
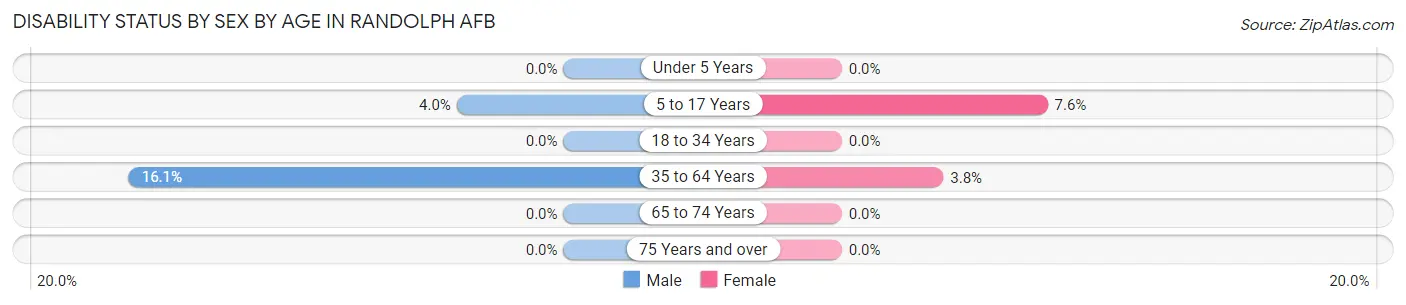
| Age Bracket | Male | Female |
| Under 5 Years | 0 (0.0%) | 0 (0.0%) |
| 5 to 17 Years | 8 (4.0%) | 12 (7.6%) |
| 18 to 34 Years | 0 (0.0%) | 0 (0.0%) |
| 35 to 64 Years | 10 (16.1%) | 9 (3.8%) |
| 65 to 74 Years | 0 (0.0%) | 0 (0.0%) |
| 75 Years and over | 0 (0.0%) | 0 (0.0%) |
Disability Class by Sex by Age in Randolph AFB
Disability Class: Hearing Difficulty
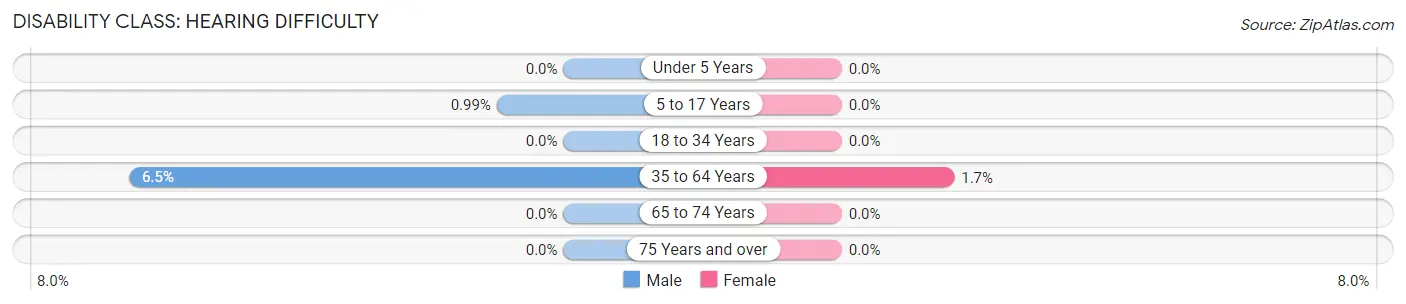
| Age Bracket | Male | Female |
| Under 5 Years | 0 (0.0%) | 0 (0.0%) |
| 5 to 17 Years | 2 (1.0%) | 0 (0.0%) |
| 18 to 34 Years | 0 (0.0%) | 0 (0.0%) |
| 35 to 64 Years | 4 (6.5%) | 4 (1.7%) |
| 65 to 74 Years | 0 (0.0%) | 0 (0.0%) |
| 75 Years and over | 0 (0.0%) | 0 (0.0%) |
Disability Class: Vision Difficulty
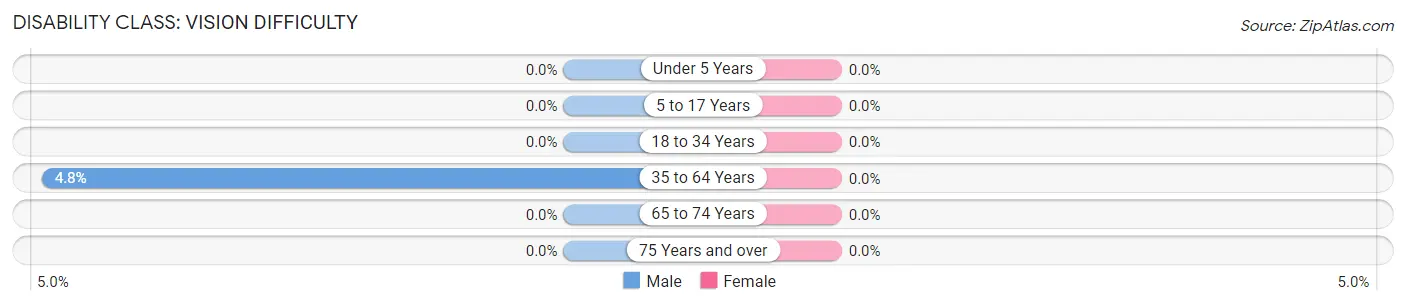
| Age Bracket | Male | Female |
| Under 5 Years | 0 (0.0%) | 0 (0.0%) |
| 5 to 17 Years | 0 (0.0%) | 0 (0.0%) |
| 18 to 34 Years | 0 (0.0%) | 0 (0.0%) |
| 35 to 64 Years | 3 (4.8%) | 0 (0.0%) |
| 65 to 74 Years | 0 (0.0%) | 0 (0.0%) |
| 75 Years and over | 0 (0.0%) | 0 (0.0%) |
Disability Class: Cognitive Difficulty
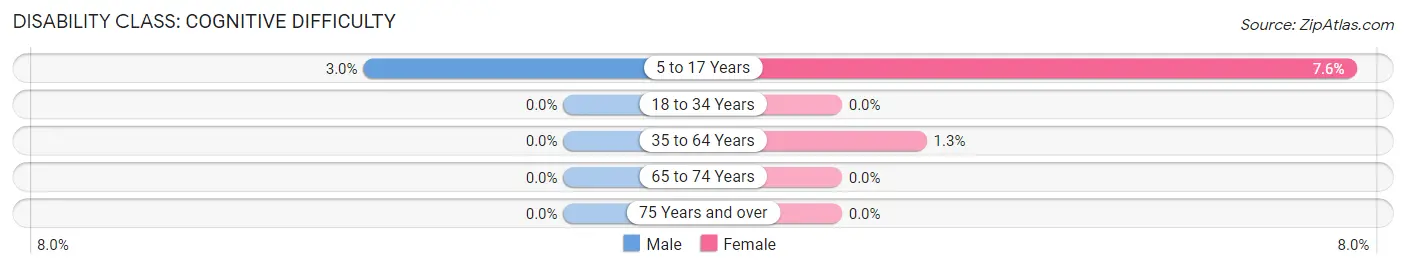
| Age Bracket | Male | Female |
| 5 to 17 Years | 6 (3.0%) | 12 (7.6%) |
| 18 to 34 Years | 0 (0.0%) | 0 (0.0%) |
| 35 to 64 Years | 0 (0.0%) | 3 (1.3%) |
| 65 to 74 Years | 0 (0.0%) | 0 (0.0%) |
| 75 Years and over | 0 (0.0%) | 0 (0.0%) |
Disability Class: Ambulatory Difficulty
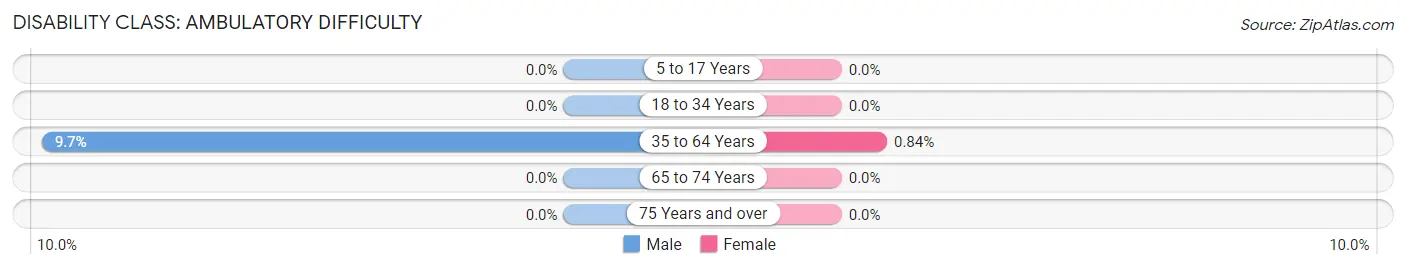
| Age Bracket | Male | Female |
| 5 to 17 Years | 0 (0.0%) | 0 (0.0%) |
| 18 to 34 Years | 0 (0.0%) | 0 (0.0%) |
| 35 to 64 Years | 6 (9.7%) | 2 (0.8%) |
| 65 to 74 Years | 0 (0.0%) | 0 (0.0%) |
| 75 Years and over | 0 (0.0%) | 0 (0.0%) |
Disability Class: Self-Care Difficulty
| Age Bracket | Male | Female |
| 5 to 17 Years | 0 (0.0%) | 0 (0.0%) |
| 18 to 34 Years | 0 (0.0%) | 0 (0.0%) |
| 35 to 64 Years | 0 (0.0%) | 0 (0.0%) |
| 65 to 74 Years | 0 (0.0%) | 0 (0.0%) |
| 75 Years and over | 0 (0.0%) | 0 (0.0%) |
Technology Access in Randolph AFB
Computing Device Access in Randolph AFB
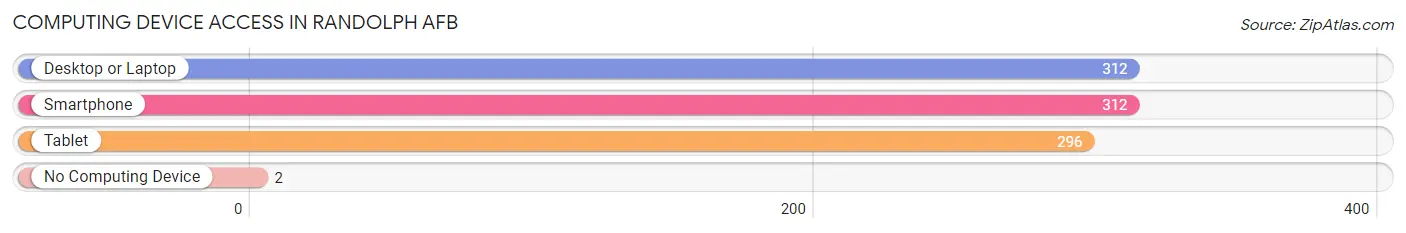
| Device Type | # Households | % Households |
| Desktop or Laptop | 312 | 97.8% |
| Smartphone | 312 | 97.8% |
| Tablet | 296 | 92.8% |
| No Computing Device | 2 | 0.6% |
| Total | 319 | 100.0% |
Internet Access in Randolph AFB
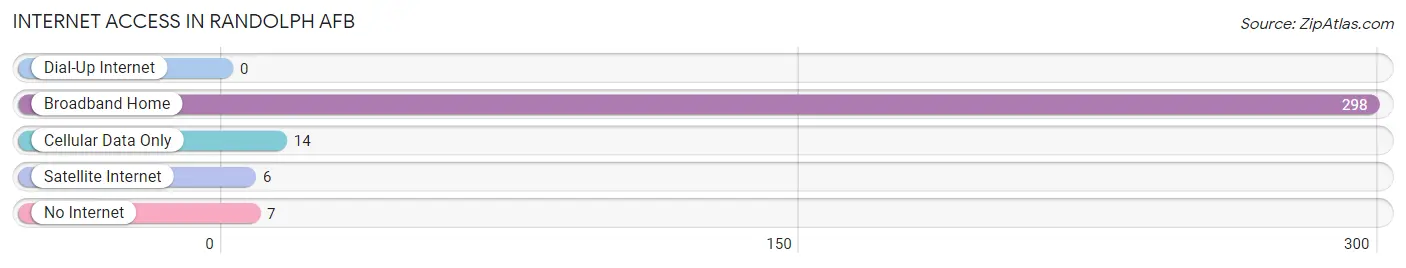
| Internet Type | # Households | % Households |
| Dial-Up Internet | 0 | 0.0% |
| Broadband Home | 298 | 93.4% |
| Cellular Data Only | 14 | 4.4% |
| Satellite Internet | 6 | 1.9% |
| No Internet | 7 | 2.2% |
| Total | 319 | 100.0% |
Randolph AFB Summary
Randolph Air Force Base (RAFB) is located in Universal City, Texas, and is a part of Joint Base San Antonio (JBSA). It is the headquarters of Air Education and Training Command (AETC) and is home to the 12th Flying Training Wing (12 FTW). RAFB is the oldest continuously active air force base in the United States, having been established in 1930.
Geography
Randolph Air Force Base is located in the city of Universal City, Texas, which is in Bexar County, approximately 20 miles northeast of downtown San Antonio. The base is situated on approximately 2,000 acres of land and is bordered by Interstate 35 to the west, FM 78 to the north, FM 1518 to the east, and FM 78 to the south. The base is located in a semi-arid climate, with hot summers and mild winters.
Economy
Randolph Air Force Base is a major economic driver for the region, providing jobs and economic activity to the surrounding area. The base is home to more than 10,000 military and civilian personnel, and is the largest employer in the region. The base also supports a large number of contractors and vendors, providing additional economic activity to the region.
Demographics
As of the 2010 census, the population of Universal City was 19,236. The racial makeup of the city was 79.3% White, 8.2% African American, 0.5% Native American, 4.2% Asian, 0.1% Pacific Islander, 5.2% from other races, and 2.5% from two or more races. Hispanic or Latino of any race were 18.2% of the population.
History
Randolph Air Force Base was established in 1930 as a training facility for the United States Army Air Corps. The base was named after Captain William Millican Randolph, a World War I aviator who was killed in a crash in 1921. During World War II, the base was used as a training facility for pilots and aircrews. After the war, the base was used as a training facility for the United States Air Force.
In the 1950s, the base was used as a training facility for the Strategic Air Command. In the 1960s, the base was used as a training facility for the Air Defense Command. In the 1970s, the base was used as a training facility for the Tactical Air Command. In the 1980s, the base was used as a training facility for the Air Training Command.
In the 1990s, the base was used as a training facility for the Air Education and Training Command. In the 2000s, the base was used as a training facility for the Air Force Reserve Command.
Today, Randolph Air Force Base is the headquarters of Air Education and Training Command and is home to the 12th Flying Training Wing. The base is also home to the Air Force Reserve Command's 433rd Airlift Wing and the Air Force's 12th Flying Training Wing. The base is also home to the Air Force's Air Force Recruiting Service and the Air Force's Air Force Reserve Officer Training Corps.
Common Questions
What is Per Capita Income in Randolph AFB?
Per Capita income in Randolph AFB is $36,648.
What is the Median Family Income in Randolph AFB?
Median Family Income in Randolph AFB is $127,875.
What is the Median Household income in Randolph AFB?
Median Household Income in Randolph AFB is $127,625.
What is Income or Wage Gap in Randolph AFB?
Income or Wage Gap in Randolph AFB is 86.6%.
Women in Randolph AFB earn 13.4 cents for every dollar earned by a man.
What is Inequality or Gini Index in Randolph AFB?
Inequality or Gini Index in Randolph AFB is 0.28.
What is the Total Population of Randolph AFB?
Total Population of Randolph AFB is 1,195.
What is the Total Male Population of Randolph AFB?
Total Male Population of Randolph AFB is 648.
What is the Total Female Population of Randolph AFB?
Total Female Population of Randolph AFB is 547.
What is the Ratio of Males per 100 Females in Randolph AFB?
There are 118.46 Males per 100 Females in Randolph AFB.
What is the Ratio of Females per 100 Males in Randolph AFB?
There are 84.41 Females per 100 Males in Randolph AFB.
What is the Median Population Age in Randolph AFB?
Median Population Age in Randolph AFB is 27.2 Years.
What is the Average Family Size in Randolph AFB
Average Family Size in Randolph AFB is 3.6 People.
What is the Average Household Size in Randolph AFB
Average Household Size in Randolph AFB is 3.5 People.
How Large is the Labor Force in Randolph AFB?
There are 571 People in the Labor Forcein in Randolph AFB.
What is the Percentage of People in the Labor Force in Randolph AFB?
71.5% of People are in the Labor Force in Randolph AFB.
What is the Unemployment Rate in Randolph AFB?
Unemployment Rate in Randolph AFB is 13.1%.