Point Blank, TX Map & Demographics
Point Blank Map
Point Blank Overview
$47,384
PER CAPITA INCOME
$97,222
AVG FAMILY INCOME
$58,942
AVG HOUSEHOLD INCOME
43.3%
WAGE / INCOME GAP [ % ]
56.7¢/ $1
WAGE / INCOME GAP [ $ ]
$4,594
FAMILY INCOME DEFICIT
0.48
INEQUALITY / GINI INDEX
816
TOTAL POPULATION
511
MALE POPULATION
305
FEMALE POPULATION
167.54
MALES / 100 FEMALES
59.69
FEMALES / 100 MALES
57.5
MEDIAN AGE
2.7
AVG FAMILY SIZE
2.1
AVG HOUSEHOLD SIZE
406
LABOR FORCE [ PEOPLE ]
55.2%
PERCENT IN LABOR FORCE
9.4%
UNEMPLOYMENT RATE
Income in Point Blank
Income Overview in Point Blank
Per Capita Income in Point Blank is $47,384, while median incomes of families and households are $97,222 and $58,942 respectively.
| Characteristic | Number | Measure |
| Per Capita Income | 816 | $47,384 |
| Median Family Income | 234 | $97,222 |
| Mean Family Income | 234 | $111,504 |
| Median Household Income | 380 | $58,942 |
| Mean Household Income | 380 | $85,562 |
| Income Deficit | 234 | $4,594 |
| Wage / Income Gap (%) | 816 | 43.29% |
| Wage / Income Gap ($) | 816 | 56.71¢ per $1 |
| Gini / Inequality Index | 816 | 0.48 |
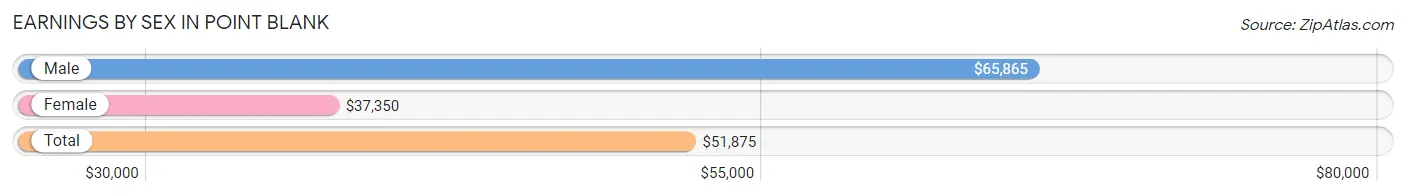
Earnings by Sex in Point Blank
Average Earnings in Point Blank are $51,875, $65,865 for men and $37,350 for women, a difference of 43.3%.
| Sex | Number | Average Earnings |
| Male | 251 (64.4%) | $65,865 |
| Female | 139 (35.6%) | $37,350 |
| Total | 390 (100.0%) | $51,875 |
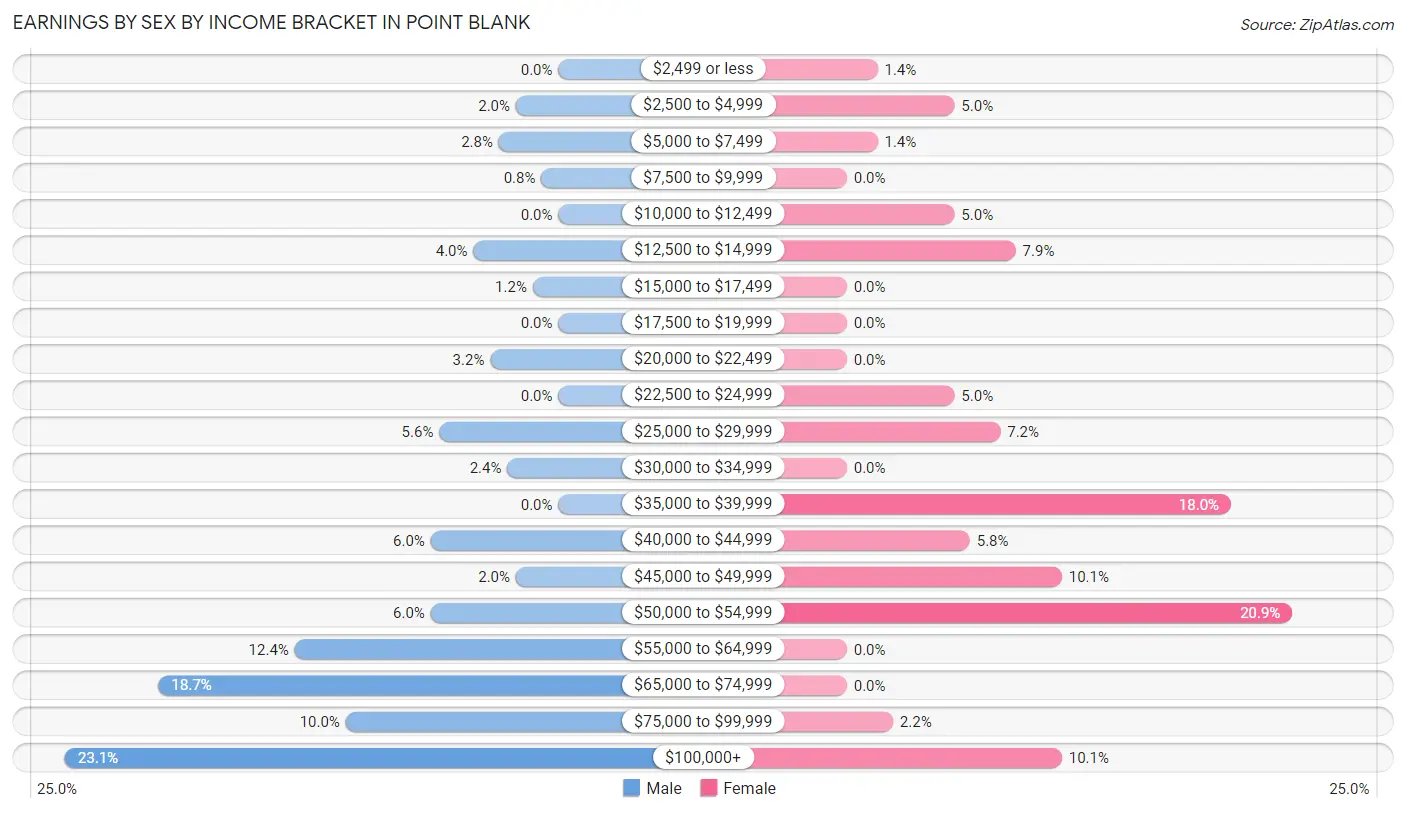
Earnings by Sex by Income Bracket in Point Blank
The most common earnings brackets in Point Blank are $100,000+ for men (58 | 23.1%) and $50,000 to $54,999 for women (29 | 20.9%).
| Income | Male | Female |
| $2,499 or less | 0 (0.0%) | 2 (1.4%) |
| $2,500 to $4,999 | 5 (2.0%) | 7 (5.0%) |
| $5,000 to $7,499 | 7 (2.8%) | 2 (1.4%) |
| $7,500 to $9,999 | 2 (0.8%) | 0 (0.0%) |
| $10,000 to $12,499 | 0 (0.0%) | 7 (5.0%) |
| $12,500 to $14,999 | 10 (4.0%) | 11 (7.9%) |
| $15,000 to $17,499 | 3 (1.2%) | 0 (0.0%) |
| $17,500 to $19,999 | 0 (0.0%) | 0 (0.0%) |
| $20,000 to $22,499 | 8 (3.2%) | 0 (0.0%) |
| $22,500 to $24,999 | 0 (0.0%) | 7 (5.0%) |
| $25,000 to $29,999 | 14 (5.6%) | 10 (7.2%) |
| $30,000 to $34,999 | 6 (2.4%) | 0 (0.0%) |
| $35,000 to $39,999 | 0 (0.0%) | 25 (18.0%) |
| $40,000 to $44,999 | 15 (6.0%) | 8 (5.8%) |
| $45,000 to $49,999 | 5 (2.0%) | 14 (10.1%) |
| $50,000 to $54,999 | 15 (6.0%) | 29 (20.9%) |
| $55,000 to $64,999 | 31 (12.3%) | 0 (0.0%) |
| $65,000 to $74,999 | 47 (18.7%) | 0 (0.0%) |
| $75,000 to $99,999 | 25 (10.0%) | 3 (2.2%) |
| $100,000+ | 58 (23.1%) | 14 (10.1%) |
| Total | 251 (100.0%) | 139 (100.0%) |
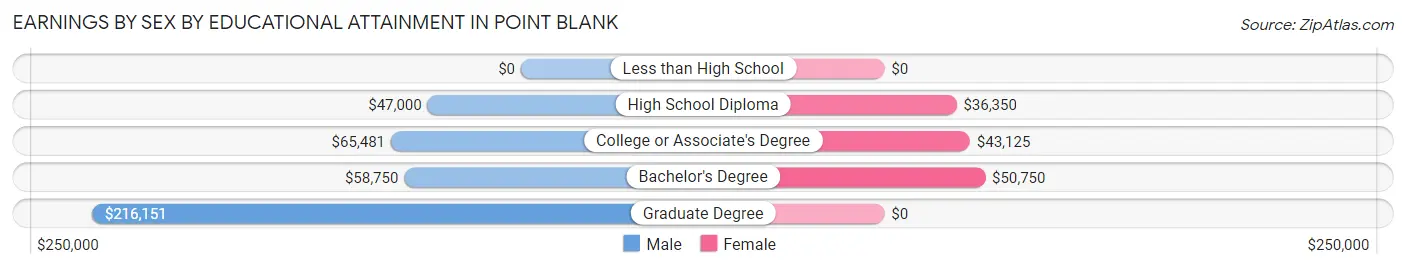
Earnings by Sex by Educational Attainment in Point Blank
Average earnings in Point Blank are $65,865 for men and $37,350 for women, a difference of 43.3%. Men with an educational attainment of graduate degree enjoy the highest average annual earnings of $216,151, while those with high school diploma education earn the least with $47,000. Women with an educational attainment of bachelor's degree earn the most with the average annual earnings of $50,750, while those with high school diploma education have the smallest earnings of $36,350.
| Educational Attainment | Male Income | Female Income |
| Less than High School | - | - |
| High School Diploma | $47,000 | $36,350 |
| College or Associate's Degree | $65,481 | $43,125 |
| Bachelor's Degree | $58,750 | $50,750 |
| Graduate Degree | $216,151 | $0 |
| Total | $65,865 | $37,350 |
Family Income in Point Blank
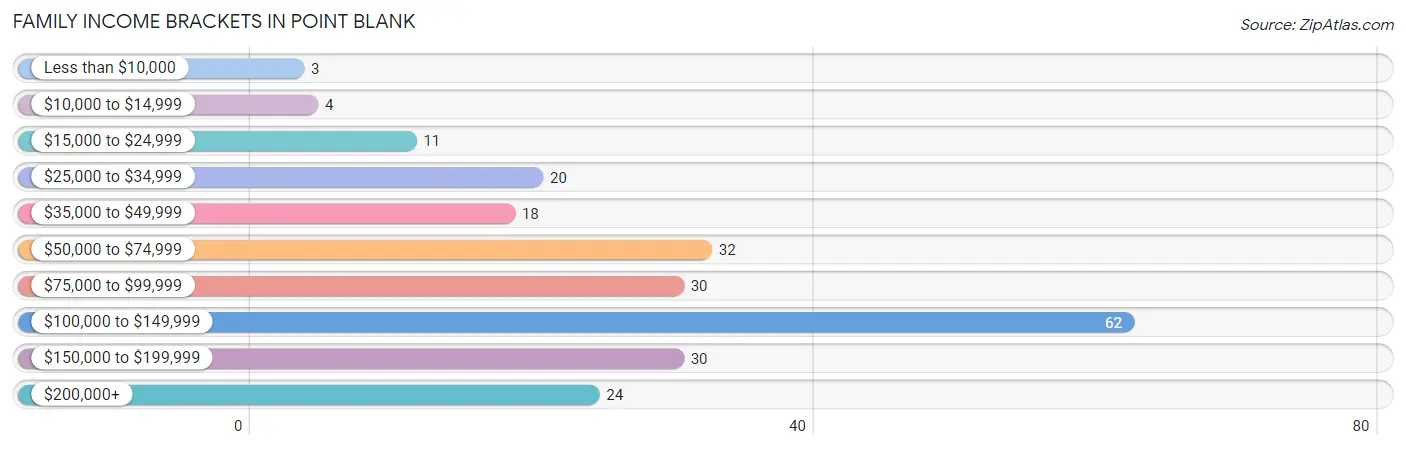
Family Income Brackets in Point Blank
According to the Point Blank family income data, there are 62 families falling into the $100,000 to $149,999 income range, which is the most common income bracket and makes up 26.5% of all families. Conversely, the less than $10,000 income bracket is the least frequent group with only 3 families (1.3%) belonging to this category.
| Income Bracket | # Families | % Families |
| Less than $10,000 | 3 | 1.3% |
| $10,000 to $14,999 | 4 | 1.7% |
| $15,000 to $24,999 | 11 | 4.7% |
| $25,000 to $34,999 | 20 | 8.5% |
| $35,000 to $49,999 | 18 | 7.7% |
| $50,000 to $74,999 | 32 | 13.7% |
| $75,000 to $99,999 | 30 | 12.8% |
| $100,000 to $149,999 | 62 | 26.5% |
| $150,000 to $199,999 | 30 | 12.8% |
| $200,000+ | 24 | 10.3% |
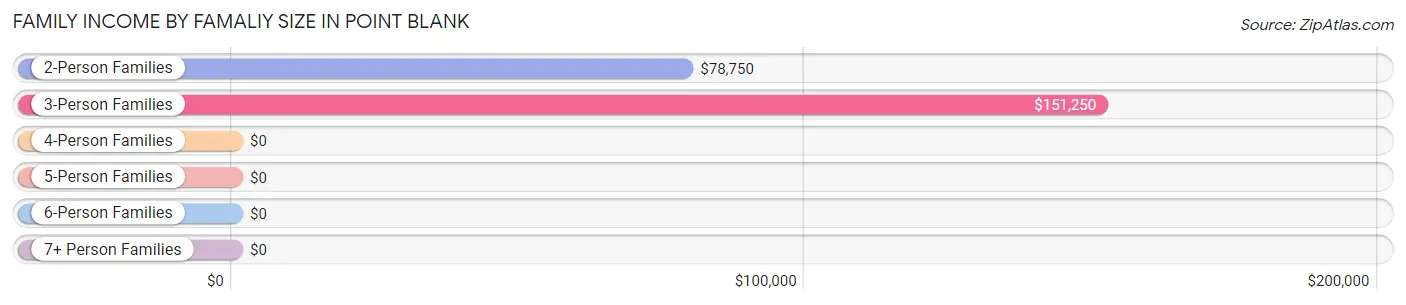
Family Income by Famaliy Size in Point Blank
3-person families (66 | 28.2%) account for the highest median family income in Point Blank with $151,250 per family, while 3-person families (66 | 28.2%) have the highest median income of $50,417 per family member.
| Income Bracket | # Families | Median Income |
| 2-Person Families | 166 (70.9%) | $78,750 |
| 3-Person Families | 66 (28.2%) | $151,250 |
| 4-Person Families | 0 (0.0%) | $0 |
| 5-Person Families | 2 (0.9%) | $0 |
| 6-Person Families | 0 (0.0%) | $0 |
| 7+ Person Families | 0 (0.0%) | $0 |
| Total | 234 (100.0%) | $97,222 |
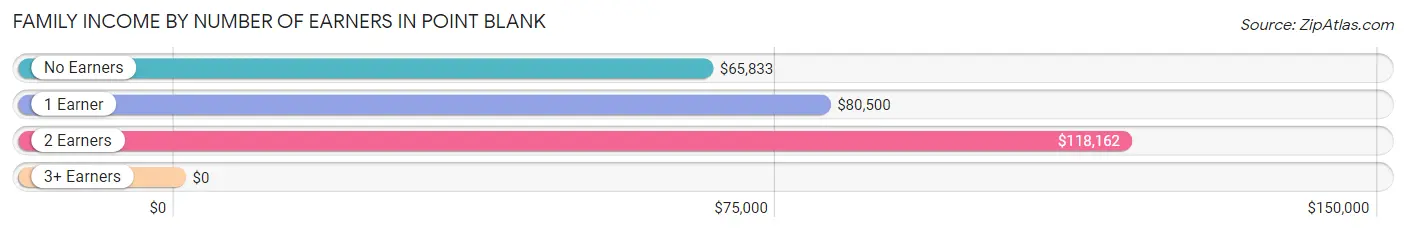
Family Income by Number of Earners in Point Blank
| Number of Earners | # Families | Median Income |
| No Earners | 56 (23.9%) | $65,833 |
| 1 Earner | 92 (39.3%) | $80,500 |
| 2 Earners | 71 (30.3%) | $118,162 |
| 3+ Earners | 15 (6.4%) | $0 |
| Total | 234 (100.0%) | $97,222 |
Household Income in Point Blank
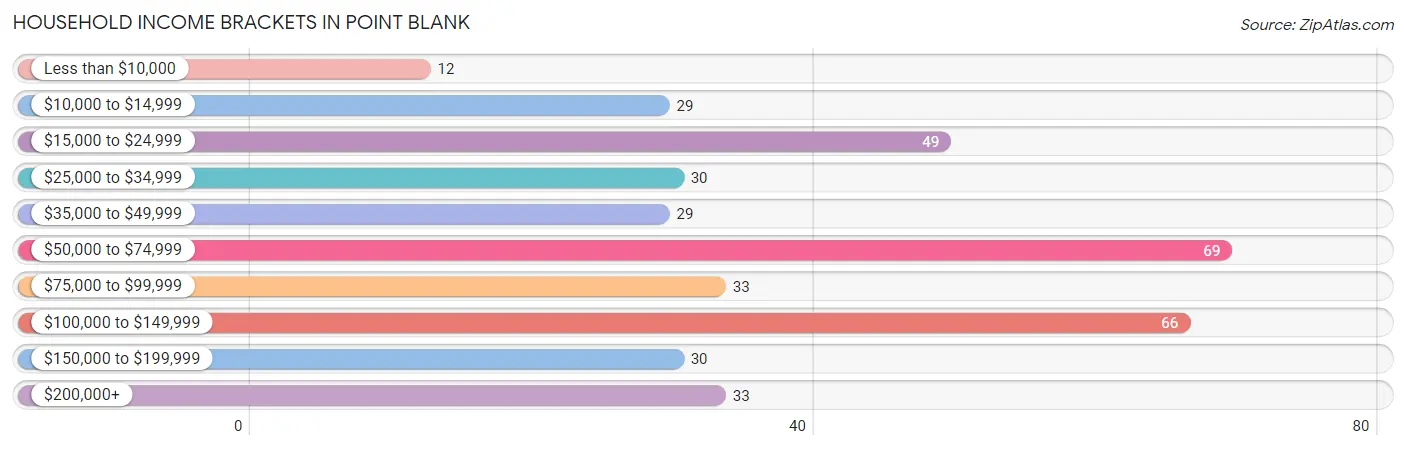
Household Income Brackets in Point Blank
With 69 households falling in the category, the $50,000 to $74,999 income range is the most frequent in Point Blank, accounting for 18.2% of all households. In contrast, only 12 households (3.2%) fall into the less than $10,000 income bracket, making it the least populous group.
| Income Bracket | # Households | % Households |
| Less than $10,000 | 12 | 3.2% |
| $10,000 to $14,999 | 29 | 7.6% |
| $15,000 to $24,999 | 49 | 12.9% |
| $25,000 to $34,999 | 30 | 7.9% |
| $35,000 to $49,999 | 29 | 7.6% |
| $50,000 to $74,999 | 69 | 18.2% |
| $75,000 to $99,999 | 33 | 8.7% |
| $100,000 to $149,999 | 66 | 17.4% |
| $150,000 to $199,999 | 30 | 7.9% |
| $200,000+ | 33 | 8.7% |
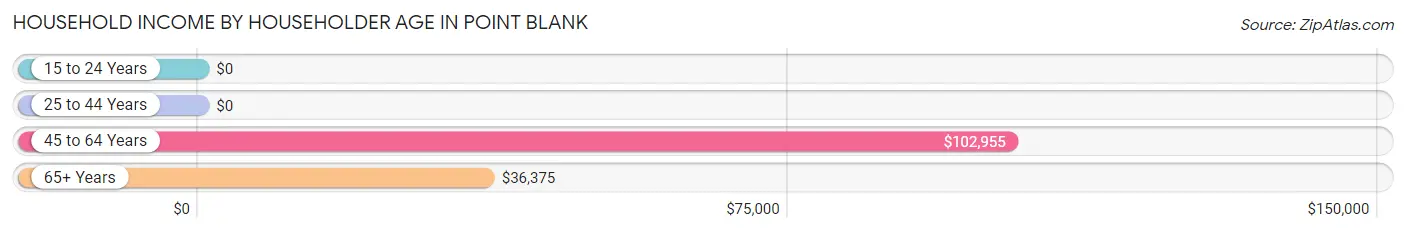
Household Income by Householder Age in Point Blank
The median household income in Point Blank is $58,942, with the highest median household income of $102,955 found in the 45 to 64 years age bracket for the primary householder. A total of 174 households (45.8%) fall into this category.
| Income Bracket | # Households | Median Income |
| 15 to 24 Years | 0 (0.0%) | $0 |
| 25 to 44 Years | 45 (11.8%) | $0 |
| 45 to 64 Years | 174 (45.8%) | $102,955 |
| 65+ Years | 161 (42.4%) | $36,375 |
| Total | 380 (100.0%) | $58,942 |
Poverty in Point Blank
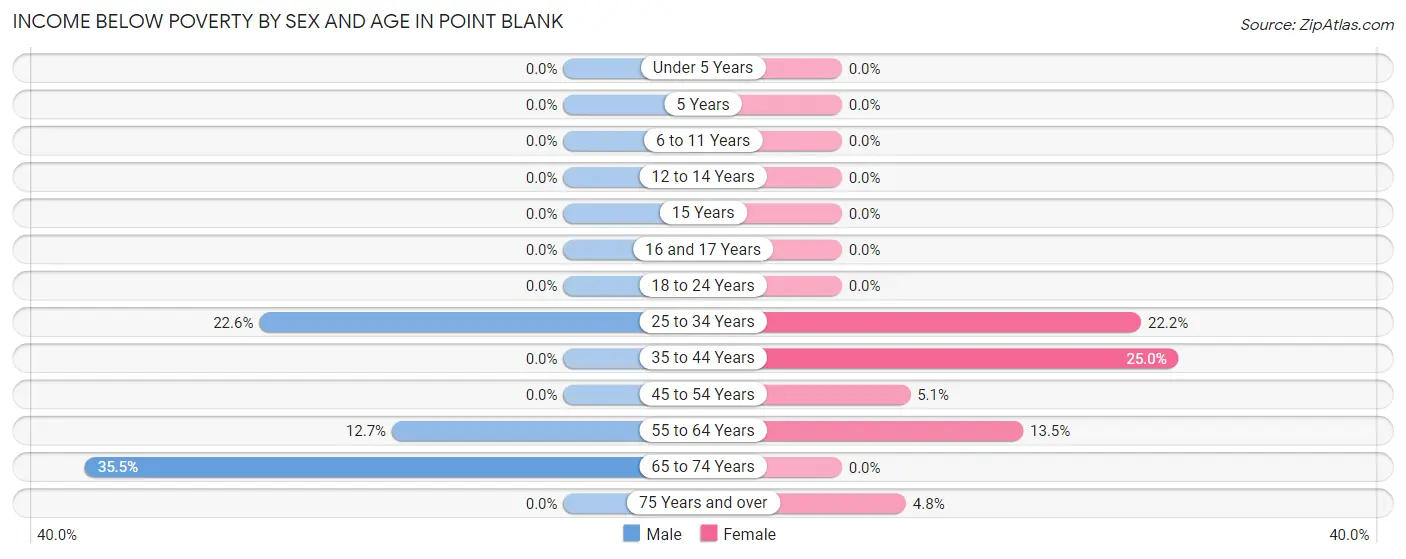
Income Below Poverty by Sex and Age in Point Blank
With 9.4% poverty level for males and 8.5% for females among the residents of Point Blank, 65 to 74 year old males and 35 to 44 year old females are the most vulnerable to poverty, with 27 males (35.5%) and 3 females (25.0%) in their respective age groups living below the poverty level.
| Age Bracket | Male | Female |
| Under 5 Years | 0 (0.0%) | 0 (0.0%) |
| 5 Years | 0 (0.0%) | 0 (0.0%) |
| 6 to 11 Years | 0 (0.0%) | 0 (0.0%) |
| 12 to 14 Years | 0 (0.0%) | 0 (0.0%) |
| 15 Years | 0 (0.0%) | 0 (0.0%) |
| 16 and 17 Years | 0 (0.0%) | 0 (0.0%) |
| 18 to 24 Years | 0 (0.0%) | 0 (0.0%) |
| 25 to 34 Years | 7 (22.6%) | 4 (22.2%) |
| 35 to 44 Years | 0 (0.0%) | 3 (25.0%) |
| 45 to 54 Years | 0 (0.0%) | 3 (5.1%) |
| 55 to 64 Years | 14 (12.7%) | 14 (13.5%) |
| 65 to 74 Years | 27 (35.5%) | 0 (0.0%) |
| 75 Years and over | 0 (0.0%) | 2 (4.8%) |
| Total | 48 (9.4%) | 26 (8.5%) |
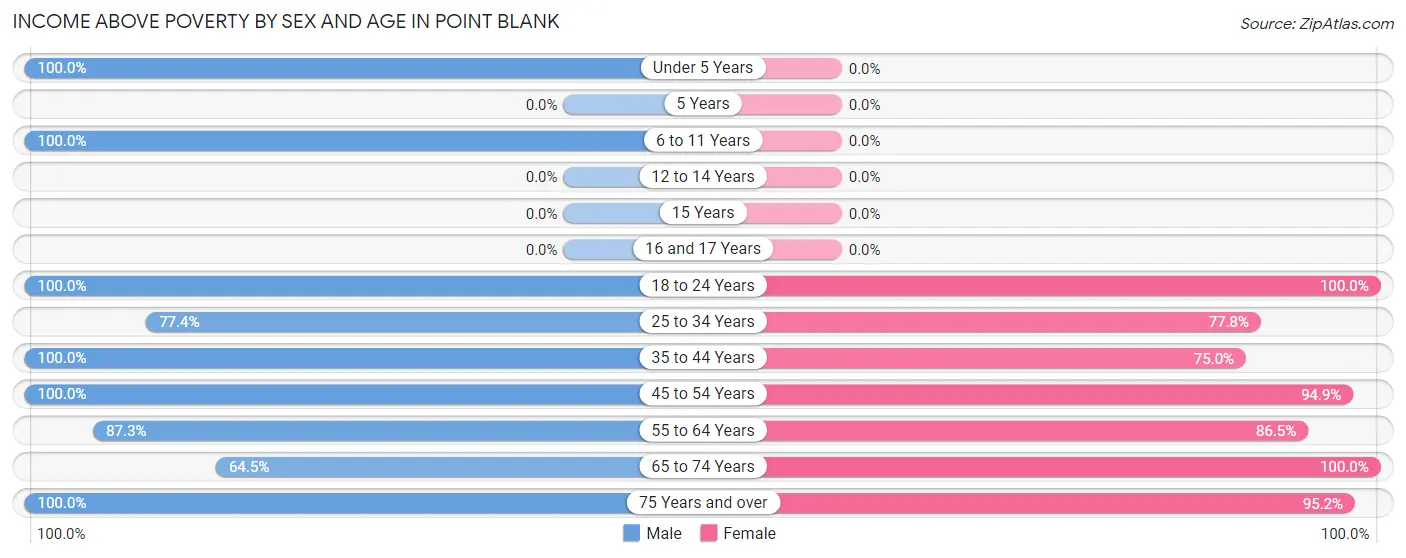
Income Above Poverty by Sex and Age in Point Blank
According to the poverty statistics in Point Blank, males aged under 5 years and females aged 18 to 24 years are the age groups that are most secure financially, with 100.0% of males and 100.0% of females in these age groups living above the poverty line.
| Age Bracket | Male | Female |
| Under 5 Years | 7 (100.0%) | 0 (0.0%) |
| 5 Years | 0 (0.0%) | 0 (0.0%) |
| 6 to 11 Years | 74 (100.0%) | 0 (0.0%) |
| 12 to 14 Years | 0 (0.0%) | 0 (0.0%) |
| 15 Years | 0 (0.0%) | 0 (0.0%) |
| 16 and 17 Years | 0 (0.0%) | 0 (0.0%) |
| 18 to 24 Years | 19 (100.0%) | 9 (100.0%) |
| 25 to 34 Years | 24 (77.4%) | 14 (77.8%) |
| 35 to 44 Years | 69 (100.0%) | 9 (75.0%) |
| 45 to 54 Years | 74 (100.0%) | 56 (94.9%) |
| 55 to 64 Years | 96 (87.3%) | 90 (86.5%) |
| 65 to 74 Years | 49 (64.5%) | 61 (100.0%) |
| 75 Years and over | 51 (100.0%) | 40 (95.2%) |
| Total | 463 (90.6%) | 279 (91.5%) |
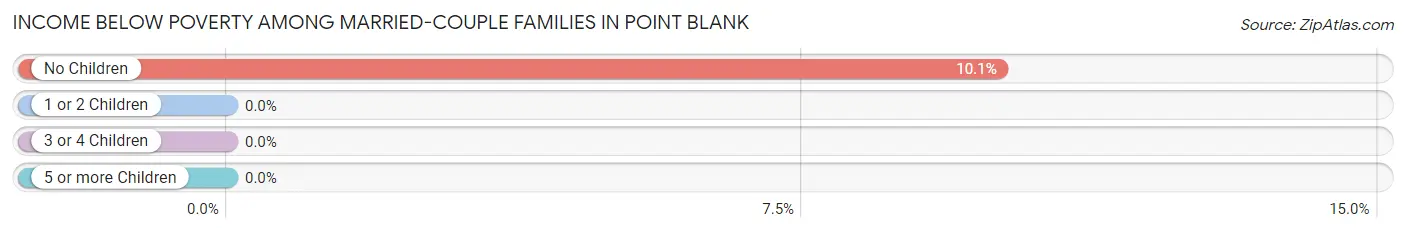
Income Below Poverty Among Married-Couple Families in Point Blank
The poverty statistics for married-couple families in Point Blank show that 9.4% or 18 of the total 191 families live below the poverty line. Families with no children have the highest poverty rate of 10.1%, comprising of 18 families. On the other hand, families with 1 or 2 children have the lowest poverty rate of 0.0%, which includes 0 families.
| Children | Above Poverty | Below Poverty |
| No Children | 161 (89.9%) | 18 (10.1%) |
| 1 or 2 Children | 12 (100.0%) | 0 (0.0%) |
| 3 or 4 Children | 0 (0.0%) | 0 (0.0%) |
| 5 or more Children | 0 (0.0%) | 0 (0.0%) |
| Total | 173 (90.6%) | 18 (9.4%) |
Income Below Poverty Among Single-Parent Households in Point Blank
| Children | Single Father | Single Mother |
| No Children | 0 (0.0%) | 0 (0.0%) |
| 1 or 2 Children | 0 (0.0%) | 0 (0.0%) |
| 3 or 4 Children | 0 (0.0%) | 0 (0.0%) |
| 5 or more Children | 0 (0.0%) | 0 (0.0%) |
| Total | 0 (0.0%) | 0 (0.0%) |
Income Below Poverty Among Married-Couple vs Single-Parent Households in Point Blank
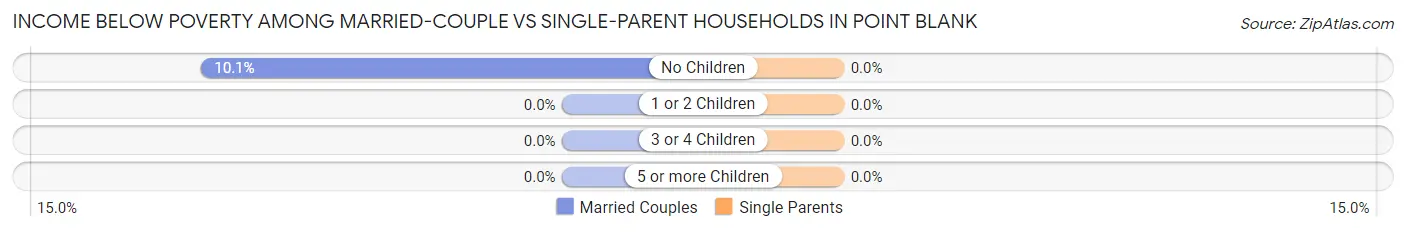
| Children | Married-Couple Families | Single-Parent Households |
| No Children | 18 (10.1%) | 0 (0.0%) |
| 1 or 2 Children | 0 (0.0%) | 0 (0.0%) |
| 3 or 4 Children | 0 (0.0%) | 0 (0.0%) |
| 5 or more Children | 0 (0.0%) | 0 (0.0%) |
| Total | 18 (9.4%) | 0 (0.0%) |
Race in Point Blank
The most populous races in Point Blank are White / Caucasian (633 | 77.6%), Two or more Races (77 | 9.4%), and Black / African American (61 | 7.5%).
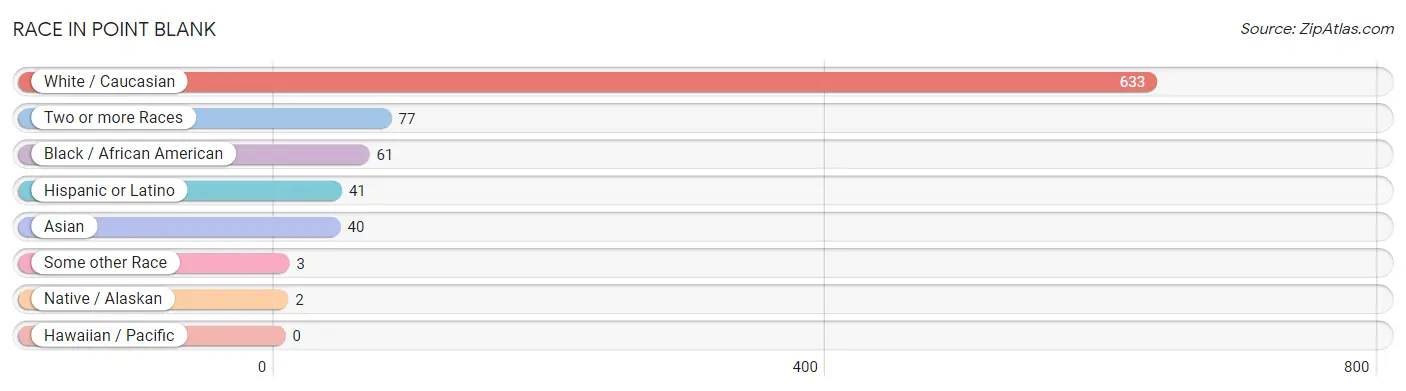
| Race | # Population | % Population |
| Asian | 40 | 4.9% |
| Black / African American | 61 | 7.5% |
| Hawaiian / Pacific | 0 | 0.0% |
| Hispanic or Latino | 41 | 5.0% |
| Native / Alaskan | 2 | 0.3% |
| White / Caucasian | 633 | 77.6% |
| Two or more Races | 77 | 9.4% |
| Some other Race | 3 | 0.4% |
| Total | 816 | 100.0% |
Ancestry in Point Blank
The most populous ancestries reported in Point Blank are American (94 | 11.5%), German (90 | 11.0%), Irish (67 | 8.2%), European (65 | 8.0%), and English (60 | 7.3%), together accounting for 46.1% of all Point Blank residents.
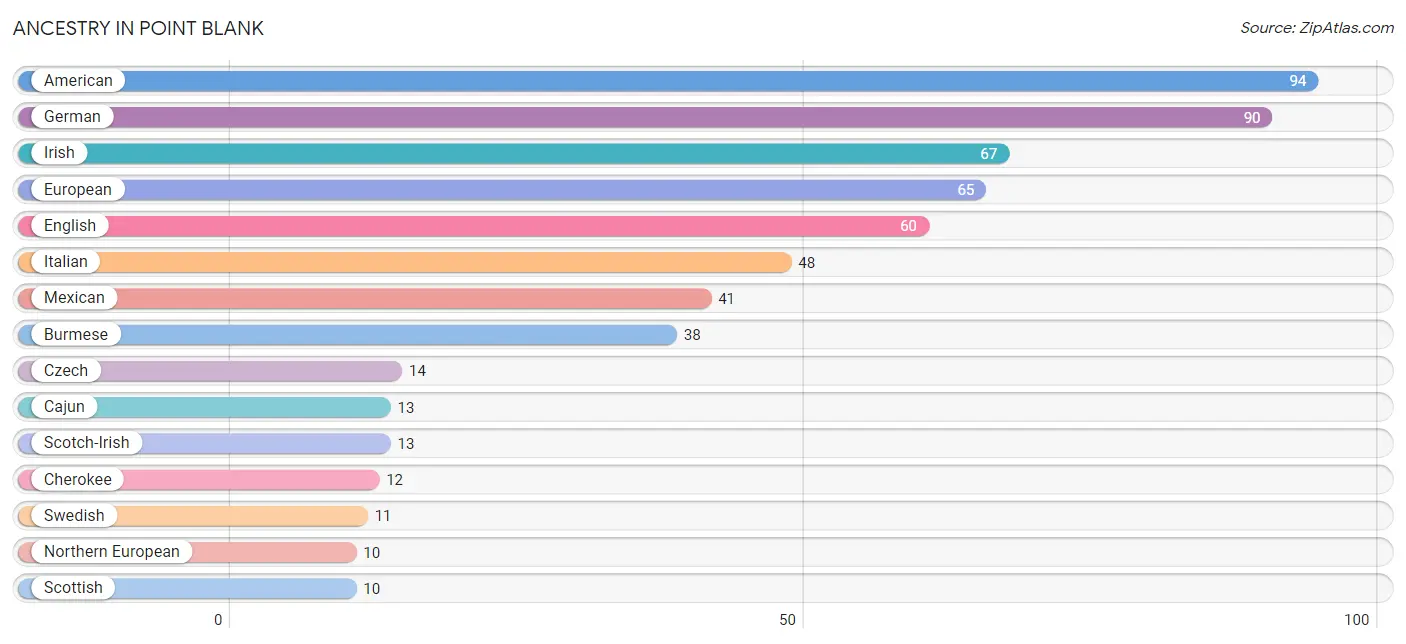
| Ancestry | # Population | % Population |
| American | 94 | 11.5% |
| Burmese | 38 | 4.7% |
| Cajun | 13 | 1.6% |
| Cherokee | 12 | 1.5% |
| Choctaw | 6 | 0.7% |
| Czech | 14 | 1.7% |
| Danish | 2 | 0.3% |
| Dutch | 2 | 0.3% |
| English | 60 | 7.3% |
| European | 65 | 8.0% |
| French | 4 | 0.5% |
| German | 90 | 11.0% |
| Hungarian | 3 | 0.4% |
| Irish | 67 | 8.2% |
| Italian | 48 | 5.9% |
| Korean | 2 | 0.3% |
| Mexican | 41 | 5.0% |
| Northern European | 10 | 1.2% |
| Polish | 6 | 0.7% |
| Russian | 2 | 0.3% |
| Scandinavian | 7 | 0.9% |
| Scotch-Irish | 13 | 1.6% |
| Scottish | 10 | 1.2% |
| Swedish | 11 | 1.3% | View All 24 Rows |
Immigrants in Point Blank
The most numerous immigrant groups reported in Point Blank came from Asia (40 | 4.9%), Eastern Asia (38 | 4.7%), Korea (38 | 4.7%), Central America (18 | 2.2%), and Latin America (18 | 2.2%), together accounting for 18.6% of all Point Blank residents.
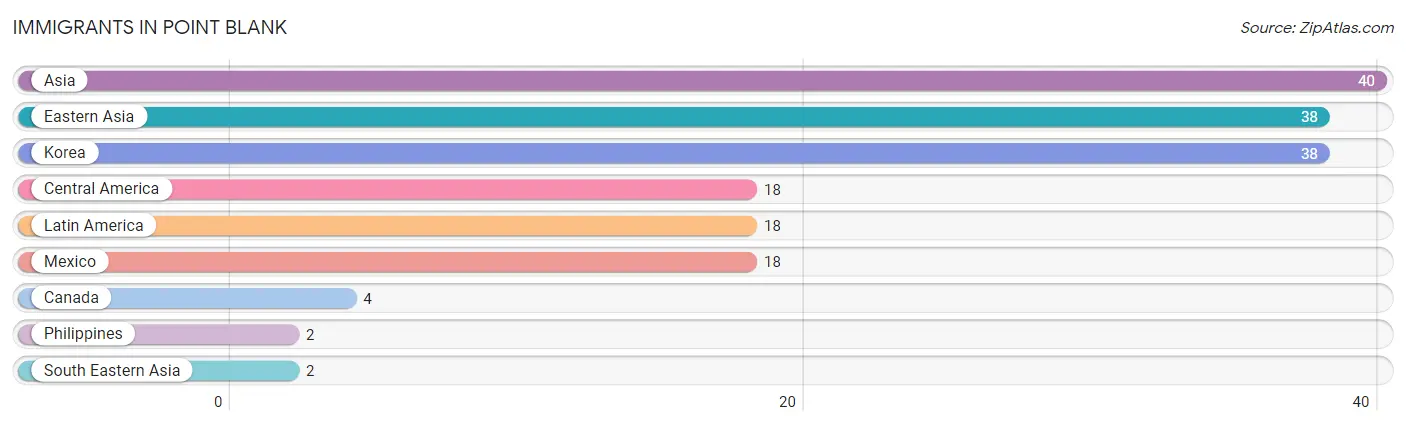
| Immigration Origin | # Population | % Population |
| Asia | 40 | 4.9% |
| Canada | 4 | 0.5% |
| Central America | 18 | 2.2% |
| Eastern Asia | 38 | 4.7% |
| Korea | 38 | 4.7% |
| Latin America | 18 | 2.2% |
| Mexico | 18 | 2.2% |
| Philippines | 2 | 0.3% |
| South Eastern Asia | 2 | 0.3% | View All 9 Rows |
Sex and Age in Point Blank
Sex and Age in Point Blank
The most populous age groups in Point Blank are 5 to 9 Years (67 | 13.1%) for men and 60 to 64 Years (70 | 23.0%) for women.
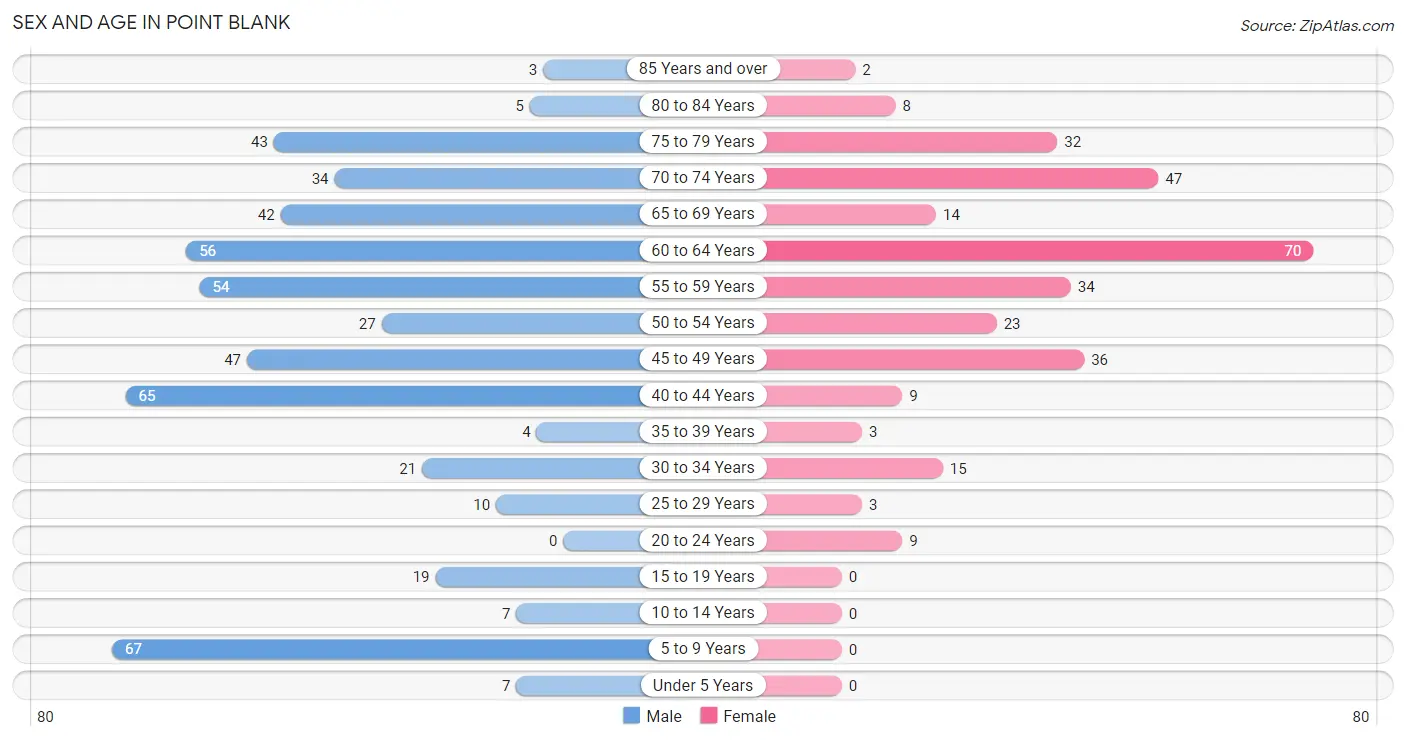
| Age Bracket | Male | Female |
| Under 5 Years | 7 (1.4%) | 0 (0.0%) |
| 5 to 9 Years | 67 (13.1%) | 0 (0.0%) |
| 10 to 14 Years | 7 (1.4%) | 0 (0.0%) |
| 15 to 19 Years | 19 (3.7%) | 0 (0.0%) |
| 20 to 24 Years | 0 (0.0%) | 9 (2.9%) |
| 25 to 29 Years | 10 (2.0%) | 3 (1.0%) |
| 30 to 34 Years | 21 (4.1%) | 15 (4.9%) |
| 35 to 39 Years | 4 (0.8%) | 3 (1.0%) |
| 40 to 44 Years | 65 (12.7%) | 9 (2.9%) |
| 45 to 49 Years | 47 (9.2%) | 36 (11.8%) |
| 50 to 54 Years | 27 (5.3%) | 23 (7.5%) |
| 55 to 59 Years | 54 (10.6%) | 34 (11.2%) |
| 60 to 64 Years | 56 (11.0%) | 70 (23.0%) |
| 65 to 69 Years | 42 (8.2%) | 14 (4.6%) |
| 70 to 74 Years | 34 (6.7%) | 47 (15.4%) |
| 75 to 79 Years | 43 (8.4%) | 32 (10.5%) |
| 80 to 84 Years | 5 (1.0%) | 8 (2.6%) |
| 85 Years and over | 3 (0.6%) | 2 (0.7%) |
| Total | 511 (100.0%) | 305 (100.0%) |
Families and Households in Point Blank
Median Family Size in Point Blank
The median family size in Point Blank is 2.73 persons per family, with single male/father families (31 | 13.3%) accounting for the largest median family size of 3 persons per family. On the other hand, single female/mother families (12 | 5.1%) represent the smallest median family size with 2.33 persons per family.
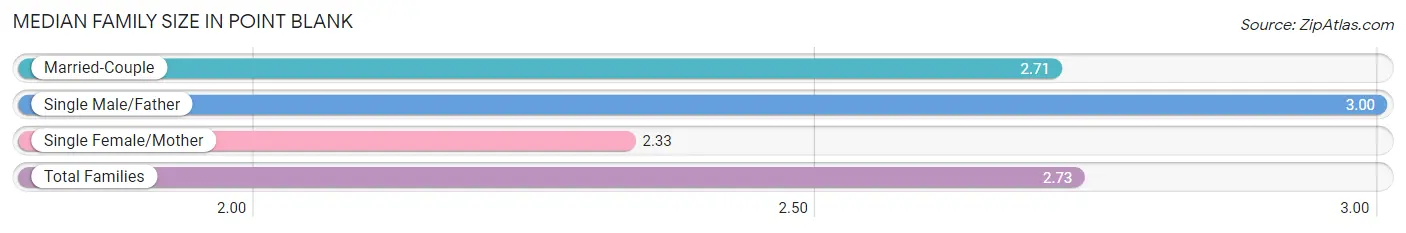
| Family Type | # Families | Family Size |
| Married-Couple | 191 (81.6%) | 2.71 |
| Single Male/Father | 31 (13.3%) | 3.00 |
| Single Female/Mother | 12 (5.1%) | 2.33 |
| Total Families | 234 (100.0%) | 2.73 |
Median Household Size in Point Blank
The median household size in Point Blank is 2.15 persons per household, with single male/father households (31 | 8.2%) accounting for the largest median household size of 3.42 persons per household. non-family households (146 | 38.4%) represent the smallest median household size with 1.12 persons per household.
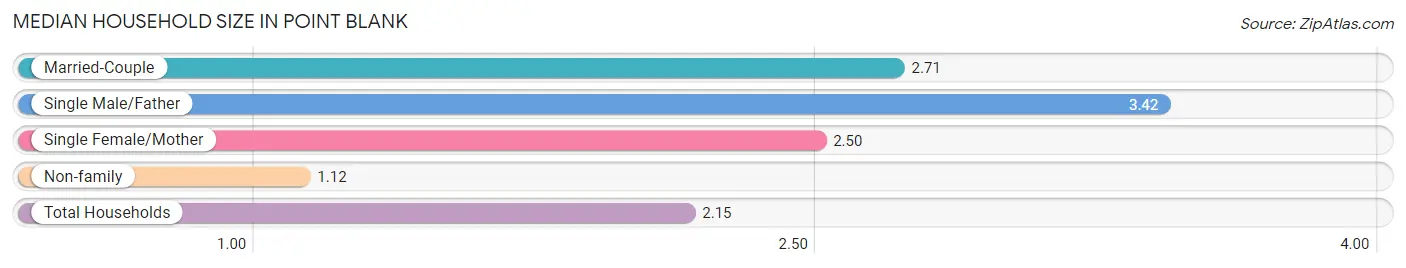
| Household Type | # Households | Household Size |
| Married-Couple | 191 (50.3%) | 2.71 |
| Single Male/Father | 31 (8.2%) | 3.42 |
| Single Female/Mother | 12 (3.2%) | 2.50 |
| Non-family | 146 (38.4%) | 1.12 |
| Total Households | 380 (100.0%) | 2.15 |
Household Size by Marriage Status in Point Blank
Out of a total of 380 households in Point Blank, 234 (61.6%) are family households, while 146 (38.4%) are nonfamily households. The most numerous type of family households are 2-person households, comprising 163, and the most common type of nonfamily households are 1-person households, comprising 127.
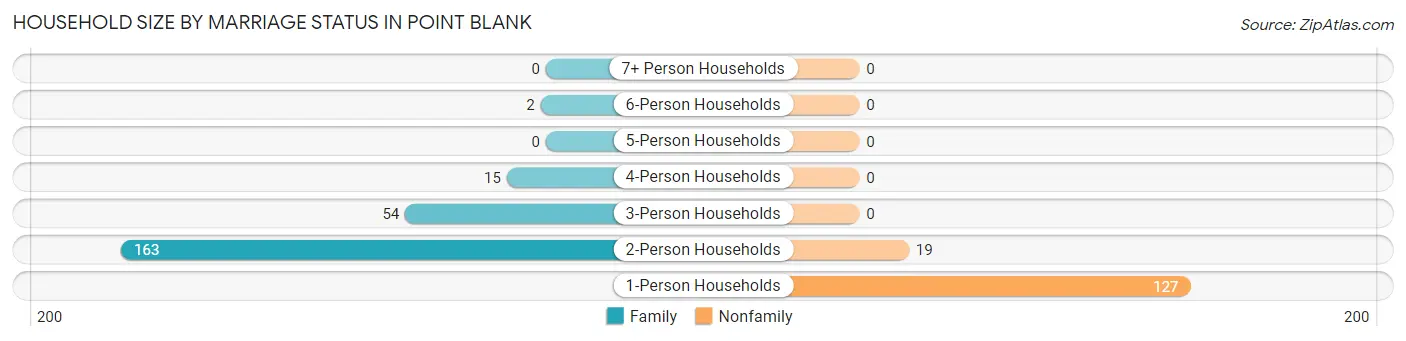
| Household Size | Family Households | Nonfamily Households |
| 1-Person Households | - | 127 (33.4%) |
| 2-Person Households | 163 (42.9%) | 19 (5.0%) |
| 3-Person Households | 54 (14.2%) | 0 (0.0%) |
| 4-Person Households | 15 (4.0%) | 0 (0.0%) |
| 5-Person Households | 0 (0.0%) | 0 (0.0%) |
| 6-Person Households | 2 (0.5%) | 0 (0.0%) |
| 7+ Person Households | 0 (0.0%) | 0 (0.0%) |
| Total | 234 (61.6%) | 146 (38.4%) |
Female Fertility in Point Blank
Fertility by Age in Point Blank
| Age Bracket | Women with Births | Births / 1,000 Women |
| 15 to 19 years | 0 (0.0%) | 0.0 |
| 20 to 34 years | 0 (0.0%) | 0.0 |
| 35 to 50 years | 0 (0.0%) | 0.0 |
| Total | 0 (0.0%) | 0.0 |
Fertility by Age by Marriage Status in Point Blank
| Age Bracket | Married | Unmarried |
| 15 to 19 years | 0 (0.0%) | 0 (0.0%) |
| 20 to 34 years | 0 (0.0%) | 0 (0.0%) |
| 35 to 50 years | 0 (0.0%) | 0 (0.0%) |
| Total | 0 (0.0%) | 0 (0.0%) |
Fertility by Education in Point Blank
| Educational Attainment | Women with Births | Births / 1,000 Women |
| Less than High School | 0 (0.0%) | 0.0 |
| High School Diploma | 0 (0.0%) | 0.0 |
| College or Associate's Degree | 0 (0.0%) | 0.0 |
| Bachelor's Degree | 0 (0.0%) | 0.0 |
| Graduate Degree | 0 (0.0%) | 0.0 |
| Total | 0 (0.0%) | 0.0 |
Fertility by Education by Marriage Status in Point Blank
| Educational Attainment | Married | Unmarried |
| Less than High School | 0 (0.0%) | 0 (0.0%) |
| High School Diploma | 0 (0.0%) | 0 (0.0%) |
| College or Associate's Degree | 0 (0.0%) | 0 (0.0%) |
| Bachelor's Degree | 0 (0.0%) | 0 (0.0%) |
| Graduate Degree | 0 (0.0%) | 0 (0.0%) |
| Total | 0 (0.0%) | 0 (0.0%) |
Employment Characteristics in Point Blank
Employment by Class of Employer in Point Blank
Among the 352 employed individuals in Point Blank, private company employees (237 | 67.3%), state government employees (52 | 14.8%), and self-employed (not incorporated) (25 | 7.1%) make up the most common classes of employment.
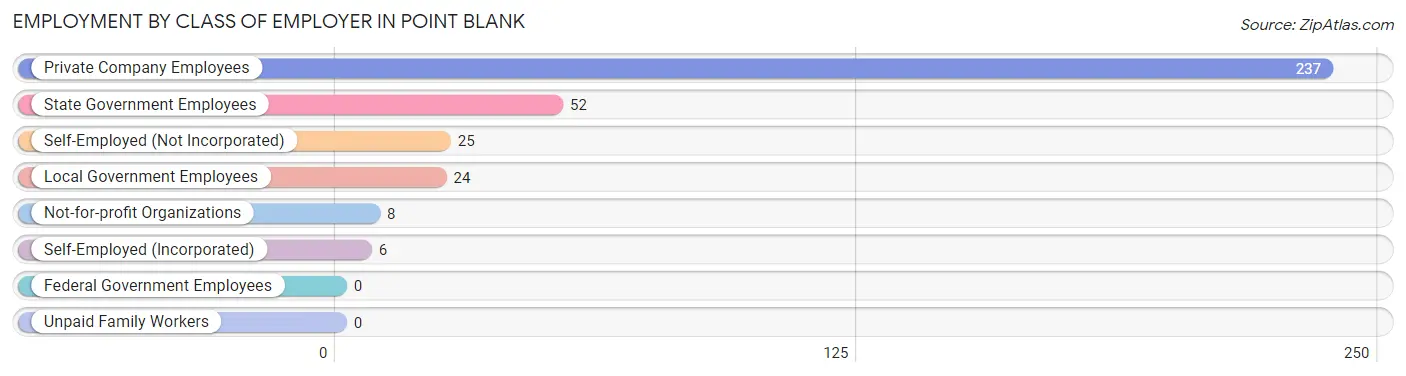
| Employer Class | # Employees | % Employees |
| Private Company Employees | 237 | 67.3% |
| Self-Employed (Incorporated) | 6 | 1.7% |
| Self-Employed (Not Incorporated) | 25 | 7.1% |
| Not-for-profit Organizations | 8 | 2.3% |
| Local Government Employees | 24 | 6.8% |
| State Government Employees | 52 | 14.8% |
| Federal Government Employees | 0 | 0.0% |
| Unpaid Family Workers | 0 | 0.0% |
| Total | 352 | 100.0% |
Employment Status by Age in Point Blank
According to the labor force statistics for Point Blank, out of the total population over 16 years of age (735), 55.2% or 406 individuals are in the labor force, with 9.4% or 38 of them unemployed. The age group with the highest labor force participation rate is 16 to 19 years, with 100.0% or 19 individuals in the labor force. Within the labor force, the 16 to 19 years age range has the highest percentage of unemployed individuals, with 100.0% or 19 of them being unemployed.
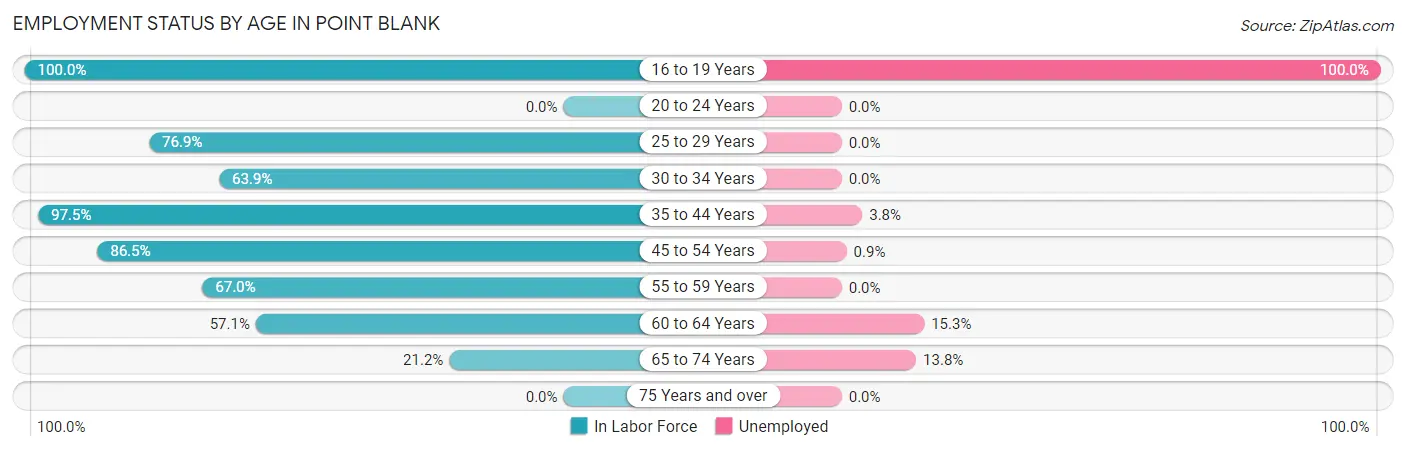
| Age Bracket | In Labor Force | Unemployed |
| 16 to 19 Years | 19 (100.0%) | 19 (100.0%) |
| 20 to 24 Years | 0 (0.0%) | 0 (0.0%) |
| 25 to 29 Years | 10 (76.9%) | 0 (0.0%) |
| 30 to 34 Years | 23 (63.9%) | 0 (0.0%) |
| 35 to 44 Years | 79 (97.5%) | 3 (3.8%) |
| 45 to 54 Years | 115 (86.5%) | 1 (0.9%) |
| 55 to 59 Years | 59 (67.0%) | 0 (0.0%) |
| 60 to 64 Years | 72 (57.1%) | 11 (15.3%) |
| 65 to 74 Years | 29 (21.2%) | 4 (13.8%) |
| 75 Years and over | 0 (0.0%) | 0 (0.0%) |
| Total | 406 (55.2%) | 38 (9.4%) |
Employment Status by Educational Attainment in Point Blank
According to labor force statistics for Point Blank, 75.1% of individuals (358) out of the total population between 25 and 64 years of age (477) are in the labor force, with 4.2% or 15 of them being unemployed. The group with the highest labor force participation rate are those with the educational attainment of bachelor's degree or higher, with 81.6% or 111 individuals in the labor force. Within the labor force, individuals with college / associate degree education have the highest percentage of unemployment, with 8.3% or 12 of them being unemployed.
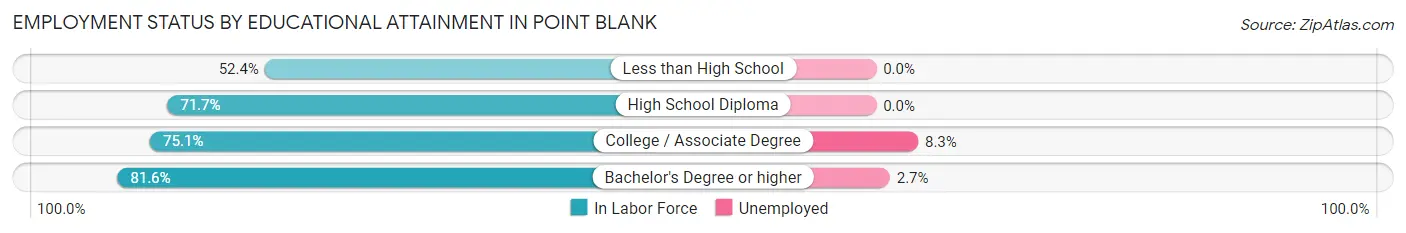
| Educational Attainment | In Labor Force | Unemployed |
| Less than High School | 11 (52.4%) | 0 (0.0%) |
| High School Diploma | 91 (71.7%) | 0 (0.0%) |
| College / Associate Degree | 145 (75.1%) | 16 (8.3%) |
| Bachelor's Degree or higher | 111 (81.6%) | 4 (2.7%) |
| Total | 358 (75.1%) | 20 (4.2%) |
Employment Occupations by Sex in Point Blank
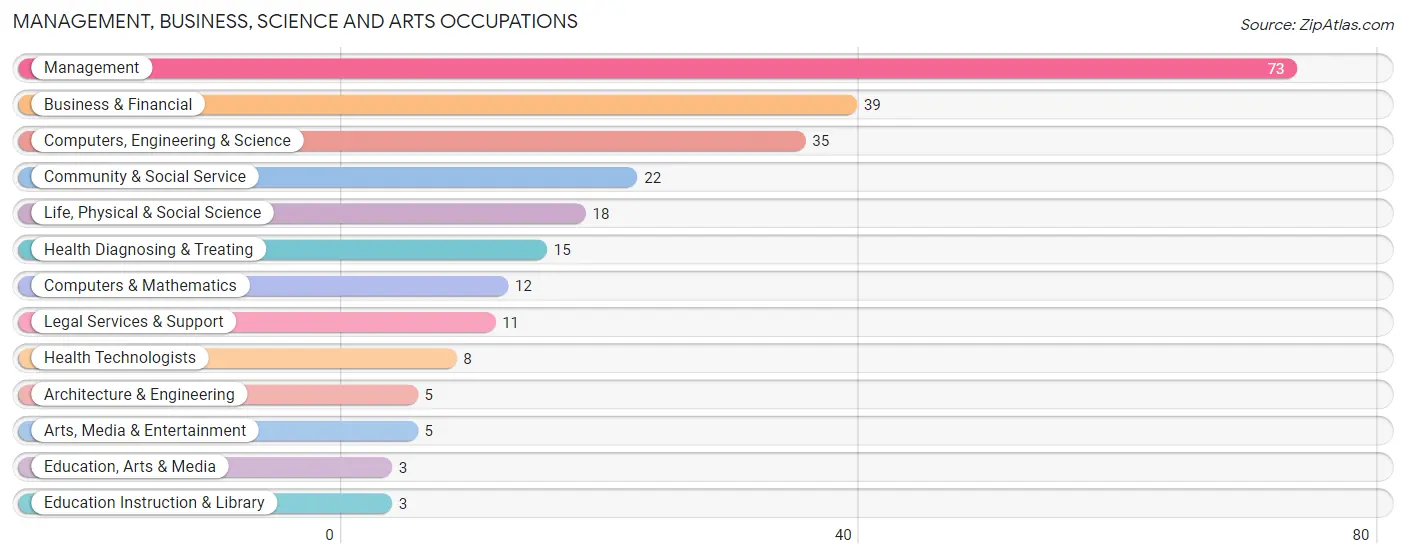
Management, Business, Science and Arts Occupations
The most common Management, Business, Science and Arts occupations in Point Blank are Management (73 | 19.8%), Business & Financial (39 | 10.6%), Computers, Engineering & Science (35 | 9.5%), Community & Social Service (22 | 6.0%), and Life, Physical & Social Science (18 | 4.9%).
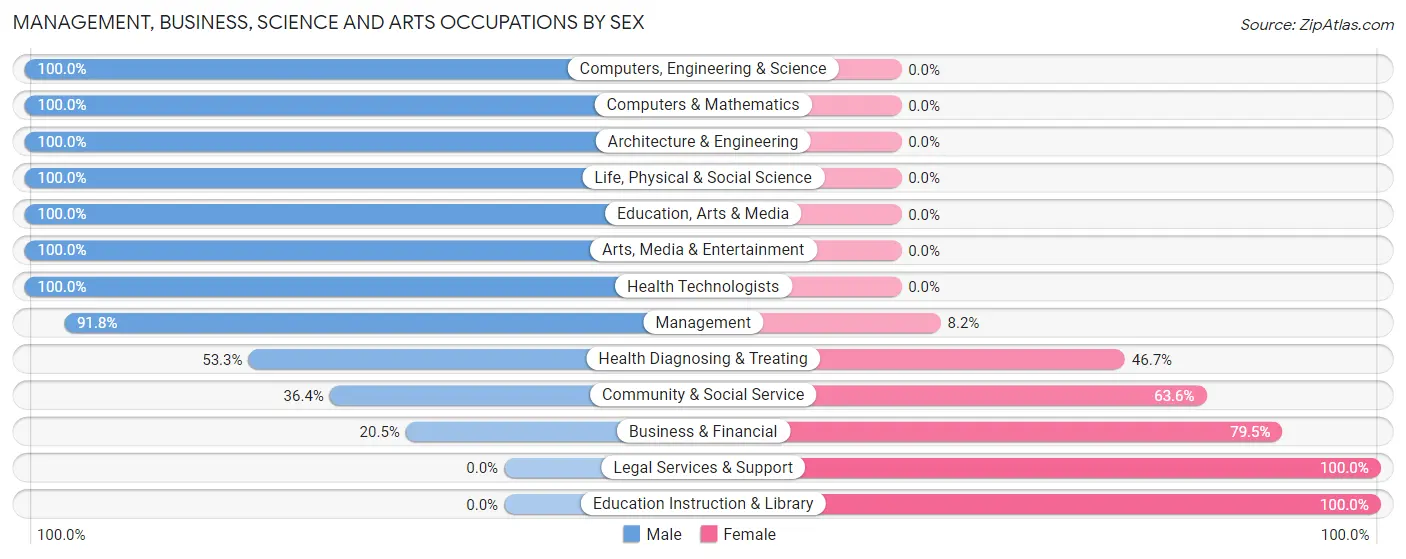
Management, Business, Science and Arts Occupations by Sex
Within the Management, Business, Science and Arts occupations in Point Blank, the most male-oriented occupations are Computers, Engineering & Science (100.0%), Computers & Mathematics (100.0%), and Architecture & Engineering (100.0%), while the most female-oriented occupations are Legal Services & Support (100.0%), Education Instruction & Library (100.0%), and Business & Financial (79.5%).
| Occupation | Male | Female |
| Management | 67 (91.8%) | 6 (8.2%) |
| Business & Financial | 8 (20.5%) | 31 (79.5%) |
| Computers, Engineering & Science | 35 (100.0%) | 0 (0.0%) |
| Computers & Mathematics | 12 (100.0%) | 0 (0.0%) |
| Architecture & Engineering | 5 (100.0%) | 0 (0.0%) |
| Life, Physical & Social Science | 18 (100.0%) | 0 (0.0%) |
| Community & Social Service | 8 (36.4%) | 14 (63.6%) |
| Education, Arts & Media | 3 (100.0%) | 0 (0.0%) |
| Legal Services & Support | 0 (0.0%) | 11 (100.0%) |
| Education Instruction & Library | 0 (0.0%) | 3 (100.0%) |
| Arts, Media & Entertainment | 5 (100.0%) | 0 (0.0%) |
| Health Diagnosing & Treating | 8 (53.3%) | 7 (46.7%) |
| Health Technologists | 8 (100.0%) | 0 (0.0%) |
| Total (Category) | 126 (68.5%) | 58 (31.5%) |
| Total (Overall) | 238 (64.7%) | 130 (35.3%) |
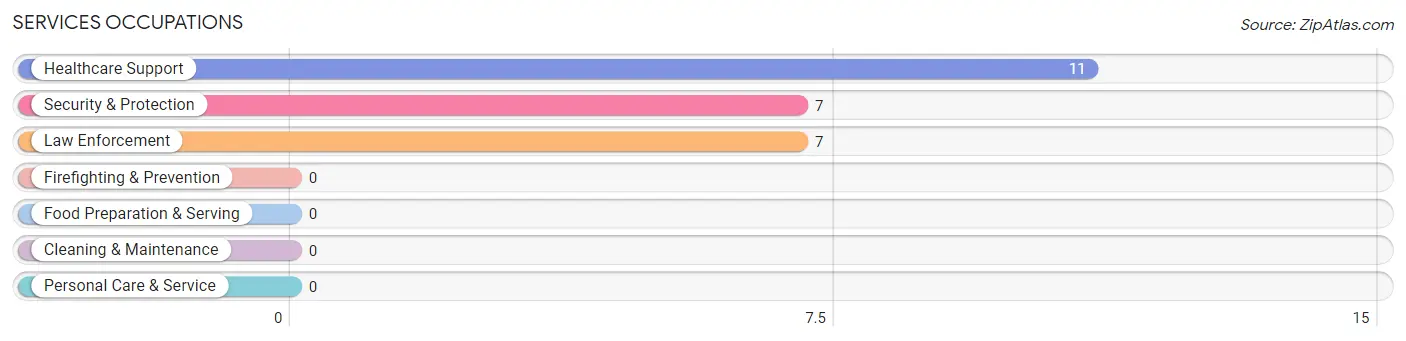
Services Occupations
The most common Services occupations in Point Blank are Healthcare Support (11 | 3.0%), Security & Protection (7 | 1.9%), and Law Enforcement (7 | 1.9%).
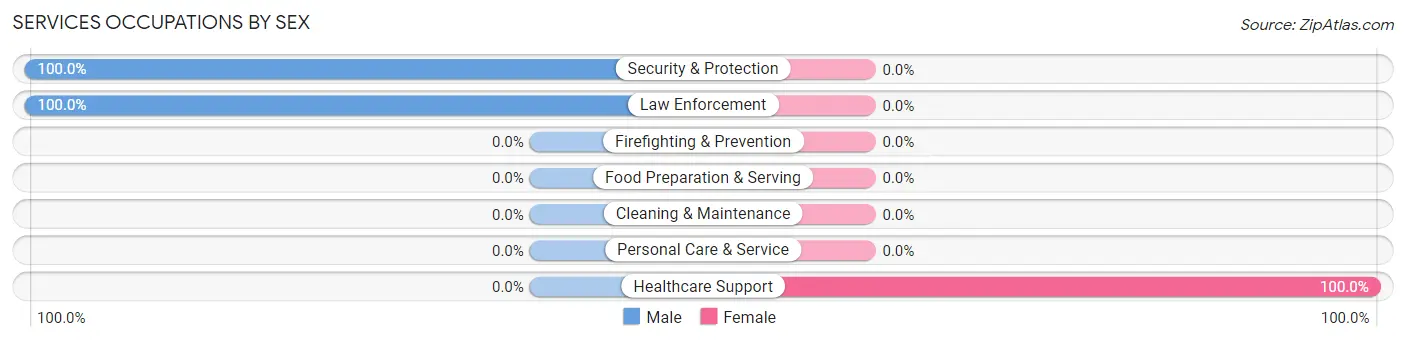
Services Occupations by Sex
| Occupation | Male | Female |
| Healthcare Support | 0 (0.0%) | 11 (100.0%) |
| Security & Protection | 7 (100.0%) | 0 (0.0%) |
| Firefighting & Prevention | 0 (0.0%) | 0 (0.0%) |
| Law Enforcement | 7 (100.0%) | 0 (0.0%) |
| Food Preparation & Serving | 0 (0.0%) | 0 (0.0%) |
| Cleaning & Maintenance | 0 (0.0%) | 0 (0.0%) |
| Personal Care & Service | 0 (0.0%) | 0 (0.0%) |
| Total (Category) | 7 (38.9%) | 11 (61.1%) |
| Total (Overall) | 238 (64.7%) | 130 (35.3%) |
Sales and Office Occupations
The most common Sales and Office occupations in Point Blank are Office & Administration (58 | 15.8%), and Sales & Related (15 | 4.1%).
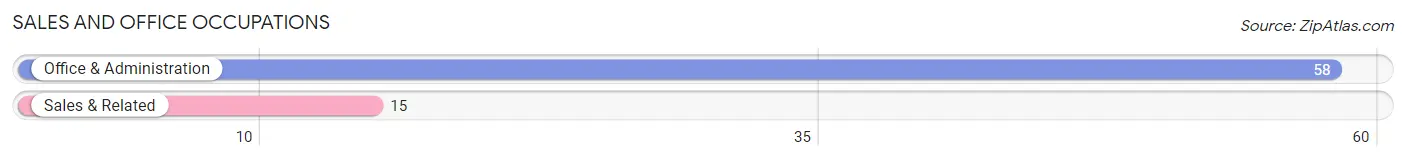
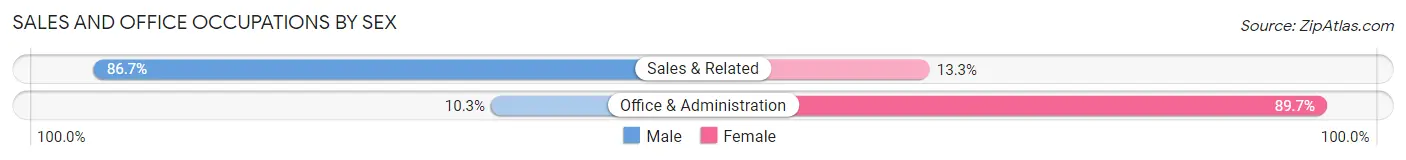
Sales and Office Occupations by Sex
| Occupation | Male | Female |
| Sales & Related | 13 (86.7%) | 2 (13.3%) |
| Office & Administration | 6 (10.3%) | 52 (89.7%) |
| Total (Category) | 19 (26.0%) | 54 (74.0%) |
| Total (Overall) | 238 (64.7%) | 130 (35.3%) |
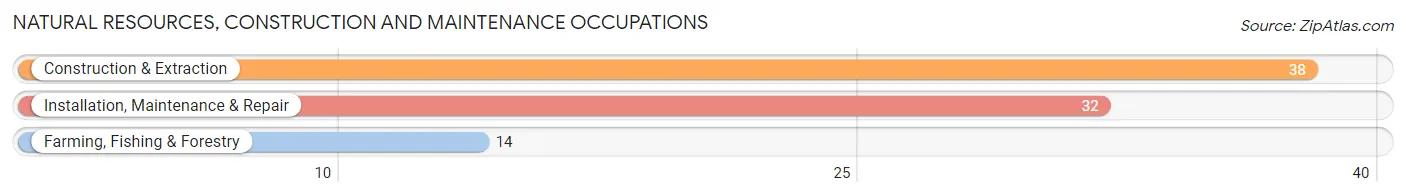
Natural Resources, Construction and Maintenance Occupations
The most common Natural Resources, Construction and Maintenance occupations in Point Blank are Construction & Extraction (38 | 10.3%), Installation, Maintenance & Repair (32 | 8.7%), and Farming, Fishing & Forestry (14 | 3.8%).
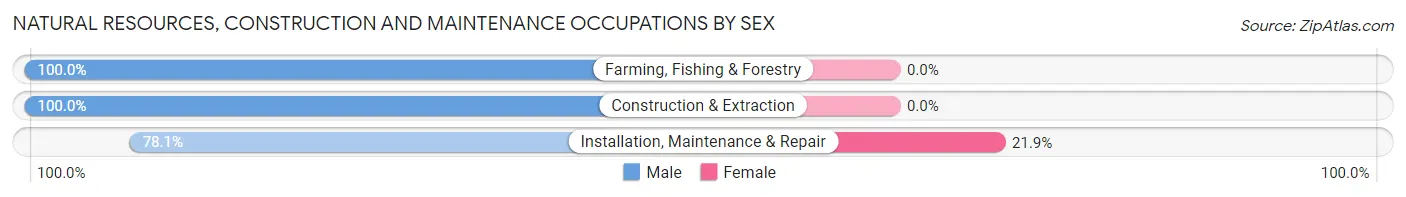
Natural Resources, Construction and Maintenance Occupations by Sex
| Occupation | Male | Female |
| Farming, Fishing & Forestry | 14 (100.0%) | 0 (0.0%) |
| Construction & Extraction | 38 (100.0%) | 0 (0.0%) |
| Installation, Maintenance & Repair | 25 (78.1%) | 7 (21.9%) |
| Total (Category) | 77 (91.7%) | 7 (8.3%) |
| Total (Overall) | 238 (64.7%) | 130 (35.3%) |
Production, Transportation and Moving Occupations
The most common Production, Transportation and Moving occupations in Point Blank are Production (6 | 1.6%), and Transportation (3 | 0.8%).
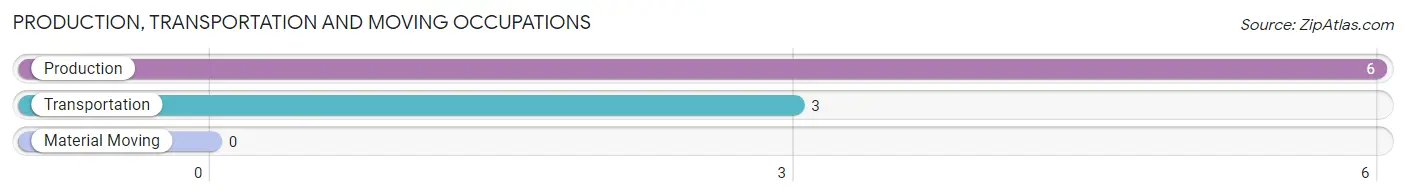
Production, Transportation and Moving Occupations by Sex
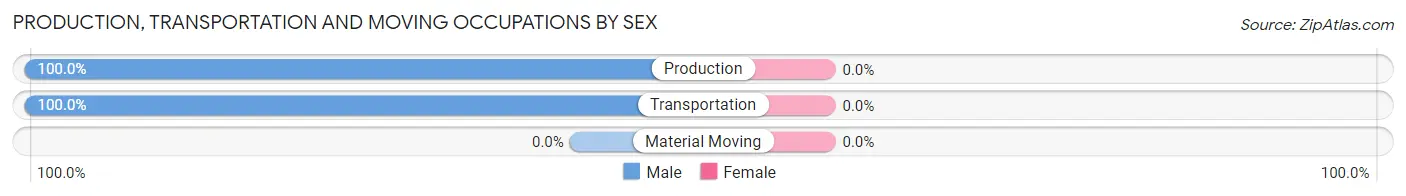
| Occupation | Male | Female |
| Production | 6 (100.0%) | 0 (0.0%) |
| Transportation | 3 (100.0%) | 0 (0.0%) |
| Material Moving | 0 (0.0%) | 0 (0.0%) |
| Total (Category) | 9 (100.0%) | 0 (0.0%) |
| Total (Overall) | 238 (64.7%) | 130 (35.3%) |
Employment Industries by Sex in Point Blank
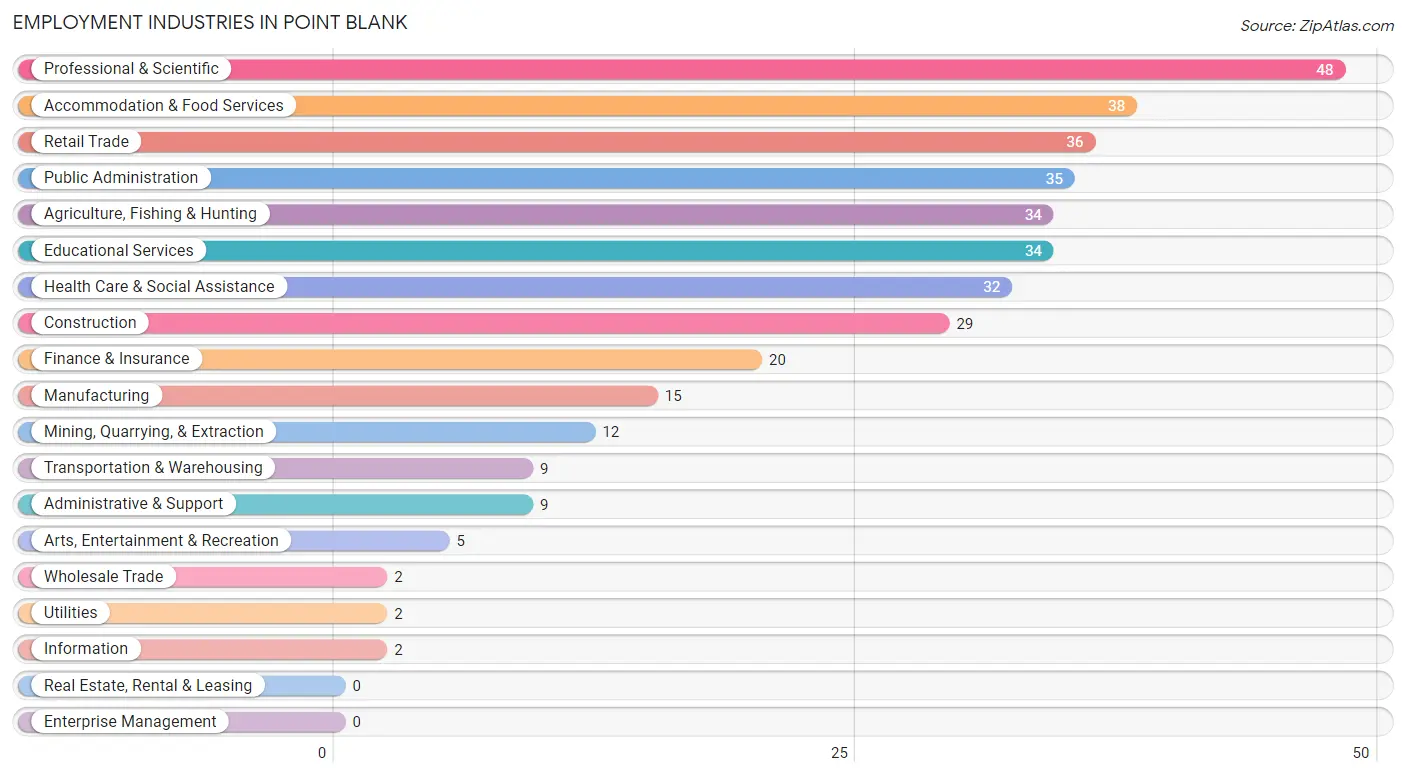
Employment Industries in Point Blank
The major employment industries in Point Blank include Professional & Scientific (48 | 13.0%), Accommodation & Food Services (38 | 10.3%), Retail Trade (36 | 9.8%), Public Administration (35 | 9.5%), and Agriculture, Fishing & Hunting (34 | 9.2%).
Employment Industries by Sex in Point Blank
The Point Blank industries that see more men than women are Agriculture, Fishing & Hunting (100.0%), Mining, Quarrying, & Extraction (100.0%), and Construction (100.0%), whereas the industries that tend to have a higher number of women are Information (100.0%), Educational Services (70.6%), and Finance & Insurance (70.0%).
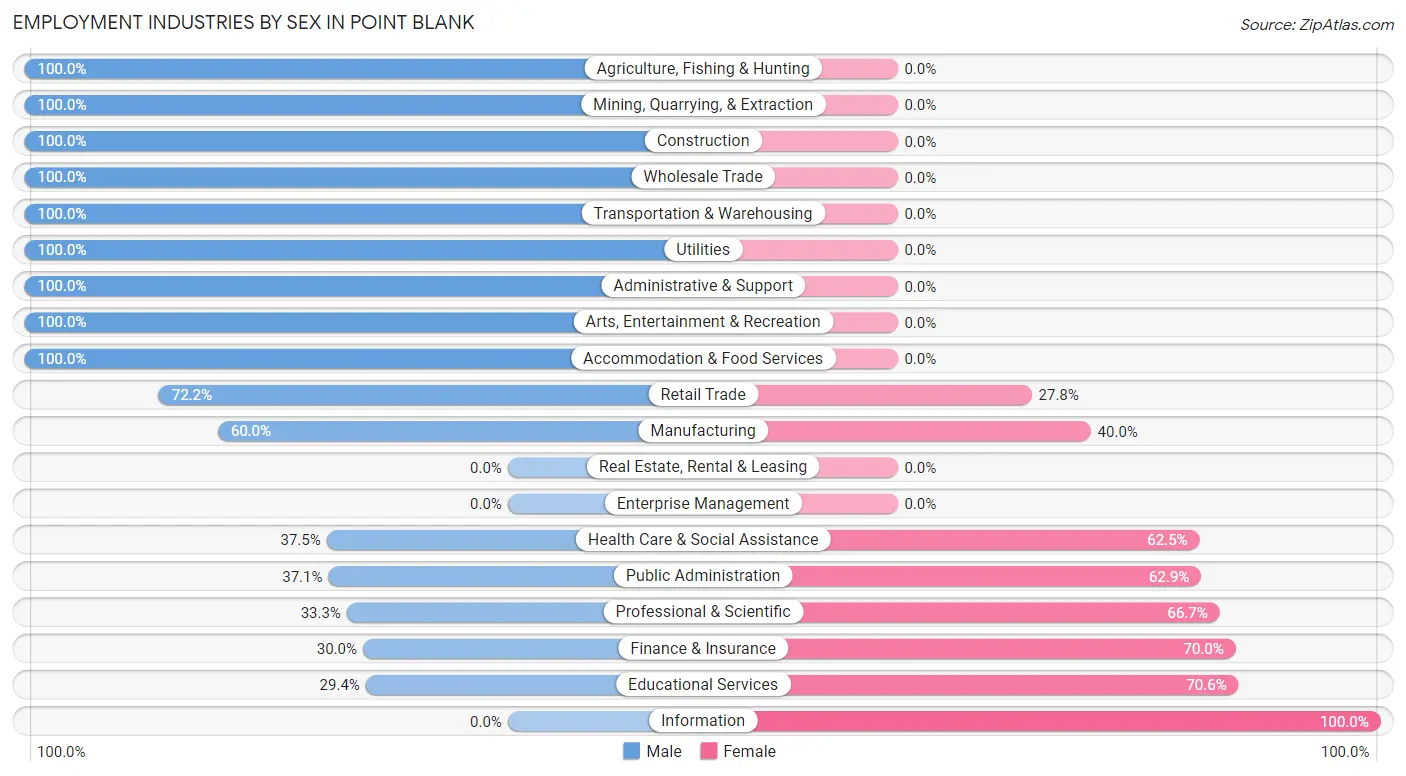
| Industry | Male | Female |
| Agriculture, Fishing & Hunting | 34 (100.0%) | 0 (0.0%) |
| Mining, Quarrying, & Extraction | 12 (100.0%) | 0 (0.0%) |
| Construction | 29 (100.0%) | 0 (0.0%) |
| Manufacturing | 9 (60.0%) | 6 (40.0%) |
| Wholesale Trade | 2 (100.0%) | 0 (0.0%) |
| Retail Trade | 26 (72.2%) | 10 (27.8%) |
| Transportation & Warehousing | 9 (100.0%) | 0 (0.0%) |
| Utilities | 2 (100.0%) | 0 (0.0%) |
| Information | 0 (0.0%) | 2 (100.0%) |
| Finance & Insurance | 6 (30.0%) | 14 (70.0%) |
| Real Estate, Rental & Leasing | 0 (0.0%) | 0 (0.0%) |
| Professional & Scientific | 16 (33.3%) | 32 (66.7%) |
| Enterprise Management | 0 (0.0%) | 0 (0.0%) |
| Administrative & Support | 9 (100.0%) | 0 (0.0%) |
| Educational Services | 10 (29.4%) | 24 (70.6%) |
| Health Care & Social Assistance | 12 (37.5%) | 20 (62.5%) |
| Arts, Entertainment & Recreation | 5 (100.0%) | 0 (0.0%) |
| Accommodation & Food Services | 38 (100.0%) | 0 (0.0%) |
| Public Administration | 13 (37.1%) | 22 (62.9%) |
| Total | 238 (64.7%) | 130 (35.3%) |
Education in Point Blank
School Enrollment in Point Blank
The most common levels of schooling among the 129 students in Point Blank are elementary school (67 | 51.9%), college / undergraduate (26 | 20.2%), and high school (21 | 16.3%).
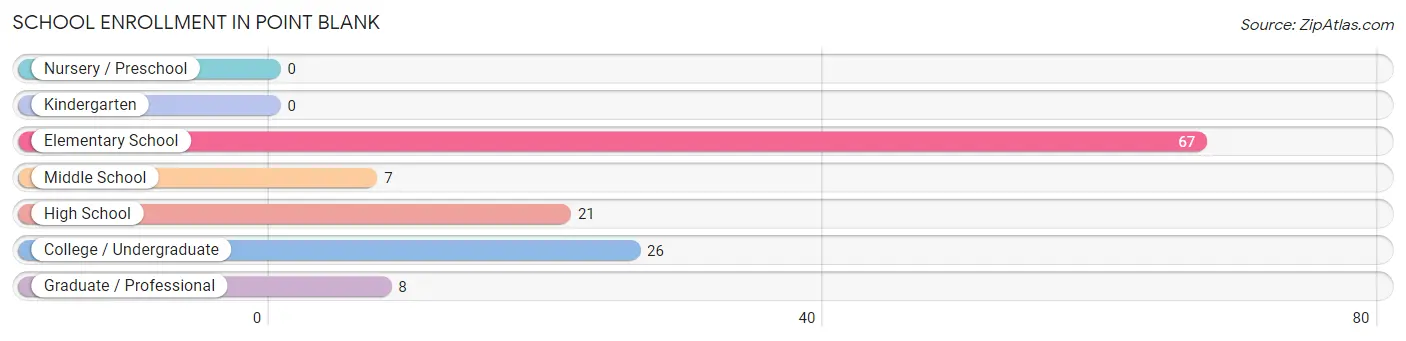
| School Level | # Students | % Students |
| Nursery / Preschool | 0 | 0.0% |
| Kindergarten | 0 | 0.0% |
| Elementary School | 67 | 51.9% |
| Middle School | 7 | 5.4% |
| High School | 21 | 16.3% |
| College / Undergraduate | 26 | 20.2% |
| Graduate / Professional | 8 | 6.2% |
| Total | 129 | 100.0% |
School Enrollment by Age by Funding Source in Point Blank
Out of a total of 129 students who are enrolled in schools in Point Blank, 2 (1.6%) attend a private institution, while the remaining 127 (98.4%) are enrolled in public schools. The age group of 35 years and over has the highest likelihood of being enrolled in private schools, with 2 (13.3% in the age bracket) enrolled. Conversely, the age group of 5 to 9 year old has the lowest likelihood of being enrolled in a private school, with 67 (100.0% in the age bracket) attending a public institution.
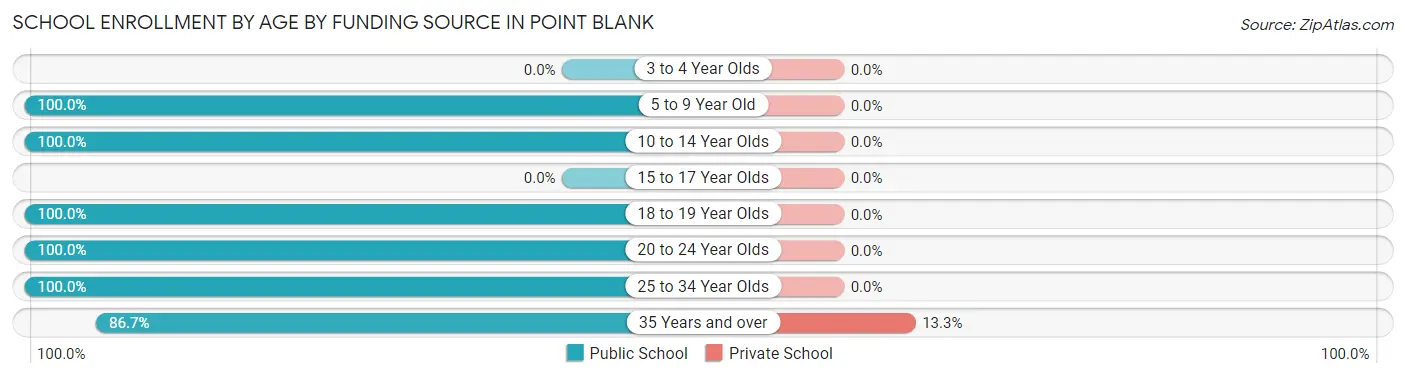
| Age Bracket | Public School | Private School |
| 3 to 4 Year Olds | 0 (0.0%) | 0 (0.0%) |
| 5 to 9 Year Old | 67 (100.0%) | 0 (0.0%) |
| 10 to 14 Year Olds | 7 (100.0%) | 0 (0.0%) |
| 15 to 17 Year Olds | 0 (0.0%) | 0 (0.0%) |
| 18 to 19 Year Olds | 19 (100.0%) | 0 (0.0%) |
| 20 to 24 Year Olds | 9 (100.0%) | 0 (0.0%) |
| 25 to 34 Year Olds | 12 (100.0%) | 0 (0.0%) |
| 35 Years and over | 13 (86.7%) | 2 (13.3%) |
| Total | 127 (98.4%) | 2 (1.6%) |
Educational Attainment by Field of Study in Point Blank
Business (69 | 35.9%), engineering (29 | 15.1%), liberal arts & history (23 | 12.0%), science & technology (15 | 7.8%), and bio, nature & agricultural (12 | 6.2%) are the most common fields of study among 192 individuals in Point Blank who have obtained a bachelor's degree or higher.
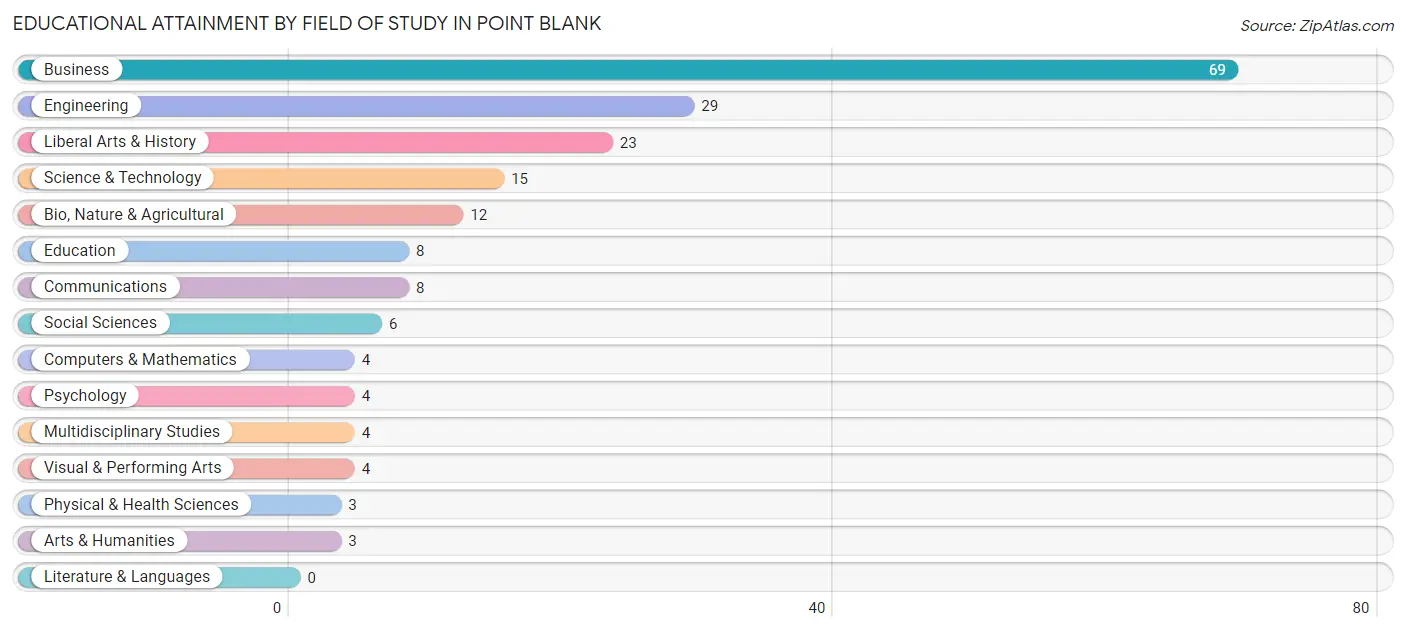
| Field of Study | # Graduates | % Graduates |
| Computers & Mathematics | 4 | 2.1% |
| Bio, Nature & Agricultural | 12 | 6.2% |
| Physical & Health Sciences | 3 | 1.6% |
| Psychology | 4 | 2.1% |
| Social Sciences | 6 | 3.1% |
| Engineering | 29 | 15.1% |
| Multidisciplinary Studies | 4 | 2.1% |
| Science & Technology | 15 | 7.8% |
| Business | 69 | 35.9% |
| Education | 8 | 4.2% |
| Literature & Languages | 0 | 0.0% |
| Liberal Arts & History | 23 | 12.0% |
| Visual & Performing Arts | 4 | 2.1% |
| Communications | 8 | 4.2% |
| Arts & Humanities | 3 | 1.6% |
| Total | 192 | 100.0% |
Transportation & Commute in Point Blank
Vehicle Availability by Sex in Point Blank
The most prevalent vehicle ownership categories in Point Blank are males with 2 vehicles (123, accounting for 52.8%) and females with 2 vehicles (54, making up 103.4%).
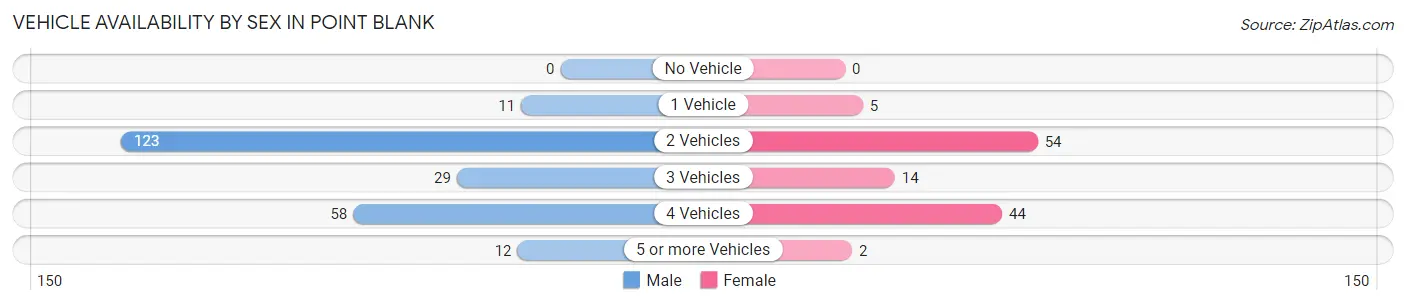
| Vehicles Available | Male | Female |
| No Vehicle | 0 (0.0%) | 0 (0.0%) |
| 1 Vehicle | 11 (4.7%) | 5 (4.2%) |
| 2 Vehicles | 123 (52.8%) | 54 (45.4%) |
| 3 Vehicles | 29 (12.4%) | 14 (11.8%) |
| 4 Vehicles | 58 (24.9%) | 44 (37.0%) |
| 5 or more Vehicles | 12 (5.1%) | 2 (1.7%) |
| Total | 233 (100.0%) | 119 (100.0%) |
Commute Time in Point Blank
The most frequently occuring commute durations in Point Blank are 90 or more minutes (93 commuters, 27.6%), 30 to 34 minutes (69 commuters, 20.5%), and 10 to 14 minutes (45 commuters, 13.4%).
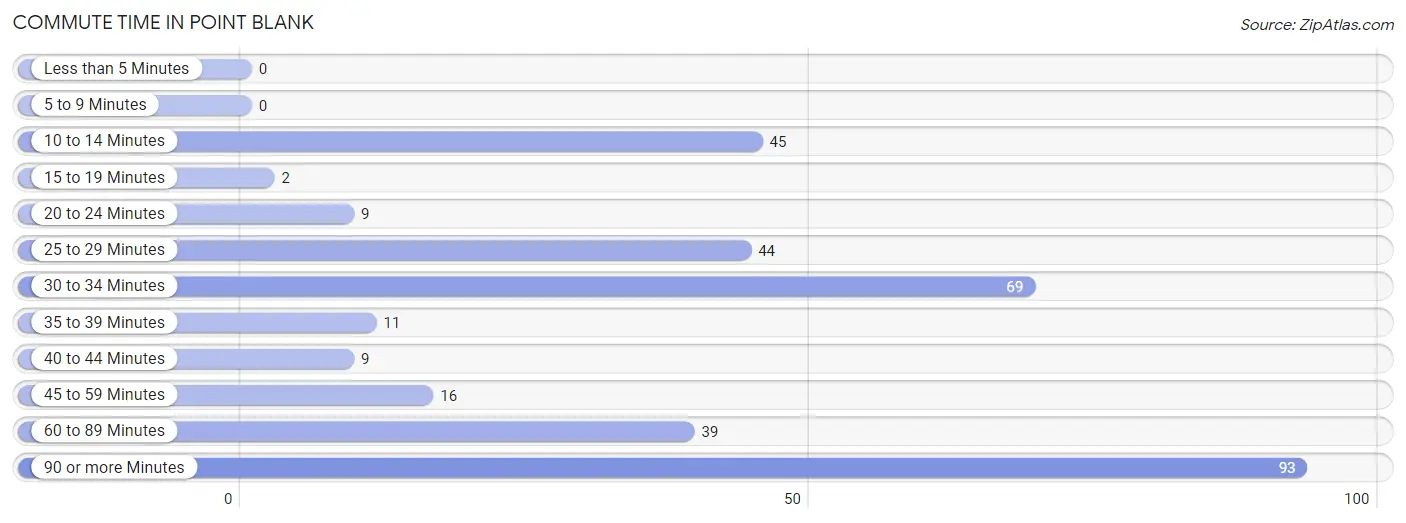
| Commute Time | # Commuters | % Commuters |
| Less than 5 Minutes | 0 | 0.0% |
| 5 to 9 Minutes | 0 | 0.0% |
| 10 to 14 Minutes | 45 | 13.4% |
| 15 to 19 Minutes | 2 | 0.6% |
| 20 to 24 Minutes | 9 | 2.7% |
| 25 to 29 Minutes | 44 | 13.1% |
| 30 to 34 Minutes | 69 | 20.5% |
| 35 to 39 Minutes | 11 | 3.3% |
| 40 to 44 Minutes | 9 | 2.7% |
| 45 to 59 Minutes | 16 | 4.8% |
| 60 to 89 Minutes | 39 | 11.6% |
| 90 or more Minutes | 93 | 27.6% |
Commute Time by Sex in Point Blank
The most common commute times in Point Blank are 90 or more minutes (93 commuters, 40.1%) for males and 10 to 14 minutes (32 commuters, 30.5%) for females.
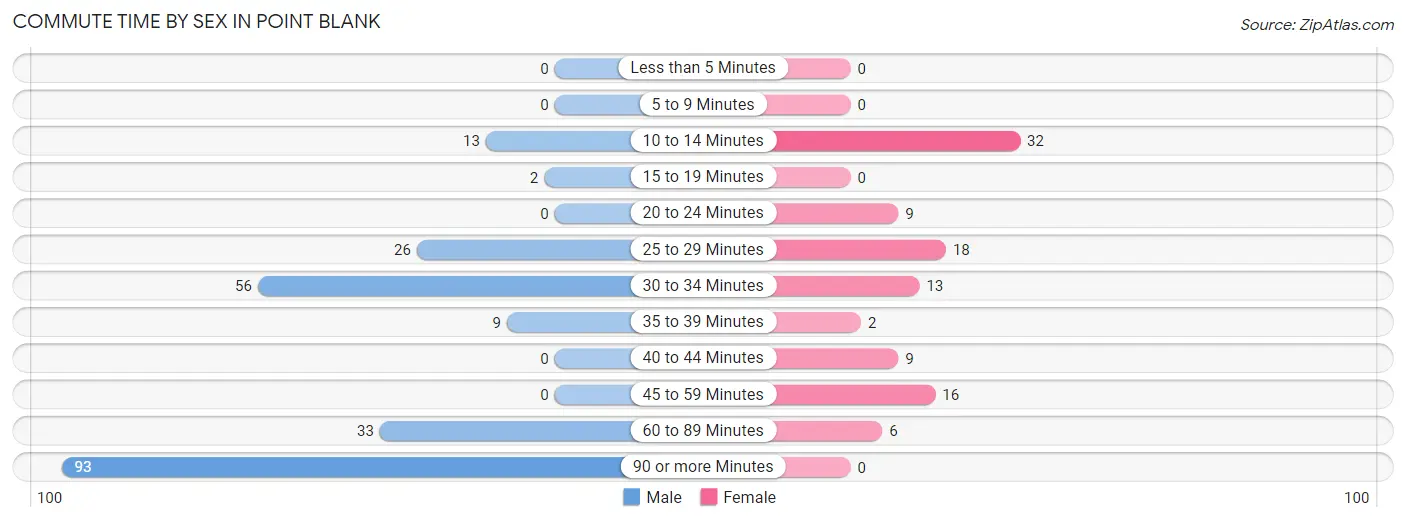
| Commute Time | Male | Female |
| Less than 5 Minutes | 0 (0.0%) | 0 (0.0%) |
| 5 to 9 Minutes | 0 (0.0%) | 0 (0.0%) |
| 10 to 14 Minutes | 13 (5.6%) | 32 (30.5%) |
| 15 to 19 Minutes | 2 (0.9%) | 0 (0.0%) |
| 20 to 24 Minutes | 0 (0.0%) | 9 (8.6%) |
| 25 to 29 Minutes | 26 (11.2%) | 18 (17.1%) |
| 30 to 34 Minutes | 56 (24.1%) | 13 (12.4%) |
| 35 to 39 Minutes | 9 (3.9%) | 2 (1.9%) |
| 40 to 44 Minutes | 0 (0.0%) | 9 (8.6%) |
| 45 to 59 Minutes | 0 (0.0%) | 16 (15.2%) |
| 60 to 89 Minutes | 33 (14.2%) | 6 (5.7%) |
| 90 or more Minutes | 93 (40.1%) | 0 (0.0%) |
Time of Departure to Work by Sex in Point Blank
The most frequent times of departure to work in Point Blank are 6:00 AM to 6:29 AM (51, 22.0%) for males and 7:30 AM to 7:59 AM (32, 30.5%) for females.
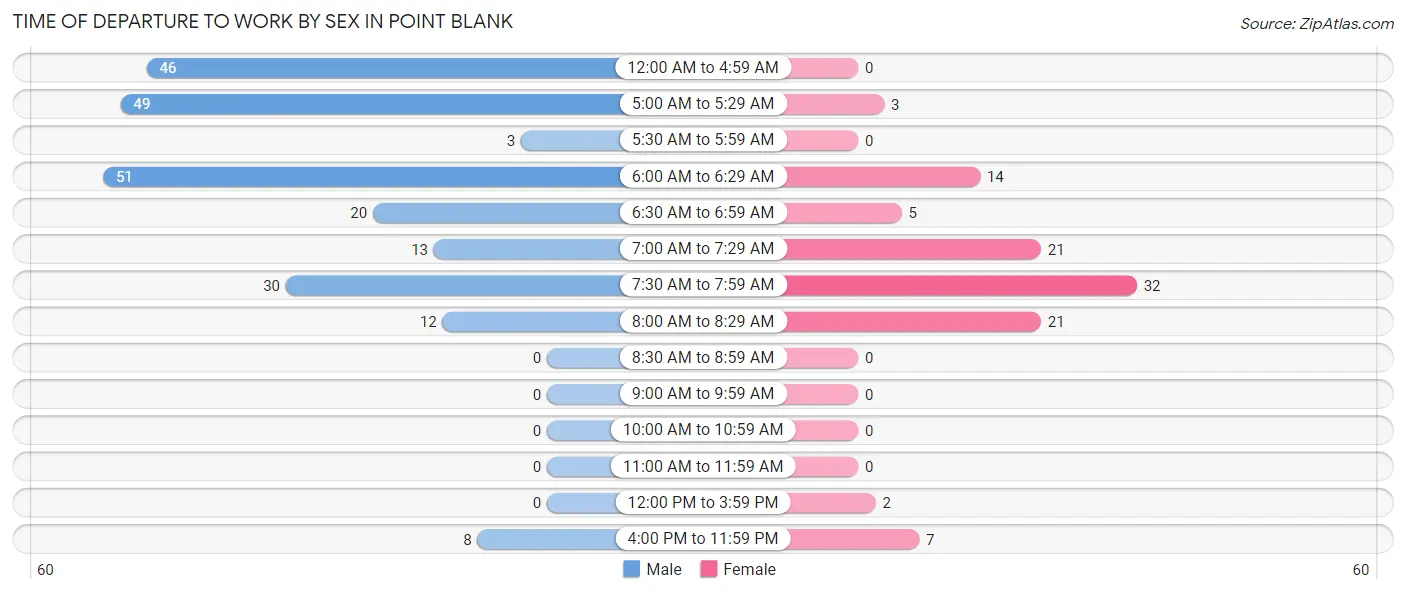
| Time of Departure | Male | Female |
| 12:00 AM to 4:59 AM | 46 (19.8%) | 0 (0.0%) |
| 5:00 AM to 5:29 AM | 49 (21.1%) | 3 (2.9%) |
| 5:30 AM to 5:59 AM | 3 (1.3%) | 0 (0.0%) |
| 6:00 AM to 6:29 AM | 51 (22.0%) | 14 (13.3%) |
| 6:30 AM to 6:59 AM | 20 (8.6%) | 5 (4.8%) |
| 7:00 AM to 7:29 AM | 13 (5.6%) | 21 (20.0%) |
| 7:30 AM to 7:59 AM | 30 (12.9%) | 32 (30.5%) |
| 8:00 AM to 8:29 AM | 12 (5.2%) | 21 (20.0%) |
| 8:30 AM to 8:59 AM | 0 (0.0%) | 0 (0.0%) |
| 9:00 AM to 9:59 AM | 0 (0.0%) | 0 (0.0%) |
| 10:00 AM to 10:59 AM | 0 (0.0%) | 0 (0.0%) |
| 11:00 AM to 11:59 AM | 0 (0.0%) | 0 (0.0%) |
| 12:00 PM to 3:59 PM | 0 (0.0%) | 2 (1.9%) |
| 4:00 PM to 11:59 PM | 8 (3.5%) | 7 (6.7%) |
| Total | 232 (100.0%) | 105 (100.0%) |
Housing Occupancy in Point Blank
Occupancy by Ownership in Point Blank
Of the total 380 dwellings in Point Blank, owner-occupied units account for 375 (98.7%), while renter-occupied units make up 5 (1.3%).
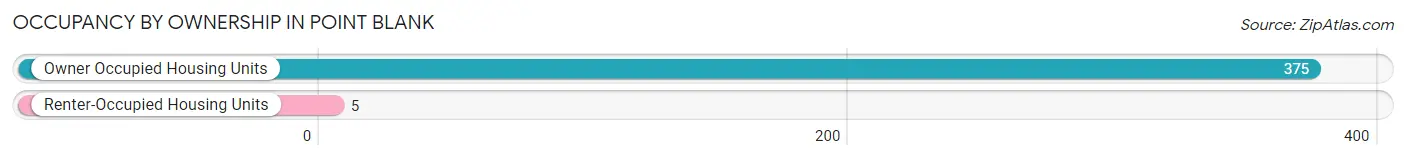
| Occupancy | # Housing Units | % Housing Units |
| Owner Occupied Housing Units | 375 | 98.7% |
| Renter-Occupied Housing Units | 5 | 1.3% |
| Total Occupied Housing Units | 380 | 100.0% |
Occupancy by Household Size in Point Blank
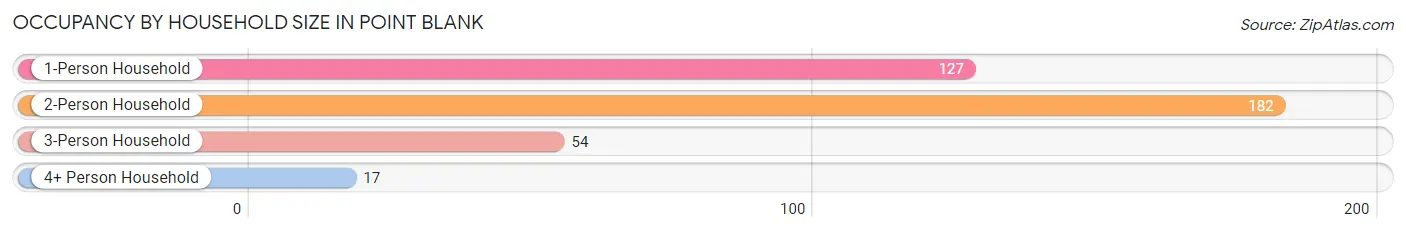
| Household Size | # Housing Units | % Housing Units |
| 1-Person Household | 127 | 33.4% |
| 2-Person Household | 182 | 47.9% |
| 3-Person Household | 54 | 14.2% |
| 4+ Person Household | 17 | 4.5% |
| Total Housing Units | 380 | 100.0% |
Occupancy by Ownership by Household Size in Point Blank
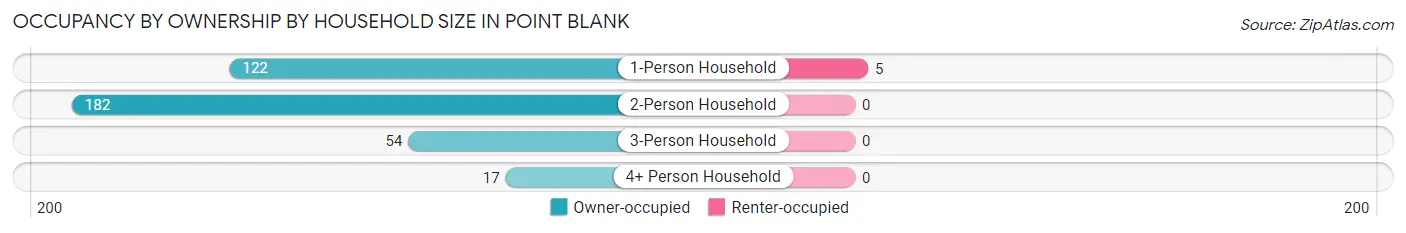
| Household Size | Owner-occupied | Renter-occupied |
| 1-Person Household | 122 (96.1%) | 5 (3.9%) |
| 2-Person Household | 182 (100.0%) | 0 (0.0%) |
| 3-Person Household | 54 (100.0%) | 0 (0.0%) |
| 4+ Person Household | 17 (100.0%) | 0 (0.0%) |
| Total Housing Units | 375 (98.7%) | 5 (1.3%) |
Occupancy by Educational Attainment in Point Blank
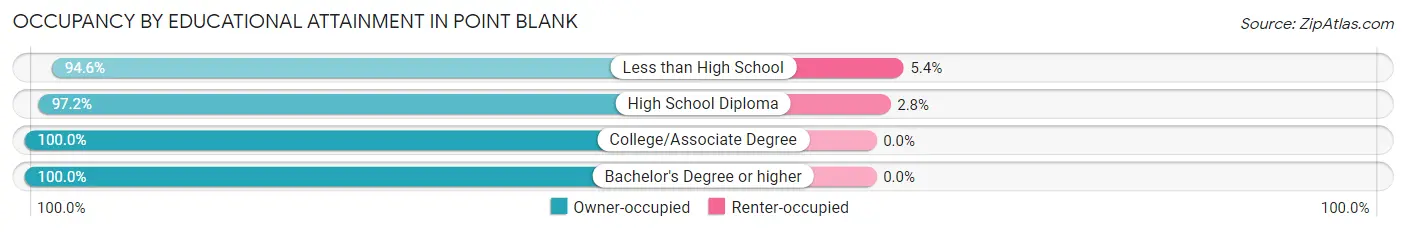
| Household Size | Owner-occupied | Renter-occupied |
| Less than High School | 35 (94.6%) | 2 (5.4%) |
| High School Diploma | 104 (97.2%) | 3 (2.8%) |
| College/Associate Degree | 140 (100.0%) | 0 (0.0%) |
| Bachelor's Degree or higher | 96 (100.0%) | 0 (0.0%) |
Occupancy by Age of Householder in Point Blank
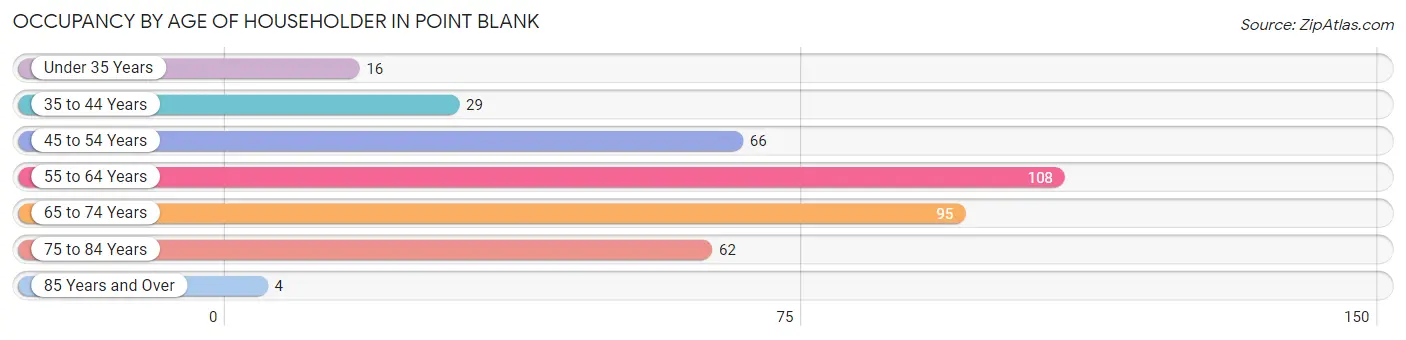
| Age Bracket | # Households | % Households |
| Under 35 Years | 16 | 4.2% |
| 35 to 44 Years | 29 | 7.6% |
| 45 to 54 Years | 66 | 17.4% |
| 55 to 64 Years | 108 | 28.4% |
| 65 to 74 Years | 95 | 25.0% |
| 75 to 84 Years | 62 | 16.3% |
| 85 Years and Over | 4 | 1.1% |
| Total | 380 | 100.0% |
Housing Finances in Point Blank
Median Income by Occupancy in Point Blank
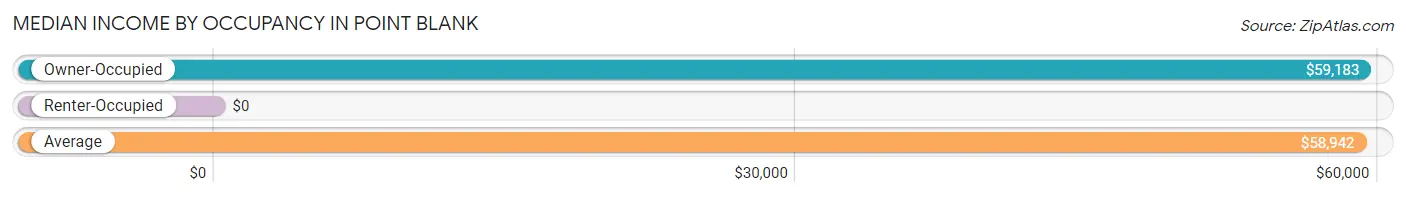
| Occupancy Type | # Households | Median Income |
| Owner-Occupied | 375 (98.7%) | $59,183 |
| Renter-Occupied | 5 (1.3%) | $0 |
| Average | 380 (100.0%) | $58,942 |
Occupancy by Householder Income Bracket in Point Blank
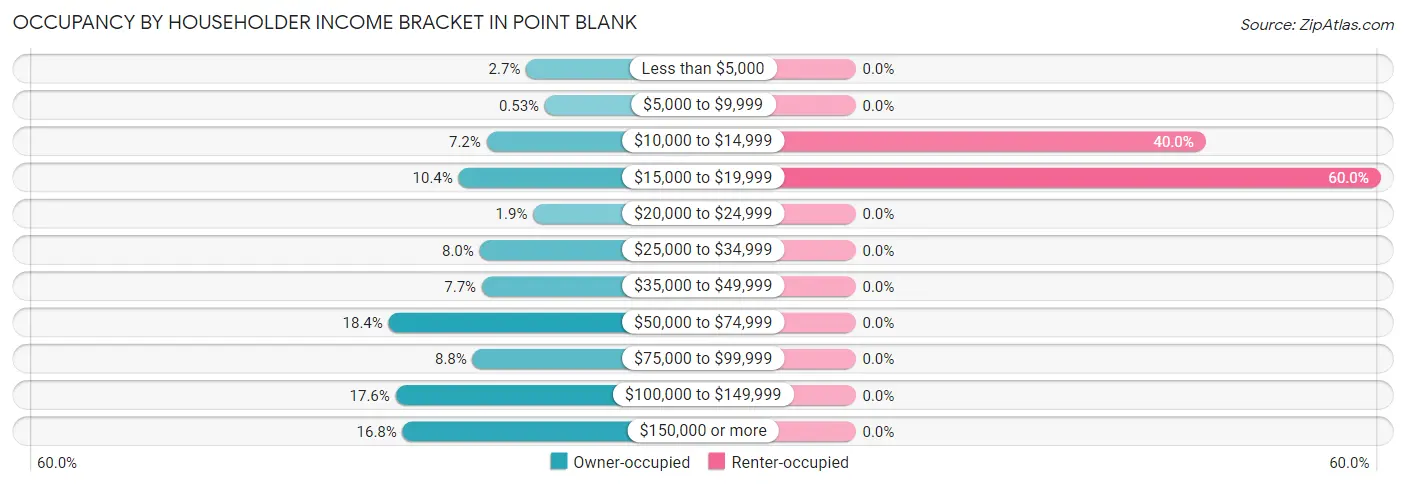
| Income Bracket | Owner-occupied | Renter-occupied |
| Less than $5,000 | 10 (2.7%) | 0 (0.0%) |
| $5,000 to $9,999 | 2 (0.5%) | 0 (0.0%) |
| $10,000 to $14,999 | 27 (7.2%) | 2 (40.0%) |
| $15,000 to $19,999 | 39 (10.4%) | 3 (60.0%) |
| $20,000 to $24,999 | 7 (1.9%) | 0 (0.0%) |
| $25,000 to $34,999 | 30 (8.0%) | 0 (0.0%) |
| $35,000 to $49,999 | 29 (7.7%) | 0 (0.0%) |
| $50,000 to $74,999 | 69 (18.4%) | 0 (0.0%) |
| $75,000 to $99,999 | 33 (8.8%) | 0 (0.0%) |
| $100,000 to $149,999 | 66 (17.6%) | 0 (0.0%) |
| $150,000 or more | 63 (16.8%) | 0 (0.0%) |
| Total | 375 (100.0%) | 5 (100.0%) |
Monthly Housing Cost Tiers in Point Blank
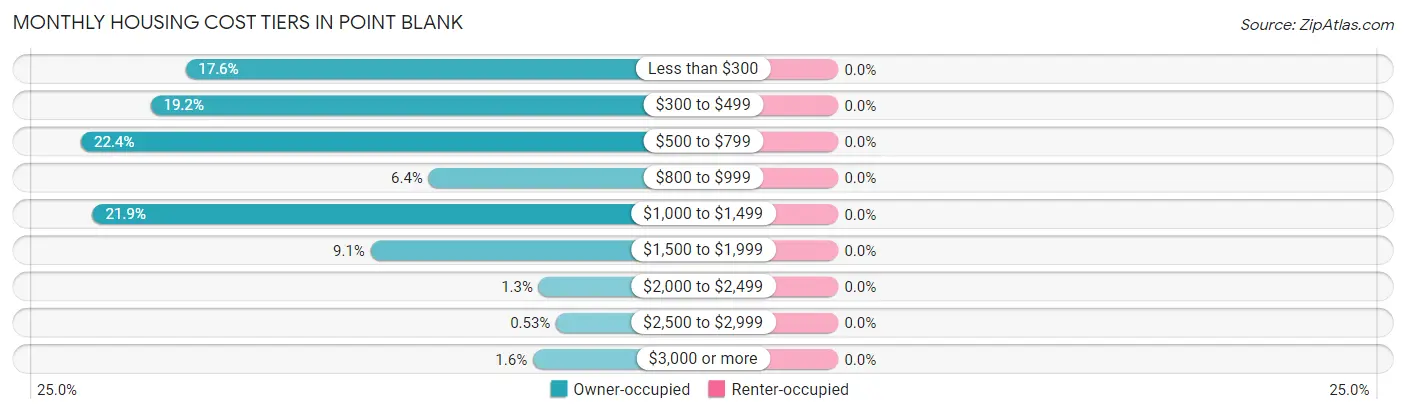
| Monthly Cost | Owner-occupied | Renter-occupied |
| Less than $300 | 66 (17.6%) | 0 (0.0%) |
| $300 to $499 | 72 (19.2%) | 0 (0.0%) |
| $500 to $799 | 84 (22.4%) | 0 (0.0%) |
| $800 to $999 | 24 (6.4%) | 0 (0.0%) |
| $1,000 to $1,499 | 82 (21.9%) | 0 (0.0%) |
| $1,500 to $1,999 | 34 (9.1%) | 0 (0.0%) |
| $2,000 to $2,499 | 5 (1.3%) | 0 (0.0%) |
| $2,500 to $2,999 | 2 (0.5%) | 0 (0.0%) |
| $3,000 or more | 6 (1.6%) | 0 (0.0%) |
| Total | 375 (100.0%) | 5 (100.0%) |
Physical Housing Characteristics in Point Blank
Housing Structures in Point Blank
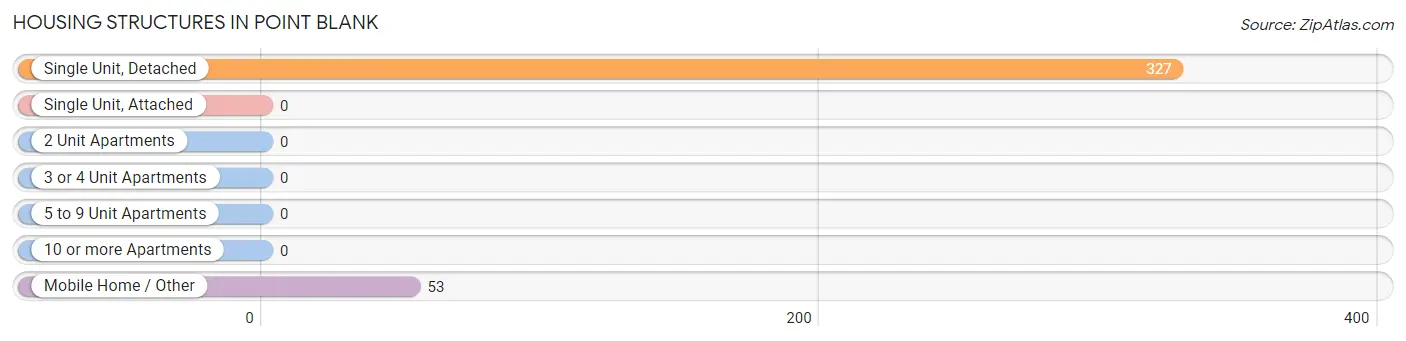
| Structure Type | # Housing Units | % Housing Units |
| Single Unit, Detached | 327 | 86.1% |
| Single Unit, Attached | 0 | 0.0% |
| 2 Unit Apartments | 0 | 0.0% |
| 3 or 4 Unit Apartments | 0 | 0.0% |
| 5 to 9 Unit Apartments | 0 | 0.0% |
| 10 or more Apartments | 0 | 0.0% |
| Mobile Home / Other | 53 | 14.0% |
| Total | 380 | 100.0% |
Housing Structures by Occupancy in Point Blank
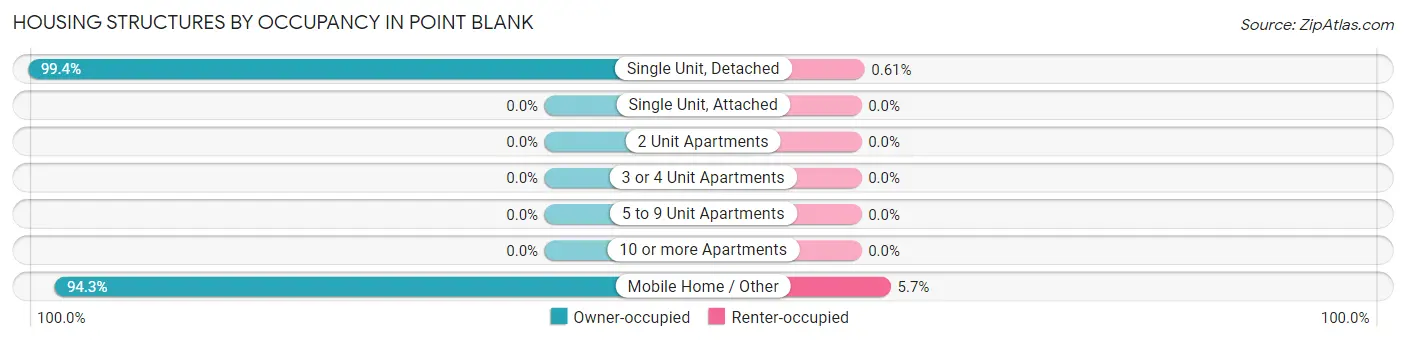
| Structure Type | Owner-occupied | Renter-occupied |
| Single Unit, Detached | 325 (99.4%) | 2 (0.6%) |
| Single Unit, Attached | 0 (0.0%) | 0 (0.0%) |
| 2 Unit Apartments | 0 (0.0%) | 0 (0.0%) |
| 3 or 4 Unit Apartments | 0 (0.0%) | 0 (0.0%) |
| 5 to 9 Unit Apartments | 0 (0.0%) | 0 (0.0%) |
| 10 or more Apartments | 0 (0.0%) | 0 (0.0%) |
| Mobile Home / Other | 50 (94.3%) | 3 (5.7%) |
| Total | 375 (98.7%) | 5 (1.3%) |
Housing Structures by Number of Rooms in Point Blank
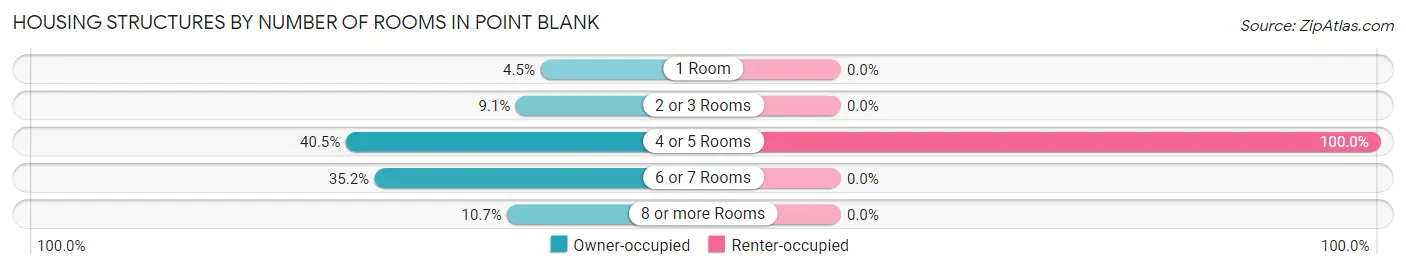
| Number of Rooms | Owner-occupied | Renter-occupied |
| 1 Room | 17 (4.5%) | 0 (0.0%) |
| 2 or 3 Rooms | 34 (9.1%) | 0 (0.0%) |
| 4 or 5 Rooms | 152 (40.5%) | 5 (100.0%) |
| 6 or 7 Rooms | 132 (35.2%) | 0 (0.0%) |
| 8 or more Rooms | 40 (10.7%) | 0 (0.0%) |
| Total | 375 (100.0%) | 5 (100.0%) |
Housing Structure by Heating Type in Point Blank
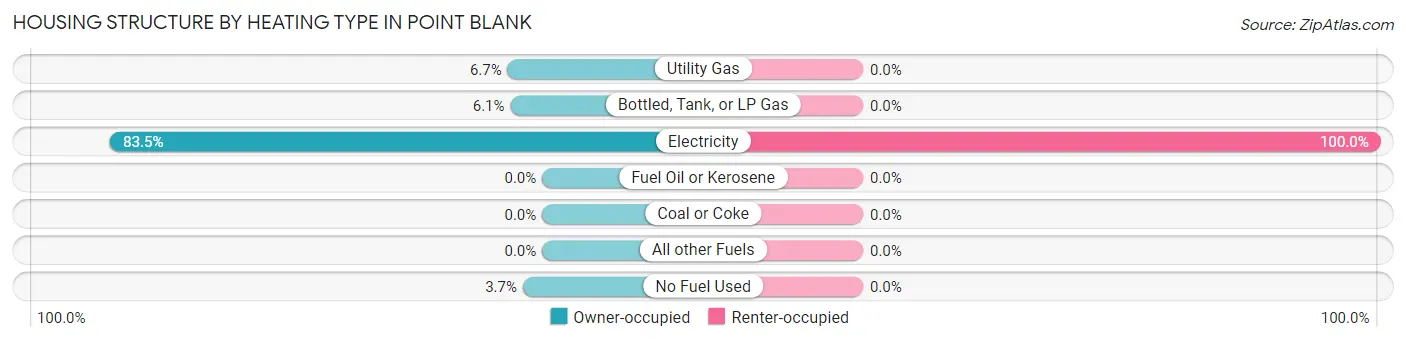
| Heating Type | Owner-occupied | Renter-occupied |
| Utility Gas | 25 (6.7%) | 0 (0.0%) |
| Bottled, Tank, or LP Gas | 23 (6.1%) | 0 (0.0%) |
| Electricity | 313 (83.5%) | 5 (100.0%) |
| Fuel Oil or Kerosene | 0 (0.0%) | 0 (0.0%) |
| Coal or Coke | 0 (0.0%) | 0 (0.0%) |
| All other Fuels | 0 (0.0%) | 0 (0.0%) |
| No Fuel Used | 14 (3.7%) | 0 (0.0%) |
| Total | 375 (100.0%) | 5 (100.0%) |
Household Vehicle Usage in Point Blank
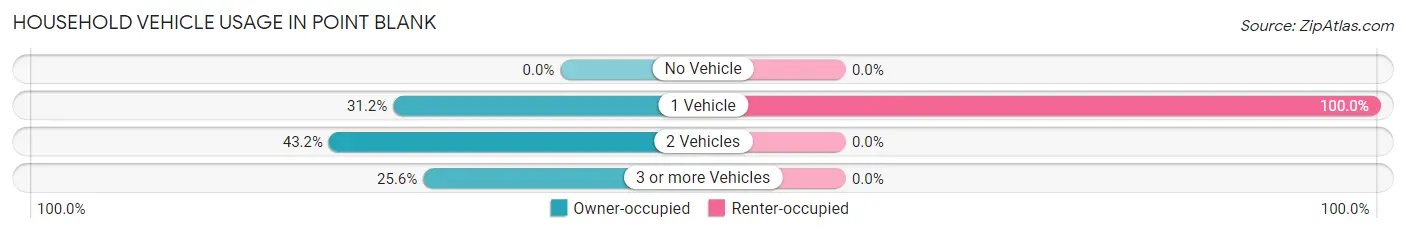
| Vehicles per Household | Owner-occupied | Renter-occupied |
| No Vehicle | 0 (0.0%) | 0 (0.0%) |
| 1 Vehicle | 117 (31.2%) | 5 (100.0%) |
| 2 Vehicles | 162 (43.2%) | 0 (0.0%) |
| 3 or more Vehicles | 96 (25.6%) | 0 (0.0%) |
| Total | 375 (100.0%) | 5 (100.0%) |
Real Estate & Mortgages in Point Blank
Real Estate and Mortgage Overview in Point Blank
| Characteristic | Without Mortgage | With Mortgage |
| Housing Units | 231 | 144 |
| Median Property Value | $124,600 | $211,300 |
| Median Household Income | $51,583 | $35 |
| Monthly Housing Costs | $422 | $0 |
| Real Estate Taxes | $1,242 | $5 |
Property Value by Mortgage Status in Point Blank
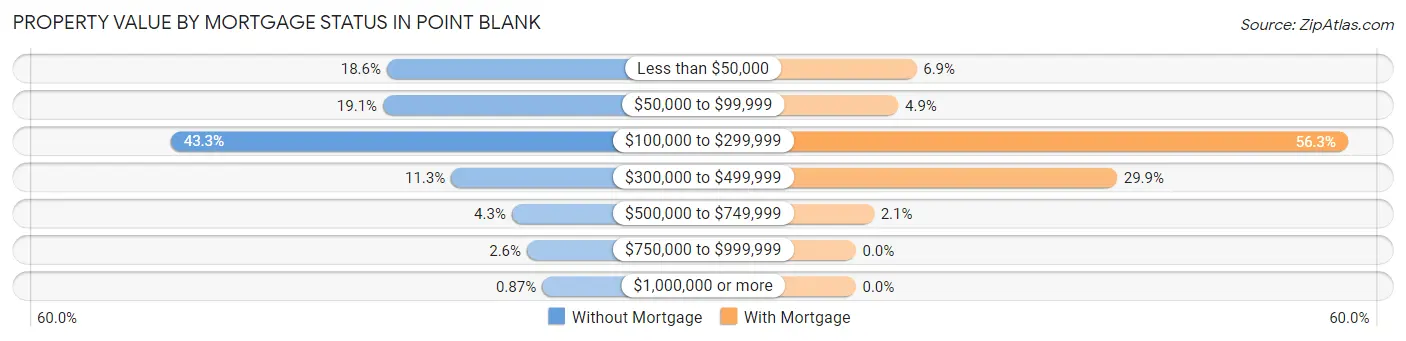
| Property Value | Without Mortgage | With Mortgage |
| Less than $50,000 | 43 (18.6%) | 10 (6.9%) |
| $50,000 to $99,999 | 44 (19.1%) | 7 (4.9%) |
| $100,000 to $299,999 | 100 (43.3%) | 81 (56.2%) |
| $300,000 to $499,999 | 26 (11.3%) | 43 (29.9%) |
| $500,000 to $749,999 | 10 (4.3%) | 3 (2.1%) |
| $750,000 to $999,999 | 6 (2.6%) | 0 (0.0%) |
| $1,000,000 or more | 2 (0.9%) | 0 (0.0%) |
| Total | 231 (100.0%) | 144 (100.0%) |
Household Income by Mortgage Status in Point Blank
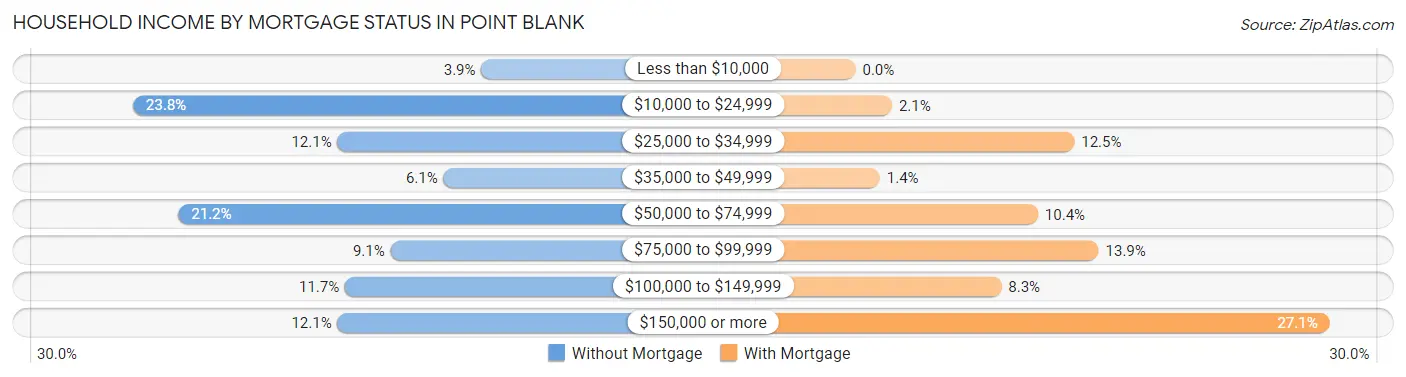
| Household Income | Without Mortgage | With Mortgage |
| Less than $10,000 | 9 (3.9%) | 0 (0.0%) |
| $10,000 to $24,999 | 55 (23.8%) | 3 (2.1%) |
| $25,000 to $34,999 | 28 (12.1%) | 18 (12.5%) |
| $35,000 to $49,999 | 14 (6.1%) | 2 (1.4%) |
| $50,000 to $74,999 | 49 (21.2%) | 15 (10.4%) |
| $75,000 to $99,999 | 21 (9.1%) | 20 (13.9%) |
| $100,000 to $149,999 | 27 (11.7%) | 12 (8.3%) |
| $150,000 or more | 28 (12.1%) | 39 (27.1%) |
| Total | 231 (100.0%) | 144 (100.0%) |
Property Value to Household Income Ratio in Point Blank
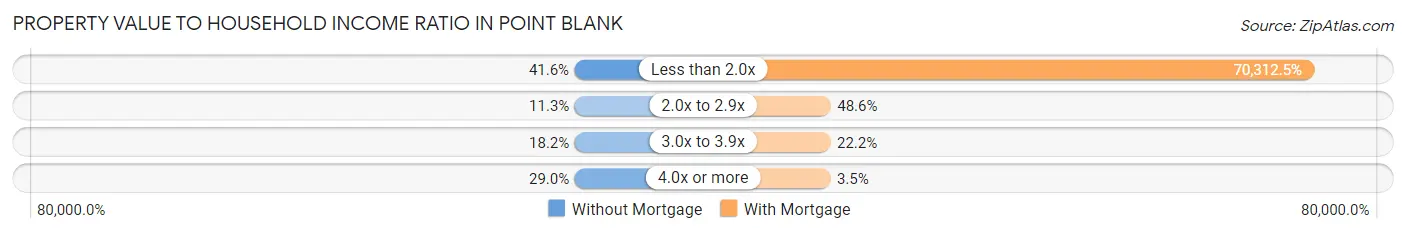
| Value-to-Income Ratio | Without Mortgage | With Mortgage |
| Less than 2.0x | 96 (41.6%) | 101,250 (70,312.5%) |
| 2.0x to 2.9x | 26 (11.3%) | 70 (48.6%) |
| 3.0x to 3.9x | 42 (18.2%) | 32 (22.2%) |
| 4.0x or more | 67 (29.0%) | 5 (3.5%) |
| Total | 231 (100.0%) | 144 (100.0%) |
Real Estate Taxes by Mortgage Status in Point Blank
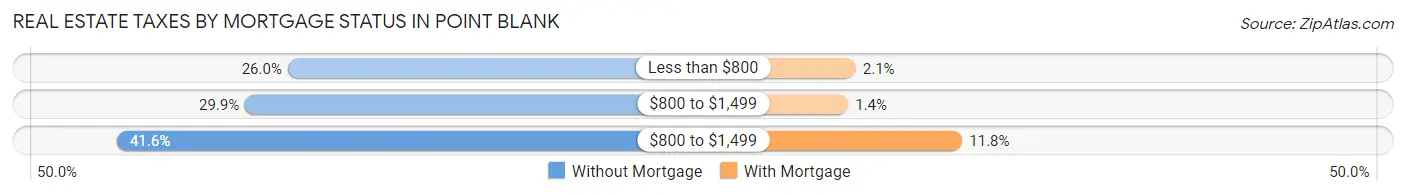
| Property Taxes | Without Mortgage | With Mortgage |
| Less than $800 | 60 (26.0%) | 3 (2.1%) |
| $800 to $1,499 | 69 (29.9%) | 2 (1.4%) |
| $800 to $1,499 | 96 (41.6%) | 17 (11.8%) |
| Total | 231 (100.0%) | 144 (100.0%) |
Health & Disability in Point Blank
Health Insurance Coverage by Age in Point Blank
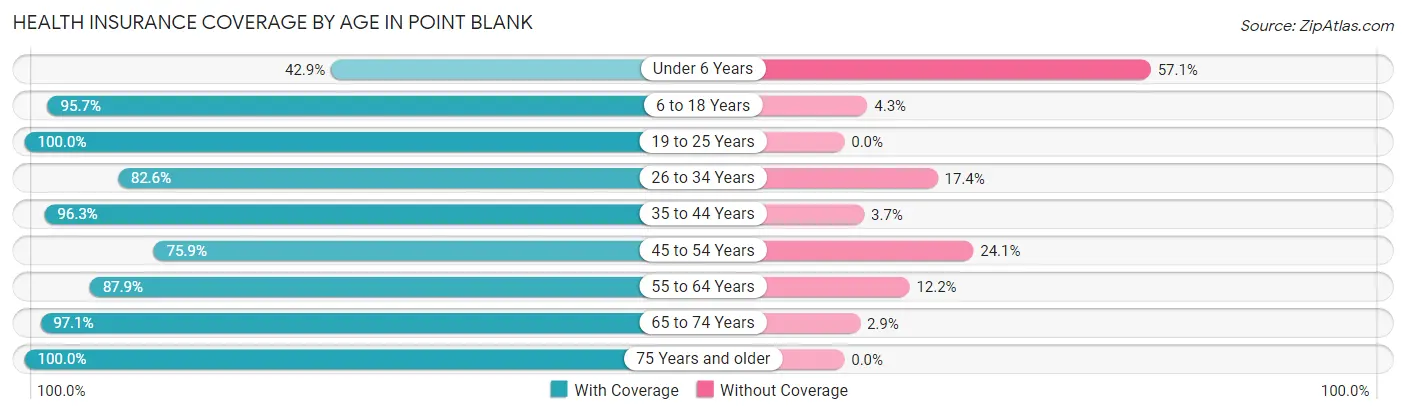
| Age Bracket | With Coverage | Without Coverage |
| Under 6 Years | 3 (42.9%) | 4 (57.1%) |
| 6 to 18 Years | 89 (95.7%) | 4 (4.3%) |
| 19 to 25 Years | 12 (100.0%) | 0 (0.0%) |
| 26 to 34 Years | 38 (82.6%) | 8 (17.4%) |
| 35 to 44 Years | 78 (96.3%) | 3 (3.7%) |
| 45 to 54 Years | 101 (75.9%) | 32 (24.1%) |
| 55 to 64 Years | 188 (87.8%) | 26 (12.1%) |
| 65 to 74 Years | 133 (97.1%) | 4 (2.9%) |
| 75 Years and older | 93 (100.0%) | 0 (0.0%) |
| Total | 735 (90.1%) | 81 (9.9%) |
Health Insurance Coverage by Citizenship Status in Point Blank
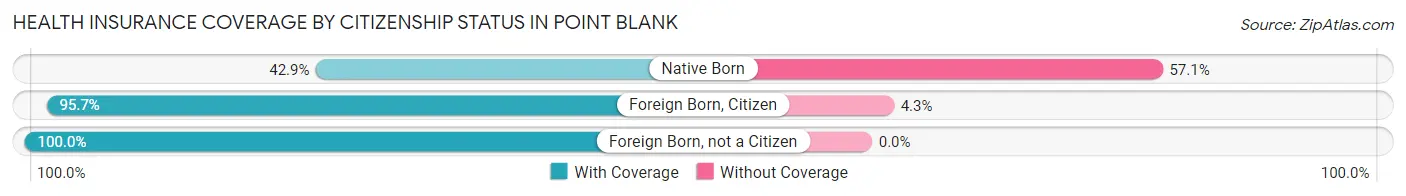
| Citizenship Status | With Coverage | Without Coverage |
| Native Born | 3 (42.9%) | 4 (57.1%) |
| Foreign Born, Citizen | 89 (95.7%) | 4 (4.3%) |
| Foreign Born, not a Citizen | 12 (100.0%) | 0 (0.0%) |
Health Insurance Coverage by Household Income in Point Blank
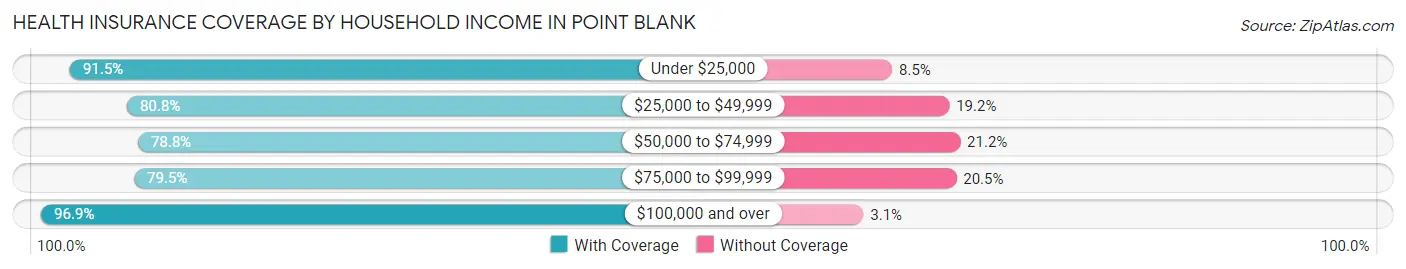
| Household Income | With Coverage | Without Coverage |
| Under $25,000 | 97 (91.5%) | 9 (8.5%) |
| $25,000 to $49,999 | 80 (80.8%) | 19 (19.2%) |
| $50,000 to $74,999 | 89 (78.8%) | 24 (21.2%) |
| $75,000 to $99,999 | 62 (79.5%) | 16 (20.5%) |
| $100,000 and over | 407 (96.9%) | 13 (3.1%) |
Public vs Private Health Insurance Coverage by Age in Point Blank
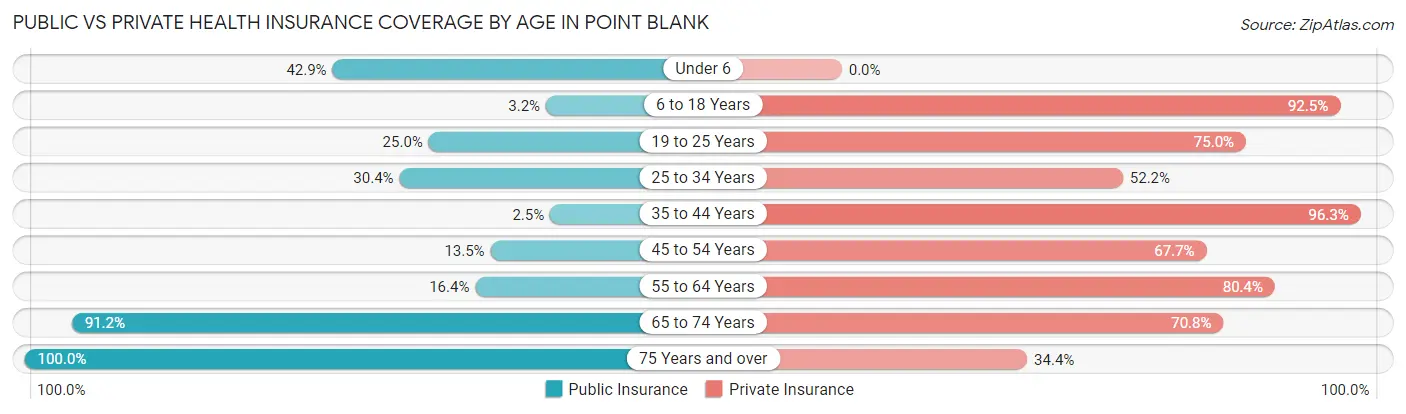
| Age Bracket | Public Insurance | Private Insurance |
| Under 6 | 3 (42.9%) | 0 (0.0%) |
| 6 to 18 Years | 3 (3.2%) | 86 (92.5%) |
| 19 to 25 Years | 3 (25.0%) | 9 (75.0%) |
| 25 to 34 Years | 14 (30.4%) | 24 (52.2%) |
| 35 to 44 Years | 2 (2.5%) | 78 (96.3%) |
| 45 to 54 Years | 18 (13.5%) | 90 (67.7%) |
| 55 to 64 Years | 35 (16.4%) | 172 (80.4%) |
| 65 to 74 Years | 125 (91.2%) | 97 (70.8%) |
| 75 Years and over | 93 (100.0%) | 32 (34.4%) |
| Total | 296 (36.3%) | 588 (72.1%) |
Disability Status by Sex by Age in Point Blank
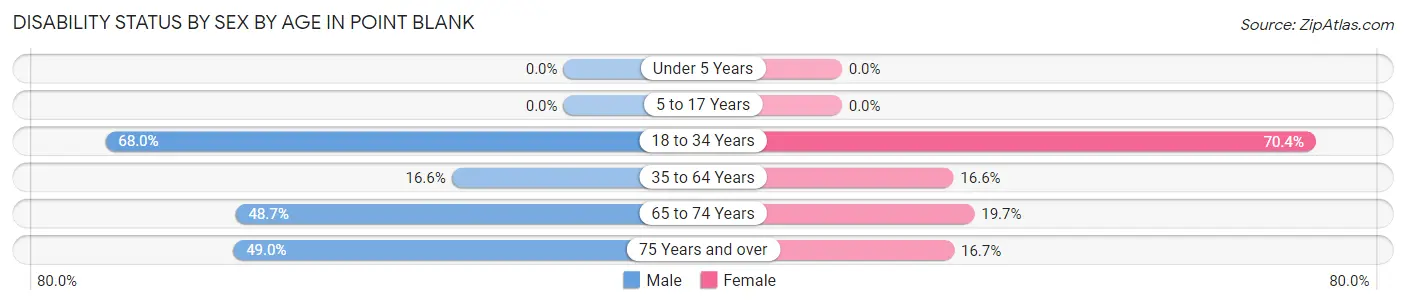
| Age Bracket | Male | Female |
| Under 5 Years | 0 (0.0%) | 0 (0.0%) |
| 5 to 17 Years | 0 (0.0%) | 0 (0.0%) |
| 18 to 34 Years | 34 (68.0%) | 19 (70.4%) |
| 35 to 64 Years | 42 (16.6%) | 29 (16.6%) |
| 65 to 74 Years | 37 (48.7%) | 12 (19.7%) |
| 75 Years and over | 25 (49.0%) | 7 (16.7%) |
Disability Class by Sex by Age in Point Blank
Disability Class: Hearing Difficulty
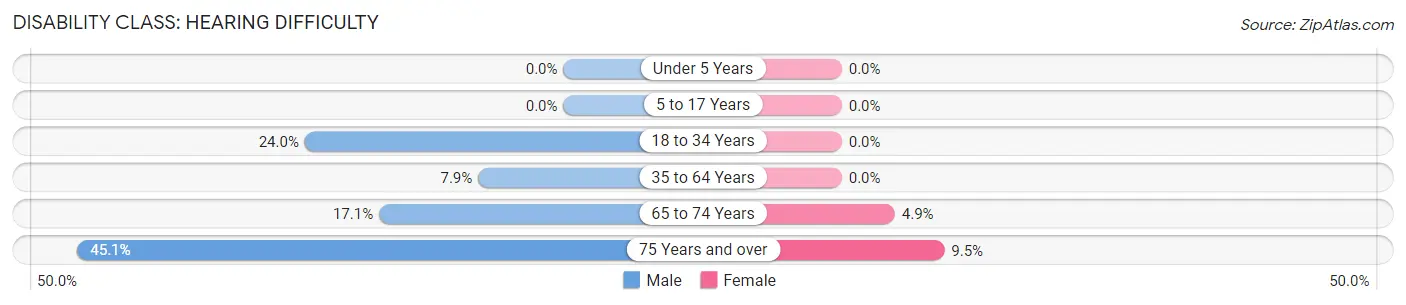
| Age Bracket | Male | Female |
| Under 5 Years | 0 (0.0%) | 0 (0.0%) |
| 5 to 17 Years | 0 (0.0%) | 0 (0.0%) |
| 18 to 34 Years | 12 (24.0%) | 0 (0.0%) |
| 35 to 64 Years | 20 (7.9%) | 0 (0.0%) |
| 65 to 74 Years | 13 (17.1%) | 3 (4.9%) |
| 75 Years and over | 23 (45.1%) | 4 (9.5%) |
Disability Class: Vision Difficulty
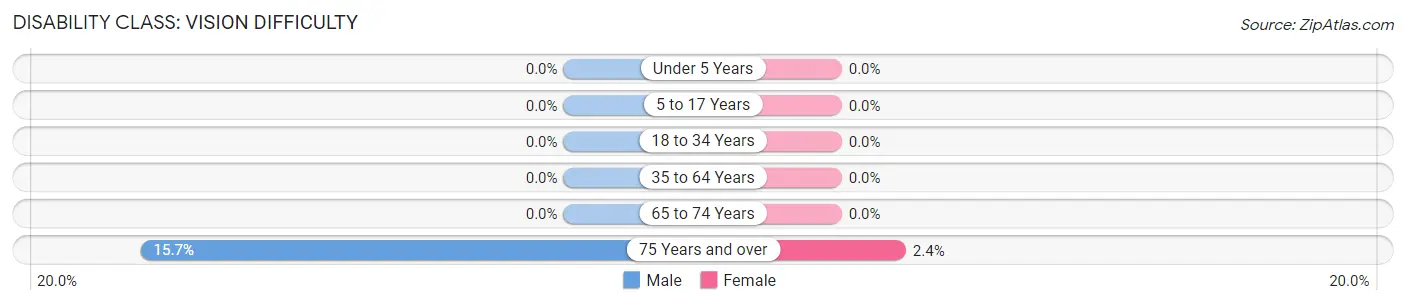
| Age Bracket | Male | Female |
| Under 5 Years | 0 (0.0%) | 0 (0.0%) |
| 5 to 17 Years | 0 (0.0%) | 0 (0.0%) |
| 18 to 34 Years | 0 (0.0%) | 0 (0.0%) |
| 35 to 64 Years | 0 (0.0%) | 0 (0.0%) |
| 65 to 74 Years | 0 (0.0%) | 0 (0.0%) |
| 75 Years and over | 8 (15.7%) | 1 (2.4%) |
Disability Class: Cognitive Difficulty
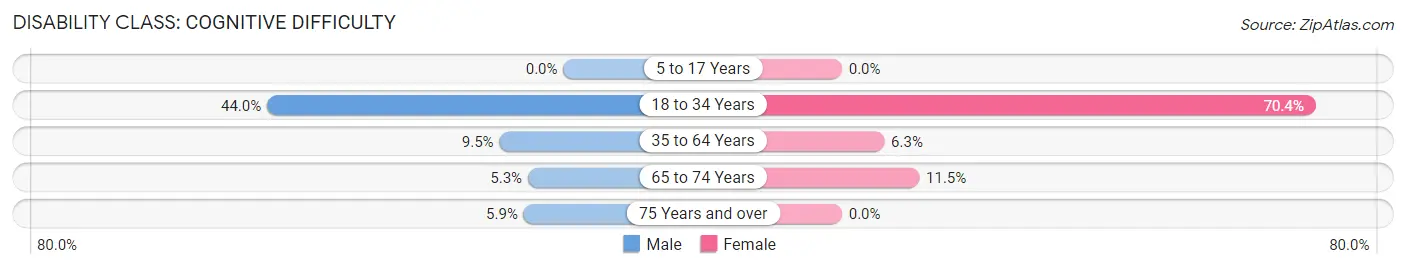
| Age Bracket | Male | Female |
| 5 to 17 Years | 0 (0.0%) | 0 (0.0%) |
| 18 to 34 Years | 22 (44.0%) | 19 (70.4%) |
| 35 to 64 Years | 24 (9.5%) | 11 (6.3%) |
| 65 to 74 Years | 4 (5.3%) | 7 (11.5%) |
| 75 Years and over | 3 (5.9%) | 0 (0.0%) |
Disability Class: Ambulatory Difficulty
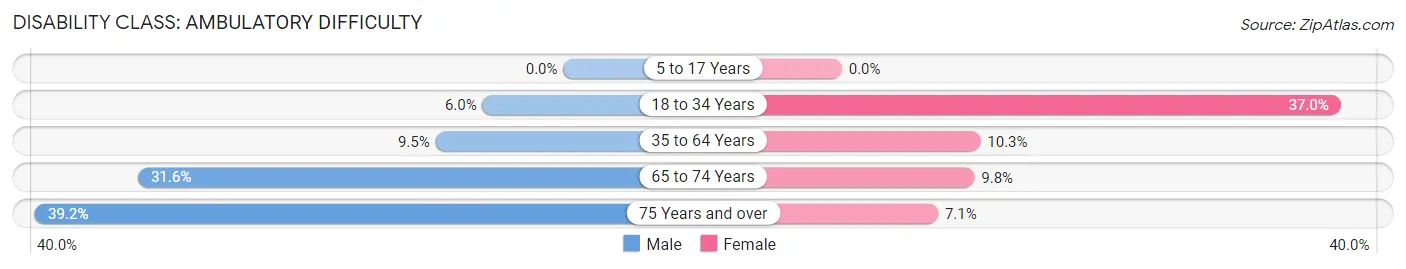
| Age Bracket | Male | Female |
| 5 to 17 Years | 0 (0.0%) | 0 (0.0%) |
| 18 to 34 Years | 3 (6.0%) | 10 (37.0%) |
| 35 to 64 Years | 24 (9.5%) | 18 (10.3%) |
| 65 to 74 Years | 24 (31.6%) | 6 (9.8%) |
| 75 Years and over | 20 (39.2%) | 3 (7.1%) |
Disability Class: Self-Care Difficulty
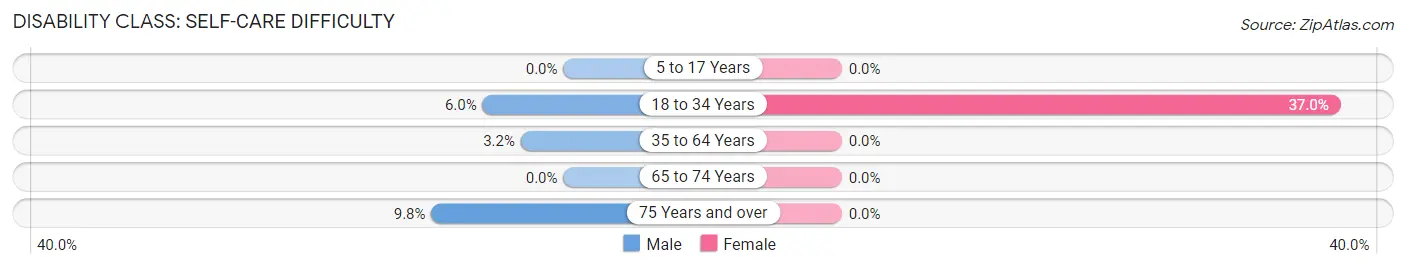
| Age Bracket | Male | Female |
| 5 to 17 Years | 0 (0.0%) | 0 (0.0%) |
| 18 to 34 Years | 3 (6.0%) | 10 (37.0%) |
| 35 to 64 Years | 8 (3.2%) | 0 (0.0%) |
| 65 to 74 Years | 0 (0.0%) | 0 (0.0%) |
| 75 Years and over | 5 (9.8%) | 0 (0.0%) |
Technology Access in Point Blank
Computing Device Access in Point Blank
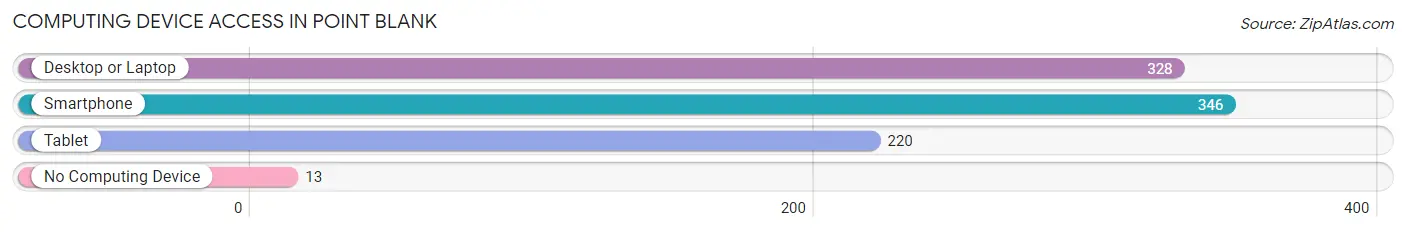
| Device Type | # Households | % Households |
| Desktop or Laptop | 328 | 86.3% |
| Smartphone | 346 | 91.0% |
| Tablet | 220 | 57.9% |
| No Computing Device | 13 | 3.4% |
| Total | 380 | 100.0% |
Internet Access in Point Blank
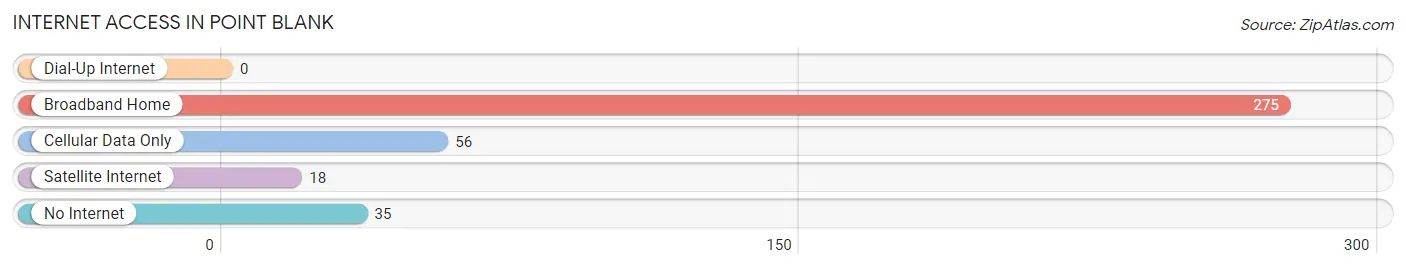
| Internet Type | # Households | % Households |
| Dial-Up Internet | 0 | 0.0% |
| Broadband Home | 275 | 72.4% |
| Cellular Data Only | 56 | 14.7% |
| Satellite Internet | 18 | 4.7% |
| No Internet | 35 | 9.2% |
| Total | 380 | 100.0% |
Point Blank Summary
Blank, TX is a small town located in the state of Texas, United States. It is situated in the county of Harris and is part of the Houston–The Woodlands–Sugar Land metropolitan area. The town has a population of approximately 2,000 people and is located about 25 miles north of Houston.
History
The area that is now known as Point Blank, TX was first settled in the early 1800s by a group of settlers from the United States. The town was originally known as “Point Blank” because of its location at the intersection of two major roads. The town was officially incorporated in 1891 and was named after the nearby Point Blank Creek.
In the early 1900s, the town began to grow and develop. The first school was built in 1906 and the first post office was established in 1907. The town also had a cotton gin, a sawmill, and a general store.
In the 1920s, the town experienced a period of growth and prosperity. The population increased from around 500 to over 1,000 people. The town also had a bank, a movie theater, and a hotel.
In the 1940s, the town experienced a period of decline. The population decreased to around 500 people and the town began to decline economically. The town was also affected by the Great Depression and World War II.
In the 1950s, the town began to experience a period of growth and development. The population increased to around 1,000 people and the town began to experience an economic revival. The town also had a new school, a library, and a hospital.
In the 1960s, the town experienced a period of decline. The population decreased to around 500 people and the town began to experience an economic decline. The town was also affected by the Vietnam War.
In the 1970s, the town experienced a period of growth and development. The population increased to around 1,000 people and the town began to experience an economic revival. The town also had a new school, a library, and a hospital.
In the 1980s, the town experienced a period of decline. The population decreased to around 500 people and the town began to experience an economic decline. The town was also affected by the oil crisis.
In the 1990s, the town experienced a period of growth and development. The population increased to around 1,000 people and the town began to experience an economic revival. The town also had a new school, a library, and a hospital.
Geography
Point Blank, TX is located in the southeastern part of the state of Texas. It is situated in the county of Harris and is part of the Houston–The Woodlands–Sugar Land metropolitan area. The town is located about 25 miles north of Houston.
The town is situated on the banks of the Trinity River and is surrounded by rolling hills and wooded areas. The town is located in a humid subtropical climate zone and experiences hot summers and mild winters.
Economy
The economy of Point Blank, TX is largely based on agriculture and tourism. The town is home to several farms and ranches that produce a variety of crops and livestock. The town is also home to several tourist attractions, including the Point Blank Historical Museum and the Point Blank Nature Center.
The town is also home to several businesses, including restaurants, retail stores, and service providers. The town is also home to several manufacturing companies, including a furniture factory and a plastics factory.
Demographics
As of the 2010 census, the population of Point Blank, TX was 2,000 people. The racial makeup of the town was 94.2% White, 2.2% African American, 0.7% Native American, 0.3% Asian, 0.1% Pacific Islander, and 2.5% from other races. The median household income was $37,500 and the median family income was $45,000. The per capita income was $19,000.
Conclusion
Point Blank, TX is a small town located in the state of Texas, United States. It is situated in the county of Harris and is part of the Houston–The Woodlands–Sugar Land metropolitan area. The town has a population of approximately 2,000 people and is located about 25 miles north of Houston. The town’s economy is largely based on agriculture and tourism and the town is home to several businesses, including restaurants, retail stores, and service providers. The town is also home to several tourist attractions, including the Point Blank Historical Museum and the Point Blank Nature Center. The town has a diverse population and the median household income is $37,500.
Common Questions
What is Per Capita Income in Point Blank?
Per Capita income in Point Blank is $47,384.
What is the Median Family Income in Point Blank?
Median Family Income in Point Blank is $97,222.
What is the Median Household income in Point Blank?
Median Household Income in Point Blank is $58,942.
What is Income or Wage Gap in Point Blank?
Income or Wage Gap in Point Blank is 43.3%.
Women in Point Blank earn 56.7 cents for every dollar earned by a man.
What is Family Income Deficit in Point Blank?
Family Income Deficit in Point Blank is $4,594.
Families that are below poverty line in Point Blank earn $4,594 less on average than the poverty threshold level.
What is Inequality or Gini Index in Point Blank?
Inequality or Gini Index in Point Blank is 0.48.
What is the Total Population of Point Blank?
Total Population of Point Blank is 816.
What is the Total Male Population of Point Blank?
Total Male Population of Point Blank is 511.
What is the Total Female Population of Point Blank?
Total Female Population of Point Blank is 305.
What is the Ratio of Males per 100 Females in Point Blank?
There are 167.54 Males per 100 Females in Point Blank.
What is the Ratio of Females per 100 Males in Point Blank?
There are 59.69 Females per 100 Males in Point Blank.
What is the Median Population Age in Point Blank?
Median Population Age in Point Blank is 57.5 Years.
What is the Average Family Size in Point Blank
Average Family Size in Point Blank is 2.7 People.
What is the Average Household Size in Point Blank
Average Household Size in Point Blank is 2.1 People.
How Large is the Labor Force in Point Blank?
There are 406 People in the Labor Forcein in Point Blank.
What is the Percentage of People in the Labor Force in Point Blank?
55.2% of People are in the Labor Force in Point Blank.
What is the Unemployment Rate in Point Blank?
Unemployment Rate in Point Blank is 9.4%.