Buchanan Lake Village, TX Map & Demographics
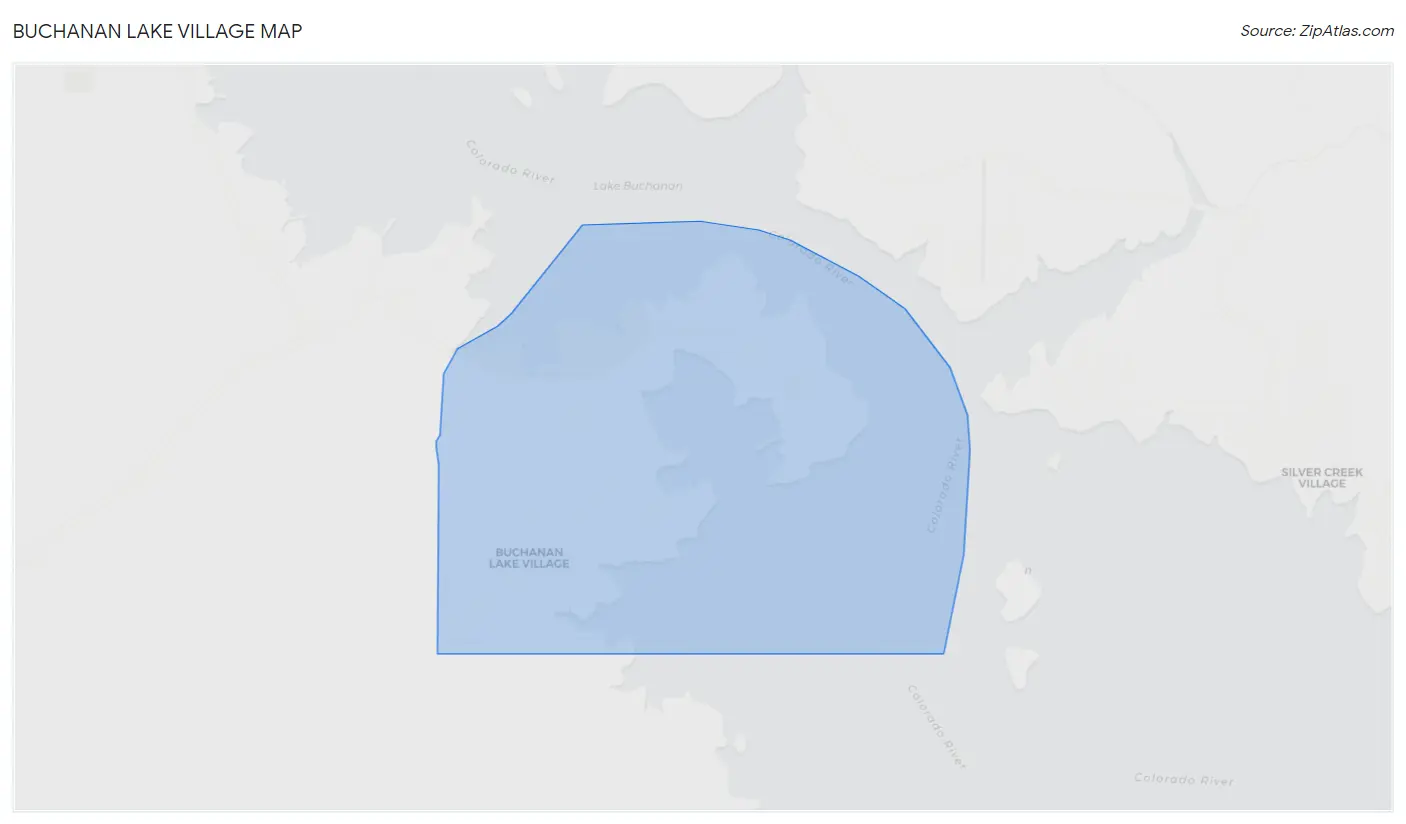
Buchanan Lake Village Map
Buchanan Lake Village Overview
$24,535
PER CAPITA INCOME
$42,204
AVG FAMILY INCOME
$41,118
AVG HOUSEHOLD INCOME
0.36
INEQUALITY / GINI INDEX
532
TOTAL POPULATION
247
MALE POPULATION
285
FEMALE POPULATION
86.67
MALES / 100 FEMALES
115.38
FEMALES / 100 MALES
66.7
MEDIAN AGE
2.4
AVG FAMILY SIZE
2.0
AVG HOUSEHOLD SIZE
143
LABOR FORCE [ PEOPLE ]
31.0%
PERCENT IN LABOR FORCE
13.3%
UNEMPLOYMENT RATE
Income in Buchanan Lake Village
Income Overview in Buchanan Lake Village
Per Capita Income in Buchanan Lake Village is $24,535, while median incomes of families and households are $42,204 and $41,118 respectively.
| Characteristic | Number | Measure |
| Per Capita Income | 532 | $24,535 |
| Median Family Income | 177 | $42,204 |
| Mean Family Income | 177 | $52,772 |
| Median Household Income | 264 | $41,118 |
| Mean Household Income | 264 | $46,566 |
| Income Deficit | 177 | $0 |
| Wage / Income Gap (%) | 532 | 0.00% |
| Wage / Income Gap ($) | 532 | 100.00¢ per $1 |
| Gini / Inequality Index | 532 | 0.36 |
Earnings by Sex in Buchanan Lake Village
| Sex | Number | Average Earnings |
| Male | 57 (38.8%) | $0 |
| Female | 90 (61.2%) | $0 |
| Total | 147 (100.0%) | $0 |
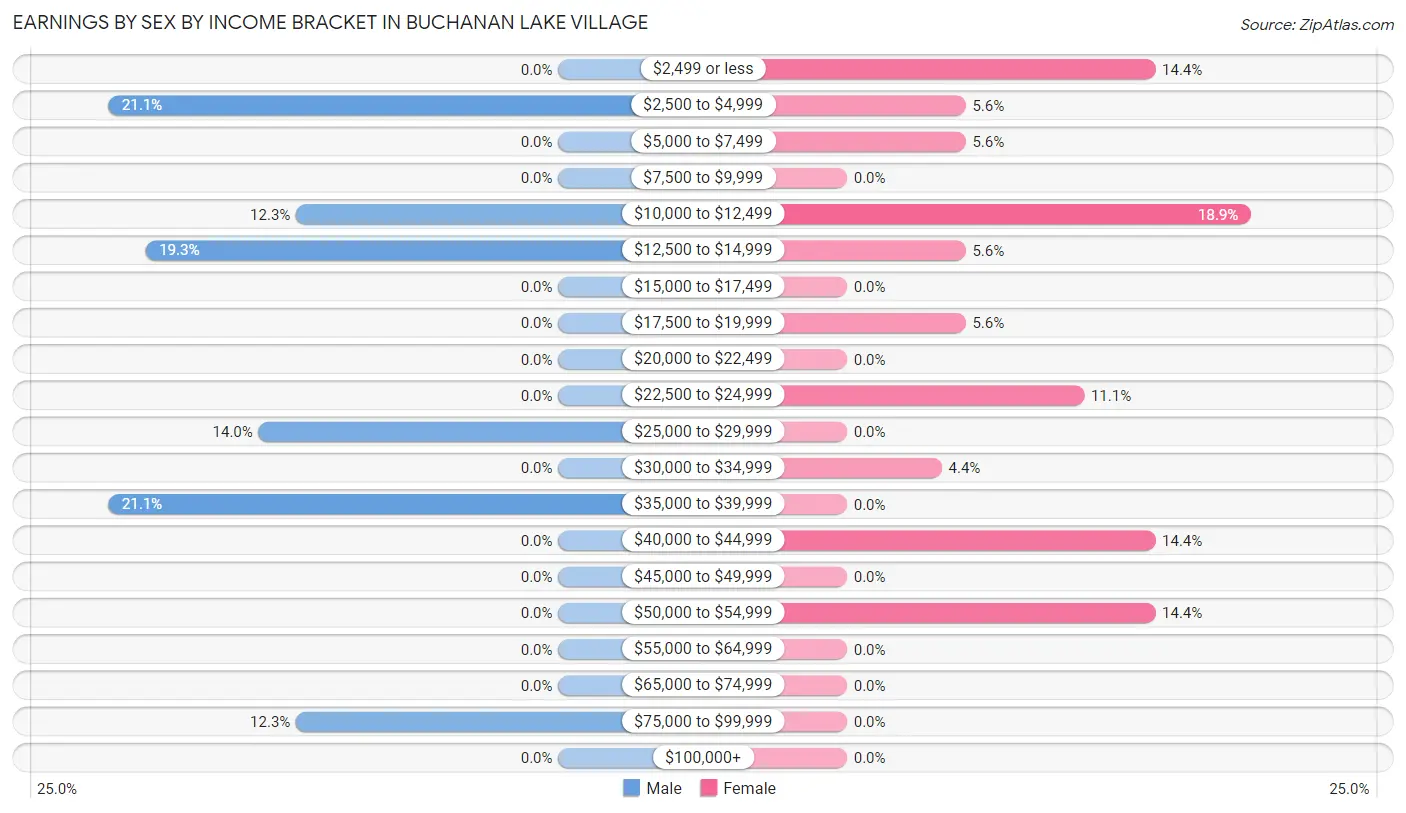
Earnings by Sex by Income Bracket in Buchanan Lake Village
The most common earnings brackets in Buchanan Lake Village are $2,500 to $4,999 for men (12 | 21.0%) and $10,000 to $12,499 for women (17 | 18.9%).
| Income | Male | Female |
| $2,499 or less | 0 (0.0%) | 13 (14.4%) |
| $2,500 to $4,999 | 12 (21.0%) | 5 (5.6%) |
| $5,000 to $7,499 | 0 (0.0%) | 5 (5.6%) |
| $7,500 to $9,999 | 0 (0.0%) | 0 (0.0%) |
| $10,000 to $12,499 | 7 (12.3%) | 17 (18.9%) |
| $12,500 to $14,999 | 11 (19.3%) | 5 (5.6%) |
| $15,000 to $17,499 | 0 (0.0%) | 0 (0.0%) |
| $17,500 to $19,999 | 0 (0.0%) | 5 (5.6%) |
| $20,000 to $22,499 | 0 (0.0%) | 0 (0.0%) |
| $22,500 to $24,999 | 0 (0.0%) | 10 (11.1%) |
| $25,000 to $29,999 | 8 (14.0%) | 0 (0.0%) |
| $30,000 to $34,999 | 0 (0.0%) | 4 (4.4%) |
| $35,000 to $39,999 | 12 (21.0%) | 0 (0.0%) |
| $40,000 to $44,999 | 0 (0.0%) | 13 (14.4%) |
| $45,000 to $49,999 | 0 (0.0%) | 0 (0.0%) |
| $50,000 to $54,999 | 0 (0.0%) | 13 (14.4%) |
| $55,000 to $64,999 | 0 (0.0%) | 0 (0.0%) |
| $65,000 to $74,999 | 0 (0.0%) | 0 (0.0%) |
| $75,000 to $99,999 | 7 (12.3%) | 0 (0.0%) |
| $100,000+ | 0 (0.0%) | 0 (0.0%) |
| Total | 57 (100.0%) | 90 (100.0%) |
Earnings by Sex by Educational Attainment in Buchanan Lake Village
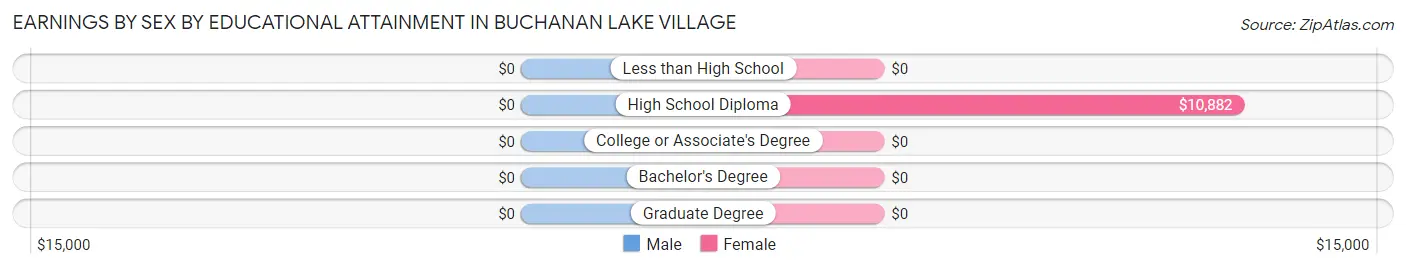
| Educational Attainment | Male Income | Female Income |
| Less than High School | - | - |
| High School Diploma | - | - |
| College or Associate's Degree | - | - |
| Bachelor's Degree | - | - |
| Graduate Degree | - | - |
| Total | $13,295 | $0 |
Family Income in Buchanan Lake Village
Family Income Brackets in Buchanan Lake Village
According to the Buchanan Lake Village family income data, there are 52 families falling into the $35,000 to $49,999 income range, which is the most common income bracket and makes up 29.4% of all families.
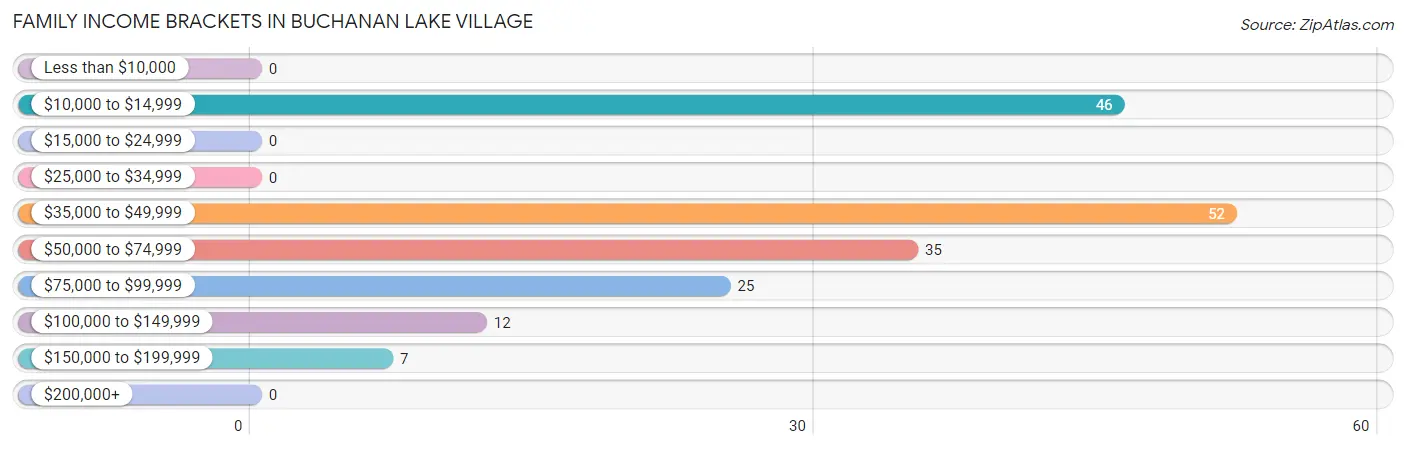
| Income Bracket | # Families | % Families |
| Less than $10,000 | 0 | 0.0% |
| $10,000 to $14,999 | 46 | 26.0% |
| $15,000 to $24,999 | 0 | 0.0% |
| $25,000 to $34,999 | 0 | 0.0% |
| $35,000 to $49,999 | 52 | 29.4% |
| $50,000 to $74,999 | 35 | 19.8% |
| $75,000 to $99,999 | 25 | 14.1% |
| $100,000 to $149,999 | 12 | 6.8% |
| $150,000 to $199,999 | 7 | 4.0% |
| $200,000+ | 0 | 0.0% |
Family Income by Famaliy Size in Buchanan Lake Village
2-person families (155 | 87.6%) account for the highest median family income in Buchanan Lake Village with $42,336 per family, while 2-person families (155 | 87.6%) have the highest median income of $21,168 per family member.
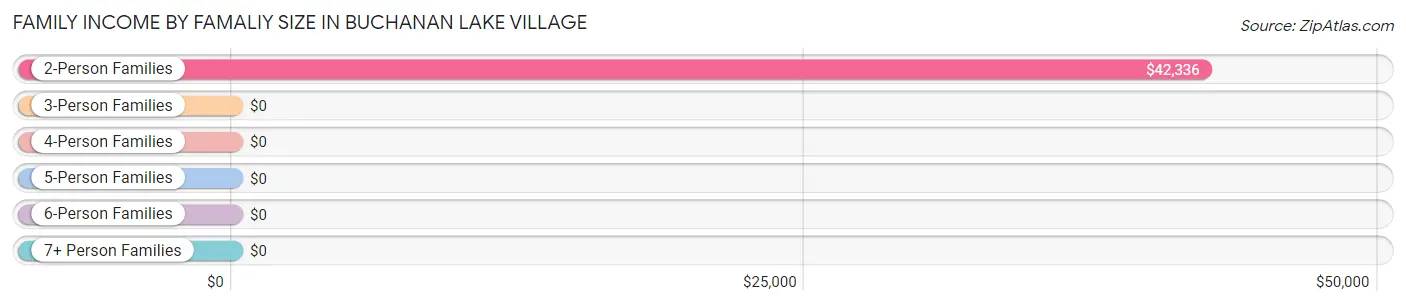
| Income Bracket | # Families | Median Income |
| 2-Person Families | 155 (87.6%) | $42,336 |
| 3-Person Families | 1 (0.6%) | $0 |
| 4-Person Families | 8 (4.5%) | $0 |
| 5-Person Families | 13 (7.3%) | $0 |
| 6-Person Families | 0 (0.0%) | $0 |
| 7+ Person Families | 0 (0.0%) | $0 |
| Total | 177 (100.0%) | $42,204 |
Family Income by Number of Earners in Buchanan Lake Village
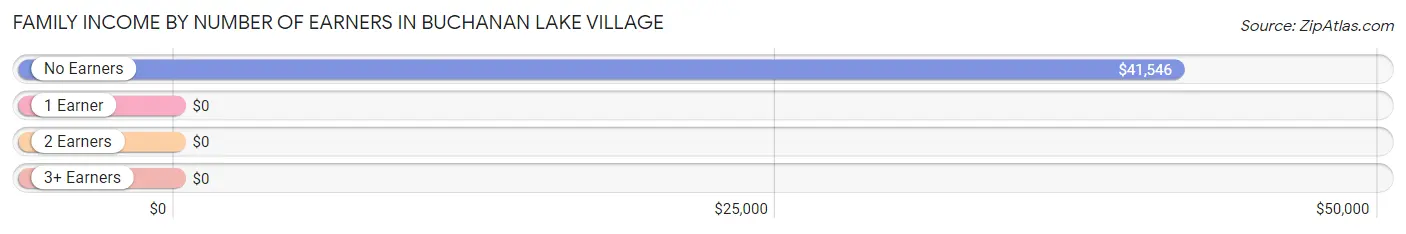
| Number of Earners | # Families | Median Income |
| No Earners | 65 (36.7%) | $41,546 |
| 1 Earner | 73 (41.2%) | $0 |
| 2 Earners | 39 (22.0%) | $0 |
| 3+ Earners | 0 (0.0%) | $0 |
| Total | 177 (100.0%) | $42,204 |
Household Income in Buchanan Lake Village
Household Income Brackets in Buchanan Lake Village
With 82 households falling in the category, the $35,000 to $49,999 income range is the most frequent in Buchanan Lake Village, accounting for 31.1% of all households.
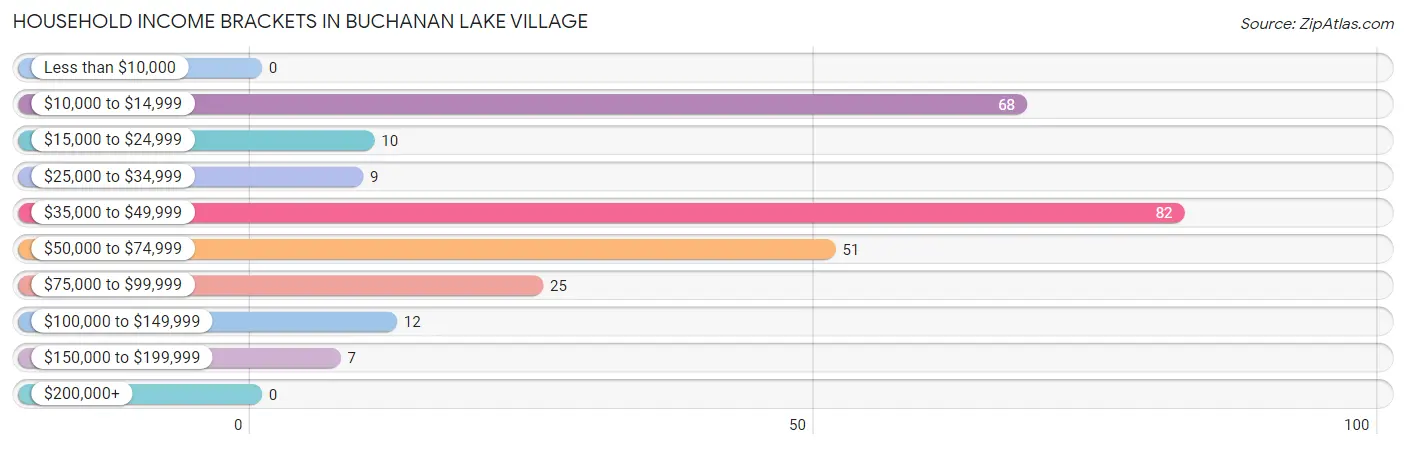
| Income Bracket | # Households | % Households |
| Less than $10,000 | 0 | 0.0% |
| $10,000 to $14,999 | 68 | 25.8% |
| $15,000 to $24,999 | 10 | 3.8% |
| $25,000 to $34,999 | 9 | 3.4% |
| $35,000 to $49,999 | 82 | 31.1% |
| $50,000 to $74,999 | 51 | 19.3% |
| $75,000 to $99,999 | 25 | 9.5% |
| $100,000 to $149,999 | 12 | 4.5% |
| $150,000 to $199,999 | 7 | 2.7% |
| $200,000+ | 0 | 0.0% |
Household Income by Householder Age in Buchanan Lake Village
The median household income in Buchanan Lake Village is $41,118, with the highest median household income of $76,932 found in the 45 to 64 years age bracket for the primary householder. A total of 27 households (10.2%) fall into this category.
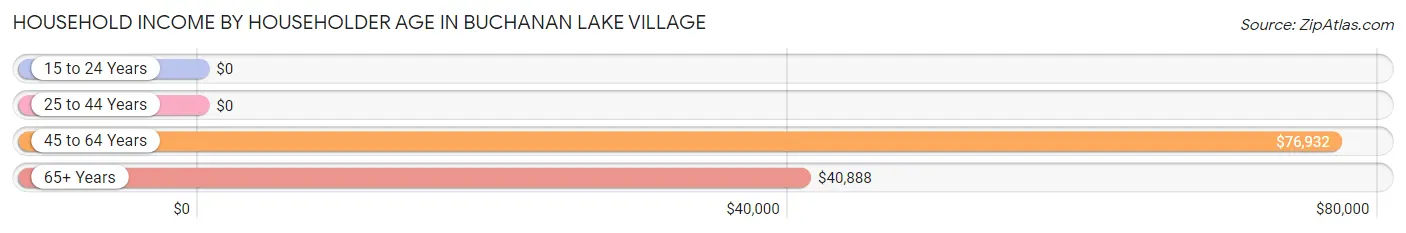
| Income Bracket | # Households | Median Income |
| 15 to 24 Years | 0 (0.0%) | $0 |
| 25 to 44 Years | 20 (7.6%) | $0 |
| 45 to 64 Years | 27 (10.2%) | $76,932 |
| 65+ Years | 217 (82.2%) | $40,888 |
| Total | 264 (100.0%) | $41,118 |
Poverty in Buchanan Lake Village
Income Below Poverty by Sex and Age in Buchanan Lake Village
With 33.6% poverty level for males and 33.0% for females among the residents of Buchanan Lake Village, 6 to 11 year old males and under 5 year old females are the most vulnerable to poverty, with 37 males (100.0%) and 18 females (100.0%) in their respective age groups living below the poverty level.
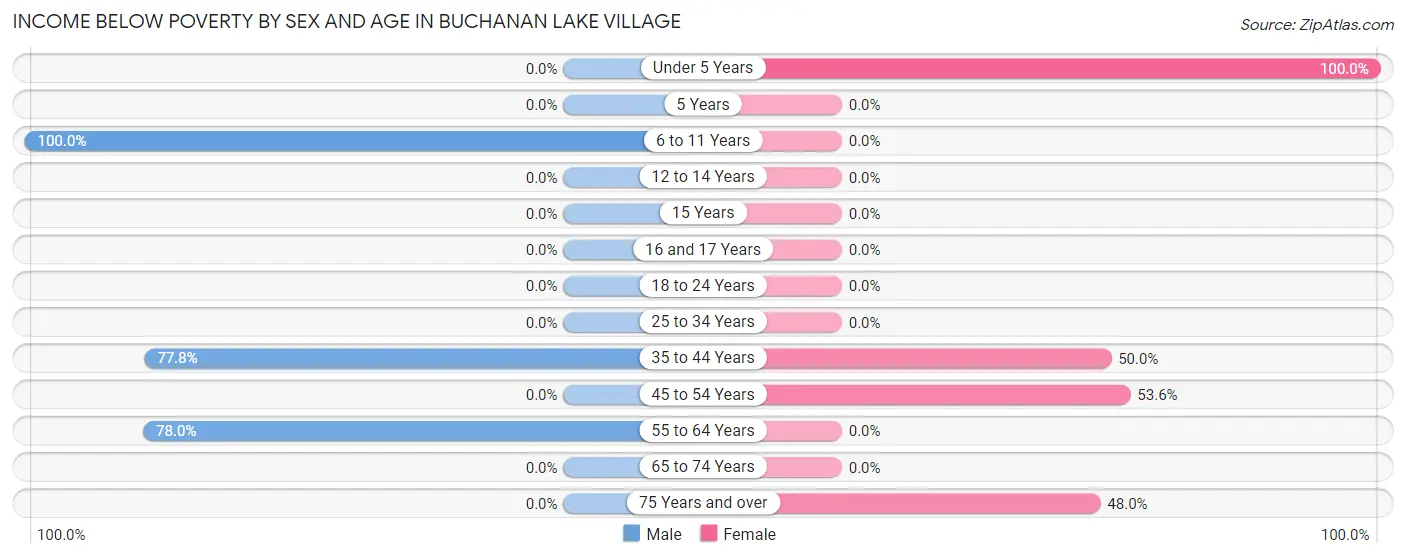
| Age Bracket | Male | Female |
| Under 5 Years | 0 (0.0%) | 18 (100.0%) |
| 5 Years | 0 (0.0%) | 0 (0.0%) |
| 6 to 11 Years | 37 (100.0%) | 0 (0.0%) |
| 12 to 14 Years | 0 (0.0%) | 0 (0.0%) |
| 15 Years | 0 (0.0%) | 0 (0.0%) |
| 16 and 17 Years | 0 (0.0%) | 0 (0.0%) |
| 18 to 24 Years | 0 (0.0%) | 0 (0.0%) |
| 25 to 34 Years | 0 (0.0%) | 0 (0.0%) |
| 35 to 44 Years | 7 (77.8%) | 13 (50.0%) |
| 45 to 54 Years | 0 (0.0%) | 15 (53.6%) |
| 55 to 64 Years | 39 (78.0%) | 0 (0.0%) |
| 65 to 74 Years | 0 (0.0%) | 0 (0.0%) |
| 75 Years and over | 0 (0.0%) | 48 (48.0%) |
| Total | 83 (33.6%) | 94 (33.0%) |
Income Above Poverty by Sex and Age in Buchanan Lake Village
According to the poverty statistics in Buchanan Lake Village, males aged 12 to 14 years and females aged 6 to 11 years are the age groups that are most secure financially, with 100.0% of males and 100.0% of females in these age groups living above the poverty line.
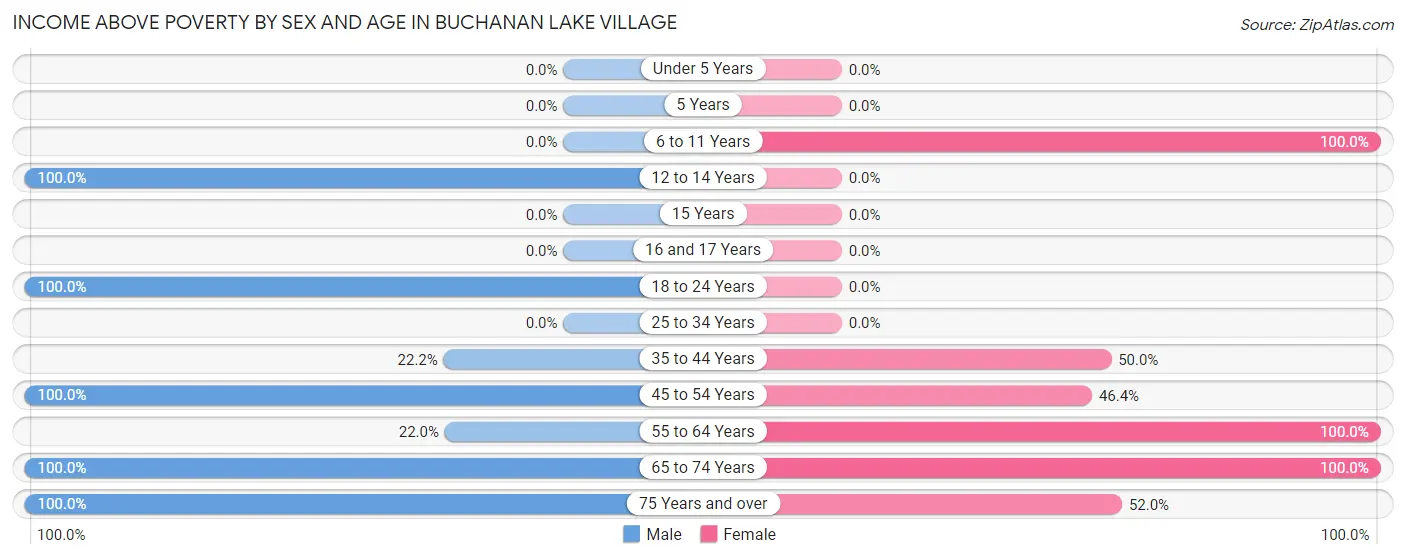
| Age Bracket | Male | Female |
| Under 5 Years | 0 (0.0%) | 0 (0.0%) |
| 5 Years | 0 (0.0%) | 0 (0.0%) |
| 6 to 11 Years | 0 (0.0%) | 6 (100.0%) |
| 12 to 14 Years | 9 (100.0%) | 0 (0.0%) |
| 15 Years | 0 (0.0%) | 0 (0.0%) |
| 16 and 17 Years | 0 (0.0%) | 0 (0.0%) |
| 18 to 24 Years | 12 (100.0%) | 0 (0.0%) |
| 25 to 34 Years | 0 (0.0%) | 0 (0.0%) |
| 35 to 44 Years | 2 (22.2%) | 13 (50.0%) |
| 45 to 54 Years | 7 (100.0%) | 13 (46.4%) |
| 55 to 64 Years | 11 (22.0%) | 60 (100.0%) |
| 65 to 74 Years | 45 (100.0%) | 47 (100.0%) |
| 75 Years and over | 78 (100.0%) | 52 (52.0%) |
| Total | 164 (66.4%) | 191 (67.0%) |
Income Below Poverty Among Married-Couple Families in Buchanan Lake Village
The poverty statistics for married-couple families in Buchanan Lake Village show that 31.1% or 33 of the total 106 families live below the poverty line. Families with no children have the highest poverty rate of 31.1%, comprising of 33 families. On the other hand, families with no children have the lowest poverty rate of 31.1%, which includes 33 families.
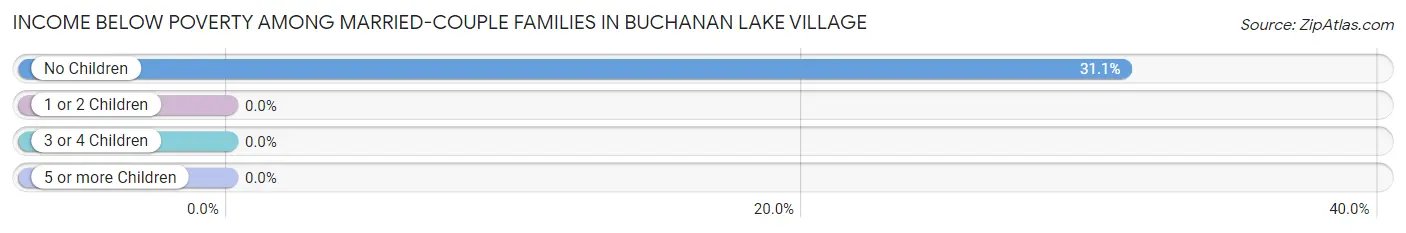
| Children | Above Poverty | Below Poverty |
| No Children | 73 (68.9%) | 33 (31.1%) |
| 1 or 2 Children | 0 (0.0%) | 0 (0.0%) |
| 3 or 4 Children | 0 (0.0%) | 0 (0.0%) |
| 5 or more Children | 0 (0.0%) | 0 (0.0%) |
| Total | 73 (68.9%) | 33 (31.1%) |
Income Below Poverty Among Single-Parent Households in Buchanan Lake Village
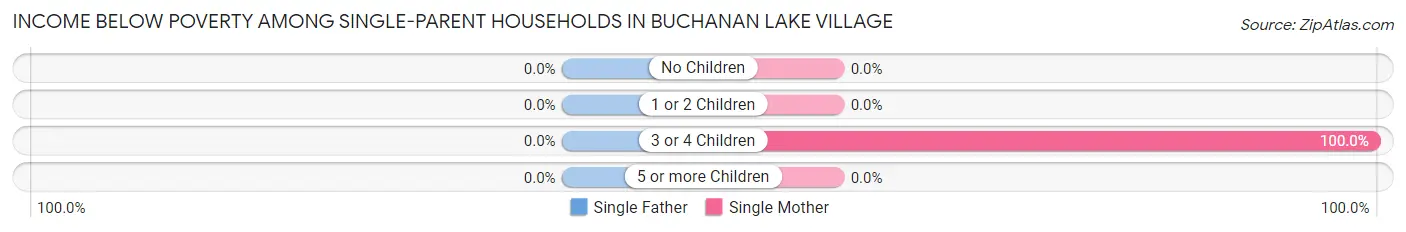
| Children | Single Father | Single Mother |
| No Children | 0 (0.0%) | 0 (0.0%) |
| 1 or 2 Children | 0 (0.0%) | 0 (0.0%) |
| 3 or 4 Children | 0 (0.0%) | 13 (100.0%) |
| 5 or more Children | 0 (0.0%) | 0 (0.0%) |
| Total | 0 (0.0%) | 13 (39.4%) |
Income Below Poverty Among Married-Couple vs Single-Parent Households in Buchanan Lake Village
The poverty data for Buchanan Lake Village shows that 33 of the married-couple family households (31.1%) and 13 of the single-parent households (18.3%) are living below the poverty level. Within the married-couple family households, those with no children have the highest poverty rate, with 33 households (31.1%) falling below the poverty line. Among the single-parent households, those with 3 or 4 children have the highest poverty rate, with 13 household (100.0%) living below poverty.
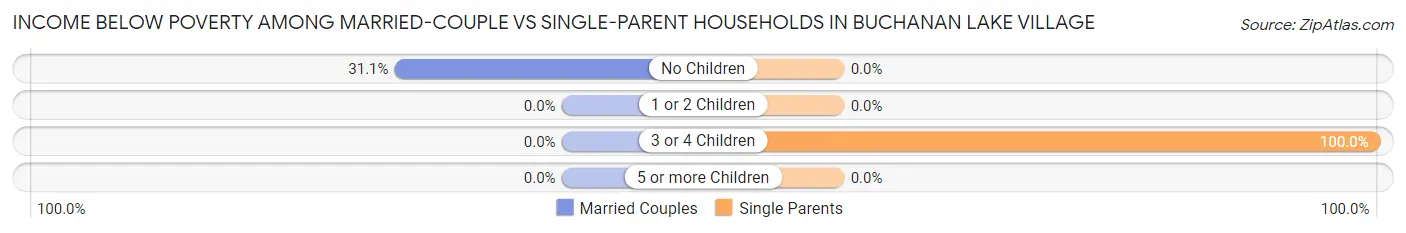
| Children | Married-Couple Families | Single-Parent Households |
| No Children | 33 (31.1%) | 0 (0.0%) |
| 1 or 2 Children | 0 (0.0%) | 0 (0.0%) |
| 3 or 4 Children | 0 (0.0%) | 13 (100.0%) |
| 5 or more Children | 0 (0.0%) | 0 (0.0%) |
| Total | 33 (31.1%) | 13 (18.3%) |
Race in Buchanan Lake Village
The most populous races in Buchanan Lake Village are White / Caucasian (520 | 97.7%), Hispanic or Latino (120 | 22.6%), and Two or more Races (12 | 2.3%).
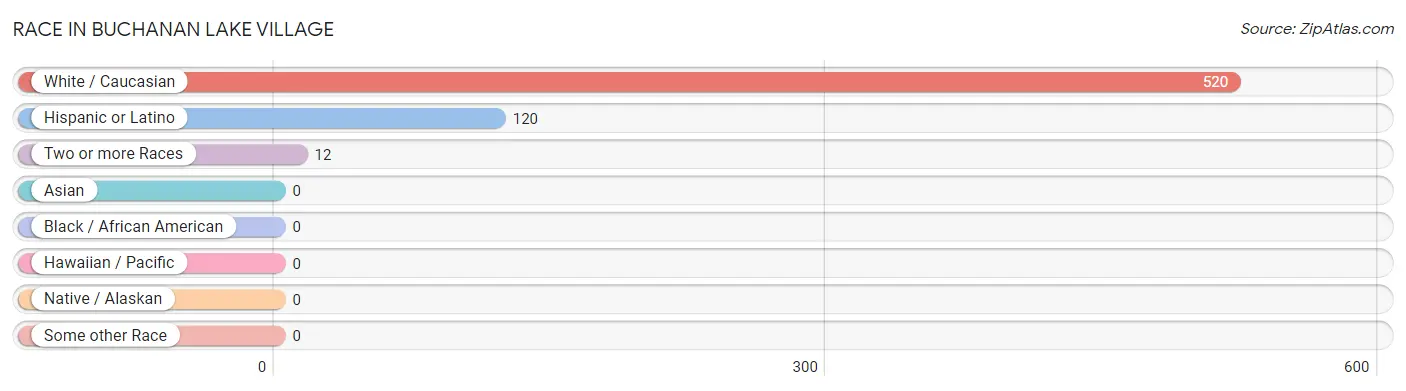
| Race | # Population | % Population |
| Asian | 0 | 0.0% |
| Black / African American | 0 | 0.0% |
| Hawaiian / Pacific | 0 | 0.0% |
| Hispanic or Latino | 120 | 22.6% |
| Native / Alaskan | 0 | 0.0% |
| White / Caucasian | 520 | 97.7% |
| Two or more Races | 12 | 2.3% |
| Some other Race | 0 | 0.0% |
| Total | 532 | 100.0% |
Ancestry in Buchanan Lake Village
The most populous ancestries reported in Buchanan Lake Village are German (150 | 28.2%), Scottish (76 | 14.3%), Irish (56 | 10.5%), English (37 | 7.0%), and Scotch-Irish (16 | 3.0%), together accounting for 63.0% of all Buchanan Lake Village residents.
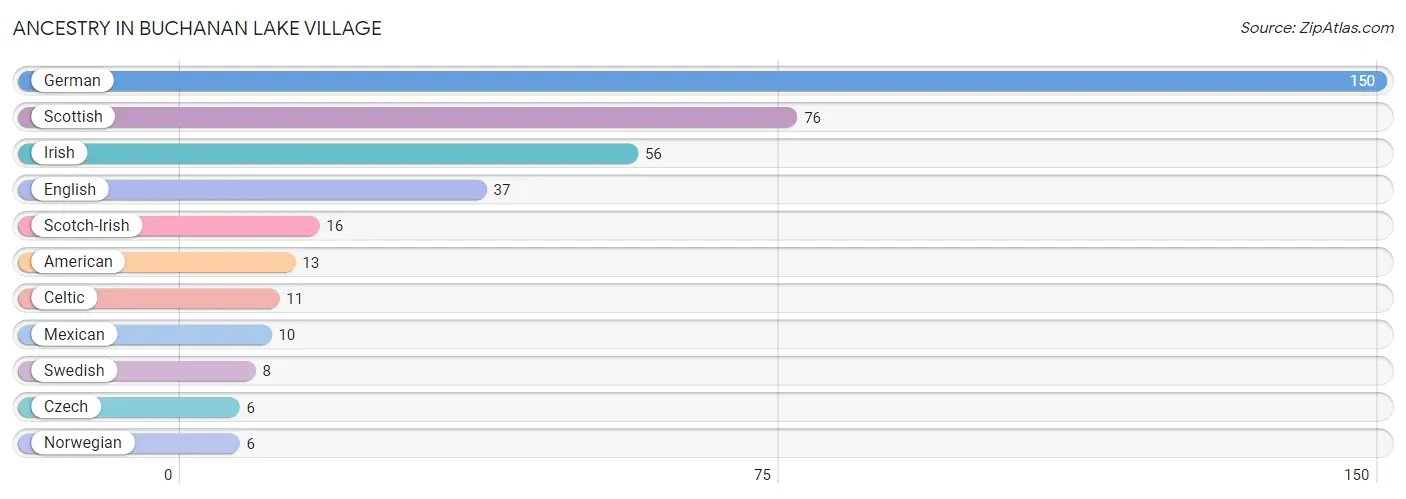
| Ancestry | # Population | % Population |
| American | 13 | 2.4% |
| Celtic | 11 | 2.1% |
| Czech | 6 | 1.1% |
| English | 37 | 7.0% |
| German | 150 | 28.2% |
| Irish | 56 | 10.5% |
| Mexican | 10 | 1.9% |
| Norwegian | 6 | 1.1% |
| Scotch-Irish | 16 | 3.0% |
| Scottish | 76 | 14.3% |
| Swedish | 8 | 1.5% | View All 11 Rows |
Immigrants in Buchanan Lake Village

| Immigration Origin | # Population | % Population | View All 0 Rows |
Sex and Age in Buchanan Lake Village
Sex and Age in Buchanan Lake Village
The most populous age groups in Buchanan Lake Village are 75 to 79 Years (53 | 21.5%) for men and 75 to 79 Years (52 | 18.2%) for women.
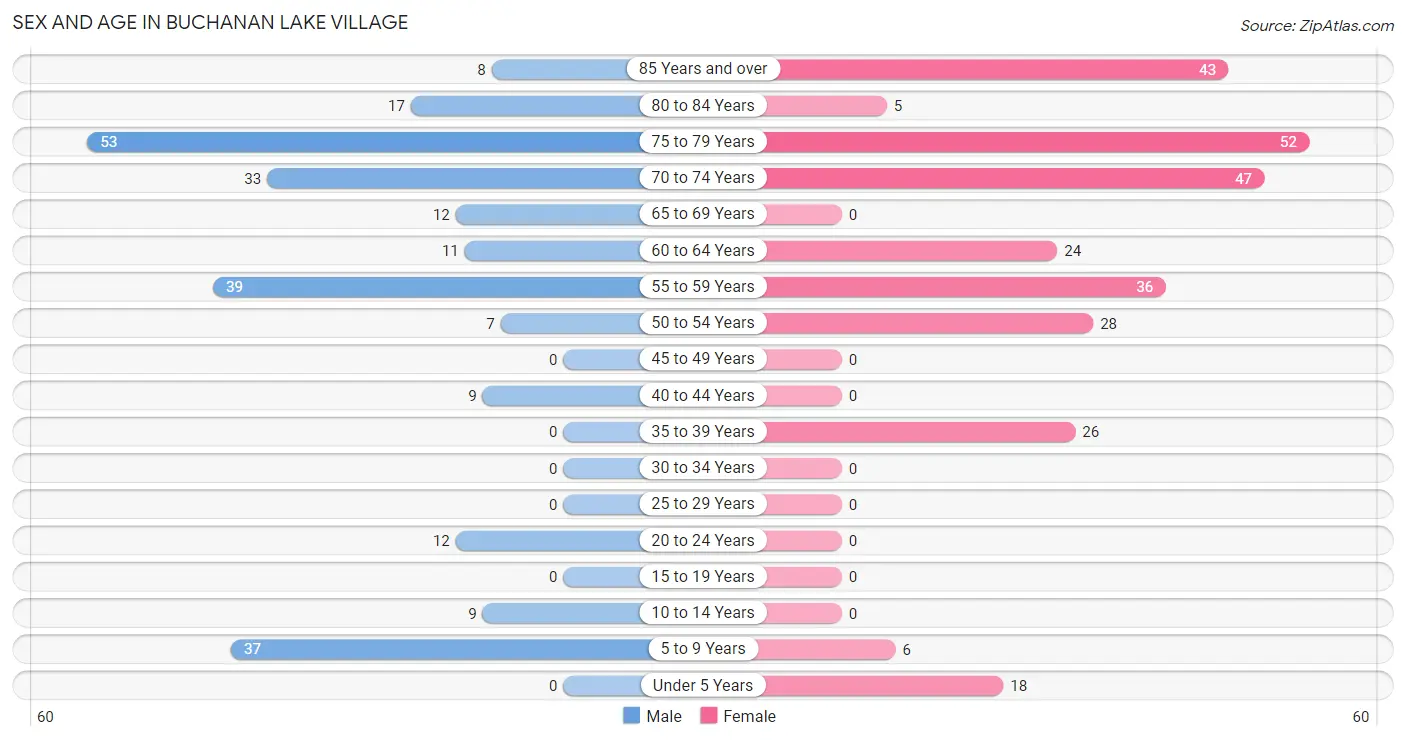
| Age Bracket | Male | Female |
| Under 5 Years | 0 (0.0%) | 18 (6.3%) |
| 5 to 9 Years | 37 (15.0%) | 6 (2.1%) |
| 10 to 14 Years | 9 (3.6%) | 0 (0.0%) |
| 15 to 19 Years | 0 (0.0%) | 0 (0.0%) |
| 20 to 24 Years | 12 (4.9%) | 0 (0.0%) |
| 25 to 29 Years | 0 (0.0%) | 0 (0.0%) |
| 30 to 34 Years | 0 (0.0%) | 0 (0.0%) |
| 35 to 39 Years | 0 (0.0%) | 26 (9.1%) |
| 40 to 44 Years | 9 (3.6%) | 0 (0.0%) |
| 45 to 49 Years | 0 (0.0%) | 0 (0.0%) |
| 50 to 54 Years | 7 (2.8%) | 28 (9.8%) |
| 55 to 59 Years | 39 (15.8%) | 36 (12.6%) |
| 60 to 64 Years | 11 (4.4%) | 24 (8.4%) |
| 65 to 69 Years | 12 (4.9%) | 0 (0.0%) |
| 70 to 74 Years | 33 (13.4%) | 47 (16.5%) |
| 75 to 79 Years | 53 (21.5%) | 52 (18.2%) |
| 80 to 84 Years | 17 (6.9%) | 5 (1.8%) |
| 85 Years and over | 8 (3.2%) | 43 (15.1%) |
| Total | 247 (100.0%) | 285 (100.0%) |
Families and Households in Buchanan Lake Village
Median Family Size in Buchanan Lake Village
The median family size in Buchanan Lake Village is 2.43 persons per family, with single female/mother families (33 | 18.6%) accounting for the largest median family size of 5 persons per family. On the other hand, single male/father families (38 | 21.5%) represent the smallest median family size with 1.82 persons per family.
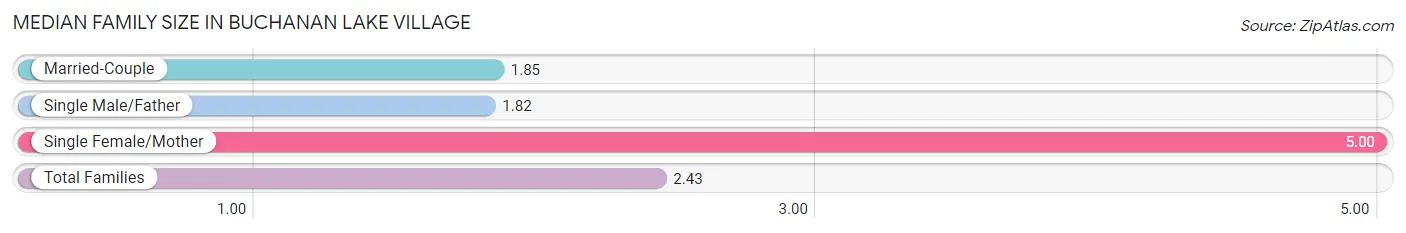
| Family Type | # Families | Family Size |
| Married-Couple | 106 (59.9%) | 1.85 |
| Single Male/Father | 38 (21.5%) | 1.82 |
| Single Female/Mother | 33 (18.6%) | 5.00 |
| Total Families | 177 (100.0%) | 2.43 |
Median Household Size in Buchanan Lake Village
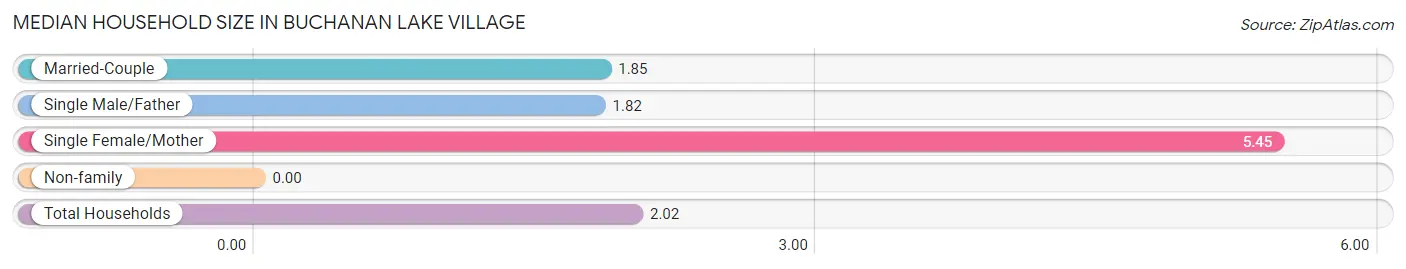
| Household Type | # Households | Household Size |
| Married-Couple | 106 (40.2%) | 1.85 |
| Single Male/Father | 38 (14.4%) | 1.82 |
| Single Female/Mother | 33 (12.5%) | 5.45 |
| Non-family | 87 (33.0%) | - |
| Total Households | 264 (100.0%) | 2.02 |
Household Size by Marriage Status in Buchanan Lake Village
Out of a total of 264 households in Buchanan Lake Village, 177 (67.0%) are family households, while 87 (33.0%) are nonfamily households. The most numerous type of family households are 2-person households, comprising 155, and the most common type of nonfamily households are 1-person households, comprising 87.
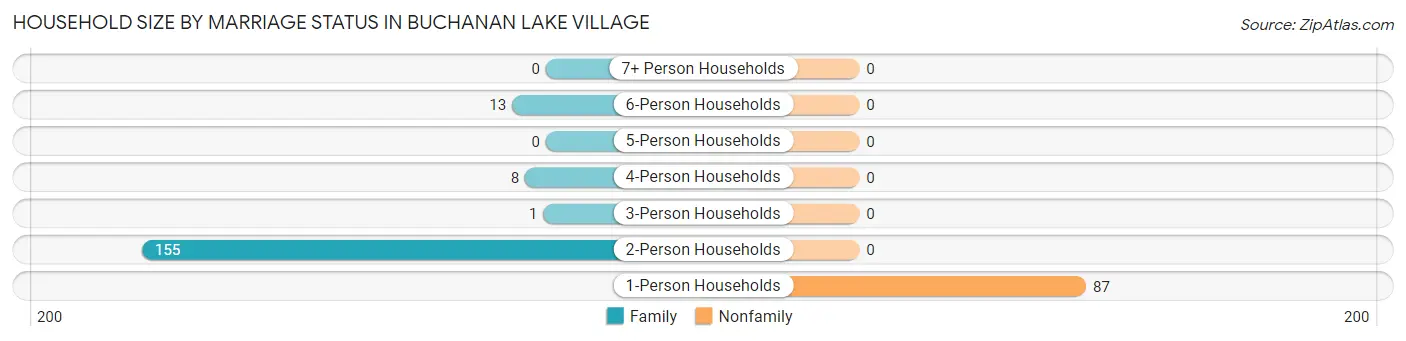
| Household Size | Family Households | Nonfamily Households |
| 1-Person Households | - | 87 (33.0%) |
| 2-Person Households | 155 (58.7%) | 0 (0.0%) |
| 3-Person Households | 1 (0.4%) | 0 (0.0%) |
| 4-Person Households | 8 (3.0%) | 0 (0.0%) |
| 5-Person Households | 0 (0.0%) | 0 (0.0%) |
| 6-Person Households | 13 (4.9%) | 0 (0.0%) |
| 7+ Person Households | 0 (0.0%) | 0 (0.0%) |
| Total | 177 (67.0%) | 87 (33.0%) |
Female Fertility in Buchanan Lake Village
Fertility by Age in Buchanan Lake Village
| Age Bracket | Women with Births | Births / 1,000 Women |
| 15 to 19 years | 0 (0.0%) | 0.0 |
| 20 to 34 years | 0 (0.0%) | 0.0 |
| 35 to 50 years | 0 (0.0%) | 0.0 |
| Total | 0 (0.0%) | 0.0 |
Fertility by Age by Marriage Status in Buchanan Lake Village
| Age Bracket | Married | Unmarried |
| 15 to 19 years | 0 (0.0%) | 0 (0.0%) |
| 20 to 34 years | 0 (0.0%) | 0 (0.0%) |
| 35 to 50 years | 0 (0.0%) | 0 (0.0%) |
| Total | 0 (0.0%) | 0 (0.0%) |
Fertility by Education in Buchanan Lake Village
| Educational Attainment | Women with Births | Births / 1,000 Women |
| Less than High School | 0 (0.0%) | 0.0 |
| High School Diploma | 0 (0.0%) | 0.0 |
| College or Associate's Degree | 0 (0.0%) | 0.0 |
| Bachelor's Degree | 0 (0.0%) | 0.0 |
| Graduate Degree | 0 (0.0%) | 0.0 |
| Total | 0 (0.0%) | 0.0 |
Fertility by Education by Marriage Status in Buchanan Lake Village
| Educational Attainment | Married | Unmarried |
| Less than High School | 0 (0.0%) | 0 (0.0%) |
| High School Diploma | 0 (0.0%) | 0 (0.0%) |
| College or Associate's Degree | 0 (0.0%) | 0 (0.0%) |
| Bachelor's Degree | 0 (0.0%) | 0 (0.0%) |
| Graduate Degree | 0 (0.0%) | 0 (0.0%) |
| Total | 0 (0.0%) | 0 (0.0%) |
Employment Characteristics in Buchanan Lake Village
Employment by Class of Employer in Buchanan Lake Village
Among the 124 employed individuals in Buchanan Lake Village, private company employees (56 | 45.2%), self-employed (not incorporated) (26 | 21.0%), and state government employees (20 | 16.1%) make up the most common classes of employment.
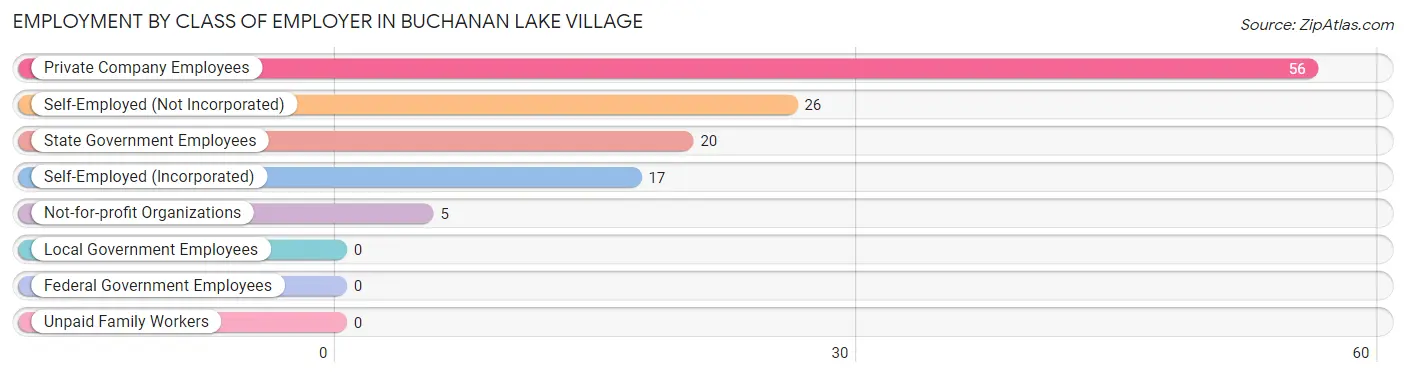
| Employer Class | # Employees | % Employees |
| Private Company Employees | 56 | 45.2% |
| Self-Employed (Incorporated) | 17 | 13.7% |
| Self-Employed (Not Incorporated) | 26 | 21.0% |
| Not-for-profit Organizations | 5 | 4.0% |
| Local Government Employees | 0 | 0.0% |
| State Government Employees | 20 | 16.1% |
| Federal Government Employees | 0 | 0.0% |
| Unpaid Family Workers | 0 | 0.0% |
| Total | 124 | 100.0% |
Employment Status by Age in Buchanan Lake Village
According to the labor force statistics for Buchanan Lake Village, out of the total population over 16 years of age (462), 31.0% or 143 individuals are in the labor force, with 13.3% or 19 of them unemployed. The age group with the highest labor force participation rate is 20 to 24 years, with 100.0% or 12 individuals in the labor force. Within the labor force, the 20 to 24 years age range has the highest percentage of unemployed individuals, with 100.0% or 12 of them being unemployed.
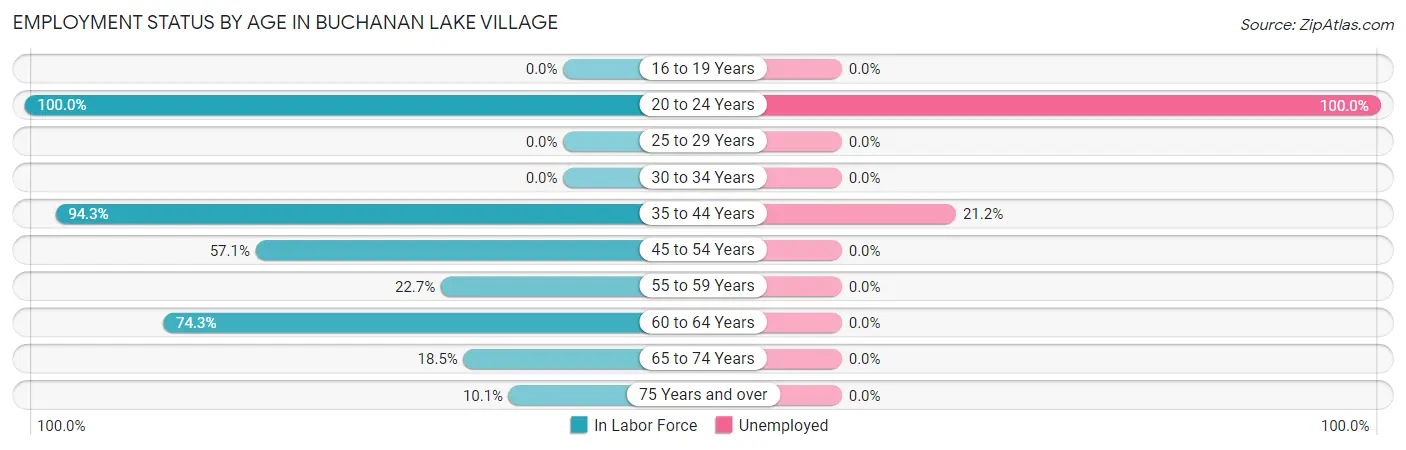
| Age Bracket | In Labor Force | Unemployed |
| 16 to 19 Years | 0 (0.0%) | 0 (0.0%) |
| 20 to 24 Years | 12 (100.0%) | 12 (100.0%) |
| 25 to 29 Years | 0 (0.0%) | 0 (0.0%) |
| 30 to 34 Years | 0 (0.0%) | 0 (0.0%) |
| 35 to 44 Years | 33 (94.3%) | 7 (21.2%) |
| 45 to 54 Years | 20 (57.1%) | 0 (0.0%) |
| 55 to 59 Years | 17 (22.7%) | 0 (0.0%) |
| 60 to 64 Years | 26 (74.3%) | 0 (0.0%) |
| 65 to 74 Years | 17 (18.5%) | 0 (0.0%) |
| 75 Years and over | 18 (10.1%) | 0 (0.0%) |
| Total | 143 (31.0%) | 19 (13.3%) |
Employment Status by Educational Attainment in Buchanan Lake Village
According to labor force statistics for Buchanan Lake Village, 53.3% of individuals (96) out of the total population between 25 and 64 years of age (180) are in the labor force, with 7.3% or 7 of them being unemployed. The group with the highest labor force participation rate are those with the educational attainment of bachelor's degree or higher, with 100.0% or 13 individuals in the labor force. Within the labor force, individuals with less than high school education have the highest percentage of unemployment, with 100.0% or 7 of them being unemployed.
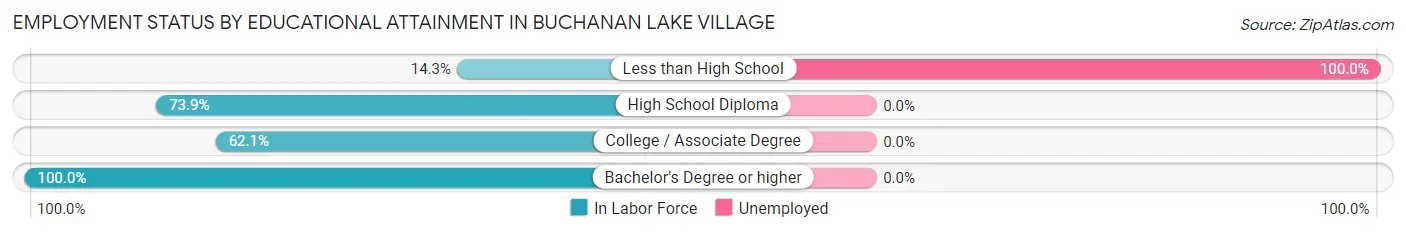
| Educational Attainment | In Labor Force | Unemployed |
| Less than High School | 7 (14.3%) | 49 (100.0%) |
| High School Diploma | 17 (73.9%) | 0 (0.0%) |
| College / Associate Degree | 59 (62.1%) | 0 (0.0%) |
| Bachelor's Degree or higher | 13 (100.0%) | 0 (0.0%) |
| Total | 96 (53.3%) | 13 (7.3%) |
Employment Occupations by Sex in Buchanan Lake Village
Management, Business, Science and Arts Occupations
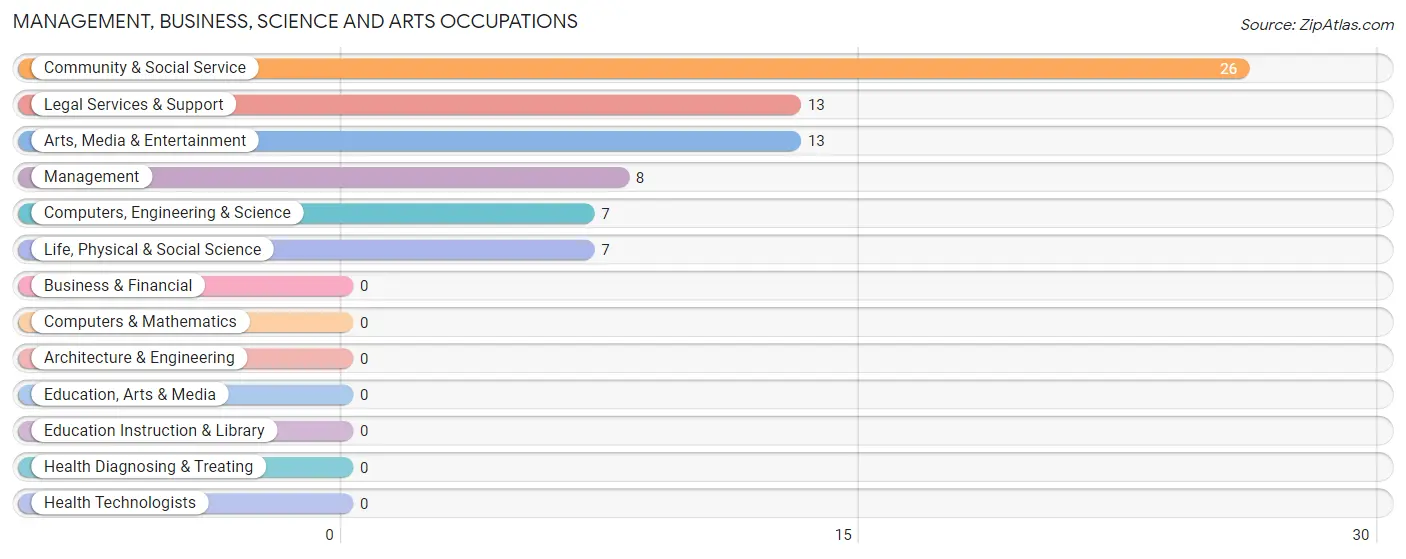
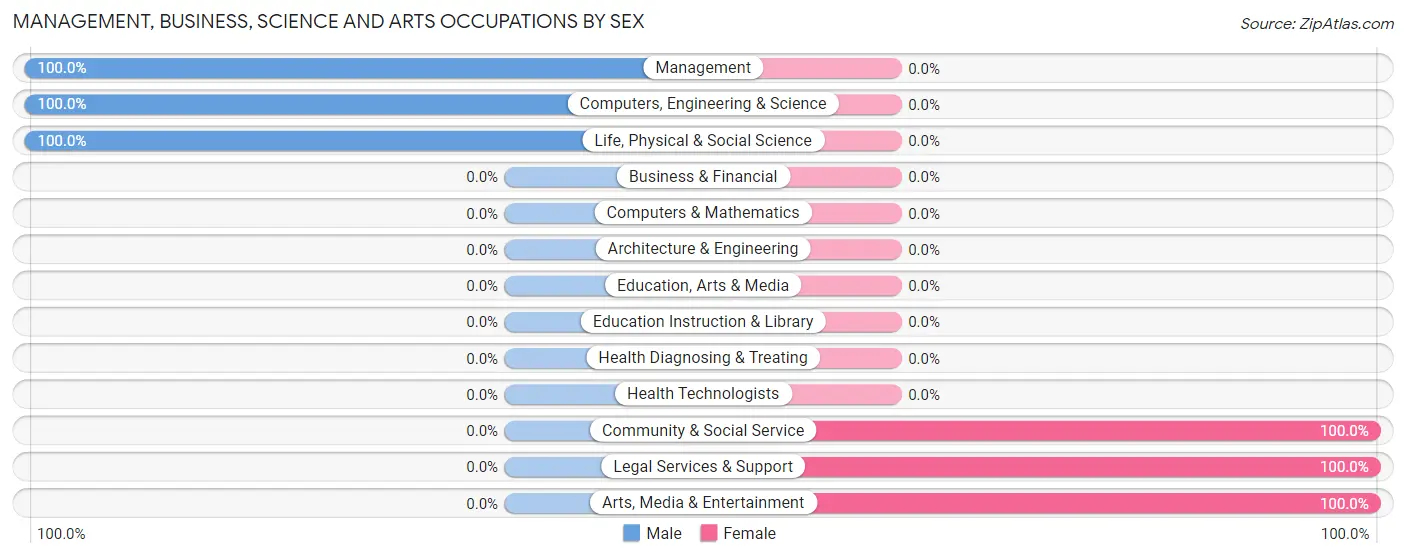
The most common Management, Business, Science and Arts occupations in Buchanan Lake Village are Community & Social Service (26 | 21.0%), Legal Services & Support (13 | 10.5%), Arts, Media & Entertainment (13 | 10.5%), Management (8 | 6.5%), and Computers, Engineering & Science (7 | 5.7%).
Management, Business, Science and Arts Occupations by Sex
Within the Management, Business, Science and Arts occupations in Buchanan Lake Village, the most male-oriented occupations are Management (100.0%), Computers, Engineering & Science (100.0%), and Life, Physical & Social Science (100.0%), while the most female-oriented occupations are Community & Social Service (100.0%), Legal Services & Support (100.0%), and Arts, Media & Entertainment (100.0%).
| Occupation | Male | Female |
| Management | 8 (100.0%) | 0 (0.0%) |
| Business & Financial | 0 (0.0%) | 0 (0.0%) |
| Computers, Engineering & Science | 7 (100.0%) | 0 (0.0%) |
| Computers & Mathematics | 0 (0.0%) | 0 (0.0%) |
| Architecture & Engineering | 0 (0.0%) | 0 (0.0%) |
| Life, Physical & Social Science | 7 (100.0%) | 0 (0.0%) |
| Community & Social Service | 0 (0.0%) | 26 (100.0%) |
| Education, Arts & Media | 0 (0.0%) | 0 (0.0%) |
| Legal Services & Support | 0 (0.0%) | 13 (100.0%) |
| Education Instruction & Library | 0 (0.0%) | 0 (0.0%) |
| Arts, Media & Entertainment | 0 (0.0%) | 13 (100.0%) |
| Health Diagnosing & Treating | 0 (0.0%) | 0 (0.0%) |
| Health Technologists | 0 (0.0%) | 0 (0.0%) |
| Total (Category) | 15 (36.6%) | 26 (63.4%) |
| Total (Overall) | 38 (30.6%) | 86 (69.4%) |
Services Occupations
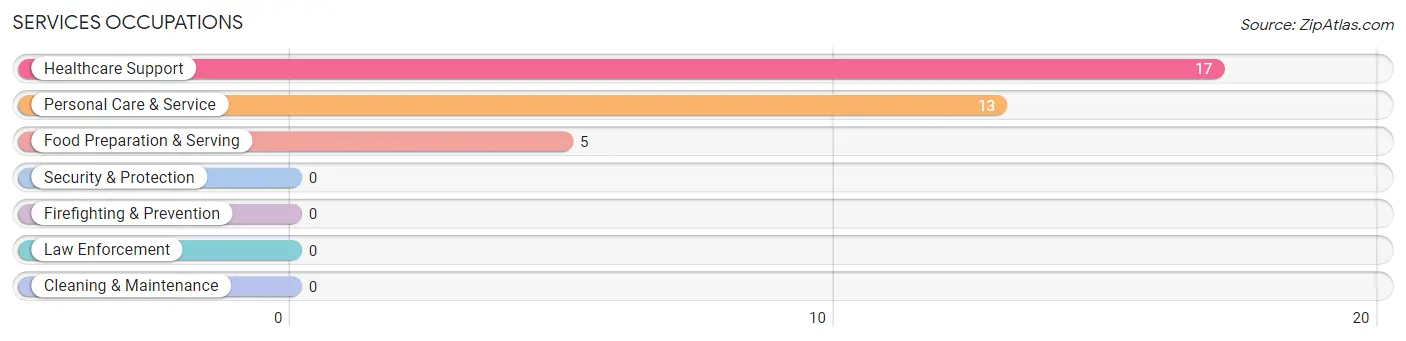
The most common Services occupations in Buchanan Lake Village are Healthcare Support (17 | 13.7%), Personal Care & Service (13 | 10.5%), and Food Preparation & Serving (5 | 4.0%).
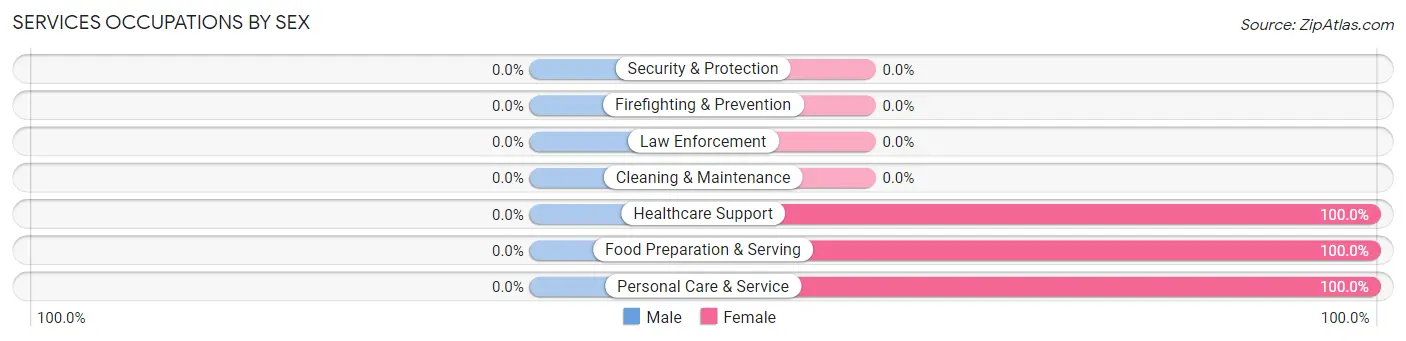
Services Occupations by Sex
| Occupation | Male | Female |
| Healthcare Support | 0 (0.0%) | 17 (100.0%) |
| Security & Protection | 0 (0.0%) | 0 (0.0%) |
| Firefighting & Prevention | 0 (0.0%) | 0 (0.0%) |
| Law Enforcement | 0 (0.0%) | 0 (0.0%) |
| Food Preparation & Serving | 0 (0.0%) | 5 (100.0%) |
| Cleaning & Maintenance | 0 (0.0%) | 0 (0.0%) |
| Personal Care & Service | 0 (0.0%) | 13 (100.0%) |
| Total (Category) | 0 (0.0%) | 35 (100.0%) |
| Total (Overall) | 38 (30.6%) | 86 (69.4%) |
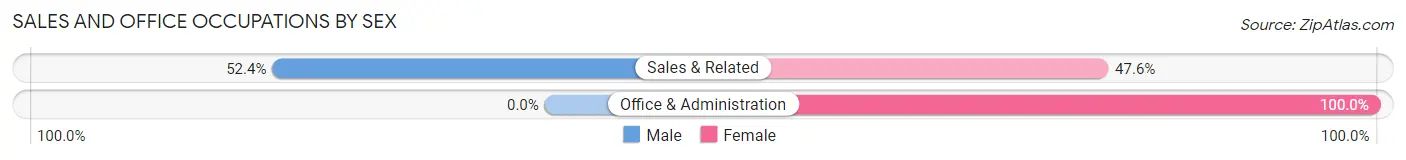
Sales and Office Occupations
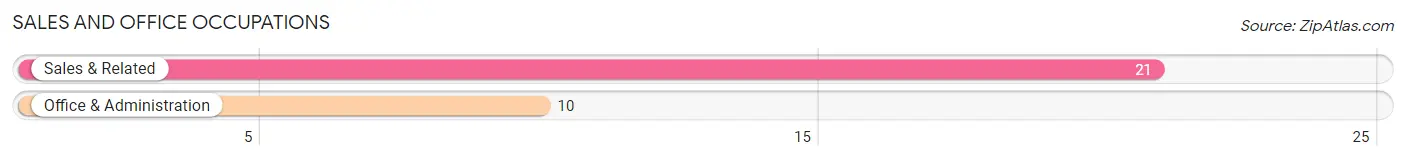
The most common Sales and Office occupations in Buchanan Lake Village are Sales & Related (21 | 16.9%), and Office & Administration (10 | 8.1%).
Sales and Office Occupations by Sex
| Occupation | Male | Female |
| Sales & Related | 11 (52.4%) | 10 (47.6%) |
| Office & Administration | 0 (0.0%) | 10 (100.0%) |
| Total (Category) | 11 (35.5%) | 20 (64.5%) |
| Total (Overall) | 38 (30.6%) | 86 (69.4%) |
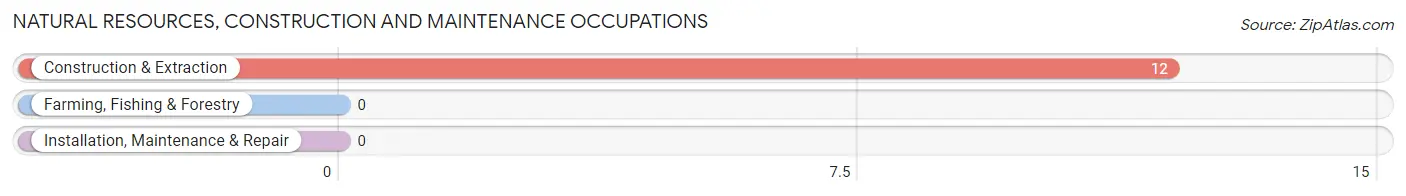
Natural Resources, Construction and Maintenance Occupations
The most common Natural Resources, Construction and Maintenance occupations in Buchanan Lake Village are , and Construction & Extraction (12 | 9.7%).
Natural Resources, Construction and Maintenance Occupations by Sex
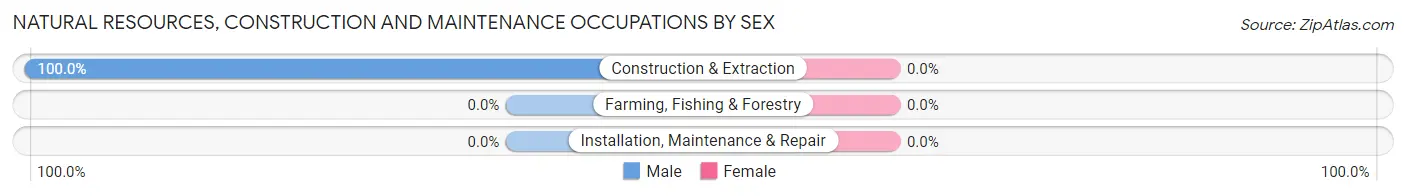
| Occupation | Male | Female |
| Farming, Fishing & Forestry | 0 (0.0%) | 0 (0.0%) |
| Construction & Extraction | 12 (100.0%) | 0 (0.0%) |
| Installation, Maintenance & Repair | 0 (0.0%) | 0 (0.0%) |
| Total (Category) | 12 (100.0%) | 0 (0.0%) |
| Total (Overall) | 38 (30.6%) | 86 (69.4%) |
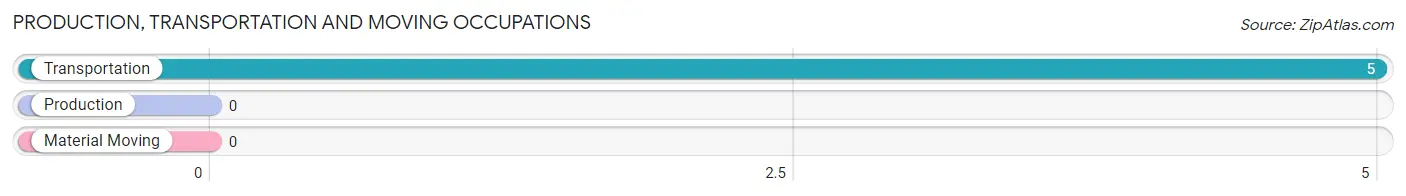
Production, Transportation and Moving Occupations
The most common Production, Transportation and Moving occupations in Buchanan Lake Village are , and Transportation (5 | 4.0%).
Production, Transportation and Moving Occupations by Sex
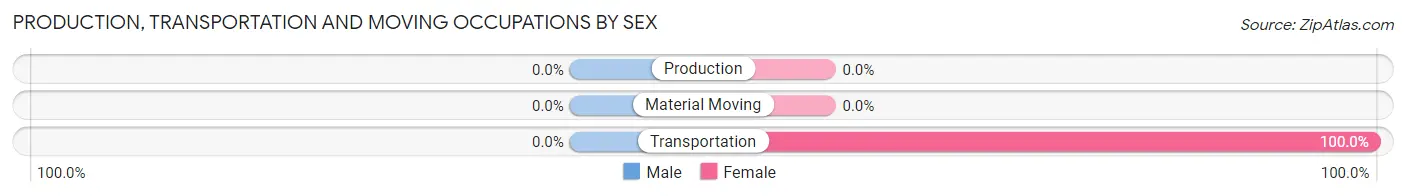
| Occupation | Male | Female |
| Production | 0 (0.0%) | 0 (0.0%) |
| Transportation | 0 (0.0%) | 5 (100.0%) |
| Material Moving | 0 (0.0%) | 0 (0.0%) |
| Total (Category) | 0 (0.0%) | 5 (100.0%) |
| Total (Overall) | 38 (30.6%) | 86 (69.4%) |
Employment Industries by Sex in Buchanan Lake Village
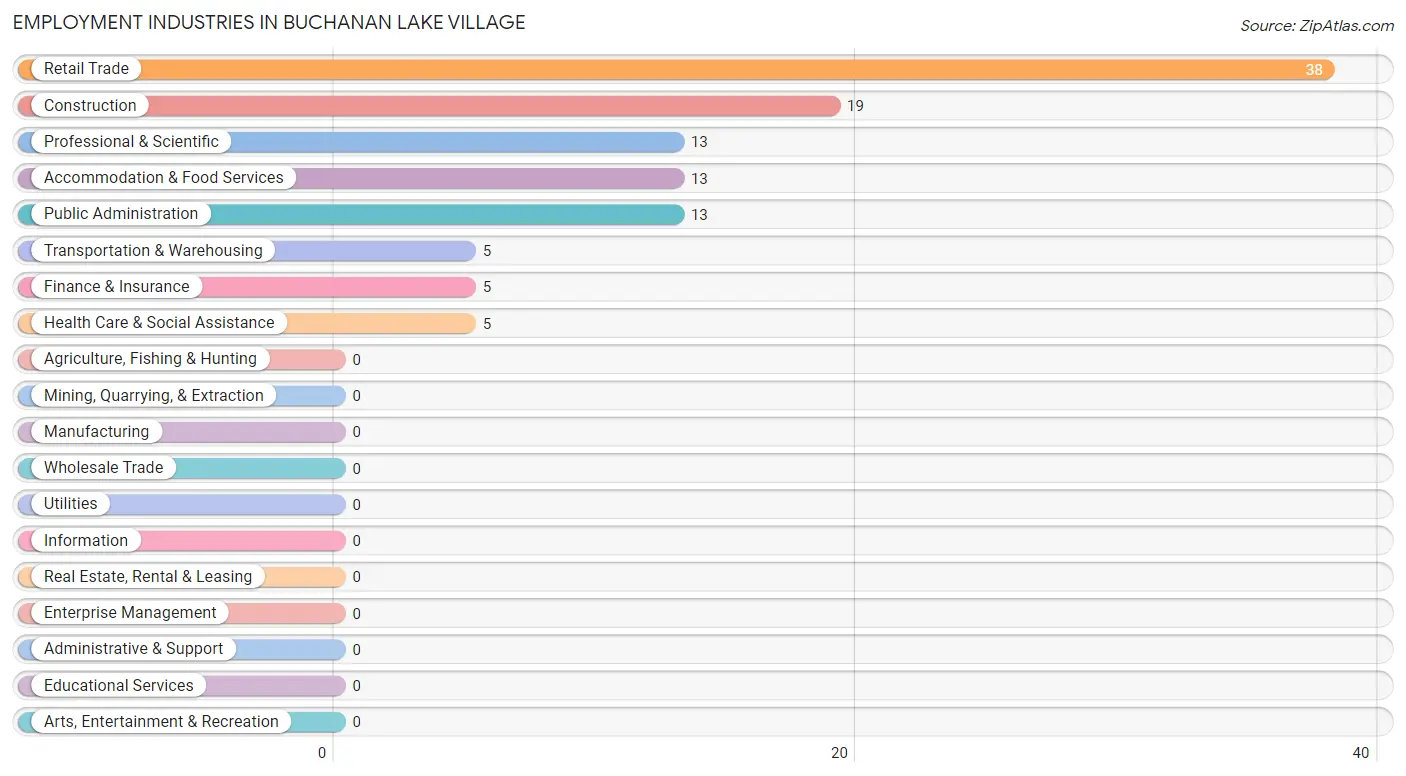
Employment Industries in Buchanan Lake Village
The major employment industries in Buchanan Lake Village include Retail Trade (38 | 30.6%), Construction (19 | 15.3%), Professional & Scientific (13 | 10.5%), Accommodation & Food Services (13 | 10.5%), and Public Administration (13 | 10.5%).
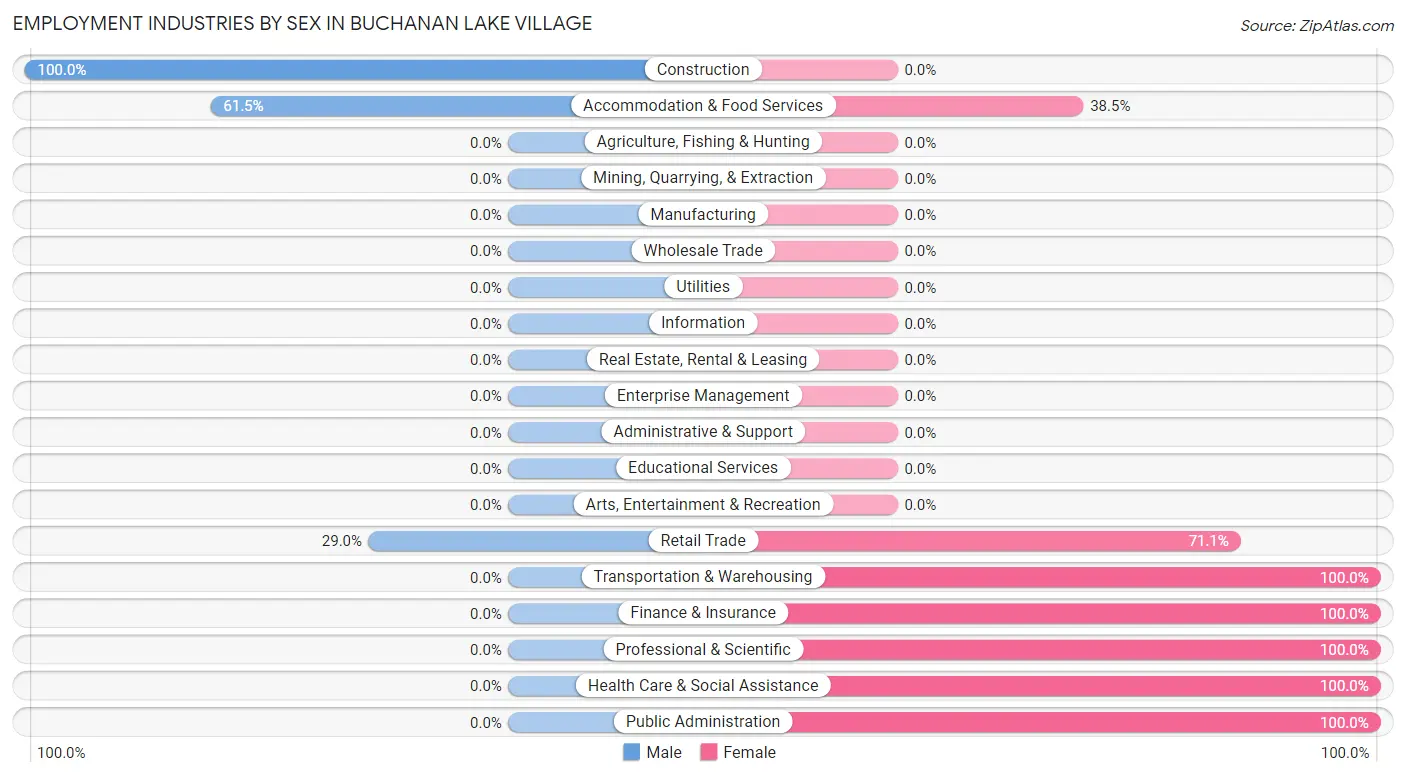
Employment Industries by Sex in Buchanan Lake Village
The Buchanan Lake Village industries that see more men than women are Construction (100.0%), Accommodation & Food Services (61.5%), and Retail Trade (28.9%), whereas the industries that tend to have a higher number of women are Transportation & Warehousing (100.0%), Finance & Insurance (100.0%), and Professional & Scientific (100.0%).
| Industry | Male | Female |
| Agriculture, Fishing & Hunting | 0 (0.0%) | 0 (0.0%) |
| Mining, Quarrying, & Extraction | 0 (0.0%) | 0 (0.0%) |
| Construction | 19 (100.0%) | 0 (0.0%) |
| Manufacturing | 0 (0.0%) | 0 (0.0%) |
| Wholesale Trade | 0 (0.0%) | 0 (0.0%) |
| Retail Trade | 11 (28.9%) | 27 (71.1%) |
| Transportation & Warehousing | 0 (0.0%) | 5 (100.0%) |
| Utilities | 0 (0.0%) | 0 (0.0%) |
| Information | 0 (0.0%) | 0 (0.0%) |
| Finance & Insurance | 0 (0.0%) | 5 (100.0%) |
| Real Estate, Rental & Leasing | 0 (0.0%) | 0 (0.0%) |
| Professional & Scientific | 0 (0.0%) | 13 (100.0%) |
| Enterprise Management | 0 (0.0%) | 0 (0.0%) |
| Administrative & Support | 0 (0.0%) | 0 (0.0%) |
| Educational Services | 0 (0.0%) | 0 (0.0%) |
| Health Care & Social Assistance | 0 (0.0%) | 5 (100.0%) |
| Arts, Entertainment & Recreation | 0 (0.0%) | 0 (0.0%) |
| Accommodation & Food Services | 8 (61.5%) | 5 (38.5%) |
| Public Administration | 0 (0.0%) | 13 (100.0%) |
| Total | 38 (30.6%) | 86 (69.4%) |
Education in Buchanan Lake Village
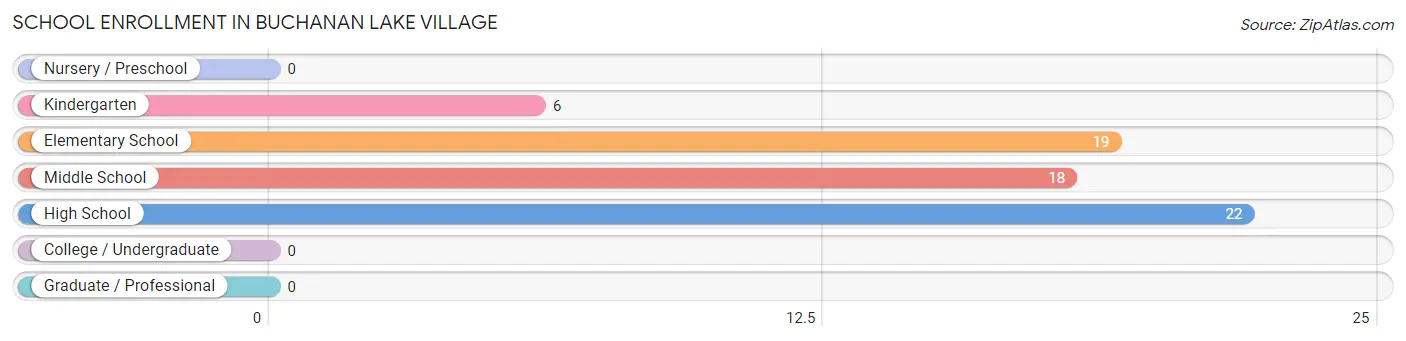
School Enrollment in Buchanan Lake Village
The most common levels of schooling among the 65 students in Buchanan Lake Village are high school (22 | 33.9%), elementary school (19 | 29.2%), and middle school (18 | 27.7%).
| School Level | # Students | % Students |
| Nursery / Preschool | 0 | 0.0% |
| Kindergarten | 6 | 9.2% |
| Elementary School | 19 | 29.2% |
| Middle School | 18 | 27.7% |
| High School | 22 | 33.9% |
| College / Undergraduate | 0 | 0.0% |
| Graduate / Professional | 0 | 0.0% |
| Total | 65 | 100.0% |
School Enrollment by Age by Funding Source in Buchanan Lake Village
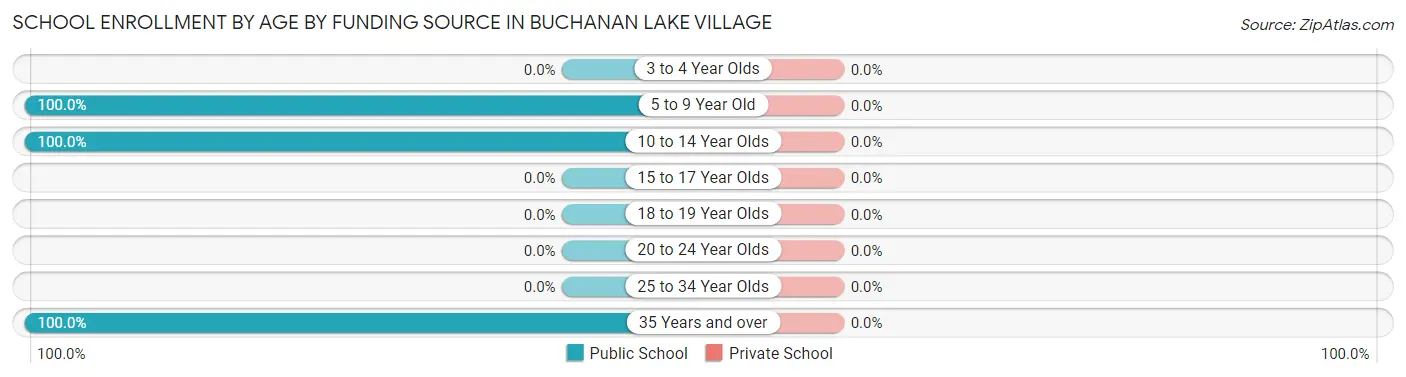
| Age Bracket | Public School | Private School |
| 3 to 4 Year Olds | 0 (0.0%) | 0 (0.0%) |
| 5 to 9 Year Old | 43 (100.0%) | 0 (0.0%) |
| 10 to 14 Year Olds | 9 (100.0%) | 0 (0.0%) |
| 15 to 17 Year Olds | 0 (0.0%) | 0 (0.0%) |
| 18 to 19 Year Olds | 0 (0.0%) | 0 (0.0%) |
| 20 to 24 Year Olds | 0 (0.0%) | 0 (0.0%) |
| 25 to 34 Year Olds | 0 (0.0%) | 0 (0.0%) |
| 35 Years and over | 13 (100.0%) | 0 (0.0%) |
| Total | 65 (100.0%) | 0 (0.0%) |
Educational Attainment by Field of Study in Buchanan Lake Village
Business (33 | 63.5%), arts & humanities (13 | 25.0%), and psychology (6 | 11.5%) are the most common fields of study among 52 individuals in Buchanan Lake Village who have obtained a bachelor's degree or higher.
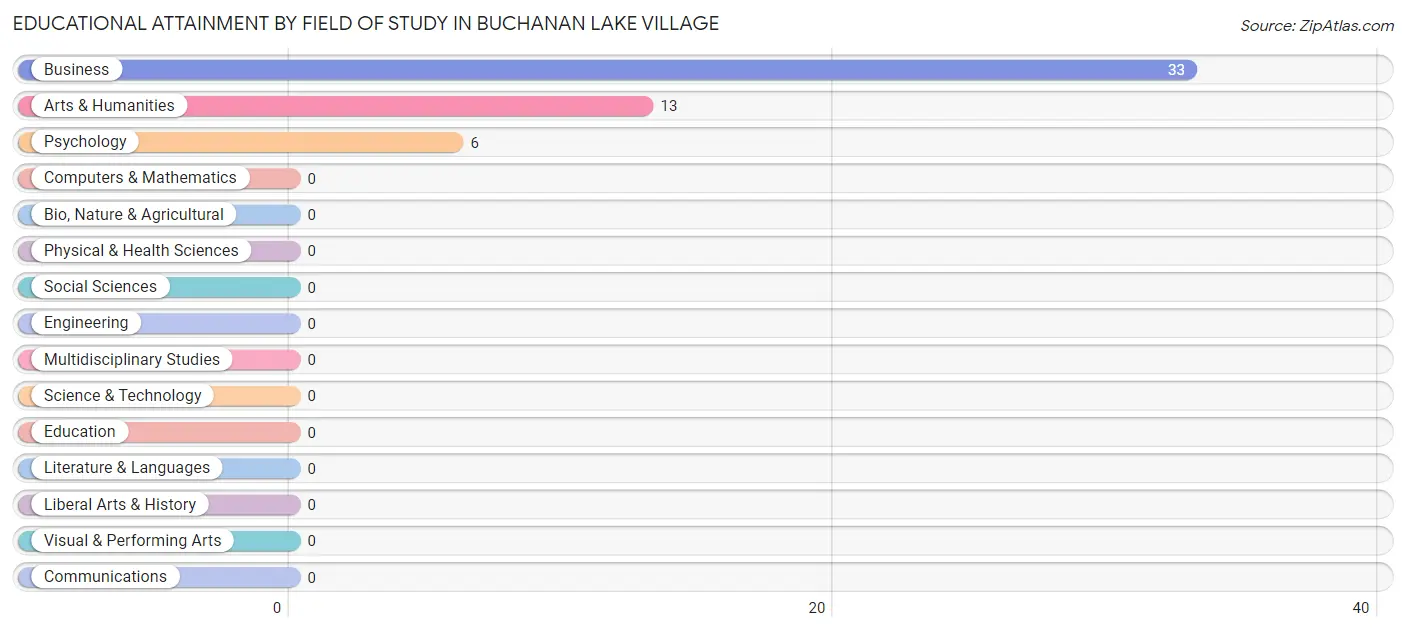
| Field of Study | # Graduates | % Graduates |
| Computers & Mathematics | 0 | 0.0% |
| Bio, Nature & Agricultural | 0 | 0.0% |
| Physical & Health Sciences | 0 | 0.0% |
| Psychology | 6 | 11.5% |
| Social Sciences | 0 | 0.0% |
| Engineering | 0 | 0.0% |
| Multidisciplinary Studies | 0 | 0.0% |
| Science & Technology | 0 | 0.0% |
| Business | 33 | 63.5% |
| Education | 0 | 0.0% |
| Literature & Languages | 0 | 0.0% |
| Liberal Arts & History | 0 | 0.0% |
| Visual & Performing Arts | 0 | 0.0% |
| Communications | 0 | 0.0% |
| Arts & Humanities | 13 | 25.0% |
| Total | 52 | 100.0% |
Transportation & Commute in Buchanan Lake Village
Vehicle Availability by Sex in Buchanan Lake Village
The most prevalent vehicle ownership categories in Buchanan Lake Village are males with 2 vehicles (26, accounting for 68.4%) and females with 2 vehicles (43, making up 30.2%).
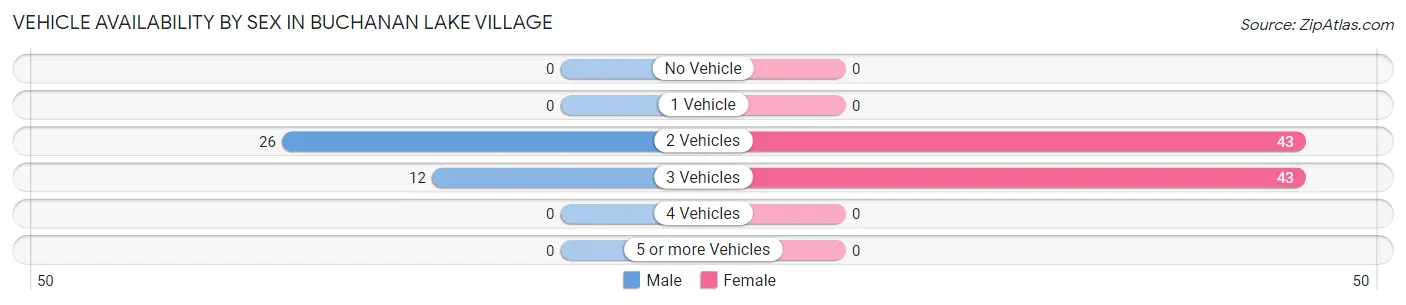
| Vehicles Available | Male | Female |
| No Vehicle | 0 (0.0%) | 0 (0.0%) |
| 1 Vehicle | 0 (0.0%) | 0 (0.0%) |
| 2 Vehicles | 26 (68.4%) | 43 (50.0%) |
| 3 Vehicles | 12 (31.6%) | 43 (50.0%) |
| 4 Vehicles | 0 (0.0%) | 0 (0.0%) |
| 5 or more Vehicles | 0 (0.0%) | 0 (0.0%) |
| Total | 38 (100.0%) | 86 (100.0%) |
Commute Time in Buchanan Lake Village
The most frequently occuring commute durations in Buchanan Lake Village are 20 to 24 minutes (32 commuters, 35.2%), 45 to 59 minutes (31 commuters, 34.1%), and 35 to 39 minutes (12 commuters, 13.2%).
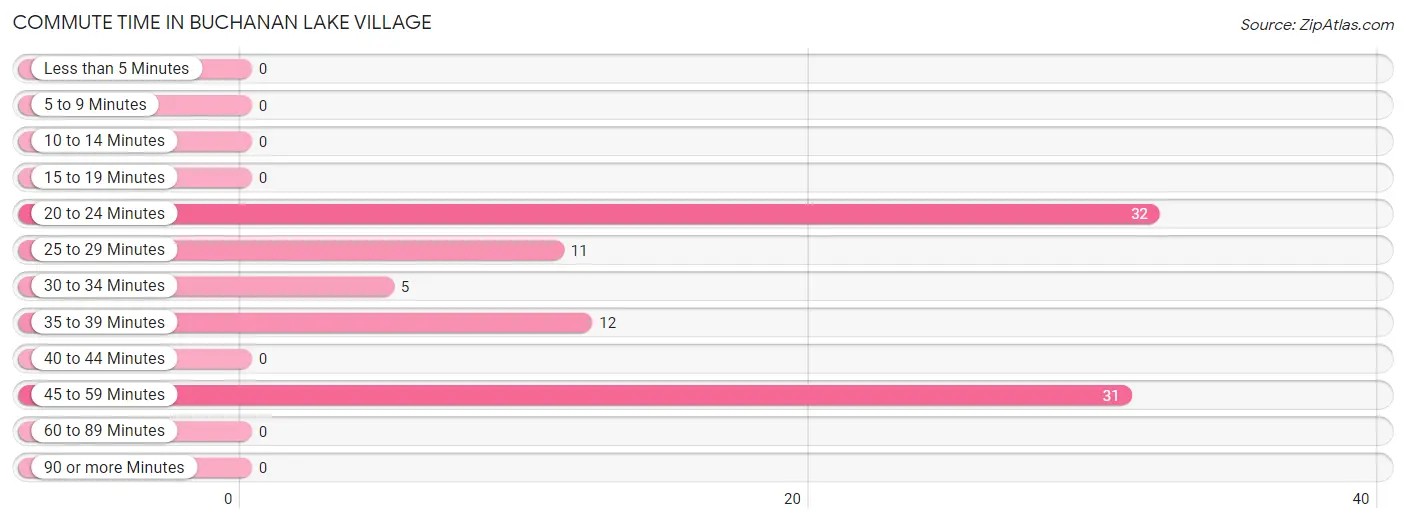
| Commute Time | # Commuters | % Commuters |
| Less than 5 Minutes | 0 | 0.0% |
| 5 to 9 Minutes | 0 | 0.0% |
| 10 to 14 Minutes | 0 | 0.0% |
| 15 to 19 Minutes | 0 | 0.0% |
| 20 to 24 Minutes | 32 | 35.2% |
| 25 to 29 Minutes | 11 | 12.1% |
| 30 to 34 Minutes | 5 | 5.5% |
| 35 to 39 Minutes | 12 | 13.2% |
| 40 to 44 Minutes | 0 | 0.0% |
| 45 to 59 Minutes | 31 | 34.1% |
| 60 to 89 Minutes | 0 | 0.0% |
| 90 or more Minutes | 0 | 0.0% |
Commute Time by Sex in Buchanan Lake Village
The most common commute times in Buchanan Lake Village are 35 to 39 minutes (12 commuters, 52.2%) for males and 20 to 24 minutes (32 commuters, 47.1%) for females.
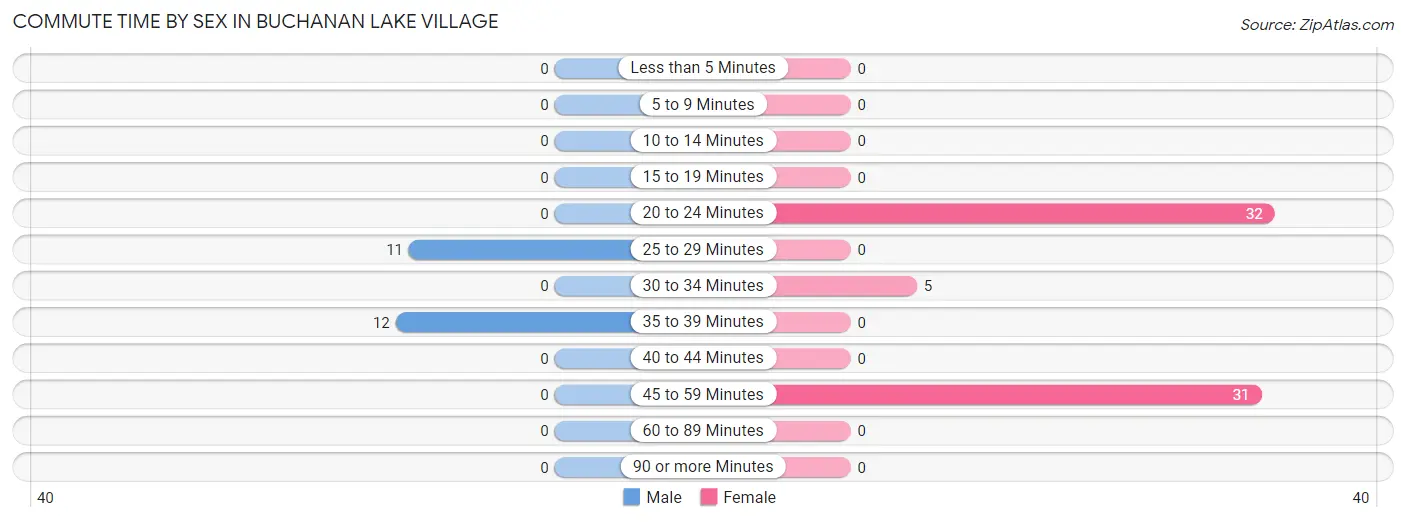
| Commute Time | Male | Female |
| Less than 5 Minutes | 0 (0.0%) | 0 (0.0%) |
| 5 to 9 Minutes | 0 (0.0%) | 0 (0.0%) |
| 10 to 14 Minutes | 0 (0.0%) | 0 (0.0%) |
| 15 to 19 Minutes | 0 (0.0%) | 0 (0.0%) |
| 20 to 24 Minutes | 0 (0.0%) | 32 (47.1%) |
| 25 to 29 Minutes | 11 (47.8%) | 0 (0.0%) |
| 30 to 34 Minutes | 0 (0.0%) | 5 (7.3%) |
| 35 to 39 Minutes | 12 (52.2%) | 0 (0.0%) |
| 40 to 44 Minutes | 0 (0.0%) | 0 (0.0%) |
| 45 to 59 Minutes | 0 (0.0%) | 31 (45.6%) |
| 60 to 89 Minutes | 0 (0.0%) | 0 (0.0%) |
| 90 or more Minutes | 0 (0.0%) | 0 (0.0%) |
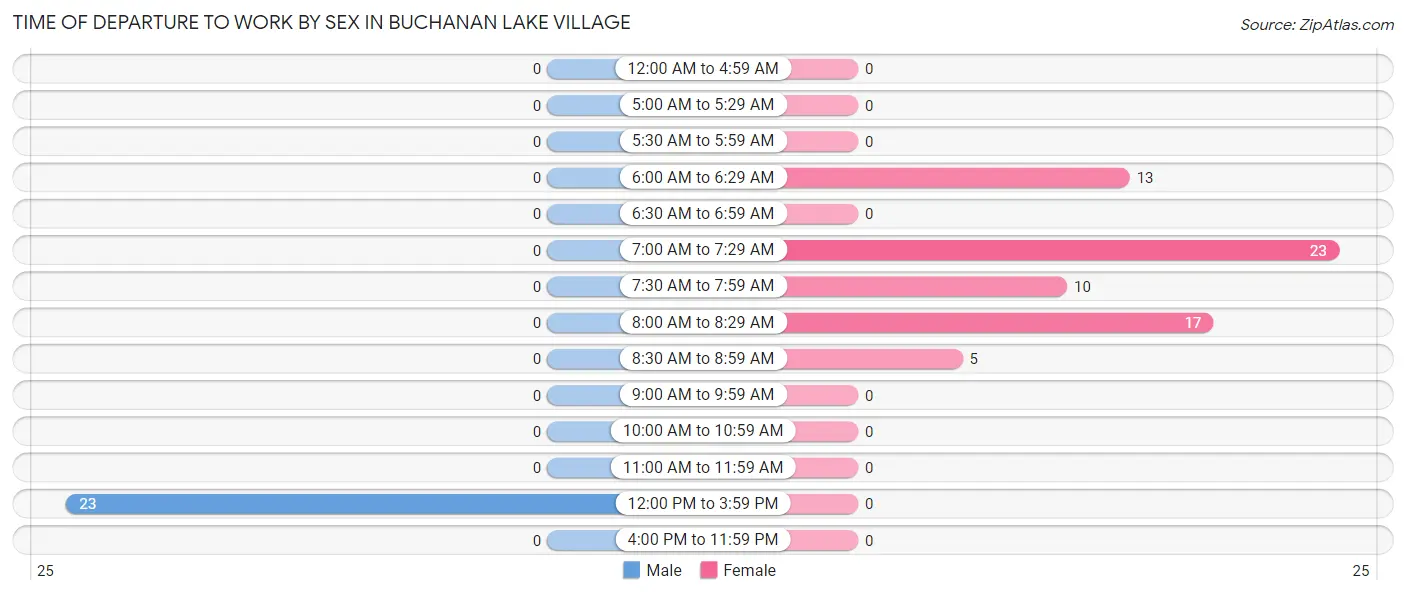
Time of Departure to Work by Sex in Buchanan Lake Village
The most frequent times of departure to work in Buchanan Lake Village are 12:00 PM to 3:59 PM (23, 100.0%) for males and 7:00 AM to 7:29 AM (23, 33.8%) for females.
| Time of Departure | Male | Female |
| 12:00 AM to 4:59 AM | 0 (0.0%) | 0 (0.0%) |
| 5:00 AM to 5:29 AM | 0 (0.0%) | 0 (0.0%) |
| 5:30 AM to 5:59 AM | 0 (0.0%) | 0 (0.0%) |
| 6:00 AM to 6:29 AM | 0 (0.0%) | 13 (19.1%) |
| 6:30 AM to 6:59 AM | 0 (0.0%) | 0 (0.0%) |
| 7:00 AM to 7:29 AM | 0 (0.0%) | 23 (33.8%) |
| 7:30 AM to 7:59 AM | 0 (0.0%) | 10 (14.7%) |
| 8:00 AM to 8:29 AM | 0 (0.0%) | 17 (25.0%) |
| 8:30 AM to 8:59 AM | 0 (0.0%) | 5 (7.3%) |
| 9:00 AM to 9:59 AM | 0 (0.0%) | 0 (0.0%) |
| 10:00 AM to 10:59 AM | 0 (0.0%) | 0 (0.0%) |
| 11:00 AM to 11:59 AM | 0 (0.0%) | 0 (0.0%) |
| 12:00 PM to 3:59 PM | 23 (100.0%) | 0 (0.0%) |
| 4:00 PM to 11:59 PM | 0 (0.0%) | 0 (0.0%) |
| Total | 23 (100.0%) | 68 (100.0%) |
Housing Occupancy in Buchanan Lake Village
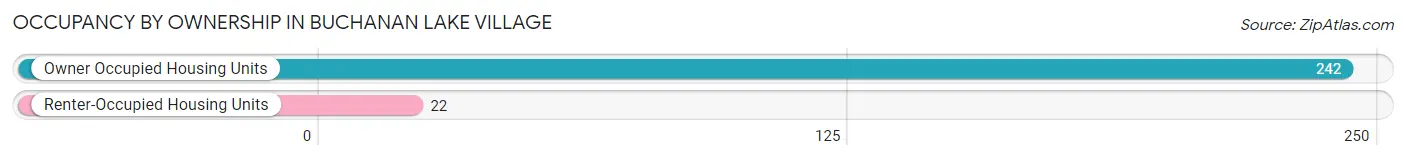
Occupancy by Ownership in Buchanan Lake Village
Of the total 264 dwellings in Buchanan Lake Village, owner-occupied units account for 242 (91.7%), while renter-occupied units make up 22 (8.3%).
| Occupancy | # Housing Units | % Housing Units |
| Owner Occupied Housing Units | 242 | 91.7% |
| Renter-Occupied Housing Units | 22 | 8.3% |
| Total Occupied Housing Units | 264 | 100.0% |
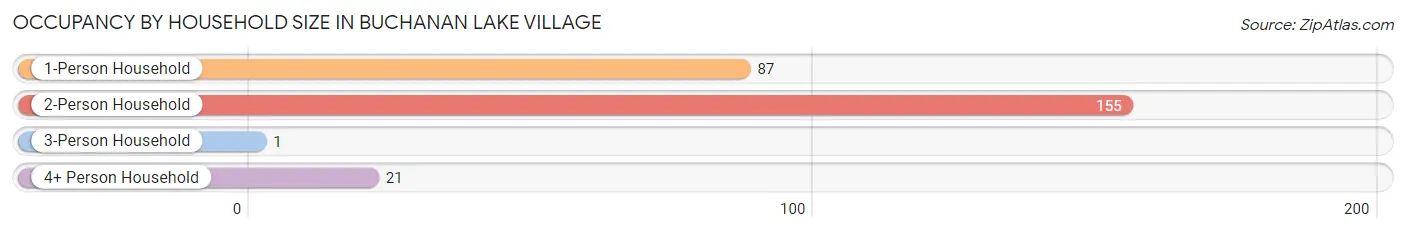
Occupancy by Household Size in Buchanan Lake Village
| Household Size | # Housing Units | % Housing Units |
| 1-Person Household | 87 | 33.0% |
| 2-Person Household | 155 | 58.7% |
| 3-Person Household | 1 | 0.4% |
| 4+ Person Household | 21 | 8.0% |
| Total Housing Units | 264 | 100.0% |
Occupancy by Ownership by Household Size in Buchanan Lake Village
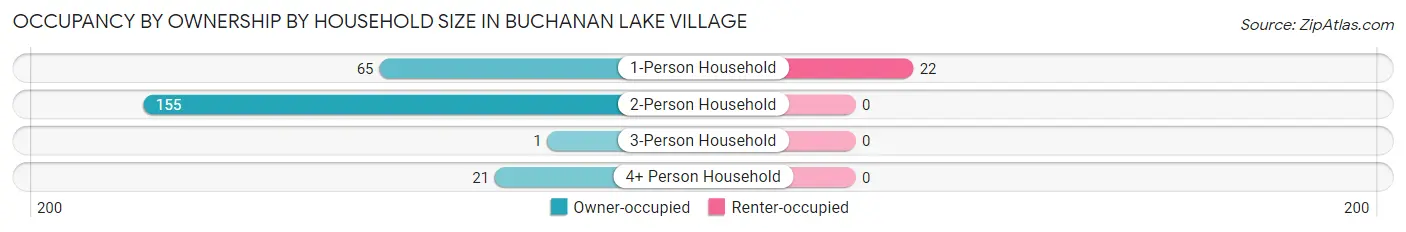
| Household Size | Owner-occupied | Renter-occupied |
| 1-Person Household | 65 (74.7%) | 22 (25.3%) |
| 2-Person Household | 155 (100.0%) | 0 (0.0%) |
| 3-Person Household | 1 (100.0%) | 0 (0.0%) |
| 4+ Person Household | 21 (100.0%) | 0 (0.0%) |
| Total Housing Units | 242 (91.7%) | 22 (8.3%) |
Occupancy by Educational Attainment in Buchanan Lake Village
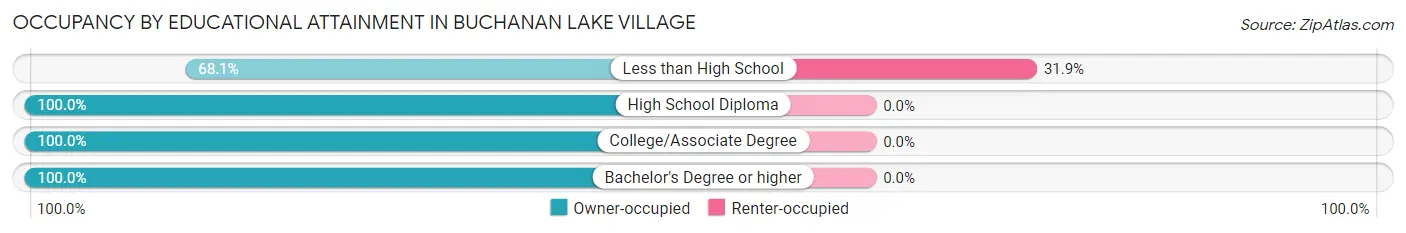
| Household Size | Owner-occupied | Renter-occupied |
| Less than High School | 47 (68.1%) | 22 (31.9%) |
| High School Diploma | 28 (100.0%) | 0 (0.0%) |
| College/Associate Degree | 128 (100.0%) | 0 (0.0%) |
| Bachelor's Degree or higher | 39 (100.0%) | 0 (0.0%) |
Occupancy by Age of Householder in Buchanan Lake Village
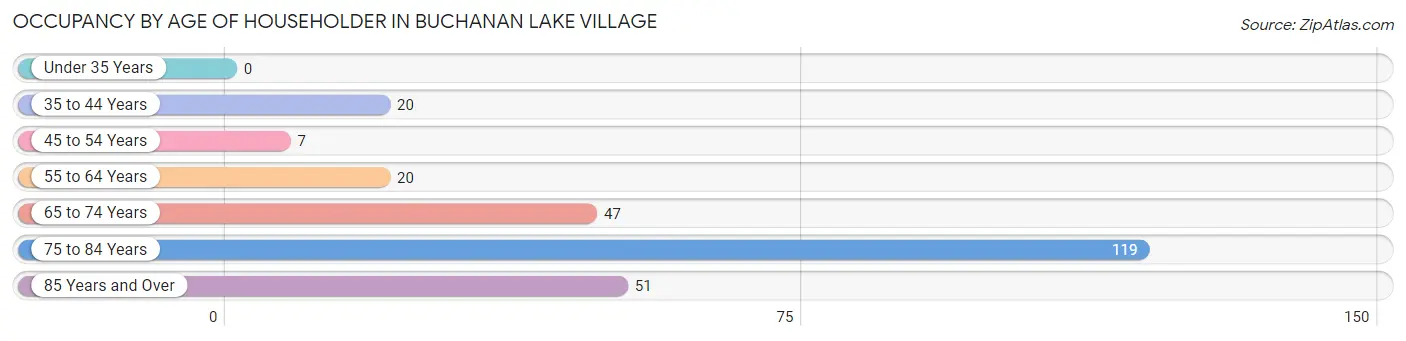
| Age Bracket | # Households | % Households |
| Under 35 Years | 0 | 0.0% |
| 35 to 44 Years | 20 | 7.6% |
| 45 to 54 Years | 7 | 2.6% |
| 55 to 64 Years | 20 | 7.6% |
| 65 to 74 Years | 47 | 17.8% |
| 75 to 84 Years | 119 | 45.1% |
| 85 Years and Over | 51 | 19.3% |
| Total | 264 | 100.0% |
Housing Finances in Buchanan Lake Village
Median Income by Occupancy in Buchanan Lake Village
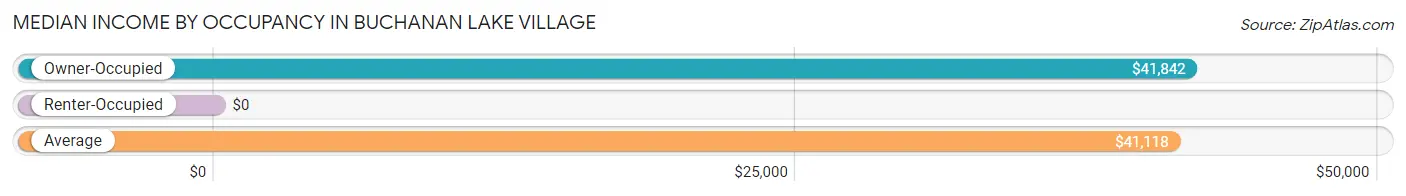
| Occupancy Type | # Households | Median Income |
| Owner-Occupied | 242 (91.7%) | $41,842 |
| Renter-Occupied | 22 (8.3%) | $0 |
| Average | 264 (100.0%) | $41,118 |
Occupancy by Householder Income Bracket in Buchanan Lake Village
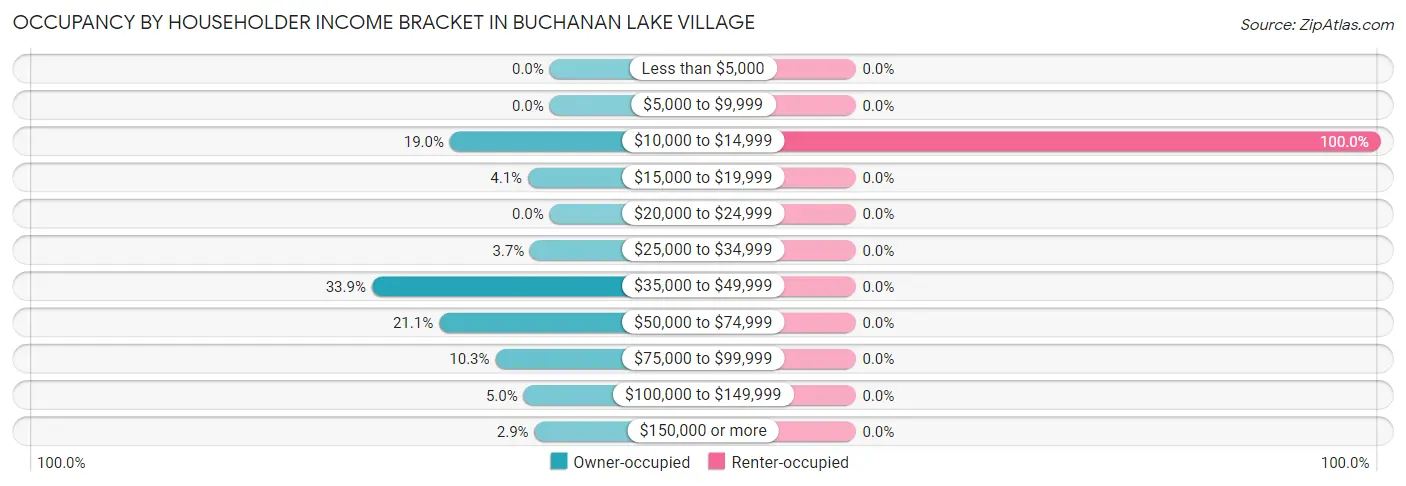
| Income Bracket | Owner-occupied | Renter-occupied |
| Less than $5,000 | 0 (0.0%) | 0 (0.0%) |
| $5,000 to $9,999 | 0 (0.0%) | 0 (0.0%) |
| $10,000 to $14,999 | 46 (19.0%) | 22 (100.0%) |
| $15,000 to $19,999 | 10 (4.1%) | 0 (0.0%) |
| $20,000 to $24,999 | 0 (0.0%) | 0 (0.0%) |
| $25,000 to $34,999 | 9 (3.7%) | 0 (0.0%) |
| $35,000 to $49,999 | 82 (33.9%) | 0 (0.0%) |
| $50,000 to $74,999 | 51 (21.1%) | 0 (0.0%) |
| $75,000 to $99,999 | 25 (10.3%) | 0 (0.0%) |
| $100,000 to $149,999 | 12 (5.0%) | 0 (0.0%) |
| $150,000 or more | 7 (2.9%) | 0 (0.0%) |
| Total | 242 (100.0%) | 22 (100.0%) |
Monthly Housing Cost Tiers in Buchanan Lake Village
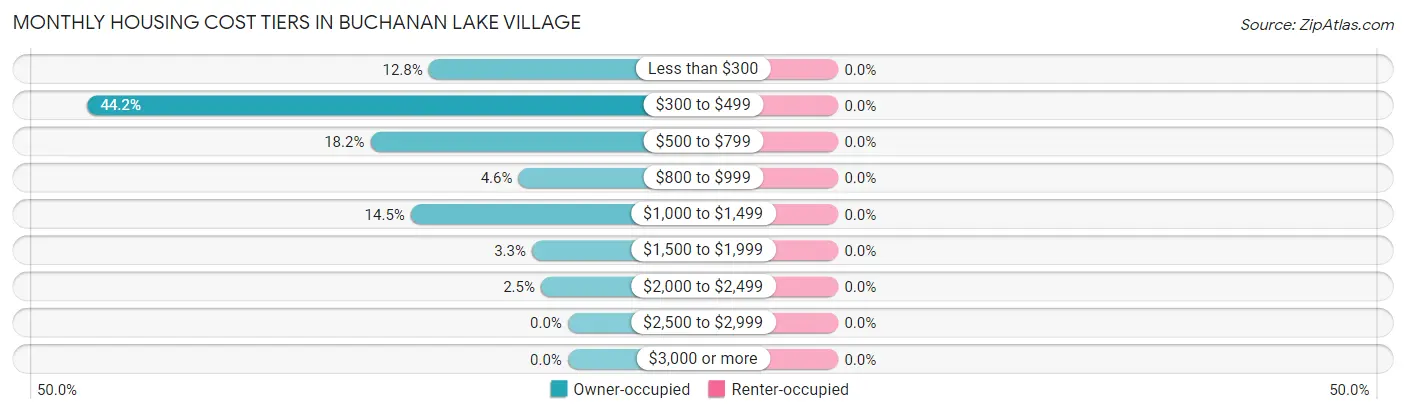
| Monthly Cost | Owner-occupied | Renter-occupied |
| Less than $300 | 31 (12.8%) | 0 (0.0%) |
| $300 to $499 | 107 (44.2%) | 0 (0.0%) |
| $500 to $799 | 44 (18.2%) | 0 (0.0%) |
| $800 to $999 | 11 (4.5%) | 0 (0.0%) |
| $1,000 to $1,499 | 35 (14.5%) | 0 (0.0%) |
| $1,500 to $1,999 | 8 (3.3%) | 0 (0.0%) |
| $2,000 to $2,499 | 6 (2.5%) | 0 (0.0%) |
| $2,500 to $2,999 | 0 (0.0%) | 0 (0.0%) |
| $3,000 or more | 0 (0.0%) | 0 (0.0%) |
| Total | 242 (100.0%) | 22 (100.0%) |
Physical Housing Characteristics in Buchanan Lake Village
Housing Structures in Buchanan Lake Village
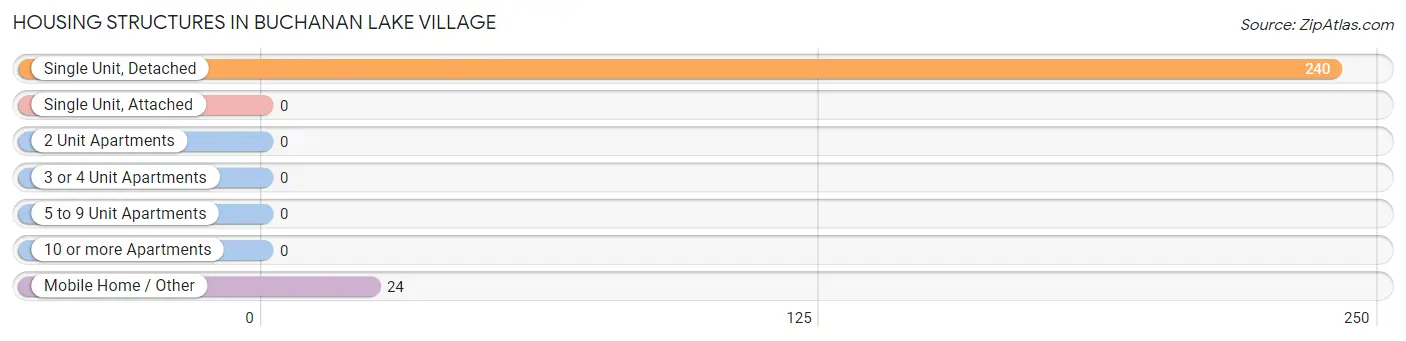
| Structure Type | # Housing Units | % Housing Units |
| Single Unit, Detached | 240 | 90.9% |
| Single Unit, Attached | 0 | 0.0% |
| 2 Unit Apartments | 0 | 0.0% |
| 3 or 4 Unit Apartments | 0 | 0.0% |
| 5 to 9 Unit Apartments | 0 | 0.0% |
| 10 or more Apartments | 0 | 0.0% |
| Mobile Home / Other | 24 | 9.1% |
| Total | 264 | 100.0% |
Housing Structures by Occupancy in Buchanan Lake Village
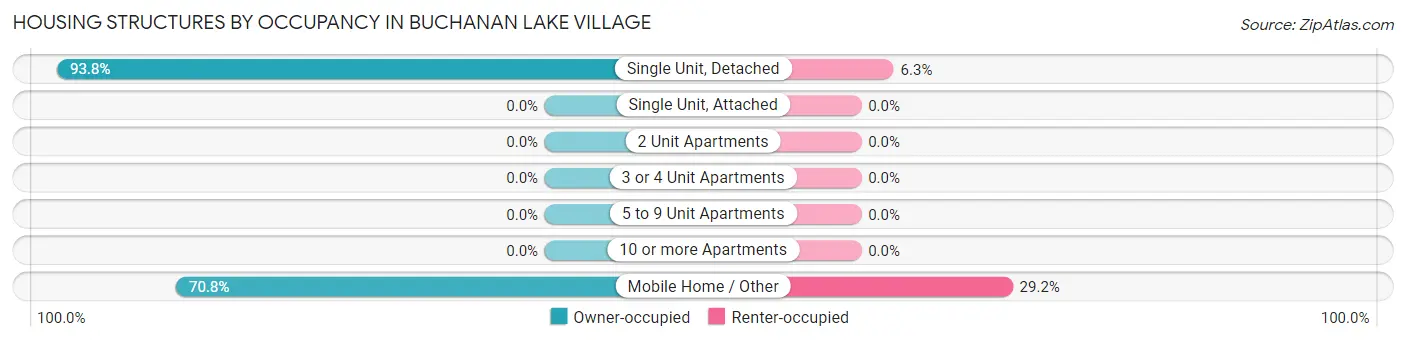
| Structure Type | Owner-occupied | Renter-occupied |
| Single Unit, Detached | 225 (93.8%) | 15 (6.2%) |
| Single Unit, Attached | 0 (0.0%) | 0 (0.0%) |
| 2 Unit Apartments | 0 (0.0%) | 0 (0.0%) |
| 3 or 4 Unit Apartments | 0 (0.0%) | 0 (0.0%) |
| 5 to 9 Unit Apartments | 0 (0.0%) | 0 (0.0%) |
| 10 or more Apartments | 0 (0.0%) | 0 (0.0%) |
| Mobile Home / Other | 17 (70.8%) | 7 (29.2%) |
| Total | 242 (91.7%) | 22 (8.3%) |
Housing Structures by Number of Rooms in Buchanan Lake Village
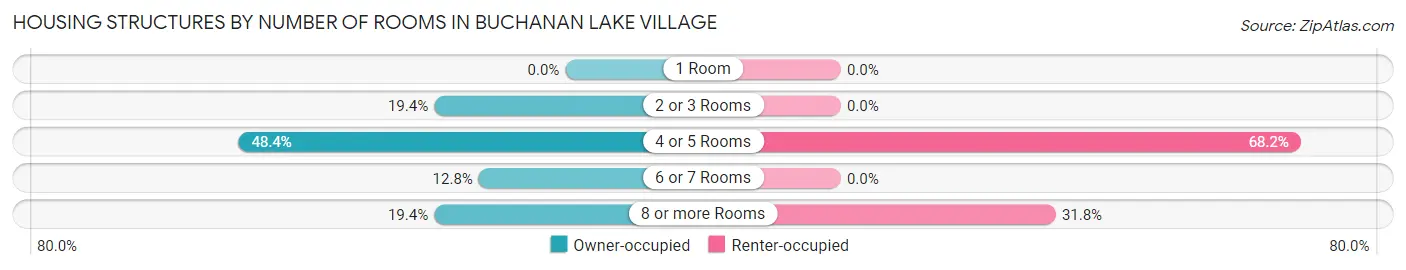
| Number of Rooms | Owner-occupied | Renter-occupied |
| 1 Room | 0 (0.0%) | 0 (0.0%) |
| 2 or 3 Rooms | 47 (19.4%) | 0 (0.0%) |
| 4 or 5 Rooms | 117 (48.3%) | 15 (68.2%) |
| 6 or 7 Rooms | 31 (12.8%) | 0 (0.0%) |
| 8 or more Rooms | 47 (19.4%) | 7 (31.8%) |
| Total | 242 (100.0%) | 22 (100.0%) |
Housing Structure by Heating Type in Buchanan Lake Village
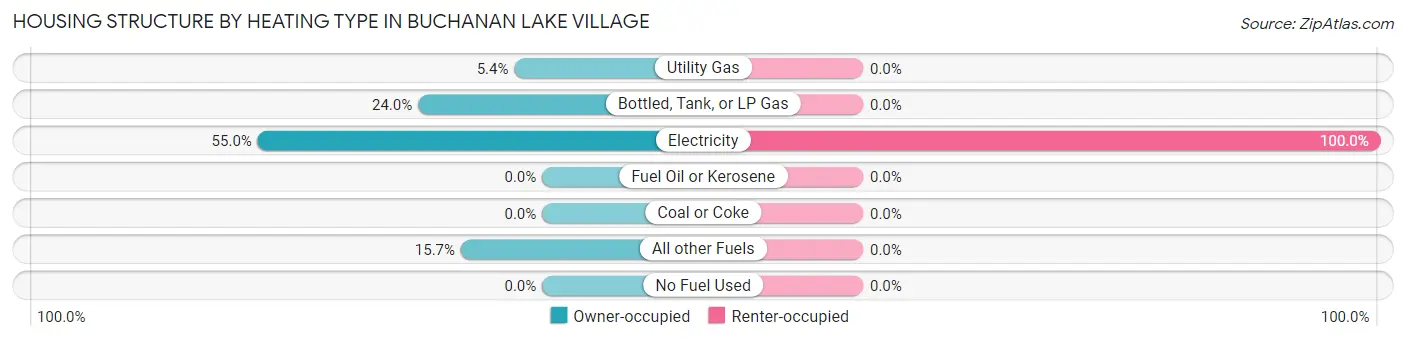
| Heating Type | Owner-occupied | Renter-occupied |
| Utility Gas | 13 (5.4%) | 0 (0.0%) |
| Bottled, Tank, or LP Gas | 58 (24.0%) | 0 (0.0%) |
| Electricity | 133 (55.0%) | 22 (100.0%) |
| Fuel Oil or Kerosene | 0 (0.0%) | 0 (0.0%) |
| Coal or Coke | 0 (0.0%) | 0 (0.0%) |
| All other Fuels | 38 (15.7%) | 0 (0.0%) |
| No Fuel Used | 0 (0.0%) | 0 (0.0%) |
| Total | 242 (100.0%) | 22 (100.0%) |
Household Vehicle Usage in Buchanan Lake Village
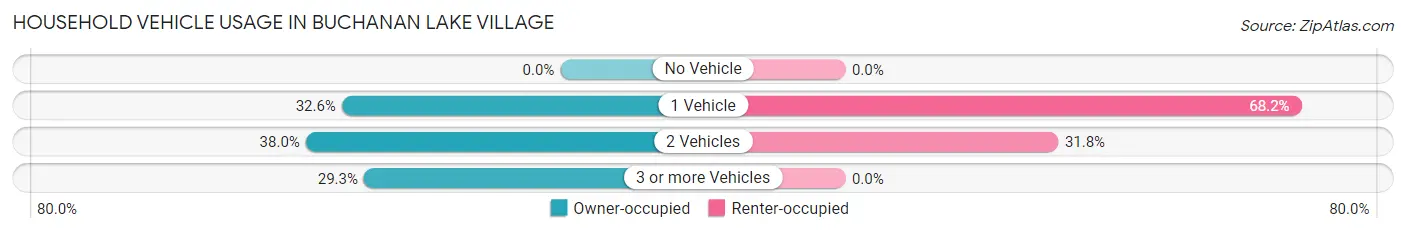
| Vehicles per Household | Owner-occupied | Renter-occupied |
| No Vehicle | 0 (0.0%) | 0 (0.0%) |
| 1 Vehicle | 79 (32.6%) | 15 (68.2%) |
| 2 Vehicles | 92 (38.0%) | 7 (31.8%) |
| 3 or more Vehicles | 71 (29.3%) | 0 (0.0%) |
| Total | 242 (100.0%) | 22 (100.0%) |
Real Estate & Mortgages in Buchanan Lake Village
Real Estate and Mortgage Overview in Buchanan Lake Village
| Characteristic | Without Mortgage | With Mortgage |
| Housing Units | 172 | 70 |
| Median Property Value | $173,100 | $177,900 |
| Median Household Income | $40,197 | $7 |
| Monthly Housing Costs | $410 | $0 |
| Real Estate Taxes | - | - |
Property Value by Mortgage Status in Buchanan Lake Village
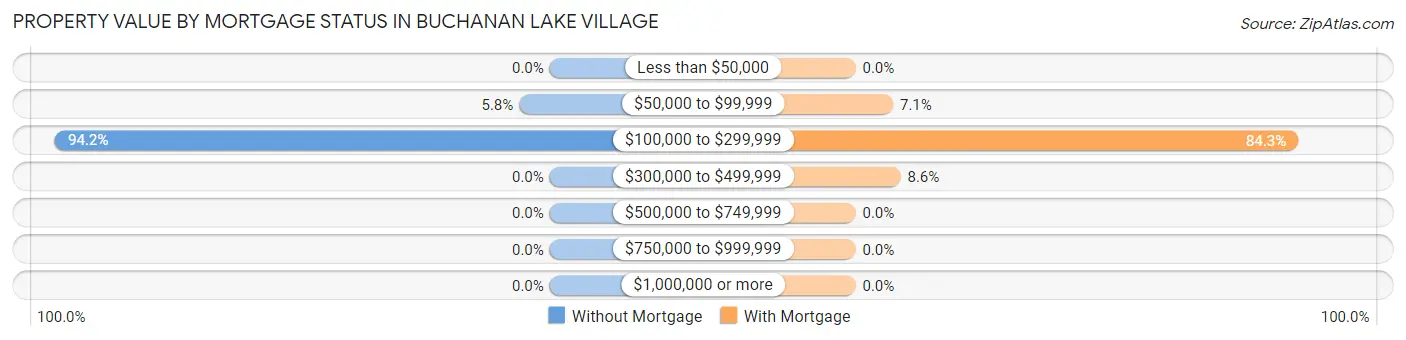
| Property Value | Without Mortgage | With Mortgage |
| Less than $50,000 | 0 (0.0%) | 0 (0.0%) |
| $50,000 to $99,999 | 10 (5.8%) | 5 (7.1%) |
| $100,000 to $299,999 | 162 (94.2%) | 59 (84.3%) |
| $300,000 to $499,999 | 0 (0.0%) | 6 (8.6%) |
| $500,000 to $749,999 | 0 (0.0%) | 0 (0.0%) |
| $750,000 to $999,999 | 0 (0.0%) | 0 (0.0%) |
| $1,000,000 or more | 0 (0.0%) | 0 (0.0%) |
| Total | 172 (100.0%) | 70 (100.0%) |
Household Income by Mortgage Status in Buchanan Lake Village
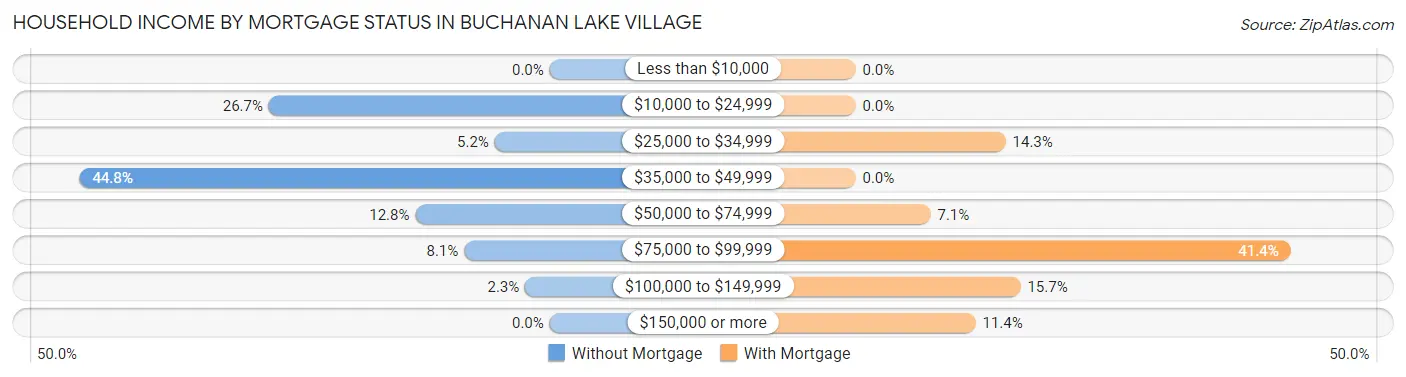
| Household Income | Without Mortgage | With Mortgage |
| Less than $10,000 | 0 (0.0%) | 0 (0.0%) |
| $10,000 to $24,999 | 46 (26.7%) | 0 (0.0%) |
| $25,000 to $34,999 | 9 (5.2%) | 10 (14.3%) |
| $35,000 to $49,999 | 77 (44.8%) | 0 (0.0%) |
| $50,000 to $74,999 | 22 (12.8%) | 5 (7.1%) |
| $75,000 to $99,999 | 14 (8.1%) | 29 (41.4%) |
| $100,000 to $149,999 | 4 (2.3%) | 11 (15.7%) |
| $150,000 or more | 0 (0.0%) | 8 (11.4%) |
| Total | 172 (100.0%) | 70 (100.0%) |
Property Value to Household Income Ratio in Buchanan Lake Village
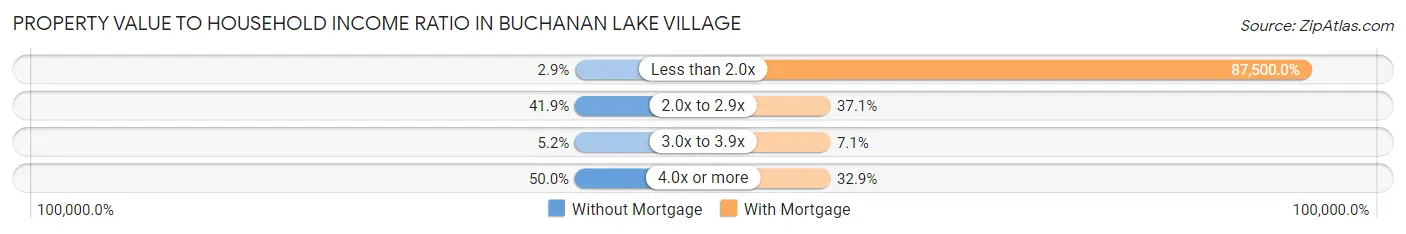
| Value-to-Income Ratio | Without Mortgage | With Mortgage |
| Less than 2.0x | 5 (2.9%) | 61,250 (87,500.0%) |
| 2.0x to 2.9x | 72 (41.9%) | 26 (37.1%) |
| 3.0x to 3.9x | 9 (5.2%) | 5 (7.1%) |
| 4.0x or more | 86 (50.0%) | 23 (32.9%) |
| Total | 172 (100.0%) | 70 (100.0%) |
Real Estate Taxes by Mortgage Status in Buchanan Lake Village
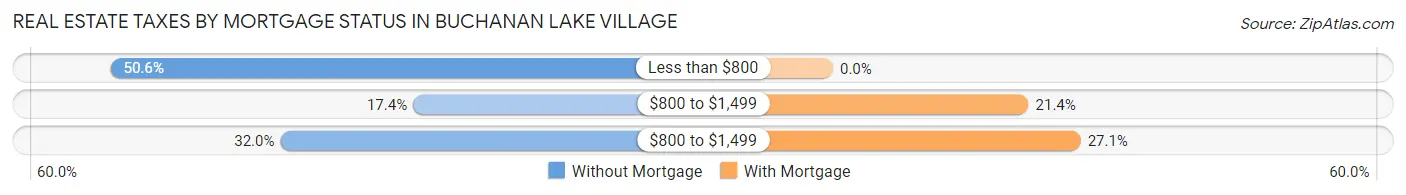
| Property Taxes | Without Mortgage | With Mortgage |
| Less than $800 | 87 (50.6%) | 0 (0.0%) |
| $800 to $1,499 | 30 (17.4%) | 15 (21.4%) |
| $800 to $1,499 | 55 (32.0%) | 19 (27.1%) |
| Total | 172 (100.0%) | 70 (100.0%) |
Health & Disability in Buchanan Lake Village
Health Insurance Coverage by Age in Buchanan Lake Village
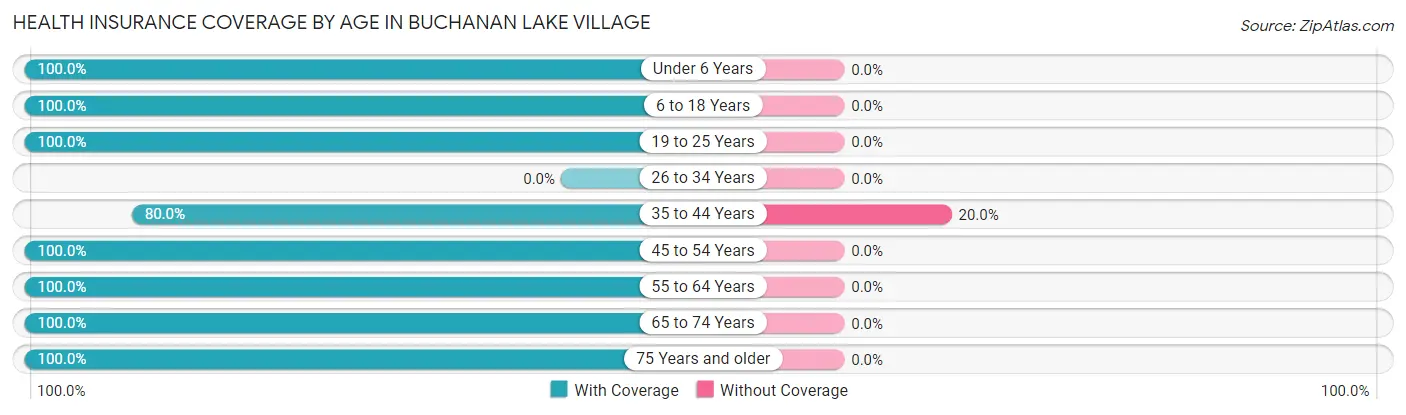
| Age Bracket | With Coverage | Without Coverage |
| Under 6 Years | 18 (100.0%) | 0 (0.0%) |
| 6 to 18 Years | 52 (100.0%) | 0 (0.0%) |
| 19 to 25 Years | 12 (100.0%) | 0 (0.0%) |
| 26 to 34 Years | 0 (0.0%) | 0 (0.0%) |
| 35 to 44 Years | 28 (80.0%) | 7 (20.0%) |
| 45 to 54 Years | 35 (100.0%) | 0 (0.0%) |
| 55 to 64 Years | 110 (100.0%) | 0 (0.0%) |
| 65 to 74 Years | 92 (100.0%) | 0 (0.0%) |
| 75 Years and older | 178 (100.0%) | 0 (0.0%) |
| Total | 525 (98.7%) | 7 (1.3%) |
Health Insurance Coverage by Citizenship Status in Buchanan Lake Village
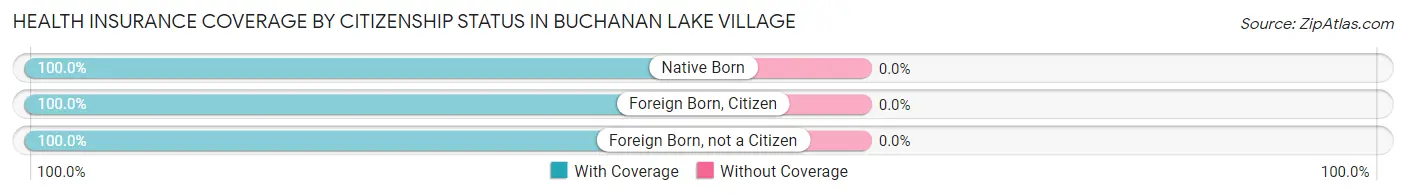
| Citizenship Status | With Coverage | Without Coverage |
| Native Born | 18 (100.0%) | 0 (0.0%) |
| Foreign Born, Citizen | 52 (100.0%) | 0 (0.0%) |
| Foreign Born, not a Citizen | 12 (100.0%) | 0 (0.0%) |
Health Insurance Coverage by Household Income in Buchanan Lake Village
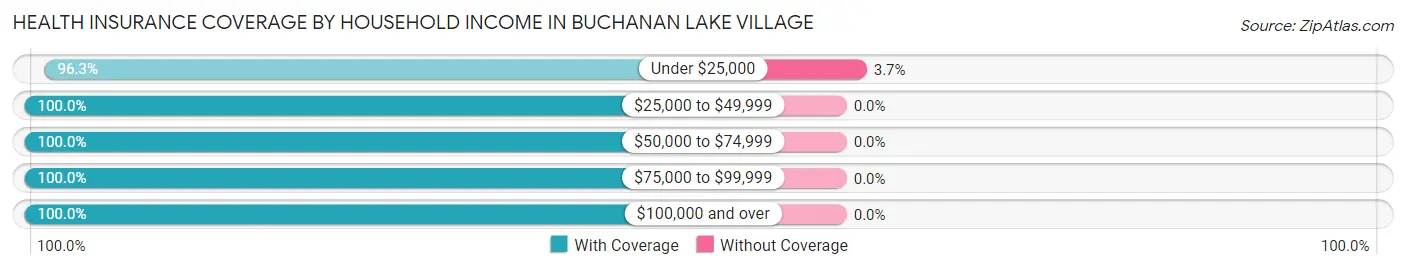
| Household Income | With Coverage | Without Coverage |
| Under $25,000 | 180 (96.3%) | 7 (3.7%) |
| $25,000 to $49,999 | 136 (100.0%) | 0 (0.0%) |
| $50,000 to $74,999 | 91 (100.0%) | 0 (0.0%) |
| $75,000 to $99,999 | 46 (100.0%) | 0 (0.0%) |
| $100,000 and over | 72 (100.0%) | 0 (0.0%) |
Public vs Private Health Insurance Coverage by Age in Buchanan Lake Village
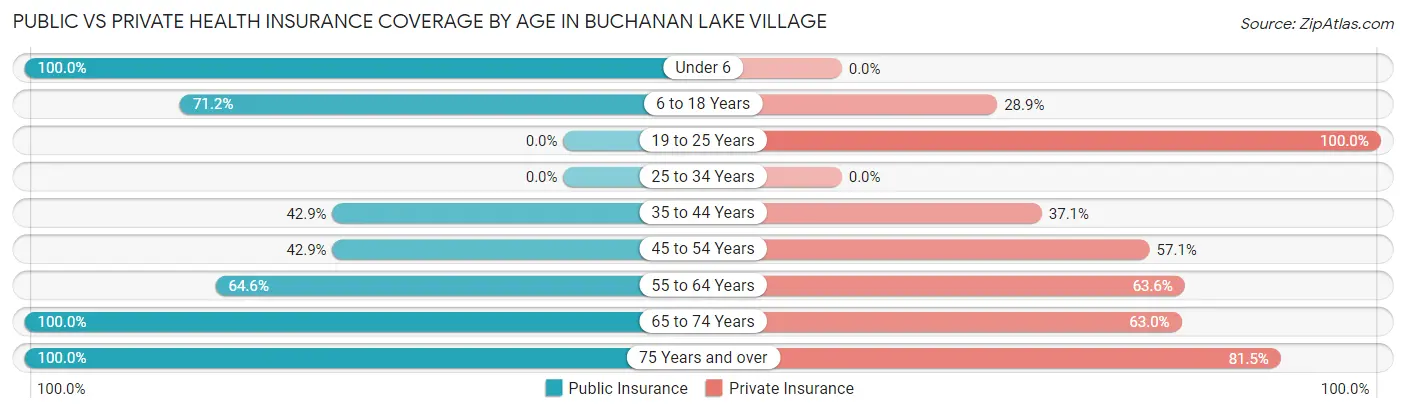
| Age Bracket | Public Insurance | Private Insurance |
| Under 6 | 18 (100.0%) | 0 (0.0%) |
| 6 to 18 Years | 37 (71.2%) | 15 (28.8%) |
| 19 to 25 Years | 0 (0.0%) | 12 (100.0%) |
| 25 to 34 Years | 0 (0.0%) | 0 (0.0%) |
| 35 to 44 Years | 15 (42.9%) | 13 (37.1%) |
| 45 to 54 Years | 15 (42.9%) | 20 (57.1%) |
| 55 to 64 Years | 71 (64.5%) | 70 (63.6%) |
| 65 to 74 Years | 92 (100.0%) | 58 (63.0%) |
| 75 Years and over | 178 (100.0%) | 145 (81.5%) |
| Total | 426 (80.1%) | 333 (62.6%) |
Disability Status by Sex by Age in Buchanan Lake Village
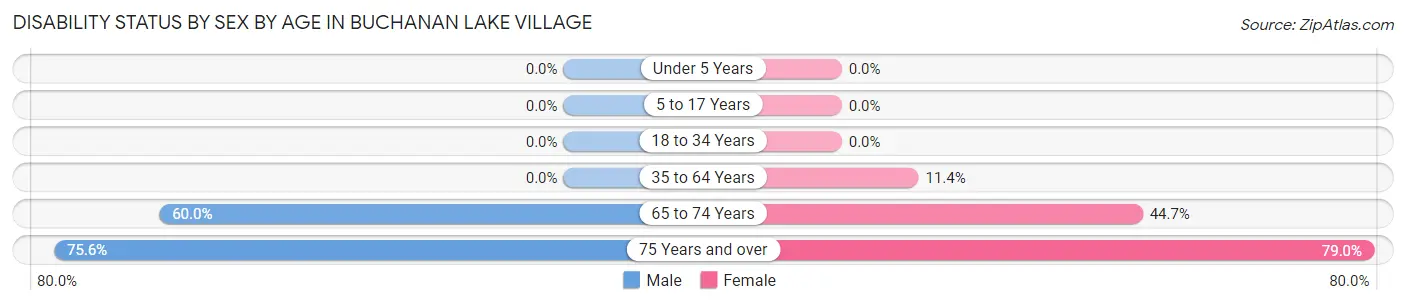
| Age Bracket | Male | Female |
| Under 5 Years | 0 (0.0%) | 0 (0.0%) |
| 5 to 17 Years | 0 (0.0%) | 0 (0.0%) |
| 18 to 34 Years | 0 (0.0%) | 0 (0.0%) |
| 35 to 64 Years | 0 (0.0%) | 13 (11.4%) |
| 65 to 74 Years | 27 (60.0%) | 21 (44.7%) |
| 75 Years and over | 59 (75.6%) | 79 (79.0%) |
Disability Class by Sex by Age in Buchanan Lake Village
Disability Class: Hearing Difficulty
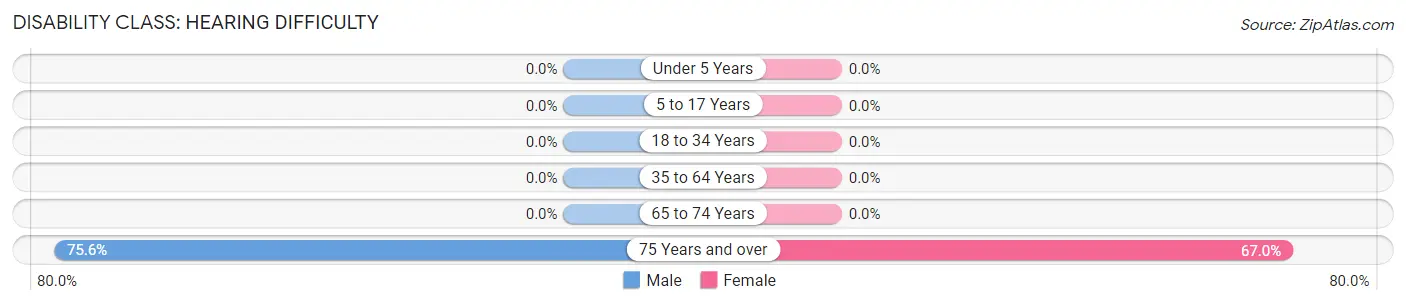
| Age Bracket | Male | Female |
| Under 5 Years | 0 (0.0%) | 0 (0.0%) |
| 5 to 17 Years | 0 (0.0%) | 0 (0.0%) |
| 18 to 34 Years | 0 (0.0%) | 0 (0.0%) |
| 35 to 64 Years | 0 (0.0%) | 0 (0.0%) |
| 65 to 74 Years | 0 (0.0%) | 0 (0.0%) |
| 75 Years and over | 59 (75.6%) | 67 (67.0%) |
Disability Class: Vision Difficulty
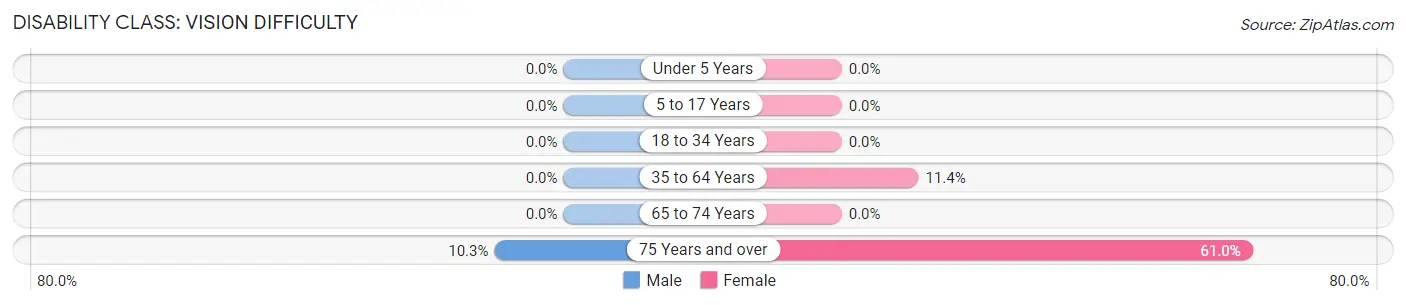
| Age Bracket | Male | Female |
| Under 5 Years | 0 (0.0%) | 0 (0.0%) |
| 5 to 17 Years | 0 (0.0%) | 0 (0.0%) |
| 18 to 34 Years | 0 (0.0%) | 0 (0.0%) |
| 35 to 64 Years | 0 (0.0%) | 13 (11.4%) |
| 65 to 74 Years | 0 (0.0%) | 0 (0.0%) |
| 75 Years and over | 8 (10.3%) | 61 (61.0%) |
Disability Class: Cognitive Difficulty
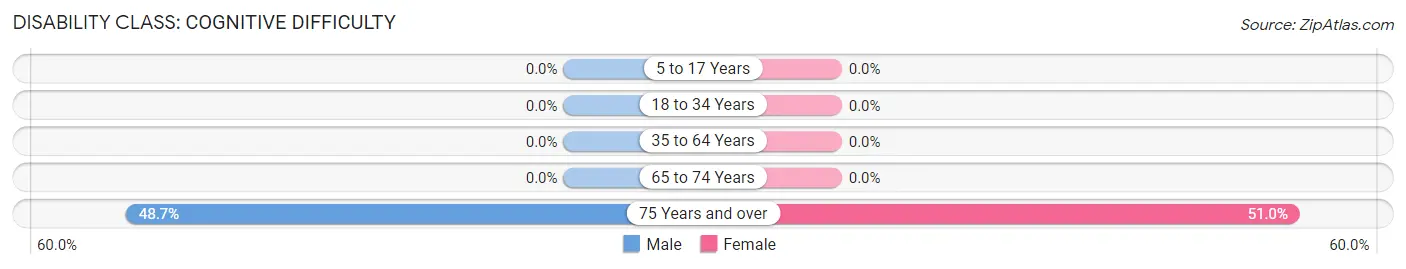
| Age Bracket | Male | Female |
| 5 to 17 Years | 0 (0.0%) | 0 (0.0%) |
| 18 to 34 Years | 0 (0.0%) | 0 (0.0%) |
| 35 to 64 Years | 0 (0.0%) | 0 (0.0%) |
| 65 to 74 Years | 0 (0.0%) | 0 (0.0%) |
| 75 Years and over | 38 (48.7%) | 51 (51.0%) |
Disability Class: Ambulatory Difficulty
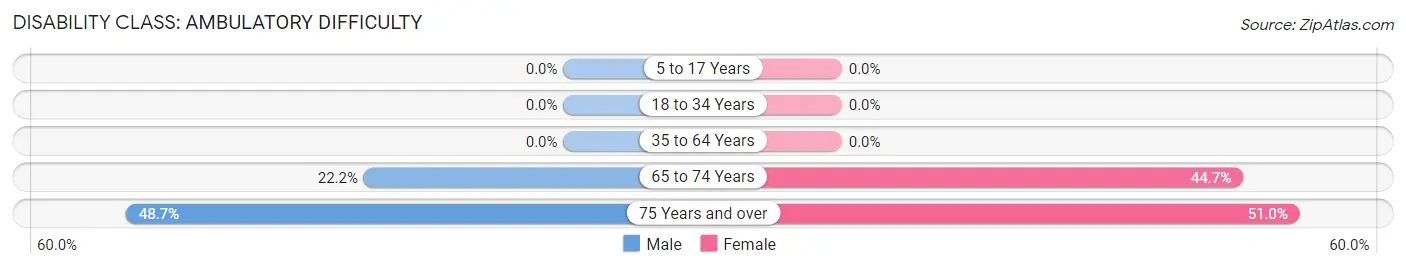
| Age Bracket | Male | Female |
| 5 to 17 Years | 0 (0.0%) | 0 (0.0%) |
| 18 to 34 Years | 0 (0.0%) | 0 (0.0%) |
| 35 to 64 Years | 0 (0.0%) | 0 (0.0%) |
| 65 to 74 Years | 10 (22.2%) | 21 (44.7%) |
| 75 Years and over | 38 (48.7%) | 51 (51.0%) |
Disability Class: Self-Care Difficulty
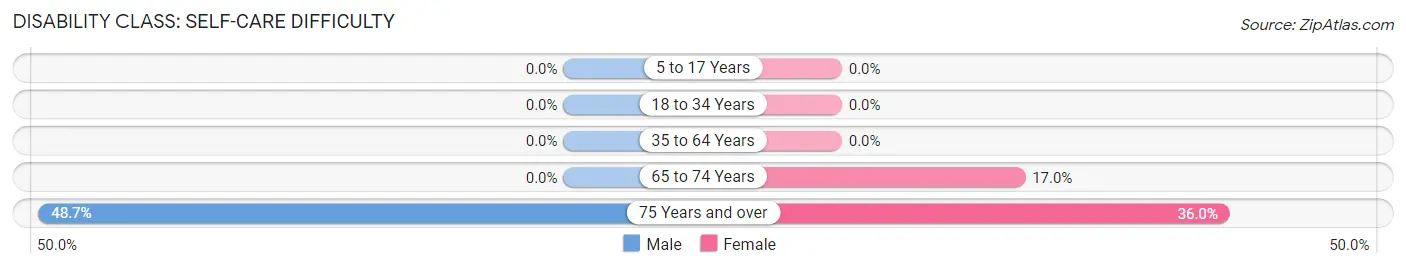
| Age Bracket | Male | Female |
| 5 to 17 Years | 0 (0.0%) | 0 (0.0%) |
| 18 to 34 Years | 0 (0.0%) | 0 (0.0%) |
| 35 to 64 Years | 0 (0.0%) | 0 (0.0%) |
| 65 to 74 Years | 0 (0.0%) | 8 (17.0%) |
| 75 Years and over | 38 (48.7%) | 36 (36.0%) |
Technology Access in Buchanan Lake Village
Computing Device Access in Buchanan Lake Village
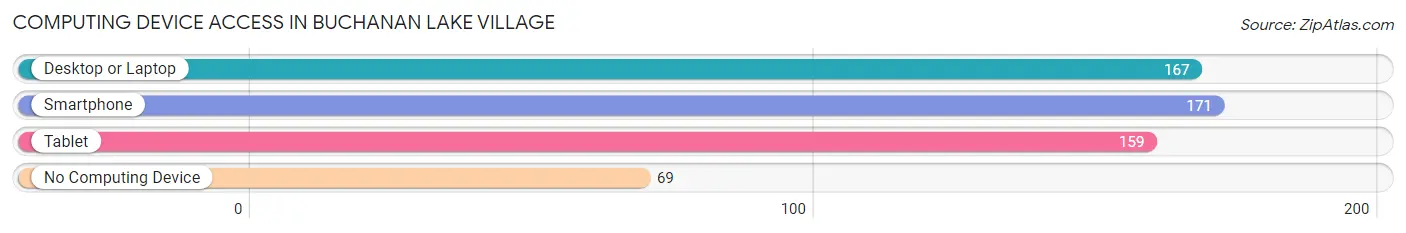
| Device Type | # Households | % Households |
| Desktop or Laptop | 167 | 63.3% |
| Smartphone | 171 | 64.8% |
| Tablet | 159 | 60.2% |
| No Computing Device | 69 | 26.1% |
| Total | 264 | 100.0% |
Internet Access in Buchanan Lake Village
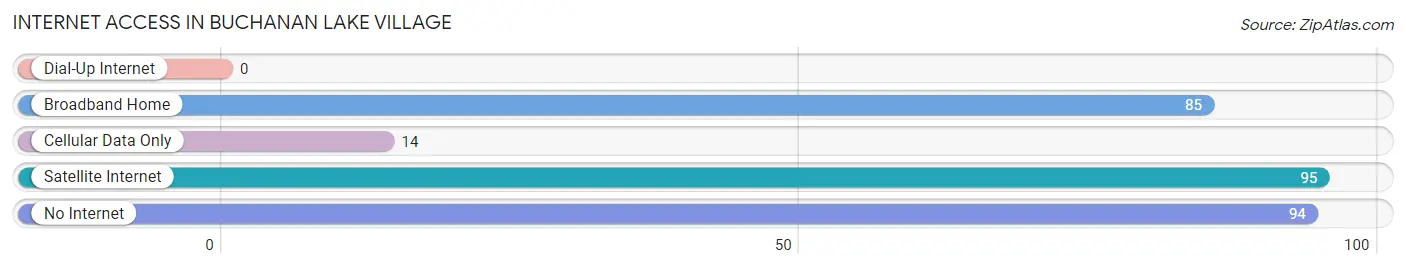
| Internet Type | # Households | % Households |
| Dial-Up Internet | 0 | 0.0% |
| Broadband Home | 85 | 32.2% |
| Cellular Data Only | 14 | 5.3% |
| Satellite Internet | 95 | 36.0% |
| No Internet | 94 | 35.6% |
| Total | 264 | 100.0% |
Buchanan Lake Village Summary
Buchanan Lake Village is a small town located in Burnet County, Texas. It is situated on the shores of Lake Buchanan, a reservoir created by the construction of the Buchanan Dam in 1937. The town was founded in the late 1940s and has a population of approximately 500 people.
History
The area around Buchanan Lake Village was first settled in the late 1800s by ranchers and farmers. The town was officially established in the late 1940s when the Buchanan Dam was completed. The dam was built to provide hydroelectric power to the area and to create a recreational lake. The town was named after the lake and was originally known as Buchanan Lake.
The town grew slowly over the years and by the 1970s had a population of around 500 people. The town was incorporated in the early 1980s and the name was changed to Buchanan Lake Village.
Geography
Buchanan Lake Village is located in Burnet County, Texas. It is situated on the shores of Lake Buchanan, a reservoir created by the construction of the Buchanan Dam in 1937. The town is located about 25 miles northwest of Austin and about 50 miles northeast of San Antonio.
The town is surrounded by rolling hills and is home to several parks and recreational areas. The lake is a popular destination for fishing, boating, and swimming.
Economy
The economy of Buchanan Lake Village is largely based on tourism and recreation. The town is home to several marinas, campgrounds, and resorts. The lake is a popular destination for fishing, boating, and swimming.
The town is also home to several small businesses, including restaurants, convenience stores, and gas stations. The town is also home to a few small manufacturing companies.
Demographics
As of the 2010 census, the population of Buchanan Lake Village was 498. The racial makeup of the town was 97.2% White, 0.2% African American, 0.4% Native American, 0.2% Asian, 0.2% from other races, and 1.9% from two or more races. Hispanic or Latino of any race were 2.2% of the population.
The median income for a household in the town was $37,500, and the median income for a family was $41,250. The per capita income for the town was $17,845. About 11.2% of families and 13.2% of the population were below the poverty line, including 16.7% of those under age 18 and none of those age 65 or over.
Common Questions
What is Per Capita Income in Buchanan Lake Village?
Per Capita income in Buchanan Lake Village is $24,535.
What is the Median Family Income in Buchanan Lake Village?
Median Family Income in Buchanan Lake Village is $42,204.
What is the Median Household income in Buchanan Lake Village?
Median Household Income in Buchanan Lake Village is $41,118.
What is Inequality or Gini Index in Buchanan Lake Village?
Inequality or Gini Index in Buchanan Lake Village is 0.36.
What is the Total Population of Buchanan Lake Village?
Total Population of Buchanan Lake Village is 532.
What is the Total Male Population of Buchanan Lake Village?
Total Male Population of Buchanan Lake Village is 247.
What is the Total Female Population of Buchanan Lake Village?
Total Female Population of Buchanan Lake Village is 285.
What is the Ratio of Males per 100 Females in Buchanan Lake Village?
There are 86.67 Males per 100 Females in Buchanan Lake Village.
What is the Ratio of Females per 100 Males in Buchanan Lake Village?
There are 115.38 Females per 100 Males in Buchanan Lake Village.
What is the Median Population Age in Buchanan Lake Village?
Median Population Age in Buchanan Lake Village is 66.7 Years.
What is the Average Family Size in Buchanan Lake Village
Average Family Size in Buchanan Lake Village is 2.4 People.
What is the Average Household Size in Buchanan Lake Village
Average Household Size in Buchanan Lake Village is 2.0 People.
How Large is the Labor Force in Buchanan Lake Village?
There are 143 People in the Labor Forcein in Buchanan Lake Village.
What is the Percentage of People in the Labor Force in Buchanan Lake Village?
31.0% of People are in the Labor Force in Buchanan Lake Village.
What is the Unemployment Rate in Buchanan Lake Village?
Unemployment Rate in Buchanan Lake Village is 13.3%.