Bailey s Prairie, TX Map & Demographics
Bailey s Prairie Map
Bailey s Prairie Overview
$51,316
PER CAPITA INCOME
$104,922
AVG FAMILY INCOME
$95,750
AVG HOUSEHOLD INCOME
41.2%
WAGE / INCOME GAP [ % ]
58.8¢/ $1
WAGE / INCOME GAP [ $ ]
0.50
INEQUALITY / GINI INDEX
763
TOTAL POPULATION
414
MALE POPULATION
349
FEMALE POPULATION
118.62
MALES / 100 FEMALES
84.30
FEMALES / 100 MALES
51.8
MEDIAN AGE
2.8
AVG FAMILY SIZE
2.5
AVG HOUSEHOLD SIZE
322
LABOR FORCE [ PEOPLE ]
47.3%
PERCENT IN LABOR FORCE
0.6%
UNEMPLOYMENT RATE
Income in Bailey s Prairie
Income Overview in Bailey s Prairie
Per Capita Income in Bailey s Prairie is $51,316, while median incomes of families and households are $104,922 and $95,750 respectively.
| Characteristic | Number | Measure |
| Per Capita Income | 763 | $51,316 |
| Median Family Income | 235 | $104,922 |
| Mean Family Income | 235 | $143,846 |
| Median Household Income | 300 | $95,750 |
| Mean Household Income | 300 | $131,166 |
| Income Deficit | 235 | $0 |
| Wage / Income Gap (%) | 763 | 41.25% |
| Wage / Income Gap ($) | 763 | 58.75¢ per $1 |
| Gini / Inequality Index | 763 | 0.50 |
Earnings by Sex in Bailey s Prairie
Average Earnings in Bailey s Prairie are $67,500, $77,232 for men and $45,375 for women, a difference of 41.2%.
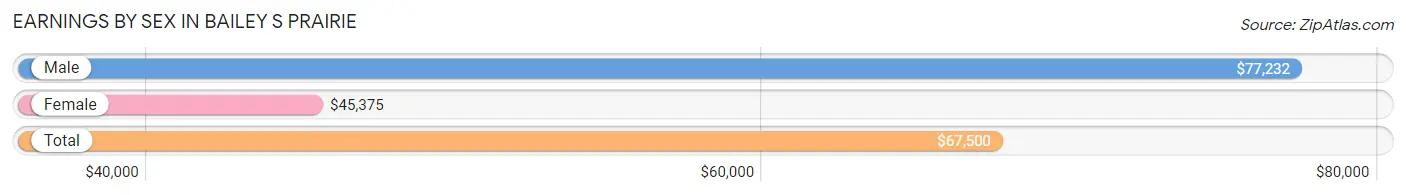
| Sex | Number | Average Earnings |
| Male | 201 (59.5%) | $77,232 |
| Female | 137 (40.5%) | $45,375 |
| Total | 338 (100.0%) | $67,500 |
Earnings by Sex by Income Bracket in Bailey s Prairie
The most common earnings brackets in Bailey s Prairie are $100,000+ for men (76 | 37.8%) and $75,000 to $99,999 for women (23 | 16.8%).
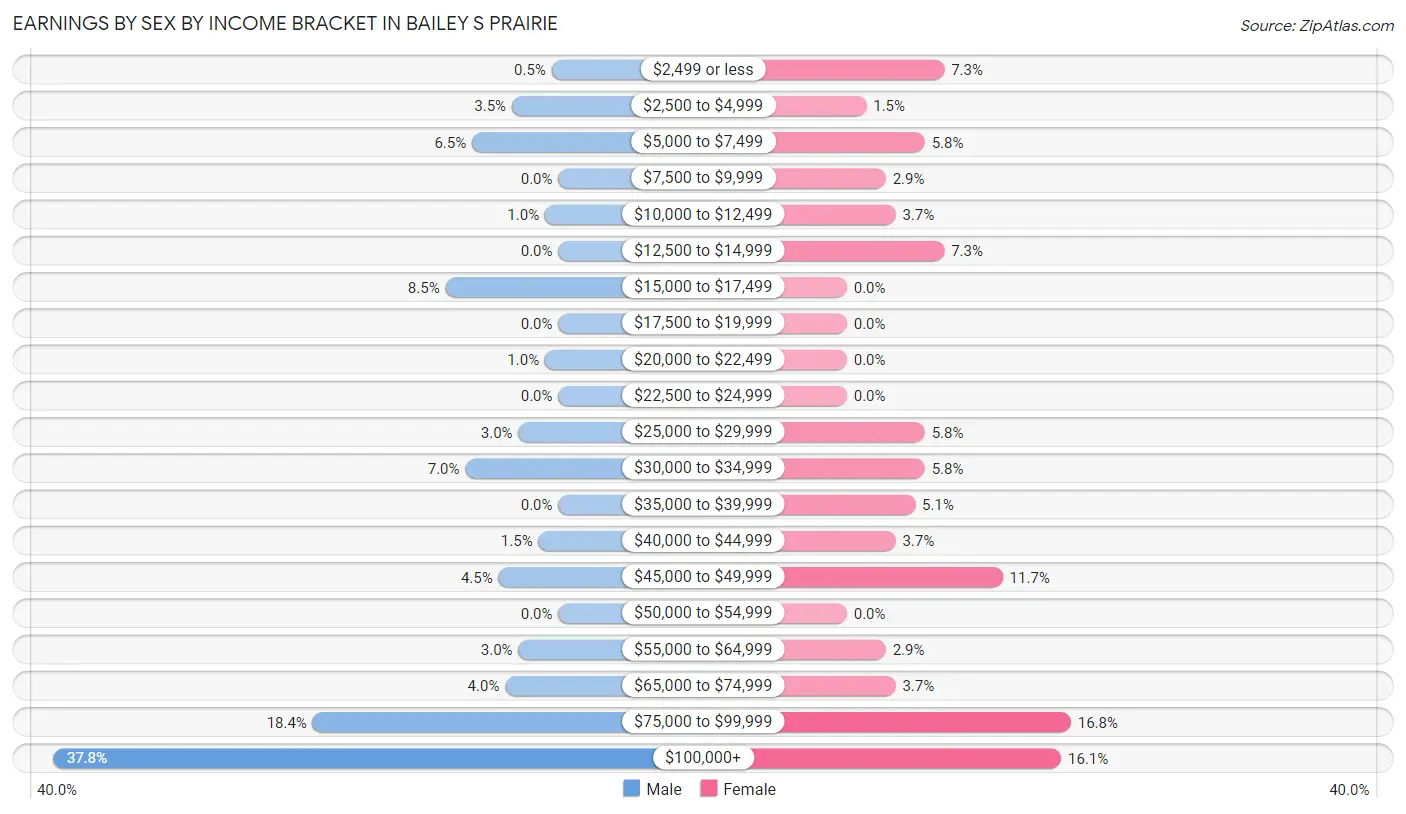
| Income | Male | Female |
| $2,499 or less | 1 (0.5%) | 10 (7.3%) |
| $2,500 to $4,999 | 7 (3.5%) | 2 (1.5%) |
| $5,000 to $7,499 | 13 (6.5%) | 8 (5.8%) |
| $7,500 to $9,999 | 0 (0.0%) | 4 (2.9%) |
| $10,000 to $12,499 | 2 (1.0%) | 5 (3.6%) |
| $12,500 to $14,999 | 0 (0.0%) | 10 (7.3%) |
| $15,000 to $17,499 | 17 (8.5%) | 0 (0.0%) |
| $17,500 to $19,999 | 0 (0.0%) | 0 (0.0%) |
| $20,000 to $22,499 | 2 (1.0%) | 0 (0.0%) |
| $22,500 to $24,999 | 0 (0.0%) | 0 (0.0%) |
| $25,000 to $29,999 | 6 (3.0%) | 8 (5.8%) |
| $30,000 to $34,999 | 14 (7.0%) | 8 (5.8%) |
| $35,000 to $39,999 | 0 (0.0%) | 7 (5.1%) |
| $40,000 to $44,999 | 3 (1.5%) | 5 (3.6%) |
| $45,000 to $49,999 | 9 (4.5%) | 16 (11.7%) |
| $50,000 to $54,999 | 0 (0.0%) | 0 (0.0%) |
| $55,000 to $64,999 | 6 (3.0%) | 4 (2.9%) |
| $65,000 to $74,999 | 8 (4.0%) | 5 (3.6%) |
| $75,000 to $99,999 | 37 (18.4%) | 23 (16.8%) |
| $100,000+ | 76 (37.8%) | 22 (16.1%) |
| Total | 201 (100.0%) | 137 (100.0%) |
Earnings by Sex by Educational Attainment in Bailey s Prairie
Average earnings in Bailey s Prairie are $94,297 for men and $46,500 for women, a difference of 50.7%. Men with an educational attainment of bachelor's degree enjoy the highest average annual earnings of $241,750, while those with high school diploma education earn the least with $34,107. Women with an educational attainment of graduate degree earn the most with the average annual earnings of $81,375, while those with college or associate's degree education have the smallest earnings of $46,625.
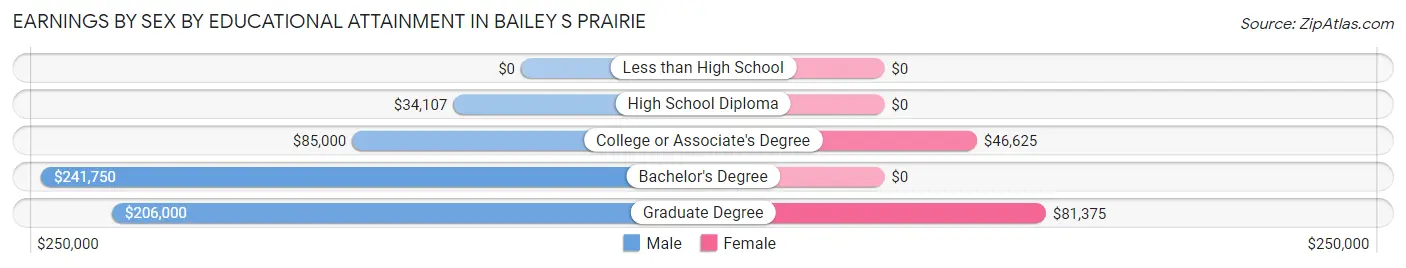
| Educational Attainment | Male Income | Female Income |
| Less than High School | - | - |
| High School Diploma | $34,107 | $0 |
| College or Associate's Degree | $85,000 | $46,625 |
| Bachelor's Degree | $241,750 | $0 |
| Graduate Degree | $206,000 | $81,375 |
| Total | $94,297 | $46,500 |
Family Income in Bailey s Prairie
Family Income Brackets in Bailey s Prairie
According to the Bailey s Prairie family income data, there are 58 families falling into the $100,000 to $149,999 income range, which is the most common income bracket and makes up 24.7% of all families.
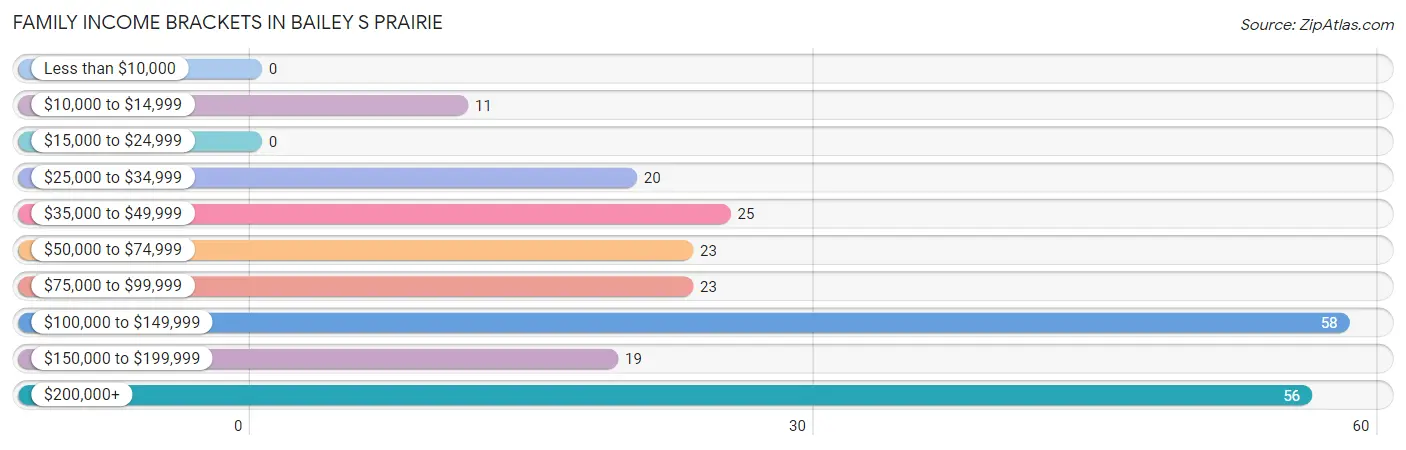
| Income Bracket | # Families | % Families |
| Less than $10,000 | 0 | 0.0% |
| $10,000 to $14,999 | 11 | 4.7% |
| $15,000 to $24,999 | 0 | 0.0% |
| $25,000 to $34,999 | 20 | 8.5% |
| $35,000 to $49,999 | 25 | 10.6% |
| $50,000 to $74,999 | 23 | 9.8% |
| $75,000 to $99,999 | 23 | 9.8% |
| $100,000 to $149,999 | 58 | 24.7% |
| $150,000 to $199,999 | 19 | 8.1% |
| $200,000+ | 56 | 23.8% |
Family Income by Famaliy Size in Bailey s Prairie
2-person families (152 | 64.7%) account for the highest median family income in Bailey s Prairie with $104,167 per family, while 2-person families (152 | 64.7%) have the highest median income of $52,084 per family member.
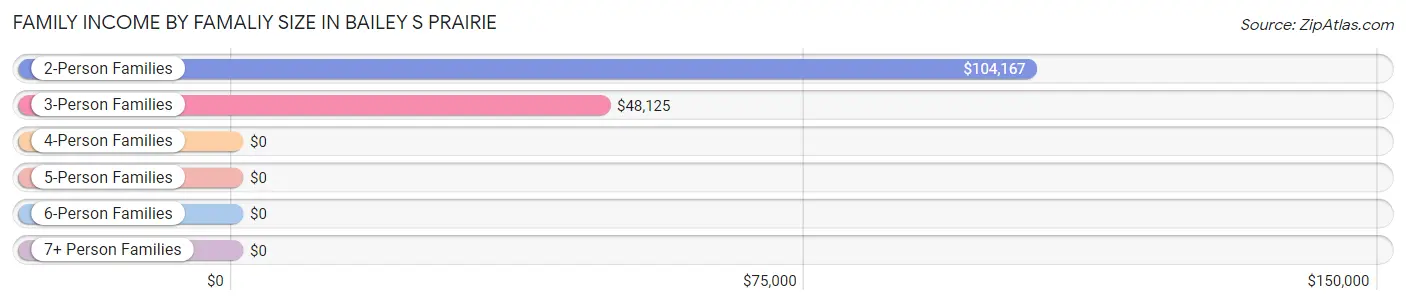
| Income Bracket | # Families | Median Income |
| 2-Person Families | 152 (64.7%) | $104,167 |
| 3-Person Families | 30 (12.8%) | $48,125 |
| 4-Person Families | 30 (12.8%) | $0 |
| 5-Person Families | 16 (6.8%) | $0 |
| 6-Person Families | 5 (2.1%) | $0 |
| 7+ Person Families | 2 (0.9%) | $0 |
| Total | 235 (100.0%) | $104,922 |
Family Income by Number of Earners in Bailey s Prairie
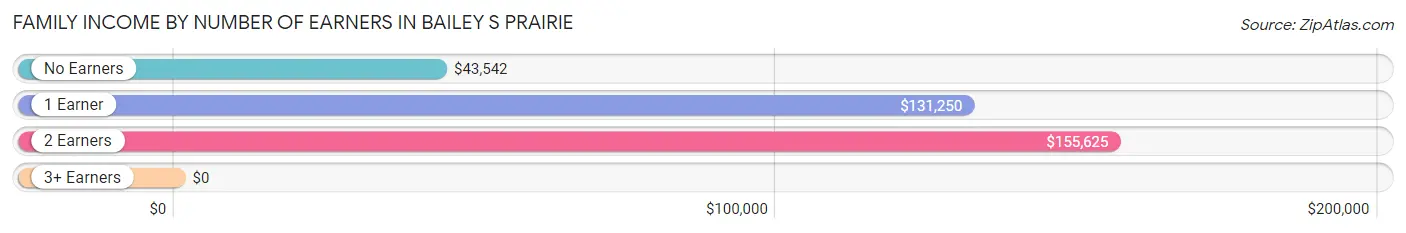
| Number of Earners | # Families | Median Income |
| No Earners | 67 (28.5%) | $43,542 |
| 1 Earner | 62 (26.4%) | $131,250 |
| 2 Earners | 95 (40.4%) | $155,625 |
| 3+ Earners | 11 (4.7%) | $0 |
| Total | 235 (100.0%) | $104,922 |
Household Income in Bailey s Prairie
Household Income Brackets in Bailey s Prairie
With 64 households falling in the category, the $200,000+ income range is the most frequent in Bailey s Prairie, accounting for 21.3% of all households. In contrast, only 2 households (0.7%) fall into the $10,000 to $14,999 income bracket, making it the least populous group.
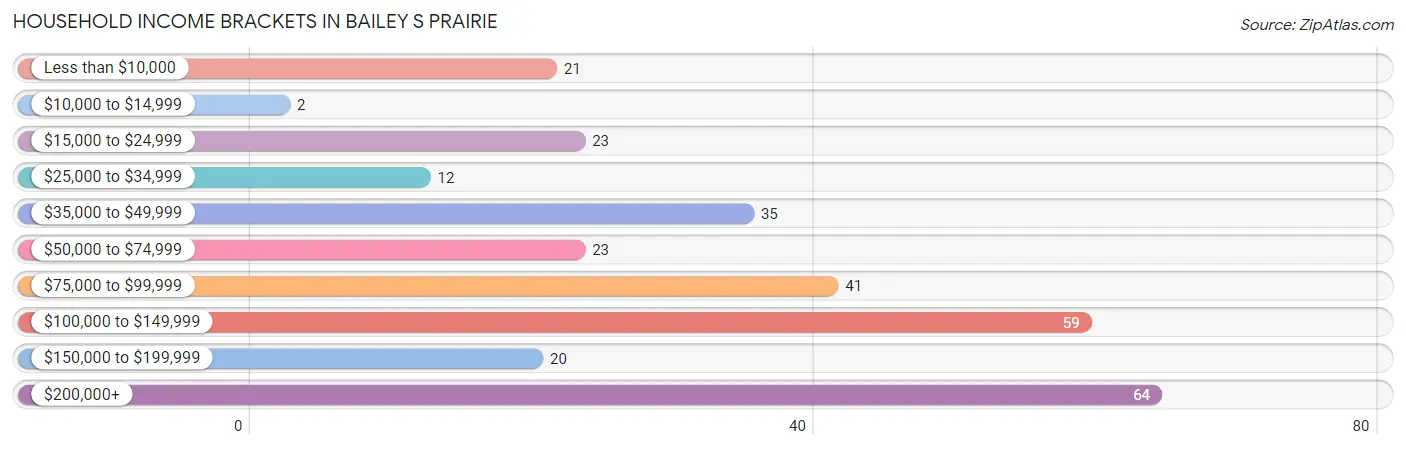
| Income Bracket | # Households | % Households |
| Less than $10,000 | 21 | 7.0% |
| $10,000 to $14,999 | 2 | 0.7% |
| $15,000 to $24,999 | 23 | 7.7% |
| $25,000 to $34,999 | 12 | 4.0% |
| $35,000 to $49,999 | 35 | 11.7% |
| $50,000 to $74,999 | 23 | 7.7% |
| $75,000 to $99,999 | 41 | 13.7% |
| $100,000 to $149,999 | 59 | 19.7% |
| $150,000 to $199,999 | 20 | 6.7% |
| $200,000+ | 64 | 21.3% |
Household Income by Householder Age in Bailey s Prairie
The median household income in Bailey s Prairie is $95,750, with the highest median household income of $121,964 found in the 45 to 64 years age bracket for the primary householder. A total of 171 households (57.0%) fall into this category.
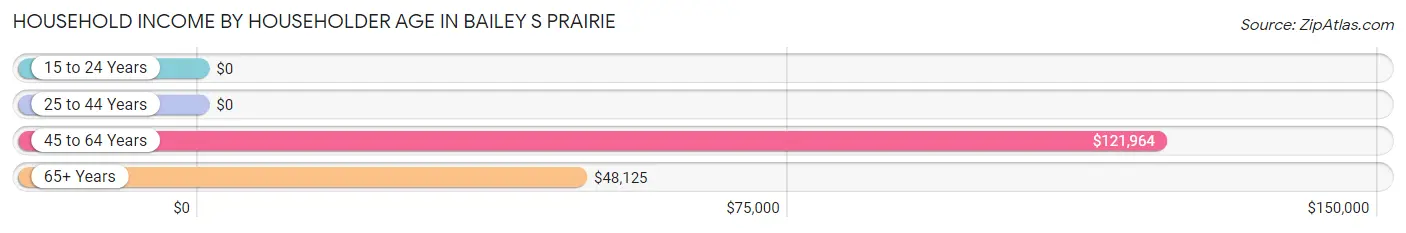
| Income Bracket | # Households | Median Income |
| 15 to 24 Years | 0 (0.0%) | $0 |
| 25 to 44 Years | 32 (10.7%) | $0 |
| 45 to 64 Years | 171 (57.0%) | $121,964 |
| 65+ Years | 97 (32.3%) | $48,125 |
| Total | 300 (100.0%) | $95,750 |
Poverty in Bailey s Prairie
Income Below Poverty by Sex and Age in Bailey s Prairie
With 11.6% poverty level for males and 5.4% for females among the residents of Bailey s Prairie, 25 to 34 year old males and 12 to 14 year old females are the most vulnerable to poverty, with 11 males (47.8%) and 6 females (54.5%) in their respective age groups living below the poverty level.
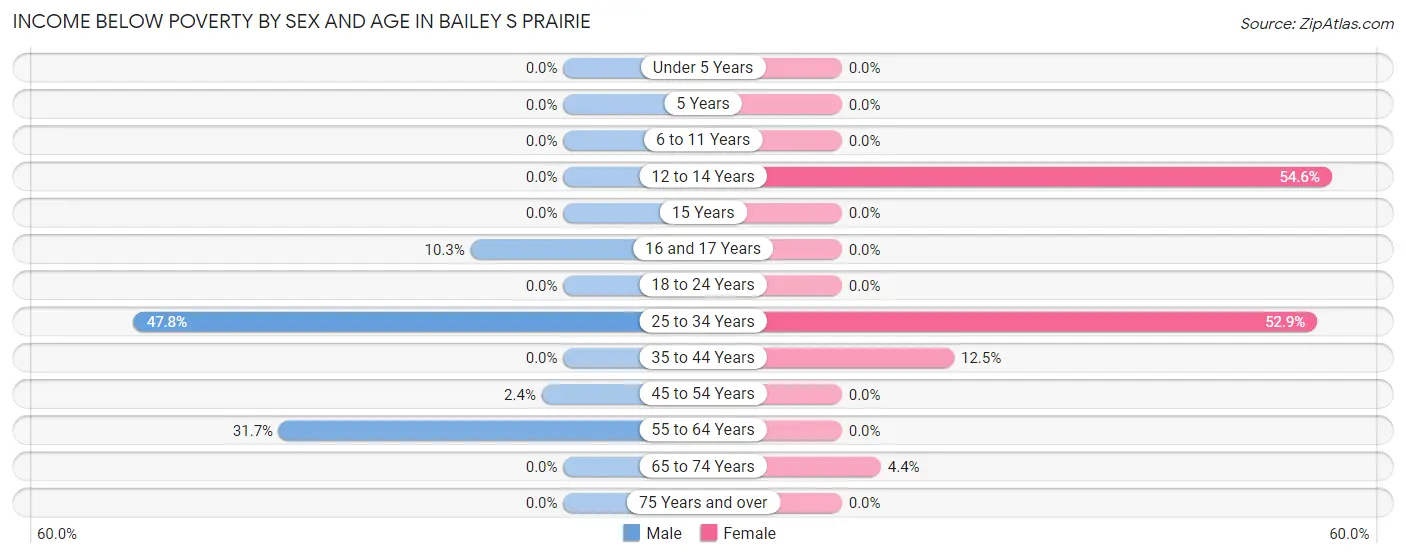
| Age Bracket | Male | Female |
| Under 5 Years | 0 (0.0%) | 0 (0.0%) |
| 5 Years | 0 (0.0%) | 0 (0.0%) |
| 6 to 11 Years | 0 (0.0%) | 0 (0.0%) |
| 12 to 14 Years | 0 (0.0%) | 6 (54.5%) |
| 15 Years | 0 (0.0%) | 0 (0.0%) |
| 16 and 17 Years | 3 (10.3%) | 0 (0.0%) |
| 18 to 24 Years | 0 (0.0%) | 0 (0.0%) |
| 25 to 34 Years | 11 (47.8%) | 9 (52.9%) |
| 35 to 44 Years | 0 (0.0%) | 2 (12.5%) |
| 45 to 54 Years | 2 (2.4%) | 0 (0.0%) |
| 55 to 64 Years | 32 (31.7%) | 0 (0.0%) |
| 65 to 74 Years | 0 (0.0%) | 2 (4.3%) |
| 75 Years and over | 0 (0.0%) | 0 (0.0%) |
| Total | 48 (11.6%) | 19 (5.4%) |
Income Above Poverty by Sex and Age in Bailey s Prairie
According to the poverty statistics in Bailey s Prairie, males aged under 5 years and females aged under 5 years are the age groups that are most secure financially, with 100.0% of males and 100.0% of females in these age groups living above the poverty line.
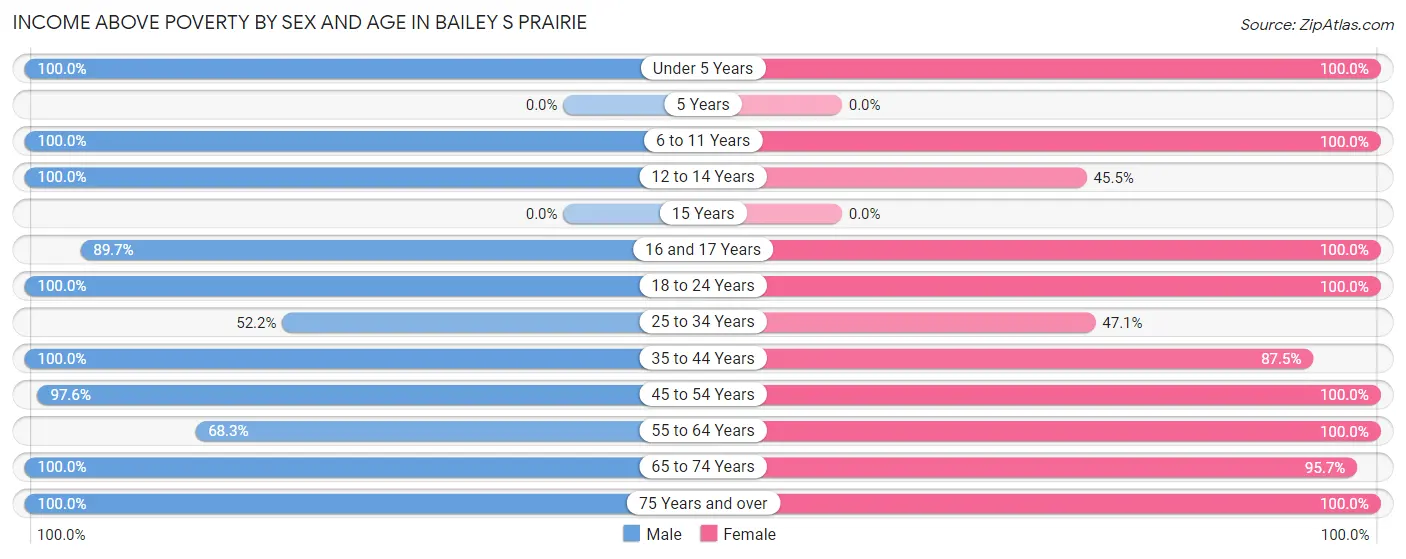
| Age Bracket | Male | Female |
| Under 5 Years | 15 (100.0%) | 6 (100.0%) |
| 5 Years | 0 (0.0%) | 0 (0.0%) |
| 6 to 11 Years | 17 (100.0%) | 11 (100.0%) |
| 12 to 14 Years | 22 (100.0%) | 5 (45.5%) |
| 15 Years | 0 (0.0%) | 0 (0.0%) |
| 16 and 17 Years | 26 (89.7%) | 24 (100.0%) |
| 18 to 24 Years | 26 (100.0%) | 28 (100.0%) |
| 25 to 34 Years | 12 (52.2%) | 8 (47.1%) |
| 35 to 44 Years | 18 (100.0%) | 14 (87.5%) |
| 45 to 54 Years | 81 (97.6%) | 70 (100.0%) |
| 55 to 64 Years | 69 (68.3%) | 78 (100.0%) |
| 65 to 74 Years | 45 (100.0%) | 44 (95.7%) |
| 75 Years and over | 35 (100.0%) | 42 (100.0%) |
| Total | 366 (88.4%) | 330 (94.6%) |
Income Below Poverty Among Married-Couple Families in Bailey s Prairie
The poverty statistics for married-couple families in Bailey s Prairie show that 1.0% or 2 of the total 206 families live below the poverty line. Families with 1 or 2 children have the highest poverty rate of 5.7%, comprising of 2 families. On the other hand, families with no children have the lowest poverty rate of 0.0%, which includes 0 families.
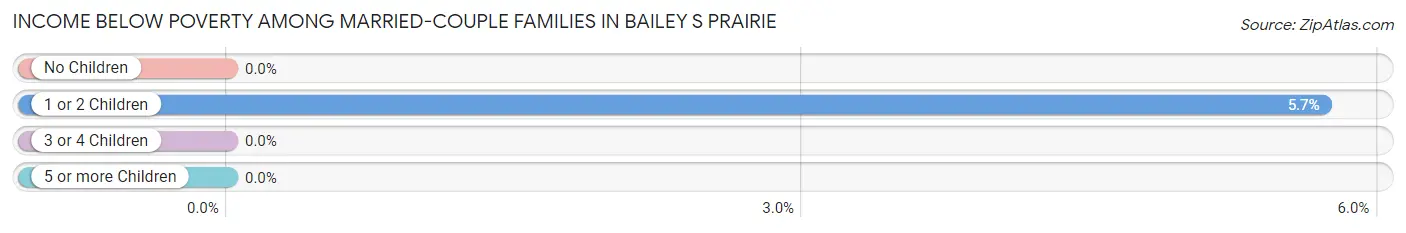
| Children | Above Poverty | Below Poverty |
| No Children | 158 (100.0%) | 0 (0.0%) |
| 1 or 2 Children | 33 (94.3%) | 2 (5.7%) |
| 3 or 4 Children | 13 (100.0%) | 0 (0.0%) |
| 5 or more Children | 0 (0.0%) | 0 (0.0%) |
| Total | 204 (99.0%) | 2 (1.0%) |
Income Below Poverty Among Single-Parent Households in Bailey s Prairie
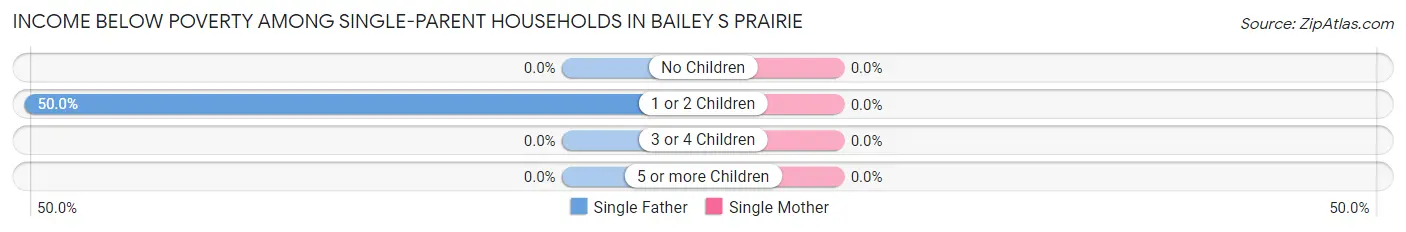
| Children | Single Father | Single Mother |
| No Children | 0 (0.0%) | 0 (0.0%) |
| 1 or 2 Children | 11 (50.0%) | 0 (0.0%) |
| 3 or 4 Children | 0 (0.0%) | 0 (0.0%) |
| 5 or more Children | 0 (0.0%) | 0 (0.0%) |
| Total | 11 (50.0%) | 0 (0.0%) |
Income Below Poverty Among Married-Couple vs Single-Parent Households in Bailey s Prairie
The poverty data for Bailey s Prairie shows that 2 of the married-couple family households (1.0%) and 11 of the single-parent households (37.9%) are living below the poverty level. Within the married-couple family households, those with 1 or 2 children have the highest poverty rate, with 2 households (5.7%) falling below the poverty line. Among the single-parent households, those with 1 or 2 children have the highest poverty rate, with 11 household (50.0%) living below poverty.
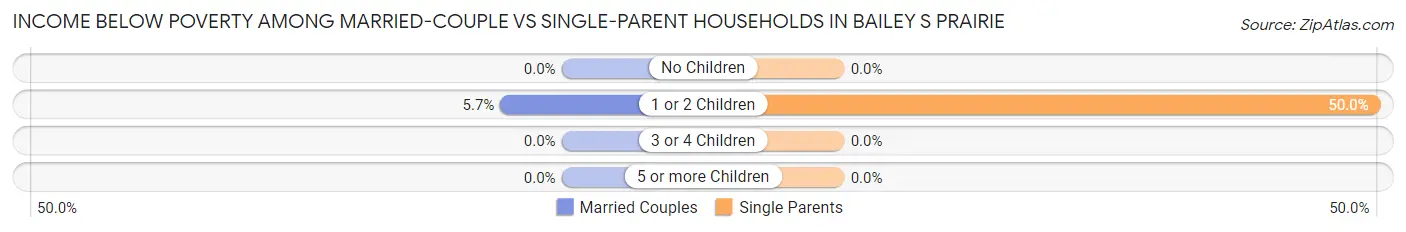
| Children | Married-Couple Families | Single-Parent Households |
| No Children | 0 (0.0%) | 0 (0.0%) |
| 1 or 2 Children | 2 (5.7%) | 11 (50.0%) |
| 3 or 4 Children | 0 (0.0%) | 0 (0.0%) |
| 5 or more Children | 0 (0.0%) | 0 (0.0%) |
| Total | 2 (1.0%) | 11 (37.9%) |
Race in Bailey s Prairie
The most populous races in Bailey s Prairie are White / Caucasian (659 | 86.4%), Hispanic or Latino (124 | 16.3%), and Two or more Races (59 | 7.7%).
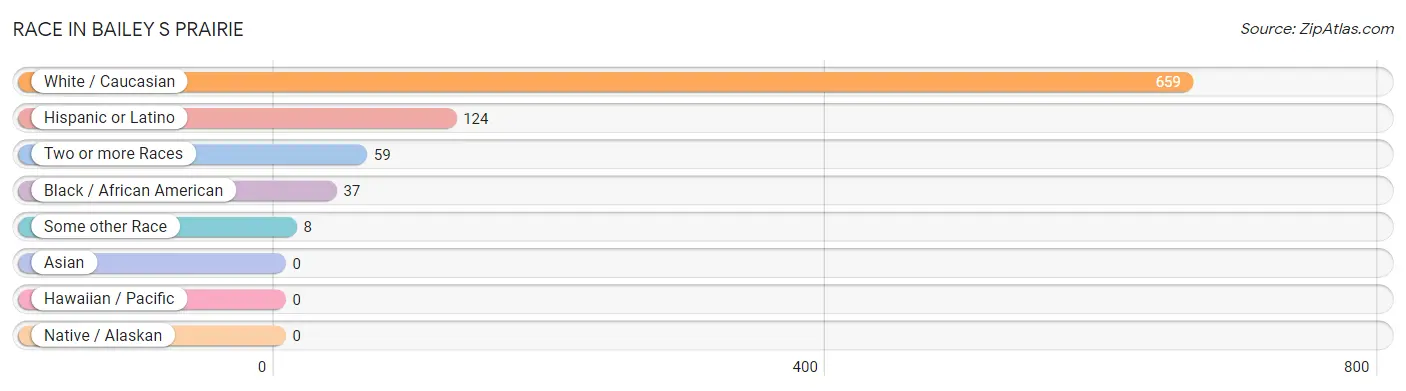
| Race | # Population | % Population |
| Asian | 0 | 0.0% |
| Black / African American | 37 | 4.9% |
| Hawaiian / Pacific | 0 | 0.0% |
| Hispanic or Latino | 124 | 16.3% |
| Native / Alaskan | 0 | 0.0% |
| White / Caucasian | 659 | 86.4% |
| Two or more Races | 59 | 7.7% |
| Some other Race | 8 | 1.1% |
| Total | 763 | 100.0% |
Ancestry in Bailey s Prairie
The most populous ancestries reported in Bailey s Prairie are German (188 | 24.6%), Irish (108 | 14.1%), Italian (78 | 10.2%), Czech (59 | 7.7%), and Mexican (59 | 7.7%), together accounting for 64.5% of all Bailey s Prairie residents.
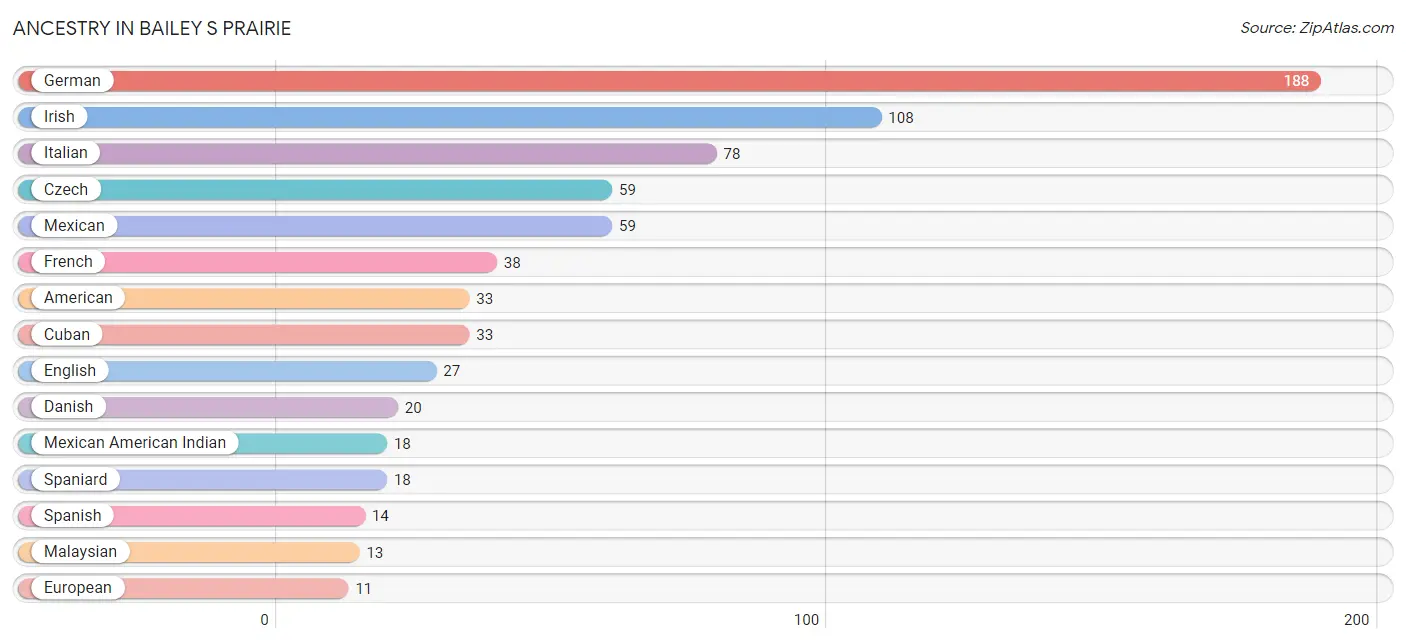
| Ancestry | # Population | % Population |
| American | 33 | 4.3% |
| Austrian | 2 | 0.3% |
| Cherokee | 2 | 0.3% |
| Cuban | 33 | 4.3% |
| Czech | 59 | 7.7% |
| Czechoslovakian | 5 | 0.7% |
| Danish | 20 | 2.6% |
| Dutch | 5 | 0.7% |
| English | 27 | 3.5% |
| European | 11 | 1.4% |
| French | 38 | 5.0% |
| German | 188 | 24.6% |
| Greek | 4 | 0.5% |
| Irish | 108 | 14.1% |
| Israeli | 6 | 0.8% |
| Italian | 78 | 10.2% |
| Malaysian | 13 | 1.7% |
| Mexican | 59 | 7.7% |
| Mexican American Indian | 18 | 2.4% |
| Norwegian | 2 | 0.3% |
| Portuguese | 6 | 0.8% |
| Scotch-Irish | 2 | 0.3% |
| Scottish | 8 | 1.1% |
| Spaniard | 18 | 2.4% |
| Spanish | 14 | 1.8% | View All 25 Rows |
Immigrants in Bailey s Prairie
The most numerous immigrant groups reported in Bailey s Prairie came from Central America (3 | 0.4%), Latin America (3 | 0.4%), and Mexico (3 | 0.4%), together accounting for 1.2% of all Bailey s Prairie residents.
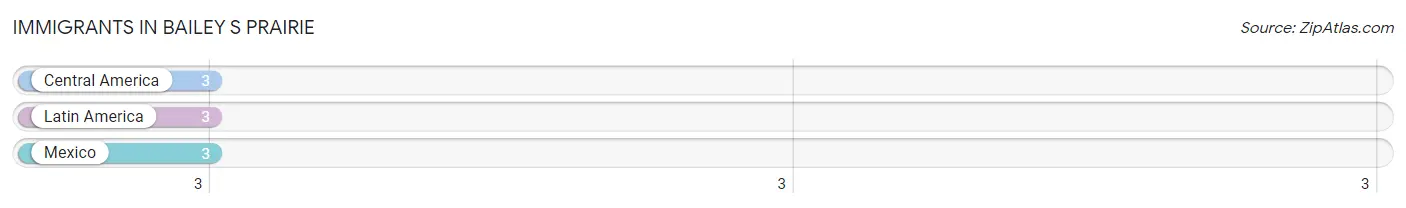
| Immigration Origin | # Population | % Population |
| Central America | 3 | 0.4% |
| Latin America | 3 | 0.4% |
| Mexico | 3 | 0.4% | View All 3 Rows |
Sex and Age in Bailey s Prairie
Sex and Age in Bailey s Prairie
The most populous age groups in Bailey s Prairie are 60 to 64 Years (74 | 17.9%) for men and 50 to 54 Years (48 | 13.8%) for women.
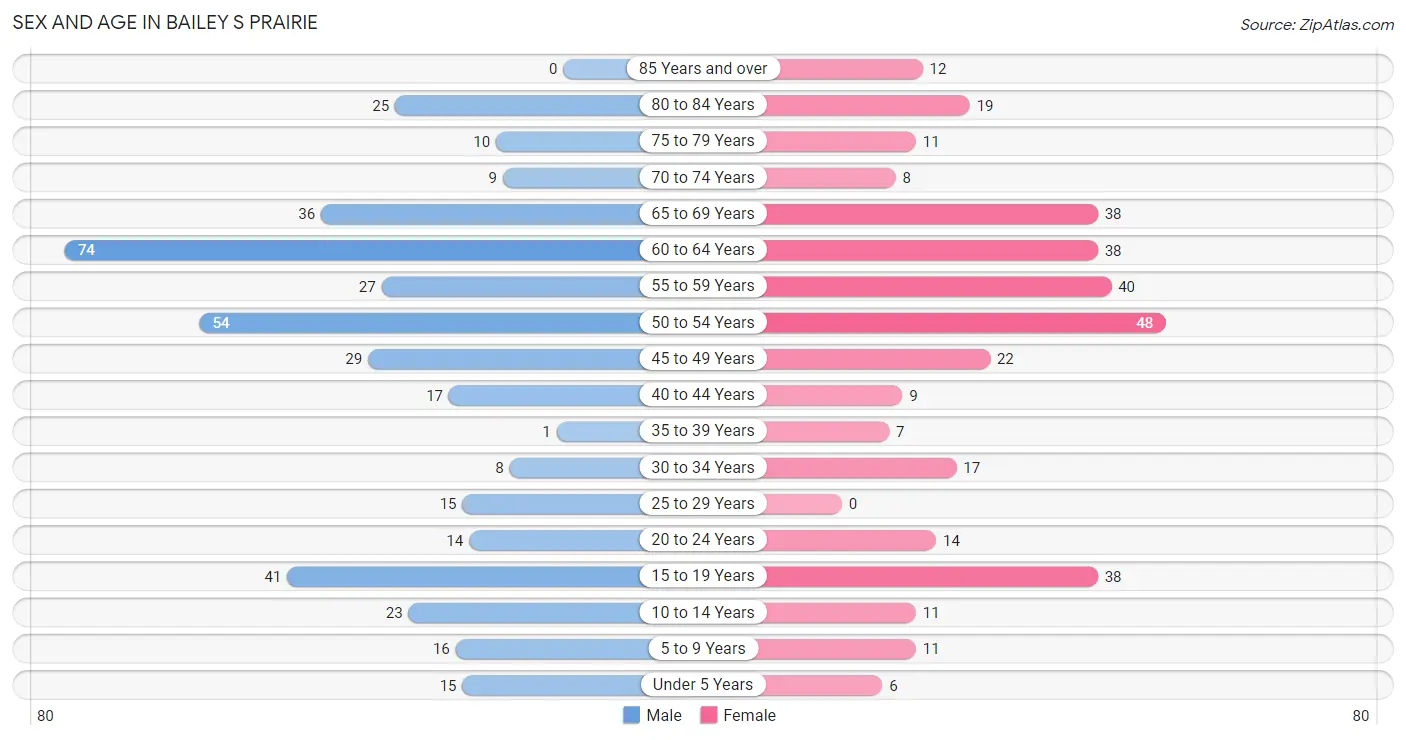
| Age Bracket | Male | Female |
| Under 5 Years | 15 (3.6%) | 6 (1.7%) |
| 5 to 9 Years | 16 (3.9%) | 11 (3.2%) |
| 10 to 14 Years | 23 (5.6%) | 11 (3.2%) |
| 15 to 19 Years | 41 (9.9%) | 38 (10.9%) |
| 20 to 24 Years | 14 (3.4%) | 14 (4.0%) |
| 25 to 29 Years | 15 (3.6%) | 0 (0.0%) |
| 30 to 34 Years | 8 (1.9%) | 17 (4.9%) |
| 35 to 39 Years | 1 (0.2%) | 7 (2.0%) |
| 40 to 44 Years | 17 (4.1%) | 9 (2.6%) |
| 45 to 49 Years | 29 (7.0%) | 22 (6.3%) |
| 50 to 54 Years | 54 (13.0%) | 48 (13.8%) |
| 55 to 59 Years | 27 (6.5%) | 40 (11.5%) |
| 60 to 64 Years | 74 (17.9%) | 38 (10.9%) |
| 65 to 69 Years | 36 (8.7%) | 38 (10.9%) |
| 70 to 74 Years | 9 (2.2%) | 8 (2.3%) |
| 75 to 79 Years | 10 (2.4%) | 11 (3.2%) |
| 80 to 84 Years | 25 (6.0%) | 19 (5.4%) |
| 85 Years and over | 0 (0.0%) | 12 (3.4%) |
| Total | 414 (100.0%) | 349 (100.0%) |
Families and Households in Bailey s Prairie
Median Family Size in Bailey s Prairie
The median family size in Bailey s Prairie is 2.78 persons per family, with married-couple families (206 | 87.7%) accounting for the largest median family size of 2.85 persons per family. On the other hand, single male/father families (22 | 9.4%) represent the smallest median family size with 2.27 persons per family.
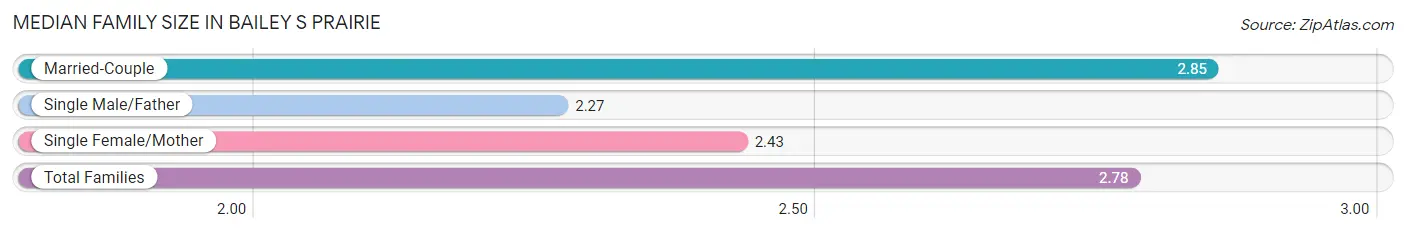
| Family Type | # Families | Family Size |
| Married-Couple | 206 (87.7%) | 2.85 |
| Single Male/Father | 22 (9.4%) | 2.27 |
| Single Female/Mother | 7 (3.0%) | 2.43 |
| Total Families | 235 (100.0%) | 2.78 |
Median Household Size in Bailey s Prairie
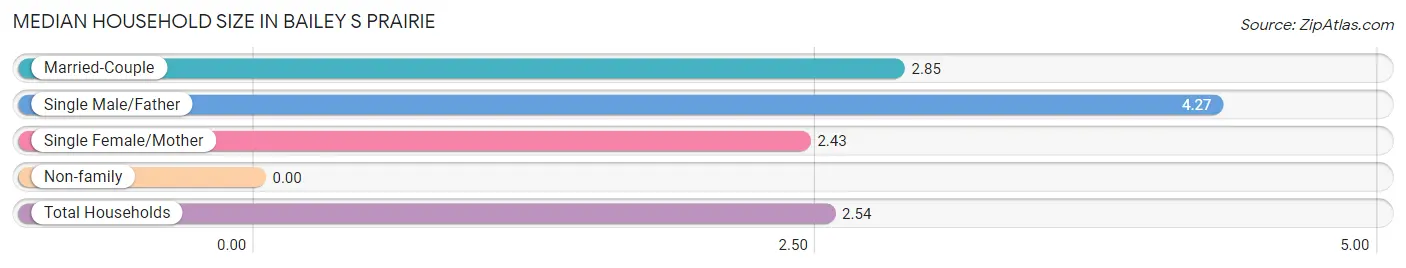
| Household Type | # Households | Household Size |
| Married-Couple | 206 (68.7%) | 2.85 |
| Single Male/Father | 22 (7.3%) | 4.27 |
| Single Female/Mother | 7 (2.3%) | 2.43 |
| Non-family | 65 (21.7%) | - |
| Total Households | 300 (100.0%) | 2.54 |
Household Size by Marriage Status in Bailey s Prairie
Out of a total of 300 households in Bailey s Prairie, 235 (78.3%) are family households, while 65 (21.7%) are nonfamily households. The most numerous type of family households are 2-person households, comprising 141, and the most common type of nonfamily households are 1-person households, comprising 65.
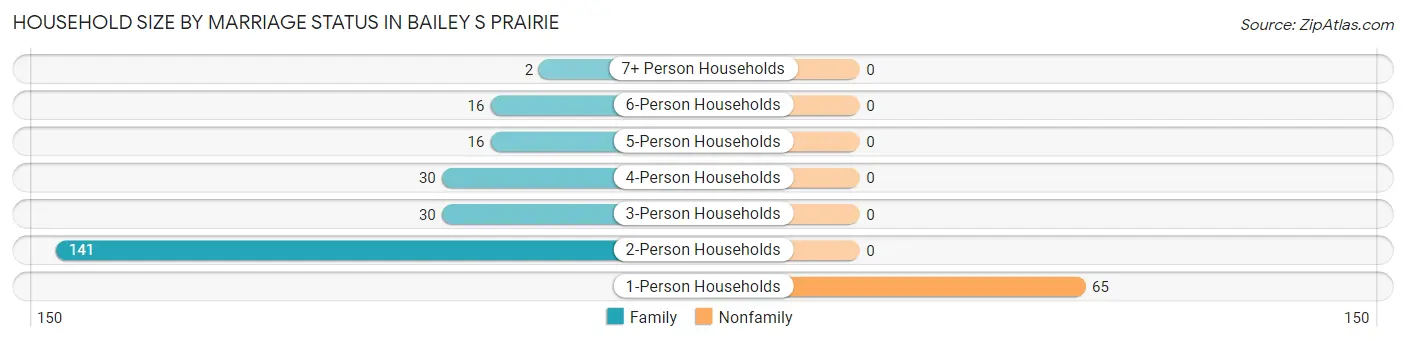
| Household Size | Family Households | Nonfamily Households |
| 1-Person Households | - | 65 (21.7%) |
| 2-Person Households | 141 (47.0%) | 0 (0.0%) |
| 3-Person Households | 30 (10.0%) | 0 (0.0%) |
| 4-Person Households | 30 (10.0%) | 0 (0.0%) |
| 5-Person Households | 16 (5.3%) | 0 (0.0%) |
| 6-Person Households | 16 (5.3%) | 0 (0.0%) |
| 7+ Person Households | 2 (0.7%) | 0 (0.0%) |
| Total | 235 (78.3%) | 65 (21.7%) |
Female Fertility in Bailey s Prairie
Fertility by Age in Bailey s Prairie
Average fertility rate in Bailey s Prairie is 65.0 births per 1,000 women. Women in the age bracket of 20 to 34 years have the highest fertility rate with 258.0 births per 1,000 women. Women in the age bracket of 20 to 34 years acount for 100.0% of all women with births.
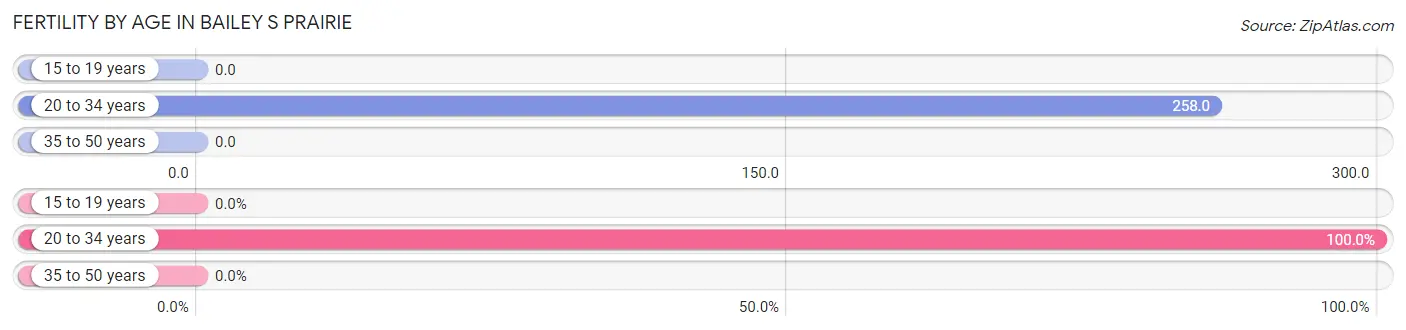
| Age Bracket | Women with Births | Births / 1,000 Women |
| 15 to 19 years | 0 (0.0%) | 0.0 |
| 20 to 34 years | 8 (100.0%) | 258.0 |
| 35 to 50 years | 0 (0.0%) | 0.0 |
| Total | 8 (100.0%) | 65.0 |
Fertility by Age by Marriage Status in Bailey s Prairie
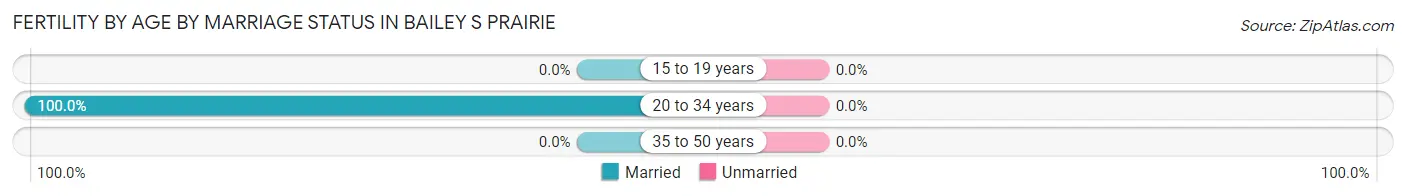
| Age Bracket | Married | Unmarried |
| 15 to 19 years | 0 (0.0%) | 0 (0.0%) |
| 20 to 34 years | 8 (100.0%) | 0 (0.0%) |
| 35 to 50 years | 0 (0.0%) | 0 (0.0%) |
| Total | 8 (100.0%) | 0 (0.0%) |
Fertility by Education in Bailey s Prairie
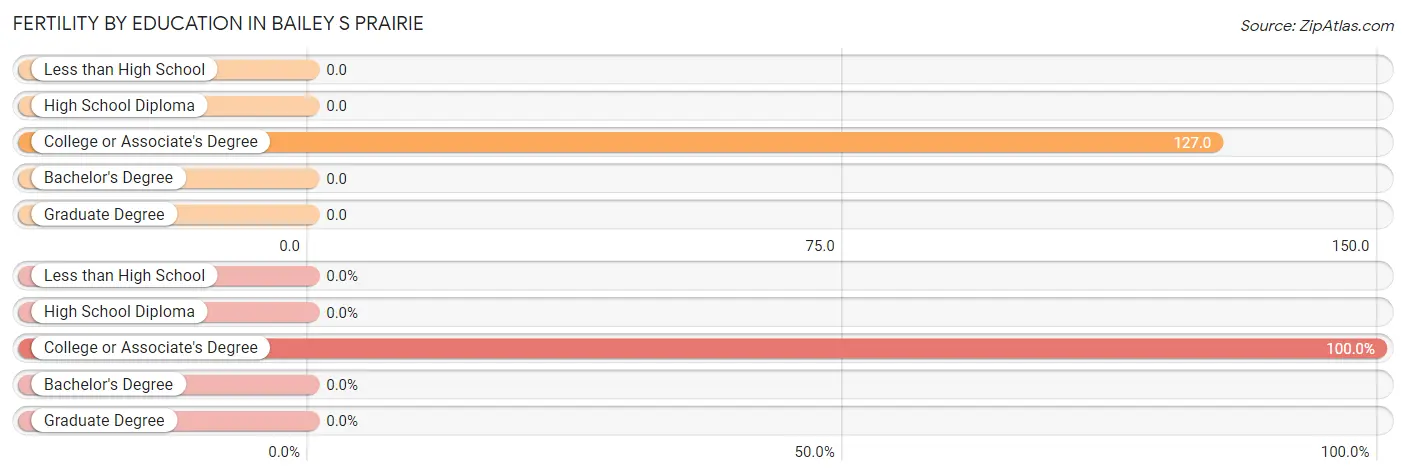
| Educational Attainment | Women with Births | Births / 1,000 Women |
| Less than High School | 0 (0.0%) | 0.0 |
| High School Diploma | 0 (0.0%) | 0.0 |
| College or Associate's Degree | 8 (100.0%) | 127.0 |
| Bachelor's Degree | 0 (0.0%) | 0.0 |
| Graduate Degree | 0 (0.0%) | 0.0 |
| Total | 8 (100.0%) | 65.0 |
Fertility by Education by Marriage Status in Bailey s Prairie
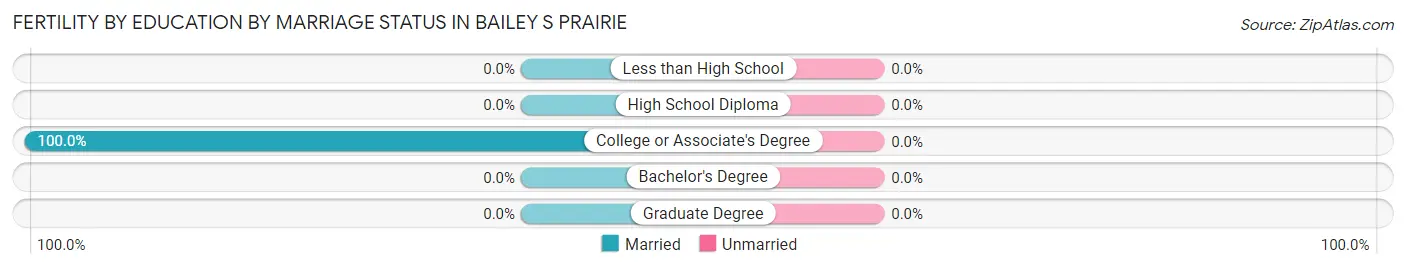
| Educational Attainment | Married | Unmarried |
| Less than High School | 0 (0.0%) | 0 (0.0%) |
| High School Diploma | 0 (0.0%) | 0 (0.0%) |
| College or Associate's Degree | 8 (100.0%) | 0 (0.0%) |
| Bachelor's Degree | 0 (0.0%) | 0 (0.0%) |
| Graduate Degree | 0 (0.0%) | 0 (0.0%) |
| Total | 8 (100.0%) | 0 (0.0%) |
Employment Characteristics in Bailey s Prairie
Employment by Class of Employer in Bailey s Prairie
Among the 315 employed individuals in Bailey s Prairie, private company employees (188 | 59.7%), local government employees (41 | 13.0%), and self-employed (not incorporated) (30 | 9.5%) make up the most common classes of employment.
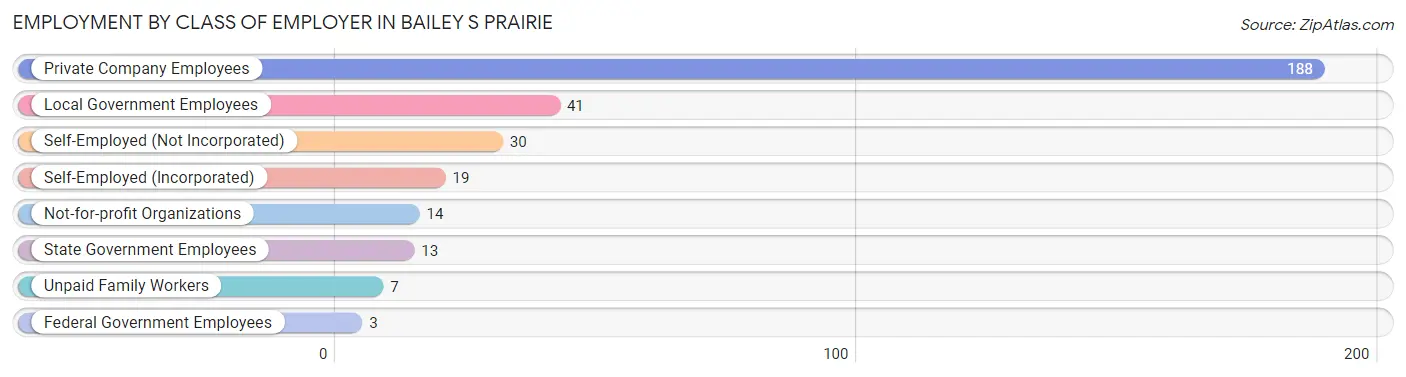
| Employer Class | # Employees | % Employees |
| Private Company Employees | 188 | 59.7% |
| Self-Employed (Incorporated) | 19 | 6.0% |
| Self-Employed (Not Incorporated) | 30 | 9.5% |
| Not-for-profit Organizations | 14 | 4.4% |
| Local Government Employees | 41 | 13.0% |
| State Government Employees | 13 | 4.1% |
| Federal Government Employees | 3 | 0.9% |
| Unpaid Family Workers | 7 | 2.2% |
| Total | 315 | 100.0% |
Employment Status by Age in Bailey s Prairie
According to the labor force statistics for Bailey s Prairie, out of the total population over 16 years of age (681), 47.3% or 322 individuals are in the labor force, with 0.6% or 2 of them unemployed. The age group with the highest labor force participation rate is 35 to 44 years, with 100.0% or 34 individuals in the labor force. Within the labor force, the 45 to 54 years age range has the highest percentage of unemployed individuals, with 1.7% or 2 of them being unemployed.
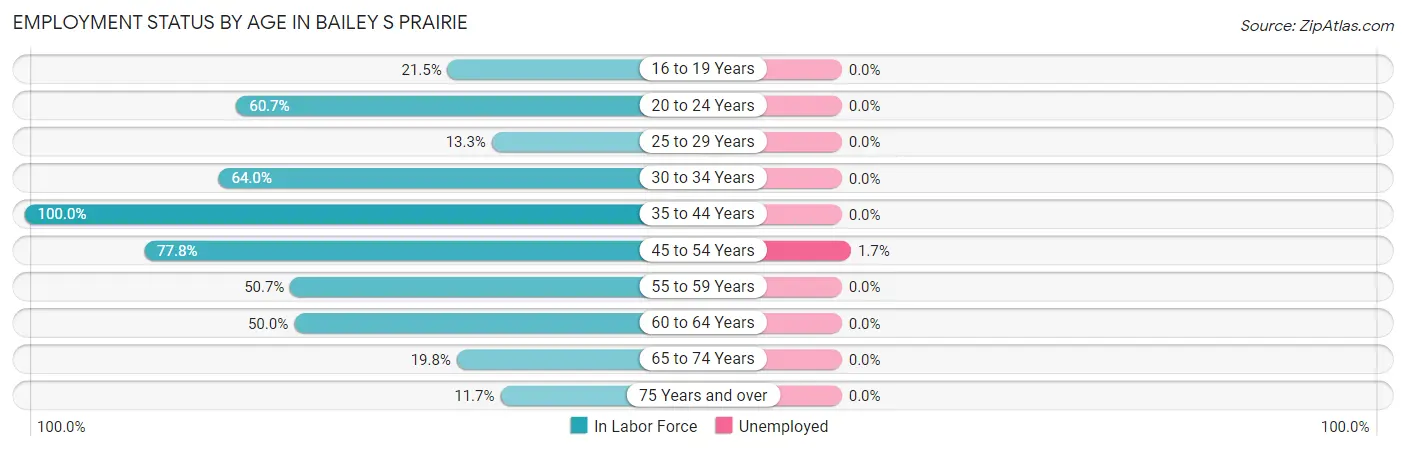
| Age Bracket | In Labor Force | Unemployed |
| 16 to 19 Years | 17 (21.5%) | 0 (0.0%) |
| 20 to 24 Years | 17 (60.7%) | 0 (0.0%) |
| 25 to 29 Years | 2 (13.3%) | 0 (0.0%) |
| 30 to 34 Years | 16 (64.0%) | 0 (0.0%) |
| 35 to 44 Years | 34 (100.0%) | 0 (0.0%) |
| 45 to 54 Years | 119 (77.8%) | 2 (1.7%) |
| 55 to 59 Years | 34 (50.7%) | 0 (0.0%) |
| 60 to 64 Years | 56 (50.0%) | 0 (0.0%) |
| 65 to 74 Years | 18 (19.8%) | 0 (0.0%) |
| 75 Years and over | 9 (11.7%) | 0 (0.0%) |
| Total | 322 (47.3%) | 2 (0.6%) |
Employment Status by Educational Attainment in Bailey s Prairie
According to labor force statistics for Bailey s Prairie, 64.3% of individuals (261) out of the total population between 25 and 64 years of age (406) are in the labor force, with 0.8% or 2 of them being unemployed. The group with the highest labor force participation rate are those with the educational attainment of less than high school, with 100.0% or 4 individuals in the labor force. Within the labor force, individuals with college / associate degree education have the highest percentage of unemployment, with 1.5% or 2 of them being unemployed.
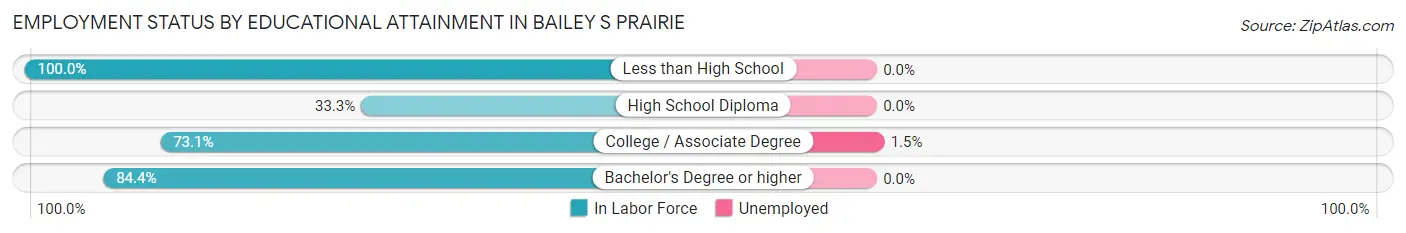
| Educational Attainment | In Labor Force | Unemployed |
| Less than High School | 4 (100.0%) | 0 (0.0%) |
| High School Diploma | 40 (33.3%) | 0 (0.0%) |
| College / Associate Degree | 136 (73.1%) | 3 (1.5%) |
| Bachelor's Degree or higher | 81 (84.4%) | 0 (0.0%) |
| Total | 261 (64.3%) | 3 (0.8%) |
Employment Occupations by Sex in Bailey s Prairie
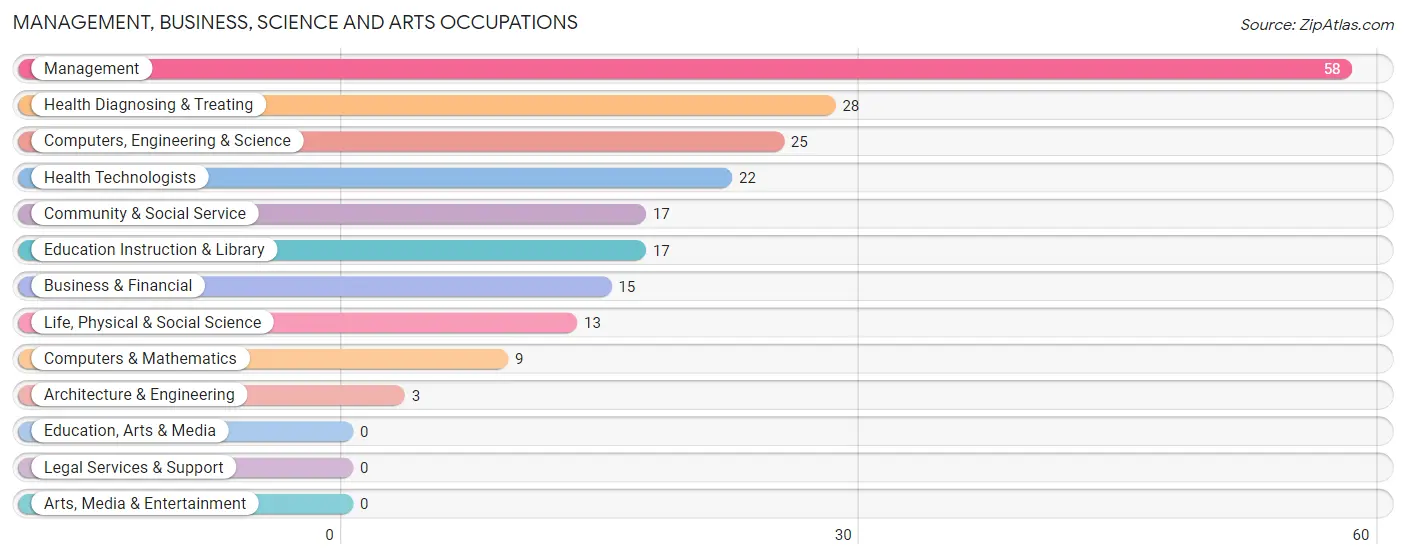
Management, Business, Science and Arts Occupations
The most common Management, Business, Science and Arts occupations in Bailey s Prairie are Management (58 | 18.1%), Health Diagnosing & Treating (28 | 8.7%), Computers, Engineering & Science (25 | 7.8%), Health Technologists (22 | 6.9%), and Community & Social Service (17 | 5.3%).
Management, Business, Science and Arts Occupations by Sex
Within the Management, Business, Science and Arts occupations in Bailey s Prairie, the most male-oriented occupations are Computers & Mathematics (100.0%), Architecture & Engineering (100.0%), and Computers, Engineering & Science (84.0%), while the most female-oriented occupations are Community & Social Service (100.0%), Education Instruction & Library (100.0%), and Health Diagnosing & Treating (89.3%).
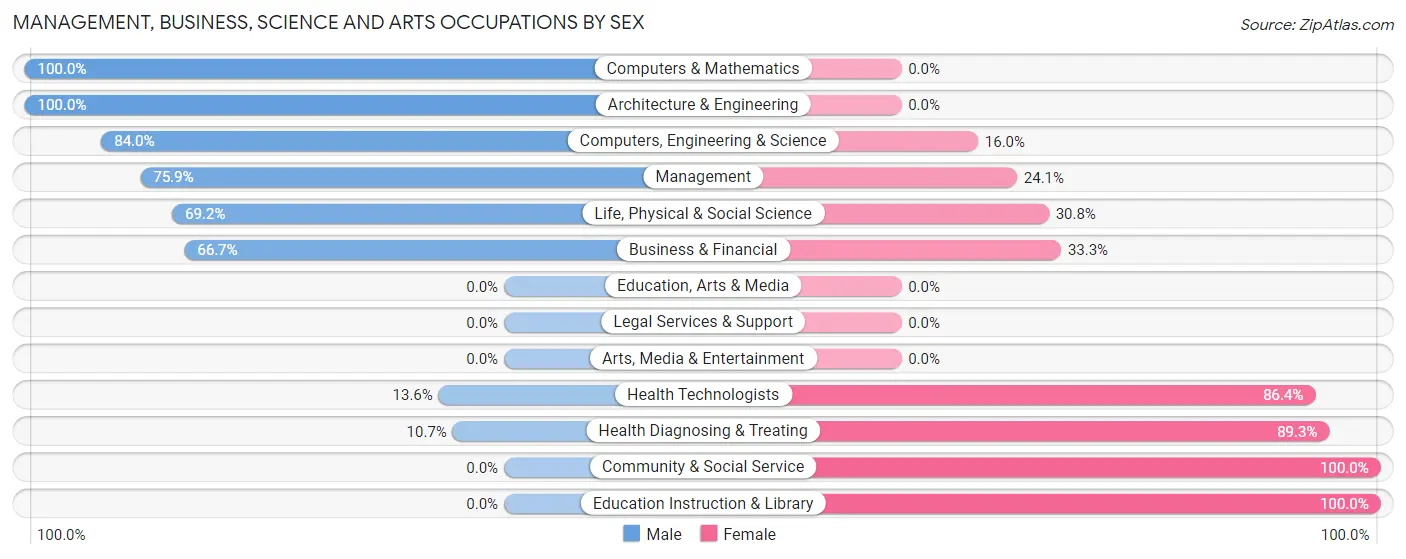
| Occupation | Male | Female |
| Management | 44 (75.9%) | 14 (24.1%) |
| Business & Financial | 10 (66.7%) | 5 (33.3%) |
| Computers, Engineering & Science | 21 (84.0%) | 4 (16.0%) |
| Computers & Mathematics | 9 (100.0%) | 0 (0.0%) |
| Architecture & Engineering | 3 (100.0%) | 0 (0.0%) |
| Life, Physical & Social Science | 9 (69.2%) | 4 (30.8%) |
| Community & Social Service | 0 (0.0%) | 17 (100.0%) |
| Education, Arts & Media | 0 (0.0%) | 0 (0.0%) |
| Legal Services & Support | 0 (0.0%) | 0 (0.0%) |
| Education Instruction & Library | 0 (0.0%) | 17 (100.0%) |
| Arts, Media & Entertainment | 0 (0.0%) | 0 (0.0%) |
| Health Diagnosing & Treating | 3 (10.7%) | 25 (89.3%) |
| Health Technologists | 3 (13.6%) | 19 (86.4%) |
| Total (Category) | 78 (54.5%) | 65 (45.5%) |
| Total (Overall) | 191 (59.7%) | 129 (40.3%) |
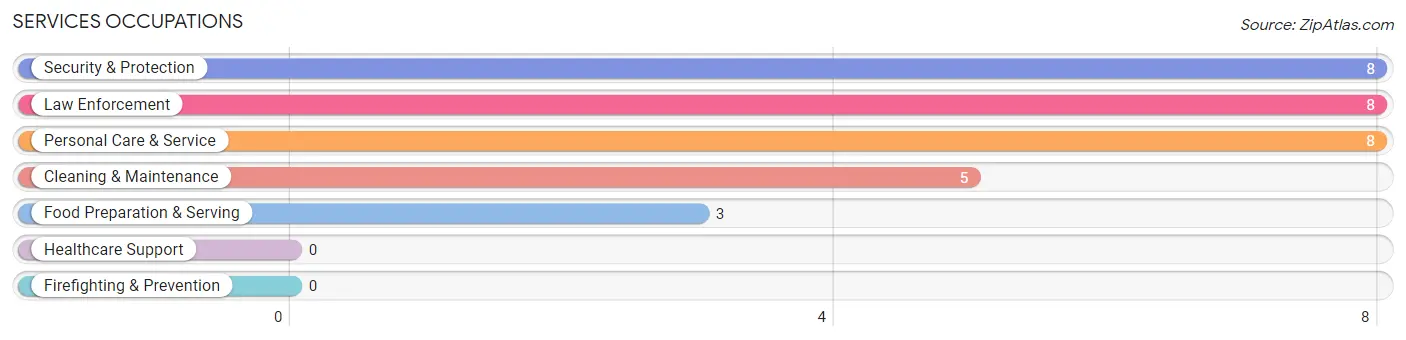
Services Occupations
The most common Services occupations in Bailey s Prairie are Security & Protection (8 | 2.5%), Law Enforcement (8 | 2.5%), Personal Care & Service (8 | 2.5%), Cleaning & Maintenance (5 | 1.6%), and Food Preparation & Serving (3 | 0.9%).
Services Occupations by Sex
Within the Services occupations in Bailey s Prairie, the most male-oriented occupations are Security & Protection (100.0%), and Law Enforcement (100.0%), while the most female-oriented occupations are Food Preparation & Serving (100.0%), Cleaning & Maintenance (100.0%), and Personal Care & Service (100.0%).
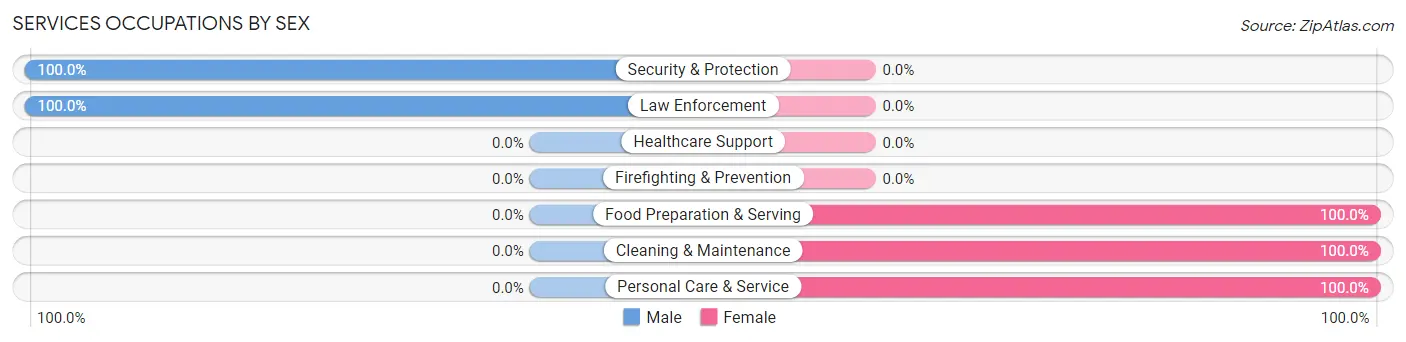
| Occupation | Male | Female |
| Healthcare Support | 0 (0.0%) | 0 (0.0%) |
| Security & Protection | 8 (100.0%) | 0 (0.0%) |
| Firefighting & Prevention | 0 (0.0%) | 0 (0.0%) |
| Law Enforcement | 8 (100.0%) | 0 (0.0%) |
| Food Preparation & Serving | 0 (0.0%) | 3 (100.0%) |
| Cleaning & Maintenance | 0 (0.0%) | 5 (100.0%) |
| Personal Care & Service | 0 (0.0%) | 8 (100.0%) |
| Total (Category) | 8 (33.3%) | 16 (66.7%) |
| Total (Overall) | 191 (59.7%) | 129 (40.3%) |
Sales and Office Occupations
The most common Sales and Office occupations in Bailey s Prairie are Office & Administration (54 | 16.9%), and Sales & Related (18 | 5.6%).

Sales and Office Occupations by Sex
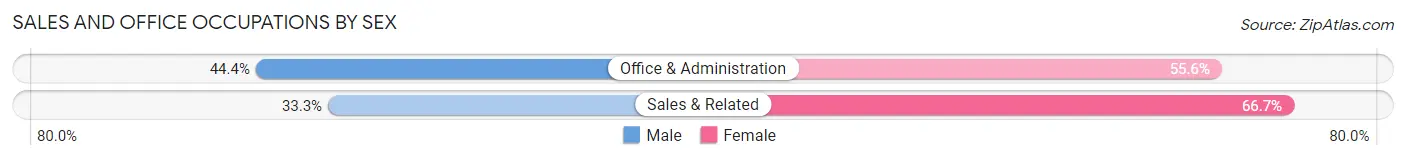
| Occupation | Male | Female |
| Sales & Related | 6 (33.3%) | 12 (66.7%) |
| Office & Administration | 24 (44.4%) | 30 (55.6%) |
| Total (Category) | 30 (41.7%) | 42 (58.3%) |
| Total (Overall) | 191 (59.7%) | 129 (40.3%) |
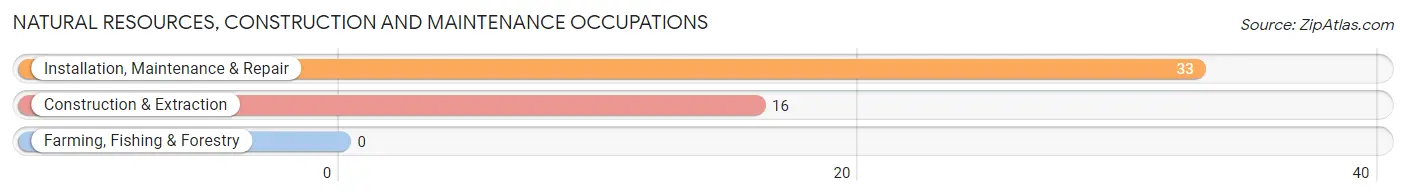
Natural Resources, Construction and Maintenance Occupations
The most common Natural Resources, Construction and Maintenance occupations in Bailey s Prairie are Installation, Maintenance & Repair (33 | 10.3%), and Construction & Extraction (16 | 5.0%).
Natural Resources, Construction and Maintenance Occupations by Sex
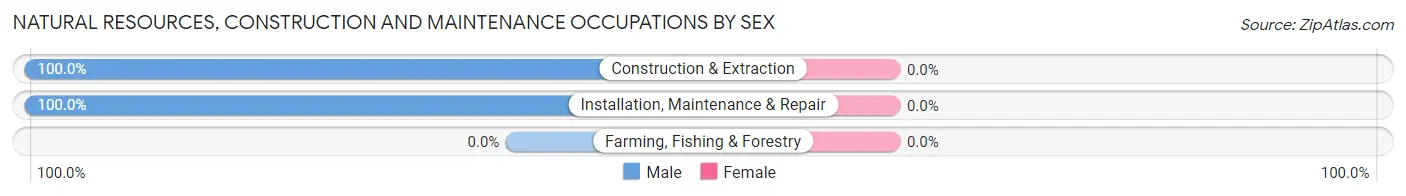
| Occupation | Male | Female |
| Farming, Fishing & Forestry | 0 (0.0%) | 0 (0.0%) |
| Construction & Extraction | 16 (100.0%) | 0 (0.0%) |
| Installation, Maintenance & Repair | 33 (100.0%) | 0 (0.0%) |
| Total (Category) | 49 (100.0%) | 0 (0.0%) |
| Total (Overall) | 191 (59.7%) | 129 (40.3%) |
Production, Transportation and Moving Occupations
The most common Production, Transportation and Moving occupations in Bailey s Prairie are Transportation (19 | 5.9%), Material Moving (11 | 3.4%), and Production (2 | 0.6%).
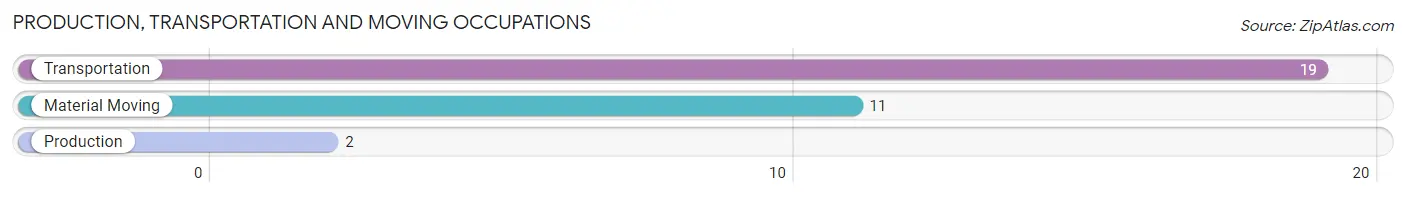
Production, Transportation and Moving Occupations by Sex
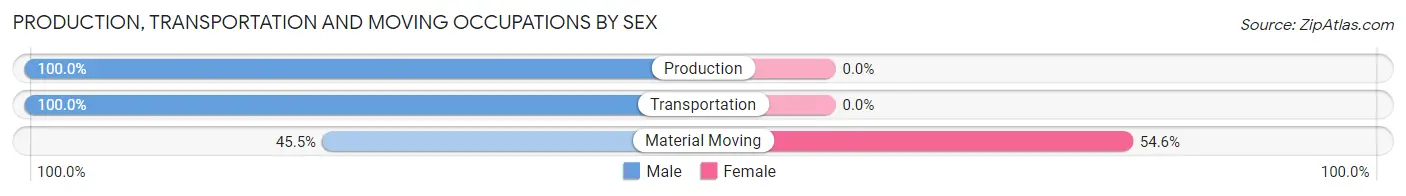
| Occupation | Male | Female |
| Production | 2 (100.0%) | 0 (0.0%) |
| Transportation | 19 (100.0%) | 0 (0.0%) |
| Material Moving | 5 (45.5%) | 6 (54.5%) |
| Total (Category) | 26 (81.2%) | 6 (18.8%) |
| Total (Overall) | 191 (59.7%) | 129 (40.3%) |
Employment Industries by Sex in Bailey s Prairie
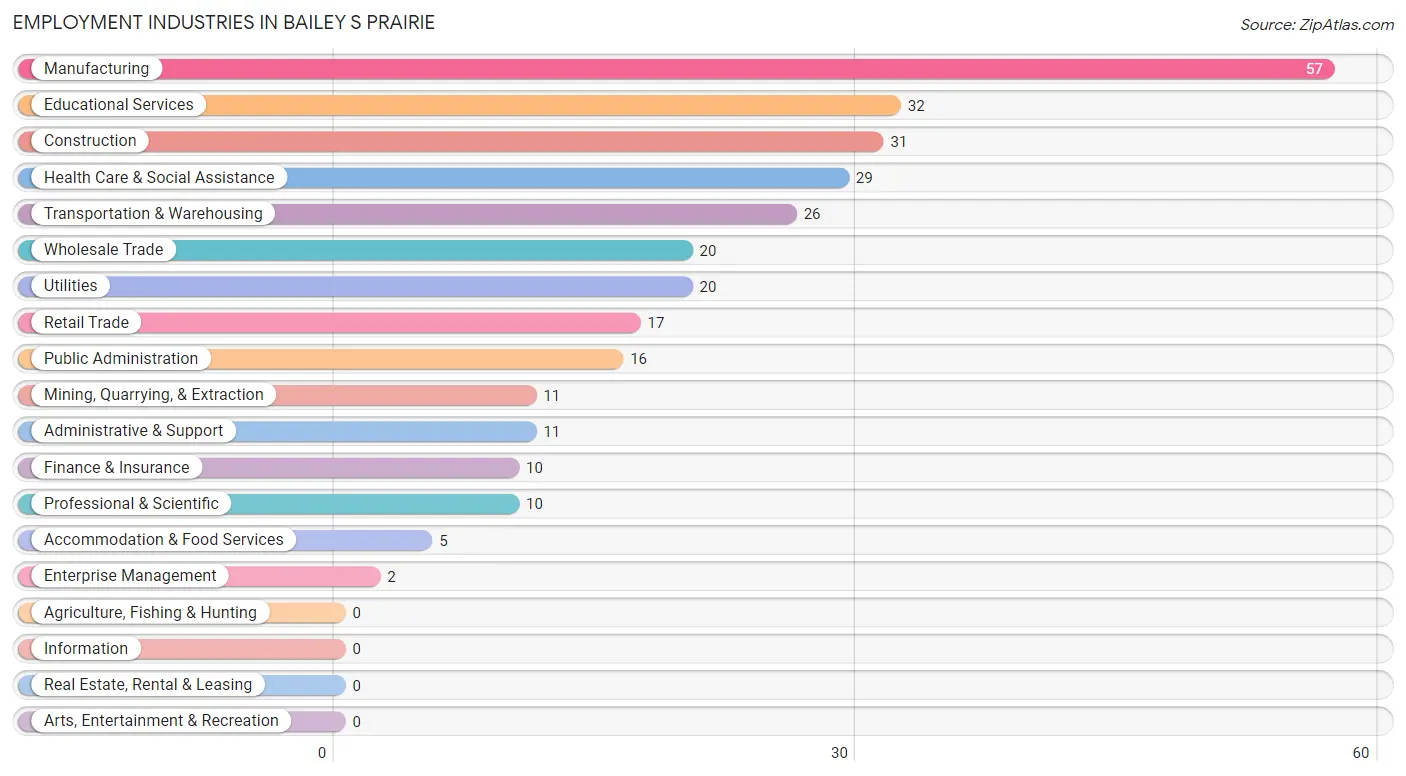
Employment Industries in Bailey s Prairie
The major employment industries in Bailey s Prairie include Manufacturing (57 | 17.8%), Educational Services (32 | 10.0%), Construction (31 | 9.7%), Health Care & Social Assistance (29 | 9.1%), and Transportation & Warehousing (26 | 8.1%).
Employment Industries by Sex in Bailey s Prairie
The Bailey s Prairie industries that see more men than women are Mining, Quarrying, & Extraction (100.0%), Utilities (100.0%), and Professional & Scientific (100.0%), whereas the industries that tend to have a higher number of women are Finance & Insurance (100.0%), Enterprise Management (100.0%), and Educational Services (100.0%).
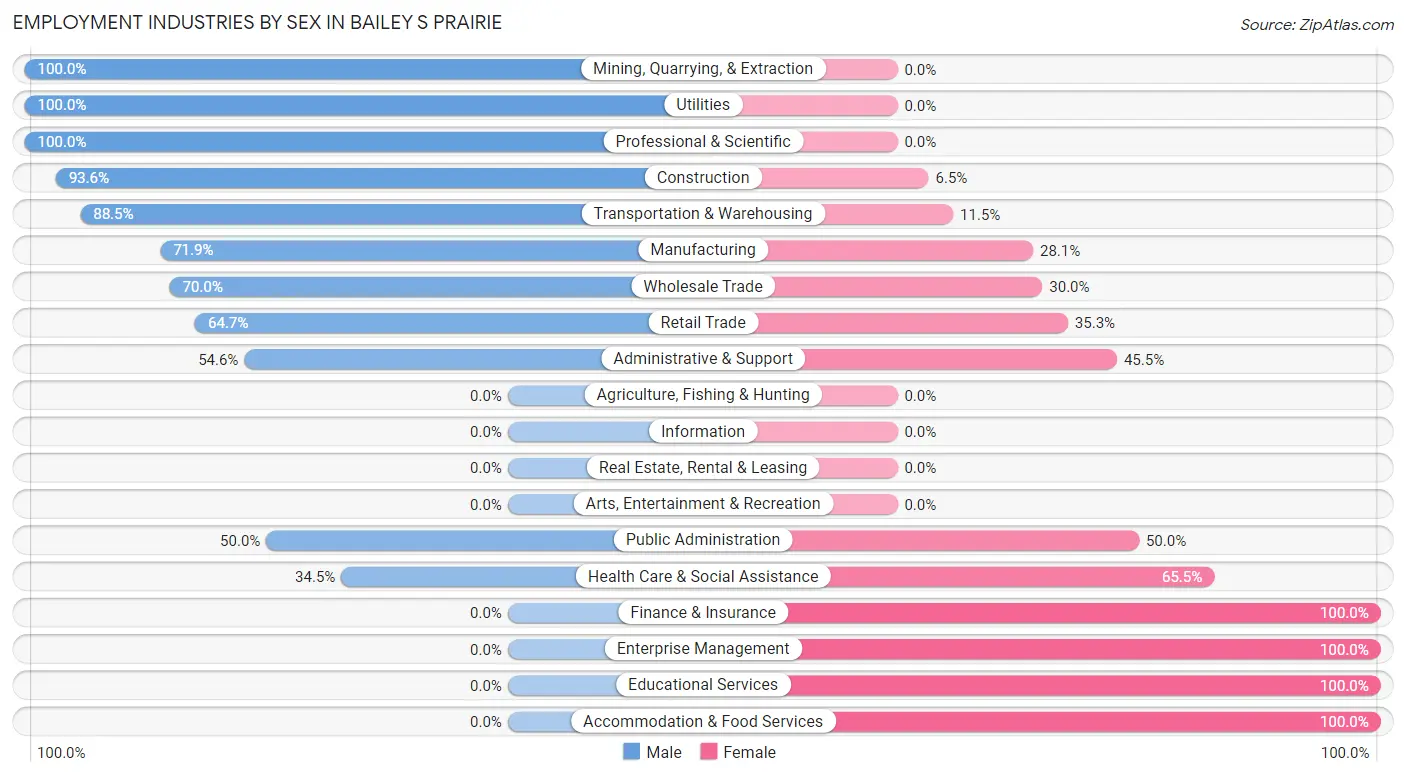
| Industry | Male | Female |
| Agriculture, Fishing & Hunting | 0 (0.0%) | 0 (0.0%) |
| Mining, Quarrying, & Extraction | 11 (100.0%) | 0 (0.0%) |
| Construction | 29 (93.5%) | 2 (6.5%) |
| Manufacturing | 41 (71.9%) | 16 (28.1%) |
| Wholesale Trade | 14 (70.0%) | 6 (30.0%) |
| Retail Trade | 11 (64.7%) | 6 (35.3%) |
| Transportation & Warehousing | 23 (88.5%) | 3 (11.5%) |
| Utilities | 20 (100.0%) | 0 (0.0%) |
| Information | 0 (0.0%) | 0 (0.0%) |
| Finance & Insurance | 0 (0.0%) | 10 (100.0%) |
| Real Estate, Rental & Leasing | 0 (0.0%) | 0 (0.0%) |
| Professional & Scientific | 10 (100.0%) | 0 (0.0%) |
| Enterprise Management | 0 (0.0%) | 2 (100.0%) |
| Administrative & Support | 6 (54.5%) | 5 (45.5%) |
| Educational Services | 0 (0.0%) | 32 (100.0%) |
| Health Care & Social Assistance | 10 (34.5%) | 19 (65.5%) |
| Arts, Entertainment & Recreation | 0 (0.0%) | 0 (0.0%) |
| Accommodation & Food Services | 0 (0.0%) | 5 (100.0%) |
| Public Administration | 8 (50.0%) | 8 (50.0%) |
| Total | 191 (59.7%) | 129 (40.3%) |
Education in Bailey s Prairie
School Enrollment in Bailey s Prairie
The most common levels of schooling among the 173 students in Bailey s Prairie are high school (82 | 47.4%), college / undergraduate (39 | 22.5%), and elementary school (27 | 15.6%).
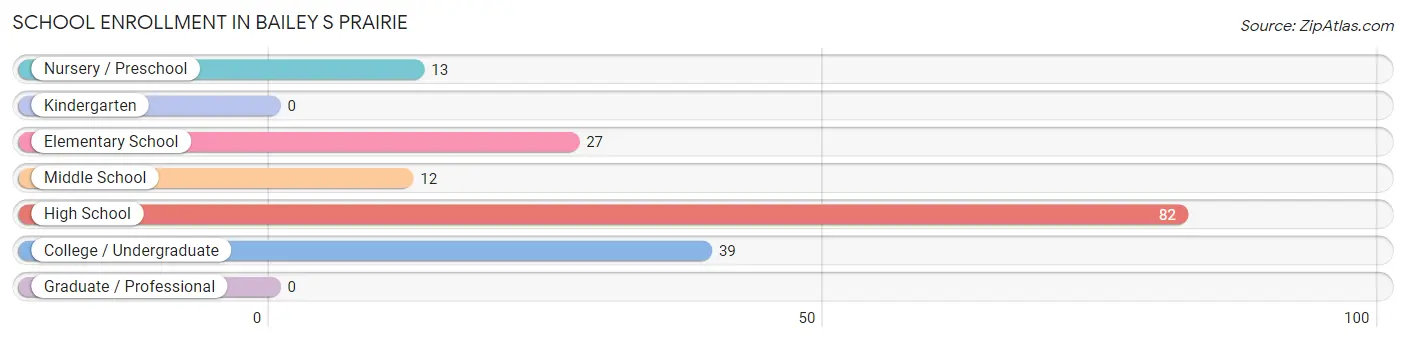
| School Level | # Students | % Students |
| Nursery / Preschool | 13 | 7.5% |
| Kindergarten | 0 | 0.0% |
| Elementary School | 27 | 15.6% |
| Middle School | 12 | 6.9% |
| High School | 82 | 47.4% |
| College / Undergraduate | 39 | 22.5% |
| Graduate / Professional | 0 | 0.0% |
| Total | 173 | 100.0% |
School Enrollment by Age by Funding Source in Bailey s Prairie
Out of a total of 173 students who are enrolled in schools in Bailey s Prairie, 49 (28.3%) attend a private institution, while the remaining 124 (71.7%) are enrolled in public schools. The age group of 3 to 4 year olds has the highest likelihood of being enrolled in private schools, with 12 (92.3% in the age bracket) enrolled. Conversely, the age group of 20 to 24 year olds has the lowest likelihood of being enrolled in a private school, with 18 (100.0% in the age bracket) attending a public institution.
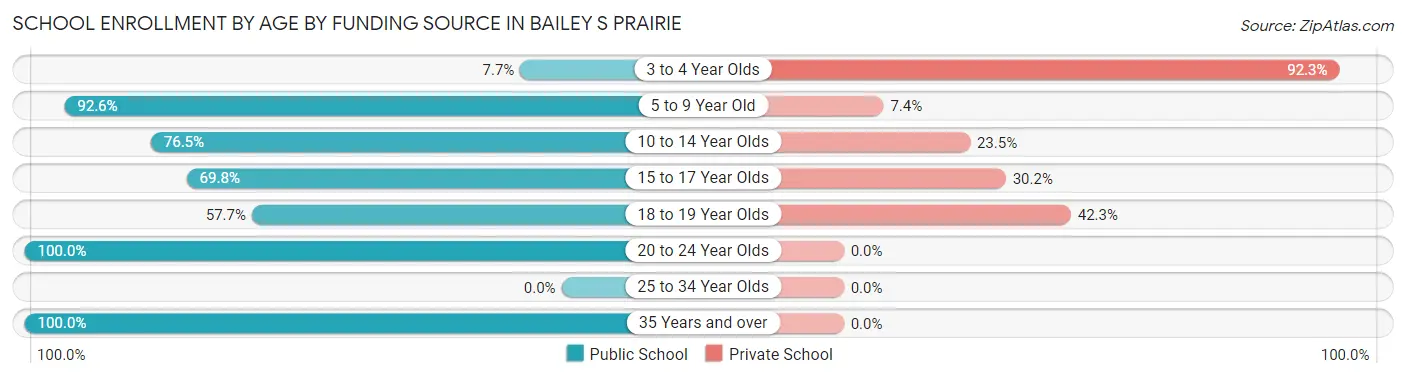
| Age Bracket | Public School | Private School |
| 3 to 4 Year Olds | 1 (7.7%) | 12 (92.3%) |
| 5 to 9 Year Old | 25 (92.6%) | 2 (7.4%) |
| 10 to 14 Year Olds | 26 (76.5%) | 8 (23.5%) |
| 15 to 17 Year Olds | 37 (69.8%) | 16 (30.2%) |
| 18 to 19 Year Olds | 15 (57.7%) | 11 (42.3%) |
| 20 to 24 Year Olds | 18 (100.0%) | 0 (0.0%) |
| 25 to 34 Year Olds | 0 (0.0%) | 0 (0.0%) |
| 35 Years and over | 2 (100.0%) | 0 (0.0%) |
| Total | 124 (71.7%) | 49 (28.3%) |
Educational Attainment by Field of Study in Bailey s Prairie
Education (29 | 20.7%), engineering (24 | 17.1%), arts & humanities (21 | 15.0%), bio, nature & agricultural (15 | 10.7%), and physical & health sciences (13 | 9.3%) are the most common fields of study among 140 individuals in Bailey s Prairie who have obtained a bachelor's degree or higher.
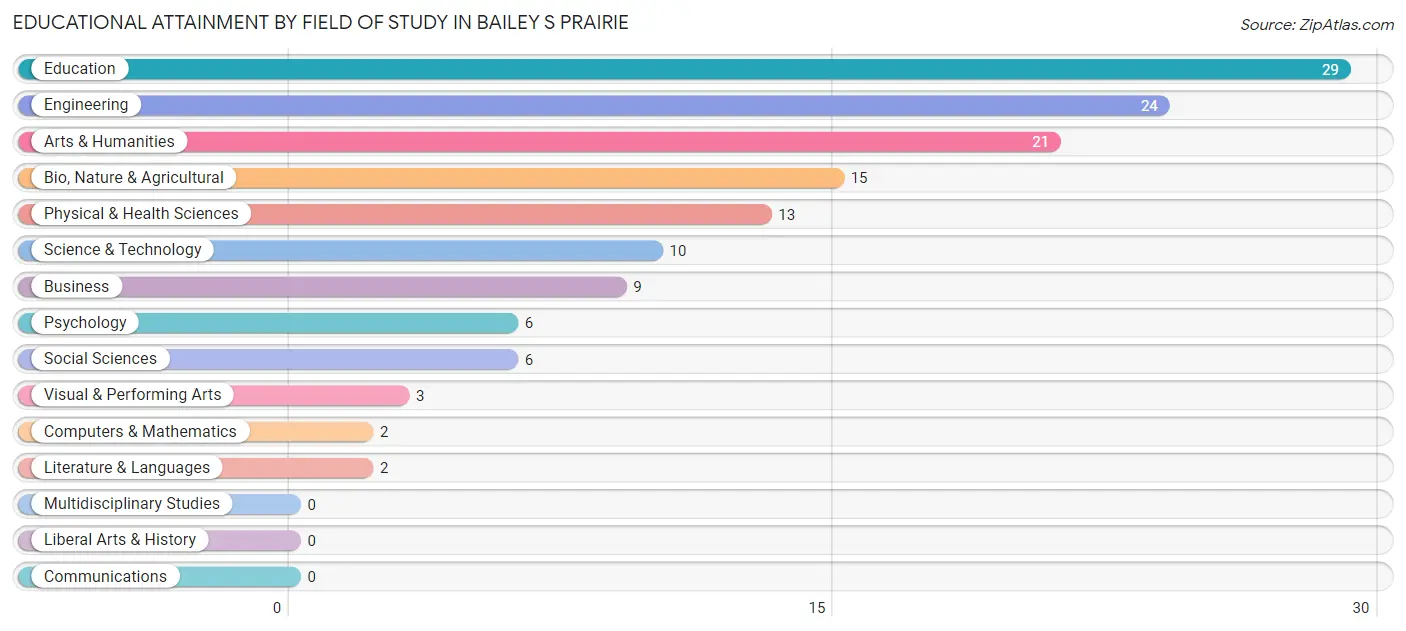
| Field of Study | # Graduates | % Graduates |
| Computers & Mathematics | 2 | 1.4% |
| Bio, Nature & Agricultural | 15 | 10.7% |
| Physical & Health Sciences | 13 | 9.3% |
| Psychology | 6 | 4.3% |
| Social Sciences | 6 | 4.3% |
| Engineering | 24 | 17.1% |
| Multidisciplinary Studies | 0 | 0.0% |
| Science & Technology | 10 | 7.1% |
| Business | 9 | 6.4% |
| Education | 29 | 20.7% |
| Literature & Languages | 2 | 1.4% |
| Liberal Arts & History | 0 | 0.0% |
| Visual & Performing Arts | 3 | 2.1% |
| Communications | 0 | 0.0% |
| Arts & Humanities | 21 | 15.0% |
| Total | 140 | 100.0% |
Transportation & Commute in Bailey s Prairie
Vehicle Availability by Sex in Bailey s Prairie
The most prevalent vehicle ownership categories in Bailey s Prairie are males with 2 vehicles (63, accounting for 33.3%) and females with 2 vehicles (39, making up 50.0%).
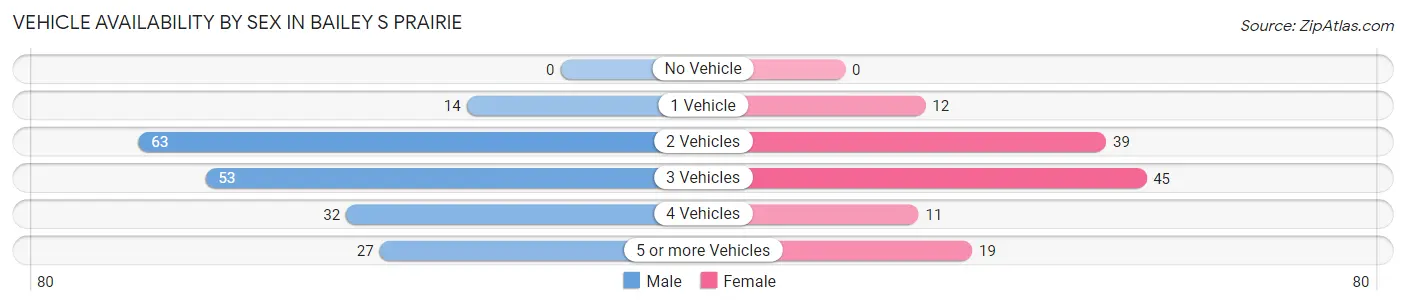
| Vehicles Available | Male | Female |
| No Vehicle | 0 (0.0%) | 0 (0.0%) |
| 1 Vehicle | 14 (7.4%) | 12 (9.5%) |
| 2 Vehicles | 63 (33.3%) | 39 (30.9%) |
| 3 Vehicles | 53 (28.0%) | 45 (35.7%) |
| 4 Vehicles | 32 (16.9%) | 11 (8.7%) |
| 5 or more Vehicles | 27 (14.3%) | 19 (15.1%) |
| Total | 189 (100.0%) | 126 (100.0%) |
Commute Time in Bailey s Prairie
The most frequently occuring commute durations in Bailey s Prairie are 30 to 34 minutes (82 commuters, 28.2%), 20 to 24 minutes (62 commuters, 21.3%), and 5 to 9 minutes (29 commuters, 10.0%).
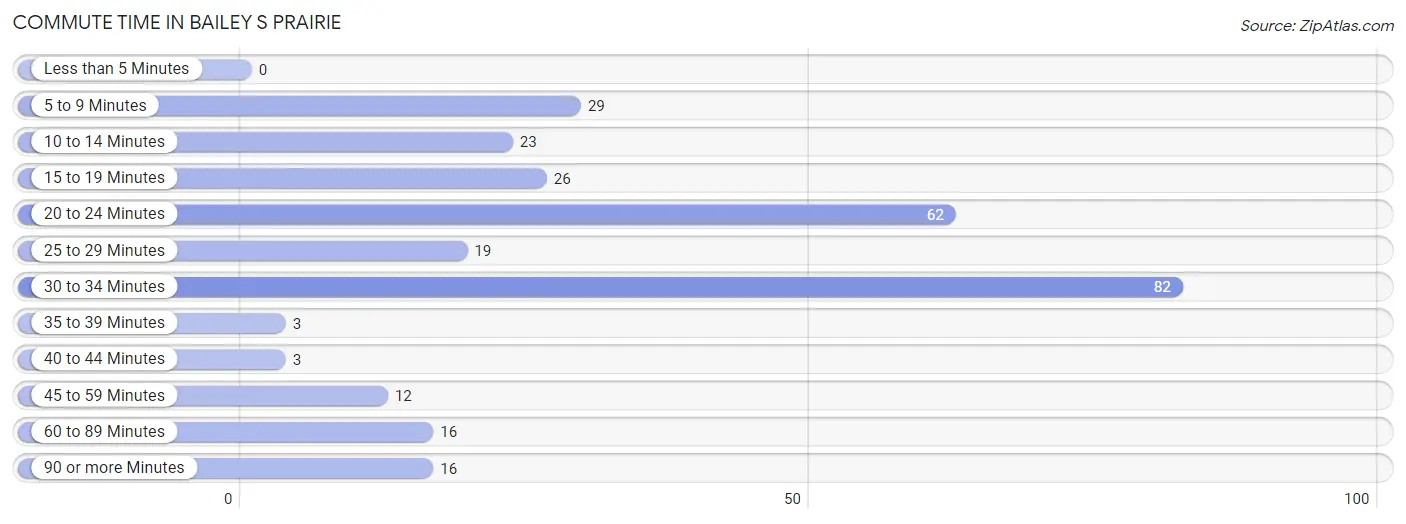
| Commute Time | # Commuters | % Commuters |
| Less than 5 Minutes | 0 | 0.0% |
| 5 to 9 Minutes | 29 | 10.0% |
| 10 to 14 Minutes | 23 | 7.9% |
| 15 to 19 Minutes | 26 | 8.9% |
| 20 to 24 Minutes | 62 | 21.3% |
| 25 to 29 Minutes | 19 | 6.5% |
| 30 to 34 Minutes | 82 | 28.2% |
| 35 to 39 Minutes | 3 | 1.0% |
| 40 to 44 Minutes | 3 | 1.0% |
| 45 to 59 Minutes | 12 | 4.1% |
| 60 to 89 Minutes | 16 | 5.5% |
| 90 or more Minutes | 16 | 5.5% |
Commute Time by Sex in Bailey s Prairie
The most common commute times in Bailey s Prairie are 30 to 34 minutes (54 commuters, 30.7%) for males and 30 to 34 minutes (28 commuters, 24.3%) for females.
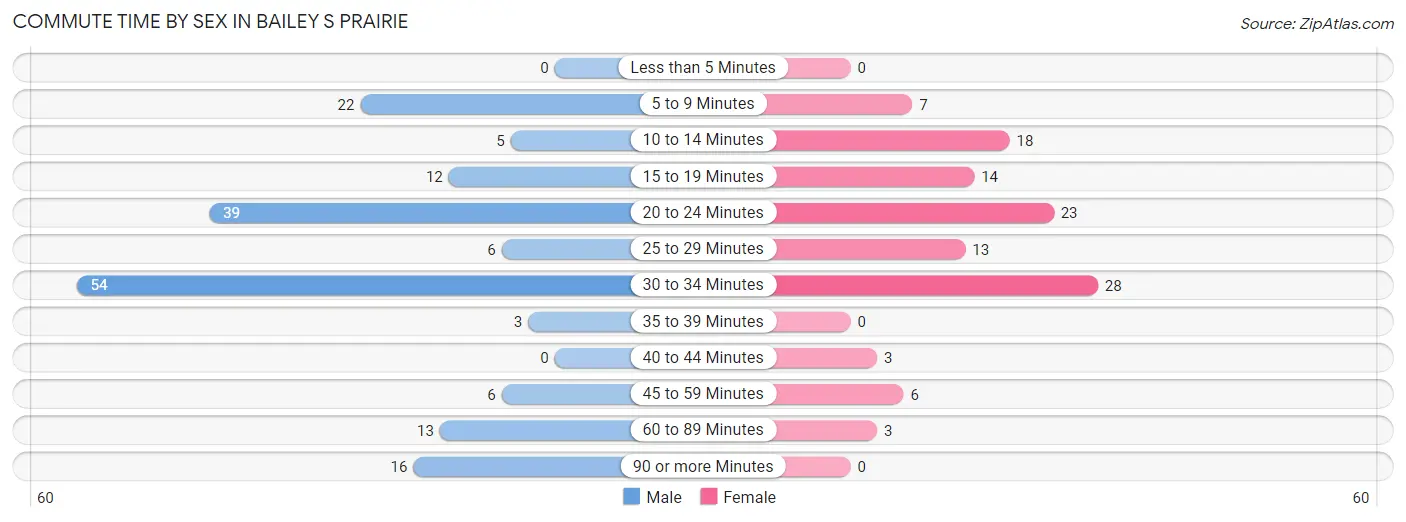
| Commute Time | Male | Female |
| Less than 5 Minutes | 0 (0.0%) | 0 (0.0%) |
| 5 to 9 Minutes | 22 (12.5%) | 7 (6.1%) |
| 10 to 14 Minutes | 5 (2.8%) | 18 (15.7%) |
| 15 to 19 Minutes | 12 (6.8%) | 14 (12.2%) |
| 20 to 24 Minutes | 39 (22.2%) | 23 (20.0%) |
| 25 to 29 Minutes | 6 (3.4%) | 13 (11.3%) |
| 30 to 34 Minutes | 54 (30.7%) | 28 (24.3%) |
| 35 to 39 Minutes | 3 (1.7%) | 0 (0.0%) |
| 40 to 44 Minutes | 0 (0.0%) | 3 (2.6%) |
| 45 to 59 Minutes | 6 (3.4%) | 6 (5.2%) |
| 60 to 89 Minutes | 13 (7.4%) | 3 (2.6%) |
| 90 or more Minutes | 16 (9.1%) | 0 (0.0%) |
Time of Departure to Work by Sex in Bailey s Prairie
The most frequent times of departure to work in Bailey s Prairie are 8:00 AM to 8:29 AM (38, 21.6%) for males and 7:00 AM to 7:29 AM (29, 25.2%) for females.
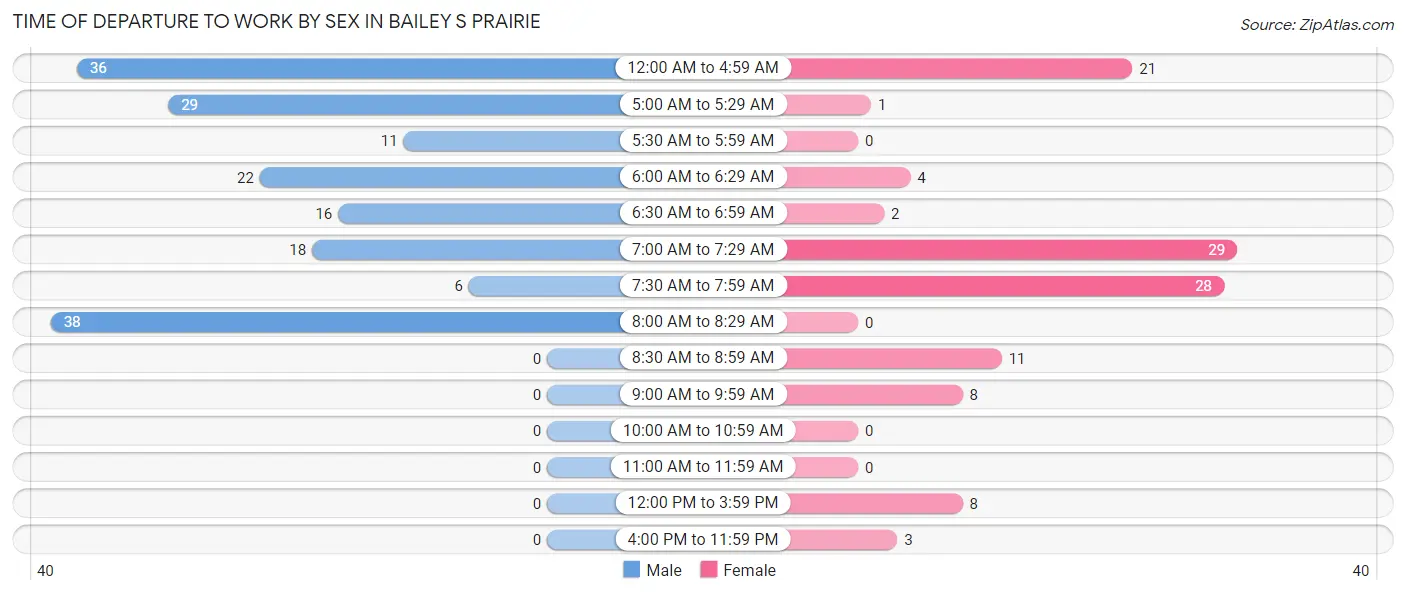
| Time of Departure | Male | Female |
| 12:00 AM to 4:59 AM | 36 (20.4%) | 21 (18.3%) |
| 5:00 AM to 5:29 AM | 29 (16.5%) | 1 (0.9%) |
| 5:30 AM to 5:59 AM | 11 (6.2%) | 0 (0.0%) |
| 6:00 AM to 6:29 AM | 22 (12.5%) | 4 (3.5%) |
| 6:30 AM to 6:59 AM | 16 (9.1%) | 2 (1.7%) |
| 7:00 AM to 7:29 AM | 18 (10.2%) | 29 (25.2%) |
| 7:30 AM to 7:59 AM | 6 (3.4%) | 28 (24.3%) |
| 8:00 AM to 8:29 AM | 38 (21.6%) | 0 (0.0%) |
| 8:30 AM to 8:59 AM | 0 (0.0%) | 11 (9.6%) |
| 9:00 AM to 9:59 AM | 0 (0.0%) | 8 (7.0%) |
| 10:00 AM to 10:59 AM | 0 (0.0%) | 0 (0.0%) |
| 11:00 AM to 11:59 AM | 0 (0.0%) | 0 (0.0%) |
| 12:00 PM to 3:59 PM | 0 (0.0%) | 8 (7.0%) |
| 4:00 PM to 11:59 PM | 0 (0.0%) | 3 (2.6%) |
| Total | 176 (100.0%) | 115 (100.0%) |
Housing Occupancy in Bailey s Prairie
Occupancy by Ownership in Bailey s Prairie
Of the total 300 dwellings in Bailey s Prairie, owner-occupied units account for 275 (91.7%), while renter-occupied units make up 25 (8.3%).
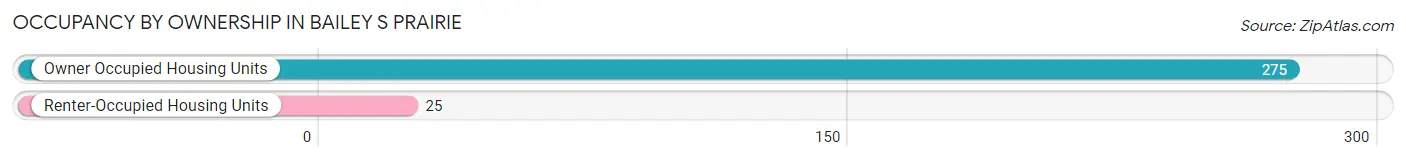
| Occupancy | # Housing Units | % Housing Units |
| Owner Occupied Housing Units | 275 | 91.7% |
| Renter-Occupied Housing Units | 25 | 8.3% |
| Total Occupied Housing Units | 300 | 100.0% |
Occupancy by Household Size in Bailey s Prairie
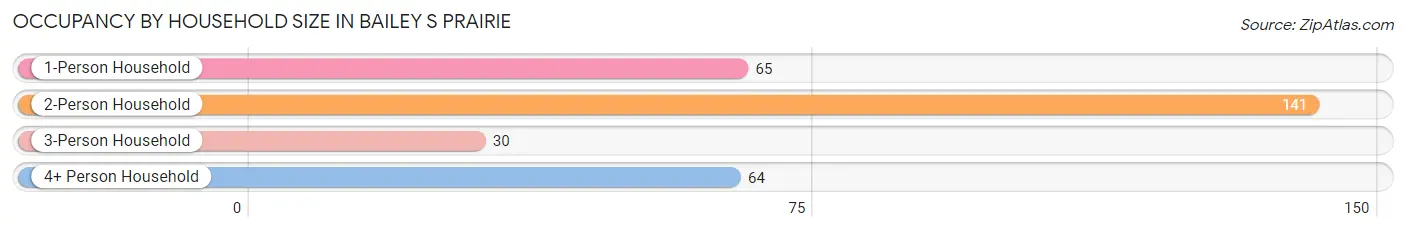
| Household Size | # Housing Units | % Housing Units |
| 1-Person Household | 65 | 21.7% |
| 2-Person Household | 141 | 47.0% |
| 3-Person Household | 30 | 10.0% |
| 4+ Person Household | 64 | 21.3% |
| Total Housing Units | 300 | 100.0% |
Occupancy by Ownership by Household Size in Bailey s Prairie
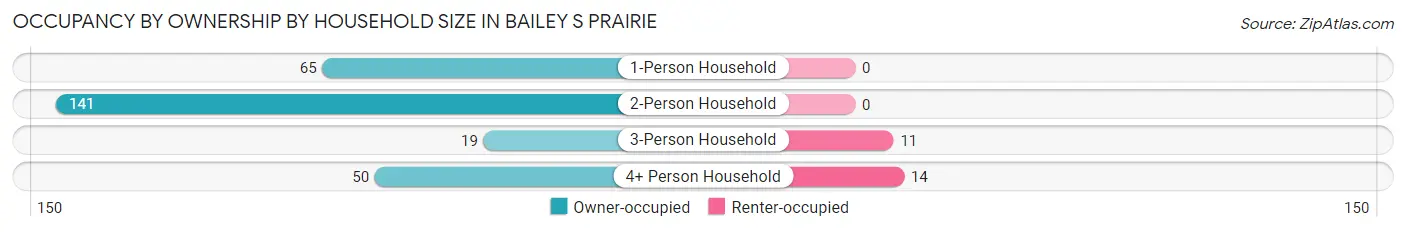
| Household Size | Owner-occupied | Renter-occupied |
| 1-Person Household | 65 (100.0%) | 0 (0.0%) |
| 2-Person Household | 141 (100.0%) | 0 (0.0%) |
| 3-Person Household | 19 (63.3%) | 11 (36.7%) |
| 4+ Person Household | 50 (78.1%) | 14 (21.9%) |
| Total Housing Units | 275 (91.7%) | 25 (8.3%) |
Occupancy by Educational Attainment in Bailey s Prairie
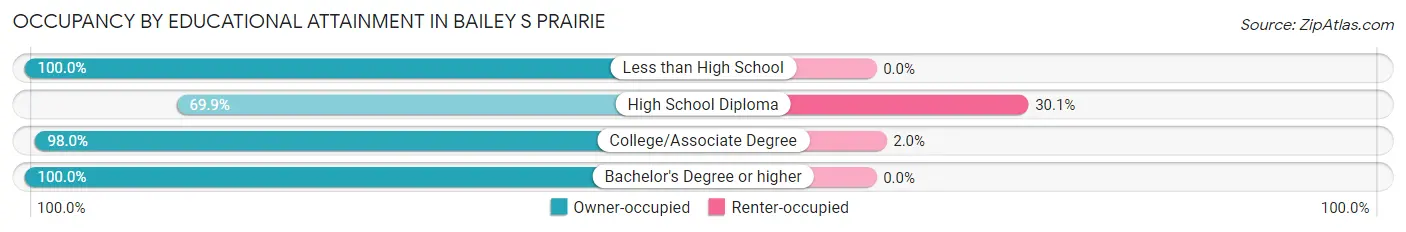
| Household Size | Owner-occupied | Renter-occupied |
| Less than High School | 7 (100.0%) | 0 (0.0%) |
| High School Diploma | 51 (69.9%) | 22 (30.1%) |
| College/Associate Degree | 147 (98.0%) | 3 (2.0%) |
| Bachelor's Degree or higher | 70 (100.0%) | 0 (0.0%) |
Occupancy by Age of Householder in Bailey s Prairie
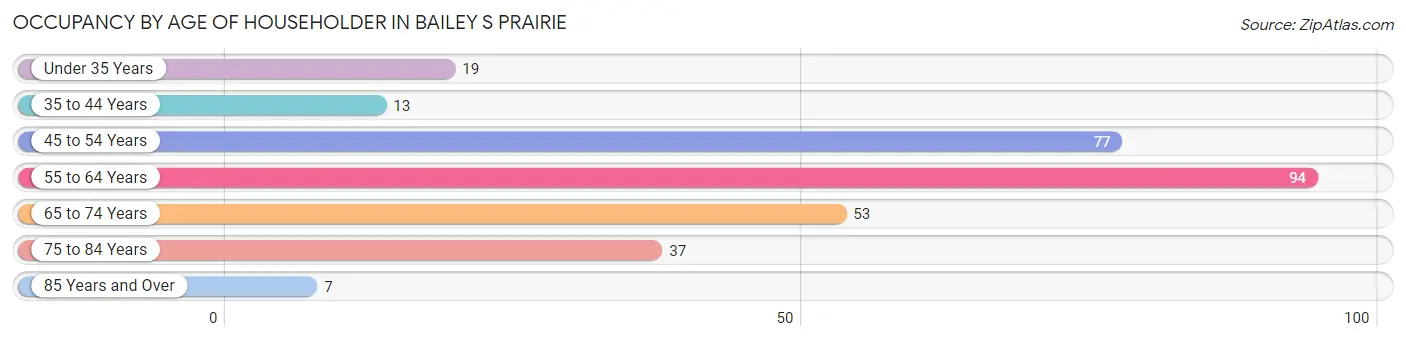
| Age Bracket | # Households | % Households |
| Under 35 Years | 19 | 6.3% |
| 35 to 44 Years | 13 | 4.3% |
| 45 to 54 Years | 77 | 25.7% |
| 55 to 64 Years | 94 | 31.3% |
| 65 to 74 Years | 53 | 17.7% |
| 75 to 84 Years | 37 | 12.3% |
| 85 Years and Over | 7 | 2.3% |
| Total | 300 | 100.0% |
Housing Finances in Bailey s Prairie
Median Income by Occupancy in Bailey s Prairie
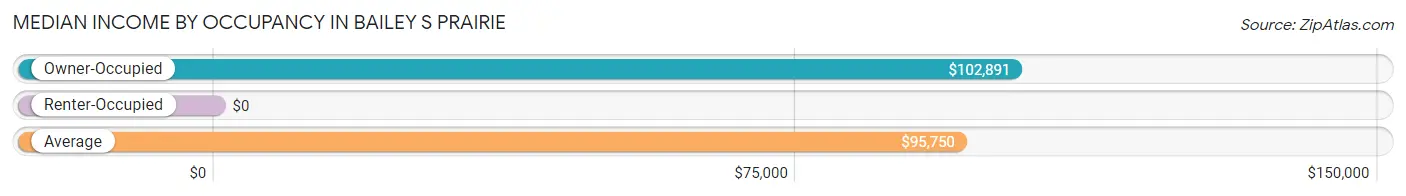
| Occupancy Type | # Households | Median Income |
| Owner-Occupied | 275 (91.7%) | $102,891 |
| Renter-Occupied | 25 (8.3%) | $0 |
| Average | 300 (100.0%) | $95,750 |
Occupancy by Householder Income Bracket in Bailey s Prairie
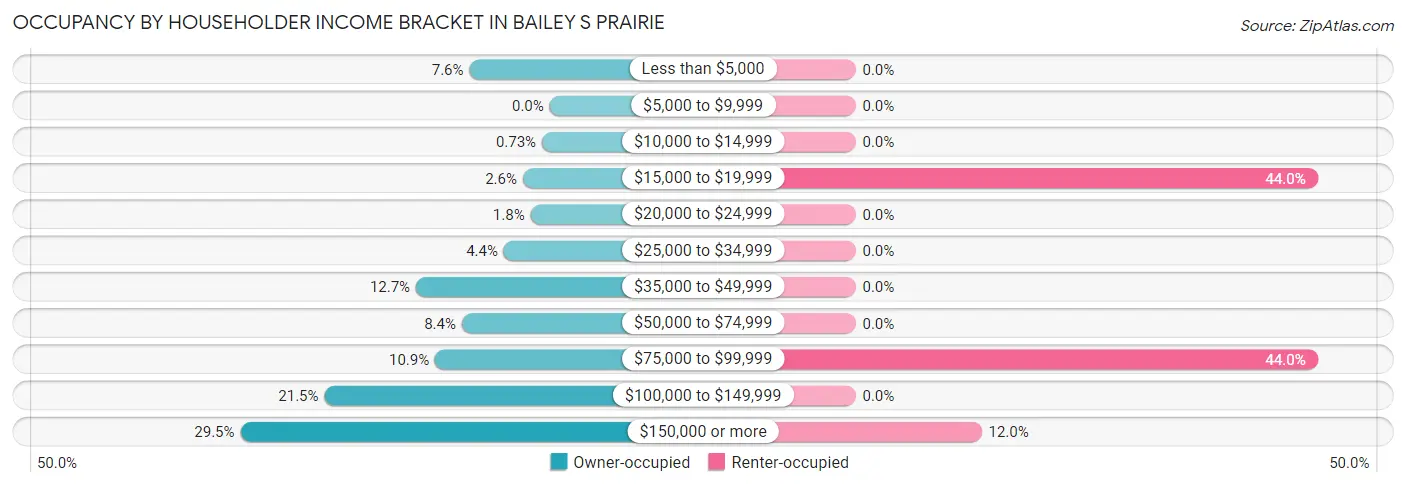
| Income Bracket | Owner-occupied | Renter-occupied |
| Less than $5,000 | 21 (7.6%) | 0 (0.0%) |
| $5,000 to $9,999 | 0 (0.0%) | 0 (0.0%) |
| $10,000 to $14,999 | 2 (0.7%) | 0 (0.0%) |
| $15,000 to $19,999 | 7 (2.5%) | 11 (44.0%) |
| $20,000 to $24,999 | 5 (1.8%) | 0 (0.0%) |
| $25,000 to $34,999 | 12 (4.4%) | 0 (0.0%) |
| $35,000 to $49,999 | 35 (12.7%) | 0 (0.0%) |
| $50,000 to $74,999 | 23 (8.4%) | 0 (0.0%) |
| $75,000 to $99,999 | 30 (10.9%) | 11 (44.0%) |
| $100,000 to $149,999 | 59 (21.4%) | 0 (0.0%) |
| $150,000 or more | 81 (29.4%) | 3 (12.0%) |
| Total | 275 (100.0%) | 25 (100.0%) |
Monthly Housing Cost Tiers in Bailey s Prairie
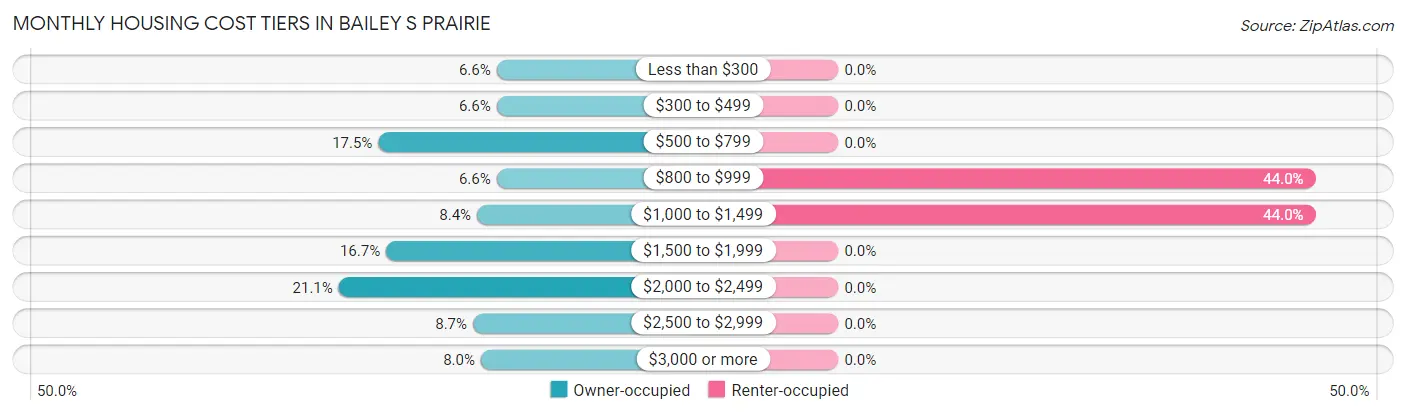
| Monthly Cost | Owner-occupied | Renter-occupied |
| Less than $300 | 18 (6.6%) | 0 (0.0%) |
| $300 to $499 | 18 (6.6%) | 0 (0.0%) |
| $500 to $799 | 48 (17.4%) | 0 (0.0%) |
| $800 to $999 | 18 (6.6%) | 11 (44.0%) |
| $1,000 to $1,499 | 23 (8.4%) | 11 (44.0%) |
| $1,500 to $1,999 | 46 (16.7%) | 0 (0.0%) |
| $2,000 to $2,499 | 58 (21.1%) | 0 (0.0%) |
| $2,500 to $2,999 | 24 (8.7%) | 0 (0.0%) |
| $3,000 or more | 22 (8.0%) | 0 (0.0%) |
| Total | 275 (100.0%) | 25 (100.0%) |
Physical Housing Characteristics in Bailey s Prairie
Housing Structures in Bailey s Prairie
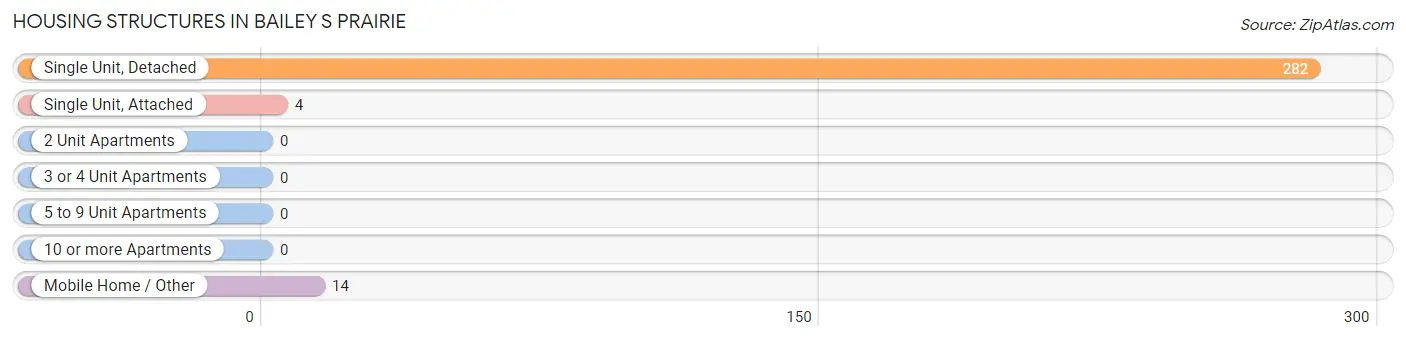
| Structure Type | # Housing Units | % Housing Units |
| Single Unit, Detached | 282 | 94.0% |
| Single Unit, Attached | 4 | 1.3% |
| 2 Unit Apartments | 0 | 0.0% |
| 3 or 4 Unit Apartments | 0 | 0.0% |
| 5 to 9 Unit Apartments | 0 | 0.0% |
| 10 or more Apartments | 0 | 0.0% |
| Mobile Home / Other | 14 | 4.7% |
| Total | 300 | 100.0% |
Housing Structures by Occupancy in Bailey s Prairie
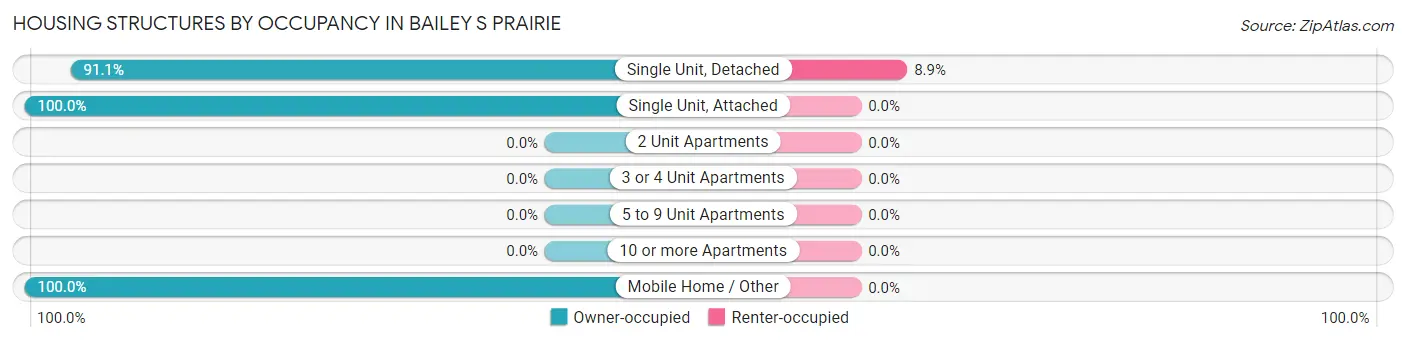
| Structure Type | Owner-occupied | Renter-occupied |
| Single Unit, Detached | 257 (91.1%) | 25 (8.9%) |
| Single Unit, Attached | 4 (100.0%) | 0 (0.0%) |
| 2 Unit Apartments | 0 (0.0%) | 0 (0.0%) |
| 3 or 4 Unit Apartments | 0 (0.0%) | 0 (0.0%) |
| 5 to 9 Unit Apartments | 0 (0.0%) | 0 (0.0%) |
| 10 or more Apartments | 0 (0.0%) | 0 (0.0%) |
| Mobile Home / Other | 14 (100.0%) | 0 (0.0%) |
| Total | 275 (91.7%) | 25 (8.3%) |
Housing Structures by Number of Rooms in Bailey s Prairie
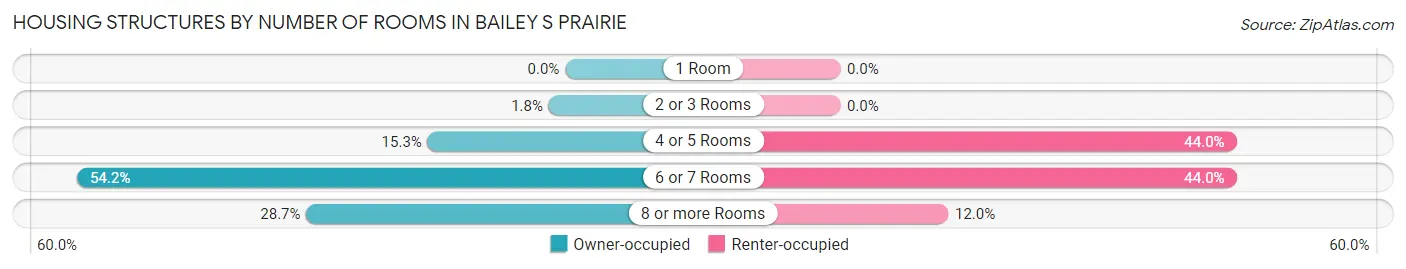
| Number of Rooms | Owner-occupied | Renter-occupied |
| 1 Room | 0 (0.0%) | 0 (0.0%) |
| 2 or 3 Rooms | 5 (1.8%) | 0 (0.0%) |
| 4 or 5 Rooms | 42 (15.3%) | 11 (44.0%) |
| 6 or 7 Rooms | 149 (54.2%) | 11 (44.0%) |
| 8 or more Rooms | 79 (28.7%) | 3 (12.0%) |
| Total | 275 (100.0%) | 25 (100.0%) |
Housing Structure by Heating Type in Bailey s Prairie
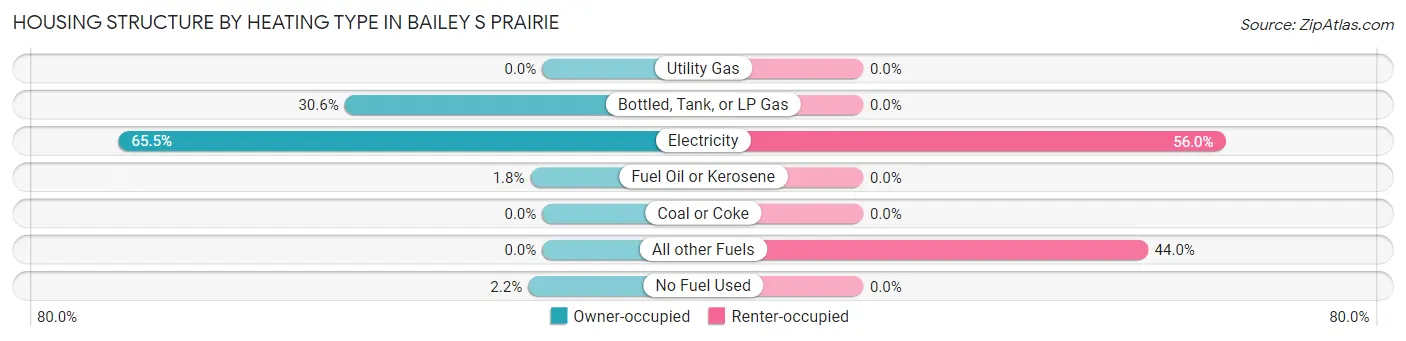
| Heating Type | Owner-occupied | Renter-occupied |
| Utility Gas | 0 (0.0%) | 0 (0.0%) |
| Bottled, Tank, or LP Gas | 84 (30.5%) | 0 (0.0%) |
| Electricity | 180 (65.4%) | 14 (56.0%) |
| Fuel Oil or Kerosene | 5 (1.8%) | 0 (0.0%) |
| Coal or Coke | 0 (0.0%) | 0 (0.0%) |
| All other Fuels | 0 (0.0%) | 11 (44.0%) |
| No Fuel Used | 6 (2.2%) | 0 (0.0%) |
| Total | 275 (100.0%) | 25 (100.0%) |
Household Vehicle Usage in Bailey s Prairie
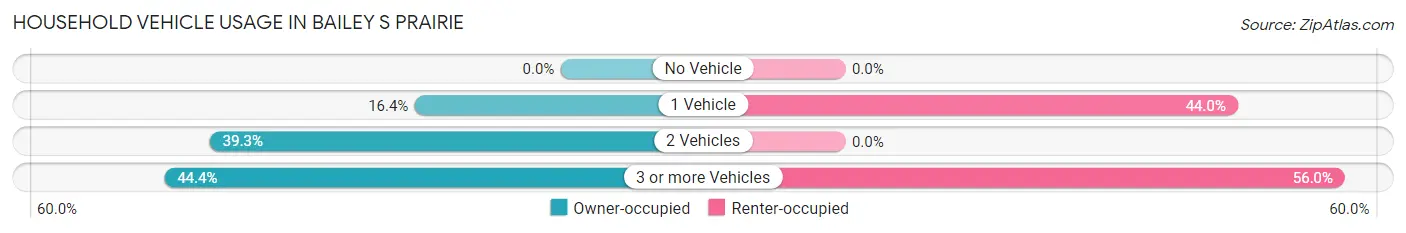
| Vehicles per Household | Owner-occupied | Renter-occupied |
| No Vehicle | 0 (0.0%) | 0 (0.0%) |
| 1 Vehicle | 45 (16.4%) | 11 (44.0%) |
| 2 Vehicles | 108 (39.3%) | 0 (0.0%) |
| 3 or more Vehicles | 122 (44.4%) | 14 (56.0%) |
| Total | 275 (100.0%) | 25 (100.0%) |
Real Estate & Mortgages in Bailey s Prairie
Real Estate and Mortgage Overview in Bailey s Prairie
| Characteristic | Without Mortgage | With Mortgage |
| Housing Units | 121 | 154 |
| Median Property Value | $267,900 | $349,200 |
| Median Household Income | $65,208 | $54 |
| Monthly Housing Costs | $725 | $22 |
| Real Estate Taxes | $2,621 | $4 |
Property Value by Mortgage Status in Bailey s Prairie
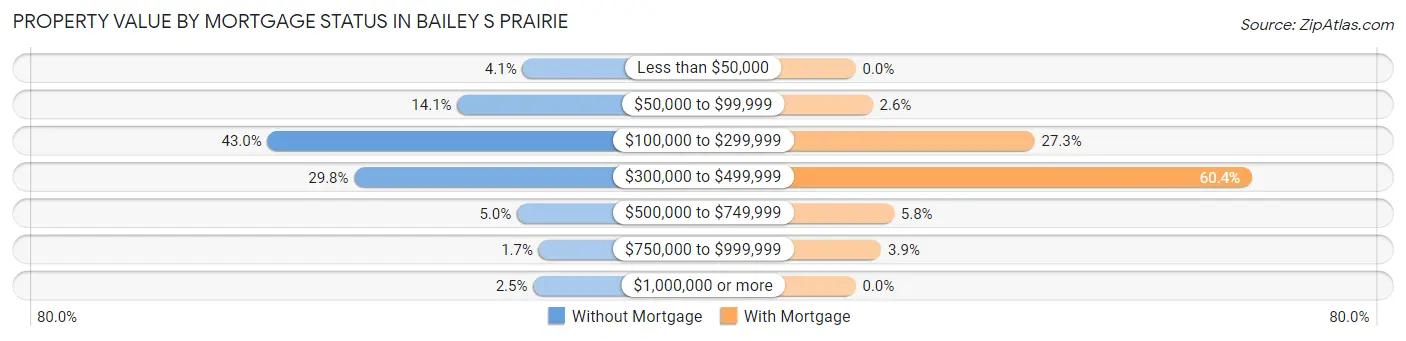
| Property Value | Without Mortgage | With Mortgage |
| Less than $50,000 | 5 (4.1%) | 0 (0.0%) |
| $50,000 to $99,999 | 17 (14.1%) | 4 (2.6%) |
| $100,000 to $299,999 | 52 (43.0%) | 42 (27.3%) |
| $300,000 to $499,999 | 36 (29.7%) | 93 (60.4%) |
| $500,000 to $749,999 | 6 (5.0%) | 9 (5.8%) |
| $750,000 to $999,999 | 2 (1.7%) | 6 (3.9%) |
| $1,000,000 or more | 3 (2.5%) | 0 (0.0%) |
| Total | 121 (100.0%) | 154 (100.0%) |
Household Income by Mortgage Status in Bailey s Prairie
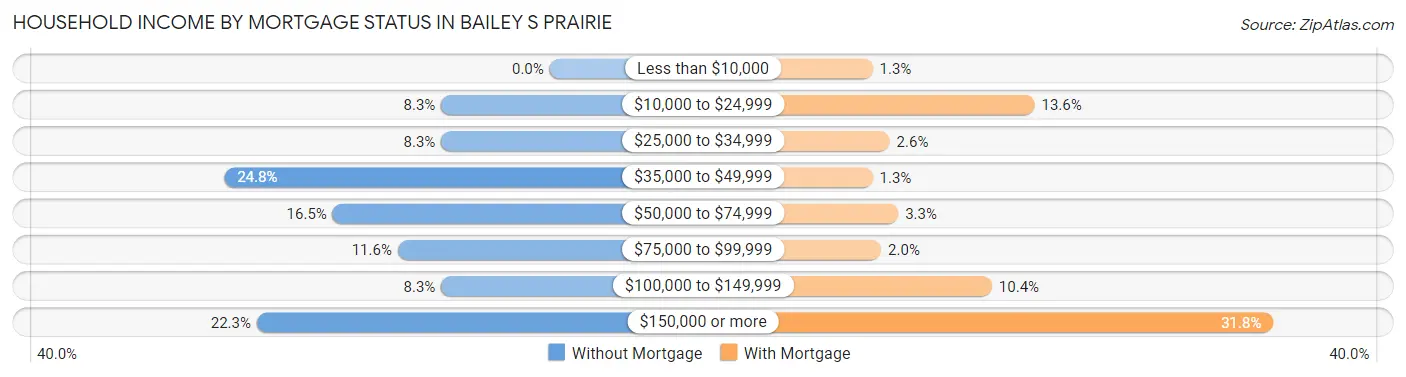
| Household Income | Without Mortgage | With Mortgage |
| Less than $10,000 | 0 (0.0%) | 2 (1.3%) |
| $10,000 to $24,999 | 10 (8.3%) | 21 (13.6%) |
| $25,000 to $34,999 | 10 (8.3%) | 4 (2.6%) |
| $35,000 to $49,999 | 30 (24.8%) | 2 (1.3%) |
| $50,000 to $74,999 | 20 (16.5%) | 5 (3.3%) |
| $75,000 to $99,999 | 14 (11.6%) | 3 (1.9%) |
| $100,000 to $149,999 | 10 (8.3%) | 16 (10.4%) |
| $150,000 or more | 27 (22.3%) | 49 (31.8%) |
| Total | 121 (100.0%) | 154 (100.0%) |
Property Value to Household Income Ratio in Bailey s Prairie
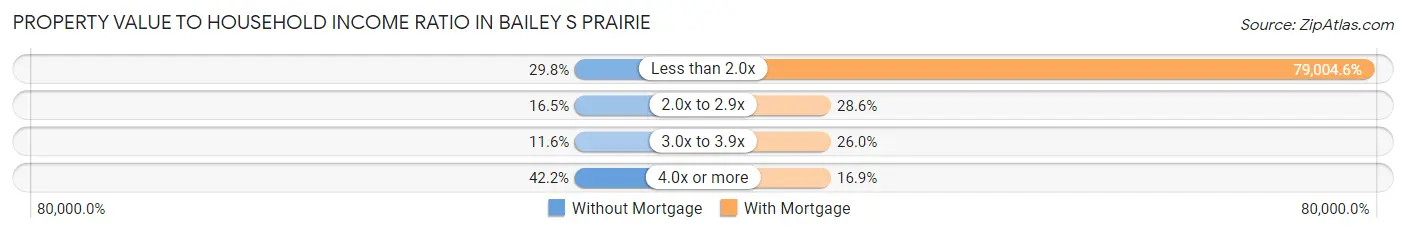
| Value-to-Income Ratio | Without Mortgage | With Mortgage |
| Less than 2.0x | 36 (29.7%) | 121,667 (79,004.5%) |
| 2.0x to 2.9x | 20 (16.5%) | 44 (28.6%) |
| 3.0x to 3.9x | 14 (11.6%) | 40 (26.0%) |
| 4.0x or more | 51 (42.1%) | 26 (16.9%) |
| Total | 121 (100.0%) | 154 (100.0%) |
Real Estate Taxes by Mortgage Status in Bailey s Prairie
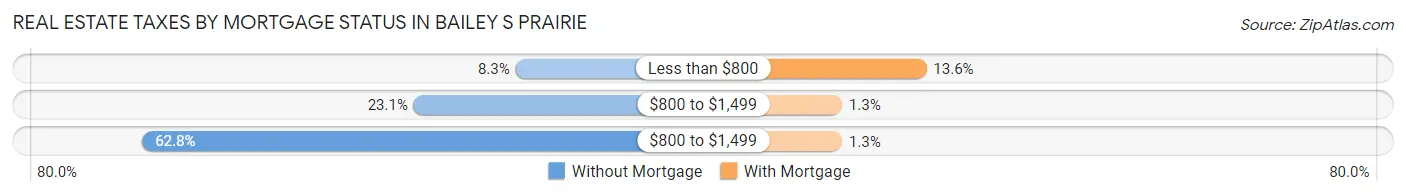
| Property Taxes | Without Mortgage | With Mortgage |
| Less than $800 | 10 (8.3%) | 21 (13.6%) |
| $800 to $1,499 | 28 (23.1%) | 2 (1.3%) |
| $800 to $1,499 | 76 (62.8%) | 2 (1.3%) |
| Total | 121 (100.0%) | 154 (100.0%) |
Health & Disability in Bailey s Prairie
Health Insurance Coverage by Age in Bailey s Prairie
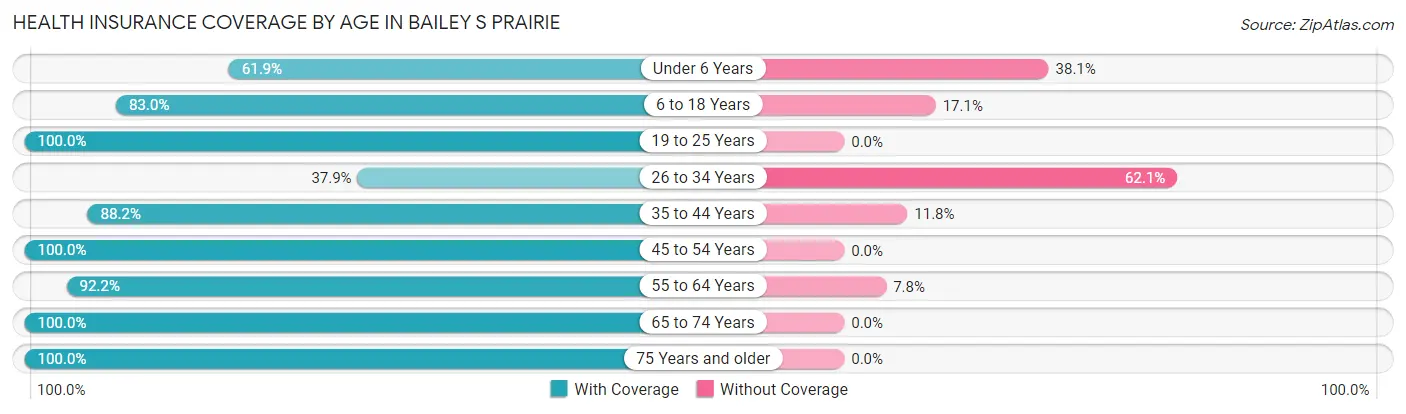
| Age Bracket | With Coverage | Without Coverage |
| Under 6 Years | 13 (61.9%) | 8 (38.1%) |
| 6 to 18 Years | 107 (83.0%) | 22 (17.1%) |
| 19 to 25 Years | 50 (100.0%) | 0 (0.0%) |
| 26 to 34 Years | 11 (37.9%) | 18 (62.1%) |
| 35 to 44 Years | 30 (88.2%) | 4 (11.8%) |
| 45 to 54 Years | 153 (100.0%) | 0 (0.0%) |
| 55 to 64 Years | 165 (92.2%) | 14 (7.8%) |
| 65 to 74 Years | 91 (100.0%) | 0 (0.0%) |
| 75 Years and older | 77 (100.0%) | 0 (0.0%) |
| Total | 697 (91.3%) | 66 (8.6%) |
Health Insurance Coverage by Citizenship Status in Bailey s Prairie
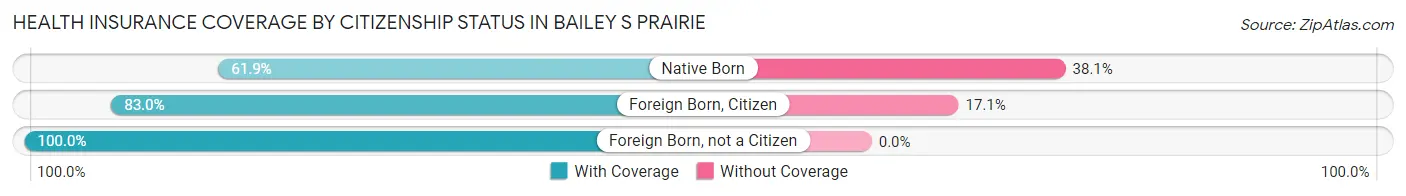
| Citizenship Status | With Coverage | Without Coverage |
| Native Born | 13 (61.9%) | 8 (38.1%) |
| Foreign Born, Citizen | 107 (83.0%) | 22 (17.1%) |
| Foreign Born, not a Citizen | 50 (100.0%) | 0 (0.0%) |
Health Insurance Coverage by Household Income in Bailey s Prairie
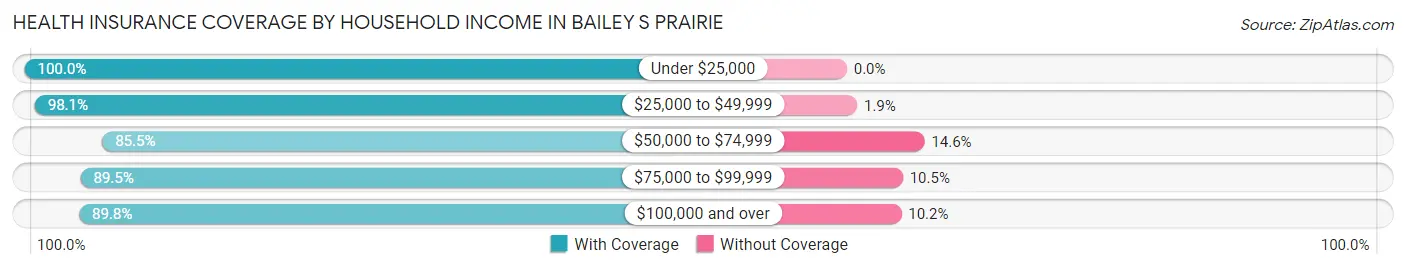
| Household Income | With Coverage | Without Coverage |
| Under $25,000 | 59 (100.0%) | 0 (0.0%) |
| $25,000 to $49,999 | 102 (98.1%) | 2 (1.9%) |
| $50,000 to $74,999 | 47 (85.5%) | 8 (14.5%) |
| $75,000 to $99,999 | 111 (89.5%) | 13 (10.5%) |
| $100,000 and over | 378 (89.8%) | 43 (10.2%) |
Public vs Private Health Insurance Coverage by Age in Bailey s Prairie
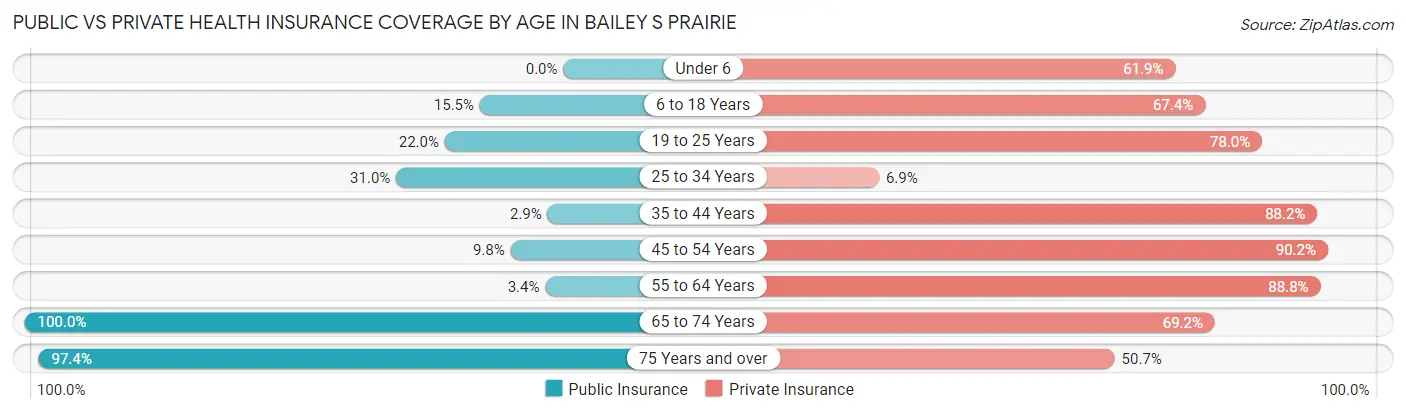
| Age Bracket | Public Insurance | Private Insurance |
| Under 6 | 0 (0.0%) | 13 (61.9%) |
| 6 to 18 Years | 20 (15.5%) | 87 (67.4%) |
| 19 to 25 Years | 11 (22.0%) | 39 (78.0%) |
| 25 to 34 Years | 9 (31.0%) | 2 (6.9%) |
| 35 to 44 Years | 1 (2.9%) | 30 (88.2%) |
| 45 to 54 Years | 15 (9.8%) | 138 (90.2%) |
| 55 to 64 Years | 6 (3.4%) | 159 (88.8%) |
| 65 to 74 Years | 91 (100.0%) | 63 (69.2%) |
| 75 Years and over | 75 (97.4%) | 39 (50.6%) |
| Total | 228 (29.9%) | 570 (74.7%) |
Disability Status by Sex by Age in Bailey s Prairie
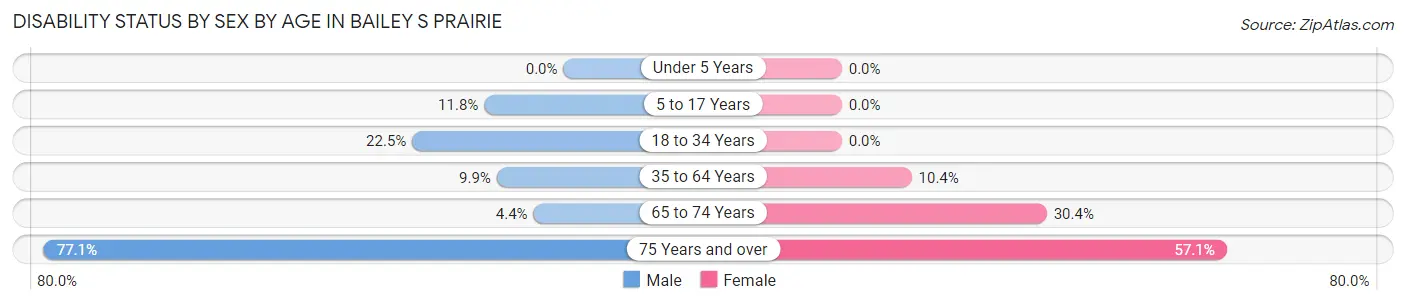
| Age Bracket | Male | Female |
| Under 5 Years | 0 (0.0%) | 0 (0.0%) |
| 5 to 17 Years | 8 (11.8%) | 0 (0.0%) |
| 18 to 34 Years | 11 (22.5%) | 0 (0.0%) |
| 35 to 64 Years | 20 (9.9%) | 17 (10.4%) |
| 65 to 74 Years | 2 (4.4%) | 14 (30.4%) |
| 75 Years and over | 27 (77.1%) | 24 (57.1%) |
Disability Class by Sex by Age in Bailey s Prairie
Disability Class: Hearing Difficulty
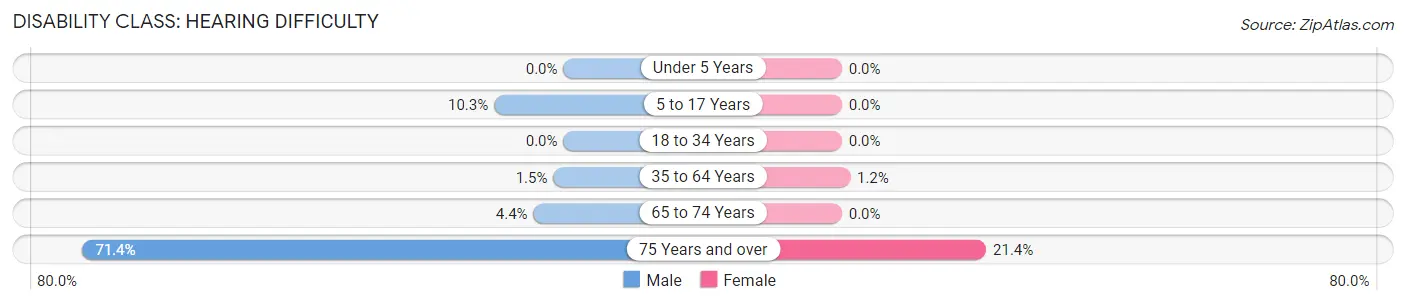
| Age Bracket | Male | Female |
| Under 5 Years | 0 (0.0%) | 0 (0.0%) |
| 5 to 17 Years | 7 (10.3%) | 0 (0.0%) |
| 18 to 34 Years | 0 (0.0%) | 0 (0.0%) |
| 35 to 64 Years | 3 (1.5%) | 2 (1.2%) |
| 65 to 74 Years | 2 (4.4%) | 0 (0.0%) |
| 75 Years and over | 25 (71.4%) | 9 (21.4%) |
Disability Class: Vision Difficulty
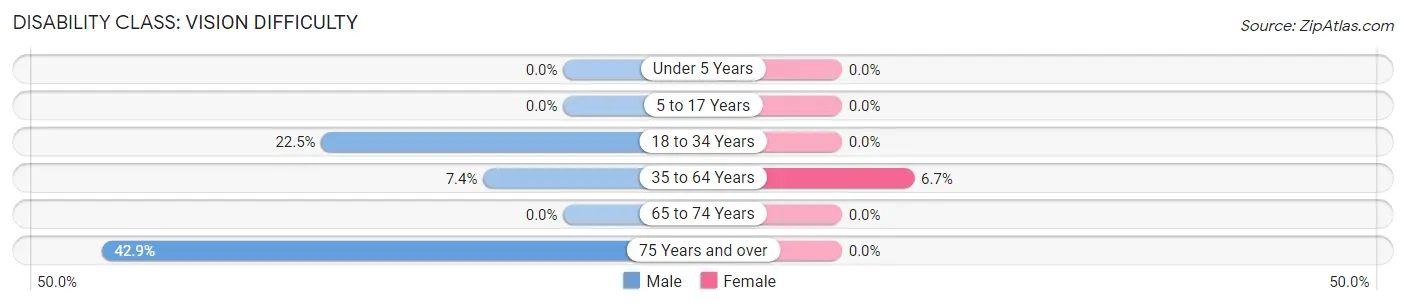
| Age Bracket | Male | Female |
| Under 5 Years | 0 (0.0%) | 0 (0.0%) |
| 5 to 17 Years | 0 (0.0%) | 0 (0.0%) |
| 18 to 34 Years | 11 (22.5%) | 0 (0.0%) |
| 35 to 64 Years | 15 (7.4%) | 11 (6.7%) |
| 65 to 74 Years | 0 (0.0%) | 0 (0.0%) |
| 75 Years and over | 15 (42.9%) | 0 (0.0%) |
Disability Class: Cognitive Difficulty
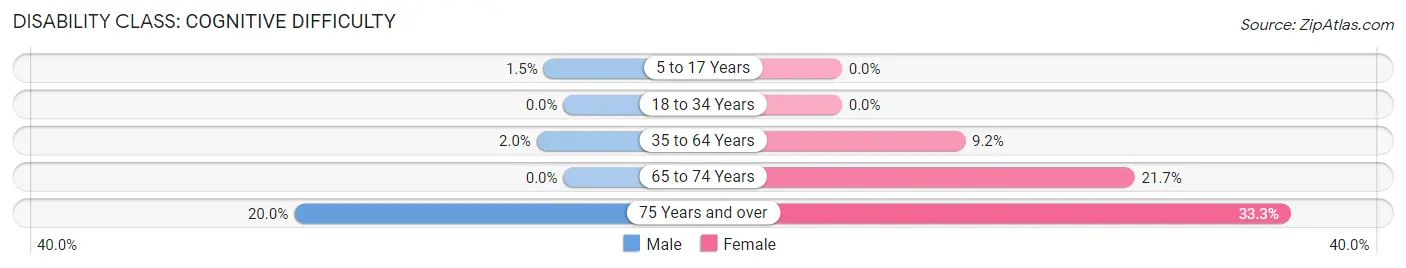
| Age Bracket | Male | Female |
| 5 to 17 Years | 1 (1.5%) | 0 (0.0%) |
| 18 to 34 Years | 0 (0.0%) | 0 (0.0%) |
| 35 to 64 Years | 4 (2.0%) | 15 (9.1%) |
| 65 to 74 Years | 0 (0.0%) | 10 (21.7%) |
| 75 Years and over | 7 (20.0%) | 14 (33.3%) |
Disability Class: Ambulatory Difficulty
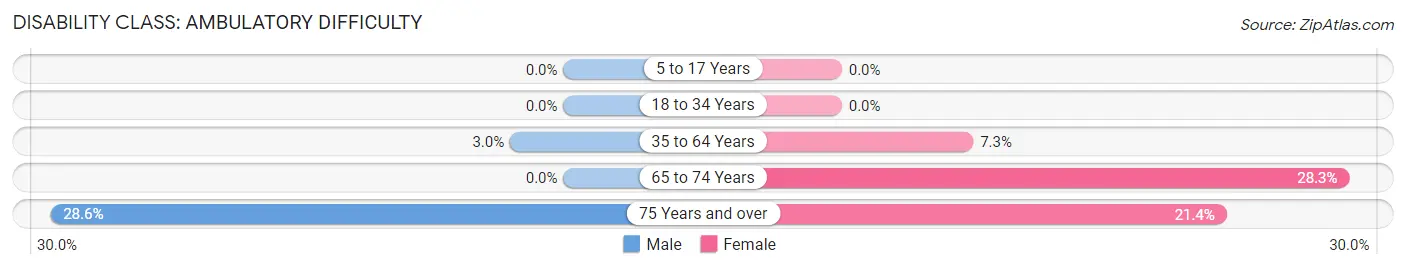
| Age Bracket | Male | Female |
| 5 to 17 Years | 0 (0.0%) | 0 (0.0%) |
| 18 to 34 Years | 0 (0.0%) | 0 (0.0%) |
| 35 to 64 Years | 6 (3.0%) | 12 (7.3%) |
| 65 to 74 Years | 0 (0.0%) | 13 (28.3%) |
| 75 Years and over | 10 (28.6%) | 9 (21.4%) |
Disability Class: Self-Care Difficulty
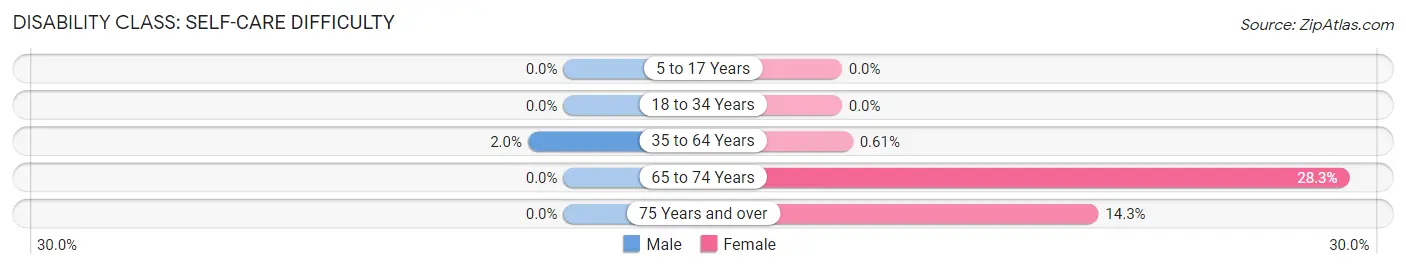
| Age Bracket | Male | Female |
| 5 to 17 Years | 0 (0.0%) | 0 (0.0%) |
| 18 to 34 Years | 0 (0.0%) | 0 (0.0%) |
| 35 to 64 Years | 4 (2.0%) | 1 (0.6%) |
| 65 to 74 Years | 0 (0.0%) | 13 (28.3%) |
| 75 Years and over | 0 (0.0%) | 6 (14.3%) |
Technology Access in Bailey s Prairie
Computing Device Access in Bailey s Prairie
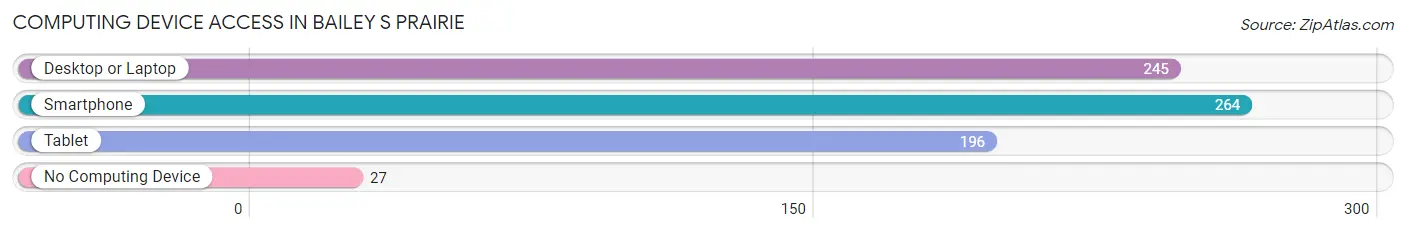
| Device Type | # Households | % Households |
| Desktop or Laptop | 245 | 81.7% |
| Smartphone | 264 | 88.0% |
| Tablet | 196 | 65.3% |
| No Computing Device | 27 | 9.0% |
| Total | 300 | 100.0% |
Internet Access in Bailey s Prairie
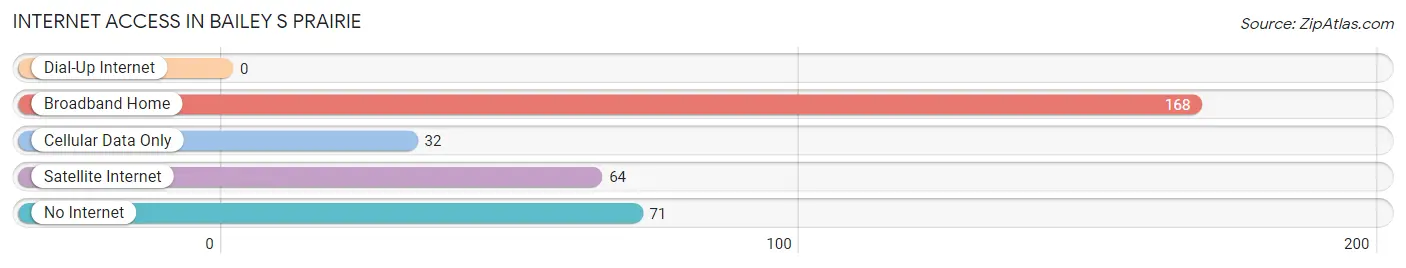
| Internet Type | # Households | % Households |
| Dial-Up Internet | 0 | 0.0% |
| Broadband Home | 168 | 56.0% |
| Cellular Data Only | 32 | 10.7% |
| Satellite Internet | 64 | 21.3% |
| No Internet | 71 | 23.7% |
| Total | 300 | 100.0% |
Bailey s Prairie Summary
Bailey's Prairie is a small unincorporated community located in Brazoria County, Texas, United States. It is situated approximately 25 miles south of Houston and is part of the Houston–The Woodlands–Sugar Land metropolitan area. The population of Bailey's Prairie was estimated to be 1,845 in 2019.
History
The area that is now Bailey's Prairie was first settled in the early 1800s by the Bailey family, who were among the first settlers in the area. The family established a homestead and a small trading post, which eventually became the center of the community. The town was officially established in 1854 and was named after the Bailey family.
In the late 1800s, the town began to grow and develop, with the construction of a school, a post office, and a general store. The town also had a cotton gin, a blacksmith shop, and a sawmill.
Geography
Bailey's Prairie is located in Brazoria County, Texas, approximately 25 miles south of Houston. It is situated on the west side of the San Bernard River, which is a tributary of the Brazos River. The town is surrounded by prairies and wetlands, and is home to a variety of wildlife, including deer, wild hogs, and waterfowl.
The climate in Bailey's Prairie is humid subtropical, with hot summers and mild winters. The average annual temperature is around 70°F (21°C), and the average annual precipitation is around 50 inches (127 cm).
Economy
The economy of Bailey's Prairie is largely based on agriculture and oil and gas production. The town is home to several large farms, which produce a variety of crops, including cotton, corn, soybeans, and wheat. The town is also home to several oil and gas production companies, which are responsible for much of the town's economic activity.
In addition to agriculture and oil and gas production, Bailey's Prairie is home to several small businesses, including restaurants, convenience stores, and auto repair shops. The town is also home to a few small manufacturing companies, which produce a variety of products, including furniture and clothing.
Demographics
As of 2019, the population of Bailey's Prairie was estimated to be 1,845. The racial makeup of the town was 79.3% White, 15.2% Hispanic or Latino, 2.2% African American, 1.2% Asian, and 2.1% other. The median household income was $50,945, and the median home value was $133,400.
Conclusion
Bailey's Prairie is a small unincorporated community located in Brazoria County, Texas, United States. It is situated approximately 25 miles south of Houston and is part of the Houston–The Woodlands–Sugar Land metropolitan area. The population of Bailey's Prairie was estimated to be 1,845 in 2019. The town is surrounded by prairies and wetlands, and is home to a variety of wildlife. The economy of Bailey's Prairie is largely based on agriculture and oil and gas production. The racial makeup of the town was 79.3% White, 15.2% Hispanic or Latino, 2.2% African American, 1.2% Asian, and 2.1% other. Bailey's Prairie is a small but vibrant community that offers its residents a unique blend of rural and urban living.
Common Questions
What is Per Capita Income in Bailey s Prairie?
Per Capita income in Bailey s Prairie is $51,316.
What is the Median Family Income in Bailey s Prairie?
Median Family Income in Bailey s Prairie is $104,922.
What is the Median Household income in Bailey s Prairie?
Median Household Income in Bailey s Prairie is $95,750.
What is Income or Wage Gap in Bailey s Prairie?
Income or Wage Gap in Bailey s Prairie is 41.2%.
Women in Bailey s Prairie earn 58.8 cents for every dollar earned by a man.
What is Inequality or Gini Index in Bailey s Prairie?
Inequality or Gini Index in Bailey s Prairie is 0.50.
What is the Total Population of Bailey s Prairie?
Total Population of Bailey s Prairie is 763.
What is the Total Male Population of Bailey s Prairie?
Total Male Population of Bailey s Prairie is 414.
What is the Total Female Population of Bailey s Prairie?
Total Female Population of Bailey s Prairie is 349.
What is the Ratio of Males per 100 Females in Bailey s Prairie?
There are 118.62 Males per 100 Females in Bailey s Prairie.
What is the Ratio of Females per 100 Males in Bailey s Prairie?
There are 84.30 Females per 100 Males in Bailey s Prairie.
What is the Median Population Age in Bailey s Prairie?
Median Population Age in Bailey s Prairie is 51.8 Years.
What is the Average Family Size in Bailey s Prairie
Average Family Size in Bailey s Prairie is 2.8 People.
What is the Average Household Size in Bailey s Prairie
Average Household Size in Bailey s Prairie is 2.5 People.
How Large is the Labor Force in Bailey s Prairie?
There are 322 People in the Labor Forcein in Bailey s Prairie.
What is the Percentage of People in the Labor Force in Bailey s Prairie?
47.3% of People are in the Labor Force in Bailey s Prairie.
What is the Unemployment Rate in Bailey s Prairie?
Unemployment Rate in Bailey s Prairie is 0.6%.