Zip Codes with the Highest Percentage of Population Employed in Life, Physical & Social Science in Gilmer, TX
RELATED REPORTS & OPTIONS
Life, Physical & Social Science
Gilmer
Compare Zip Codes
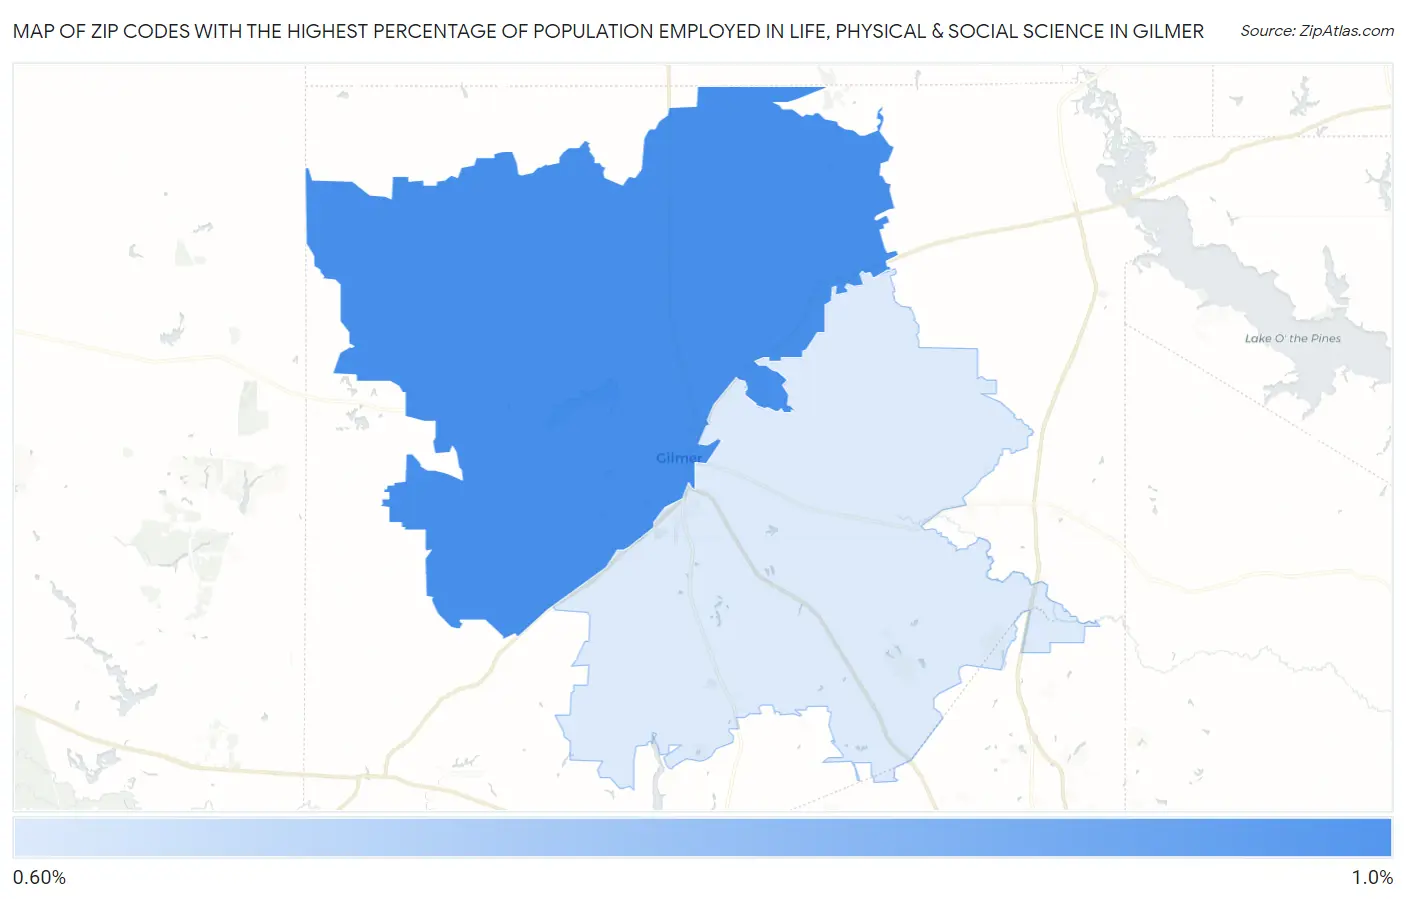
Map of Zip Codes with the Highest Percentage of Population Employed in Life, Physical & Social Science in Gilmer
0.66%
0.81%
Zip Codes with the Highest Percentage of Population Employed in Life, Physical & Social Science in Gilmer, TX
| Zip Code | % Employed | vs State | vs National | |
| 1. | 75644 | 0.81% | 0.84%(-0.034)#509 | 1.1%(-0.283)#10,909 |
| 2. | 75645 | 0.66% | 0.84%(-0.187)#612 | 1.1%(-0.436)#12,588 |
1
Common Questions
What are the Top Zip Codes with the Highest Percentage of Population Employed in Life, Physical & Social Science in Gilmer, TX?
Top Zip Codes with the Highest Percentage of Population Employed in Life, Physical & Social Science in Gilmer, TX are:
What zip code has the Highest Percentage of Population Employed in Life, Physical & Social Science in Gilmer, TX?
75644 has the Highest Percentage of Population Employed in Life, Physical & Social Science in Gilmer, TX with 0.81%.
What is the Percentage of Population Employed in Life, Physical & Social Science in Gilmer, TX?
Percentage of Population Employed in Life, Physical & Social Science in Gilmer is 2.2%.
What is the Percentage of Population Employed in Life, Physical & Social Science in Texas?
Percentage of Population Employed in Life, Physical & Social Science in Texas is 0.84%.
What is the Percentage of Population Employed in Life, Physical & Social Science in the United States?
Percentage of Population Employed in Life, Physical & Social Science in the United States is 1.1%.