Zip Codes with the Highest Percentage of Population Employed in Life, Physical & Social Science in Houston, TX
RELATED REPORTS & OPTIONS
Life, Physical & Social Science
Houston
Compare Zip Codes
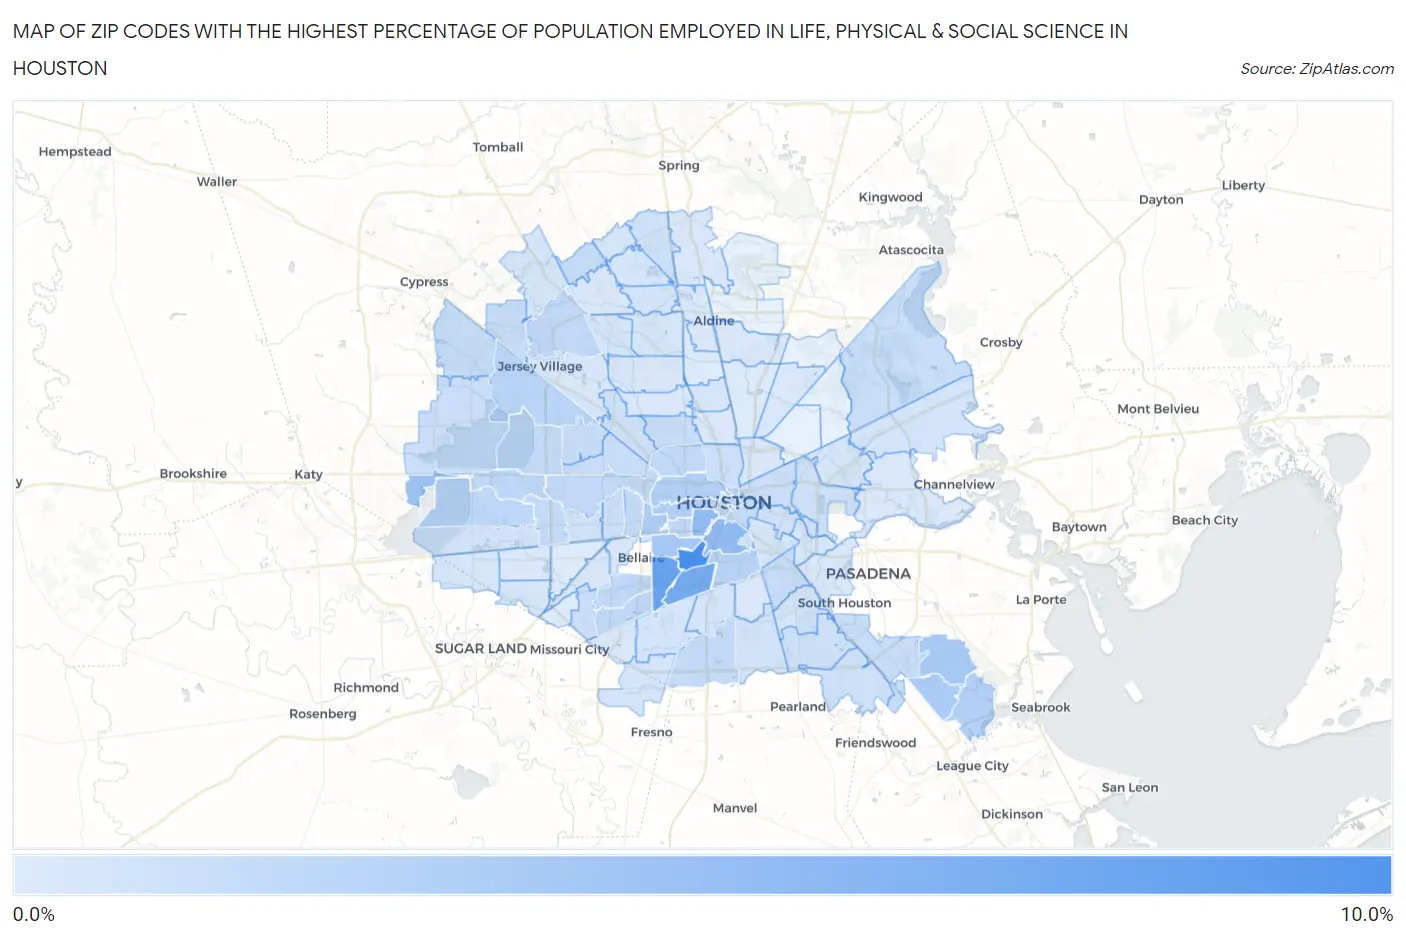
Map of Zip Codes with the Highest Percentage of Population Employed in Life, Physical & Social Science in Houston
0.048%
9.6%
Zip Codes with the Highest Percentage of Population Employed in Life, Physical & Social Science in Houston, TX
| Zip Code | % Employed | vs State | vs National | |
| 1. | 77030 | 9.6% | 0.84%(+8.78)#8 | 1.1%(+8.53)#222 |
| 2. | 77025 | 7.3% | 0.84%(+6.44)#15 | 1.1%(+6.19)#382 |
| 3. | 77054 | 6.6% | 0.84%(+5.77)#18 | 1.1%(+5.52)#455 |
| 4. | 77004 | 4.8% | 0.84%(+3.93)#27 | 1.1%(+3.69)#823 |
| 5. | 77006 | 4.7% | 0.84%(+3.87)#29 | 1.1%(+3.63)#845 |
| 6. | 77094 | 4.1% | 0.84%(+3.23)#37 | 1.1%(+2.98)#1,113 |
| 7. | 77005 | 3.4% | 0.84%(+2.58)#52 | 1.1%(+2.33)#1,488 |
| 8. | 77059 | 3.3% | 0.84%(+2.45)#56 | 1.1%(+2.21)#1,580 |
| 9. | 77062 | 3.2% | 0.84%(+2.31)#61 | 1.1%(+2.07)#1,701 |
| 10. | 77027 | 2.9% | 0.84%(+2.07)#64 | 1.1%(+1.83)#1,980 |
| 11. | 77007 | 2.7% | 0.84%(+1.84)#72 | 1.1%(+1.59)#2,272 |
| 12. | 77019 | 2.6% | 0.84%(+1.80)#75 | 1.1%(+1.55)#2,326 |
| 13. | 77058 | 2.5% | 0.84%(+1.71)#78 | 1.1%(+1.46)#2,483 |
| 14. | 77021 | 2.3% | 0.84%(+1.42)#105 | 1.1%(+1.17)#3,041 |
| 15. | 77041 | 2.2% | 0.84%(+1.32)#112 | 1.1%(+1.07)#3,272 |
| 16. | 77077 | 1.9% | 0.84%(+1.11)#133 | 1.1%(+0.857)#3,834 |
| 17. | 77079 | 1.9% | 0.84%(+1.09)#135 | 1.1%(+0.846)#3,866 |
| 18. | 77010 | 1.9% | 0.84%(+1.07)#136 | 1.1%(+0.826)#3,919 |
| 19. | 77098 | 1.9% | 0.84%(+1.06)#139 | 1.1%(+0.811)#3,971 |
| 20. | 77035 | 1.9% | 0.84%(+1.05)#141 | 1.1%(+0.802)#4,003 |
| 21. | 77046 | 1.8% | 0.84%(+0.941)#162 | 1.1%(+0.693)#4,386 |
| 22. | 77096 | 1.8% | 0.84%(+0.935)#164 | 1.1%(+0.686)#4,410 |
| 23. | 77008 | 1.7% | 0.84%(+0.881)#173 | 1.1%(+0.633)#4,622 |
| 24. | 77064 | 1.7% | 0.84%(+0.877)#174 | 1.1%(+0.629)#4,634 |
| 25. | 77024 | 1.7% | 0.84%(+0.875)#175 | 1.1%(+0.626)#4,647 |
| 26. | 77002 | 1.7% | 0.84%(+0.853)#179 | 1.1%(+0.605)#4,745 |
| 27. | 77047 | 1.6% | 0.84%(+0.783)#193 | 1.1%(+0.535)#5,055 |
| 28. | 77042 | 1.6% | 0.84%(+0.762)#199 | 1.1%(+0.514)#5,129 |
| 29. | 77043 | 1.6% | 0.84%(+0.758)#200 | 1.1%(+0.510)#5,155 |
| 30. | 77056 | 1.5% | 0.84%(+0.695)#213 | 1.1%(+0.446)#5,462 |
| 31. | 77095 | 1.5% | 0.84%(+0.624)#234 | 1.1%(+0.375)#5,836 |
| 32. | 77069 | 1.4% | 0.84%(+0.596)#240 | 1.1%(+0.348)#5,969 |
| 33. | 77003 | 1.4% | 0.84%(+0.566)#249 | 1.1%(+0.318)#6,141 |
| 34. | 77034 | 1.4% | 0.84%(+0.537)#256 | 1.1%(+0.289)#6,307 |
| 35. | 77080 | 1.4% | 0.84%(+0.516)#266 | 1.1%(+0.267)#6,432 |
| 36. | 77065 | 1.3% | 0.84%(+0.469)#279 | 1.1%(+0.221)#6,735 |
| 37. | 77044 | 1.3% | 0.84%(+0.468)#280 | 1.1%(+0.220)#6,739 |
| 38. | 77018 | 1.3% | 0.84%(+0.458)#285 | 1.1%(+0.209)#6,804 |
| 39. | 77087 | 1.3% | 0.84%(+0.432)#293 | 1.1%(+0.183)#6,968 |
| 40. | 77055 | 1.3% | 0.84%(+0.430)#294 | 1.1%(+0.182)#6,980 |
| 41. | 77020 | 1.2% | 0.84%(+0.361)#325 | 1.1%(+0.112)#7,477 |
| 42. | 77084 | 1.2% | 0.84%(+0.357)#328 | 1.1%(+0.109)#7,497 |
| 43. | 77057 | 1.2% | 0.84%(+0.312)#342 | 1.1%(+0.064)#7,830 |
| 44. | 77071 | 1.1% | 0.84%(+0.273)#359 | 1.1%(+0.025)#8,101 |
| 45. | 77009 | 1.0% | 0.84%(+0.180)#401 | 1.1%(-0.069)#8,866 |
| 46. | 77063 | 0.95% | 0.84%(+0.112)#432 | 1.1%(-0.136)#9,454 |
| 47. | 77092 | 0.93% | 0.84%(+0.091)#438 | 1.1%(-0.157)#9,627 |
| 48. | 77090 | 0.87% | 0.84%(+0.026)#475 | 1.1%(-0.222)#10,277 |
| 49. | 77075 | 0.86% | 0.84%(+0.021)#477 | 1.1%(-0.228)#10,331 |
| 50. | 77089 | 0.85% | 0.84%(+0.011)#482 | 1.1%(-0.237)#10,446 |
| 51. | 77204 | 0.85% | 0.84%(+0.008)#483 | 1.1%(-0.240)#10,475 |
| 52. | 77029 | 0.83% | 0.84%(-0.010)#494 | 1.1%(-0.259)#10,662 |
| 53. | 77048 | 0.73% | 0.84%(-0.116)#556 | 1.1%(-0.365)#11,755 |
| 54. | 77082 | 0.71% | 0.84%(-0.137)#567 | 1.1%(-0.386)#11,956 |
| 55. | 77011 | 0.69% | 0.84%(-0.149)#578 | 1.1%(-0.397)#12,112 |
| 56. | 77014 | 0.67% | 0.84%(-0.171)#599 | 1.1%(-0.419)#12,388 |
| 57. | 77086 | 0.67% | 0.84%(-0.171)#601 | 1.1%(-0.420)#12,391 |
| 58. | 77051 | 0.67% | 0.84%(-0.174)#602 | 1.1%(-0.422)#12,429 |
| 59. | 77053 | 0.65% | 0.84%(-0.191)#619 | 1.1%(-0.439)#12,638 |
| 60. | 77061 | 0.65% | 0.84%(-0.192)#621 | 1.1%(-0.440)#12,650 |
| 61. | 77049 | 0.57% | 0.84%(-0.269)#674 | 1.1%(-0.518)#13,617 |
| 62. | 77045 | 0.55% | 0.84%(-0.290)#688 | 1.1%(-0.539)#13,874 |
| 63. | 77067 | 0.54% | 0.84%(-0.298)#697 | 1.1%(-0.547)#13,975 |
| 64. | 77023 | 0.50% | 0.84%(-0.346)#734 | 1.1%(-0.594)#14,534 |
| 65. | 77013 | 0.50% | 0.84%(-0.347)#738 | 1.1%(-0.596)#14,567 |
| 66. | 77070 | 0.49% | 0.84%(-0.350)#740 | 1.1%(-0.599)#14,603 |
| 67. | 77038 | 0.49% | 0.84%(-0.353)#744 | 1.1%(-0.602)#14,639 |
| 68. | 77083 | 0.48% | 0.84%(-0.359)#749 | 1.1%(-0.607)#14,707 |
| 69. | 77076 | 0.48% | 0.84%(-0.360)#752 | 1.1%(-0.609)#14,731 |
| 70. | 77068 | 0.46% | 0.84%(-0.379)#766 | 1.1%(-0.628)#14,978 |
| 71. | 77099 | 0.43% | 0.84%(-0.413)#797 | 1.1%(-0.661)#15,380 |
| 72. | 77012 | 0.40% | 0.84%(-0.440)#820 | 1.1%(-0.688)#15,719 |
| 73. | 77081 | 0.40% | 0.84%(-0.444)#824 | 1.1%(-0.692)#15,763 |
| 74. | 77040 | 0.35% | 0.84%(-0.490)#868 | 1.1%(-0.738)#16,376 |
| 75. | 77088 | 0.35% | 0.84%(-0.495)#873 | 1.1%(-0.743)#16,438 |
| 76. | 77074 | 0.34% | 0.84%(-0.502)#880 | 1.1%(-0.750)#16,528 |
| 77. | 77026 | 0.29% | 0.84%(-0.551)#925 | 1.1%(-0.800)#17,167 |
| 78. | 77091 | 0.25% | 0.84%(-0.597)#956 | 1.1%(-0.846)#17,683 |
| 79. | 77085 | 0.24% | 0.84%(-0.600)#959 | 1.1%(-0.848)#17,709 |
| 80. | 77066 | 0.24% | 0.84%(-0.606)#969 | 1.1%(-0.854)#17,788 |
| 81. | 77015 | 0.21% | 0.84%(-0.628)#978 | 1.1%(-0.876)#18,032 |
| 82. | 77033 | 0.21% | 0.84%(-0.629)#979 | 1.1%(-0.878)#18,042 |
| 83. | 77072 | 0.21% | 0.84%(-0.630)#981 | 1.1%(-0.878)#18,046 |
| 84. | 77017 | 0.21% | 0.84%(-0.637)#990 | 1.1%(-0.885)#18,142 |
| 85. | 77022 | 0.20% | 0.84%(-0.640)#994 | 1.1%(-0.888)#18,168 |
| 86. | 77039 | 0.19% | 0.84%(-0.648)#1,000 | 1.1%(-0.896)#18,252 |
| 87. | 77060 | 0.17% | 0.84%(-0.672)#1,025 | 1.1%(-0.920)#18,496 |
| 88. | 77073 | 0.13% | 0.84%(-0.717)#1,060 | 1.1%(-0.966)#18,900 |
| 89. | 77016 | 0.12% | 0.84%(-0.722)#1,066 | 1.1%(-0.970)#18,938 |
| 90. | 77093 | 0.11% | 0.84%(-0.729)#1,075 | 1.1%(-0.977)#18,984 |
| 91. | 77036 | 0.11% | 0.84%(-0.734)#1,080 | 1.1%(-0.982)#19,025 |
| 92. | 77037 | 0.095% | 0.84%(-0.748)#1,090 | 1.1%(-0.996)#19,107 |
| 93. | 77031 | 0.048% | 0.84%(-0.795)#1,113 | 1.1%(-1.04)#19,346 |
1
Common Questions
What are the Top 10 Zip Codes with the Highest Percentage of Population Employed in Life, Physical & Social Science in Houston, TX?
Top 10 Zip Codes with the Highest Percentage of Population Employed in Life, Physical & Social Science in Houston, TX are:
What zip code has the Highest Percentage of Population Employed in Life, Physical & Social Science in Houston, TX?
77030 has the Highest Percentage of Population Employed in Life, Physical & Social Science in Houston, TX with 9.6%.
What is the Percentage of Population Employed in Life, Physical & Social Science in Houston, TX?
Percentage of Population Employed in Life, Physical & Social Science in Houston is 1.4%.
What is the Percentage of Population Employed in Life, Physical & Social Science in Texas?
Percentage of Population Employed in Life, Physical & Social Science in Texas is 0.84%.
What is the Percentage of Population Employed in Life, Physical & Social Science in the United States?
Percentage of Population Employed in Life, Physical & Social Science in the United States is 1.1%.