Fritch, TX Map & Demographics
Fritch Map
Fritch Overview
$34,496
PER CAPITA INCOME
$95,119
AVG FAMILY INCOME
$74,130
AVG HOUSEHOLD INCOME
41.6%
WAGE / INCOME GAP [ % ]
58.4¢/ $1
WAGE / INCOME GAP [ $ ]
0.36
INEQUALITY / GINI INDEX
2,472
TOTAL POPULATION
1,299
MALE POPULATION
1,173
FEMALE POPULATION
110.74
MALES / 100 FEMALES
90.30
FEMALES / 100 MALES
42.1
MEDIAN AGE
3.8
AVG FAMILY SIZE
3.3
AVG HOUSEHOLD SIZE
1,209
LABOR FORCE [ PEOPLE ]
57.8%
PERCENT IN LABOR FORCE
7.9%
UNEMPLOYMENT RATE
Fritch Zip Codes
Fritch Area Codes
Income in Fritch
Income Overview in Fritch
Per Capita Income in Fritch is $34,496, while median incomes of families and households are $95,119 and $74,130 respectively.
| Characteristic | Number | Measure |
| Per Capita Income | 2,472 | $34,496 |
| Median Family Income | 592 | $95,119 |
| Mean Family Income | 592 | $96,554 |
| Median Household Income | 746 | $74,130 |
| Mean Household Income | 746 | $90,366 |
| Income Deficit | 592 | $0 |
| Wage / Income Gap (%) | 2,472 | 41.57% |
| Wage / Income Gap ($) | 2,472 | 58.43¢ per $1 |
| Gini / Inequality Index | 2,472 | 0.36 |
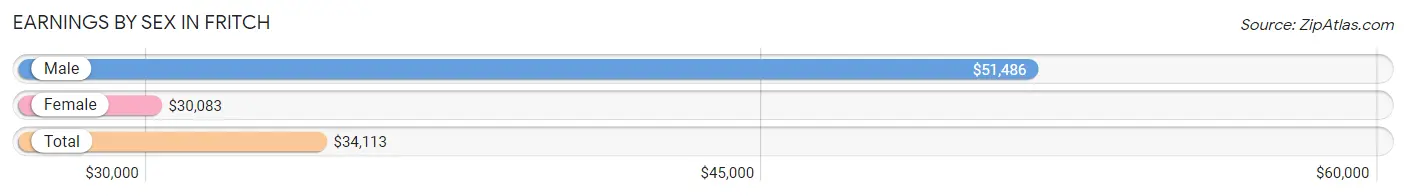
Earnings by Sex in Fritch
Average Earnings in Fritch are $34,113, $51,486 for men and $30,083 for women, a difference of 41.6%.
| Sex | Number | Average Earnings |
| Male | 704 (56.5%) | $51,486 |
| Female | 543 (43.5%) | $30,083 |
| Total | 1,247 (100.0%) | $34,113 |
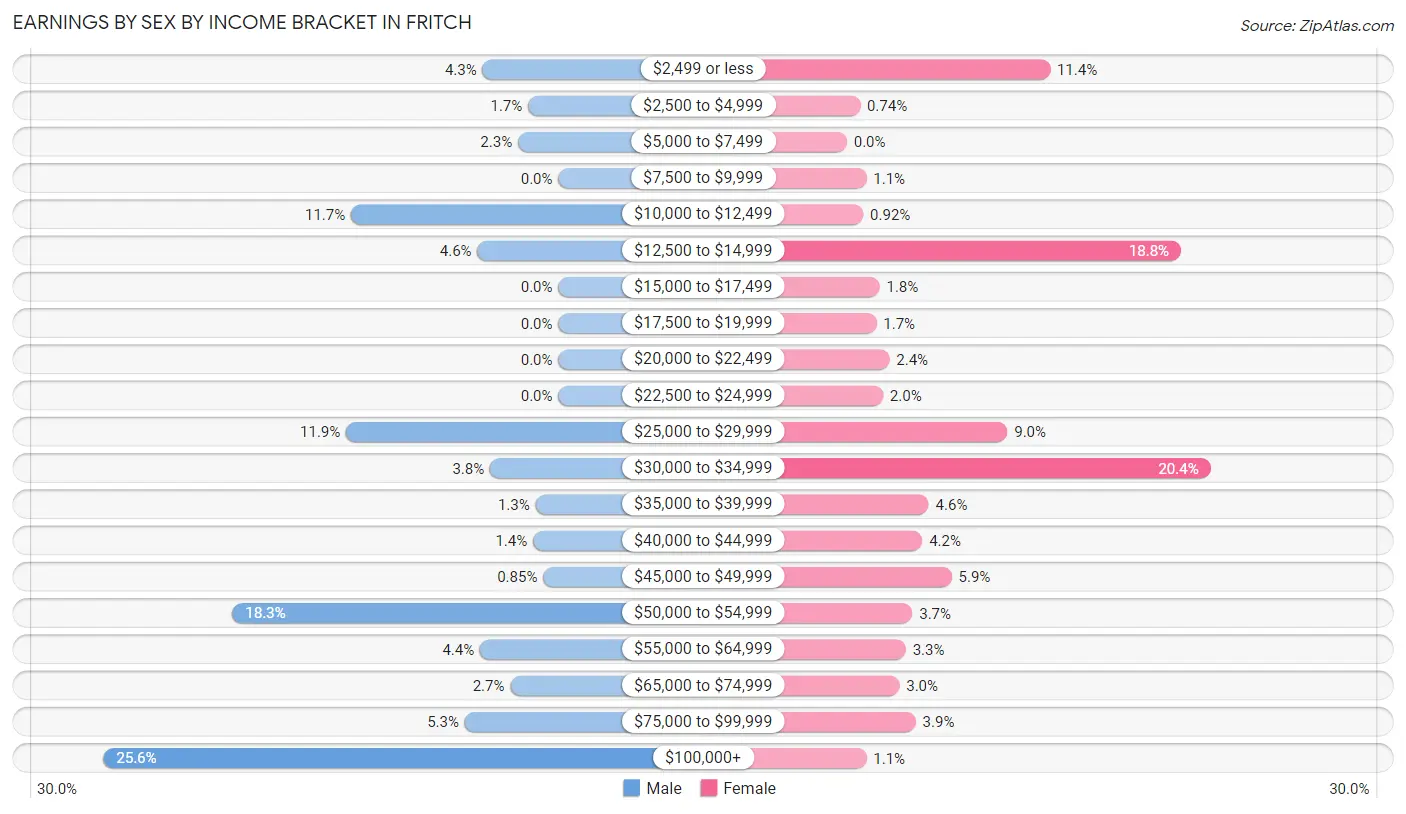
Earnings by Sex by Income Bracket in Fritch
The most common earnings brackets in Fritch are $100,000+ for men (180 | 25.6%) and $30,000 to $34,999 for women (111 | 20.4%).
| Income | Male | Female |
| $2,499 or less | 30 (4.3%) | 62 (11.4%) |
| $2,500 to $4,999 | 12 (1.7%) | 4 (0.7%) |
| $5,000 to $7,499 | 16 (2.3%) | 0 (0.0%) |
| $7,500 to $9,999 | 0 (0.0%) | 6 (1.1%) |
| $10,000 to $12,499 | 82 (11.7%) | 5 (0.9%) |
| $12,500 to $14,999 | 32 (4.5%) | 102 (18.8%) |
| $15,000 to $17,499 | 0 (0.0%) | 10 (1.8%) |
| $17,500 to $19,999 | 0 (0.0%) | 9 (1.7%) |
| $20,000 to $22,499 | 0 (0.0%) | 13 (2.4%) |
| $22,500 to $24,999 | 0 (0.0%) | 11 (2.0%) |
| $25,000 to $29,999 | 84 (11.9%) | 49 (9.0%) |
| $30,000 to $34,999 | 27 (3.8%) | 111 (20.4%) |
| $35,000 to $39,999 | 9 (1.3%) | 25 (4.6%) |
| $40,000 to $44,999 | 10 (1.4%) | 23 (4.2%) |
| $45,000 to $49,999 | 6 (0.9%) | 32 (5.9%) |
| $50,000 to $54,999 | 129 (18.3%) | 20 (3.7%) |
| $55,000 to $64,999 | 31 (4.4%) | 18 (3.3%) |
| $65,000 to $74,999 | 19 (2.7%) | 16 (2.9%) |
| $75,000 to $99,999 | 37 (5.3%) | 21 (3.9%) |
| $100,000+ | 180 (25.6%) | 6 (1.1%) |
| Total | 704 (100.0%) | 543 (100.0%) |
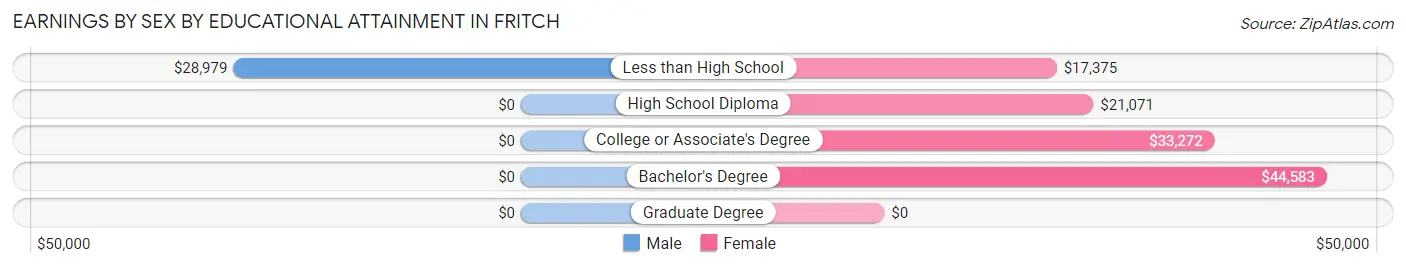
Earnings by Sex by Educational Attainment in Fritch
Average earnings in Fritch are $51,436 for men and $32,982 for women, a difference of 35.9%. Men with an educational attainment of less than high school enjoy the highest average annual earnings of $28,979, while those with less than high school education earn the least with $28,979. Women with an educational attainment of bachelor's degree earn the most with the average annual earnings of $44,583, while those with less than high school education have the smallest earnings of $17,375.
| Educational Attainment | Male Income | Female Income |
| Less than High School | $28,979 | $17,375 |
| High School Diploma | - | - |
| College or Associate's Degree | - | - |
| Bachelor's Degree | - | - |
| Graduate Degree | - | - |
| Total | $51,436 | $32,982 |
Family Income in Fritch
Family Income Brackets in Fritch
According to the Fritch family income data, there are 205 families falling into the $100,000 to $149,999 income range, which is the most common income bracket and makes up 34.6% of all families. Conversely, the less than $10,000 income bracket is the least frequent group with only 3 families (0.5%) belonging to this category.
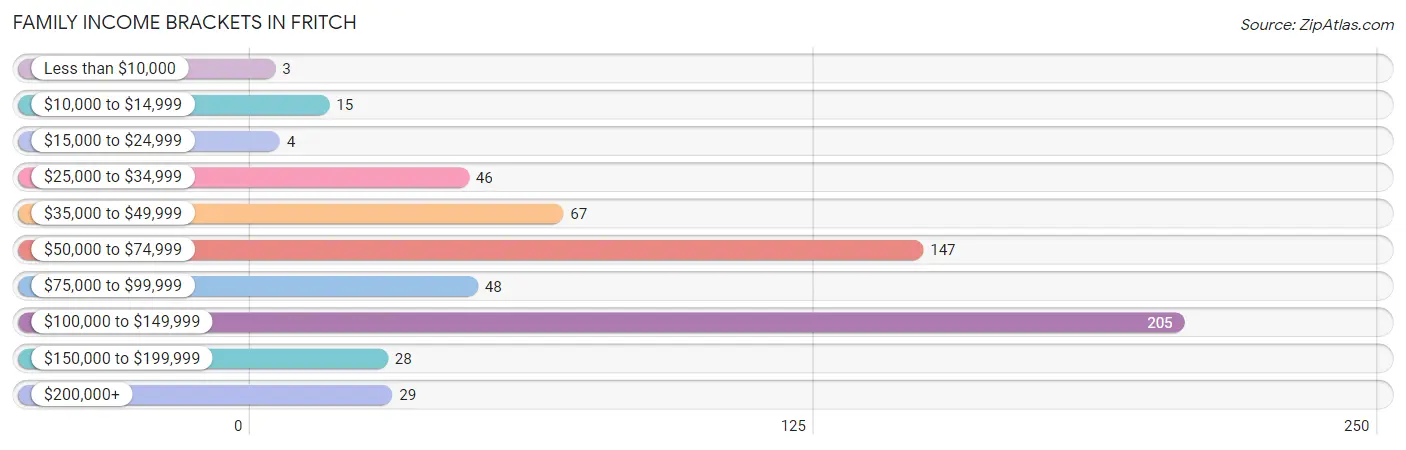
| Income Bracket | # Families | % Families |
| Less than $10,000 | 3 | 0.5% |
| $10,000 to $14,999 | 15 | 2.5% |
| $15,000 to $24,999 | 4 | 0.7% |
| $25,000 to $34,999 | 46 | 7.8% |
| $35,000 to $49,999 | 67 | 11.3% |
| $50,000 to $74,999 | 147 | 24.8% |
| $75,000 to $99,999 | 48 | 8.1% |
| $100,000 to $149,999 | 205 | 34.6% |
| $150,000 to $199,999 | 28 | 4.7% |
| $200,000+ | 29 | 4.9% |
Family Income by Famaliy Size in Fritch
3-person families (136 | 23.0%) account for the highest median family income in Fritch with $96,607 per family, while 2-person families (344 | 58.1%) have the highest median income of $42,500 per family member.
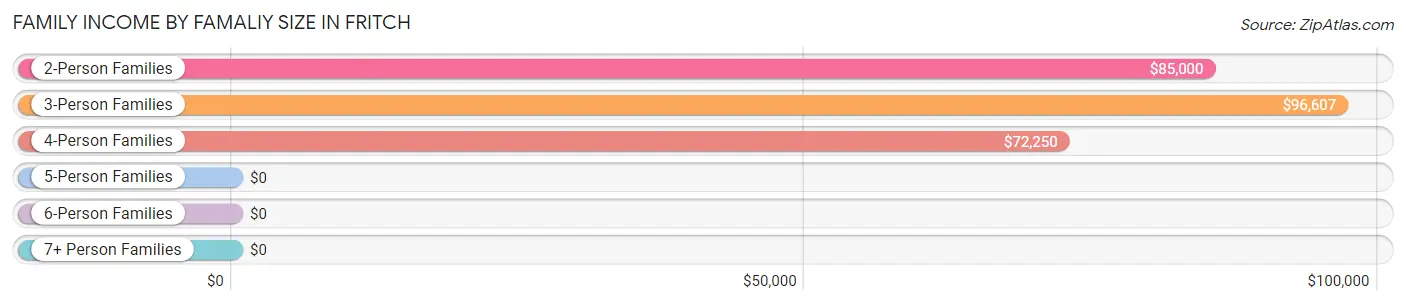
| Income Bracket | # Families | Median Income |
| 2-Person Families | 344 (58.1%) | $85,000 |
| 3-Person Families | 136 (23.0%) | $96,607 |
| 4-Person Families | 80 (13.5%) | $72,250 |
| 5-Person Families | 27 (4.6%) | $0 |
| 6-Person Families | 5 (0.8%) | $0 |
| 7+ Person Families | 0 (0.0%) | $0 |
| Total | 592 (100.0%) | $95,119 |
Family Income by Number of Earners in Fritch
The median family income in Fritch is $95,119, with families comprising 2 earners (124) having the highest median family income of $135,750, while families with no earners (127) have the lowest median family income of $44,740, accounting for 20.9% and 21.4% of families, respectively.
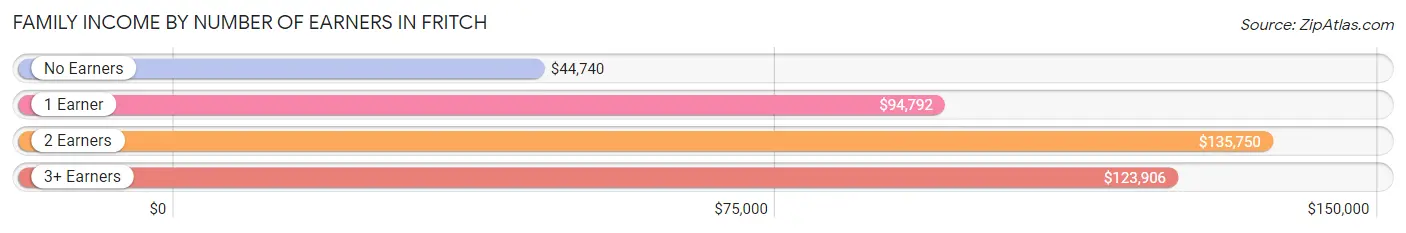
| Number of Earners | # Families | Median Income |
| No Earners | 127 (21.4%) | $44,740 |
| 1 Earner | 269 (45.4%) | $94,792 |
| 2 Earners | 124 (20.9%) | $135,750 |
| 3+ Earners | 72 (12.2%) | $123,906 |
| Total | 592 (100.0%) | $95,119 |
Household Income in Fritch
Household Income Brackets in Fritch
With 230 households falling in the category, the $100,000 to $149,999 income range is the most frequent in Fritch, accounting for 30.8% of all households. In contrast, only 9 households (1.2%) fall into the $15,000 to $24,999 income bracket, making it the least populous group.
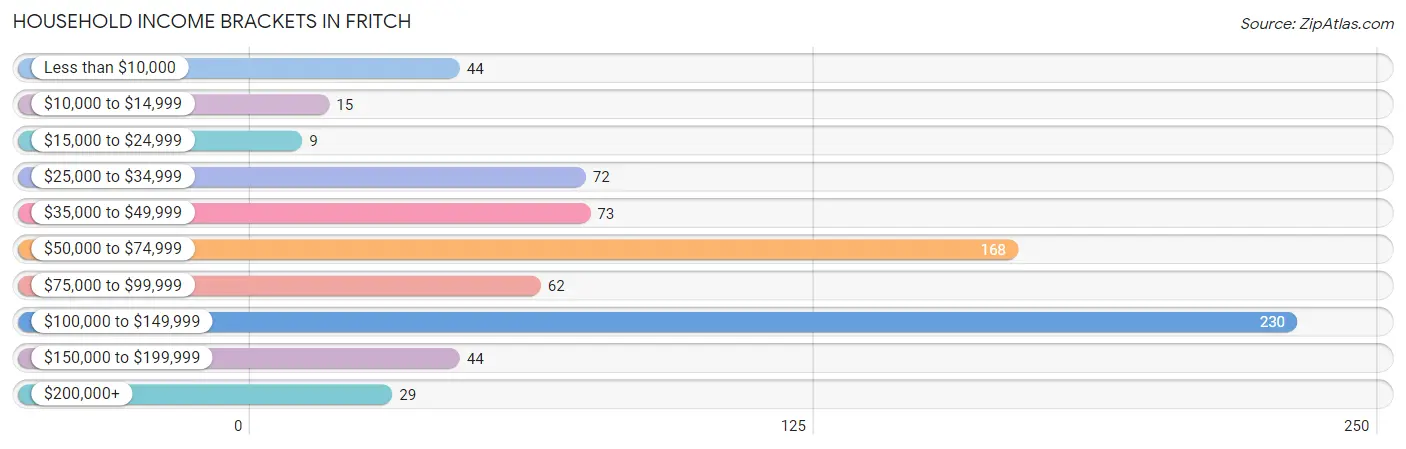
| Income Bracket | # Households | % Households |
| Less than $10,000 | 44 | 5.9% |
| $10,000 to $14,999 | 15 | 2.0% |
| $15,000 to $24,999 | 9 | 1.2% |
| $25,000 to $34,999 | 72 | 9.7% |
| $35,000 to $49,999 | 73 | 9.8% |
| $50,000 to $74,999 | 168 | 22.5% |
| $75,000 to $99,999 | 62 | 8.3% |
| $100,000 to $149,999 | 230 | 30.8% |
| $150,000 to $199,999 | 44 | 5.9% |
| $200,000+ | 29 | 3.9% |
Household Income by Householder Age in Fritch
The median household income in Fritch is $74,130, with the highest median household income of $74,583 found in the 25 to 44 years age bracket for the primary householder. A total of 169 households (22.7%) fall into this category. Meanwhile, the 15 to 24 years age bracket for the primary householder has the lowest median household income of $0, with 6 households (0.8%) in this group.
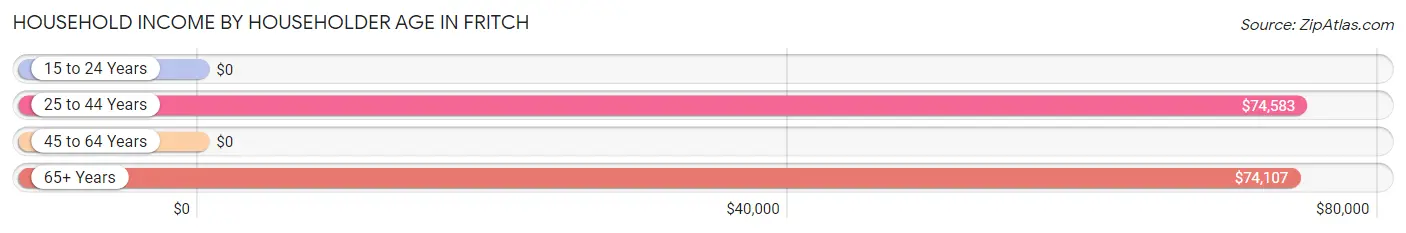
| Income Bracket | # Households | Median Income |
| 15 to 24 Years | 6 (0.8%) | $0 |
| 25 to 44 Years | 169 (22.7%) | $74,583 |
| 45 to 64 Years | 209 (28.0%) | $0 |
| 65+ Years | 362 (48.5%) | $74,107 |
| Total | 746 (100.0%) | $74,130 |
Poverty in Fritch
Income Below Poverty by Sex and Age in Fritch
With 7.2% poverty level for males and 6.7% for females among the residents of Fritch, 18 to 24 year old males and 12 to 14 year old females are the most vulnerable to poverty, with 12 males (44.4%) and 11 females (24.4%) in their respective age groups living below the poverty level.
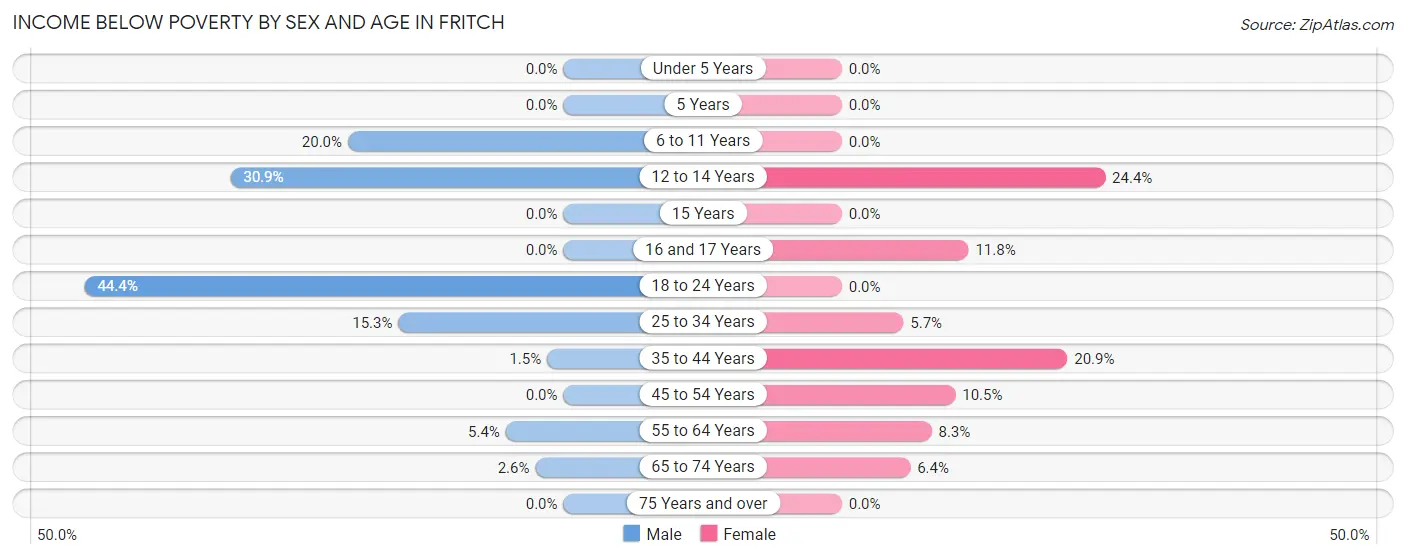
| Age Bracket | Male | Female |
| Under 5 Years | 0 (0.0%) | 0 (0.0%) |
| 5 Years | 0 (0.0%) | 0 (0.0%) |
| 6 to 11 Years | 14 (20.0%) | 0 (0.0%) |
| 12 to 14 Years | 17 (30.9%) | 11 (24.4%) |
| 15 Years | 0 (0.0%) | 0 (0.0%) |
| 16 and 17 Years | 0 (0.0%) | 4 (11.8%) |
| 18 to 24 Years | 12 (44.4%) | 0 (0.0%) |
| 25 to 34 Years | 34 (15.3%) | 14 (5.7%) |
| 35 to 44 Years | 3 (1.5%) | 18 (20.9%) |
| 45 to 54 Years | 0 (0.0%) | 10 (10.5%) |
| 55 to 64 Years | 10 (5.3%) | 13 (8.3%) |
| 65 to 74 Years | 4 (2.6%) | 8 (6.4%) |
| 75 Years and over | 0 (0.0%) | 0 (0.0%) |
| Total | 94 (7.2%) | 78 (6.7%) |
Income Above Poverty by Sex and Age in Fritch
According to the poverty statistics in Fritch, males aged under 5 years and females aged under 5 years are the age groups that are most secure financially, with 100.0% of males and 100.0% of females in these age groups living above the poverty line.
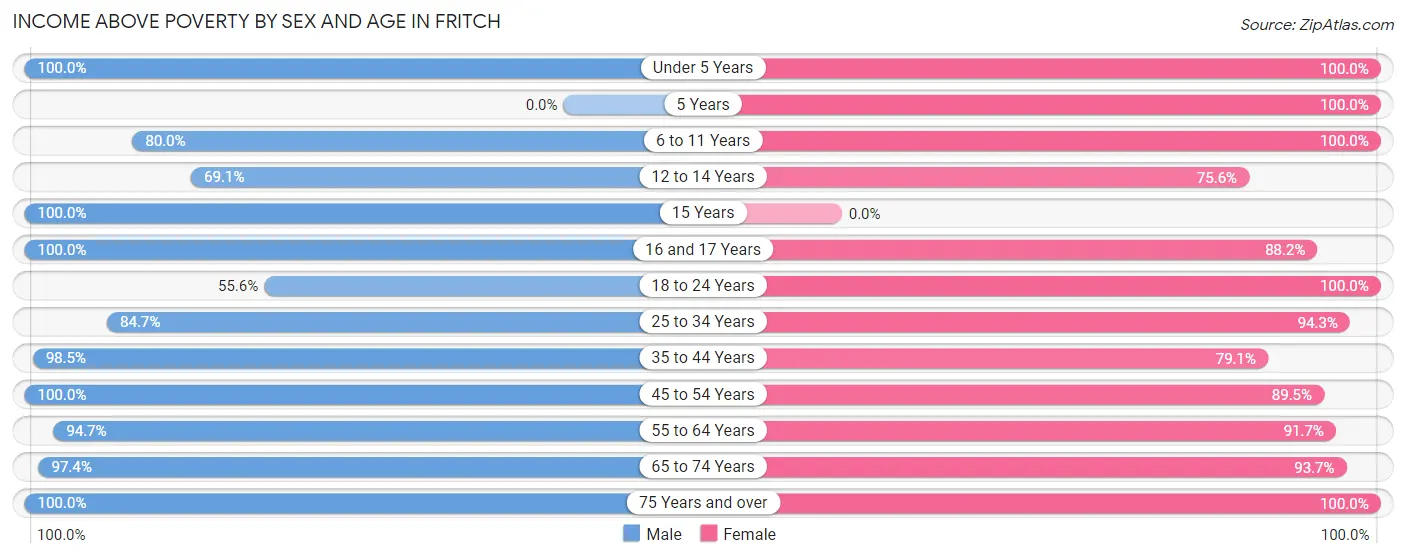
| Age Bracket | Male | Female |
| Under 5 Years | 54 (100.0%) | 71 (100.0%) |
| 5 Years | 0 (0.0%) | 6 (100.0%) |
| 6 to 11 Years | 56 (80.0%) | 75 (100.0%) |
| 12 to 14 Years | 38 (69.1%) | 34 (75.6%) |
| 15 Years | 4 (100.0%) | 0 (0.0%) |
| 16 and 17 Years | 13 (100.0%) | 30 (88.2%) |
| 18 to 24 Years | 15 (55.6%) | 74 (100.0%) |
| 25 to 34 Years | 188 (84.7%) | 231 (94.3%) |
| 35 to 44 Years | 196 (98.5%) | 68 (79.1%) |
| 45 to 54 Years | 148 (100.0%) | 85 (89.5%) |
| 55 to 64 Years | 177 (94.7%) | 143 (91.7%) |
| 65 to 74 Years | 150 (97.4%) | 118 (93.6%) |
| 75 Years and over | 166 (100.0%) | 160 (100.0%) |
| Total | 1,205 (92.8%) | 1,095 (93.3%) |
Income Below Poverty Among Married-Couple Families in Fritch
The poverty statistics for married-couple families in Fritch show that 3.1% or 14 of the total 458 families live below the poverty line. Families with no children have the highest poverty rate of 4.1%, comprising of 14 families. On the other hand, families with 1 or 2 children have the lowest poverty rate of 0.0%, which includes 0 families.
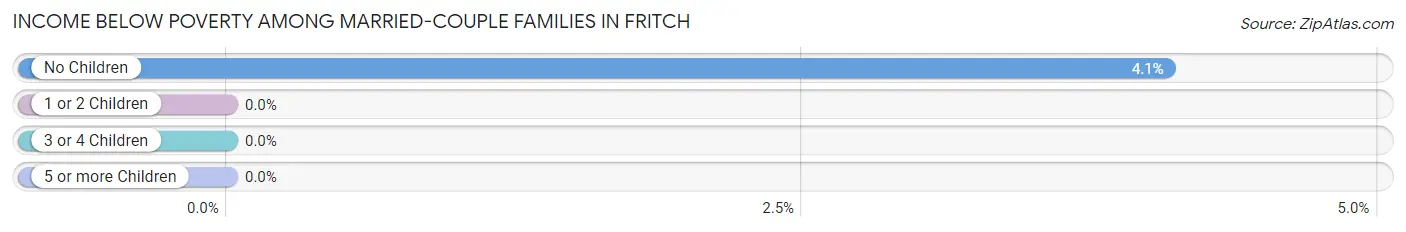
| Children | Above Poverty | Below Poverty |
| No Children | 329 (95.9%) | 14 (4.1%) |
| 1 or 2 Children | 94 (100.0%) | 0 (0.0%) |
| 3 or 4 Children | 21 (100.0%) | 0 (0.0%) |
| 5 or more Children | 0 (0.0%) | 0 (0.0%) |
| Total | 444 (96.9%) | 14 (3.1%) |
Income Below Poverty Among Single-Parent Households in Fritch
According to the poverty data in Fritch, 5.2% or 3 single-father households and 14.5% or 11 single-mother households are living below the poverty line. Among single-father households, those with 1 or 2 children have the highest poverty rate, with 3 households (11.1%) experiencing poverty. Likewise, among single-mother households, those with 3 or 4 children have the highest poverty rate, with 5 households (100.0%) falling below the poverty line.
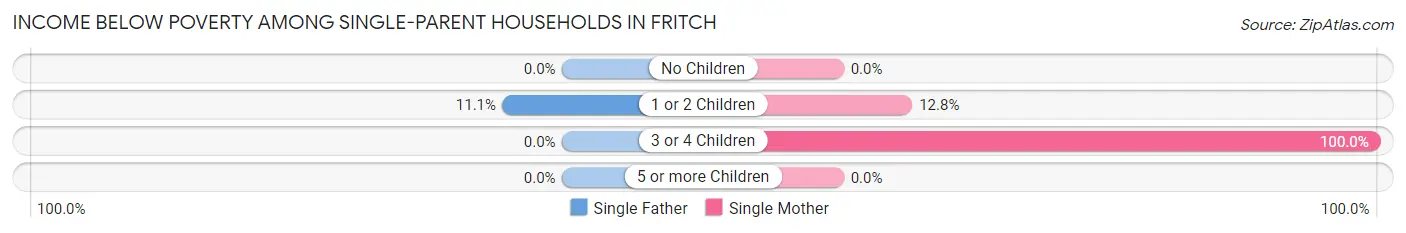
| Children | Single Father | Single Mother |
| No Children | 0 (0.0%) | 0 (0.0%) |
| 1 or 2 Children | 3 (11.1%) | 6 (12.8%) |
| 3 or 4 Children | 0 (0.0%) | 5 (100.0%) |
| 5 or more Children | 0 (0.0%) | 0 (0.0%) |
| Total | 3 (5.2%) | 11 (14.5%) |
Income Below Poverty Among Married-Couple vs Single-Parent Households in Fritch
The poverty data for Fritch shows that 14 of the married-couple family households (3.1%) and 14 of the single-parent households (10.4%) are living below the poverty level. Within the married-couple family households, those with no children have the highest poverty rate, with 14 households (4.1%) falling below the poverty line. Among the single-parent households, those with 3 or 4 children have the highest poverty rate, with 5 household (100.0%) living below poverty.
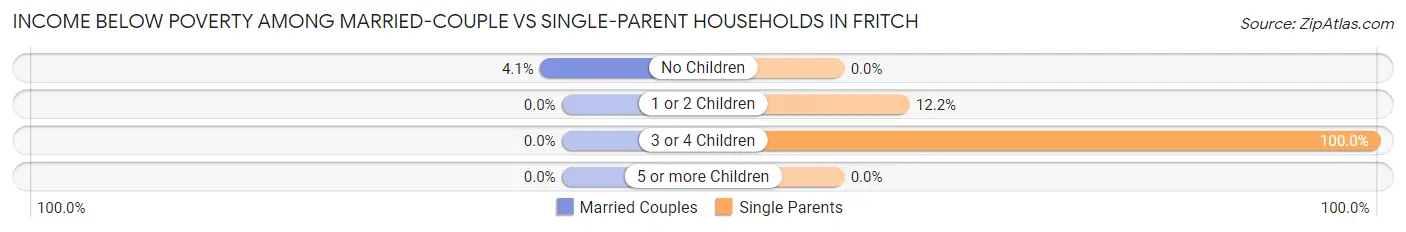
| Children | Married-Couple Families | Single-Parent Households |
| No Children | 14 (4.1%) | 0 (0.0%) |
| 1 or 2 Children | 0 (0.0%) | 9 (12.2%) |
| 3 or 4 Children | 0 (0.0%) | 5 (100.0%) |
| 5 or more Children | 0 (0.0%) | 0 (0.0%) |
| Total | 14 (3.1%) | 14 (10.4%) |
Race in Fritch
The most populous races in Fritch are White / Caucasian (2,275 | 92.0%), Hispanic or Latino (128 | 5.2%), and Native / Alaskan (95 | 3.8%).
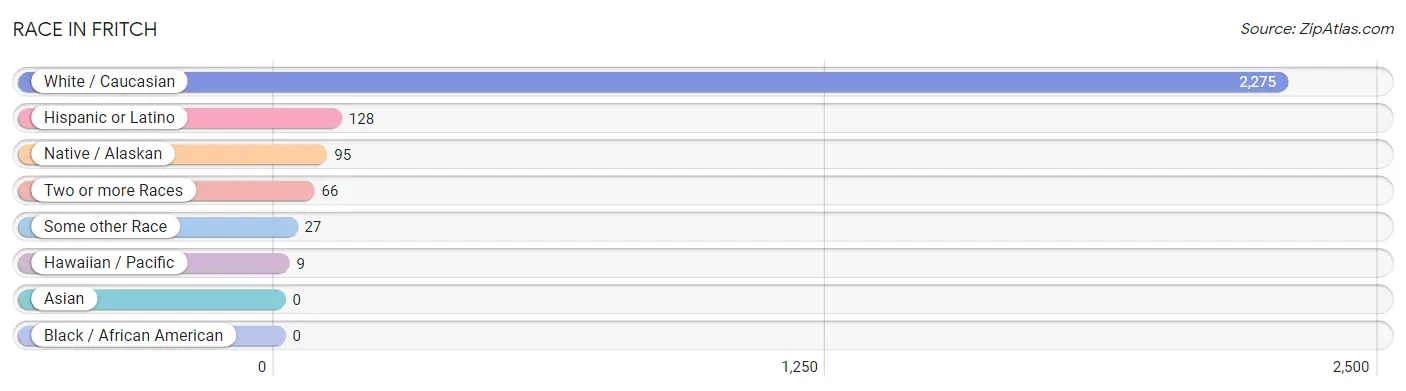
| Race | # Population | % Population |
| Asian | 0 | 0.0% |
| Black / African American | 0 | 0.0% |
| Hawaiian / Pacific | 9 | 0.4% |
| Hispanic or Latino | 128 | 5.2% |
| Native / Alaskan | 95 | 3.8% |
| White / Caucasian | 2,275 | 92.0% |
| Two or more Races | 66 | 2.7% |
| Some other Race | 27 | 1.1% |
| Total | 2,472 | 100.0% |
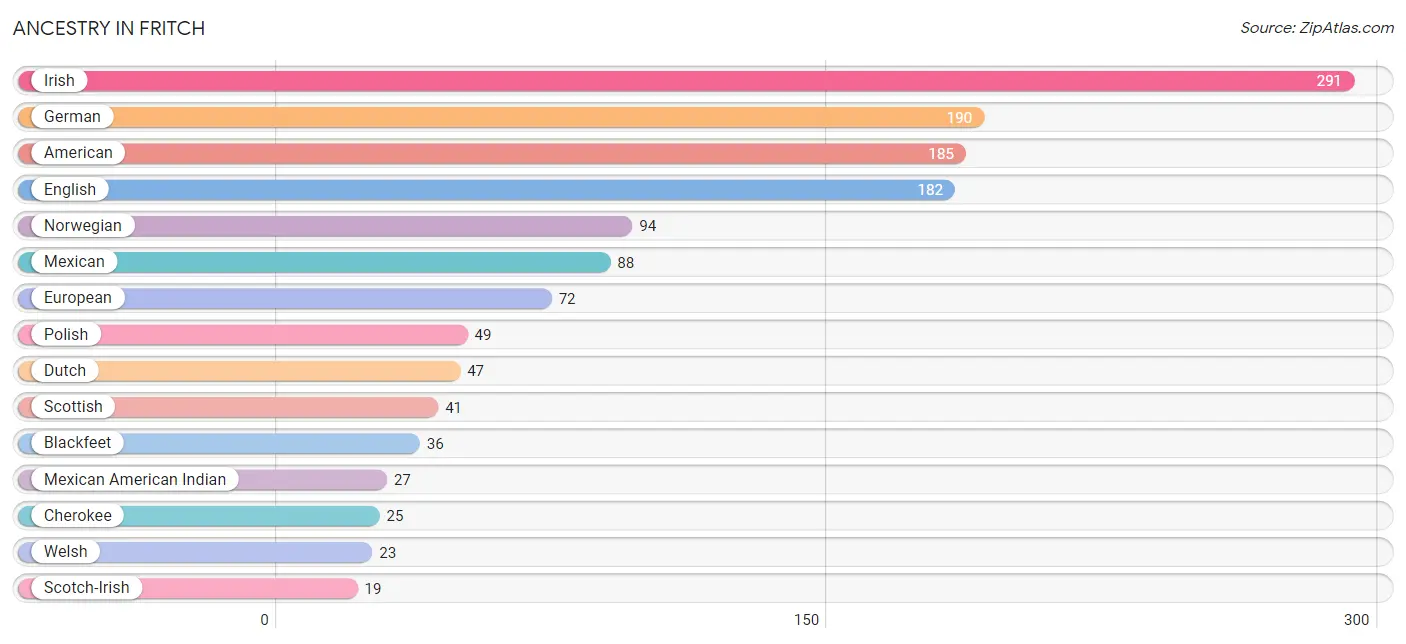
Ancestry in Fritch
The most populous ancestries reported in Fritch are Irish (291 | 11.8%), German (190 | 7.7%), American (185 | 7.5%), English (182 | 7.4%), and Norwegian (94 | 3.8%), together accounting for 38.1% of all Fritch residents.
| Ancestry | # Population | % Population |
| American | 185 | 7.5% |
| Austrian | 18 | 0.7% |
| Bhutanese | 4 | 0.2% |
| Blackfeet | 36 | 1.5% |
| British | 17 | 0.7% |
| Cherokee | 25 | 1.0% |
| Choctaw | 10 | 0.4% |
| Czech | 6 | 0.2% |
| Danish | 3 | 0.1% |
| Dutch | 47 | 1.9% |
| Eastern European | 2 | 0.1% |
| English | 182 | 7.4% |
| European | 72 | 2.9% |
| French | 15 | 0.6% |
| French Canadian | 7 | 0.3% |
| German | 190 | 7.7% |
| Guamanian / Chamorro | 9 | 0.4% |
| Irish | 291 | 11.8% |
| Mexican | 88 | 3.6% |
| Mexican American Indian | 27 | 1.1% |
| Navajo | 6 | 0.2% |
| Norwegian | 94 | 3.8% |
| Polish | 49 | 2.0% |
| Scotch-Irish | 19 | 0.8% |
| Scottish | 41 | 1.7% |
| Swedish | 7 | 0.3% |
| Swiss | 5 | 0.2% |
| Welsh | 23 | 0.9% | View All 28 Rows |
Immigrants in Fritch
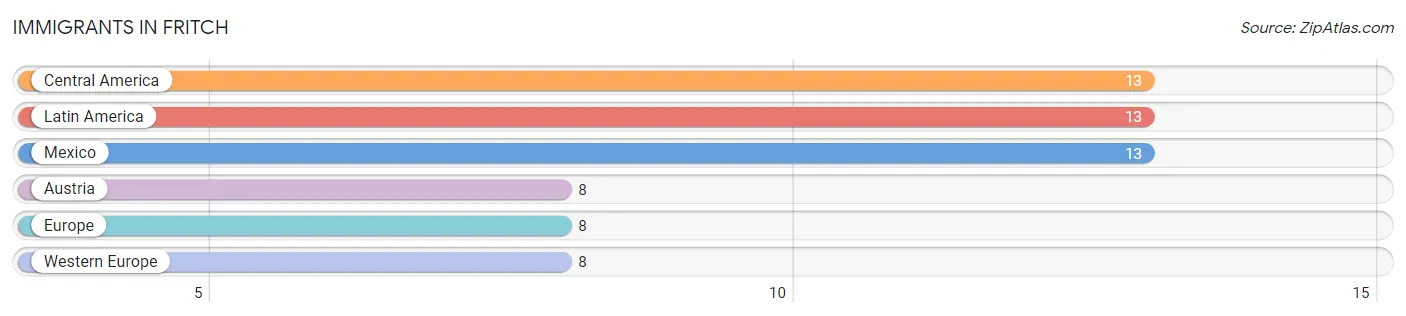
The most numerous immigrant groups reported in Fritch came from Central America (13 | 0.5%), Latin America (13 | 0.5%), Mexico (13 | 0.5%), Austria (8 | 0.3%), and Europe (8 | 0.3%), together accounting for 2.2% of all Fritch residents.
| Immigration Origin | # Population | % Population |
| Austria | 8 | 0.3% |
| Central America | 13 | 0.5% |
| Europe | 8 | 0.3% |
| Latin America | 13 | 0.5% |
| Mexico | 13 | 0.5% |
| Western Europe | 8 | 0.3% | View All 6 Rows |
Sex and Age in Fritch
Sex and Age in Fritch
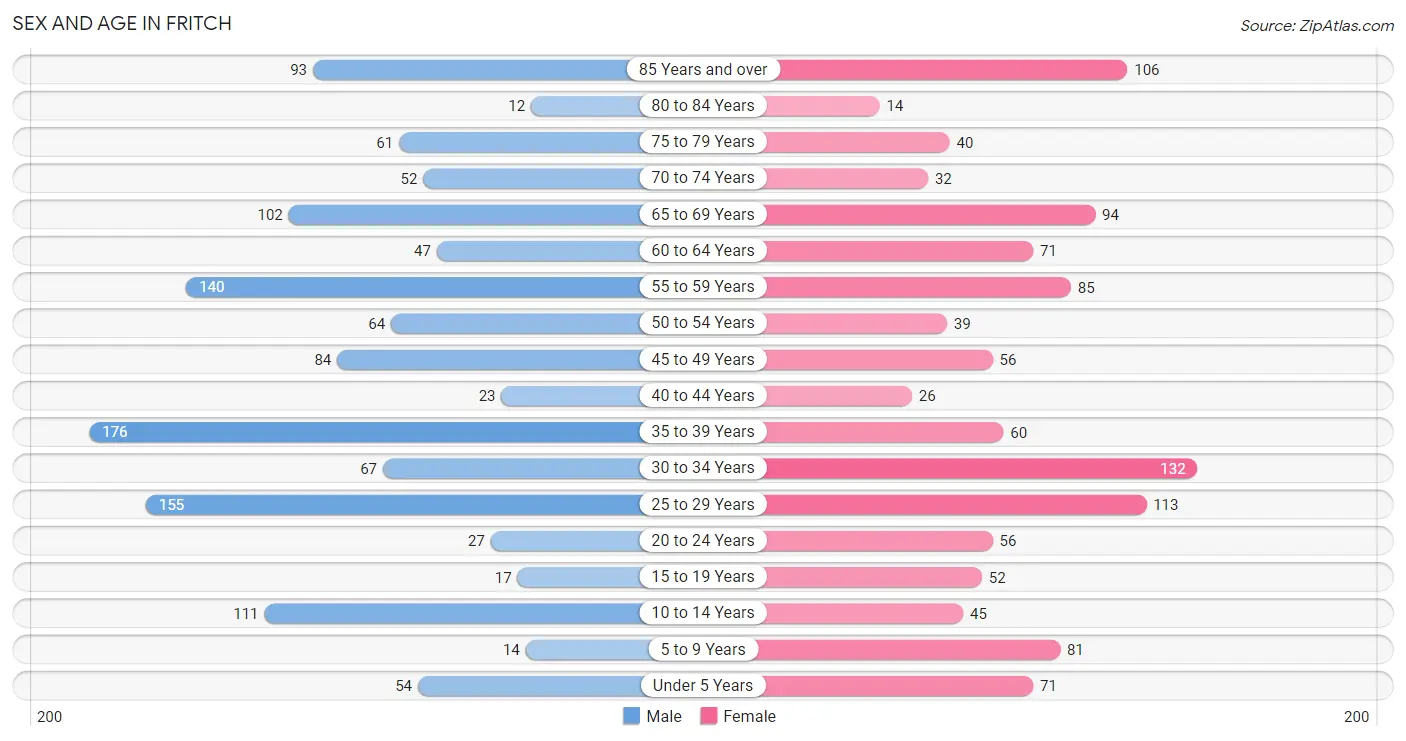
The most populous age groups in Fritch are 35 to 39 Years (176 | 13.6%) for men and 30 to 34 Years (132 | 11.3%) for women.
| Age Bracket | Male | Female |
| Under 5 Years | 54 (4.2%) | 71 (6.0%) |
| 5 to 9 Years | 14 (1.1%) | 81 (6.9%) |
| 10 to 14 Years | 111 (8.6%) | 45 (3.8%) |
| 15 to 19 Years | 17 (1.3%) | 52 (4.4%) |
| 20 to 24 Years | 27 (2.1%) | 56 (4.8%) |
| 25 to 29 Years | 155 (11.9%) | 113 (9.6%) |
| 30 to 34 Years | 67 (5.2%) | 132 (11.3%) |
| 35 to 39 Years | 176 (13.6%) | 60 (5.1%) |
| 40 to 44 Years | 23 (1.8%) | 26 (2.2%) |
| 45 to 49 Years | 84 (6.5%) | 56 (4.8%) |
| 50 to 54 Years | 64 (4.9%) | 39 (3.3%) |
| 55 to 59 Years | 140 (10.8%) | 85 (7.2%) |
| 60 to 64 Years | 47 (3.6%) | 71 (6.0%) |
| 65 to 69 Years | 102 (7.9%) | 94 (8.0%) |
| 70 to 74 Years | 52 (4.0%) | 32 (2.7%) |
| 75 to 79 Years | 61 (4.7%) | 40 (3.4%) |
| 80 to 84 Years | 12 (0.9%) | 14 (1.2%) |
| 85 Years and over | 93 (7.2%) | 106 (9.0%) |
| Total | 1,299 (100.0%) | 1,173 (100.0%) |
Families and Households in Fritch
Median Family Size in Fritch
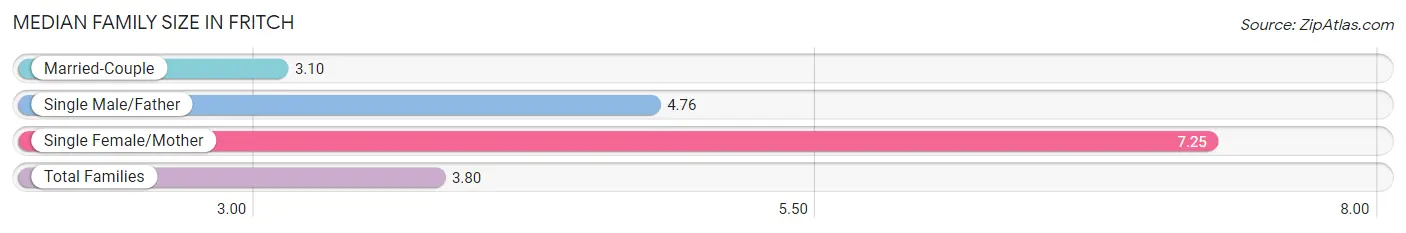
The median family size in Fritch is 3.80 persons per family, with single female/mother families (76 | 12.8%) accounting for the largest median family size of 7.25 persons per family. On the other hand, married-couple families (458 | 77.4%) represent the smallest median family size with 3.10 persons per family.
| Family Type | # Families | Family Size |
| Married-Couple | 458 (77.4%) | 3.10 |
| Single Male/Father | 58 (9.8%) | 4.76 |
| Single Female/Mother | 76 (12.8%) | 7.25 |
| Total Families | 592 (100.0%) | 3.80 |
Median Household Size in Fritch
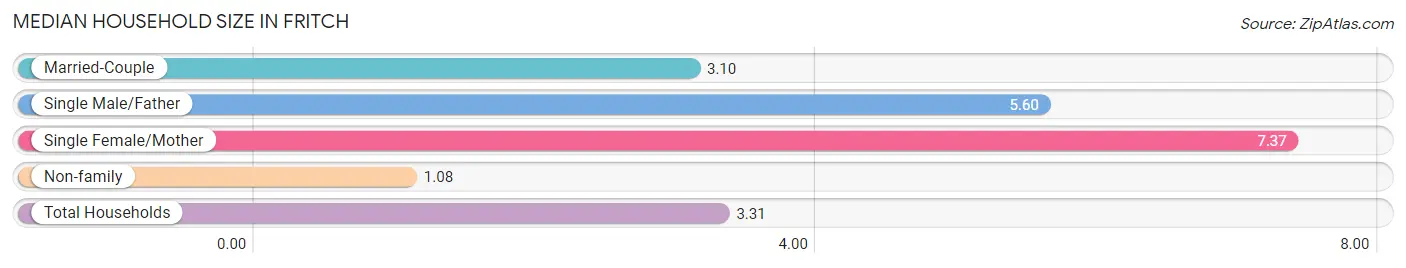
The median household size in Fritch is 3.31 persons per household, with single female/mother households (76 | 10.2%) accounting for the largest median household size of 7.37 persons per household. non-family households (154 | 20.6%) represent the smallest median household size with 1.08 persons per household.
| Household Type | # Households | Household Size |
| Married-Couple | 458 (61.4%) | 3.10 |
| Single Male/Father | 58 (7.8%) | 5.60 |
| Single Female/Mother | 76 (10.2%) | 7.37 |
| Non-family | 154 (20.6%) | 1.08 |
| Total Households | 746 (100.0%) | 3.31 |
Household Size by Marriage Status in Fritch
Out of a total of 746 households in Fritch, 592 (79.4%) are family households, while 154 (20.6%) are nonfamily households. The most numerous type of family households are 2-person households, comprising 328, and the most common type of nonfamily households are 1-person households, comprising 144.
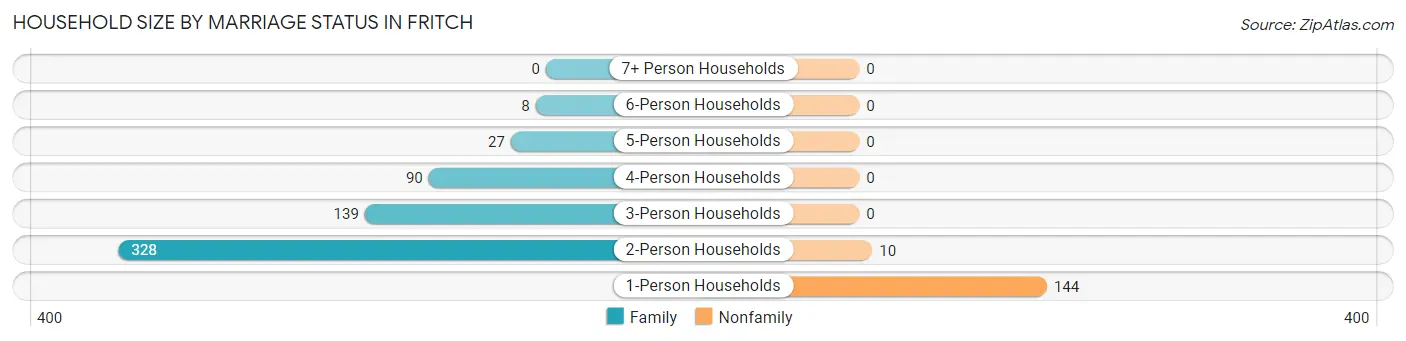
| Household Size | Family Households | Nonfamily Households |
| 1-Person Households | - | 144 (19.3%) |
| 2-Person Households | 328 (44.0%) | 10 (1.3%) |
| 3-Person Households | 139 (18.6%) | 0 (0.0%) |
| 4-Person Households | 90 (12.1%) | 0 (0.0%) |
| 5-Person Households | 27 (3.6%) | 0 (0.0%) |
| 6-Person Households | 8 (1.1%) | 0 (0.0%) |
| 7+ Person Households | 0 (0.0%) | 0 (0.0%) |
| Total | 592 (79.4%) | 154 (20.6%) |
Female Fertility in Fritch
Fertility by Age in Fritch
Average fertility rate in Fritch is 28.0 births per 1,000 women. Women in the age bracket of 20 to 34 years have the highest fertility rate with 47.0 births per 1,000 women. Women in the age bracket of 20 to 34 years acount for 100.0% of all women with births.
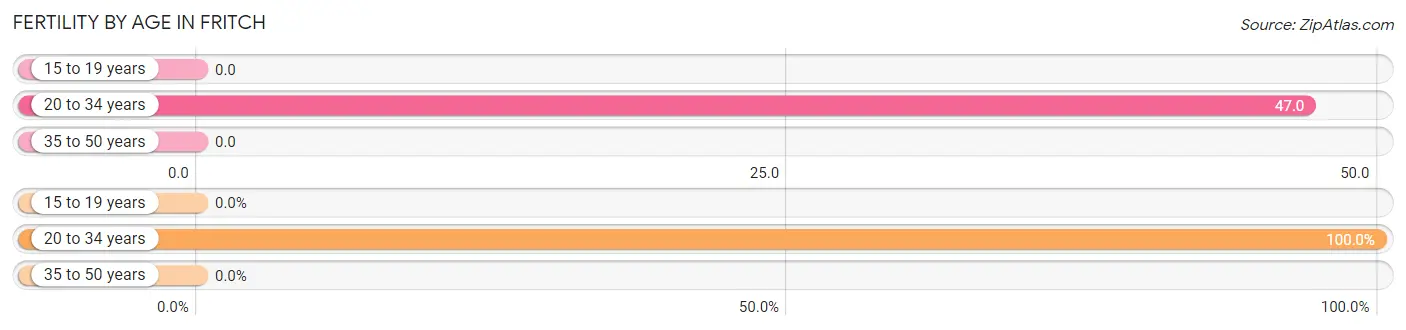
| Age Bracket | Women with Births | Births / 1,000 Women |
| 15 to 19 years | 0 (0.0%) | 0.0 |
| 20 to 34 years | 14 (100.0%) | 47.0 |
| 35 to 50 years | 0 (0.0%) | 0.0 |
| Total | 14 (100.0%) | 28.0 |
Fertility by Age by Marriage Status in Fritch
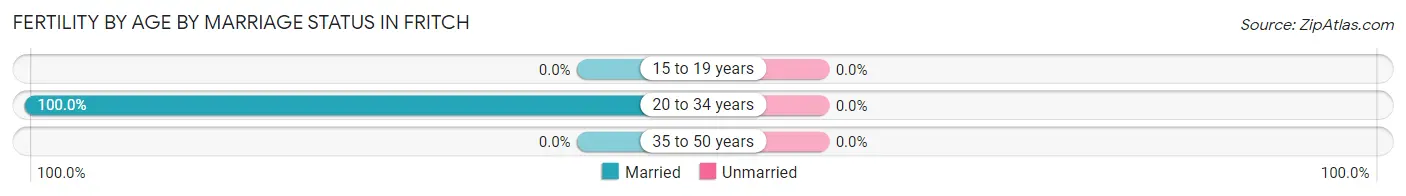
| Age Bracket | Married | Unmarried |
| 15 to 19 years | 0 (0.0%) | 0 (0.0%) |
| 20 to 34 years | 14 (100.0%) | 0 (0.0%) |
| 35 to 50 years | 0 (0.0%) | 0 (0.0%) |
| Total | 14 (100.0%) | 0 (0.0%) |
Fertility by Education in Fritch
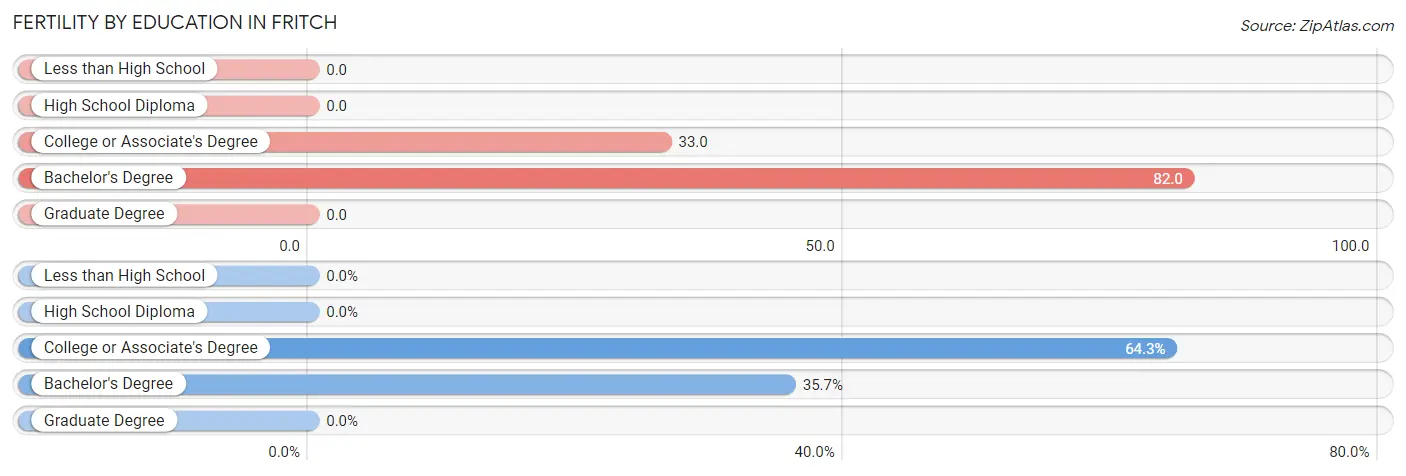
| Educational Attainment | Women with Births | Births / 1,000 Women |
| Less than High School | 0 (0.0%) | 0.0 |
| High School Diploma | 0 (0.0%) | 0.0 |
| College or Associate's Degree | 9 (64.3%) | 33.0 |
| Bachelor's Degree | 5 (35.7%) | 82.0 |
| Graduate Degree | 0 (0.0%) | 0.0 |
| Total | 14 (100.0%) | 28.0 |
Fertility by Education by Marriage Status in Fritch
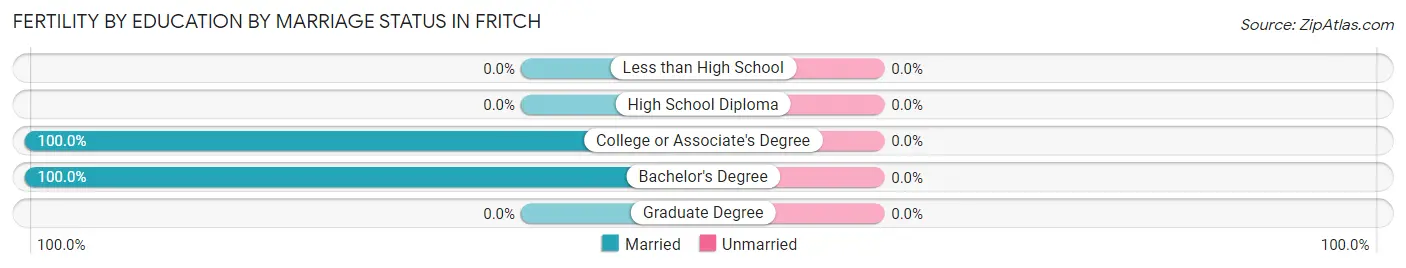
| Educational Attainment | Married | Unmarried |
| Less than High School | 0 (0.0%) | 0 (0.0%) |
| High School Diploma | 0 (0.0%) | 0 (0.0%) |
| College or Associate's Degree | 9 (100.0%) | 0 (0.0%) |
| Bachelor's Degree | 5 (100.0%) | 0 (0.0%) |
| Graduate Degree | 0 (0.0%) | 0 (0.0%) |
| Total | 14 (100.0%) | 0 (0.0%) |
Employment Characteristics in Fritch
Employment by Class of Employer in Fritch
Among the 1,114 employed individuals in Fritch, private company employees (887 | 79.6%), local government employees (90 | 8.1%), and not-for-profit organizations (57 | 5.1%) make up the most common classes of employment.
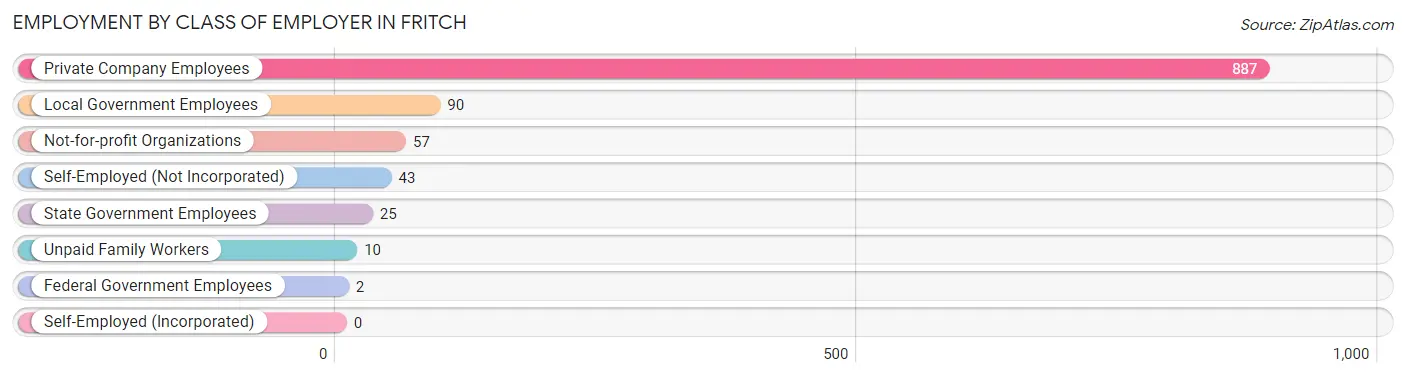
| Employer Class | # Employees | % Employees |
| Private Company Employees | 887 | 79.6% |
| Self-Employed (Incorporated) | 0 | 0.0% |
| Self-Employed (Not Incorporated) | 43 | 3.9% |
| Not-for-profit Organizations | 57 | 5.1% |
| Local Government Employees | 90 | 8.1% |
| State Government Employees | 25 | 2.2% |
| Federal Government Employees | 2 | 0.2% |
| Unpaid Family Workers | 10 | 0.9% |
| Total | 1,114 | 100.0% |
Employment Status by Age in Fritch
According to the labor force statistics for Fritch, out of the total population over 16 years of age (2,092), 57.8% or 1,209 individuals are in the labor force, with 7.9% or 96 of them unemployed. The age group with the highest labor force participation rate is 30 to 34 years, with 98.5% or 196 individuals in the labor force. Within the labor force, the 35 to 44 years age range has the highest percentage of unemployed individuals, with 25.4% or 62 of them being unemployed.
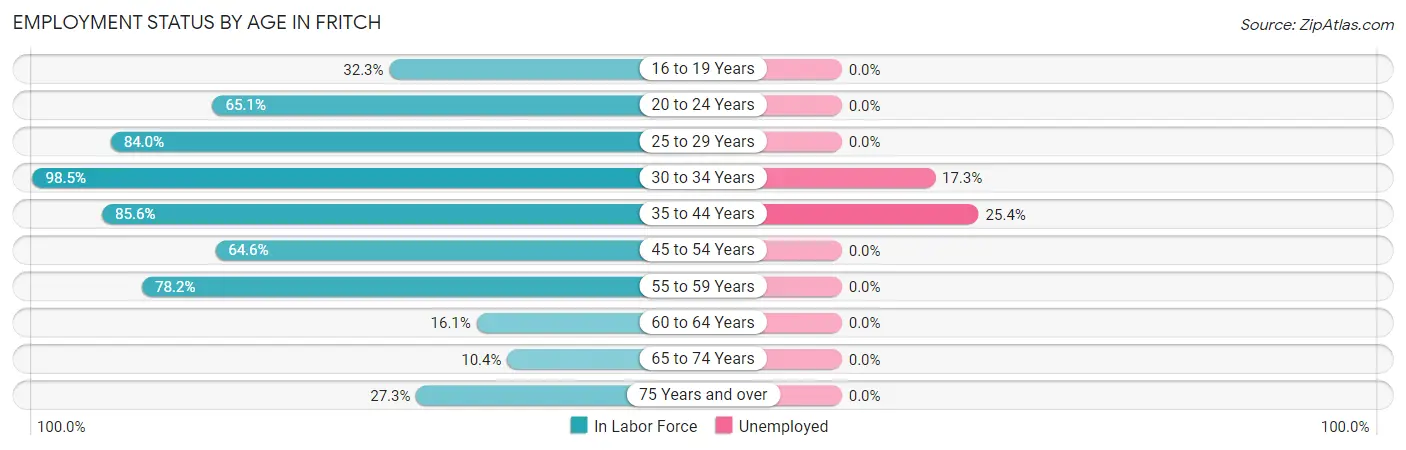
| Age Bracket | In Labor Force | Unemployed |
| 16 to 19 Years | 21 (32.3%) | 0 (0.0%) |
| 20 to 24 Years | 54 (65.1%) | 0 (0.0%) |
| 25 to 29 Years | 225 (84.0%) | 0 (0.0%) |
| 30 to 34 Years | 196 (98.5%) | 34 (17.3%) |
| 35 to 44 Years | 244 (85.6%) | 62 (25.4%) |
| 45 to 54 Years | 157 (64.6%) | 0 (0.0%) |
| 55 to 59 Years | 176 (78.2%) | 0 (0.0%) |
| 60 to 64 Years | 19 (16.1%) | 0 (0.0%) |
| 65 to 74 Years | 29 (10.4%) | 0 (0.0%) |
| 75 Years and over | 89 (27.3%) | 0 (0.0%) |
| Total | 1,209 (57.8%) | 96 (7.9%) |
Employment Status by Educational Attainment in Fritch
According to labor force statistics for Fritch, 76.0% of individuals (1,017) out of the total population between 25 and 64 years of age (1,338) are in the labor force, with 9.4% or 96 of them being unemployed. The group with the highest labor force participation rate are those with the educational attainment of college / associate degree, with 80.8% or 557 individuals in the labor force. Within the labor force, individuals with high school diploma education have the highest percentage of unemployment, with 14.2% or 34 of them being unemployed.
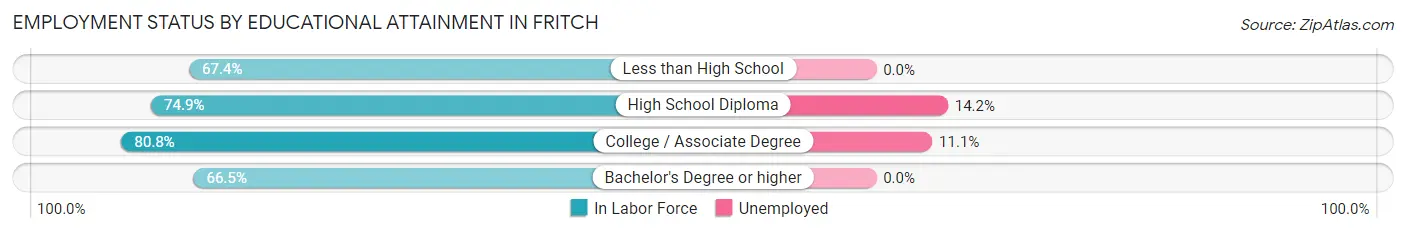
| Educational Attainment | In Labor Force | Unemployed |
| Less than High School | 116 (67.4%) | 0 (0.0%) |
| High School Diploma | 239 (74.9%) | 45 (14.2%) |
| College / Associate Degree | 557 (80.8%) | 76 (11.1%) |
| Bachelor's Degree or higher | 105 (66.5%) | 0 (0.0%) |
| Total | 1,017 (76.0%) | 126 (9.4%) |
Employment Occupations by Sex in Fritch
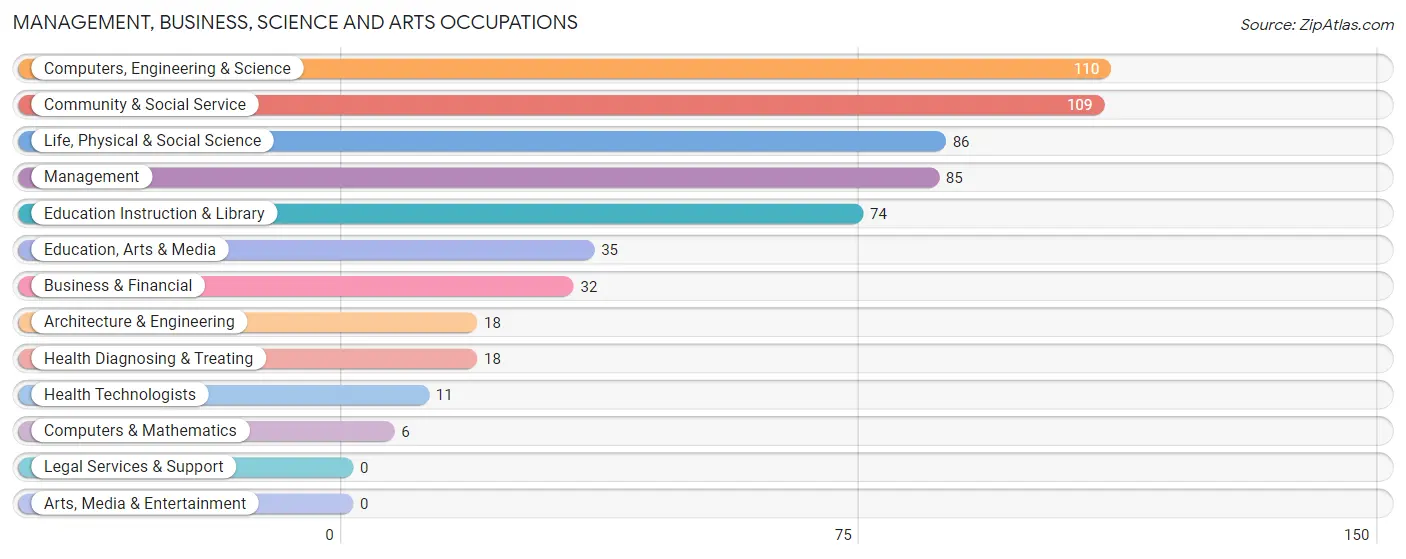
Management, Business, Science and Arts Occupations
The most common Management, Business, Science and Arts occupations in Fritch are Computers, Engineering & Science (110 | 9.9%), Community & Social Service (109 | 9.8%), Life, Physical & Social Science (86 | 7.7%), Management (85 | 7.6%), and Education Instruction & Library (74 | 6.6%).
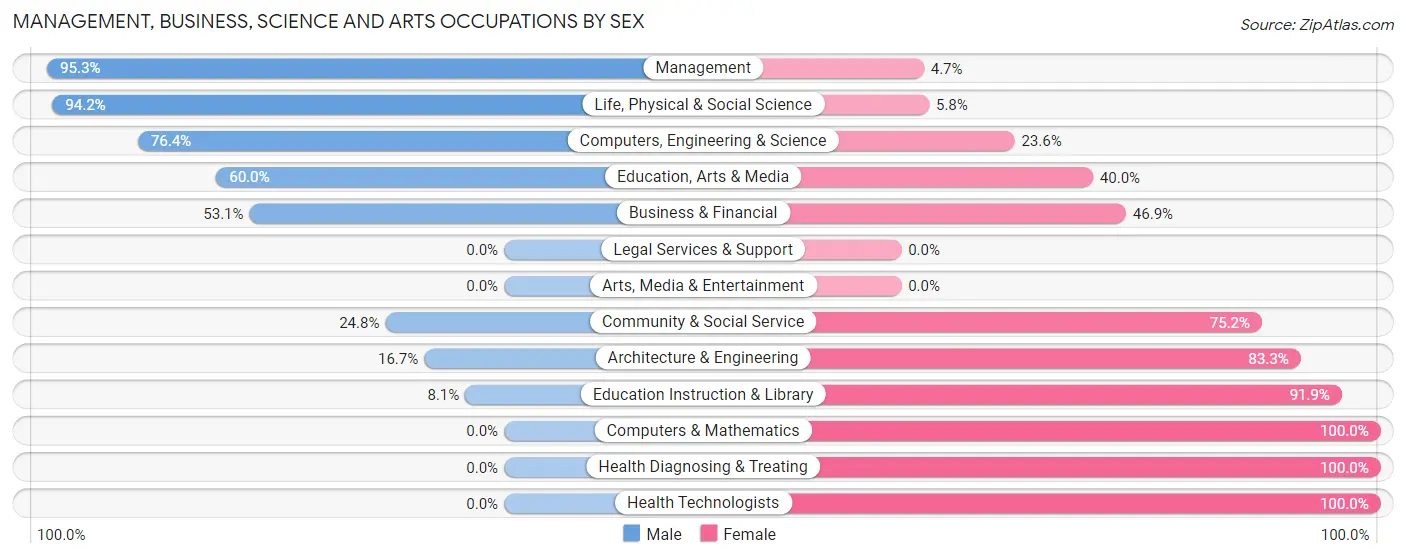
Management, Business, Science and Arts Occupations by Sex
Within the Management, Business, Science and Arts occupations in Fritch, the most male-oriented occupations are Management (95.3%), Life, Physical & Social Science (94.2%), and Computers, Engineering & Science (76.4%), while the most female-oriented occupations are Computers & Mathematics (100.0%), Health Diagnosing & Treating (100.0%), and Health Technologists (100.0%).
| Occupation | Male | Female |
| Management | 81 (95.3%) | 4 (4.7%) |
| Business & Financial | 17 (53.1%) | 15 (46.9%) |
| Computers, Engineering & Science | 84 (76.4%) | 26 (23.6%) |
| Computers & Mathematics | 0 (0.0%) | 6 (100.0%) |
| Architecture & Engineering | 3 (16.7%) | 15 (83.3%) |
| Life, Physical & Social Science | 81 (94.2%) | 5 (5.8%) |
| Community & Social Service | 27 (24.8%) | 82 (75.2%) |
| Education, Arts & Media | 21 (60.0%) | 14 (40.0%) |
| Legal Services & Support | 0 (0.0%) | 0 (0.0%) |
| Education Instruction & Library | 6 (8.1%) | 68 (91.9%) |
| Arts, Media & Entertainment | 0 (0.0%) | 0 (0.0%) |
| Health Diagnosing & Treating | 0 (0.0%) | 18 (100.0%) |
| Health Technologists | 0 (0.0%) | 11 (100.0%) |
| Total (Category) | 209 (59.0%) | 145 (41.0%) |
| Total (Overall) | 649 (58.3%) | 465 (41.7%) |
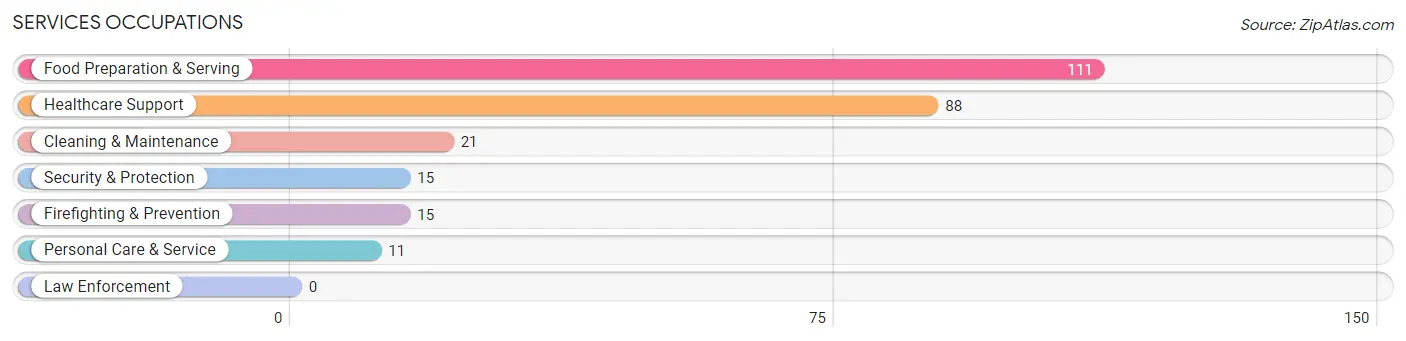
Services Occupations
The most common Services occupations in Fritch are Food Preparation & Serving (111 | 10.0%), Healthcare Support (88 | 7.9%), Cleaning & Maintenance (21 | 1.9%), Security & Protection (15 | 1.3%), and Firefighting & Prevention (15 | 1.3%).
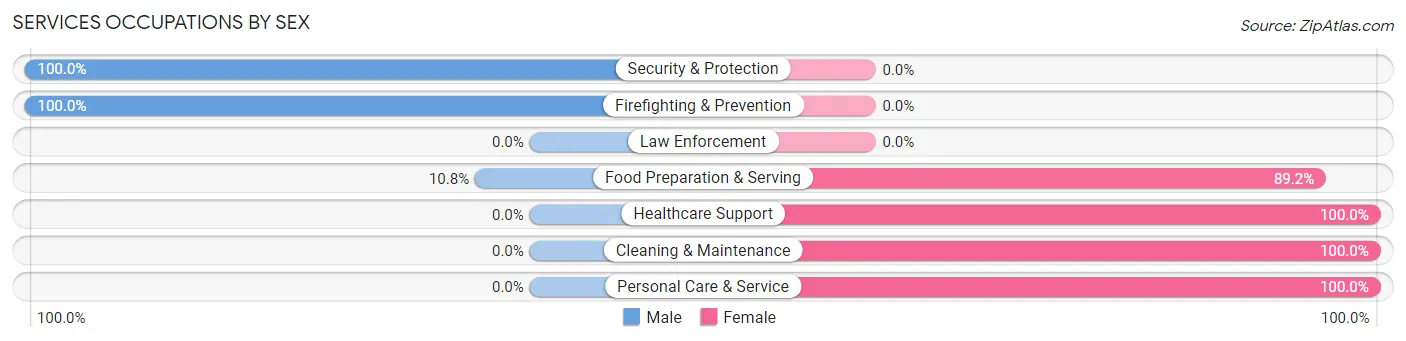
Services Occupations by Sex
Within the Services occupations in Fritch, the most male-oriented occupations are Security & Protection (100.0%), Firefighting & Prevention (100.0%), and Food Preparation & Serving (10.8%), while the most female-oriented occupations are Healthcare Support (100.0%), Cleaning & Maintenance (100.0%), and Personal Care & Service (100.0%).
| Occupation | Male | Female |
| Healthcare Support | 0 (0.0%) | 88 (100.0%) |
| Security & Protection | 15 (100.0%) | 0 (0.0%) |
| Firefighting & Prevention | 15 (100.0%) | 0 (0.0%) |
| Law Enforcement | 0 (0.0%) | 0 (0.0%) |
| Food Preparation & Serving | 12 (10.8%) | 99 (89.2%) |
| Cleaning & Maintenance | 0 (0.0%) | 21 (100.0%) |
| Personal Care & Service | 0 (0.0%) | 11 (100.0%) |
| Total (Category) | 27 (11.0%) | 219 (89.0%) |
| Total (Overall) | 649 (58.3%) | 465 (41.7%) |
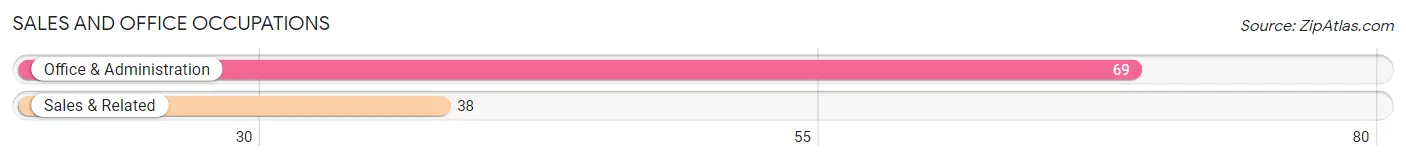
Sales and Office Occupations
The most common Sales and Office occupations in Fritch are Office & Administration (69 | 6.2%), and Sales & Related (38 | 3.4%).
Sales and Office Occupations by Sex
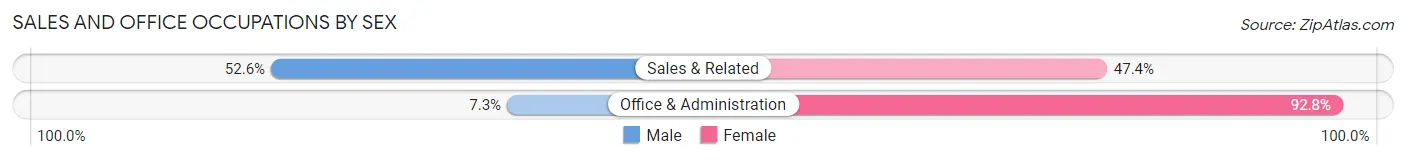
| Occupation | Male | Female |
| Sales & Related | 20 (52.6%) | 18 (47.4%) |
| Office & Administration | 5 (7.2%) | 64 (92.7%) |
| Total (Category) | 25 (23.4%) | 82 (76.6%) |
| Total (Overall) | 649 (58.3%) | 465 (41.7%) |
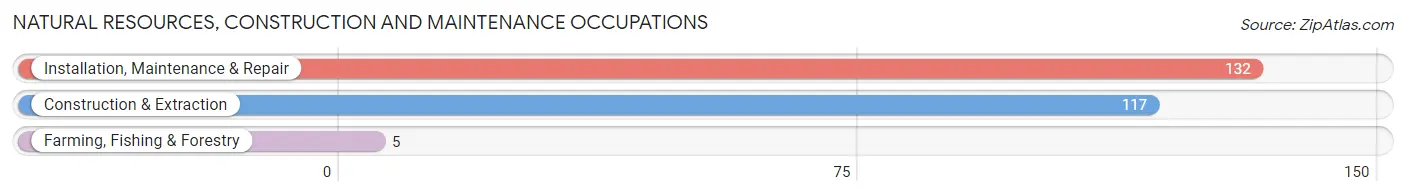
Natural Resources, Construction and Maintenance Occupations
The most common Natural Resources, Construction and Maintenance occupations in Fritch are Installation, Maintenance & Repair (132 | 11.8%), Construction & Extraction (117 | 10.5%), and Farming, Fishing & Forestry (5 | 0.4%).
Natural Resources, Construction and Maintenance Occupations by Sex
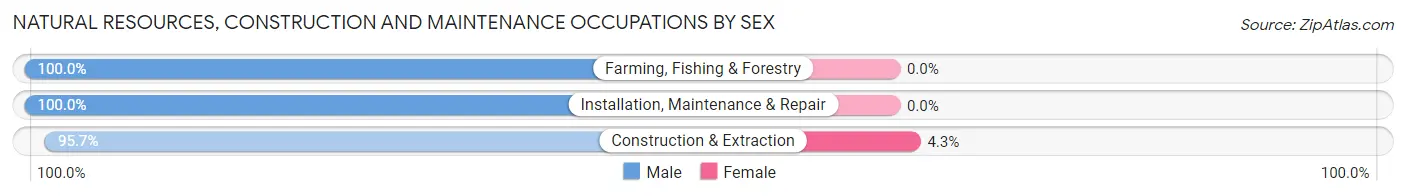
| Occupation | Male | Female |
| Farming, Fishing & Forestry | 5 (100.0%) | 0 (0.0%) |
| Construction & Extraction | 112 (95.7%) | 5 (4.3%) |
| Installation, Maintenance & Repair | 132 (100.0%) | 0 (0.0%) |
| Total (Category) | 249 (98.0%) | 5 (2.0%) |
| Total (Overall) | 649 (58.3%) | 465 (41.7%) |
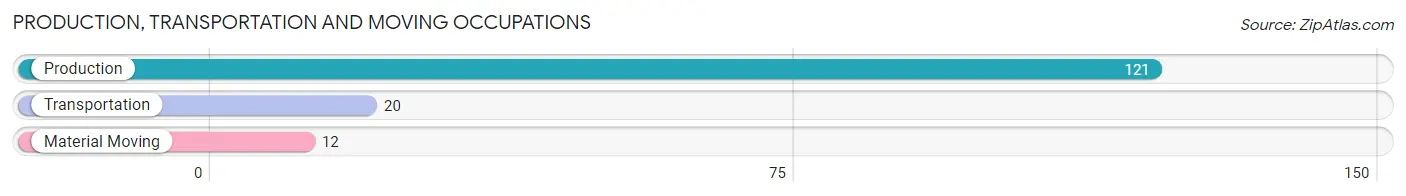
Production, Transportation and Moving Occupations
The most common Production, Transportation and Moving occupations in Fritch are Production (121 | 10.9%), Transportation (20 | 1.8%), and Material Moving (12 | 1.1%).
Production, Transportation and Moving Occupations by Sex
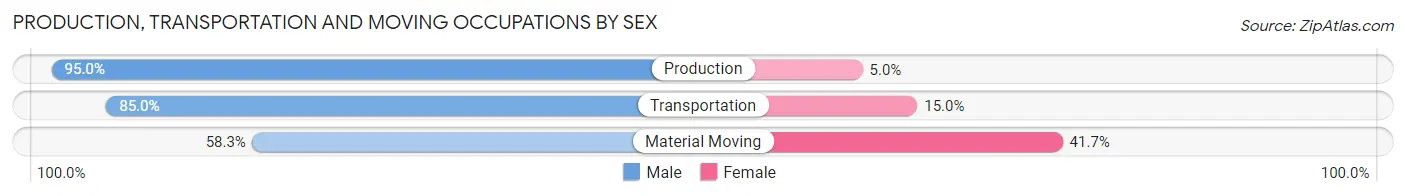
| Occupation | Male | Female |
| Production | 115 (95.0%) | 6 (5.0%) |
| Transportation | 17 (85.0%) | 3 (15.0%) |
| Material Moving | 7 (58.3%) | 5 (41.7%) |
| Total (Category) | 139 (90.8%) | 14 (9.1%) |
| Total (Overall) | 649 (58.3%) | 465 (41.7%) |
Employment Industries by Sex in Fritch
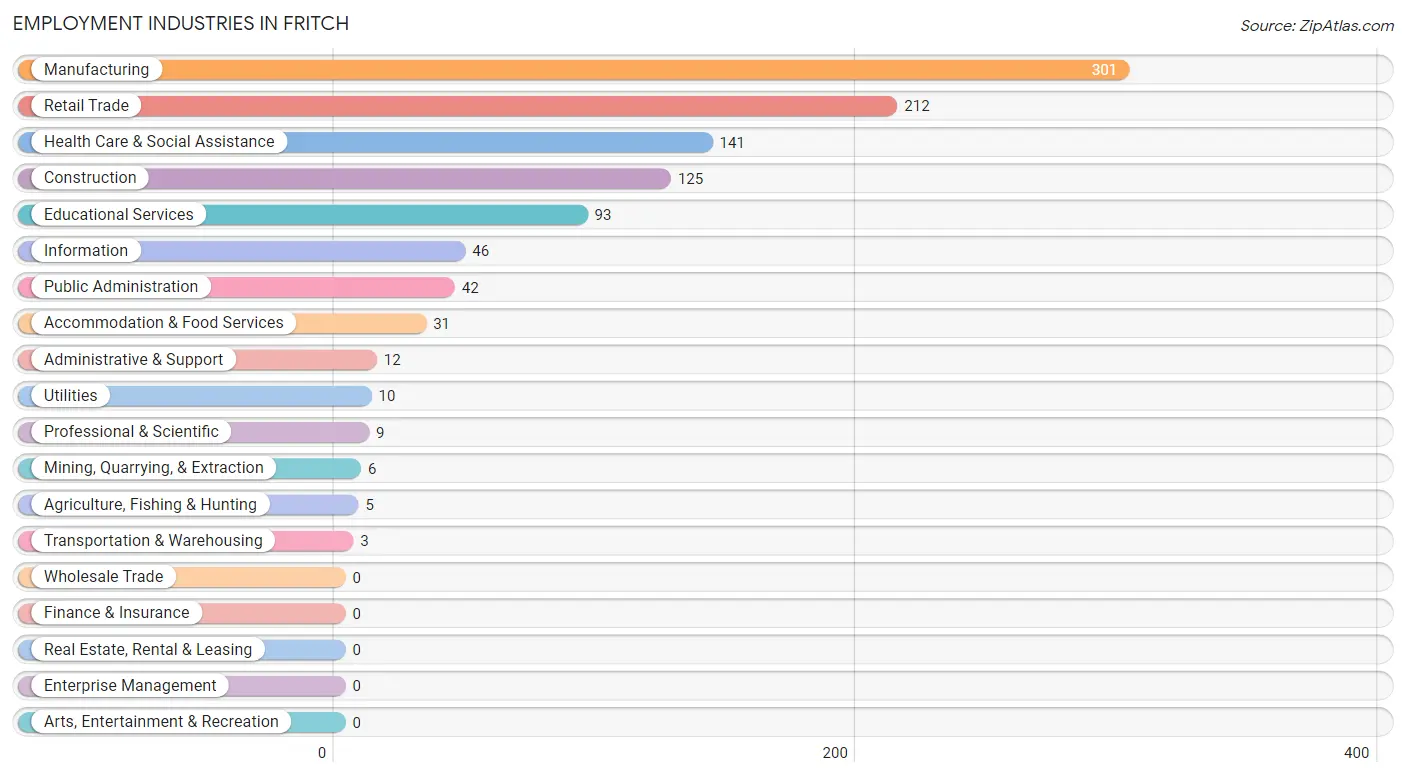
Employment Industries in Fritch
The major employment industries in Fritch include Manufacturing (301 | 27.0%), Retail Trade (212 | 19.0%), Health Care & Social Assistance (141 | 12.7%), Construction (125 | 11.2%), and Educational Services (93 | 8.4%).
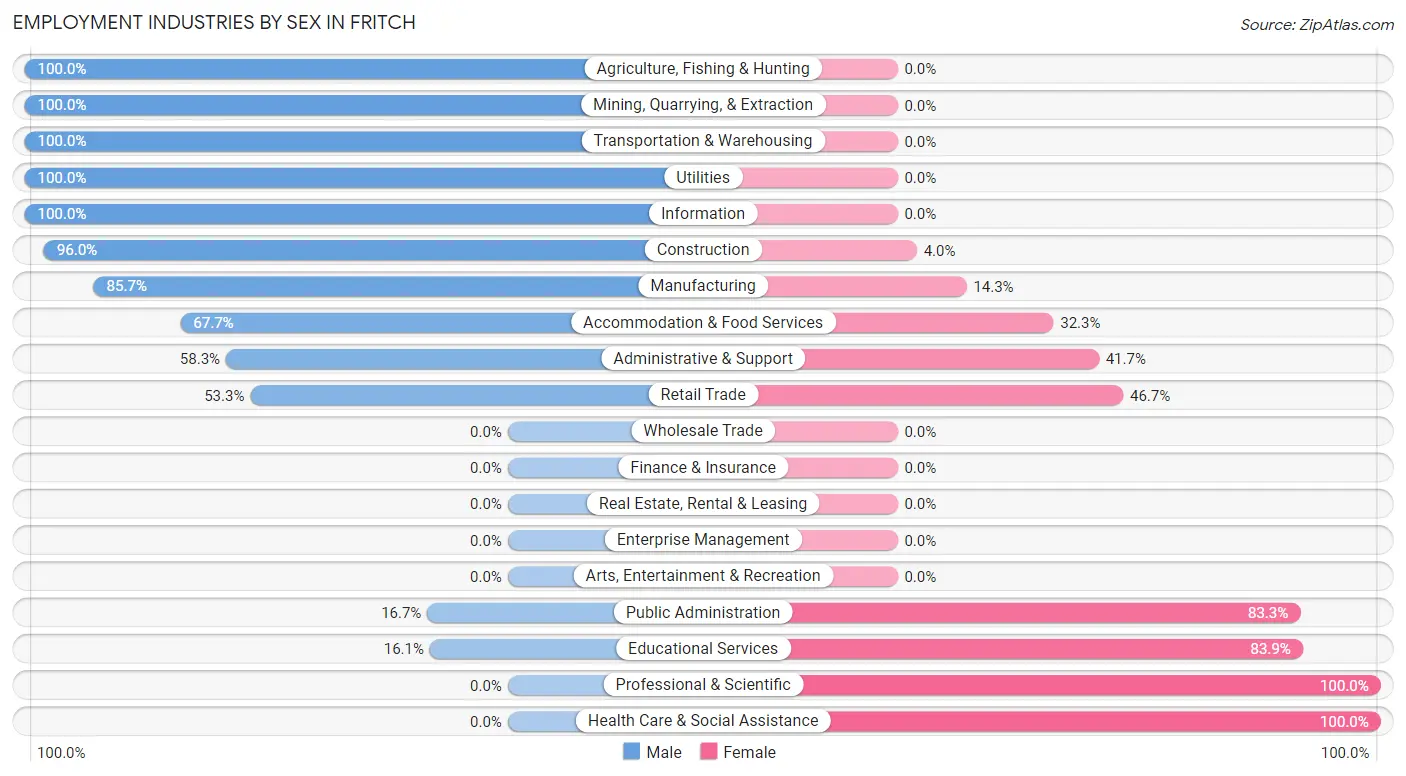
Employment Industries by Sex in Fritch
The Fritch industries that see more men than women are Agriculture, Fishing & Hunting (100.0%), Mining, Quarrying, & Extraction (100.0%), and Transportation & Warehousing (100.0%), whereas the industries that tend to have a higher number of women are Professional & Scientific (100.0%), Health Care & Social Assistance (100.0%), and Educational Services (83.9%).
| Industry | Male | Female |
| Agriculture, Fishing & Hunting | 5 (100.0%) | 0 (0.0%) |
| Mining, Quarrying, & Extraction | 6 (100.0%) | 0 (0.0%) |
| Construction | 120 (96.0%) | 5 (4.0%) |
| Manufacturing | 258 (85.7%) | 43 (14.3%) |
| Wholesale Trade | 0 (0.0%) | 0 (0.0%) |
| Retail Trade | 113 (53.3%) | 99 (46.7%) |
| Transportation & Warehousing | 3 (100.0%) | 0 (0.0%) |
| Utilities | 10 (100.0%) | 0 (0.0%) |
| Information | 46 (100.0%) | 0 (0.0%) |
| Finance & Insurance | 0 (0.0%) | 0 (0.0%) |
| Real Estate, Rental & Leasing | 0 (0.0%) | 0 (0.0%) |
| Professional & Scientific | 0 (0.0%) | 9 (100.0%) |
| Enterprise Management | 0 (0.0%) | 0 (0.0%) |
| Administrative & Support | 7 (58.3%) | 5 (41.7%) |
| Educational Services | 15 (16.1%) | 78 (83.9%) |
| Health Care & Social Assistance | 0 (0.0%) | 141 (100.0%) |
| Arts, Entertainment & Recreation | 0 (0.0%) | 0 (0.0%) |
| Accommodation & Food Services | 21 (67.7%) | 10 (32.3%) |
| Public Administration | 7 (16.7%) | 35 (83.3%) |
| Total | 649 (58.3%) | 465 (41.7%) |
Education in Fritch
School Enrollment in Fritch
The most common levels of schooling among the 427 students in Fritch are middle school (138 | 32.3%), college / undergraduate (110 | 25.8%), and elementary school (74 | 17.3%).
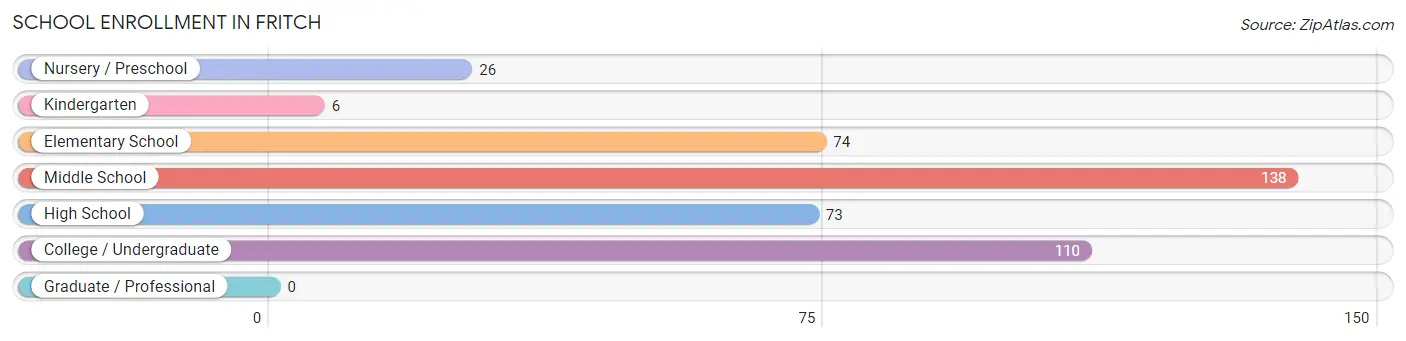
| School Level | # Students | % Students |
| Nursery / Preschool | 26 | 6.1% |
| Kindergarten | 6 | 1.4% |
| Elementary School | 74 | 17.3% |
| Middle School | 138 | 32.3% |
| High School | 73 | 17.1% |
| College / Undergraduate | 110 | 25.8% |
| Graduate / Professional | 0 | 0.0% |
| Total | 427 | 100.0% |
School Enrollment by Age by Funding Source in Fritch
Out of a total of 427 students who are enrolled in schools in Fritch, 17 (4.0%) attend a private institution, while the remaining 410 (96.0%) are enrolled in public schools. The age group of 5 to 9 year old has the highest likelihood of being enrolled in private schools, with 11 (14.3% in the age bracket) enrolled. Conversely, the age group of 3 to 4 year olds has the lowest likelihood of being enrolled in a private school, with 19 (100.0% in the age bracket) attending a public institution.
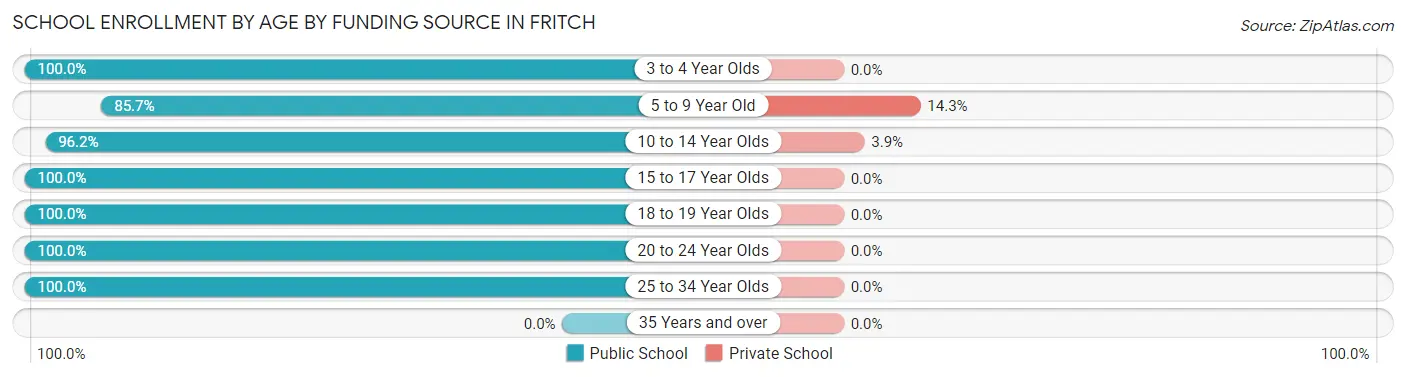
| Age Bracket | Public School | Private School |
| 3 to 4 Year Olds | 19 (100.0%) | 0 (0.0%) |
| 5 to 9 Year Old | 66 (85.7%) | 11 (14.3%) |
| 10 to 14 Year Olds | 150 (96.2%) | 6 (3.8%) |
| 15 to 17 Year Olds | 51 (100.0%) | 0 (0.0%) |
| 18 to 19 Year Olds | 18 (100.0%) | 0 (0.0%) |
| 20 to 24 Year Olds | 7 (100.0%) | 0 (0.0%) |
| 25 to 34 Year Olds | 99 (100.0%) | 0 (0.0%) |
| 35 Years and over | 0 (0.0%) | 0 (0.0%) |
| Total | 410 (96.0%) | 17 (4.0%) |
Educational Attainment by Field of Study in Fritch
Business (49 | 18.8%), education (48 | 18.4%), computers & mathematics (37 | 14.2%), engineering (22 | 8.4%), and communications (22 | 8.4%) are the most common fields of study among 261 individuals in Fritch who have obtained a bachelor's degree or higher.
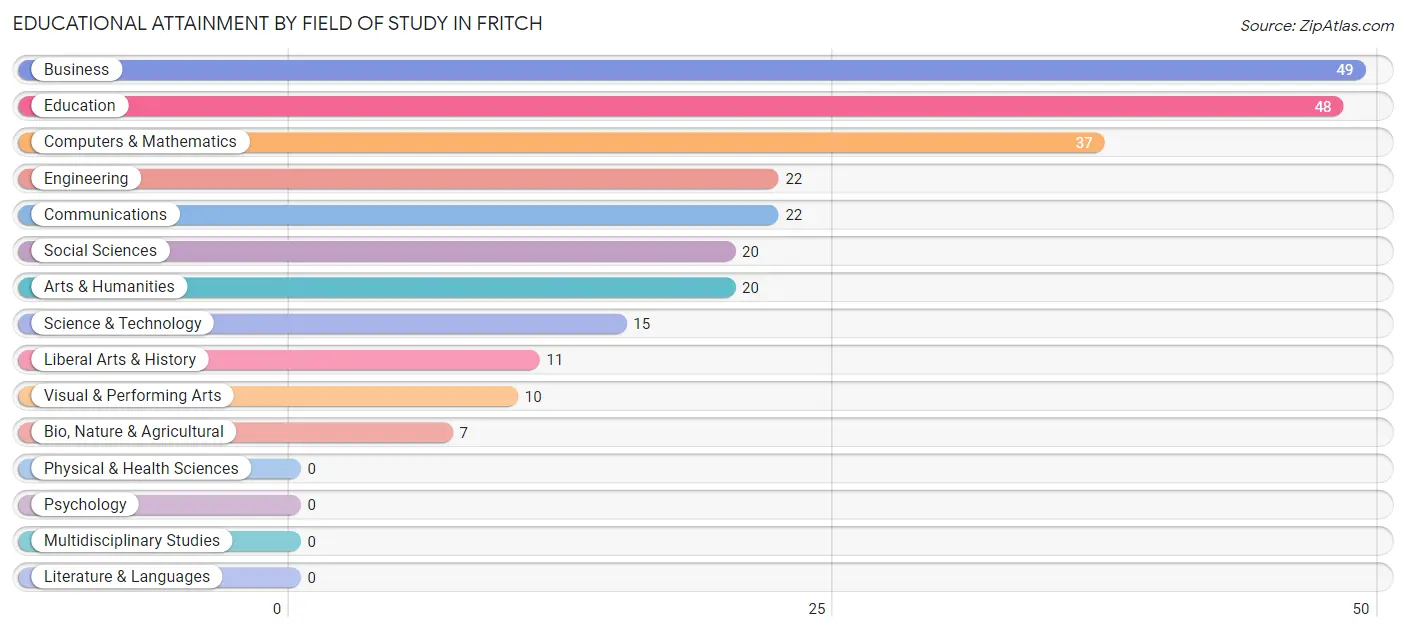
| Field of Study | # Graduates | % Graduates |
| Computers & Mathematics | 37 | 14.2% |
| Bio, Nature & Agricultural | 7 | 2.7% |
| Physical & Health Sciences | 0 | 0.0% |
| Psychology | 0 | 0.0% |
| Social Sciences | 20 | 7.7% |
| Engineering | 22 | 8.4% |
| Multidisciplinary Studies | 0 | 0.0% |
| Science & Technology | 15 | 5.8% |
| Business | 49 | 18.8% |
| Education | 48 | 18.4% |
| Literature & Languages | 0 | 0.0% |
| Liberal Arts & History | 11 | 4.2% |
| Visual & Performing Arts | 10 | 3.8% |
| Communications | 22 | 8.4% |
| Arts & Humanities | 20 | 7.7% |
| Total | 261 | 100.0% |
Transportation & Commute in Fritch
Vehicle Availability by Sex in Fritch
The most prevalent vehicle ownership categories in Fritch are males with 2 vehicles (355, accounting for 54.7%) and females with 2 vehicles (210, making up 76.3%).
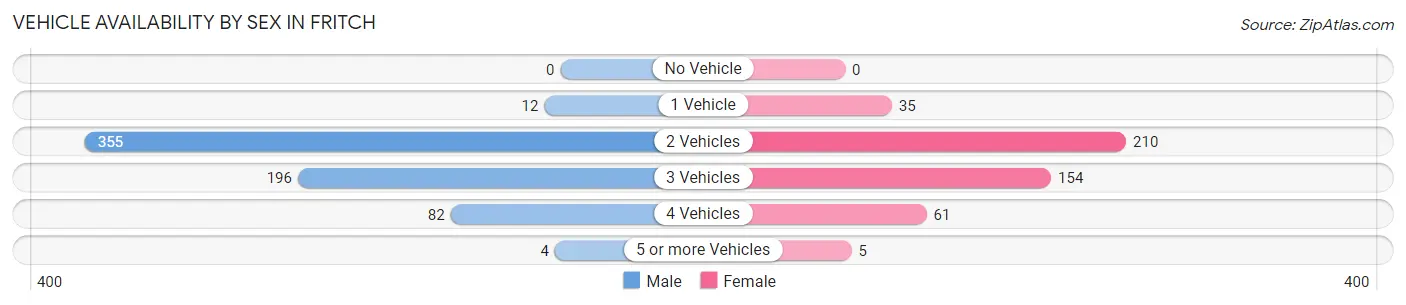
| Vehicles Available | Male | Female |
| No Vehicle | 0 (0.0%) | 0 (0.0%) |
| 1 Vehicle | 12 (1.8%) | 35 (7.5%) |
| 2 Vehicles | 355 (54.7%) | 210 (45.2%) |
| 3 Vehicles | 196 (30.2%) | 154 (33.1%) |
| 4 Vehicles | 82 (12.6%) | 61 (13.1%) |
| 5 or more Vehicles | 4 (0.6%) | 5 (1.1%) |
| Total | 649 (100.0%) | 465 (100.0%) |
Commute Time in Fritch
The most frequently occuring commute durations in Fritch are 15 to 19 minutes (357 commuters, 32.8%), 30 to 34 minutes (175 commuters, 16.1%), and 5 to 9 minutes (122 commuters, 11.2%).
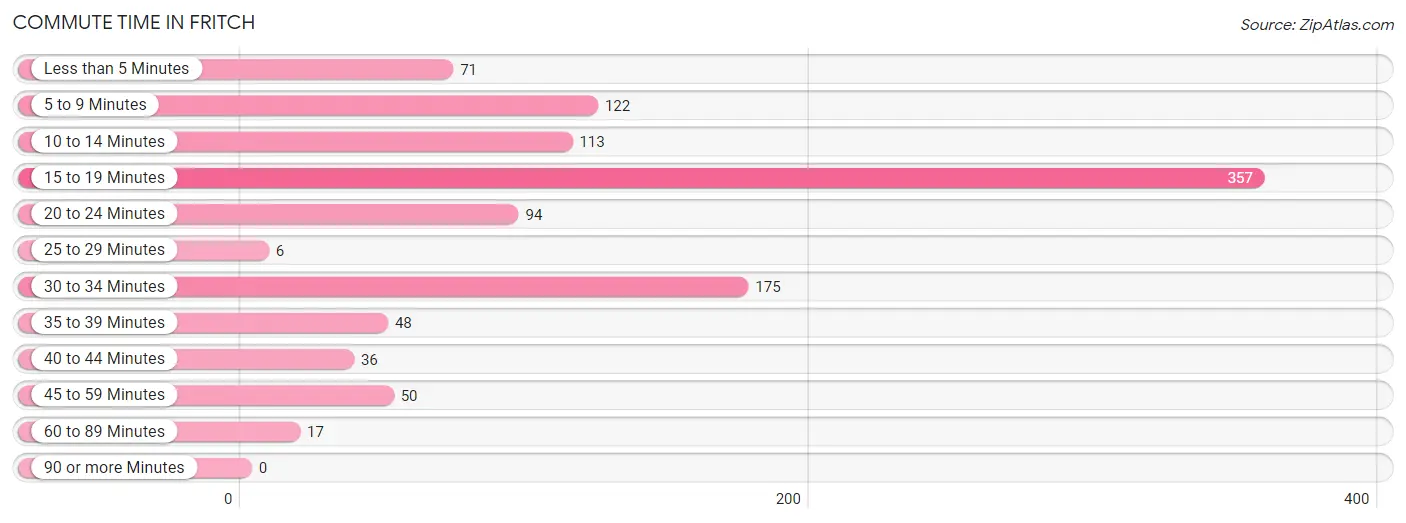
| Commute Time | # Commuters | % Commuters |
| Less than 5 Minutes | 71 | 6.5% |
| 5 to 9 Minutes | 122 | 11.2% |
| 10 to 14 Minutes | 113 | 10.4% |
| 15 to 19 Minutes | 357 | 32.8% |
| 20 to 24 Minutes | 94 | 8.6% |
| 25 to 29 Minutes | 6 | 0.5% |
| 30 to 34 Minutes | 175 | 16.1% |
| 35 to 39 Minutes | 48 | 4.4% |
| 40 to 44 Minutes | 36 | 3.3% |
| 45 to 59 Minutes | 50 | 4.6% |
| 60 to 89 Minutes | 17 | 1.6% |
| 90 or more Minutes | 0 | 0.0% |
Commute Time by Sex in Fritch
The most common commute times in Fritch are 15 to 19 minutes (211 commuters, 32.9%) for males and 15 to 19 minutes (146 commuters, 32.6%) for females.
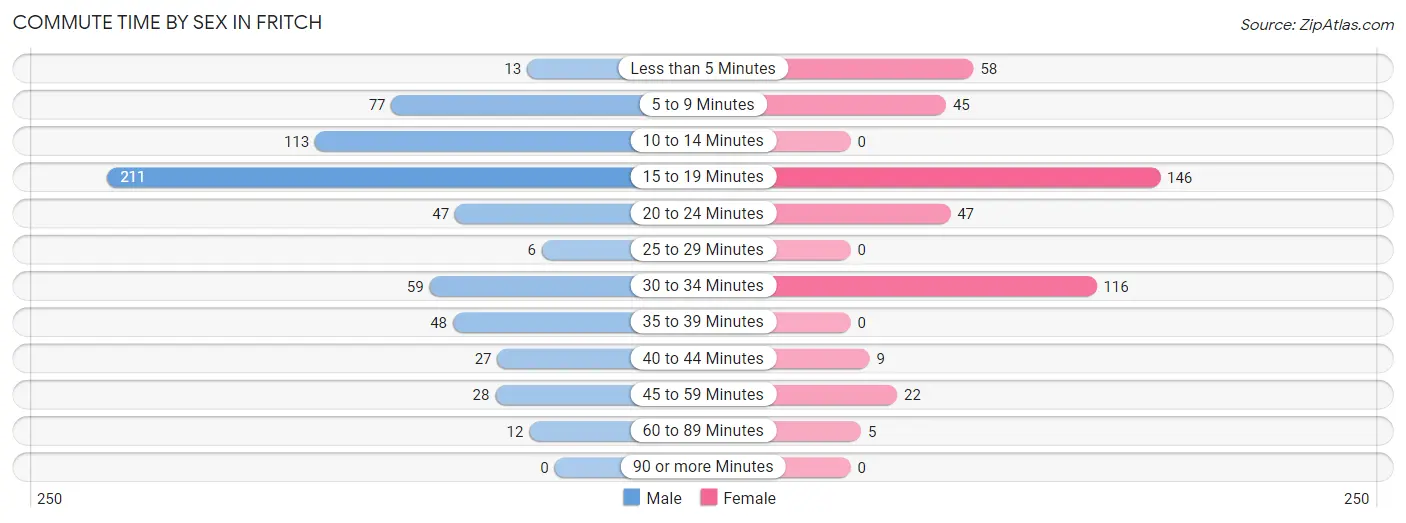
| Commute Time | Male | Female |
| Less than 5 Minutes | 13 (2.0%) | 58 (13.0%) |
| 5 to 9 Minutes | 77 (12.0%) | 45 (10.0%) |
| 10 to 14 Minutes | 113 (17.6%) | 0 (0.0%) |
| 15 to 19 Minutes | 211 (32.9%) | 146 (32.6%) |
| 20 to 24 Minutes | 47 (7.3%) | 47 (10.5%) |
| 25 to 29 Minutes | 6 (0.9%) | 0 (0.0%) |
| 30 to 34 Minutes | 59 (9.2%) | 116 (25.9%) |
| 35 to 39 Minutes | 48 (7.5%) | 0 (0.0%) |
| 40 to 44 Minutes | 27 (4.2%) | 9 (2.0%) |
| 45 to 59 Minutes | 28 (4.4%) | 22 (4.9%) |
| 60 to 89 Minutes | 12 (1.9%) | 5 (1.1%) |
| 90 or more Minutes | 0 (0.0%) | 0 (0.0%) |
Time of Departure to Work by Sex in Fritch
The most frequent times of departure to work in Fritch are 7:00 AM to 7:29 AM (129, 20.1%) for males and 7:00 AM to 7:29 AM (190, 42.4%) for females.
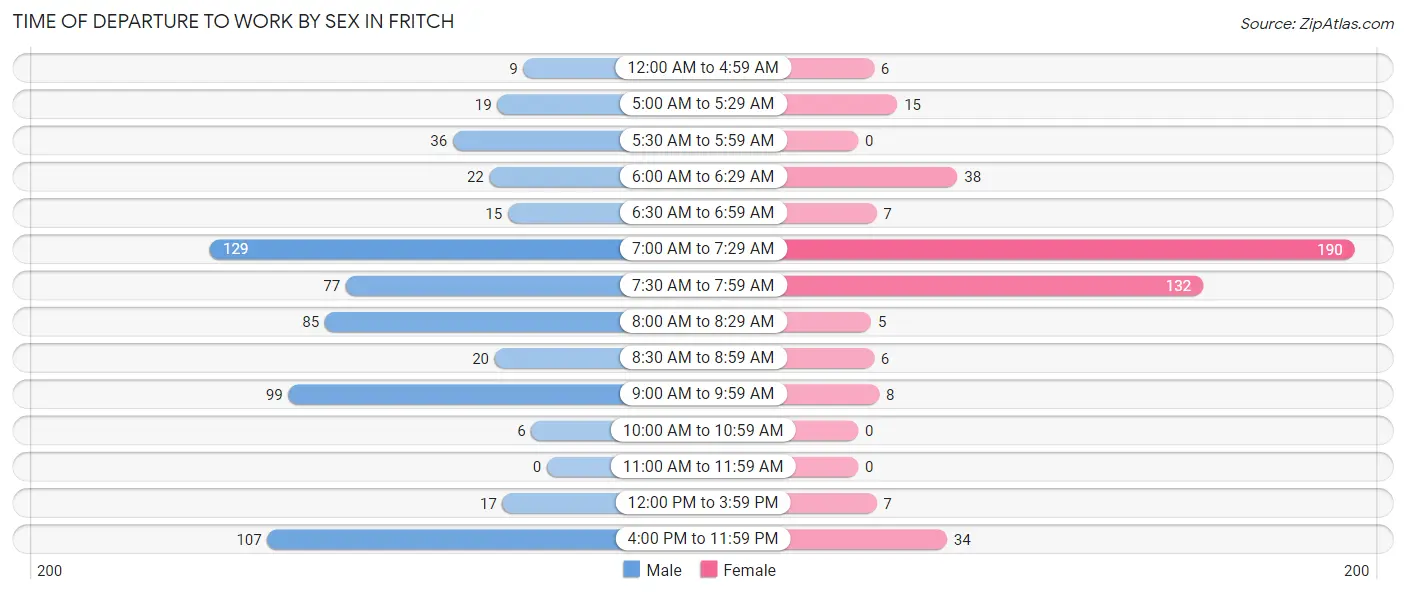
| Time of Departure | Male | Female |
| 12:00 AM to 4:59 AM | 9 (1.4%) | 6 (1.3%) |
| 5:00 AM to 5:29 AM | 19 (3.0%) | 15 (3.4%) |
| 5:30 AM to 5:59 AM | 36 (5.6%) | 0 (0.0%) |
| 6:00 AM to 6:29 AM | 22 (3.4%) | 38 (8.5%) |
| 6:30 AM to 6:59 AM | 15 (2.3%) | 7 (1.6%) |
| 7:00 AM to 7:29 AM | 129 (20.1%) | 190 (42.4%) |
| 7:30 AM to 7:59 AM | 77 (12.0%) | 132 (29.5%) |
| 8:00 AM to 8:29 AM | 85 (13.3%) | 5 (1.1%) |
| 8:30 AM to 8:59 AM | 20 (3.1%) | 6 (1.3%) |
| 9:00 AM to 9:59 AM | 99 (15.4%) | 8 (1.8%) |
| 10:00 AM to 10:59 AM | 6 (0.9%) | 0 (0.0%) |
| 11:00 AM to 11:59 AM | 0 (0.0%) | 0 (0.0%) |
| 12:00 PM to 3:59 PM | 17 (2.6%) | 7 (1.6%) |
| 4:00 PM to 11:59 PM | 107 (16.7%) | 34 (7.6%) |
| Total | 641 (100.0%) | 448 (100.0%) |
Housing Occupancy in Fritch
Occupancy by Ownership in Fritch
Of the total 746 dwellings in Fritch, owner-occupied units account for 672 (90.1%), while renter-occupied units make up 74 (9.9%).
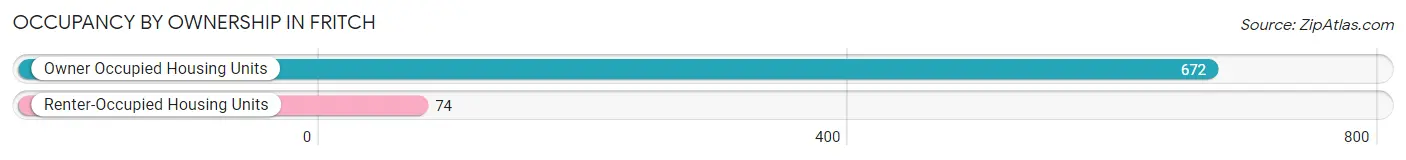
| Occupancy | # Housing Units | % Housing Units |
| Owner Occupied Housing Units | 672 | 90.1% |
| Renter-Occupied Housing Units | 74 | 9.9% |
| Total Occupied Housing Units | 746 | 100.0% |
Occupancy by Household Size in Fritch
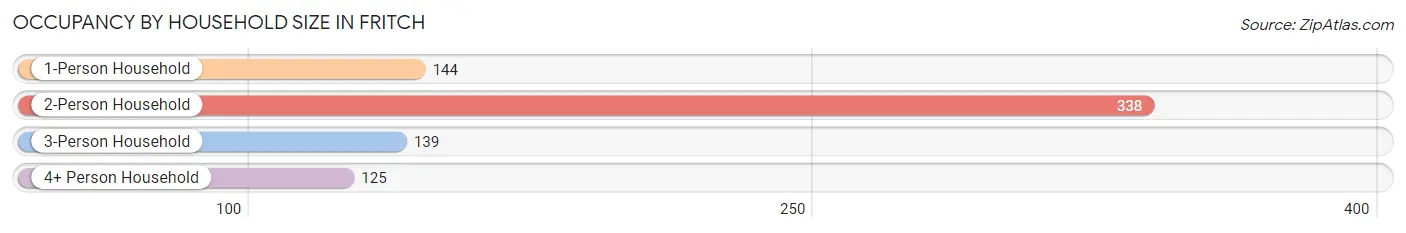
| Household Size | # Housing Units | % Housing Units |
| 1-Person Household | 144 | 19.3% |
| 2-Person Household | 338 | 45.3% |
| 3-Person Household | 139 | 18.6% |
| 4+ Person Household | 125 | 16.8% |
| Total Housing Units | 746 | 100.0% |
Occupancy by Ownership by Household Size in Fritch
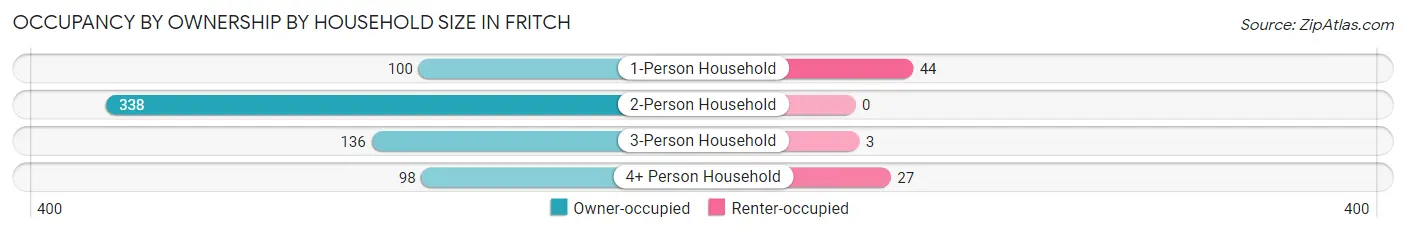
| Household Size | Owner-occupied | Renter-occupied |
| 1-Person Household | 100 (69.4%) | 44 (30.6%) |
| 2-Person Household | 338 (100.0%) | 0 (0.0%) |
| 3-Person Household | 136 (97.8%) | 3 (2.2%) |
| 4+ Person Household | 98 (78.4%) | 27 (21.6%) |
| Total Housing Units | 672 (90.1%) | 74 (9.9%) |
Occupancy by Educational Attainment in Fritch
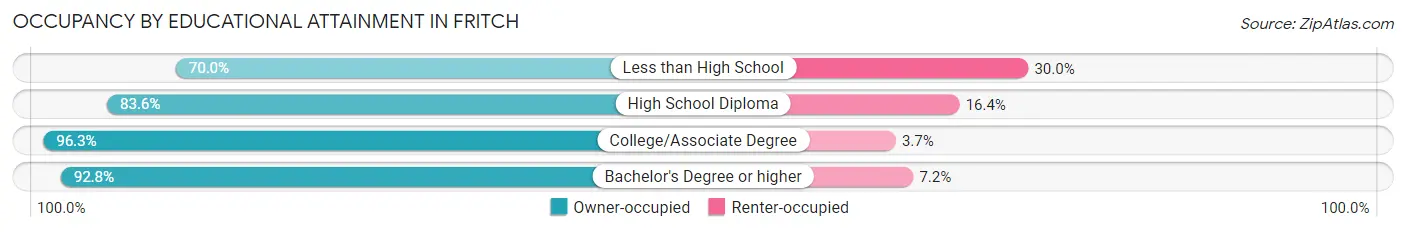
| Household Size | Owner-occupied | Renter-occupied |
| Less than High School | 35 (70.0%) | 15 (30.0%) |
| High School Diploma | 184 (83.6%) | 36 (16.4%) |
| College/Associate Degree | 311 (96.3%) | 12 (3.7%) |
| Bachelor's Degree or higher | 142 (92.8%) | 11 (7.2%) |
Occupancy by Age of Householder in Fritch
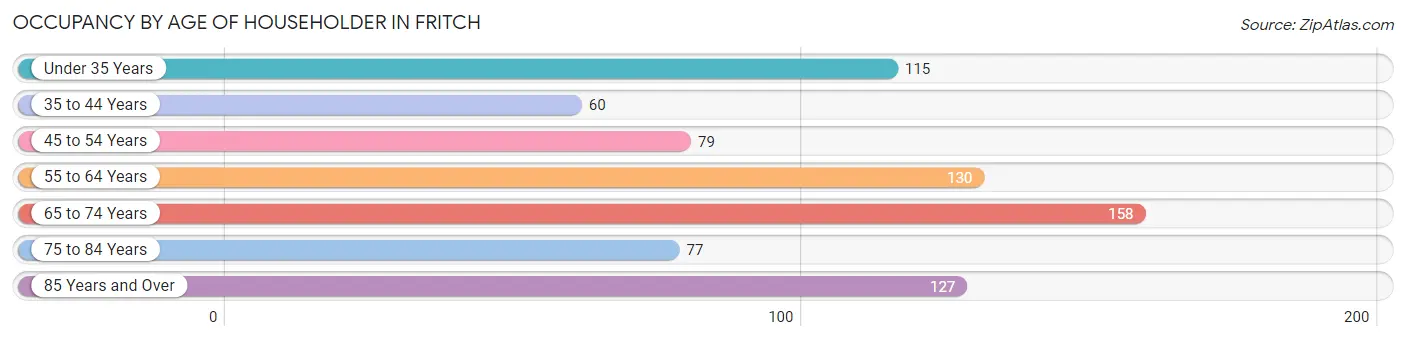
| Age Bracket | # Households | % Households |
| Under 35 Years | 115 | 15.4% |
| 35 to 44 Years | 60 | 8.0% |
| 45 to 54 Years | 79 | 10.6% |
| 55 to 64 Years | 130 | 17.4% |
| 65 to 74 Years | 158 | 21.2% |
| 75 to 84 Years | 77 | 10.3% |
| 85 Years and Over | 127 | 17.0% |
| Total | 746 | 100.0% |
Housing Finances in Fritch
Median Income by Occupancy in Fritch
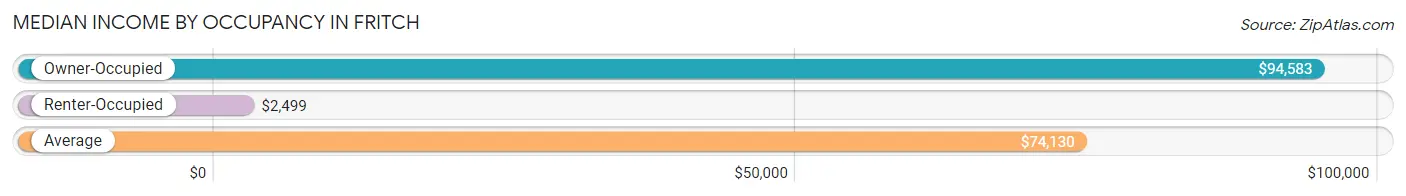
| Occupancy Type | # Households | Median Income |
| Owner-Occupied | 672 (90.1%) | $94,583 |
| Renter-Occupied | 74 (9.9%) | $2,499 |
| Average | 746 (100.0%) | $74,130 |
Occupancy by Householder Income Bracket in Fritch
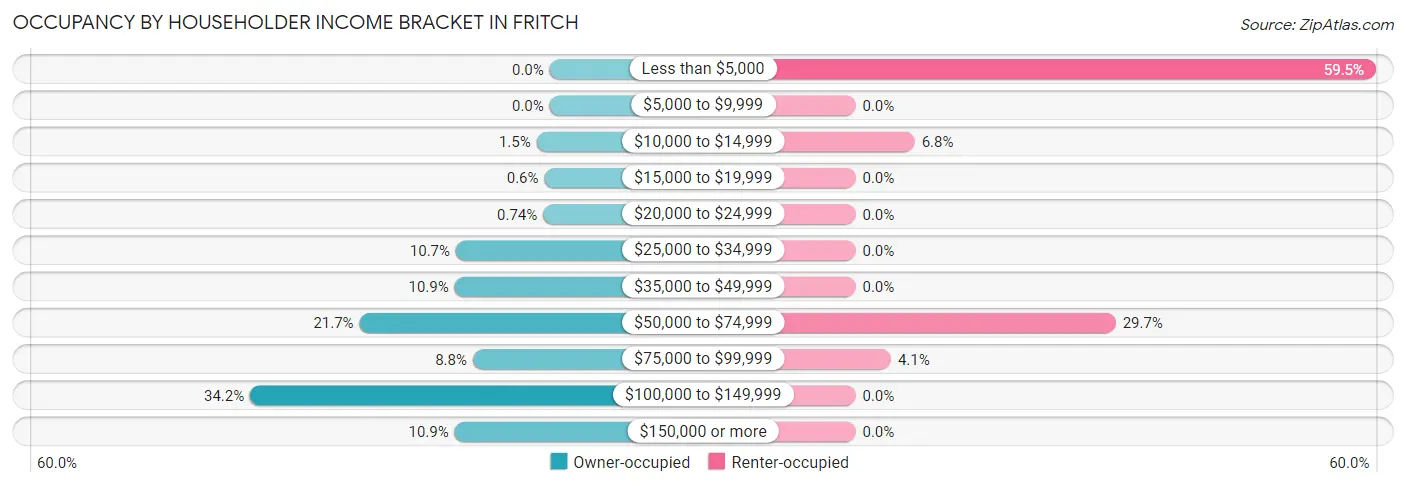
| Income Bracket | Owner-occupied | Renter-occupied |
| Less than $5,000 | 0 (0.0%) | 44 (59.5%) |
| $5,000 to $9,999 | 0 (0.0%) | 0 (0.0%) |
| $10,000 to $14,999 | 10 (1.5%) | 5 (6.8%) |
| $15,000 to $19,999 | 4 (0.6%) | 0 (0.0%) |
| $20,000 to $24,999 | 5 (0.7%) | 0 (0.0%) |
| $25,000 to $34,999 | 72 (10.7%) | 0 (0.0%) |
| $35,000 to $49,999 | 73 (10.9%) | 0 (0.0%) |
| $50,000 to $74,999 | 146 (21.7%) | 22 (29.7%) |
| $75,000 to $99,999 | 59 (8.8%) | 3 (4.1%) |
| $100,000 to $149,999 | 230 (34.2%) | 0 (0.0%) |
| $150,000 or more | 73 (10.9%) | 0 (0.0%) |
| Total | 672 (100.0%) | 74 (100.0%) |
Monthly Housing Cost Tiers in Fritch
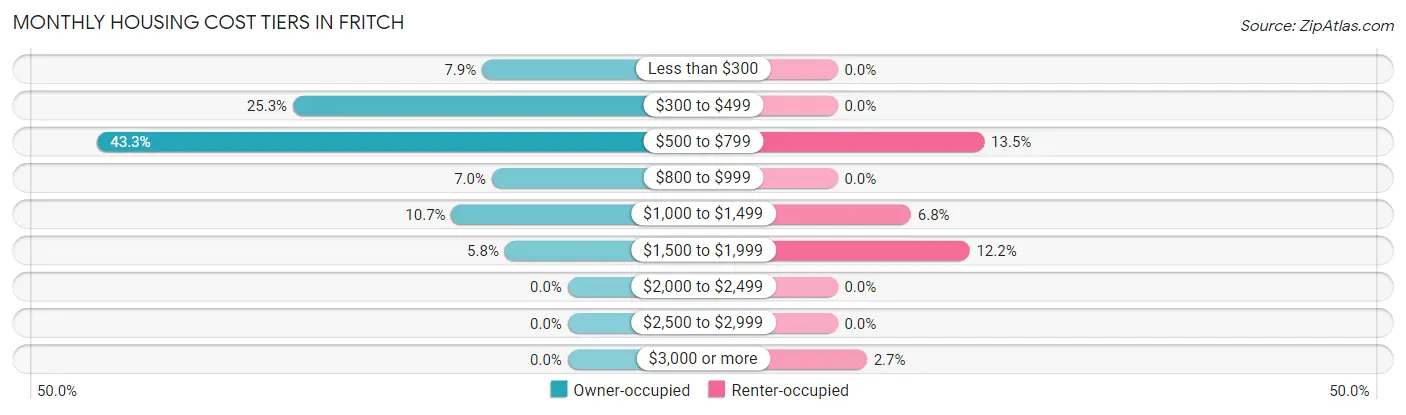
| Monthly Cost | Owner-occupied | Renter-occupied |
| Less than $300 | 53 (7.9%) | 0 (0.0%) |
| $300 to $499 | 170 (25.3%) | 0 (0.0%) |
| $500 to $799 | 291 (43.3%) | 10 (13.5%) |
| $800 to $999 | 47 (7.0%) | 0 (0.0%) |
| $1,000 to $1,499 | 72 (10.7%) | 5 (6.8%) |
| $1,500 to $1,999 | 39 (5.8%) | 9 (12.2%) |
| $2,000 to $2,499 | 0 (0.0%) | 0 (0.0%) |
| $2,500 to $2,999 | 0 (0.0%) | 0 (0.0%) |
| $3,000 or more | 0 (0.0%) | 2 (2.7%) |
| Total | 672 (100.0%) | 74 (100.0%) |
Physical Housing Characteristics in Fritch
Housing Structures in Fritch
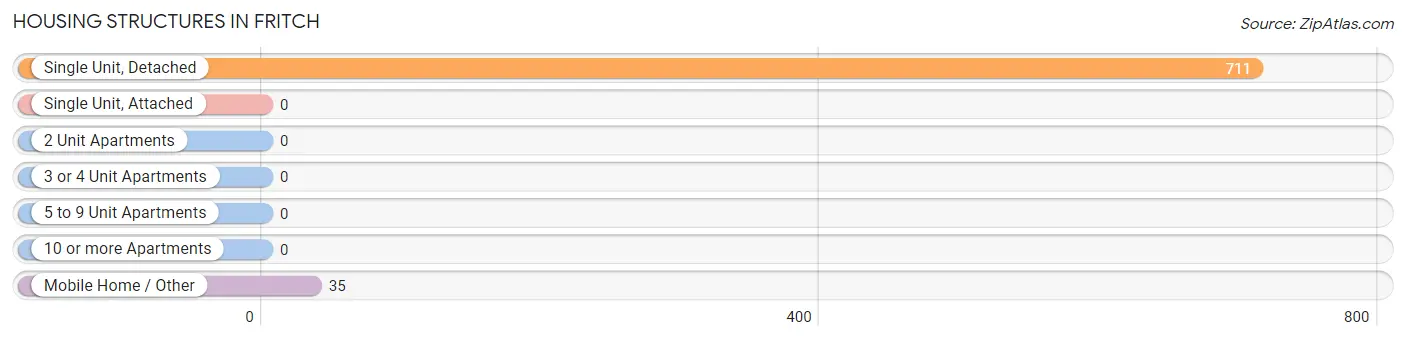
| Structure Type | # Housing Units | % Housing Units |
| Single Unit, Detached | 711 | 95.3% |
| Single Unit, Attached | 0 | 0.0% |
| 2 Unit Apartments | 0 | 0.0% |
| 3 or 4 Unit Apartments | 0 | 0.0% |
| 5 to 9 Unit Apartments | 0 | 0.0% |
| 10 or more Apartments | 0 | 0.0% |
| Mobile Home / Other | 35 | 4.7% |
| Total | 746 | 100.0% |
Housing Structures by Occupancy in Fritch
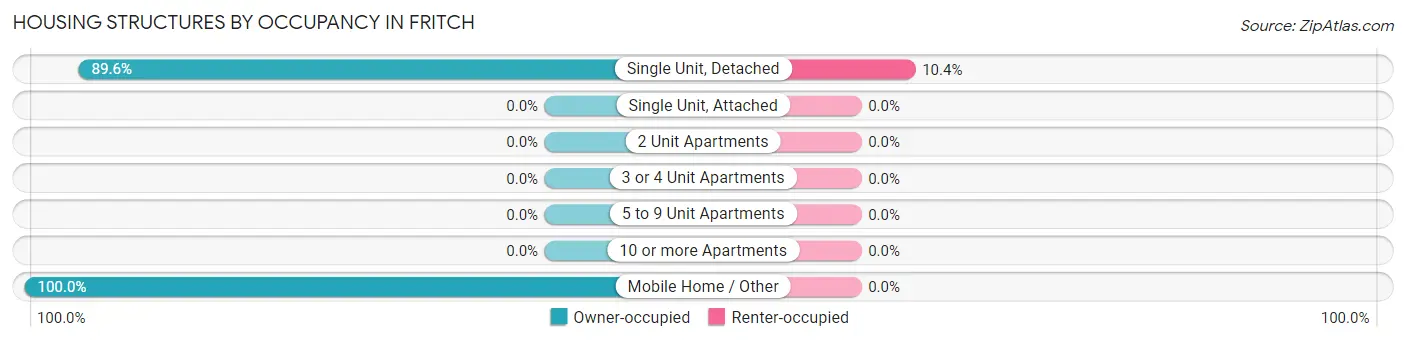
| Structure Type | Owner-occupied | Renter-occupied |
| Single Unit, Detached | 637 (89.6%) | 74 (10.4%) |
| Single Unit, Attached | 0 (0.0%) | 0 (0.0%) |
| 2 Unit Apartments | 0 (0.0%) | 0 (0.0%) |
| 3 or 4 Unit Apartments | 0 (0.0%) | 0 (0.0%) |
| 5 to 9 Unit Apartments | 0 (0.0%) | 0 (0.0%) |
| 10 or more Apartments | 0 (0.0%) | 0 (0.0%) |
| Mobile Home / Other | 35 (100.0%) | 0 (0.0%) |
| Total | 672 (90.1%) | 74 (9.9%) |
Housing Structures by Number of Rooms in Fritch
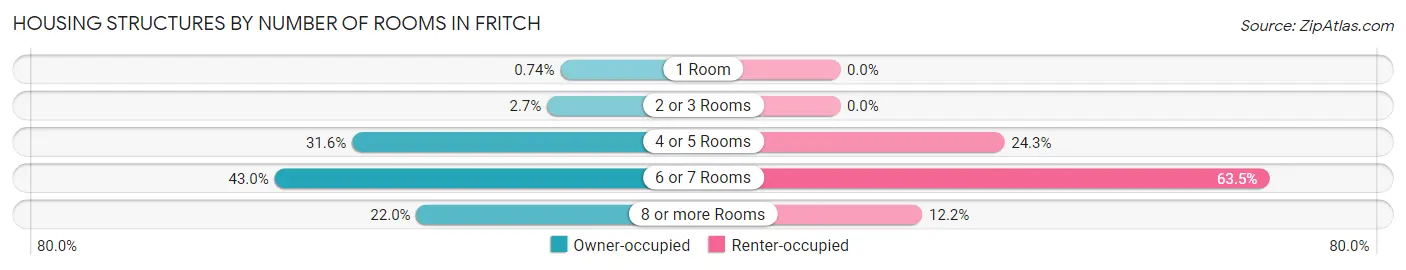
| Number of Rooms | Owner-occupied | Renter-occupied |
| 1 Room | 5 (0.7%) | 0 (0.0%) |
| 2 or 3 Rooms | 18 (2.7%) | 0 (0.0%) |
| 4 or 5 Rooms | 212 (31.6%) | 18 (24.3%) |
| 6 or 7 Rooms | 289 (43.0%) | 47 (63.5%) |
| 8 or more Rooms | 148 (22.0%) | 9 (12.2%) |
| Total | 672 (100.0%) | 74 (100.0%) |
Housing Structure by Heating Type in Fritch
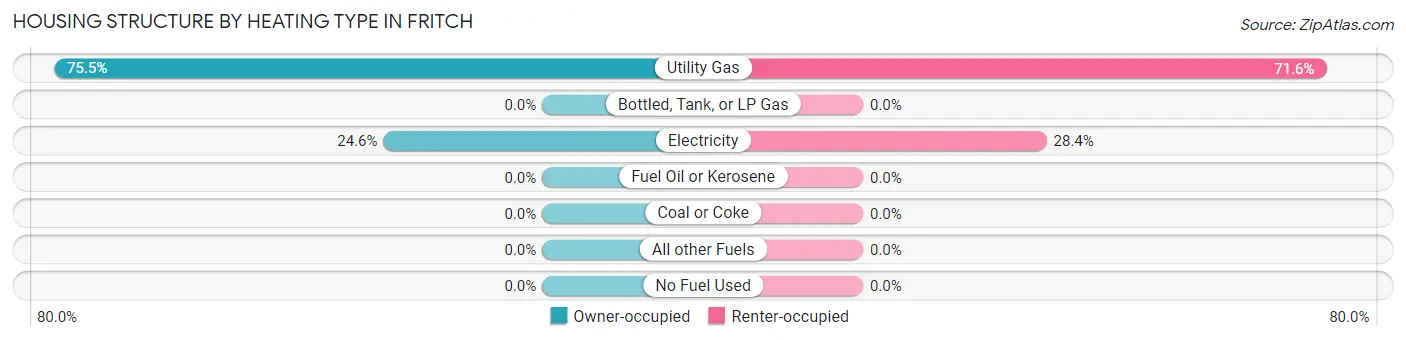
| Heating Type | Owner-occupied | Renter-occupied |
| Utility Gas | 507 (75.4%) | 53 (71.6%) |
| Bottled, Tank, or LP Gas | 0 (0.0%) | 0 (0.0%) |
| Electricity | 165 (24.5%) | 21 (28.4%) |
| Fuel Oil or Kerosene | 0 (0.0%) | 0 (0.0%) |
| Coal or Coke | 0 (0.0%) | 0 (0.0%) |
| All other Fuels | 0 (0.0%) | 0 (0.0%) |
| No Fuel Used | 0 (0.0%) | 0 (0.0%) |
| Total | 672 (100.0%) | 74 (100.0%) |
Household Vehicle Usage in Fritch
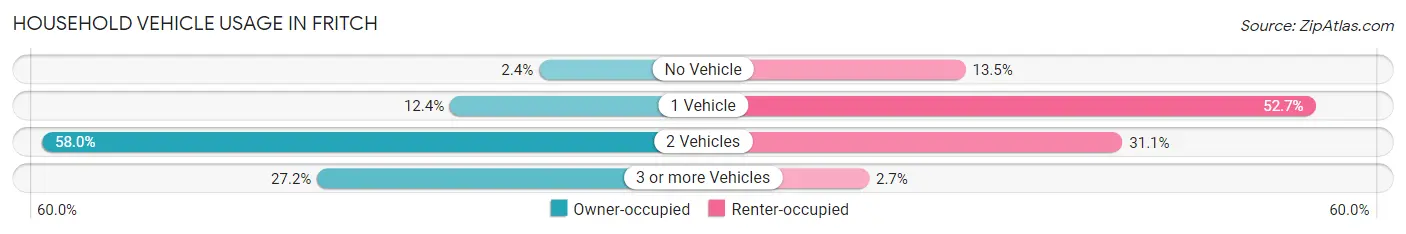
| Vehicles per Household | Owner-occupied | Renter-occupied |
| No Vehicle | 16 (2.4%) | 10 (13.5%) |
| 1 Vehicle | 83 (12.3%) | 39 (52.7%) |
| 2 Vehicles | 390 (58.0%) | 23 (31.1%) |
| 3 or more Vehicles | 183 (27.2%) | 2 (2.7%) |
| Total | 672 (100.0%) | 74 (100.0%) |
Real Estate & Mortgages in Fritch
Real Estate and Mortgage Overview in Fritch
| Characteristic | Without Mortgage | With Mortgage |
| Housing Units | 535 | 137 |
| Median Property Value | $136,800 | $114,000 |
| Median Household Income | $77,708 | $22 |
| Monthly Housing Costs | $521 | $0 |
| Real Estate Taxes | $1,838 | $6 |
Property Value by Mortgage Status in Fritch
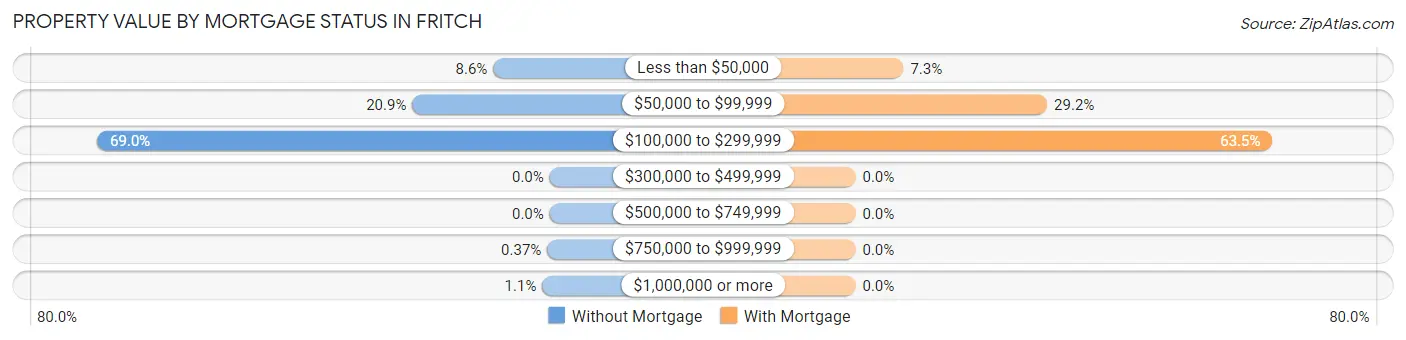
| Property Value | Without Mortgage | With Mortgage |
| Less than $50,000 | 46 (8.6%) | 10 (7.3%) |
| $50,000 to $99,999 | 112 (20.9%) | 40 (29.2%) |
| $100,000 to $299,999 | 369 (69.0%) | 87 (63.5%) |
| $300,000 to $499,999 | 0 (0.0%) | 0 (0.0%) |
| $500,000 to $749,999 | 0 (0.0%) | 0 (0.0%) |
| $750,000 to $999,999 | 2 (0.4%) | 0 (0.0%) |
| $1,000,000 or more | 6 (1.1%) | 0 (0.0%) |
| Total | 535 (100.0%) | 137 (100.0%) |
Household Income by Mortgage Status in Fritch
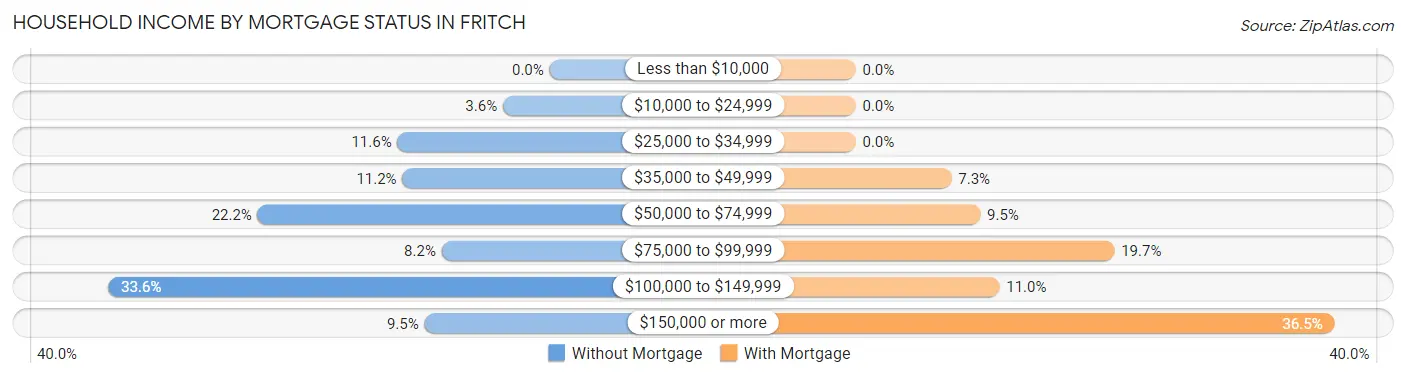
| Household Income | Without Mortgage | With Mortgage |
| Less than $10,000 | 0 (0.0%) | 0 (0.0%) |
| $10,000 to $24,999 | 19 (3.5%) | 0 (0.0%) |
| $25,000 to $34,999 | 62 (11.6%) | 0 (0.0%) |
| $35,000 to $49,999 | 60 (11.2%) | 10 (7.3%) |
| $50,000 to $74,999 | 119 (22.2%) | 13 (9.5%) |
| $75,000 to $99,999 | 44 (8.2%) | 27 (19.7%) |
| $100,000 to $149,999 | 180 (33.6%) | 15 (11.0%) |
| $150,000 or more | 51 (9.5%) | 50 (36.5%) |
| Total | 535 (100.0%) | 137 (100.0%) |
Property Value to Household Income Ratio in Fritch
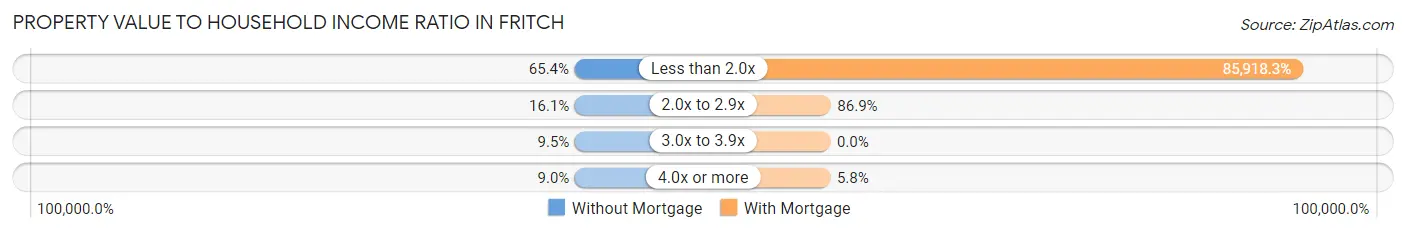
| Value-to-Income Ratio | Without Mortgage | With Mortgage |
| Less than 2.0x | 350 (65.4%) | 117,708 (85,918.3%) |
| 2.0x to 2.9x | 86 (16.1%) | 119 (86.9%) |
| 3.0x to 3.9x | 51 (9.5%) | 0 (0.0%) |
| 4.0x or more | 48 (9.0%) | 8 (5.8%) |
| Total | 535 (100.0%) | 137 (100.0%) |
Real Estate Taxes by Mortgage Status in Fritch
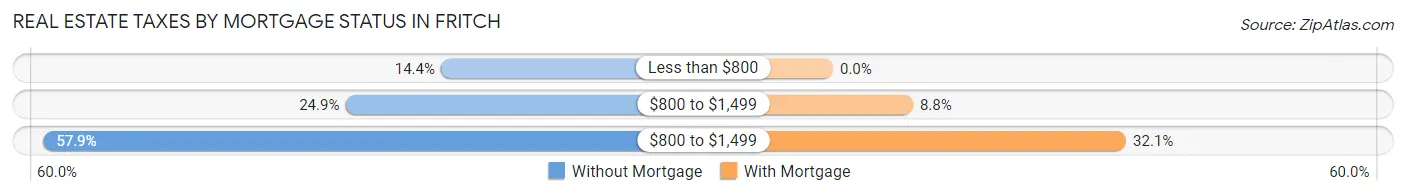
| Property Taxes | Without Mortgage | With Mortgage |
| Less than $800 | 77 (14.4%) | 0 (0.0%) |
| $800 to $1,499 | 133 (24.9%) | 12 (8.8%) |
| $800 to $1,499 | 310 (57.9%) | 44 (32.1%) |
| Total | 535 (100.0%) | 137 (100.0%) |
Health & Disability in Fritch
Health Insurance Coverage by Age in Fritch
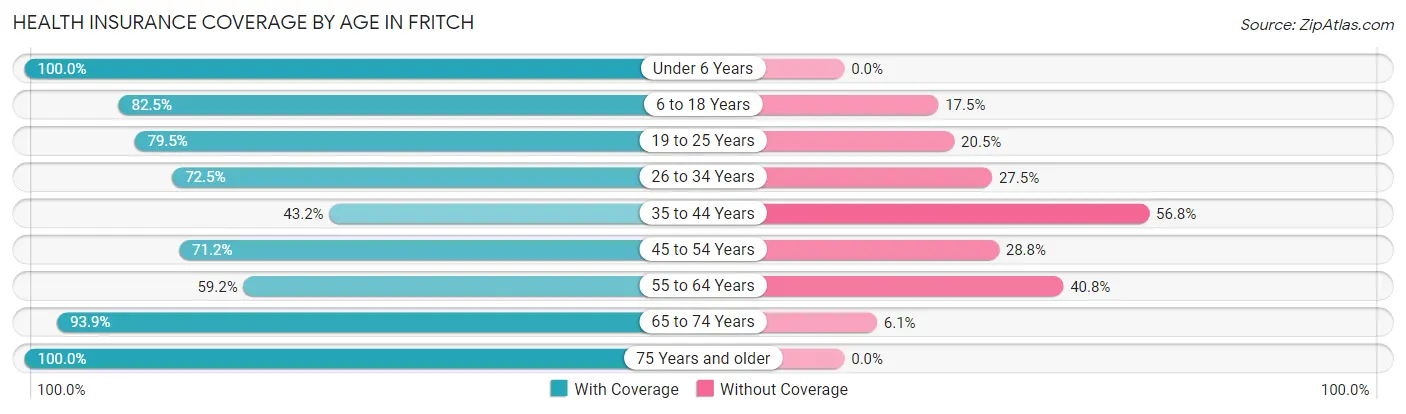
| Age Bracket | With Coverage | Without Coverage |
| Under 6 Years | 131 (100.0%) | 0 (0.0%) |
| 6 to 18 Years | 259 (82.5%) | 55 (17.5%) |
| 19 to 25 Years | 163 (79.5%) | 42 (20.5%) |
| 26 to 34 Years | 250 (72.5%) | 95 (27.5%) |
| 35 to 44 Years | 123 (43.2%) | 162 (56.8%) |
| 45 to 54 Years | 173 (71.2%) | 70 (28.8%) |
| 55 to 64 Years | 203 (59.2%) | 140 (40.8%) |
| 65 to 74 Years | 263 (93.9%) | 17 (6.1%) |
| 75 Years and older | 326 (100.0%) | 0 (0.0%) |
| Total | 1,891 (76.5%) | 581 (23.5%) |
Health Insurance Coverage by Citizenship Status in Fritch
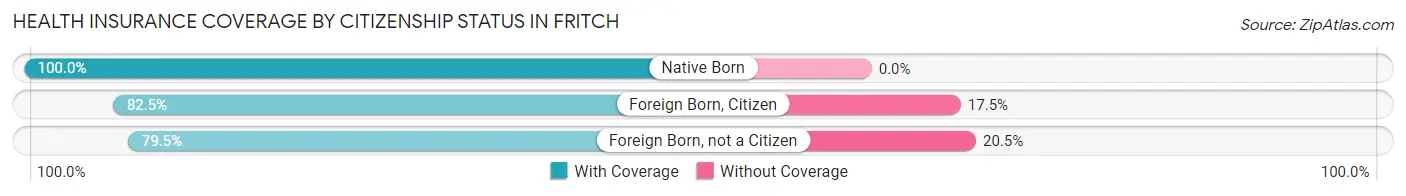
| Citizenship Status | With Coverage | Without Coverage |
| Native Born | 131 (100.0%) | 0 (0.0%) |
| Foreign Born, Citizen | 259 (82.5%) | 55 (17.5%) |
| Foreign Born, not a Citizen | 163 (79.5%) | 42 (20.5%) |
Health Insurance Coverage by Household Income in Fritch
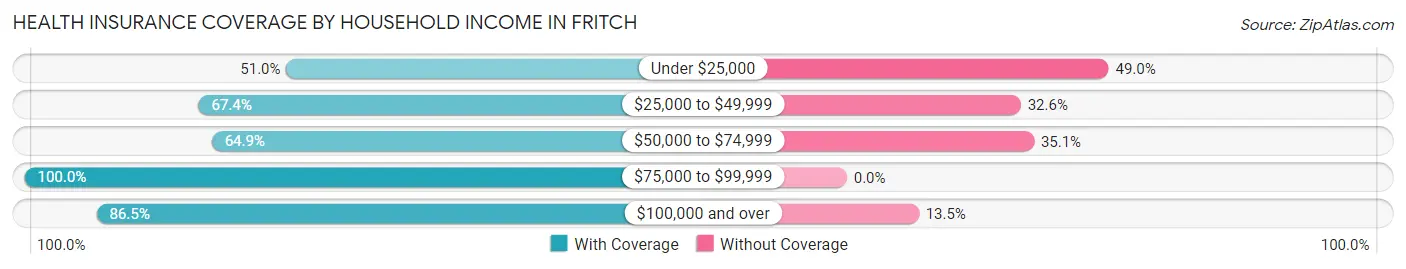
| Household Income | With Coverage | Without Coverage |
| Under $25,000 | 53 (51.0%) | 51 (49.0%) |
| $25,000 to $49,999 | 304 (67.4%) | 147 (32.6%) |
| $50,000 to $74,999 | 452 (64.9%) | 244 (35.1%) |
| $75,000 to $99,999 | 189 (100.0%) | 0 (0.0%) |
| $100,000 and over | 893 (86.5%) | 139 (13.5%) |
Public vs Private Health Insurance Coverage by Age in Fritch
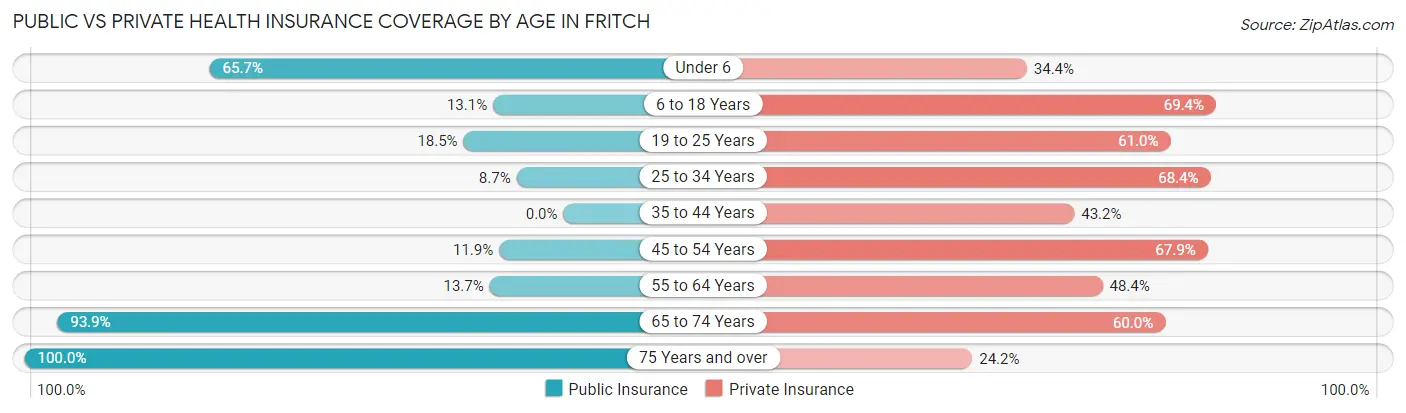
| Age Bracket | Public Insurance | Private Insurance |
| Under 6 | 86 (65.6%) | 45 (34.4%) |
| 6 to 18 Years | 41 (13.1%) | 218 (69.4%) |
| 19 to 25 Years | 38 (18.5%) | 125 (61.0%) |
| 25 to 34 Years | 30 (8.7%) | 236 (68.4%) |
| 35 to 44 Years | 0 (0.0%) | 123 (43.2%) |
| 45 to 54 Years | 29 (11.9%) | 165 (67.9%) |
| 55 to 64 Years | 47 (13.7%) | 166 (48.4%) |
| 65 to 74 Years | 263 (93.9%) | 168 (60.0%) |
| 75 Years and over | 326 (100.0%) | 79 (24.2%) |
| Total | 860 (34.8%) | 1,325 (53.6%) |
Disability Status by Sex by Age in Fritch
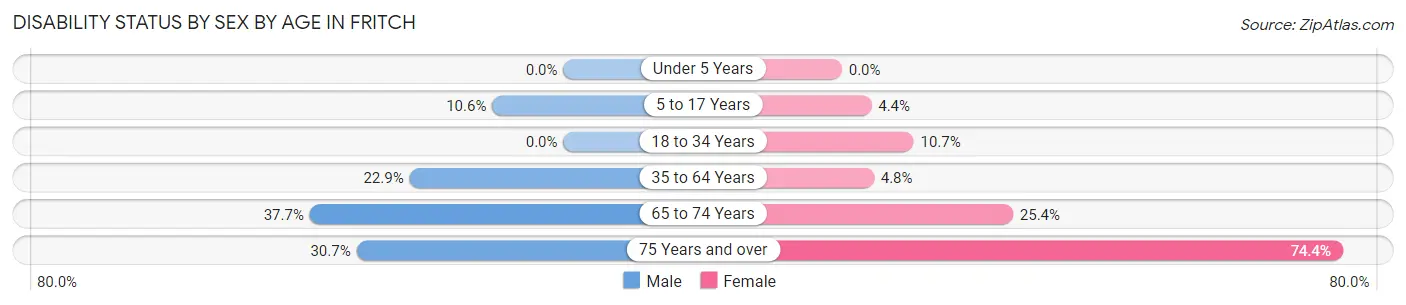
| Age Bracket | Male | Female |
| Under 5 Years | 0 (0.0%) | 0 (0.0%) |
| 5 to 17 Years | 15 (10.6%) | 7 (4.4%) |
| 18 to 34 Years | 0 (0.0%) | 34 (10.7%) |
| 35 to 64 Years | 122 (22.9%) | 16 (4.8%) |
| 65 to 74 Years | 58 (37.7%) | 32 (25.4%) |
| 75 Years and over | 51 (30.7%) | 119 (74.4%) |
Disability Class by Sex by Age in Fritch
Disability Class: Hearing Difficulty
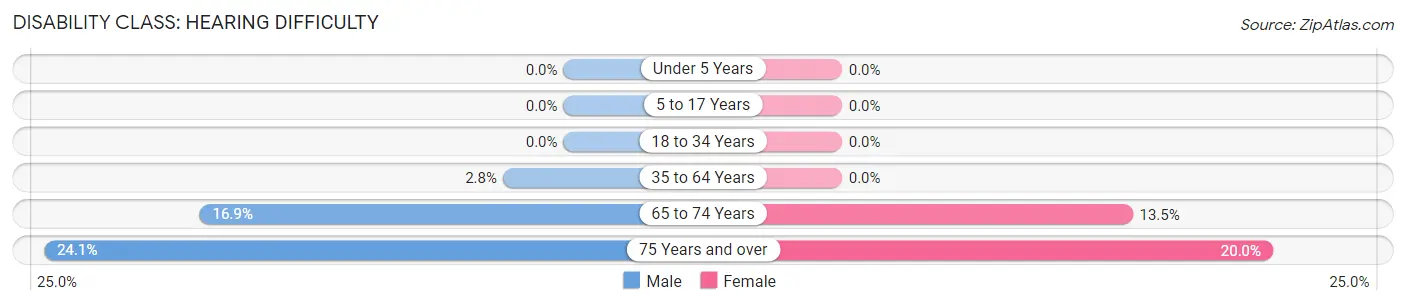
| Age Bracket | Male | Female |
| Under 5 Years | 0 (0.0%) | 0 (0.0%) |
| 5 to 17 Years | 0 (0.0%) | 0 (0.0%) |
| 18 to 34 Years | 0 (0.0%) | 0 (0.0%) |
| 35 to 64 Years | 15 (2.8%) | 0 (0.0%) |
| 65 to 74 Years | 26 (16.9%) | 17 (13.5%) |
| 75 Years and over | 40 (24.1%) | 32 (20.0%) |
Disability Class: Vision Difficulty
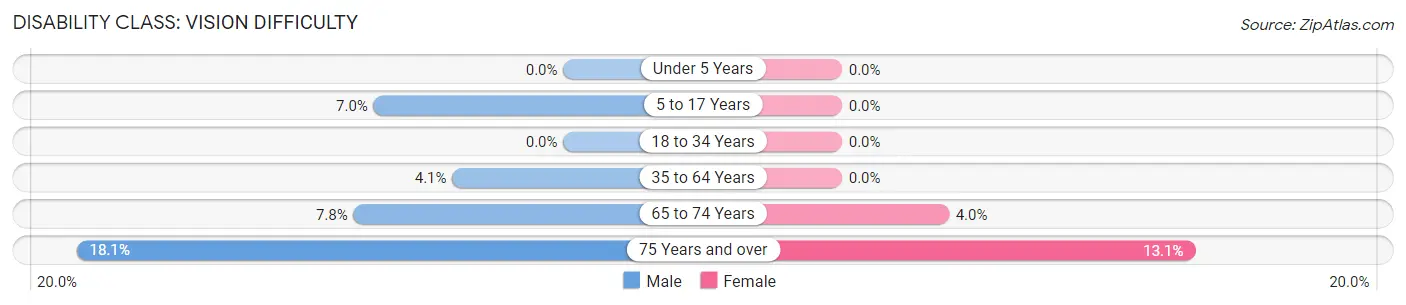
| Age Bracket | Male | Female |
| Under 5 Years | 0 (0.0%) | 0 (0.0%) |
| 5 to 17 Years | 10 (7.0%) | 0 (0.0%) |
| 18 to 34 Years | 0 (0.0%) | 0 (0.0%) |
| 35 to 64 Years | 22 (4.1%) | 0 (0.0%) |
| 65 to 74 Years | 12 (7.8%) | 5 (4.0%) |
| 75 Years and over | 30 (18.1%) | 21 (13.1%) |
Disability Class: Cognitive Difficulty
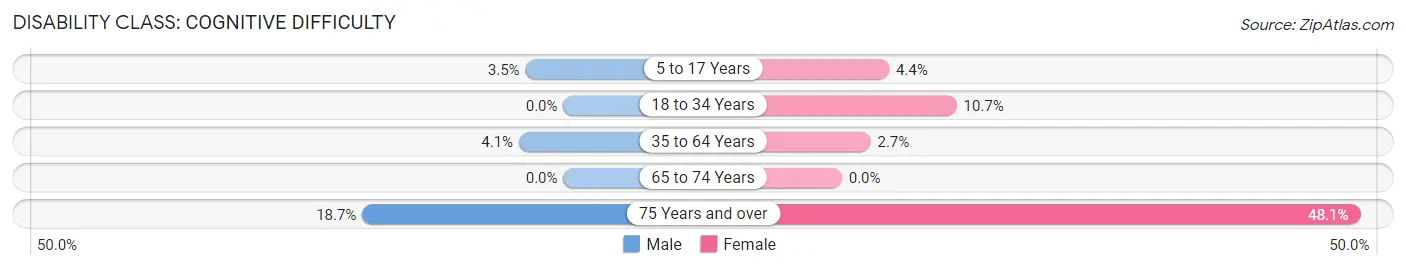
| Age Bracket | Male | Female |
| 5 to 17 Years | 5 (3.5%) | 7 (4.4%) |
| 18 to 34 Years | 0 (0.0%) | 34 (10.7%) |
| 35 to 64 Years | 22 (4.1%) | 9 (2.7%) |
| 65 to 74 Years | 0 (0.0%) | 0 (0.0%) |
| 75 Years and over | 31 (18.7%) | 77 (48.1%) |
Disability Class: Ambulatory Difficulty
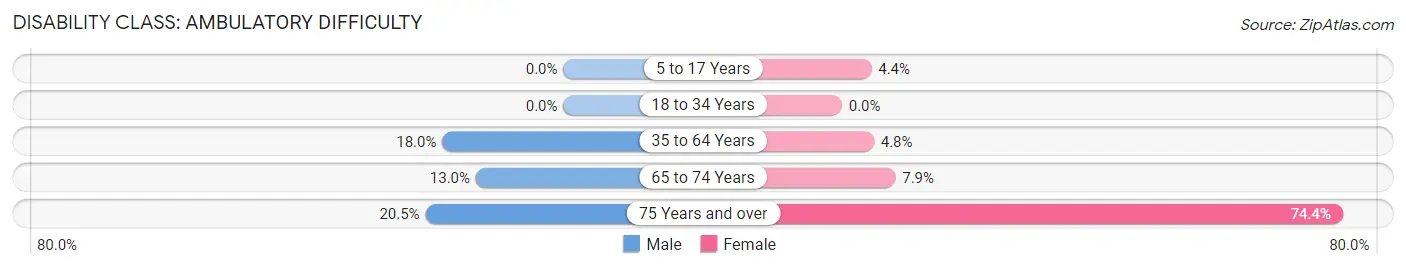
| Age Bracket | Male | Female |
| 5 to 17 Years | 0 (0.0%) | 7 (4.4%) |
| 18 to 34 Years | 0 (0.0%) | 0 (0.0%) |
| 35 to 64 Years | 96 (18.0%) | 16 (4.8%) |
| 65 to 74 Years | 20 (13.0%) | 10 (7.9%) |
| 75 Years and over | 34 (20.5%) | 119 (74.4%) |
Disability Class: Self-Care Difficulty
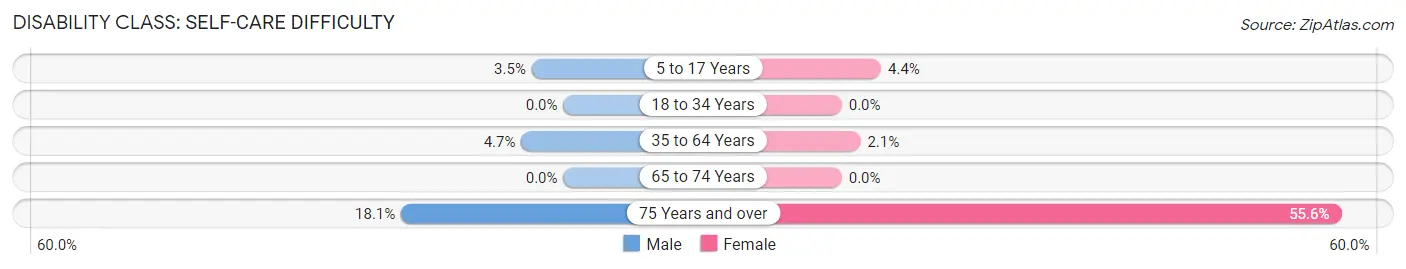
| Age Bracket | Male | Female |
| 5 to 17 Years | 5 (3.5%) | 7 (4.4%) |
| 18 to 34 Years | 0 (0.0%) | 0 (0.0%) |
| 35 to 64 Years | 25 (4.7%) | 7 (2.1%) |
| 65 to 74 Years | 0 (0.0%) | 0 (0.0%) |
| 75 Years and over | 30 (18.1%) | 89 (55.6%) |
Technology Access in Fritch
Computing Device Access in Fritch
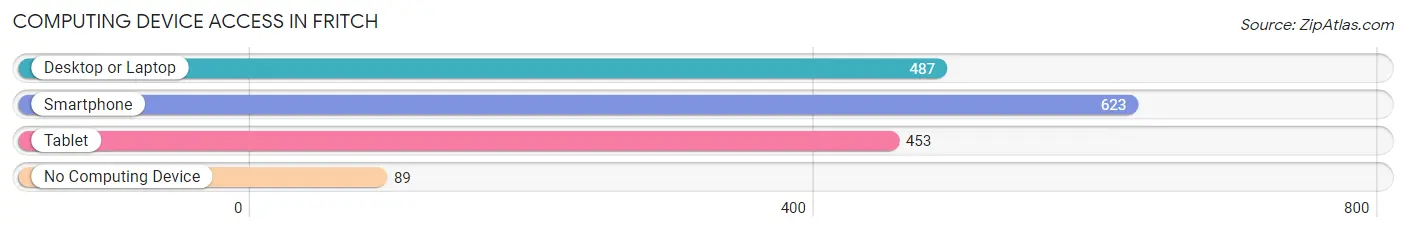
| Device Type | # Households | % Households |
| Desktop or Laptop | 487 | 65.3% |
| Smartphone | 623 | 83.5% |
| Tablet | 453 | 60.7% |
| No Computing Device | 89 | 11.9% |
| Total | 746 | 100.0% |
Internet Access in Fritch
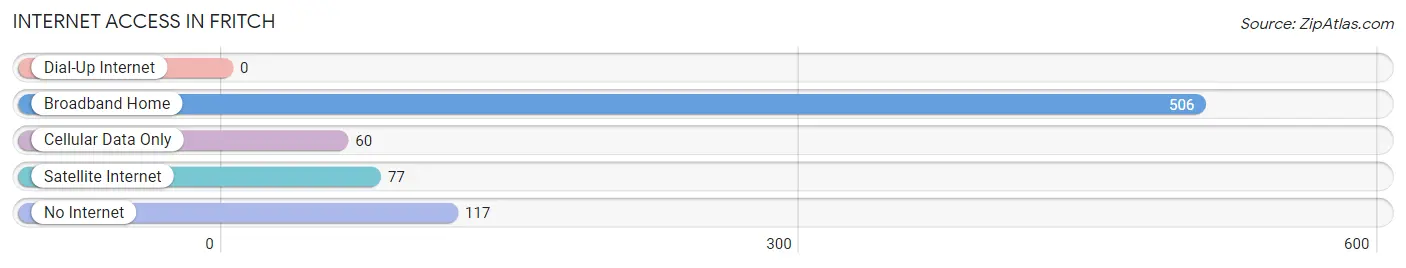
| Internet Type | # Households | % Households |
| Dial-Up Internet | 0 | 0.0% |
| Broadband Home | 506 | 67.8% |
| Cellular Data Only | 60 | 8.0% |
| Satellite Internet | 77 | 10.3% |
| No Internet | 117 | 15.7% |
| Total | 746 | 100.0% |
Fritch Summary
Fritch is a small town located in the Texas Panhandle, in Hutchinson County, Texas. It is situated on the banks of Lake Meredith, a reservoir created by Sanford Dam on the Canadian River. The town was founded in 1927 and named after its first postmaster, William Fritch. As of the 2010 census, the population of Fritch was 1,936.
Geography
Fritch is located at 35°37'25" North, 101°30'45" West (35.623607, -101.512599). It is situated on the banks of Lake Meredith, a reservoir created by Sanford Dam on the Canadian River. The town is located in the Texas Panhandle, in Hutchinson County, Texas. The elevation of Fritch is 3,093 feet (943 m).
Climate
Fritch has a semi-arid climate, with hot summers and cold winters. The average annual temperature is 64.3°F (17.9°C). The average annual precipitation is 19.3 inches (490 mm).
Demographics
As of the 2010 census, the population of Fritch was 1,936. The racial makeup of the town was 79.2% White, 0.3% African American, 0.7% Native American, 0.2% Asian, 0.1% Pacific Islander, 17.2% from other races, and 2.4% from two or more races. Hispanic or Latino of any race were 33.2% of the population.
Economy
Fritch is a small town with a limited economy. The main industries in the town are agriculture, oil and gas, and tourism. Agriculture is the main source of income for the town, with cotton, wheat, and sorghum being the main crops. Oil and gas production is also an important part of the local economy, with several oil and gas wells located in the area. Tourism is also an important part of the local economy, with Lake Meredith providing recreational opportunities for visitors.
History
Fritch was founded in 1927 and named after its first postmaster, William Fritch. The town was originally a farming community, but the discovery of oil and gas in the area in the 1930s led to an economic boom. The town was incorporated in 1937.
In the 1950s, the construction of Sanford Dam on the Canadian River created Lake Meredith, which provided recreational opportunities for visitors. The lake also provided a source of water for the town, which had previously relied on wells.
In the 1970s, the town experienced a decline in population as the oil and gas industry declined. The population of Fritch has remained relatively stable since then, with the 2010 census showing a population of 1,936.
Conclusion
Fritch is a small town located in the Texas Panhandle, in Hutchinson County, Texas. It was founded in 1927 and named after its first postmaster, William Fritch. As of the 2010 census, the population of Fritch was 1,936. The town is situated on the banks of Lake Meredith, a reservoir created by Sanford Dam on the Canadian River. The main industries in the town are agriculture, oil and gas, and tourism. Fritch has a semi-arid climate, with hot summers and cold winters. The racial makeup of the town was 79.2% White, 0.3% African American, 0.7% Native American, 0.2% Asian, 0.1% Pacific Islander, 17.2% from other races, and 2.4% from two or more races. Hispanic or Latino of any race were 33.2% of the population. Fritch has experienced a decline in population since the 1970s, but the population has remained relatively stable since then.
Common Questions
What is Per Capita Income in Fritch?
Per Capita income in Fritch is $34,496.
What is the Median Family Income in Fritch?
Median Family Income in Fritch is $95,119.
What is the Median Household income in Fritch?
Median Household Income in Fritch is $74,130.
What is Income or Wage Gap in Fritch?
Income or Wage Gap in Fritch is 41.6%.
Women in Fritch earn 58.4 cents for every dollar earned by a man.
What is Inequality or Gini Index in Fritch?
Inequality or Gini Index in Fritch is 0.36.
What is the Total Population of Fritch?
Total Population of Fritch is 2,472.
What is the Total Male Population of Fritch?
Total Male Population of Fritch is 1,299.
What is the Total Female Population of Fritch?
Total Female Population of Fritch is 1,173.
What is the Ratio of Males per 100 Females in Fritch?
There are 110.74 Males per 100 Females in Fritch.
What is the Ratio of Females per 100 Males in Fritch?
There are 90.30 Females per 100 Males in Fritch.
What is the Median Population Age in Fritch?
Median Population Age in Fritch is 42.1 Years.
What is the Average Family Size in Fritch
Average Family Size in Fritch is 3.8 People.
What is the Average Household Size in Fritch
Average Household Size in Fritch is 3.3 People.
How Large is the Labor Force in Fritch?
There are 1,209 People in the Labor Forcein in Fritch.
What is the Percentage of People in the Labor Force in Fritch?
57.8% of People are in the Labor Force in Fritch.
What is the Unemployment Rate in Fritch?
Unemployment Rate in Fritch is 7.9%.