Ross, TX Map & Demographics
Ross Map
Ross Overview
$35,113
PER CAPITA INCOME
$58,750
AVG FAMILY INCOME
$61,250
AVG HOUSEHOLD INCOME
71.5%
WAGE / INCOME GAP [ % ]
28.5¢/ $1
WAGE / INCOME GAP [ $ ]
0.37
INEQUALITY / GINI INDEX
164
TOTAL POPULATION
83
MALE POPULATION
81
FEMALE POPULATION
102.47
MALES / 100 FEMALES
97.59
FEMALES / 100 MALES
58.1
MEDIAN AGE
2.4
AVG FAMILY SIZE
2.3
AVG HOUSEHOLD SIZE
77
LABOR FORCE [ PEOPLE ]
49.0%
PERCENT IN LABOR FORCE
Ross Area Codes
Income in Ross
Income Overview in Ross
Per Capita Income in Ross is $35,113, while median incomes of families and households are $58,750 and $61,250 respectively.
| Characteristic | Number | Measure |
| Per Capita Income | 164 | $35,113 |
| Median Family Income | 62 | $58,750 |
| Mean Family Income | 62 | $88,534 |
| Median Household Income | 71 | $61,250 |
| Mean Household Income | 71 | $87,434 |
| Income Deficit | 62 | $0 |
| Wage / Income Gap (%) | 164 | 71.52% |
| Wage / Income Gap ($) | 164 | 28.48¢ per $1 |
| Gini / Inequality Index | 164 | 0.37 |
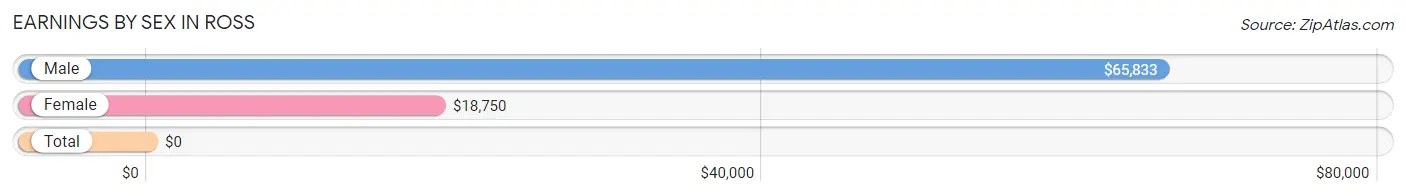
Earnings by Sex in Ross
| Sex | Number | Average Earnings |
| Male | 38 (46.9%) | $65,833 |
| Female | 43 (53.1%) | $18,750 |
| Total | 81 (100.0%) | $0 |
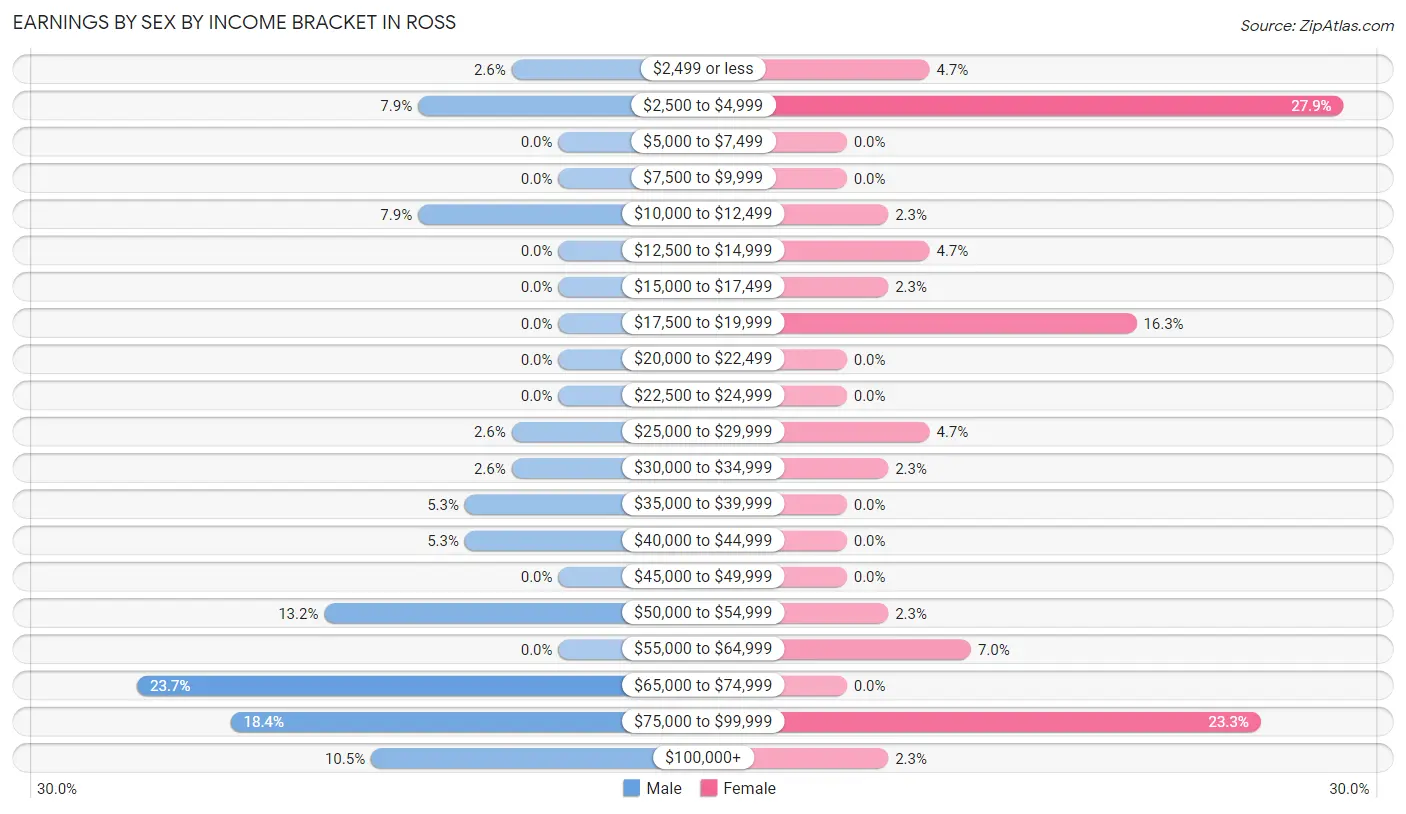
Earnings by Sex by Income Bracket in Ross
The most common earnings brackets in Ross are $65,000 to $74,999 for men (9 | 23.7%) and $2,500 to $4,999 for women (12 | 27.9%).
| Income | Male | Female |
| $2,499 or less | 1 (2.6%) | 2 (4.6%) |
| $2,500 to $4,999 | 3 (7.9%) | 12 (27.9%) |
| $5,000 to $7,499 | 0 (0.0%) | 0 (0.0%) |
| $7,500 to $9,999 | 0 (0.0%) | 0 (0.0%) |
| $10,000 to $12,499 | 3 (7.9%) | 1 (2.3%) |
| $12,500 to $14,999 | 0 (0.0%) | 2 (4.6%) |
| $15,000 to $17,499 | 0 (0.0%) | 1 (2.3%) |
| $17,500 to $19,999 | 0 (0.0%) | 7 (16.3%) |
| $20,000 to $22,499 | 0 (0.0%) | 0 (0.0%) |
| $22,500 to $24,999 | 0 (0.0%) | 0 (0.0%) |
| $25,000 to $29,999 | 1 (2.6%) | 2 (4.6%) |
| $30,000 to $34,999 | 1 (2.6%) | 1 (2.3%) |
| $35,000 to $39,999 | 2 (5.3%) | 0 (0.0%) |
| $40,000 to $44,999 | 2 (5.3%) | 0 (0.0%) |
| $45,000 to $49,999 | 0 (0.0%) | 0 (0.0%) |
| $50,000 to $54,999 | 5 (13.2%) | 1 (2.3%) |
| $55,000 to $64,999 | 0 (0.0%) | 3 (7.0%) |
| $65,000 to $74,999 | 9 (23.7%) | 0 (0.0%) |
| $75,000 to $99,999 | 7 (18.4%) | 10 (23.3%) |
| $100,000+ | 4 (10.5%) | 1 (2.3%) |
| Total | 38 (100.0%) | 43 (100.0%) |
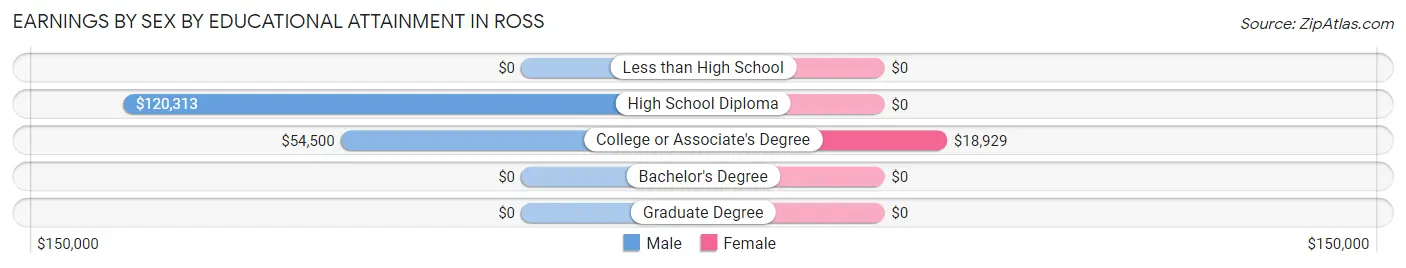
Earnings by Sex by Educational Attainment in Ross
| Educational Attainment | Male Income | Female Income |
| Less than High School | - | - |
| High School Diploma | $120,313 | $0 |
| College or Associate's Degree | $54,500 | $18,929 |
| Bachelor's Degree | - | - |
| Graduate Degree | - | - |
| Total | $67,083 | $0 |
Family Income in Ross
Family Income Brackets in Ross
According to the Ross family income data, there are 21 families falling into the $50,000 to $74,999 income range, which is the most common income bracket and makes up 33.9% of all families.
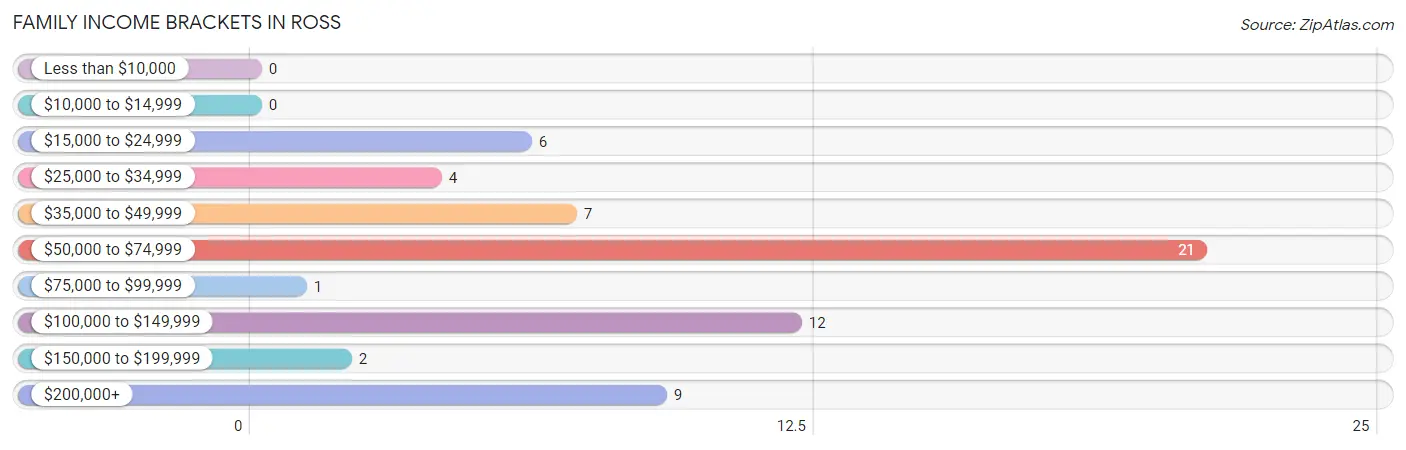
| Income Bracket | # Families | % Families |
| Less than $10,000 | 0 | 0.0% |
| $10,000 to $14,999 | 0 | 0.0% |
| $15,000 to $24,999 | 6 | 9.7% |
| $25,000 to $34,999 | 4 | 6.5% |
| $35,000 to $49,999 | 7 | 11.3% |
| $50,000 to $74,999 | 21 | 33.9% |
| $75,000 to $99,999 | 1 | 1.6% |
| $100,000 to $149,999 | 12 | 19.4% |
| $150,000 to $199,999 | 2 | 3.2% |
| $200,000+ | 9 | 14.5% |
Family Income by Famaliy Size in Ross
3-person families (6 | 9.7%) account for the highest median family income in Ross with $130,000 per family, while 3-person families (6 | 9.7%) have the highest median income of $43,333 per family member.
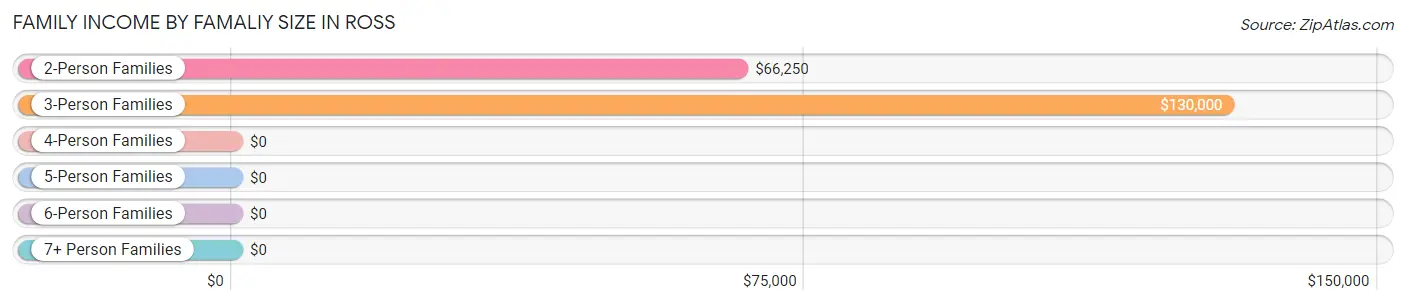
| Income Bracket | # Families | Median Income |
| 2-Person Families | 48 (77.4%) | $66,250 |
| 3-Person Families | 6 (9.7%) | $130,000 |
| 4-Person Families | 6 (9.7%) | $0 |
| 5-Person Families | 2 (3.2%) | $0 |
| 6-Person Families | 0 (0.0%) | $0 |
| 7+ Person Families | 0 (0.0%) | $0 |
| Total | 62 (100.0%) | $58,750 |
Family Income by Number of Earners in Ross
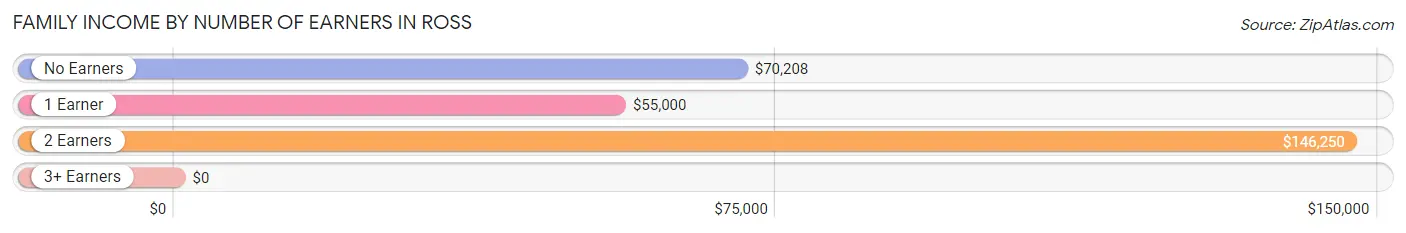
| Number of Earners | # Families | Median Income |
| No Earners | 11 (17.7%) | $70,208 |
| 1 Earner | 28 (45.2%) | $55,000 |
| 2 Earners | 22 (35.5%) | $146,250 |
| 3+ Earners | 1 (1.6%) | $0 |
| Total | 62 (100.0%) | $58,750 |
Household Income in Ross
Household Income Brackets in Ross
With 28 households falling in the category, the $50,000 to $74,999 income range is the most frequent in Ross, accounting for 39.4% of all households.
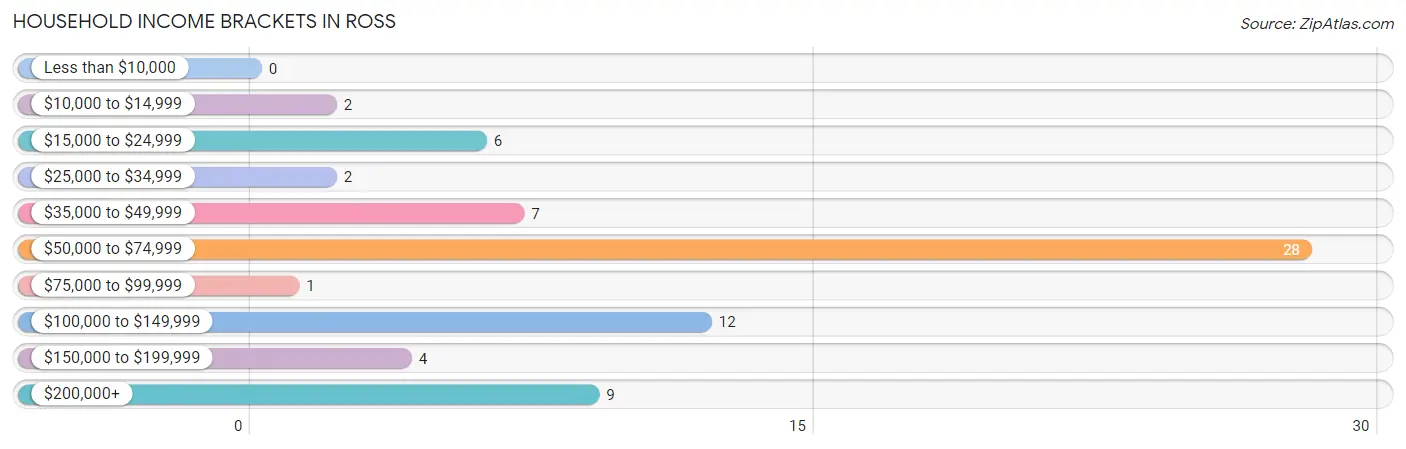
| Income Bracket | # Households | % Households |
| Less than $10,000 | 0 | 0.0% |
| $10,000 to $14,999 | 2 | 2.8% |
| $15,000 to $24,999 | 6 | 8.5% |
| $25,000 to $34,999 | 2 | 2.8% |
| $35,000 to $49,999 | 7 | 9.9% |
| $50,000 to $74,999 | 28 | 39.4% |
| $75,000 to $99,999 | 1 | 1.4% |
| $100,000 to $149,999 | 12 | 16.9% |
| $150,000 to $199,999 | 4 | 5.6% |
| $200,000+ | 9 | 12.7% |
Household Income by Householder Age in Ross
The median household income in Ross is $61,250, with the highest median household income of $138,438 found in the 45 to 64 years age bracket for the primary householder. A total of 31 households (43.7%) fall into this category. Meanwhile, the 15 to 24 years age bracket for the primary householder has the lowest median household income of $0, with 2 households (2.8%) in this group.
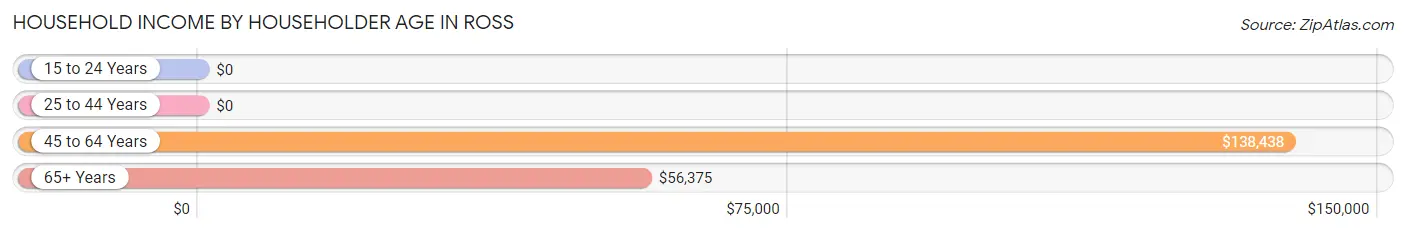
| Income Bracket | # Households | Median Income |
| 15 to 24 Years | 2 (2.8%) | $0 |
| 25 to 44 Years | 3 (4.2%) | $0 |
| 45 to 64 Years | 31 (43.7%) | $138,438 |
| 65+ Years | 35 (49.3%) | $56,375 |
| Total | 71 (100.0%) | $61,250 |
Poverty in Ross
Income Below Poverty by Sex and Age in Ross
With 20.5% poverty level for males and 19.8% for females among the residents of Ross, 18 to 24 year old males and 16 and 17 year old females are the most vulnerable to poverty, with 7 males (70.0%) and 8 females (80.0%) in their respective age groups living below the poverty level.
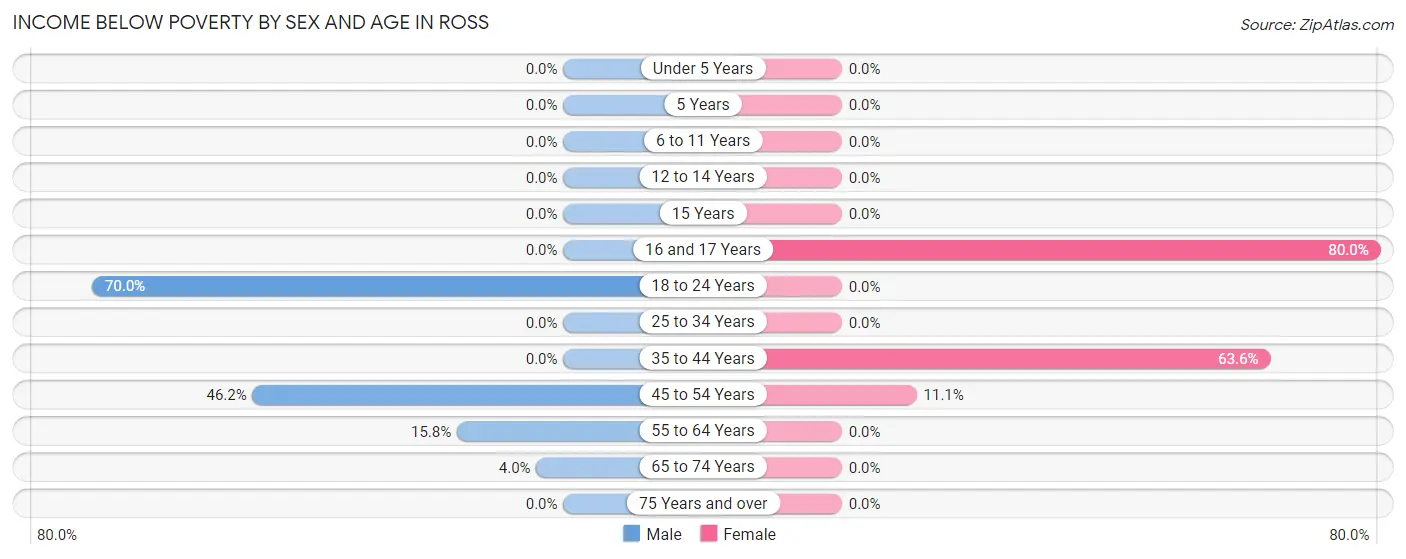
| Age Bracket | Male | Female |
| Under 5 Years | 0 (0.0%) | 0 (0.0%) |
| 5 Years | 0 (0.0%) | 0 (0.0%) |
| 6 to 11 Years | 0 (0.0%) | 0 (0.0%) |
| 12 to 14 Years | 0 (0.0%) | 0 (0.0%) |
| 15 Years | 0 (0.0%) | 0 (0.0%) |
| 16 and 17 Years | 0 (0.0%) | 8 (80.0%) |
| 18 to 24 Years | 7 (70.0%) | 0 (0.0%) |
| 25 to 34 Years | 0 (0.0%) | 0 (0.0%) |
| 35 to 44 Years | 0 (0.0%) | 7 (63.6%) |
| 45 to 54 Years | 6 (46.2%) | 1 (11.1%) |
| 55 to 64 Years | 3 (15.8%) | 0 (0.0%) |
| 65 to 74 Years | 1 (4.0%) | 0 (0.0%) |
| 75 Years and over | 0 (0.0%) | 0 (0.0%) |
| Total | 17 (20.5%) | 16 (19.8%) |
Income Above Poverty by Sex and Age in Ross
According to the poverty statistics in Ross, males aged under 5 years and females aged 6 to 11 years are the age groups that are most secure financially, with 100.0% of males and 100.0% of females in these age groups living above the poverty line.
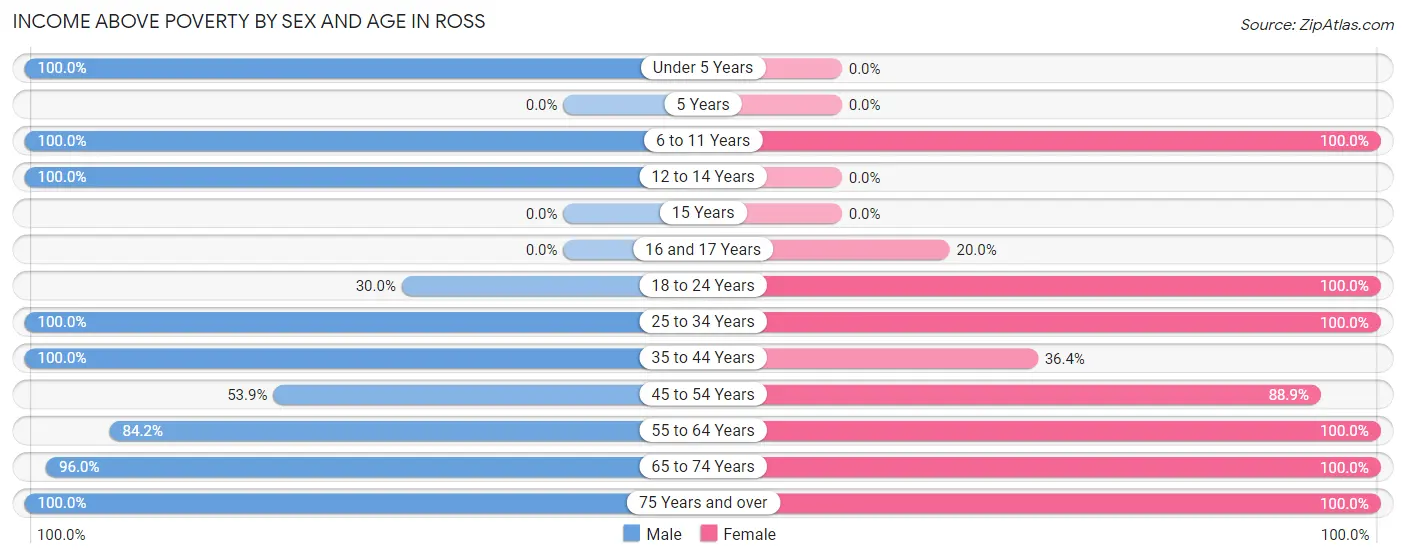
| Age Bracket | Male | Female |
| Under 5 Years | 1 (100.0%) | 0 (0.0%) |
| 5 Years | 0 (0.0%) | 0 (0.0%) |
| 6 to 11 Years | 2 (100.0%) | 2 (100.0%) |
| 12 to 14 Years | 2 (100.0%) | 0 (0.0%) |
| 15 Years | 0 (0.0%) | 0 (0.0%) |
| 16 and 17 Years | 0 (0.0%) | 2 (20.0%) |
| 18 to 24 Years | 3 (30.0%) | 4 (100.0%) |
| 25 to 34 Years | 1 (100.0%) | 1 (100.0%) |
| 35 to 44 Years | 3 (100.0%) | 4 (36.4%) |
| 45 to 54 Years | 7 (53.8%) | 8 (88.9%) |
| 55 to 64 Years | 16 (84.2%) | 18 (100.0%) |
| 65 to 74 Years | 24 (96.0%) | 22 (100.0%) |
| 75 Years and over | 7 (100.0%) | 4 (100.0%) |
| Total | 66 (79.5%) | 65 (80.2%) |
Income Below Poverty Among Married-Couple Families in Ross
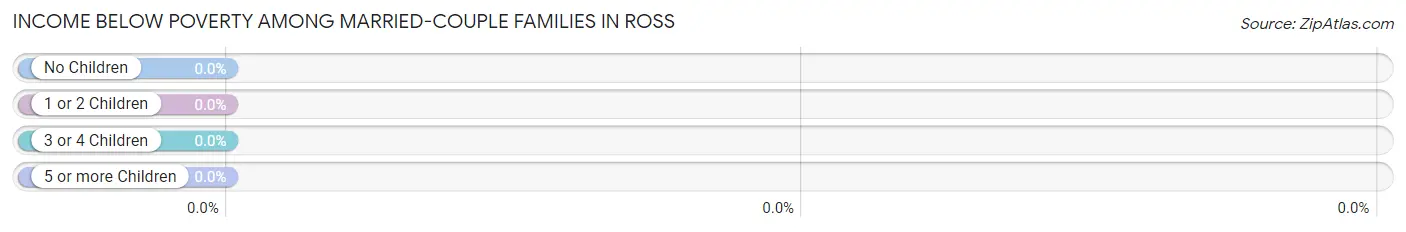
| Children | Above Poverty | Below Poverty |
| No Children | 47 (100.0%) | 0 (0.0%) |
| 1 or 2 Children | 1 (100.0%) | 0 (0.0%) |
| 3 or 4 Children | 2 (100.0%) | 0 (0.0%) |
| 5 or more Children | 0 (0.0%) | 0 (0.0%) |
| Total | 50 (100.0%) | 0 (0.0%) |
Income Below Poverty Among Single-Parent Households in Ross
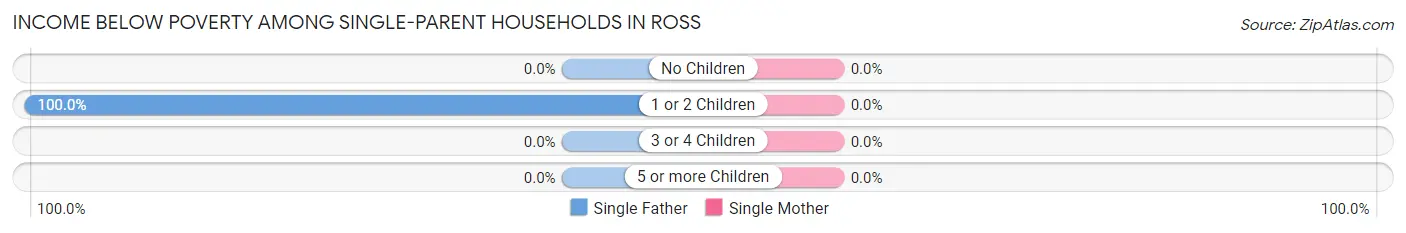
| Children | Single Father | Single Mother |
| No Children | 0 (0.0%) | 0 (0.0%) |
| 1 or 2 Children | 6 (100.0%) | 0 (0.0%) |
| 3 or 4 Children | 0 (0.0%) | 0 (0.0%) |
| 5 or more Children | 0 (0.0%) | 0 (0.0%) |
| Total | 6 (75.0%) | 0 (0.0%) |
Income Below Poverty Among Married-Couple vs Single-Parent Households in Ross
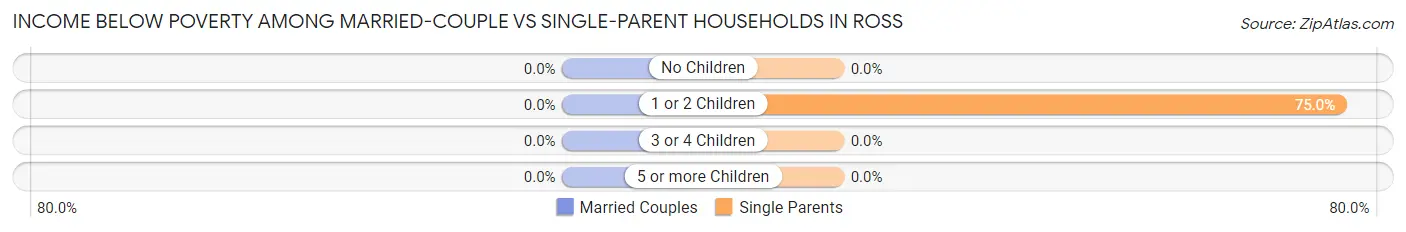
| Children | Married-Couple Families | Single-Parent Households |
| No Children | 0 (0.0%) | 0 (0.0%) |
| 1 or 2 Children | 0 (0.0%) | 6 (75.0%) |
| 3 or 4 Children | 0 (0.0%) | 0 (0.0%) |
| 5 or more Children | 0 (0.0%) | 0 (0.0%) |
| Total | 0 (0.0%) | 6 (50.0%) |
Race in Ross
The most populous races in Ross are White / Caucasian (147 | 89.6%), Two or more Races (16 | 9.8%), and Hispanic or Latino (8 | 4.9%).
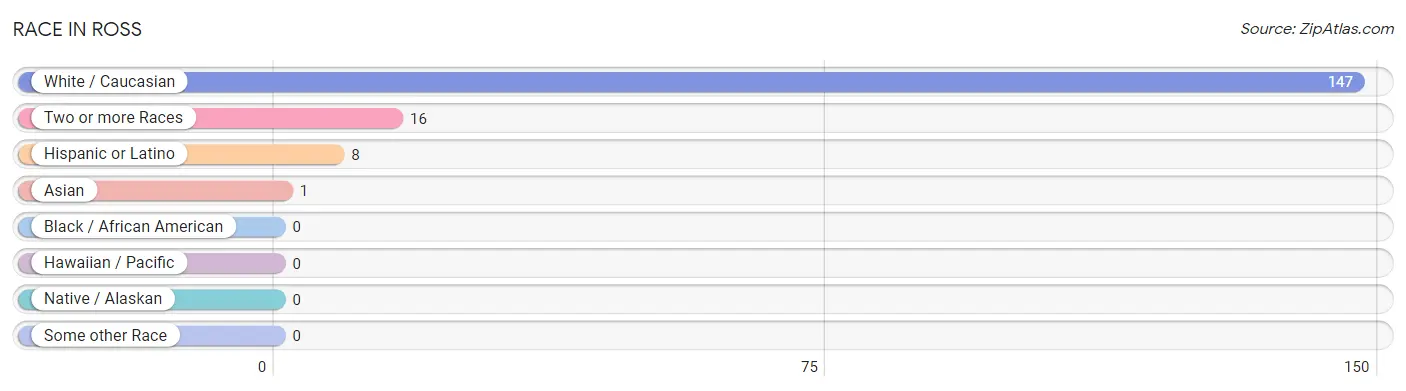
| Race | # Population | % Population |
| Asian | 1 | 0.6% |
| Black / African American | 0 | 0.0% |
| Hawaiian / Pacific | 0 | 0.0% |
| Hispanic or Latino | 8 | 4.9% |
| Native / Alaskan | 0 | 0.0% |
| White / Caucasian | 147 | 89.6% |
| Two or more Races | 16 | 9.8% |
| Some other Race | 0 | 0.0% |
| Total | 164 | 100.0% |
Ancestry in Ross
The most populous ancestries reported in Ross are German (41 | 25.0%), Czech (17 | 10.4%), Irish (17 | 10.4%), English (14 | 8.5%), and French (12 | 7.3%), together accounting for 61.6% of all Ross residents.
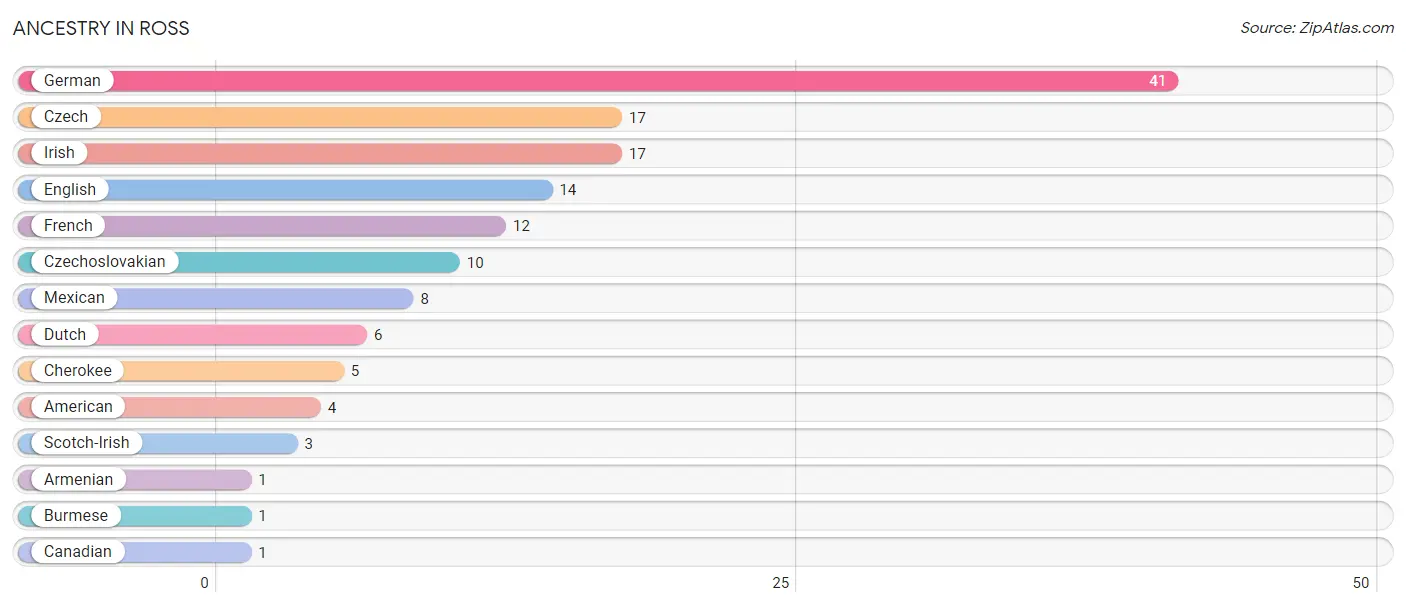
| Ancestry | # Population | % Population |
| American | 4 | 2.4% |
| Armenian | 1 | 0.6% |
| Burmese | 1 | 0.6% |
| Canadian | 1 | 0.6% |
| Cherokee | 5 | 3.0% |
| Czech | 17 | 10.4% |
| Czechoslovakian | 10 | 6.1% |
| Dutch | 6 | 3.7% |
| English | 14 | 8.5% |
| French | 12 | 7.3% |
| German | 41 | 25.0% |
| Irish | 17 | 10.4% |
| Mexican | 8 | 4.9% |
| Scotch-Irish | 3 | 1.8% | View All 14 Rows |
Immigrants in Ross
The most numerous immigrant groups reported in Ross came from Central America (2 | 1.2%), Latin America (2 | 1.2%), Mexico (2 | 1.2%), Asia (1 | 0.6%), and Canada (1 | 0.6%), together accounting for 4.9% of all Ross residents.
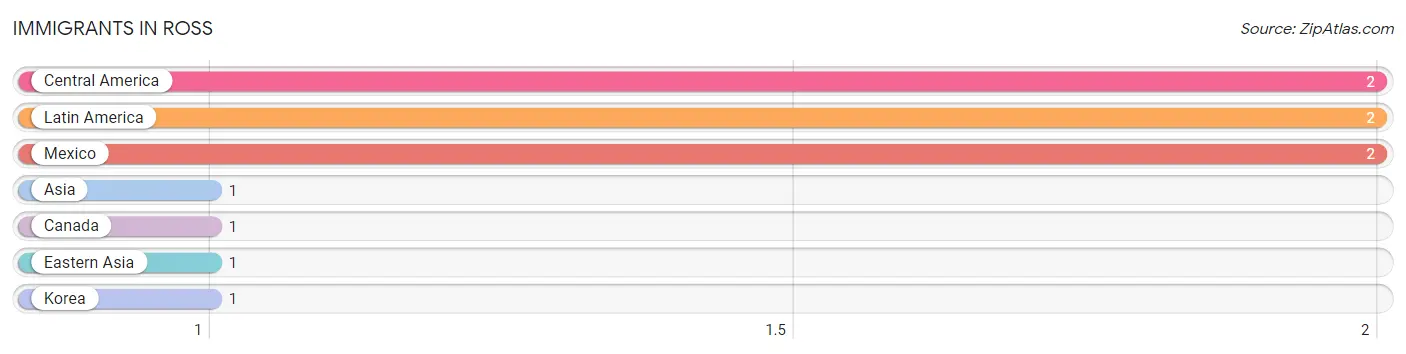
| Immigration Origin | # Population | % Population |
| Asia | 1 | 0.6% |
| Canada | 1 | 0.6% |
| Central America | 2 | 1.2% |
| Eastern Asia | 1 | 0.6% |
| Korea | 1 | 0.6% |
| Latin America | 2 | 1.2% |
| Mexico | 2 | 1.2% | View All 7 Rows |
Sex and Age in Ross
Sex and Age in Ross
The most populous age groups in Ross are 70 to 74 Years (22 | 26.5%) for men and 60 to 64 Years (13 | 16.1%) for women.
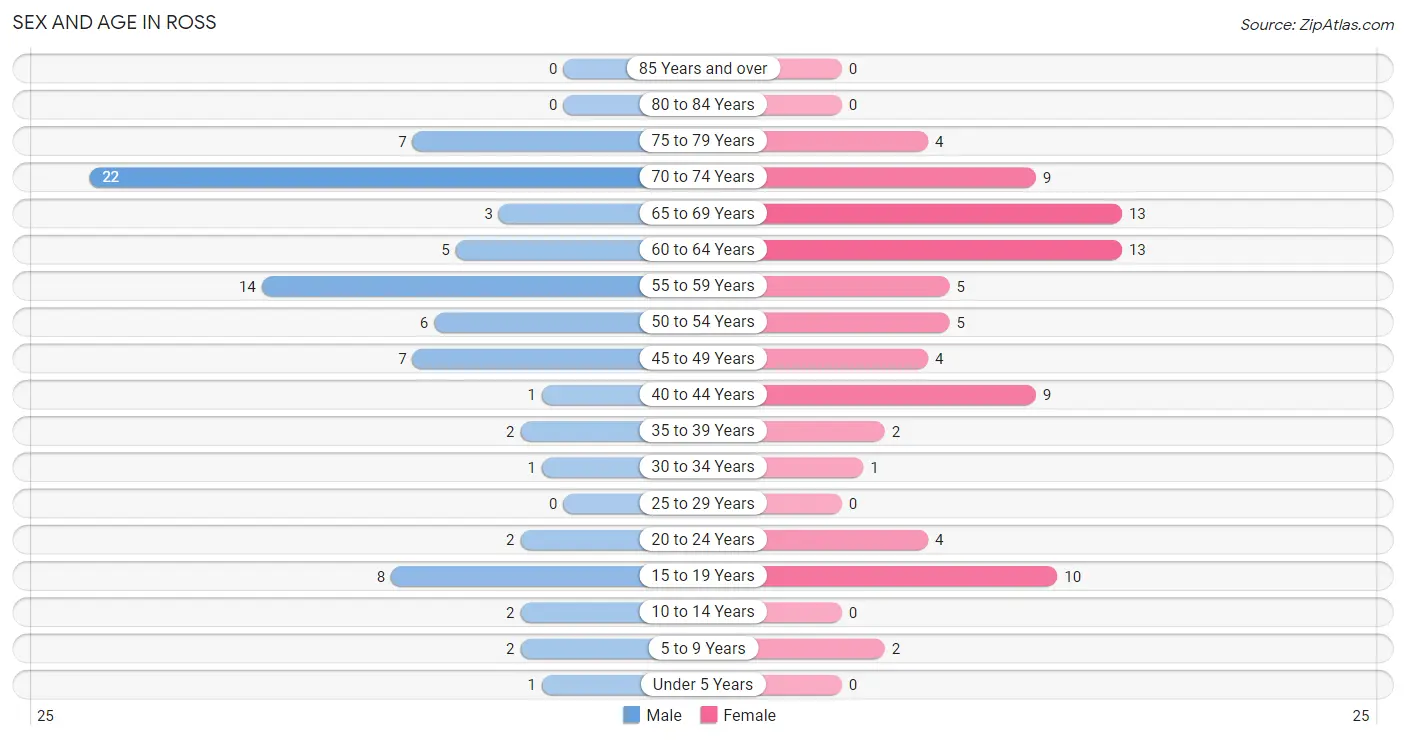
| Age Bracket | Male | Female |
| Under 5 Years | 1 (1.2%) | 0 (0.0%) |
| 5 to 9 Years | 2 (2.4%) | 2 (2.5%) |
| 10 to 14 Years | 2 (2.4%) | 0 (0.0%) |
| 15 to 19 Years | 8 (9.6%) | 10 (12.3%) |
| 20 to 24 Years | 2 (2.4%) | 4 (4.9%) |
| 25 to 29 Years | 0 (0.0%) | 0 (0.0%) |
| 30 to 34 Years | 1 (1.2%) | 1 (1.2%) |
| 35 to 39 Years | 2 (2.4%) | 2 (2.5%) |
| 40 to 44 Years | 1 (1.2%) | 9 (11.1%) |
| 45 to 49 Years | 7 (8.4%) | 4 (4.9%) |
| 50 to 54 Years | 6 (7.2%) | 5 (6.2%) |
| 55 to 59 Years | 14 (16.9%) | 5 (6.2%) |
| 60 to 64 Years | 5 (6.0%) | 13 (16.1%) |
| 65 to 69 Years | 3 (3.6%) | 13 (16.1%) |
| 70 to 74 Years | 22 (26.5%) | 9 (11.1%) |
| 75 to 79 Years | 7 (8.4%) | 4 (4.9%) |
| 80 to 84 Years | 0 (0.0%) | 0 (0.0%) |
| 85 Years and over | 0 (0.0%) | 0 (0.0%) |
| Total | 83 (100.0%) | 81 (100.0%) |
Families and Households in Ross
Median Family Size in Ross
The median family size in Ross is 2.39 persons per family, with single male/father families (8 | 12.9%) accounting for the largest median family size of 4 persons per family. On the other hand, single female/mother families (4 | 6.5%) represent the smallest median family size with 1.75 persons per family.
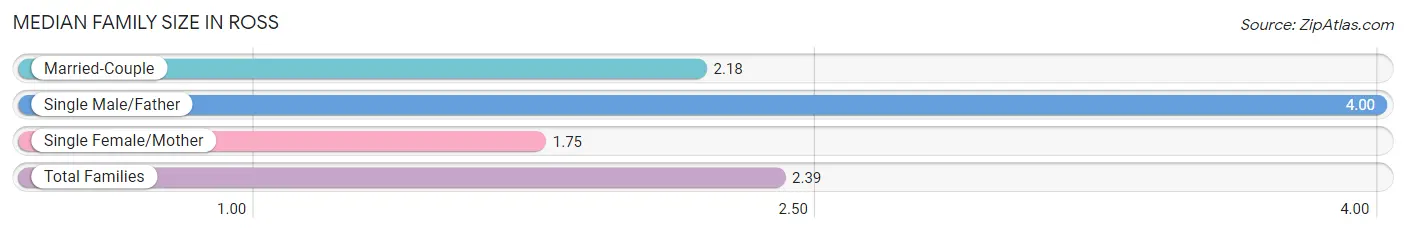
| Family Type | # Families | Family Size |
| Married-Couple | 50 (80.6%) | 2.18 |
| Single Male/Father | 8 (12.9%) | 4.00 |
| Single Female/Mother | 4 (6.5%) | 1.75 |
| Total Families | 62 (100.0%) | 2.39 |
Median Household Size in Ross
The median household size in Ross is 2.31 persons per household, with single male/father households (8 | 11.3%) accounting for the largest median household size of 4 persons per household. non-family households (9 | 12.7%) represent the smallest median household size with 1.56 persons per household.
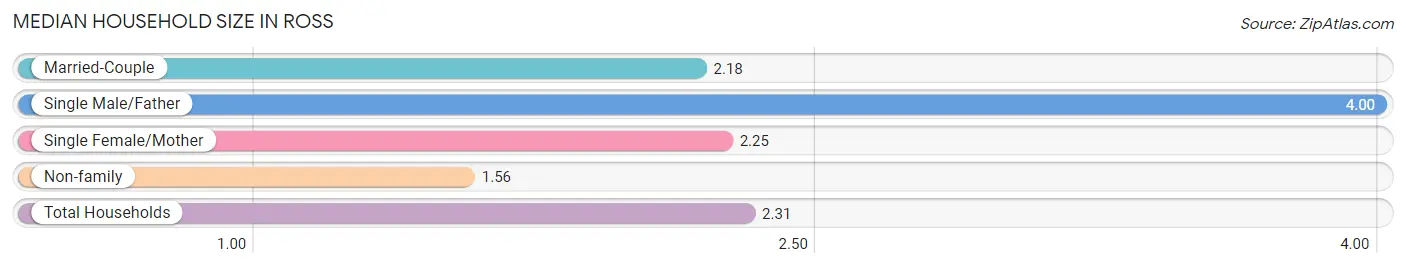
| Household Type | # Households | Household Size |
| Married-Couple | 50 (70.4%) | 2.18 |
| Single Male/Father | 8 (11.3%) | 4.00 |
| Single Female/Mother | 4 (5.6%) | 2.25 |
| Non-family | 9 (12.7%) | 1.56 |
| Total Households | 71 (100.0%) | 2.31 |
Household Size by Marriage Status in Ross
Out of a total of 71 households in Ross, 62 (87.3%) are family households, while 9 (12.7%) are nonfamily households. The most numerous type of family households are 2-person households, comprising 46, and the most common type of nonfamily households are 1-person households, comprising 6.
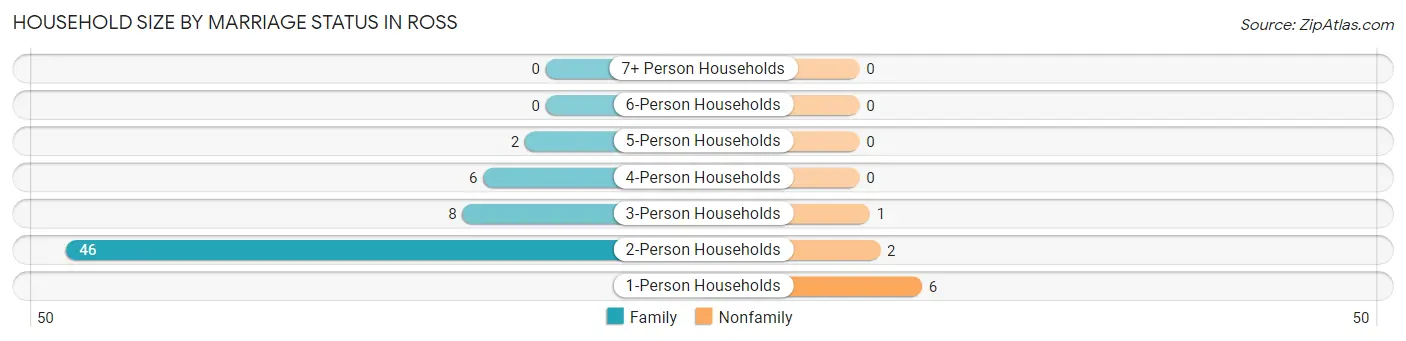
| Household Size | Family Households | Nonfamily Households |
| 1-Person Households | - | 6 (8.5%) |
| 2-Person Households | 46 (64.8%) | 2 (2.8%) |
| 3-Person Households | 8 (11.3%) | 1 (1.4%) |
| 4-Person Households | 6 (8.5%) | 0 (0.0%) |
| 5-Person Households | 2 (2.8%) | 0 (0.0%) |
| 6-Person Households | 0 (0.0%) | 0 (0.0%) |
| 7+ Person Households | 0 (0.0%) | 0 (0.0%) |
| Total | 62 (87.3%) | 9 (12.7%) |
Female Fertility in Ross
Fertility by Age in Ross
| Age Bracket | Women with Births | Births / 1,000 Women |
| 15 to 19 years | 0 (0.0%) | 0.0 |
| 20 to 34 years | 0 (0.0%) | 0.0 |
| 35 to 50 years | 0 (0.0%) | 0.0 |
| Total | 0 (0.0%) | 0.0 |
Fertility by Age by Marriage Status in Ross
| Age Bracket | Married | Unmarried |
| 15 to 19 years | 0 (0.0%) | 0 (0.0%) |
| 20 to 34 years | 0 (0.0%) | 0 (0.0%) |
| 35 to 50 years | 0 (0.0%) | 0 (0.0%) |
| Total | 0 (0.0%) | 0 (0.0%) |
Fertility by Education in Ross
| Educational Attainment | Women with Births | Births / 1,000 Women |
| Less than High School | 0 (0.0%) | 0.0 |
| High School Diploma | 0 (0.0%) | 0.0 |
| College or Associate's Degree | 0 (0.0%) | 0.0 |
| Bachelor's Degree | 0 (0.0%) | 0.0 |
| Graduate Degree | 0 (0.0%) | 0.0 |
| Total | 0 (0.0%) | 0.0 |
Fertility by Education by Marriage Status in Ross
| Educational Attainment | Married | Unmarried |
| Less than High School | 0 (0.0%) | 0 (0.0%) |
| High School Diploma | 0 (0.0%) | 0 (0.0%) |
| College or Associate's Degree | 0 (0.0%) | 0 (0.0%) |
| Bachelor's Degree | 0 (0.0%) | 0 (0.0%) |
| Graduate Degree | 0 (0.0%) | 0 (0.0%) |
| Total | 0 (0.0%) | 0 (0.0%) |
Employment Characteristics in Ross
Employment by Class of Employer in Ross
Among the 77 employed individuals in Ross, private company employees (53 | 68.8%), state government employees (7 | 9.1%), and federal government employees (5 | 6.5%) make up the most common classes of employment.
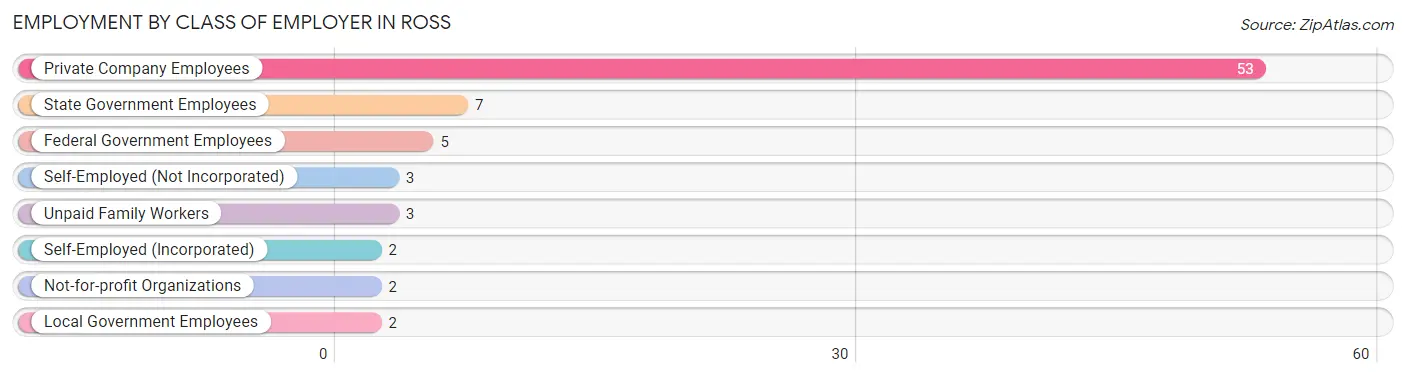
| Employer Class | # Employees | % Employees |
| Private Company Employees | 53 | 68.8% |
| Self-Employed (Incorporated) | 2 | 2.6% |
| Self-Employed (Not Incorporated) | 3 | 3.9% |
| Not-for-profit Organizations | 2 | 2.6% |
| Local Government Employees | 2 | 2.6% |
| State Government Employees | 7 | 9.1% |
| Federal Government Employees | 5 | 6.5% |
| Unpaid Family Workers | 3 | 3.9% |
| Total | 77 | 100.0% |
Employment Status by Age in Ross
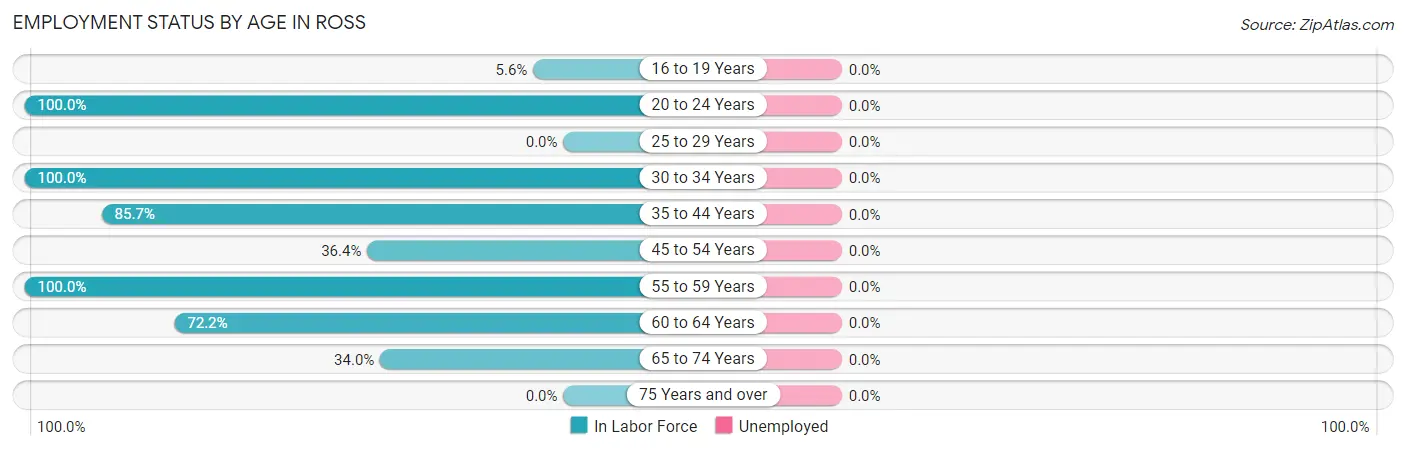
| Age Bracket | In Labor Force | Unemployed |
| 16 to 19 Years | 1 (5.6%) | 0 (0.0%) |
| 20 to 24 Years | 6 (100.0%) | 0 (0.0%) |
| 25 to 29 Years | 0 (0.0%) | 0 (0.0%) |
| 30 to 34 Years | 2 (100.0%) | 0 (0.0%) |
| 35 to 44 Years | 12 (85.7%) | 0 (0.0%) |
| 45 to 54 Years | 8 (36.4%) | 0 (0.0%) |
| 55 to 59 Years | 19 (100.0%) | 0 (0.0%) |
| 60 to 64 Years | 13 (72.2%) | 0 (0.0%) |
| 65 to 74 Years | 16 (34.0%) | 0 (0.0%) |
| 75 Years and over | 0 (0.0%) | 0 (0.0%) |
| Total | 77 (49.0%) | 0 (0.0%) |
Employment Status by Educational Attainment in Ross
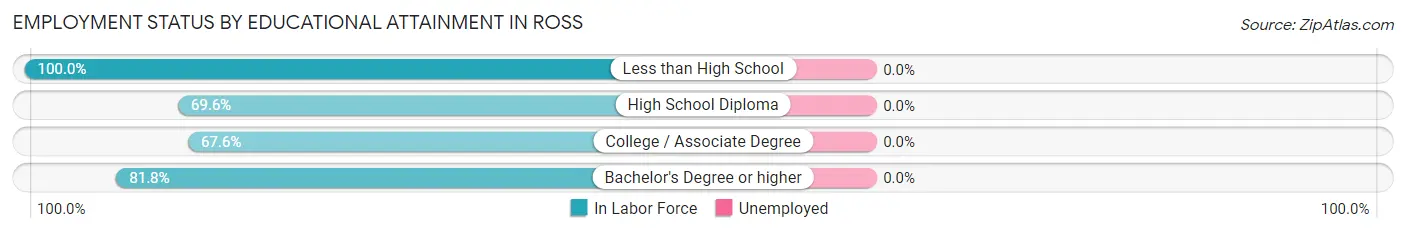
| Educational Attainment | In Labor Force | Unemployed |
| Less than High School | 4 (100.0%) | 0 (0.0%) |
| High School Diploma | 16 (69.6%) | 0 (0.0%) |
| College / Associate Degree | 25 (67.6%) | 0 (0.0%) |
| Bachelor's Degree or higher | 9 (81.8%) | 0 (0.0%) |
| Total | 54 (72.0%) | 0 (0.0%) |
Employment Occupations by Sex in Ross
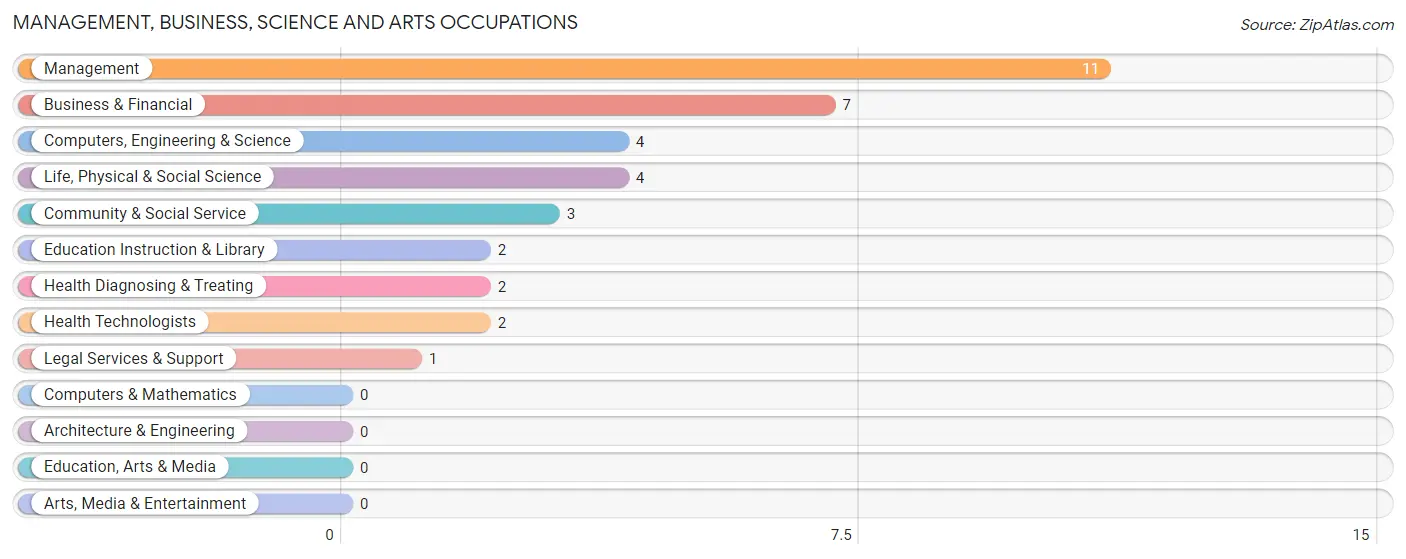
Management, Business, Science and Arts Occupations
The most common Management, Business, Science and Arts occupations in Ross are Management (11 | 14.3%), Business & Financial (7 | 9.1%), Computers, Engineering & Science (4 | 5.2%), Life, Physical & Social Science (4 | 5.2%), and Community & Social Service (3 | 3.9%).
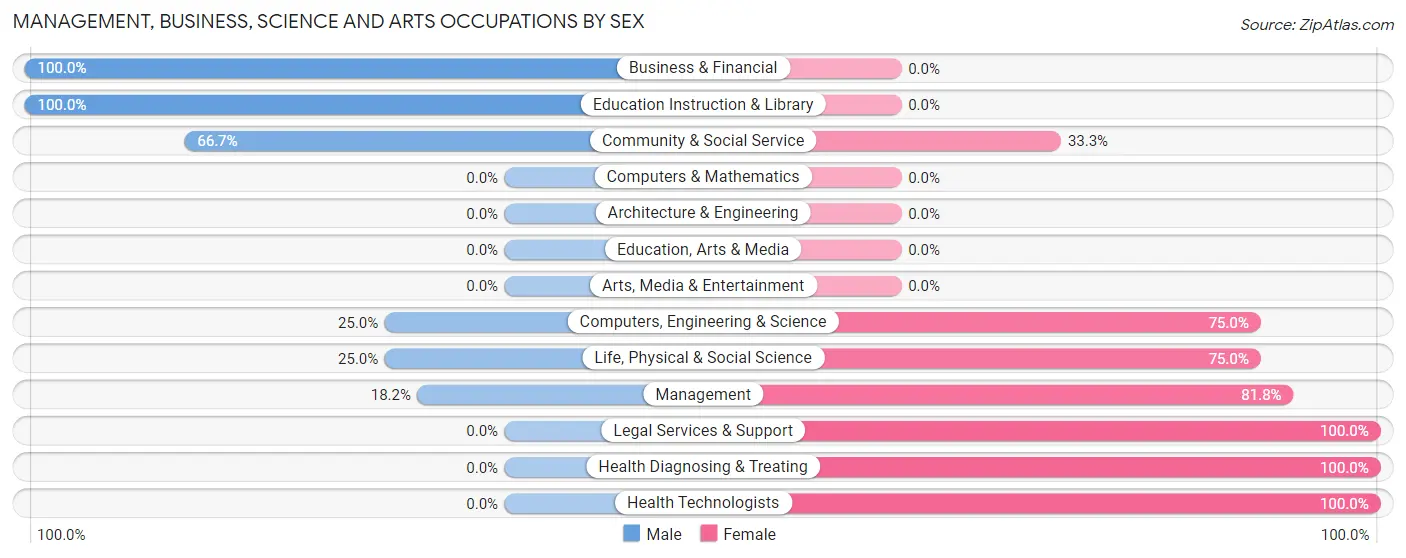
Management, Business, Science and Arts Occupations by Sex
Within the Management, Business, Science and Arts occupations in Ross, the most male-oriented occupations are Business & Financial (100.0%), Education Instruction & Library (100.0%), and Community & Social Service (66.7%), while the most female-oriented occupations are Legal Services & Support (100.0%), Health Diagnosing & Treating (100.0%), and Health Technologists (100.0%).
| Occupation | Male | Female |
| Management | 2 (18.2%) | 9 (81.8%) |
| Business & Financial | 7 (100.0%) | 0 (0.0%) |
| Computers, Engineering & Science | 1 (25.0%) | 3 (75.0%) |
| Computers & Mathematics | 0 (0.0%) | 0 (0.0%) |
| Architecture & Engineering | 0 (0.0%) | 0 (0.0%) |
| Life, Physical & Social Science | 1 (25.0%) | 3 (75.0%) |
| Community & Social Service | 2 (66.7%) | 1 (33.3%) |
| Education, Arts & Media | 0 (0.0%) | 0 (0.0%) |
| Legal Services & Support | 0 (0.0%) | 1 (100.0%) |
| Education Instruction & Library | 2 (100.0%) | 0 (0.0%) |
| Arts, Media & Entertainment | 0 (0.0%) | 0 (0.0%) |
| Health Diagnosing & Treating | 0 (0.0%) | 2 (100.0%) |
| Health Technologists | 0 (0.0%) | 2 (100.0%) |
| Total (Category) | 12 (44.4%) | 15 (55.6%) |
| Total (Overall) | 37 (48.0%) | 40 (51.9%) |
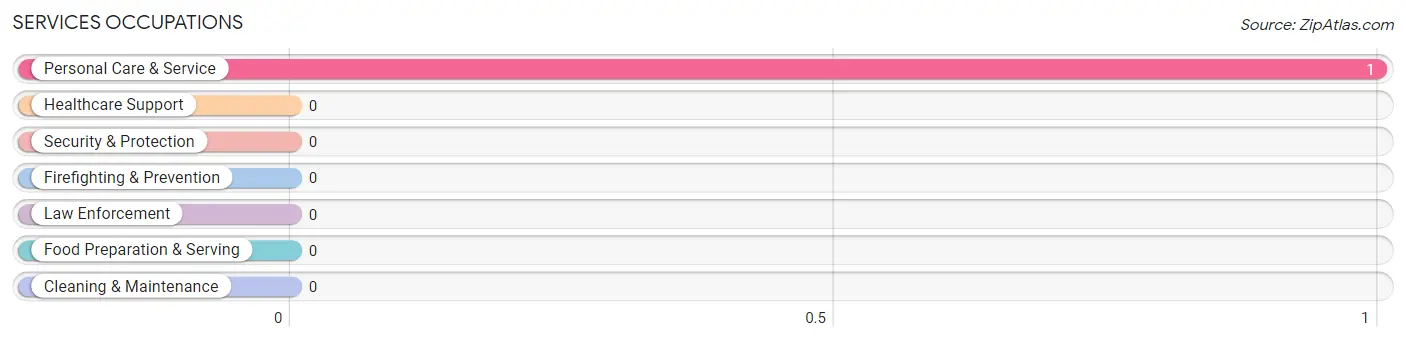
Services Occupations
The most common Services occupations in Ross are , and Personal Care & Service (1 | 1.3%).
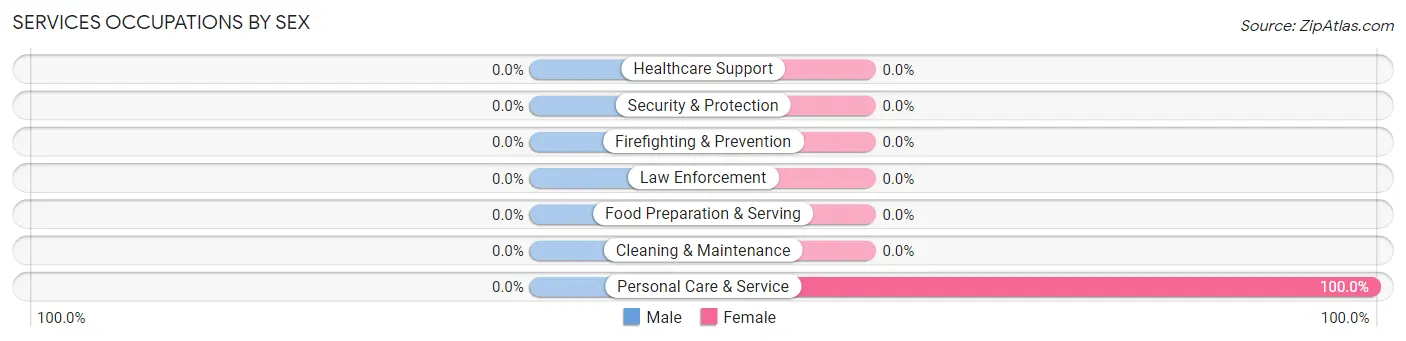
Services Occupations by Sex
| Occupation | Male | Female |
| Healthcare Support | 0 (0.0%) | 0 (0.0%) |
| Security & Protection | 0 (0.0%) | 0 (0.0%) |
| Firefighting & Prevention | 0 (0.0%) | 0 (0.0%) |
| Law Enforcement | 0 (0.0%) | 0 (0.0%) |
| Food Preparation & Serving | 0 (0.0%) | 0 (0.0%) |
| Cleaning & Maintenance | 0 (0.0%) | 0 (0.0%) |
| Personal Care & Service | 0 (0.0%) | 1 (100.0%) |
| Total (Category) | 0 (0.0%) | 1 (100.0%) |
| Total (Overall) | 37 (48.0%) | 40 (51.9%) |
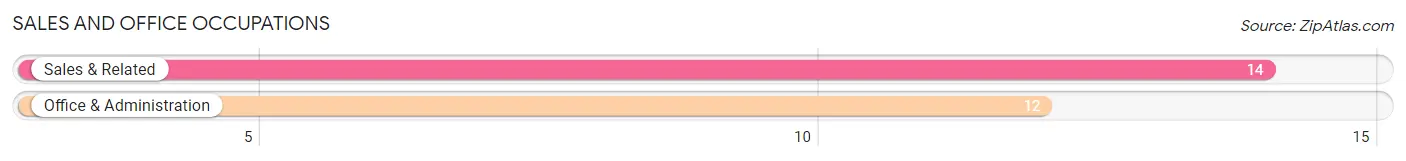
Sales and Office Occupations
The most common Sales and Office occupations in Ross are Sales & Related (14 | 18.2%), and Office & Administration (12 | 15.6%).
Sales and Office Occupations by Sex
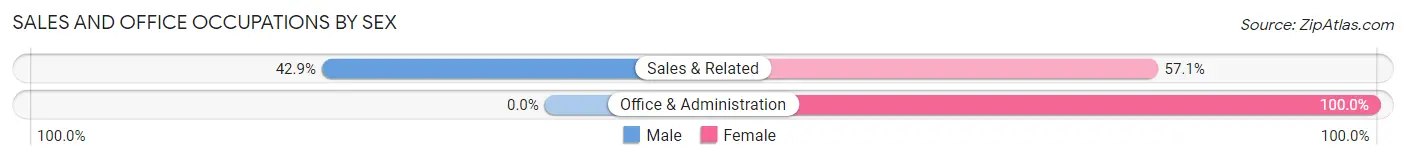
| Occupation | Male | Female |
| Sales & Related | 6 (42.9%) | 8 (57.1%) |
| Office & Administration | 0 (0.0%) | 12 (100.0%) |
| Total (Category) | 6 (23.1%) | 20 (76.9%) |
| Total (Overall) | 37 (48.0%) | 40 (51.9%) |
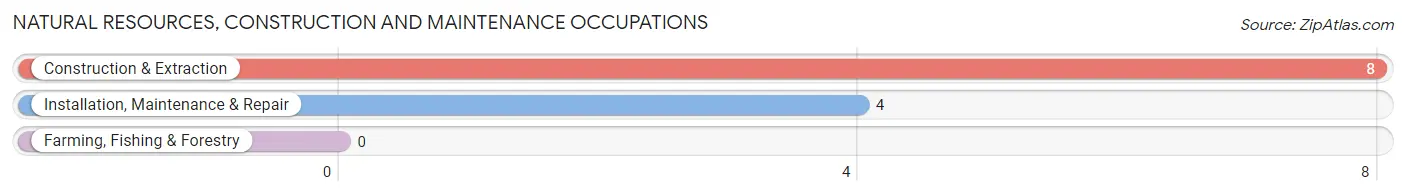
Natural Resources, Construction and Maintenance Occupations
The most common Natural Resources, Construction and Maintenance occupations in Ross are Construction & Extraction (8 | 10.4%), and Installation, Maintenance & Repair (4 | 5.2%).
Natural Resources, Construction and Maintenance Occupations by Sex
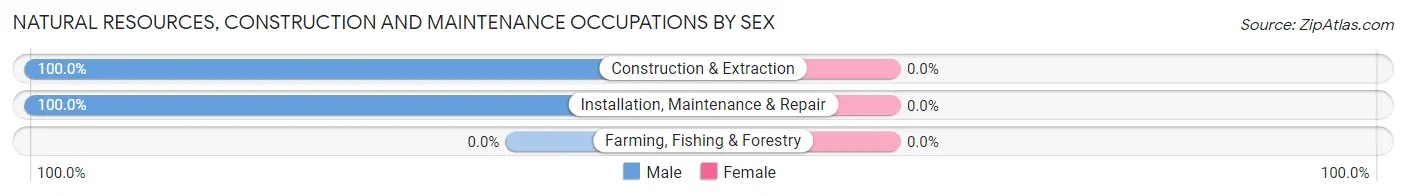
| Occupation | Male | Female |
| Farming, Fishing & Forestry | 0 (0.0%) | 0 (0.0%) |
| Construction & Extraction | 8 (100.0%) | 0 (0.0%) |
| Installation, Maintenance & Repair | 4 (100.0%) | 0 (0.0%) |
| Total (Category) | 12 (100.0%) | 0 (0.0%) |
| Total (Overall) | 37 (48.0%) | 40 (51.9%) |
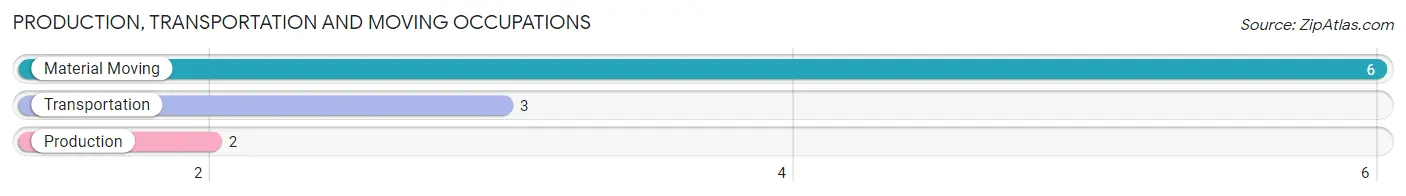
Production, Transportation and Moving Occupations
The most common Production, Transportation and Moving occupations in Ross are Material Moving (6 | 7.8%), Transportation (3 | 3.9%), and Production (2 | 2.6%).
Production, Transportation and Moving Occupations by Sex
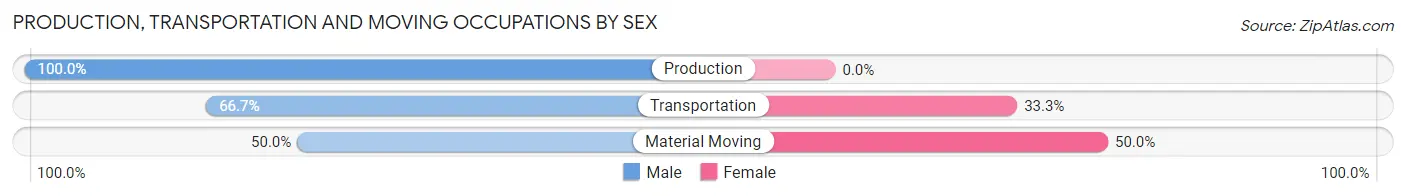
| Occupation | Male | Female |
| Production | 2 (100.0%) | 0 (0.0%) |
| Transportation | 2 (66.7%) | 1 (33.3%) |
| Material Moving | 3 (50.0%) | 3 (50.0%) |
| Total (Category) | 7 (63.6%) | 4 (36.4%) |
| Total (Overall) | 37 (48.0%) | 40 (51.9%) |
Employment Industries by Sex in Ross
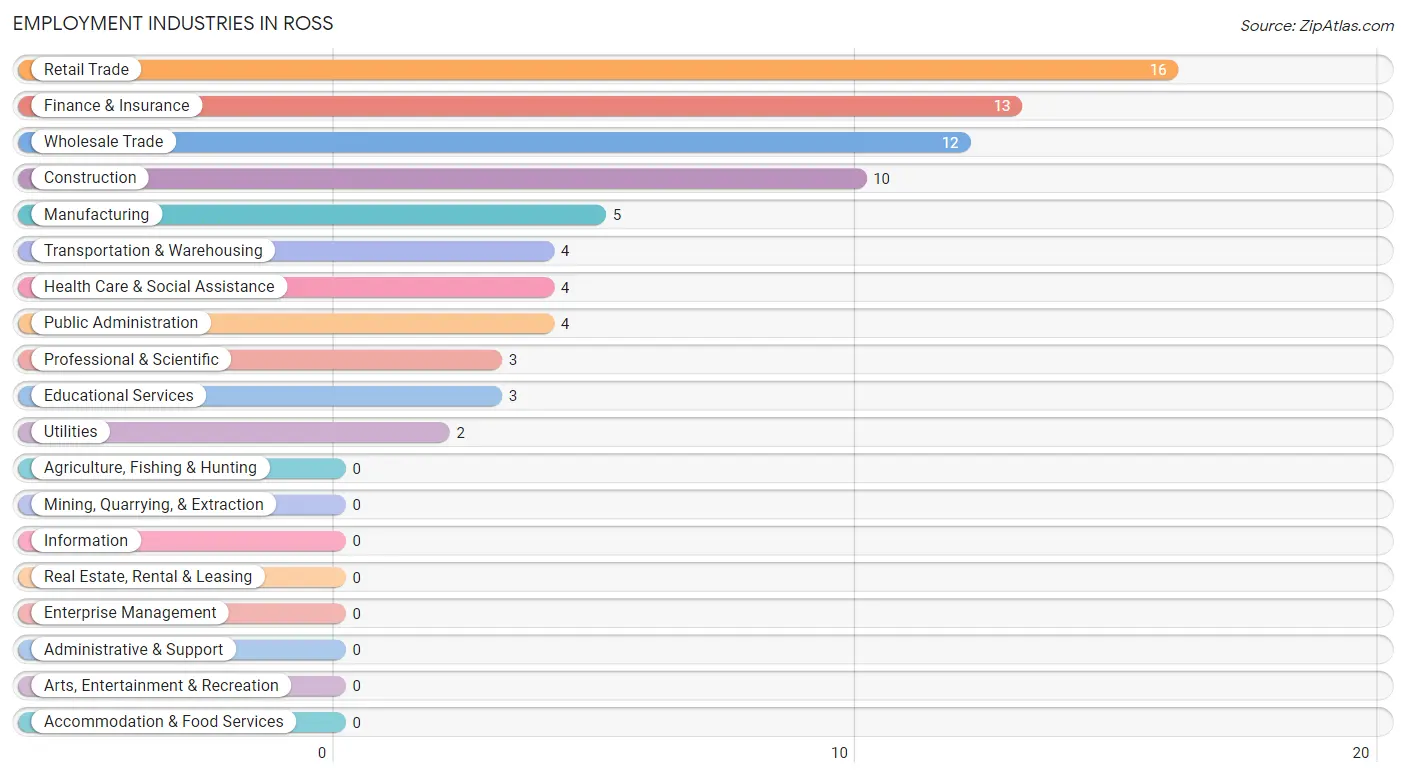
Employment Industries in Ross
The major employment industries in Ross include Retail Trade (16 | 20.8%), Finance & Insurance (13 | 16.9%), Wholesale Trade (12 | 15.6%), Construction (10 | 13.0%), and Manufacturing (5 | 6.5%).
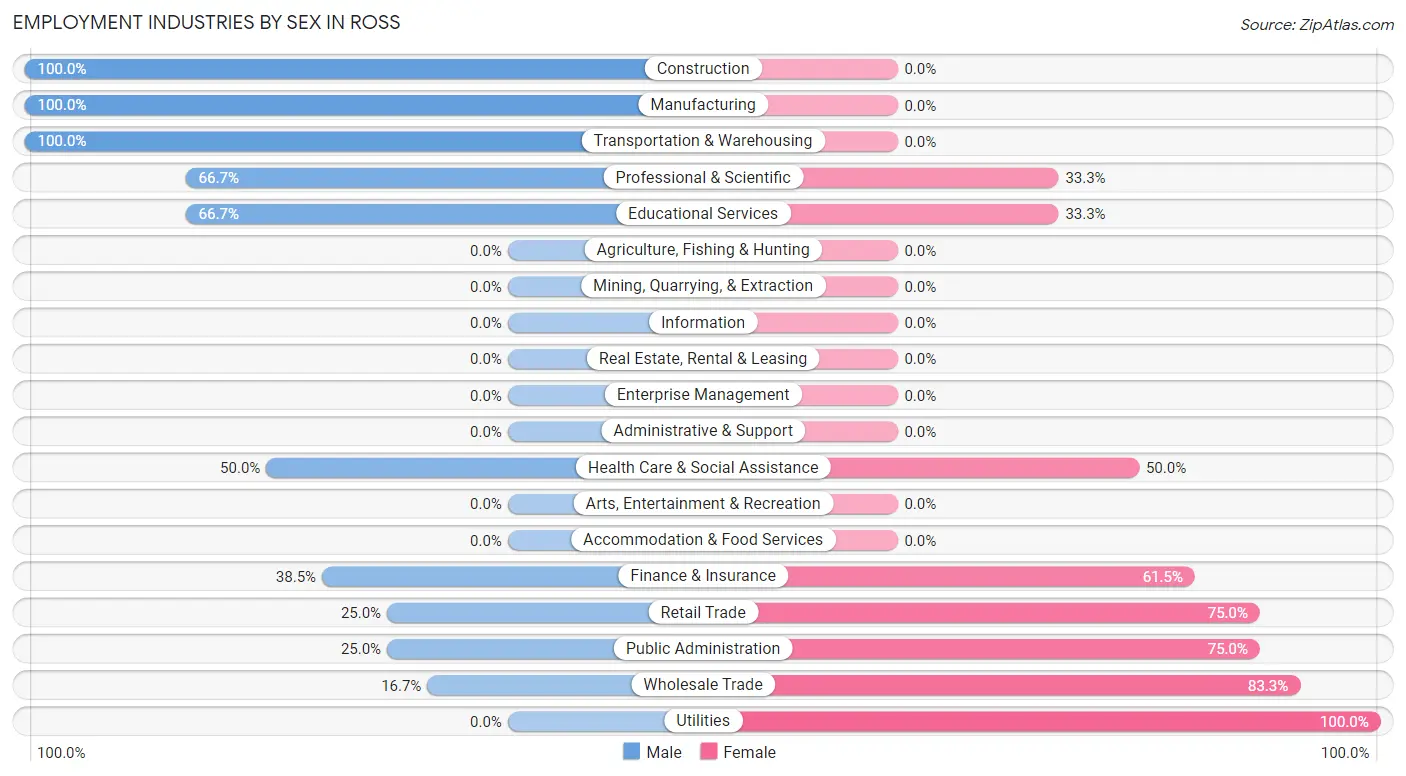
Employment Industries by Sex in Ross
The Ross industries that see more men than women are Construction (100.0%), Manufacturing (100.0%), and Transportation & Warehousing (100.0%), whereas the industries that tend to have a higher number of women are Utilities (100.0%), Wholesale Trade (83.3%), and Retail Trade (75.0%).
| Industry | Male | Female |
| Agriculture, Fishing & Hunting | 0 (0.0%) | 0 (0.0%) |
| Mining, Quarrying, & Extraction | 0 (0.0%) | 0 (0.0%) |
| Construction | 10 (100.0%) | 0 (0.0%) |
| Manufacturing | 5 (100.0%) | 0 (0.0%) |
| Wholesale Trade | 2 (16.7%) | 10 (83.3%) |
| Retail Trade | 4 (25.0%) | 12 (75.0%) |
| Transportation & Warehousing | 4 (100.0%) | 0 (0.0%) |
| Utilities | 0 (0.0%) | 2 (100.0%) |
| Information | 0 (0.0%) | 0 (0.0%) |
| Finance & Insurance | 5 (38.5%) | 8 (61.5%) |
| Real Estate, Rental & Leasing | 0 (0.0%) | 0 (0.0%) |
| Professional & Scientific | 2 (66.7%) | 1 (33.3%) |
| Enterprise Management | 0 (0.0%) | 0 (0.0%) |
| Administrative & Support | 0 (0.0%) | 0 (0.0%) |
| Educational Services | 2 (66.7%) | 1 (33.3%) |
| Health Care & Social Assistance | 2 (50.0%) | 2 (50.0%) |
| Arts, Entertainment & Recreation | 0 (0.0%) | 0 (0.0%) |
| Accommodation & Food Services | 0 (0.0%) | 0 (0.0%) |
| Public Administration | 1 (25.0%) | 3 (75.0%) |
| Total | 37 (48.0%) | 40 (51.9%) |
Education in Ross
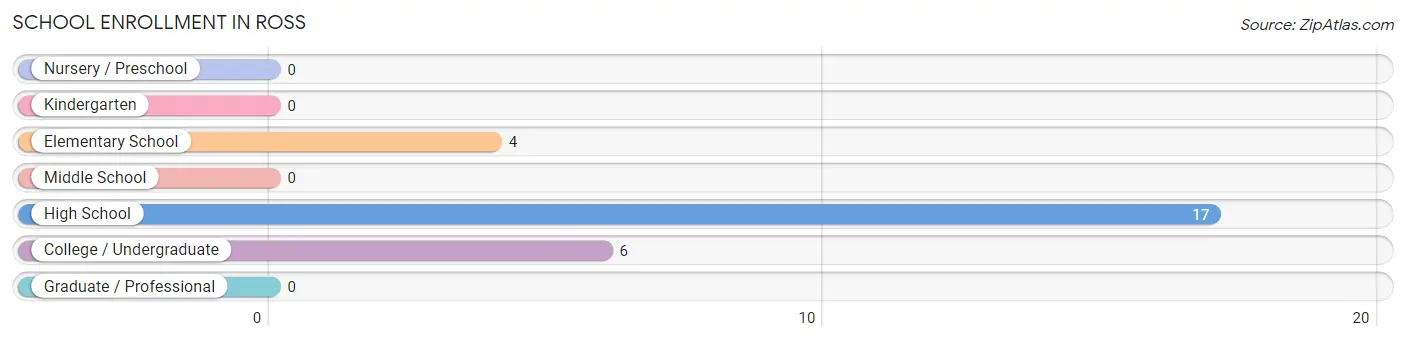
School Enrollment in Ross
The most common levels of schooling among the 27 students in Ross are high school (17 | 63.0%), college / undergraduate (6 | 22.2%), and elementary school (4 | 14.8%).
| School Level | # Students | % Students |
| Nursery / Preschool | 0 | 0.0% |
| Kindergarten | 0 | 0.0% |
| Elementary School | 4 | 14.8% |
| Middle School | 0 | 0.0% |
| High School | 17 | 63.0% |
| College / Undergraduate | 6 | 22.2% |
| Graduate / Professional | 0 | 0.0% |
| Total | 27 | 100.0% |
School Enrollment by Age by Funding Source in Ross
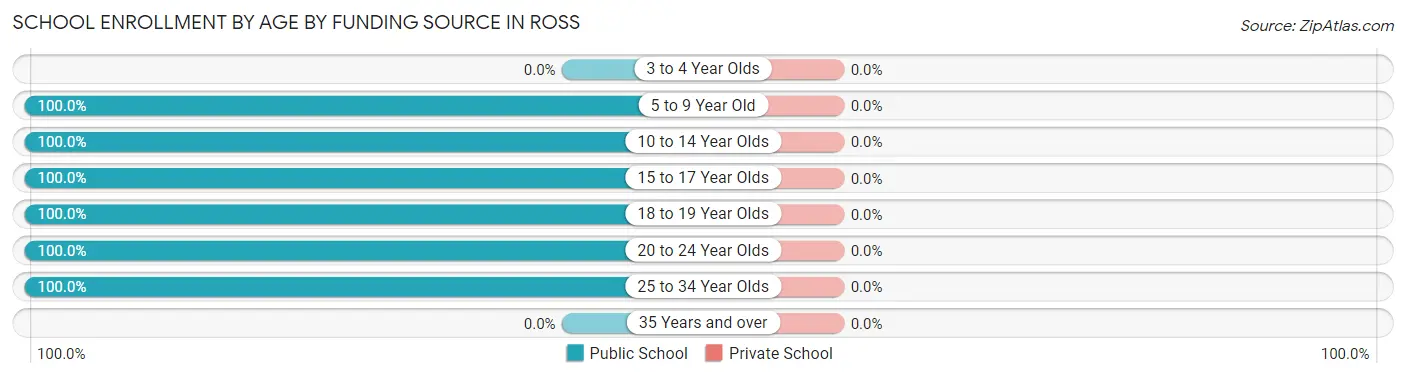
| Age Bracket | Public School | Private School |
| 3 to 4 Year Olds | 0 (0.0%) | 0 (0.0%) |
| 5 to 9 Year Old | 4 (100.0%) | 0 (0.0%) |
| 10 to 14 Year Olds | 2 (100.0%) | 0 (0.0%) |
| 15 to 17 Year Olds | 10 (100.0%) | 0 (0.0%) |
| 18 to 19 Year Olds | 8 (100.0%) | 0 (0.0%) |
| 20 to 24 Year Olds | 2 (100.0%) | 0 (0.0%) |
| 25 to 34 Year Olds | 1 (100.0%) | 0 (0.0%) |
| 35 Years and over | 0 (0.0%) | 0 (0.0%) |
| Total | 27 (100.0%) | 0 (0.0%) |
Educational Attainment by Field of Study in Ross
Business (8 | 36.4%), education (5 | 22.7%), liberal arts & history (3 | 13.6%), bio, nature & agricultural (2 | 9.1%), and science & technology (2 | 9.1%) are the most common fields of study among 22 individuals in Ross who have obtained a bachelor's degree or higher.
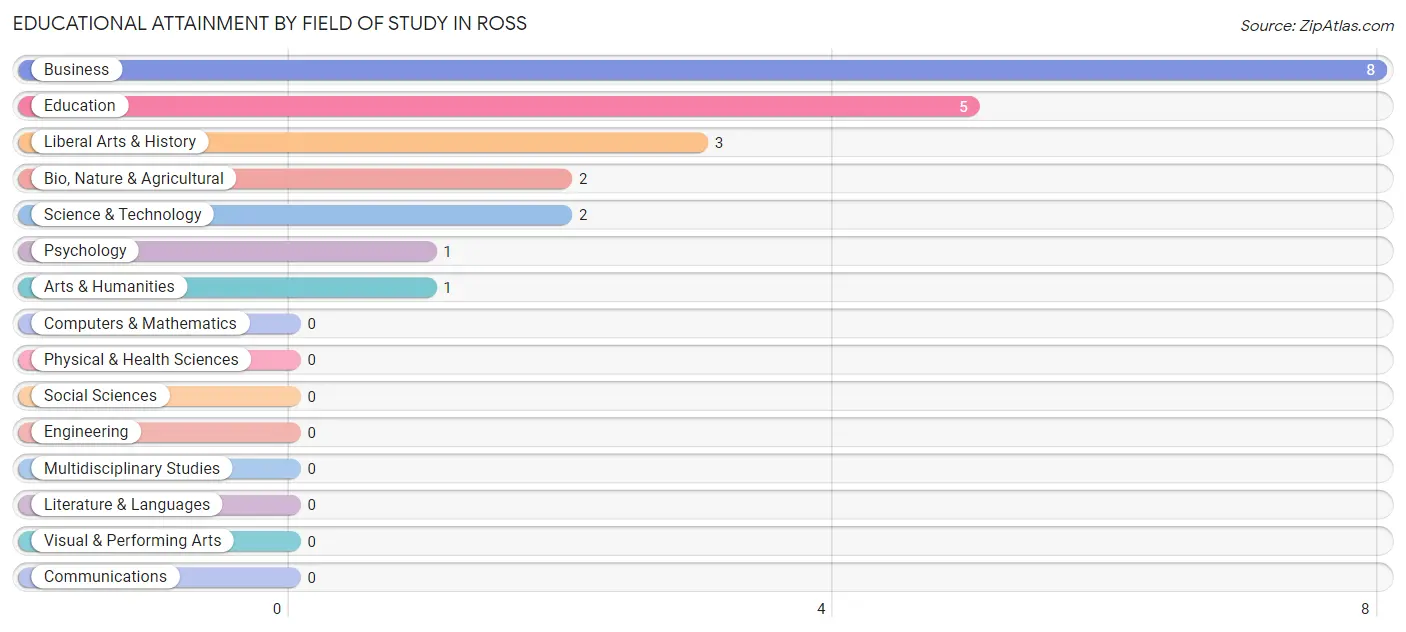
| Field of Study | # Graduates | % Graduates |
| Computers & Mathematics | 0 | 0.0% |
| Bio, Nature & Agricultural | 2 | 9.1% |
| Physical & Health Sciences | 0 | 0.0% |
| Psychology | 1 | 4.5% |
| Social Sciences | 0 | 0.0% |
| Engineering | 0 | 0.0% |
| Multidisciplinary Studies | 0 | 0.0% |
| Science & Technology | 2 | 9.1% |
| Business | 8 | 36.4% |
| Education | 5 | 22.7% |
| Literature & Languages | 0 | 0.0% |
| Liberal Arts & History | 3 | 13.6% |
| Visual & Performing Arts | 0 | 0.0% |
| Communications | 0 | 0.0% |
| Arts & Humanities | 1 | 4.5% |
| Total | 22 | 100.0% |
Transportation & Commute in Ross
Vehicle Availability by Sex in Ross
The most prevalent vehicle ownership categories in Ross are males with 2 vehicles (17, accounting for 46.0%) and females with 2 vehicles (18, making up 42.5%).
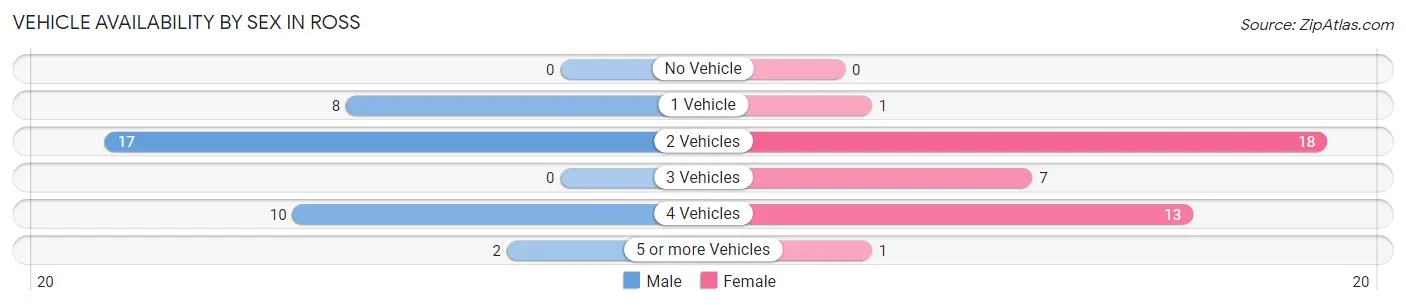
| Vehicles Available | Male | Female |
| No Vehicle | 0 (0.0%) | 0 (0.0%) |
| 1 Vehicle | 8 (21.6%) | 1 (2.5%) |
| 2 Vehicles | 17 (46.0%) | 18 (45.0%) |
| 3 Vehicles | 0 (0.0%) | 7 (17.5%) |
| 4 Vehicles | 10 (27.0%) | 13 (32.5%) |
| 5 or more Vehicles | 2 (5.4%) | 1 (2.5%) |
| Total | 37 (100.0%) | 40 (100.0%) |
Commute Time in Ross
The most frequently occuring commute durations in Ross are 15 to 19 minutes (22 commuters, 31.4%), 30 to 34 minutes (21 commuters, 30.0%), and 5 to 9 minutes (10 commuters, 14.3%).
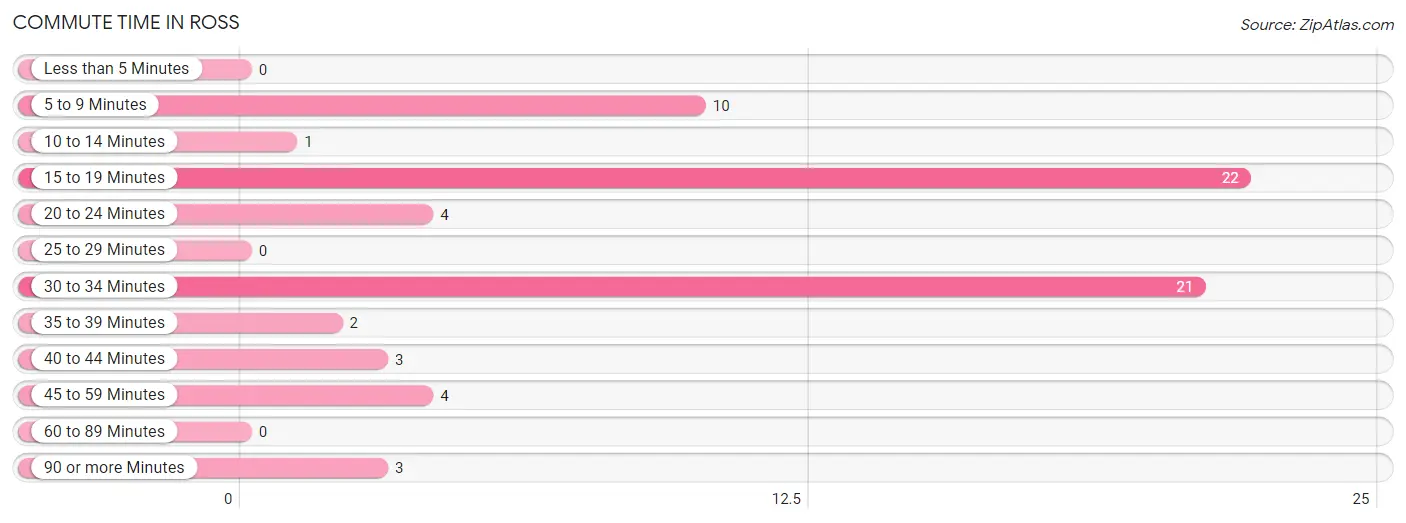
| Commute Time | # Commuters | % Commuters |
| Less than 5 Minutes | 0 | 0.0% |
| 5 to 9 Minutes | 10 | 14.3% |
| 10 to 14 Minutes | 1 | 1.4% |
| 15 to 19 Minutes | 22 | 31.4% |
| 20 to 24 Minutes | 4 | 5.7% |
| 25 to 29 Minutes | 0 | 0.0% |
| 30 to 34 Minutes | 21 | 30.0% |
| 35 to 39 Minutes | 2 | 2.9% |
| 40 to 44 Minutes | 3 | 4.3% |
| 45 to 59 Minutes | 4 | 5.7% |
| 60 to 89 Minutes | 0 | 0.0% |
| 90 or more Minutes | 3 | 4.3% |
Commute Time by Sex in Ross
The most common commute times in Ross are 30 to 34 minutes (20 commuters, 58.8%) for males and 15 to 19 minutes (19 commuters, 52.8%) for females.
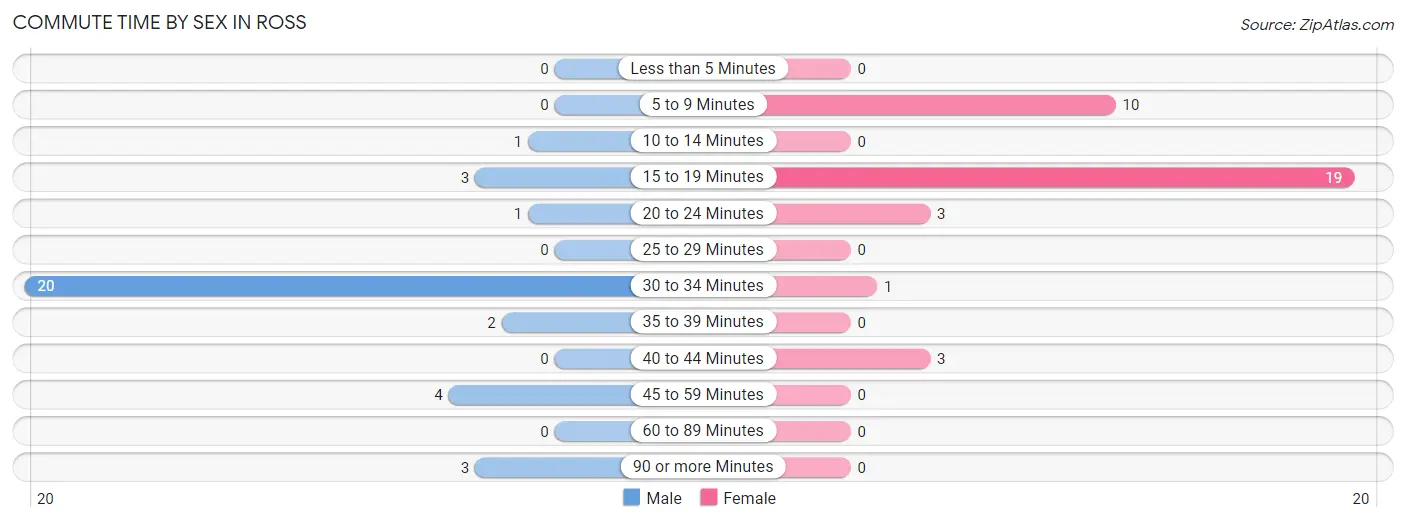
| Commute Time | Male | Female |
| Less than 5 Minutes | 0 (0.0%) | 0 (0.0%) |
| 5 to 9 Minutes | 0 (0.0%) | 10 (27.8%) |
| 10 to 14 Minutes | 1 (2.9%) | 0 (0.0%) |
| 15 to 19 Minutes | 3 (8.8%) | 19 (52.8%) |
| 20 to 24 Minutes | 1 (2.9%) | 3 (8.3%) |
| 25 to 29 Minutes | 0 (0.0%) | 0 (0.0%) |
| 30 to 34 Minutes | 20 (58.8%) | 1 (2.8%) |
| 35 to 39 Minutes | 2 (5.9%) | 0 (0.0%) |
| 40 to 44 Minutes | 0 (0.0%) | 3 (8.3%) |
| 45 to 59 Minutes | 4 (11.8%) | 0 (0.0%) |
| 60 to 89 Minutes | 0 (0.0%) | 0 (0.0%) |
| 90 or more Minutes | 3 (8.8%) | 0 (0.0%) |
Time of Departure to Work by Sex in Ross
The most frequent times of departure to work in Ross are 6:00 AM to 6:29 AM (10, 29.4%) for males and 7:00 AM to 7:29 AM (16, 44.4%) for females.
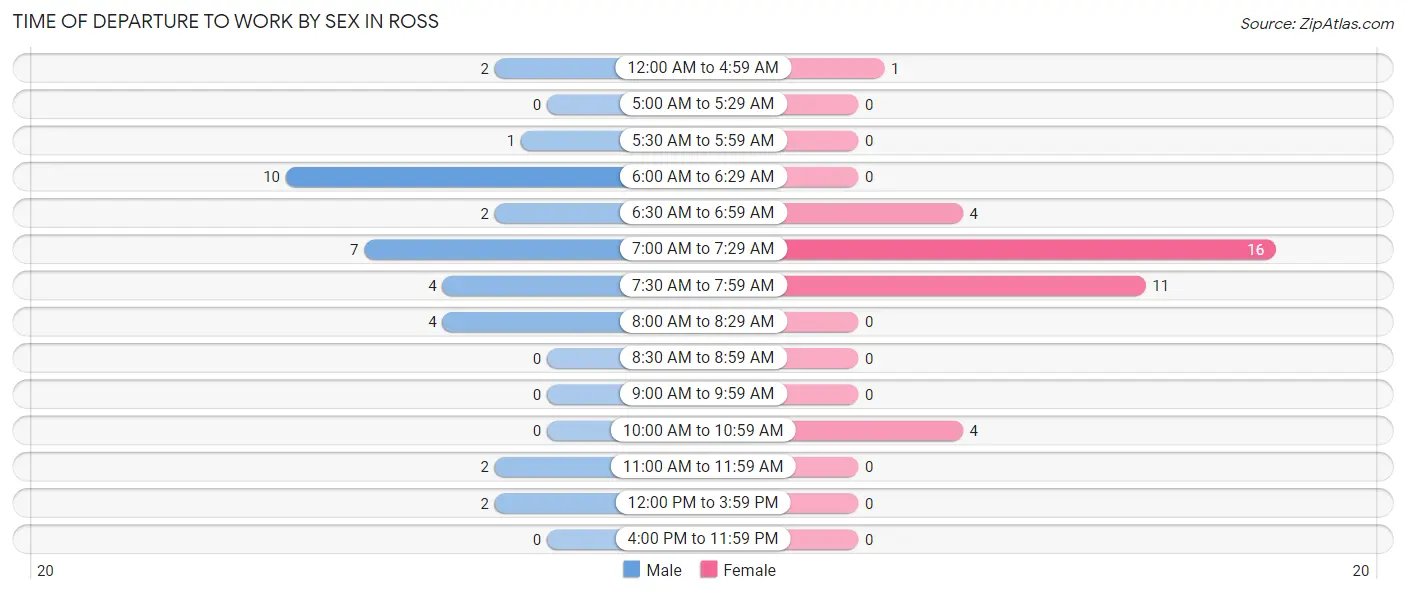
| Time of Departure | Male | Female |
| 12:00 AM to 4:59 AM | 2 (5.9%) | 1 (2.8%) |
| 5:00 AM to 5:29 AM | 0 (0.0%) | 0 (0.0%) |
| 5:30 AM to 5:59 AM | 1 (2.9%) | 0 (0.0%) |
| 6:00 AM to 6:29 AM | 10 (29.4%) | 0 (0.0%) |
| 6:30 AM to 6:59 AM | 2 (5.9%) | 4 (11.1%) |
| 7:00 AM to 7:29 AM | 7 (20.6%) | 16 (44.4%) |
| 7:30 AM to 7:59 AM | 4 (11.8%) | 11 (30.6%) |
| 8:00 AM to 8:29 AM | 4 (11.8%) | 0 (0.0%) |
| 8:30 AM to 8:59 AM | 0 (0.0%) | 0 (0.0%) |
| 9:00 AM to 9:59 AM | 0 (0.0%) | 0 (0.0%) |
| 10:00 AM to 10:59 AM | 0 (0.0%) | 4 (11.1%) |
| 11:00 AM to 11:59 AM | 2 (5.9%) | 0 (0.0%) |
| 12:00 PM to 3:59 PM | 2 (5.9%) | 0 (0.0%) |
| 4:00 PM to 11:59 PM | 0 (0.0%) | 0 (0.0%) |
| Total | 34 (100.0%) | 36 (100.0%) |
Housing Occupancy in Ross
Occupancy by Ownership in Ross
Of the total 71 dwellings in Ross, owner-occupied units account for 62 (87.3%), while renter-occupied units make up 9 (12.7%).
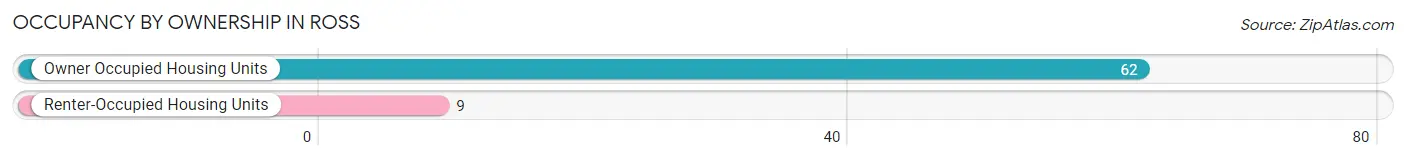
| Occupancy | # Housing Units | % Housing Units |
| Owner Occupied Housing Units | 62 | 87.3% |
| Renter-Occupied Housing Units | 9 | 12.7% |
| Total Occupied Housing Units | 71 | 100.0% |
Occupancy by Household Size in Ross
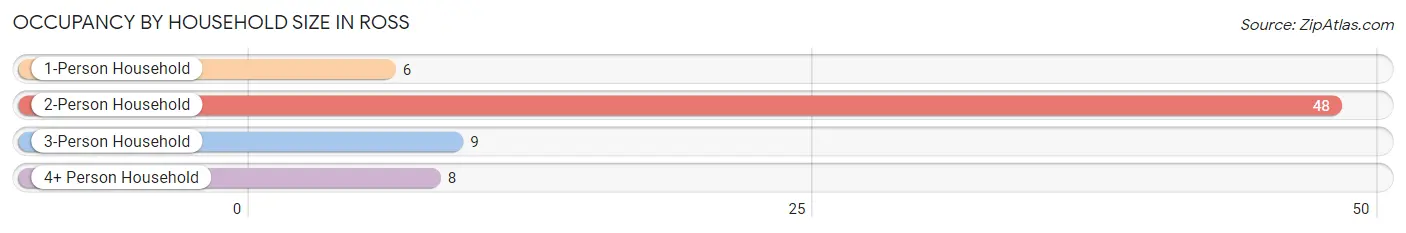
| Household Size | # Housing Units | % Housing Units |
| 1-Person Household | 6 | 8.5% |
| 2-Person Household | 48 | 67.6% |
| 3-Person Household | 9 | 12.7% |
| 4+ Person Household | 8 | 11.3% |
| Total Housing Units | 71 | 100.0% |
Occupancy by Ownership by Household Size in Ross
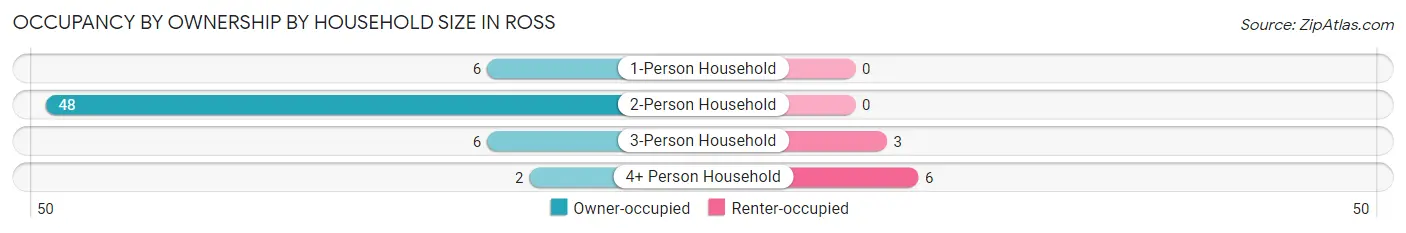
| Household Size | Owner-occupied | Renter-occupied |
| 1-Person Household | 6 (100.0%) | 0 (0.0%) |
| 2-Person Household | 48 (100.0%) | 0 (0.0%) |
| 3-Person Household | 6 (66.7%) | 3 (33.3%) |
| 4+ Person Household | 2 (25.0%) | 6 (75.0%) |
| Total Housing Units | 62 (87.3%) | 9 (12.7%) |
Occupancy by Educational Attainment in Ross
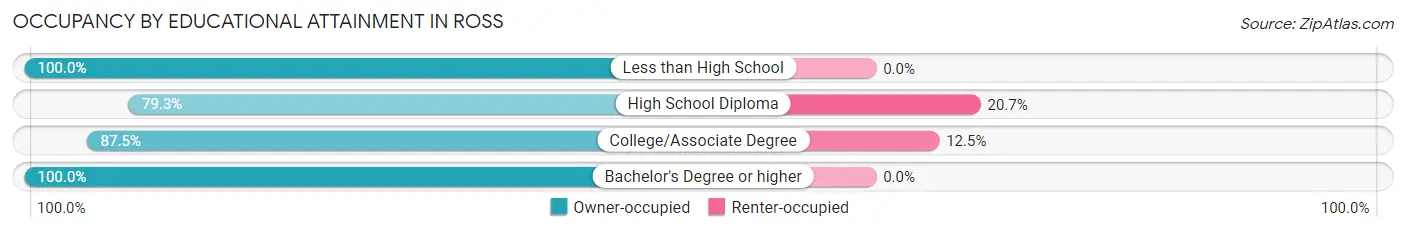
| Household Size | Owner-occupied | Renter-occupied |
| Less than High School | 7 (100.0%) | 0 (0.0%) |
| High School Diploma | 23 (79.3%) | 6 (20.7%) |
| College/Associate Degree | 21 (87.5%) | 3 (12.5%) |
| Bachelor's Degree or higher | 11 (100.0%) | 0 (0.0%) |
Occupancy by Age of Householder in Ross
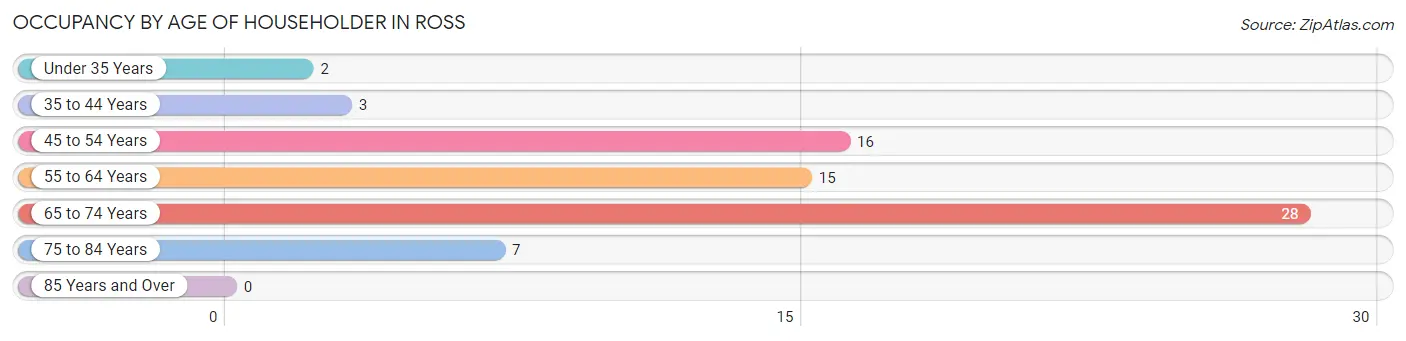
| Age Bracket | # Households | % Households |
| Under 35 Years | 2 | 2.8% |
| 35 to 44 Years | 3 | 4.2% |
| 45 to 54 Years | 16 | 22.5% |
| 55 to 64 Years | 15 | 21.1% |
| 65 to 74 Years | 28 | 39.4% |
| 75 to 84 Years | 7 | 9.9% |
| 85 Years and Over | 0 | 0.0% |
| Total | 71 | 100.0% |
Housing Finances in Ross
Median Income by Occupancy in Ross
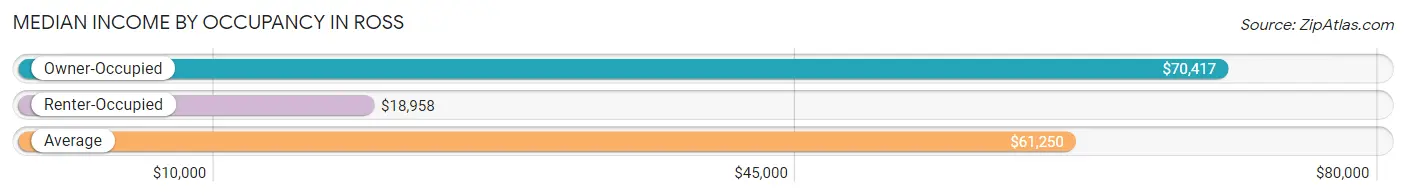
| Occupancy Type | # Households | Median Income |
| Owner-Occupied | 62 (87.3%) | $70,417 |
| Renter-Occupied | 9 (12.7%) | $18,958 |
| Average | 71 (100.0%) | $61,250 |
Occupancy by Householder Income Bracket in Ross
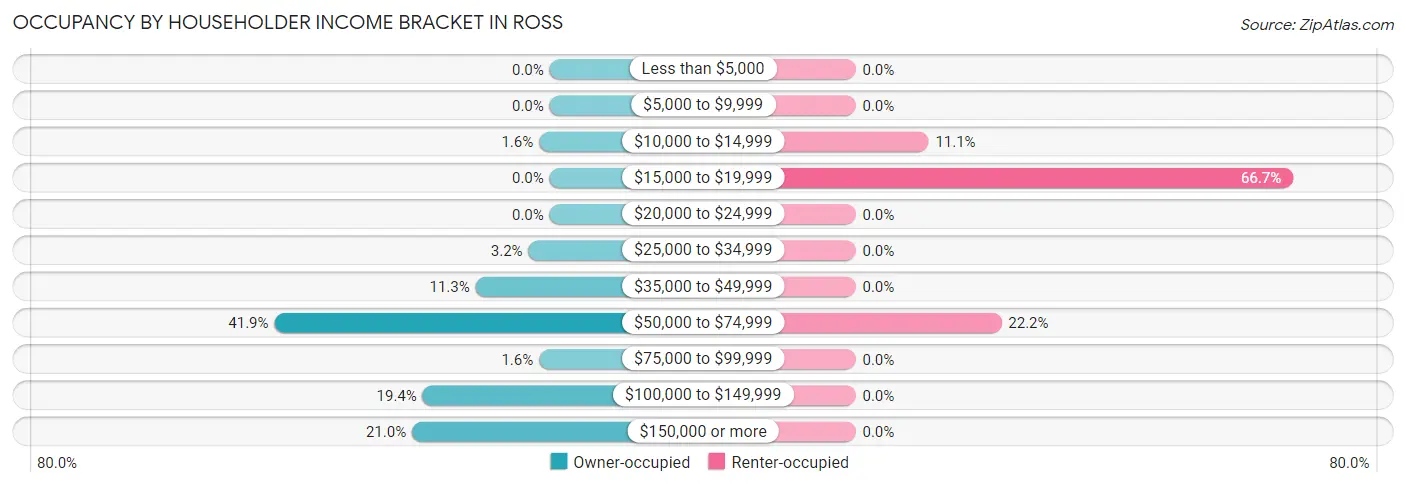
| Income Bracket | Owner-occupied | Renter-occupied |
| Less than $5,000 | 0 (0.0%) | 0 (0.0%) |
| $5,000 to $9,999 | 0 (0.0%) | 0 (0.0%) |
| $10,000 to $14,999 | 1 (1.6%) | 1 (11.1%) |
| $15,000 to $19,999 | 0 (0.0%) | 6 (66.7%) |
| $20,000 to $24,999 | 0 (0.0%) | 0 (0.0%) |
| $25,000 to $34,999 | 2 (3.2%) | 0 (0.0%) |
| $35,000 to $49,999 | 7 (11.3%) | 0 (0.0%) |
| $50,000 to $74,999 | 26 (41.9%) | 2 (22.2%) |
| $75,000 to $99,999 | 1 (1.6%) | 0 (0.0%) |
| $100,000 to $149,999 | 12 (19.4%) | 0 (0.0%) |
| $150,000 or more | 13 (21.0%) | 0 (0.0%) |
| Total | 62 (100.0%) | 9 (100.0%) |
Monthly Housing Cost Tiers in Ross
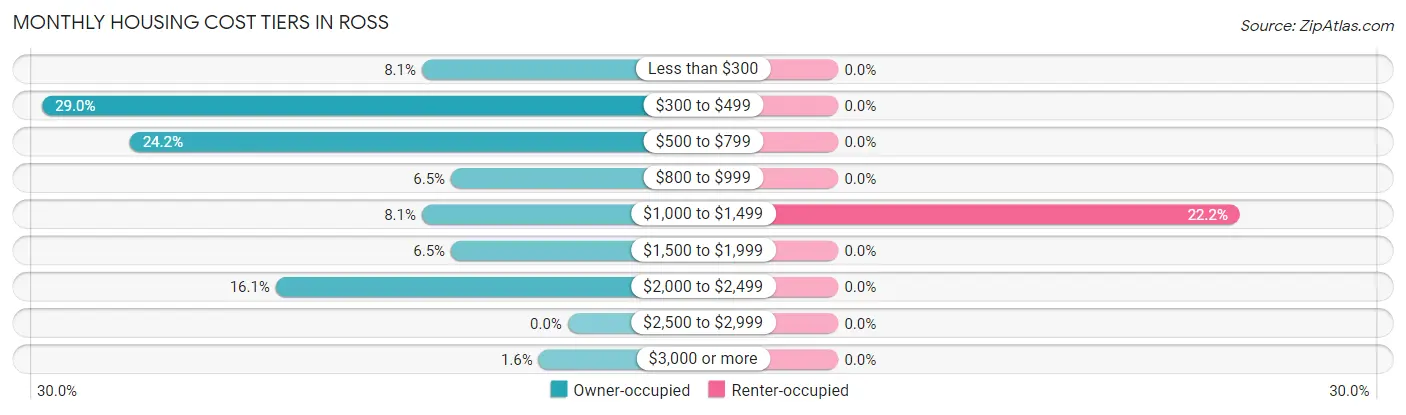
| Monthly Cost | Owner-occupied | Renter-occupied |
| Less than $300 | 5 (8.1%) | 0 (0.0%) |
| $300 to $499 | 18 (29.0%) | 0 (0.0%) |
| $500 to $799 | 15 (24.2%) | 0 (0.0%) |
| $800 to $999 | 4 (6.5%) | 0 (0.0%) |
| $1,000 to $1,499 | 5 (8.1%) | 2 (22.2%) |
| $1,500 to $1,999 | 4 (6.5%) | 0 (0.0%) |
| $2,000 to $2,499 | 10 (16.1%) | 0 (0.0%) |
| $2,500 to $2,999 | 0 (0.0%) | 0 (0.0%) |
| $3,000 or more | 1 (1.6%) | 0 (0.0%) |
| Total | 62 (100.0%) | 9 (100.0%) |
Physical Housing Characteristics in Ross
Housing Structures in Ross
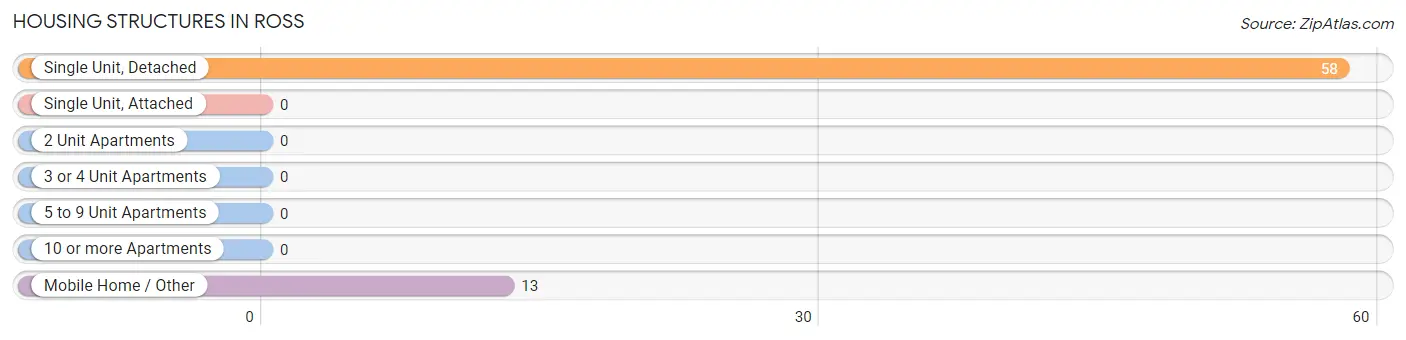
| Structure Type | # Housing Units | % Housing Units |
| Single Unit, Detached | 58 | 81.7% |
| Single Unit, Attached | 0 | 0.0% |
| 2 Unit Apartments | 0 | 0.0% |
| 3 or 4 Unit Apartments | 0 | 0.0% |
| 5 to 9 Unit Apartments | 0 | 0.0% |
| 10 or more Apartments | 0 | 0.0% |
| Mobile Home / Other | 13 | 18.3% |
| Total | 71 | 100.0% |
Housing Structures by Occupancy in Ross
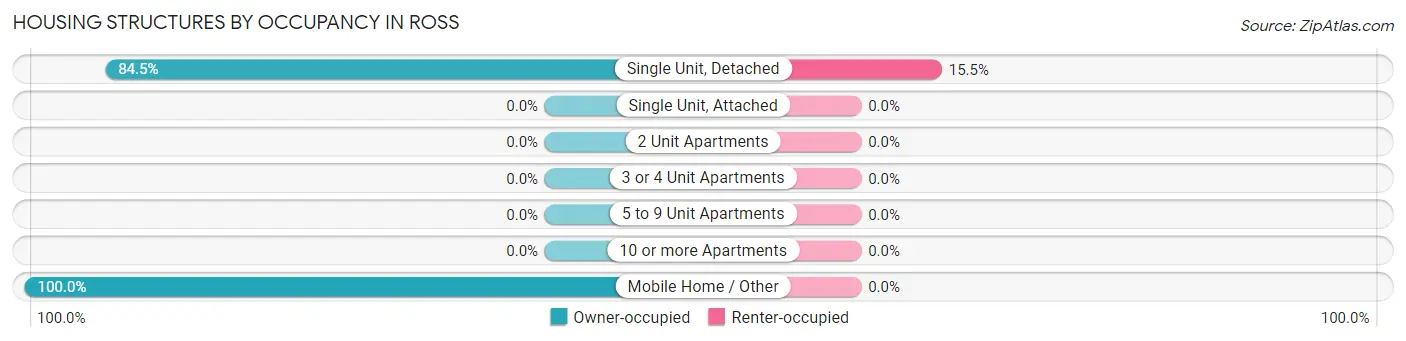
| Structure Type | Owner-occupied | Renter-occupied |
| Single Unit, Detached | 49 (84.5%) | 9 (15.5%) |
| Single Unit, Attached | 0 (0.0%) | 0 (0.0%) |
| 2 Unit Apartments | 0 (0.0%) | 0 (0.0%) |
| 3 or 4 Unit Apartments | 0 (0.0%) | 0 (0.0%) |
| 5 to 9 Unit Apartments | 0 (0.0%) | 0 (0.0%) |
| 10 or more Apartments | 0 (0.0%) | 0 (0.0%) |
| Mobile Home / Other | 13 (100.0%) | 0 (0.0%) |
| Total | 62 (87.3%) | 9 (12.7%) |
Housing Structures by Number of Rooms in Ross
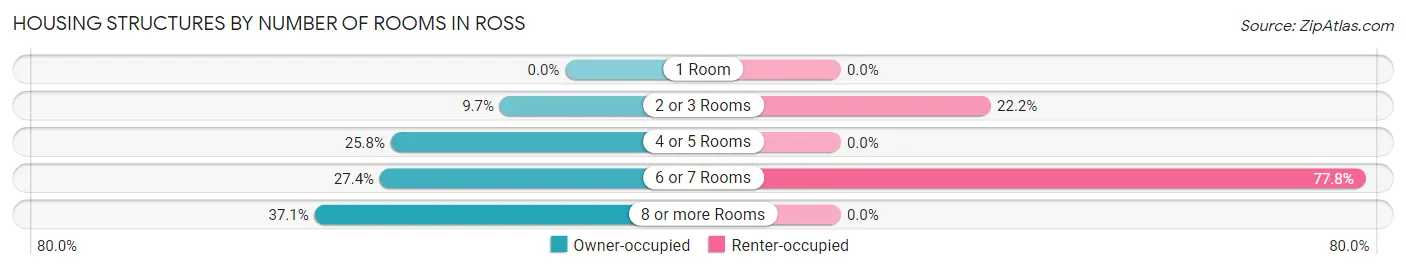
| Number of Rooms | Owner-occupied | Renter-occupied |
| 1 Room | 0 (0.0%) | 0 (0.0%) |
| 2 or 3 Rooms | 6 (9.7%) | 2 (22.2%) |
| 4 or 5 Rooms | 16 (25.8%) | 0 (0.0%) |
| 6 or 7 Rooms | 17 (27.4%) | 7 (77.8%) |
| 8 or more Rooms | 23 (37.1%) | 0 (0.0%) |
| Total | 62 (100.0%) | 9 (100.0%) |
Housing Structure by Heating Type in Ross
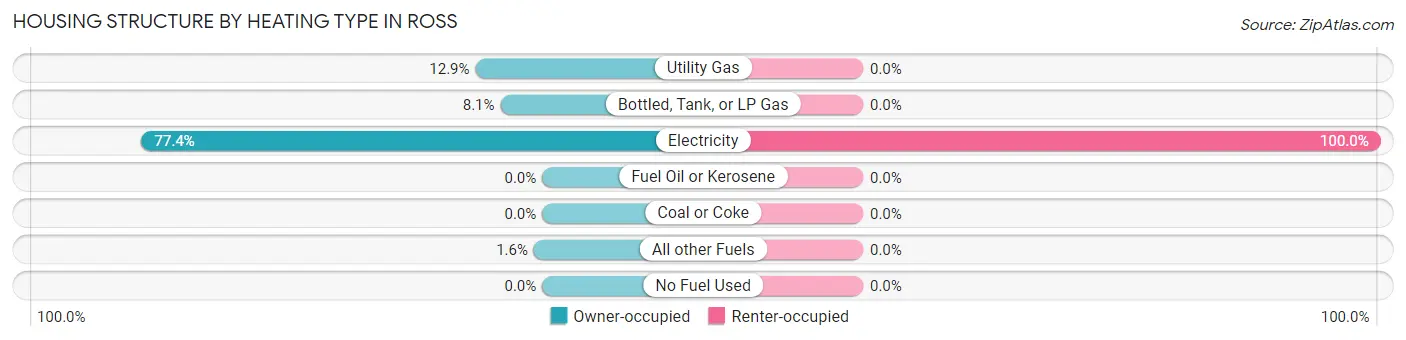
| Heating Type | Owner-occupied | Renter-occupied |
| Utility Gas | 8 (12.9%) | 0 (0.0%) |
| Bottled, Tank, or LP Gas | 5 (8.1%) | 0 (0.0%) |
| Electricity | 48 (77.4%) | 9 (100.0%) |
| Fuel Oil or Kerosene | 0 (0.0%) | 0 (0.0%) |
| Coal or Coke | 0 (0.0%) | 0 (0.0%) |
| All other Fuels | 1 (1.6%) | 0 (0.0%) |
| No Fuel Used | 0 (0.0%) | 0 (0.0%) |
| Total | 62 (100.0%) | 9 (100.0%) |
Household Vehicle Usage in Ross
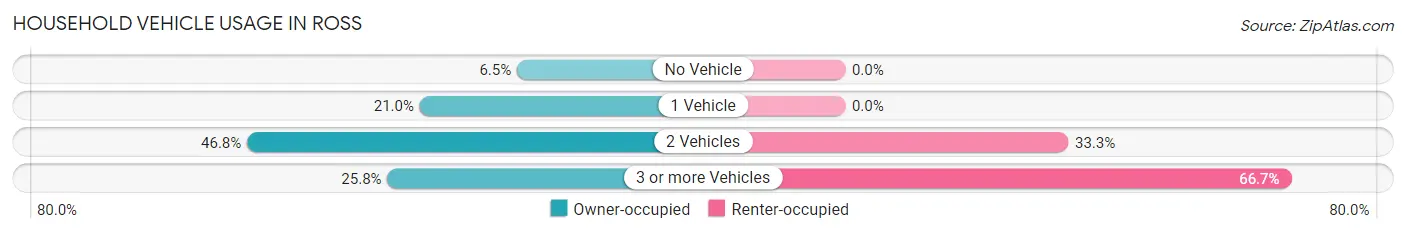
| Vehicles per Household | Owner-occupied | Renter-occupied |
| No Vehicle | 4 (6.5%) | 0 (0.0%) |
| 1 Vehicle | 13 (21.0%) | 0 (0.0%) |
| 2 Vehicles | 29 (46.8%) | 3 (33.3%) |
| 3 or more Vehicles | 16 (25.8%) | 6 (66.7%) |
| Total | 62 (100.0%) | 9 (100.0%) |
Real Estate & Mortgages in Ross
Real Estate and Mortgage Overview in Ross
| Characteristic | Without Mortgage | With Mortgage |
| Housing Units | 37 | 25 |
| Median Property Value | $160,900 | $556,800 |
| Median Household Income | $55,625 | $13 |
| Monthly Housing Costs | - | - |
| Real Estate Taxes | - | - |
Property Value by Mortgage Status in Ross
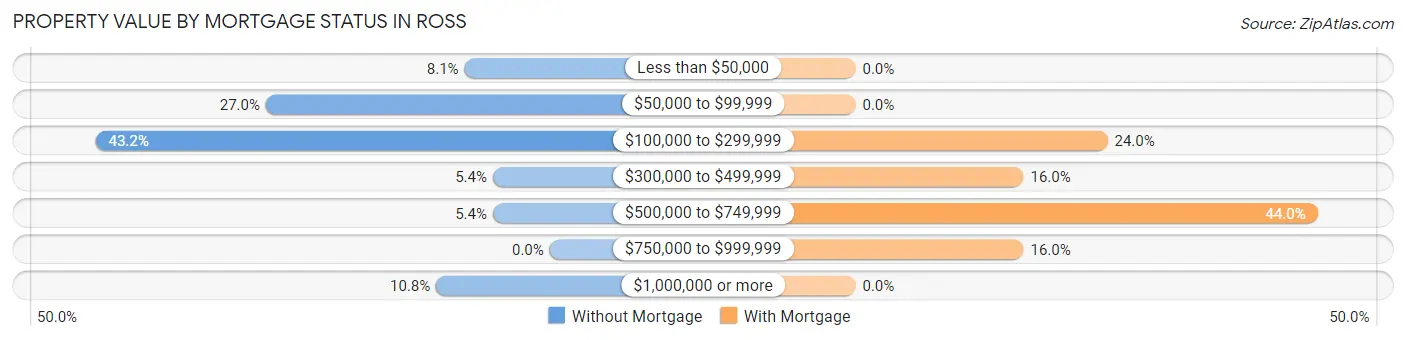
| Property Value | Without Mortgage | With Mortgage |
| Less than $50,000 | 3 (8.1%) | 0 (0.0%) |
| $50,000 to $99,999 | 10 (27.0%) | 0 (0.0%) |
| $100,000 to $299,999 | 16 (43.2%) | 6 (24.0%) |
| $300,000 to $499,999 | 2 (5.4%) | 4 (16.0%) |
| $500,000 to $749,999 | 2 (5.4%) | 11 (44.0%) |
| $750,000 to $999,999 | 0 (0.0%) | 4 (16.0%) |
| $1,000,000 or more | 4 (10.8%) | 0 (0.0%) |
| Total | 37 (100.0%) | 25 (100.0%) |
Household Income by Mortgage Status in Ross
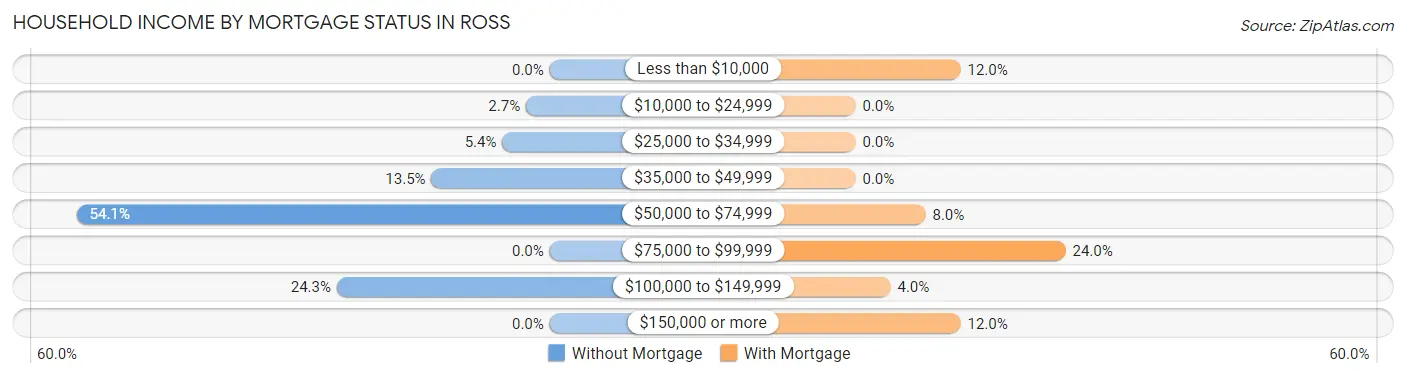
| Household Income | Without Mortgage | With Mortgage |
| Less than $10,000 | 0 (0.0%) | 3 (12.0%) |
| $10,000 to $24,999 | 1 (2.7%) | 0 (0.0%) |
| $25,000 to $34,999 | 2 (5.4%) | 0 (0.0%) |
| $35,000 to $49,999 | 5 (13.5%) | 0 (0.0%) |
| $50,000 to $74,999 | 20 (54.0%) | 2 (8.0%) |
| $75,000 to $99,999 | 0 (0.0%) | 6 (24.0%) |
| $100,000 to $149,999 | 9 (24.3%) | 1 (4.0%) |
| $150,000 or more | 0 (0.0%) | 3 (12.0%) |
| Total | 37 (100.0%) | 25 (100.0%) |
Property Value to Household Income Ratio in Ross
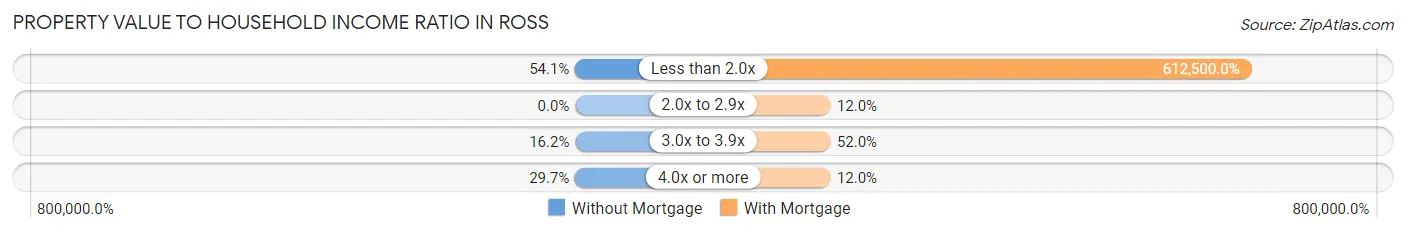
| Value-to-Income Ratio | Without Mortgage | With Mortgage |
| Less than 2.0x | 20 (54.0%) | 153,125 (612,500.0%) |
| 2.0x to 2.9x | 0 (0.0%) | 3 (12.0%) |
| 3.0x to 3.9x | 6 (16.2%) | 13 (52.0%) |
| 4.0x or more | 11 (29.7%) | 3 (12.0%) |
| Total | 37 (100.0%) | 25 (100.0%) |
Real Estate Taxes by Mortgage Status in Ross
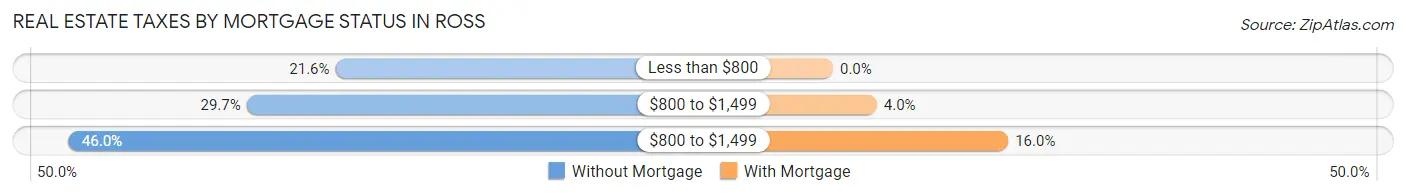
| Property Taxes | Without Mortgage | With Mortgage |
| Less than $800 | 8 (21.6%) | 0 (0.0%) |
| $800 to $1,499 | 11 (29.7%) | 1 (4.0%) |
| $800 to $1,499 | 17 (46.0%) | 4 (16.0%) |
| Total | 37 (100.0%) | 25 (100.0%) |
Health & Disability in Ross
Health Insurance Coverage by Age in Ross
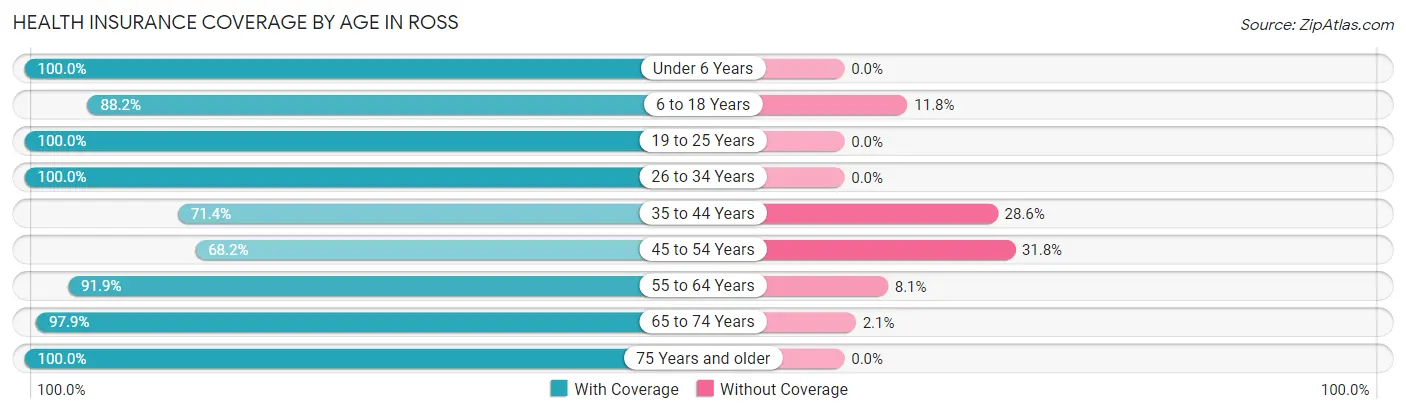
| Age Bracket | With Coverage | Without Coverage |
| Under 6 Years | 1 (100.0%) | 0 (0.0%) |
| 6 to 18 Years | 15 (88.2%) | 2 (11.8%) |
| 19 to 25 Years | 13 (100.0%) | 0 (0.0%) |
| 26 to 34 Years | 2 (100.0%) | 0 (0.0%) |
| 35 to 44 Years | 10 (71.4%) | 4 (28.6%) |
| 45 to 54 Years | 15 (68.2%) | 7 (31.8%) |
| 55 to 64 Years | 34 (91.9%) | 3 (8.1%) |
| 65 to 74 Years | 46 (97.9%) | 1 (2.1%) |
| 75 Years and older | 11 (100.0%) | 0 (0.0%) |
| Total | 147 (89.6%) | 17 (10.4%) |
Health Insurance Coverage by Citizenship Status in Ross
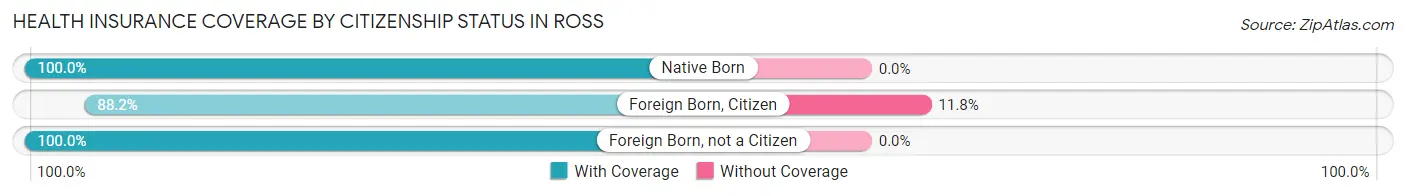
| Citizenship Status | With Coverage | Without Coverage |
| Native Born | 1 (100.0%) | 0 (0.0%) |
| Foreign Born, Citizen | 15 (88.2%) | 2 (11.8%) |
| Foreign Born, not a Citizen | 13 (100.0%) | 0 (0.0%) |
Health Insurance Coverage by Household Income in Ross
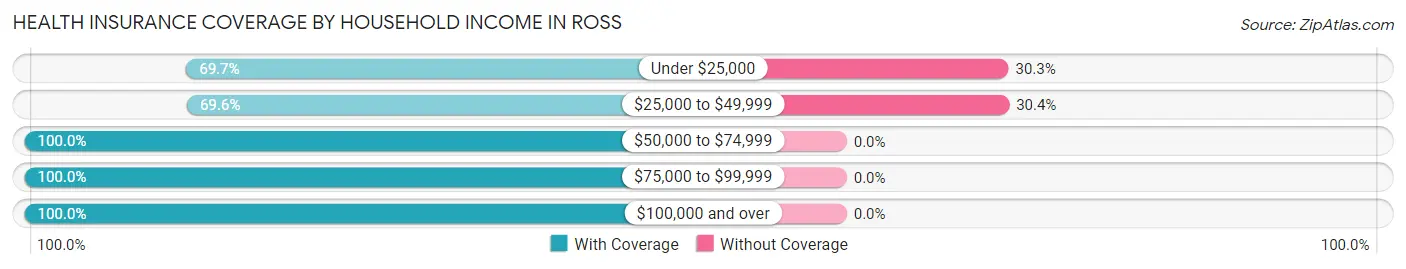
| Household Income | With Coverage | Without Coverage |
| Under $25,000 | 23 (69.7%) | 10 (30.3%) |
| $25,000 to $49,999 | 16 (69.6%) | 7 (30.4%) |
| $50,000 to $74,999 | 55 (100.0%) | 0 (0.0%) |
| $75,000 to $99,999 | 3 (100.0%) | 0 (0.0%) |
| $100,000 and over | 50 (100.0%) | 0 (0.0%) |
Public vs Private Health Insurance Coverage by Age in Ross
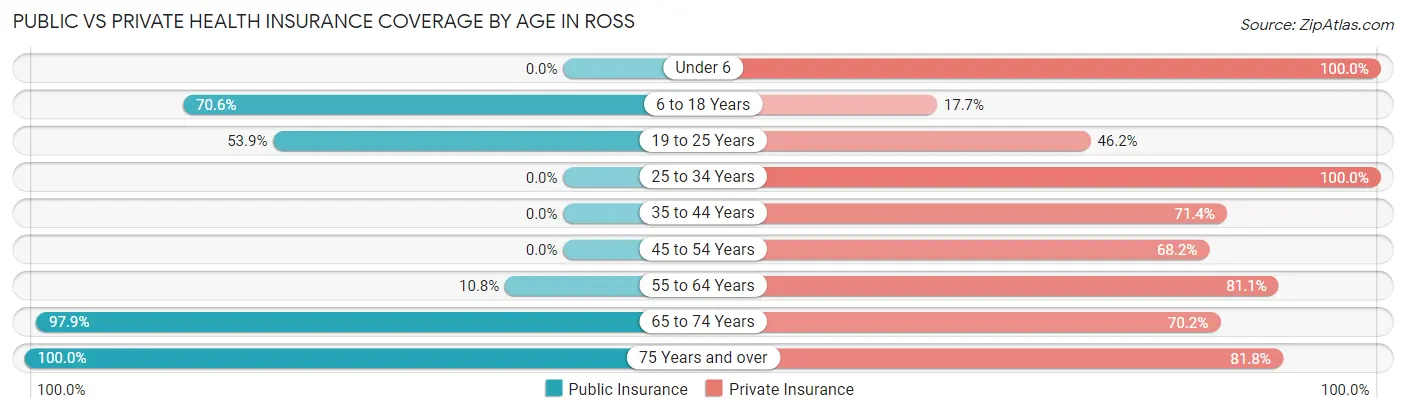
| Age Bracket | Public Insurance | Private Insurance |
| Under 6 | 0 (0.0%) | 1 (100.0%) |
| 6 to 18 Years | 12 (70.6%) | 3 (17.6%) |
| 19 to 25 Years | 7 (53.8%) | 6 (46.2%) |
| 25 to 34 Years | 0 (0.0%) | 2 (100.0%) |
| 35 to 44 Years | 0 (0.0%) | 10 (71.4%) |
| 45 to 54 Years | 0 (0.0%) | 15 (68.2%) |
| 55 to 64 Years | 4 (10.8%) | 30 (81.1%) |
| 65 to 74 Years | 46 (97.9%) | 33 (70.2%) |
| 75 Years and over | 11 (100.0%) | 9 (81.8%) |
| Total | 80 (48.8%) | 109 (66.5%) |
Disability Status by Sex by Age in Ross
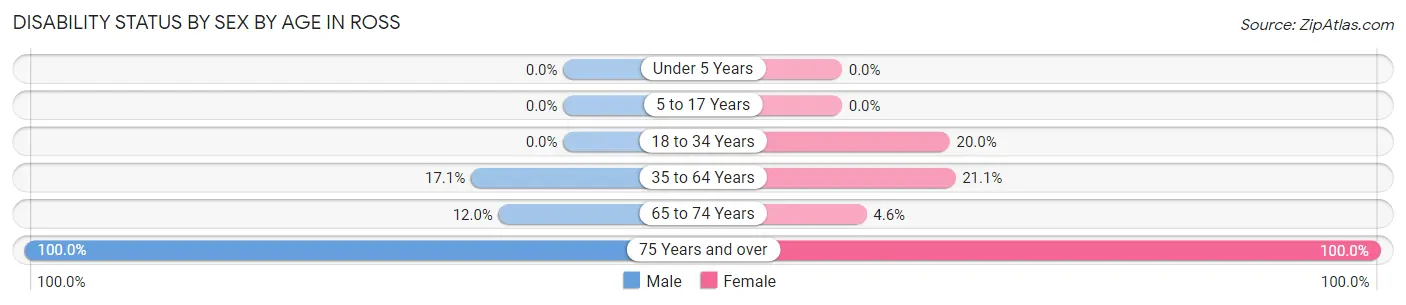
| Age Bracket | Male | Female |
| Under 5 Years | 0 (0.0%) | 0 (0.0%) |
| 5 to 17 Years | 0 (0.0%) | 0 (0.0%) |
| 18 to 34 Years | 0 (0.0%) | 1 (20.0%) |
| 35 to 64 Years | 6 (17.1%) | 8 (21.0%) |
| 65 to 74 Years | 3 (12.0%) | 1 (4.5%) |
| 75 Years and over | 7 (100.0%) | 4 (100.0%) |
Disability Class by Sex by Age in Ross
Disability Class: Hearing Difficulty
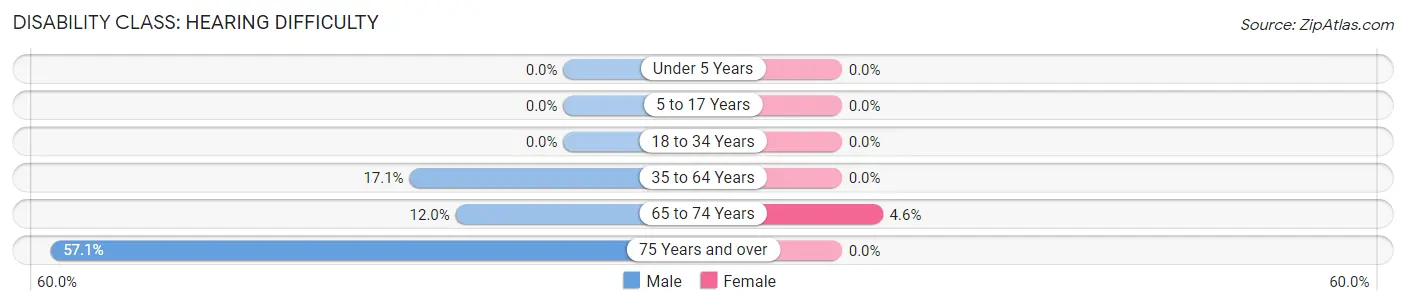
| Age Bracket | Male | Female |
| Under 5 Years | 0 (0.0%) | 0 (0.0%) |
| 5 to 17 Years | 0 (0.0%) | 0 (0.0%) |
| 18 to 34 Years | 0 (0.0%) | 0 (0.0%) |
| 35 to 64 Years | 6 (17.1%) | 0 (0.0%) |
| 65 to 74 Years | 3 (12.0%) | 1 (4.5%) |
| 75 Years and over | 4 (57.1%) | 0 (0.0%) |
Disability Class: Vision Difficulty
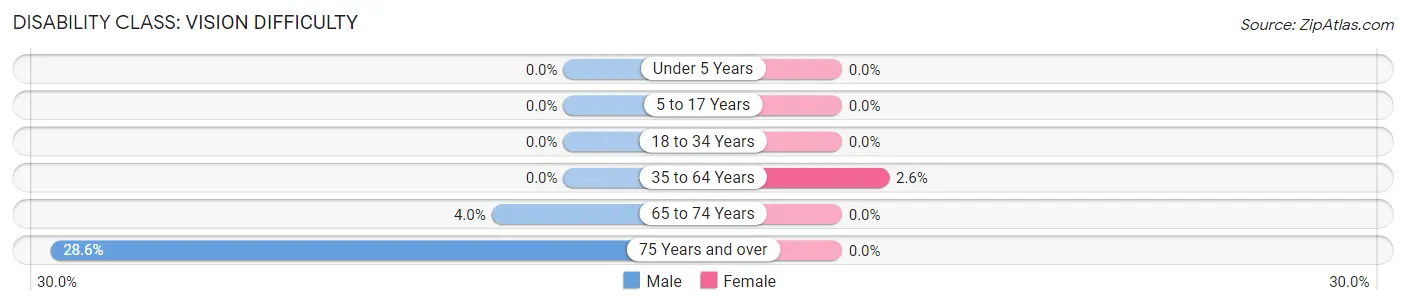
| Age Bracket | Male | Female |
| Under 5 Years | 0 (0.0%) | 0 (0.0%) |
| 5 to 17 Years | 0 (0.0%) | 0 (0.0%) |
| 18 to 34 Years | 0 (0.0%) | 0 (0.0%) |
| 35 to 64 Years | 0 (0.0%) | 1 (2.6%) |
| 65 to 74 Years | 1 (4.0%) | 0 (0.0%) |
| 75 Years and over | 2 (28.6%) | 0 (0.0%) |
Disability Class: Cognitive Difficulty
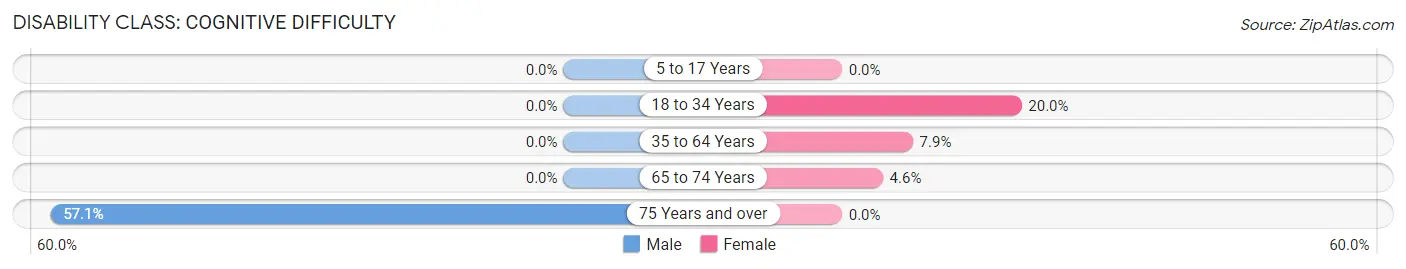
| Age Bracket | Male | Female |
| 5 to 17 Years | 0 (0.0%) | 0 (0.0%) |
| 18 to 34 Years | 0 (0.0%) | 1 (20.0%) |
| 35 to 64 Years | 0 (0.0%) | 3 (7.9%) |
| 65 to 74 Years | 0 (0.0%) | 1 (4.5%) |
| 75 Years and over | 4 (57.1%) | 0 (0.0%) |
Disability Class: Ambulatory Difficulty
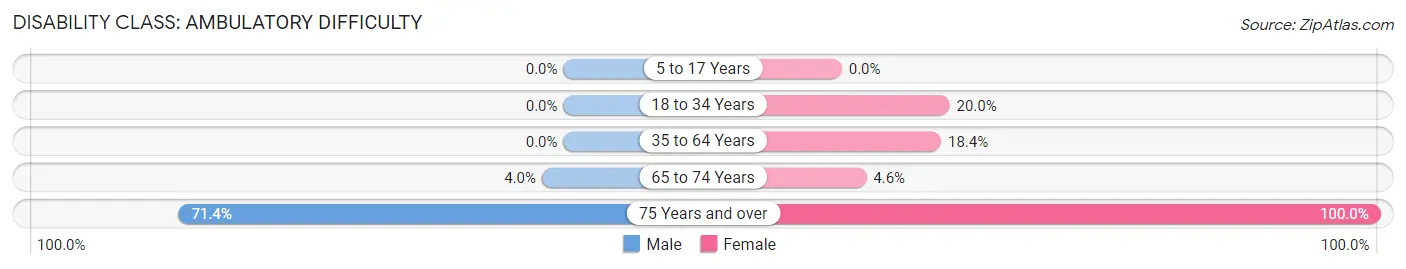
| Age Bracket | Male | Female |
| 5 to 17 Years | 0 (0.0%) | 0 (0.0%) |
| 18 to 34 Years | 0 (0.0%) | 1 (20.0%) |
| 35 to 64 Years | 0 (0.0%) | 7 (18.4%) |
| 65 to 74 Years | 1 (4.0%) | 1 (4.5%) |
| 75 Years and over | 5 (71.4%) | 4 (100.0%) |
Disability Class: Self-Care Difficulty
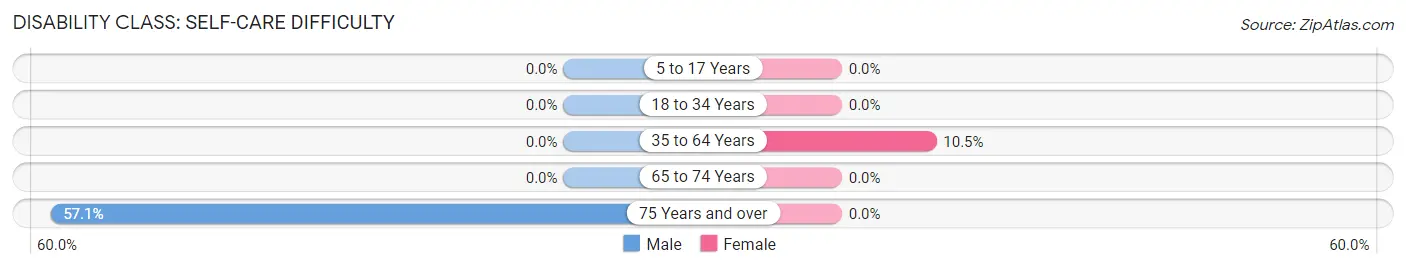
| Age Bracket | Male | Female |
| 5 to 17 Years | 0 (0.0%) | 0 (0.0%) |
| 18 to 34 Years | 0 (0.0%) | 0 (0.0%) |
| 35 to 64 Years | 0 (0.0%) | 4 (10.5%) |
| 65 to 74 Years | 0 (0.0%) | 0 (0.0%) |
| 75 Years and over | 4 (57.1%) | 0 (0.0%) |
Technology Access in Ross
Computing Device Access in Ross
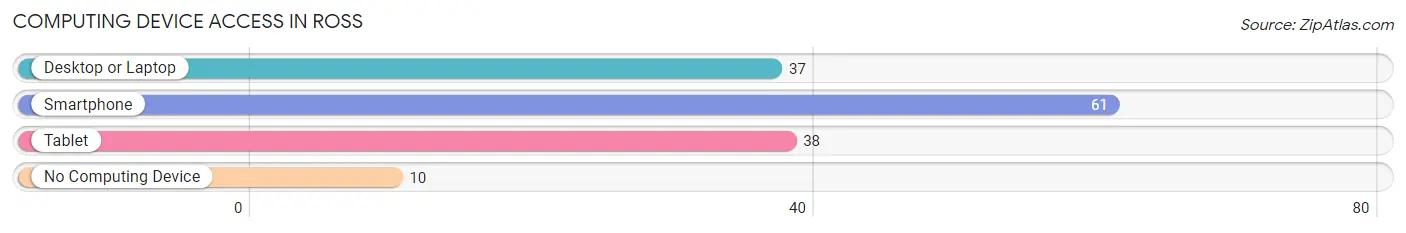
| Device Type | # Households | % Households |
| Desktop or Laptop | 37 | 52.1% |
| Smartphone | 61 | 85.9% |
| Tablet | 38 | 53.5% |
| No Computing Device | 10 | 14.1% |
| Total | 71 | 100.0% |
Internet Access in Ross
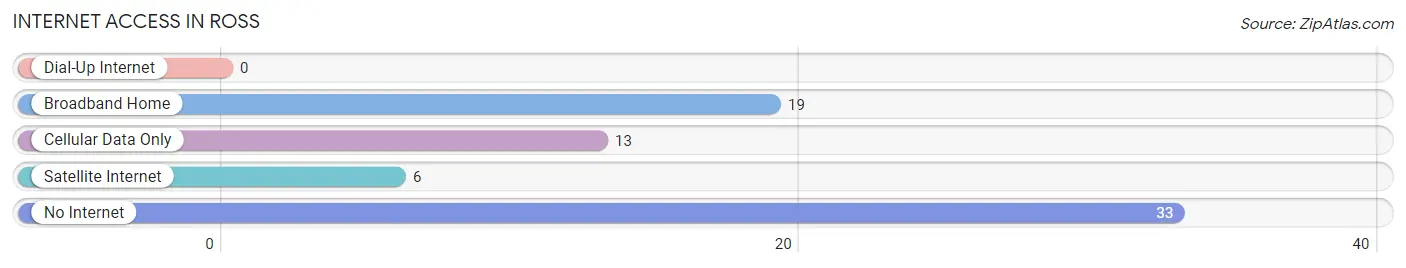
| Internet Type | # Households | % Households |
| Dial-Up Internet | 0 | 0.0% |
| Broadband Home | 19 | 26.8% |
| Cellular Data Only | 13 | 18.3% |
| Satellite Internet | 6 | 8.5% |
| No Internet | 33 | 46.5% |
| Total | 71 | 100.0% |
Ross Summary
Ross, Texas is a small town located in the eastern part of the state, in the county of Denton. It is situated on the banks of the Trinity River, and is part of the Dallas-Fort Worth metropolitan area. The town has a population of just over 1,000 people, and is known for its rural charm and small-town atmosphere.
History
The area that is now Ross, Texas was first settled in the late 1800s by a group of settlers from the nearby town of Pilot Point. The settlers named the area Ross, after the nearby Ross Creek. The town was officially incorporated in 1891, and the first post office was established in 1892.
In the early 1900s, the town began to grow and prosper. The population increased, and businesses began to open. The town was home to a cotton gin, a blacksmith shop, a general store, and a hotel. The town also had a school, which was built in 1910.
In the 1920s, the town began to decline. The Great Depression hit the town hard, and many of the businesses closed. The population decreased, and the town began to struggle.
In the 1950s, the town began to experience a resurgence. The population increased, and businesses began to open again. The town was home to a number of small businesses, including a grocery store, a hardware store, and a gas station.
Geography
Ross, Texas is located in the eastern part of the state, in the county of Denton. It is situated on the banks of the Trinity River, and is part of the Dallas-Fort Worth metropolitan area. The town is located about 25 miles north of Dallas, and about 40 miles south of Denton.
The town is located in a rural area, and is surrounded by rolling hills and farmland. The town is located in a humid subtropical climate, and experiences hot summers and mild winters.
Economy
The economy of Ross, Texas is largely based on agriculture. The town is home to a number of farms, and the surrounding area is used for growing crops such as cotton, corn, and soybeans. The town is also home to a number of small businesses, including a grocery store, a hardware store, and a gas station.
Demographics
As of the 2010 census, the population of Ross, Texas was 1,072. The racial makeup of the town was 94.3% White, 0.7% African American, 0.3% Native American, 0.2% Asian, 0.1% Pacific Islander, 2.7% from other races, and 1.9% from two or more races. Hispanic or Latino of any race were 5.3% of the population.
The median household income in Ross, Texas was $41,250, and the median family income was $45,625. The per capita income for the town was $19,945. About 11.3% of families and 13.2% of the population were below the poverty line, including 17.2% of those under age 18 and 8.3% of those age 65 or over.
Common Questions
What is Per Capita Income in Ross?
Per Capita income in Ross is $35,113.
What is the Median Family Income in Ross?
Median Family Income in Ross is $58,750.
What is the Median Household income in Ross?
Median Household Income in Ross is $61,250.
What is Income or Wage Gap in Ross?
Income or Wage Gap in Ross is 71.5%.
Women in Ross earn 28.5 cents for every dollar earned by a man.
What is Inequality or Gini Index in Ross?
Inequality or Gini Index in Ross is 0.37.
What is the Total Population of Ross?
Total Population of Ross is 164.
What is the Total Male Population of Ross?
Total Male Population of Ross is 83.
What is the Total Female Population of Ross?
Total Female Population of Ross is 81.
What is the Ratio of Males per 100 Females in Ross?
There are 102.47 Males per 100 Females in Ross.
What is the Ratio of Females per 100 Males in Ross?
There are 97.59 Females per 100 Males in Ross.
What is the Median Population Age in Ross?
Median Population Age in Ross is 58.1 Years.
What is the Average Family Size in Ross
Average Family Size in Ross is 2.4 People.
What is the Average Household Size in Ross
Average Household Size in Ross is 2.3 People.
How Large is the Labor Force in Ross?
There are 77 People in the Labor Forcein in Ross.
What is the Percentage of People in the Labor Force in Ross?
49.0% of People are in the Labor Force in Ross.