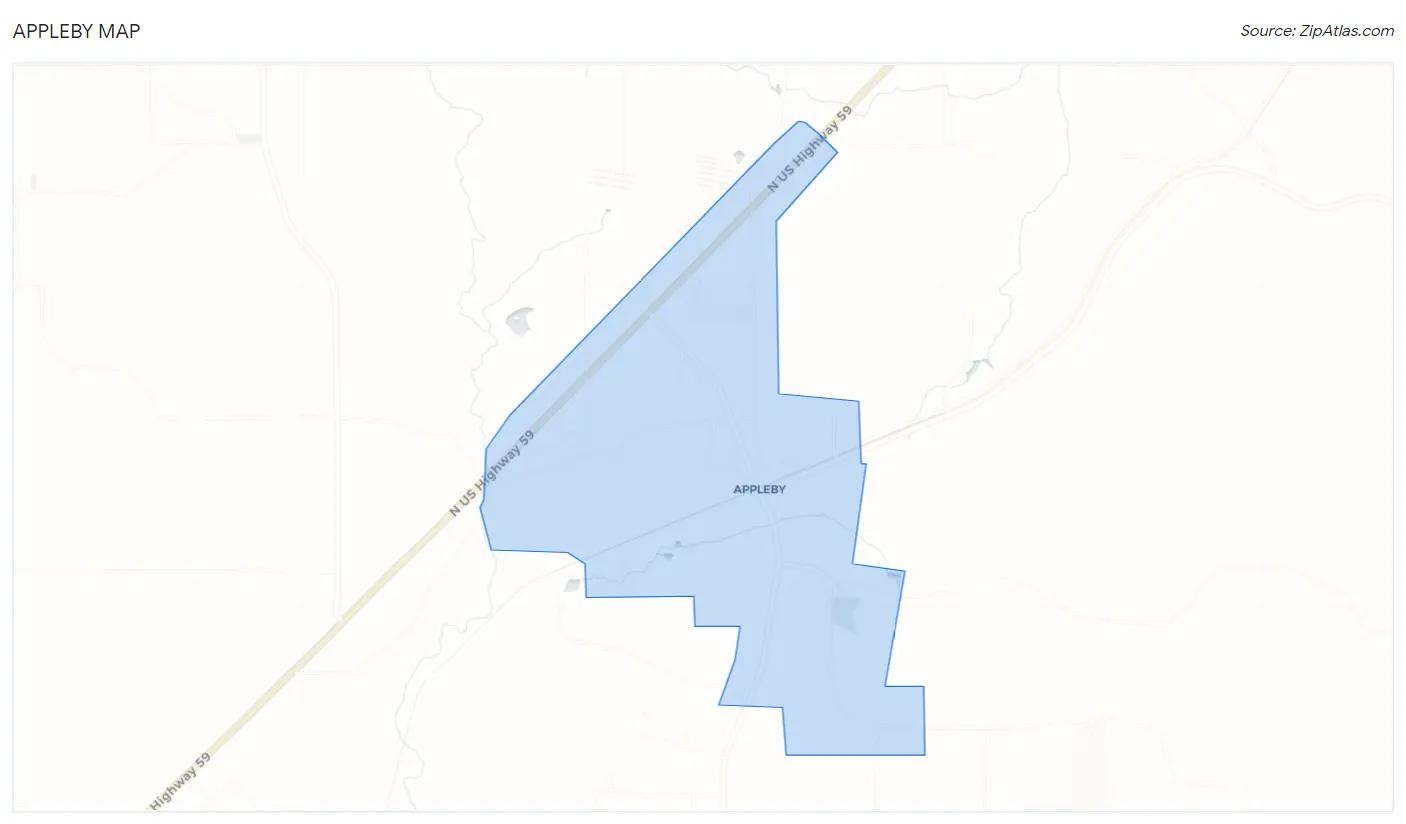
Appleby, TX Map & Demographics
Appleby Map
Appleby Overview
$35,137
PER CAPITA INCOME
$97,125
AVG FAMILY INCOME
$72,130
AVG HOUSEHOLD INCOME
29.8%
WAGE / INCOME GAP [ % ]
70.2¢/ $1
WAGE / INCOME GAP [ $ ]
0.33
INEQUALITY / GINI INDEX
490
TOTAL POPULATION
224
MALE POPULATION
266
FEMALE POPULATION
84.21
MALES / 100 FEMALES
118.75
FEMALES / 100 MALES
35.1
MEDIAN AGE
2.9
AVG FAMILY SIZE
2.3
AVG HOUSEHOLD SIZE
284
LABOR FORCE [ PEOPLE ]
74.9%
PERCENT IN LABOR FORCE
5.6%
UNEMPLOYMENT RATE
Income in Appleby
Income Overview in Appleby
Per Capita Income in Appleby is $35,137, while median incomes of families and households are $97,125 and $72,130 respectively.
| Characteristic | Number | Measure |
| Per Capita Income | 490 | $35,137 |
| Median Family Income | 131 | $97,125 |
| Mean Family Income | 131 | $97,925 |
| Median Household Income | 212 | $72,130 |
| Mean Household Income | 212 | $80,475 |
| Income Deficit | 131 | $0 |
| Wage / Income Gap (%) | 490 | 29.78% |
| Wage / Income Gap ($) | 490 | 70.22¢ per $1 |
| Gini / Inequality Index | 490 | 0.33 |
Earnings by Sex in Appleby
Average Earnings in Appleby are $47,083, $55,313 for men and $38,839 for women, a difference of 29.8%.
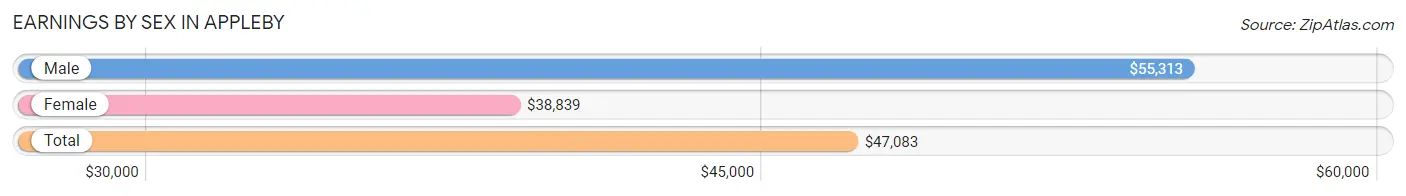
| Sex | Number | Average Earnings |
| Male | 146 (50.5%) | $55,313 |
| Female | 143 (49.5%) | $38,839 |
| Total | 289 (100.0%) | $47,083 |
Earnings by Sex by Income Bracket in Appleby
The most common earnings brackets in Appleby are $55,000 to $64,999 for men (33 | 22.6%) and $55,000 to $64,999 for women (36 | 25.2%).
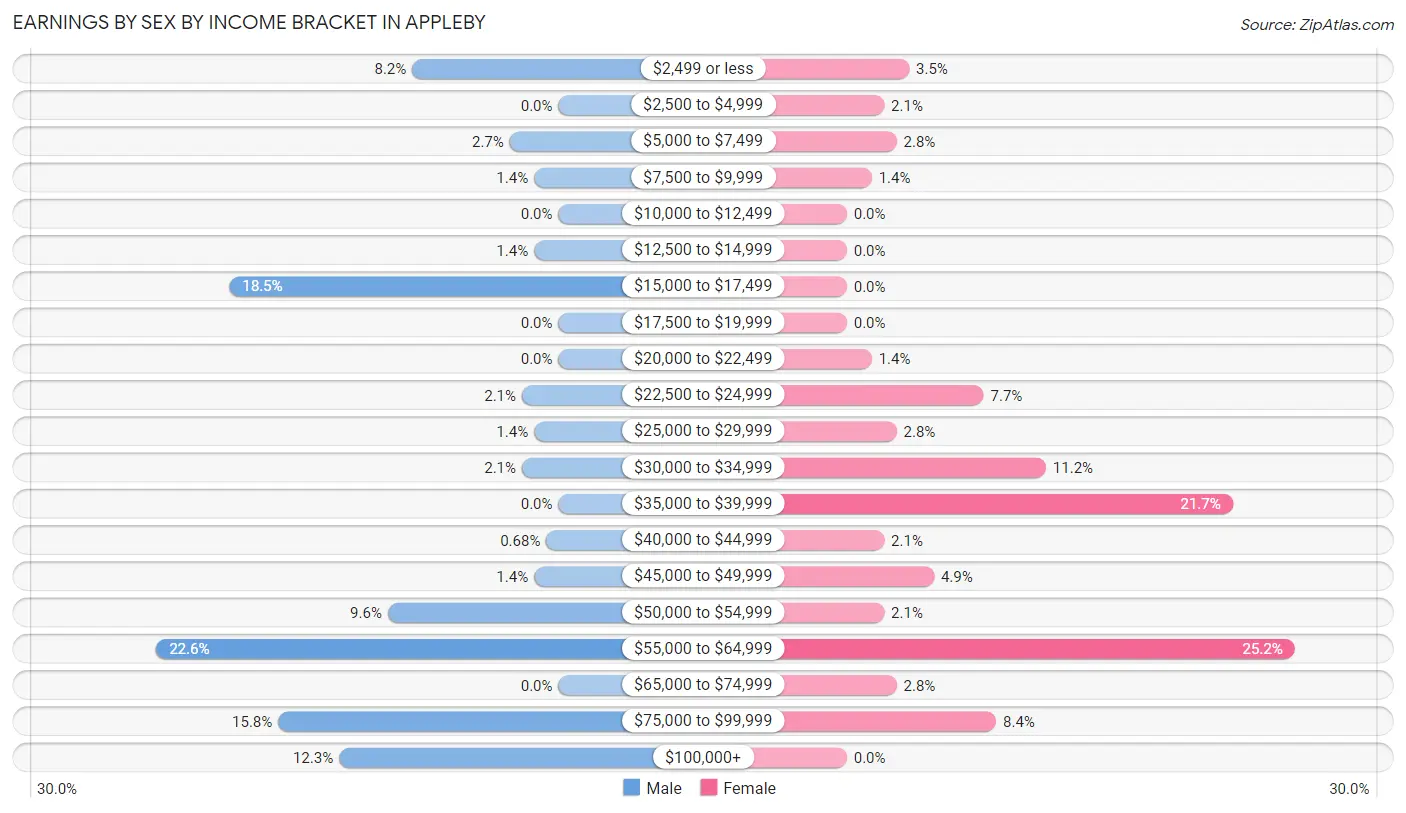
| Income | Male | Female |
| $2,499 or less | 12 (8.2%) | 5 (3.5%) |
| $2,500 to $4,999 | 0 (0.0%) | 3 (2.1%) |
| $5,000 to $7,499 | 4 (2.7%) | 4 (2.8%) |
| $7,500 to $9,999 | 2 (1.4%) | 2 (1.4%) |
| $10,000 to $12,499 | 0 (0.0%) | 0 (0.0%) |
| $12,500 to $14,999 | 2 (1.4%) | 0 (0.0%) |
| $15,000 to $17,499 | 27 (18.5%) | 0 (0.0%) |
| $17,500 to $19,999 | 0 (0.0%) | 0 (0.0%) |
| $20,000 to $22,499 | 0 (0.0%) | 2 (1.4%) |
| $22,500 to $24,999 | 3 (2.1%) | 11 (7.7%) |
| $25,000 to $29,999 | 2 (1.4%) | 4 (2.8%) |
| $30,000 to $34,999 | 3 (2.1%) | 16 (11.2%) |
| $35,000 to $39,999 | 0 (0.0%) | 31 (21.7%) |
| $40,000 to $44,999 | 1 (0.7%) | 3 (2.1%) |
| $45,000 to $49,999 | 2 (1.4%) | 7 (4.9%) |
| $50,000 to $54,999 | 14 (9.6%) | 3 (2.1%) |
| $55,000 to $64,999 | 33 (22.6%) | 36 (25.2%) |
| $65,000 to $74,999 | 0 (0.0%) | 4 (2.8%) |
| $75,000 to $99,999 | 23 (15.8%) | 12 (8.4%) |
| $100,000+ | 18 (12.3%) | 0 (0.0%) |
| Total | 146 (100.0%) | 143 (100.0%) |
Earnings by Sex by Educational Attainment in Appleby
Average earnings in Appleby are $57,500 for men and $39,286 for women, a difference of 31.7%. Men with an educational attainment of high school diploma enjoy the highest average annual earnings of $87,344, while those with college or associate's degree education earn the least with $53,571. Women with an educational attainment of bachelor's degree earn the most with the average annual earnings of $56,786, while those with high school diploma education have the smallest earnings of $35,391.
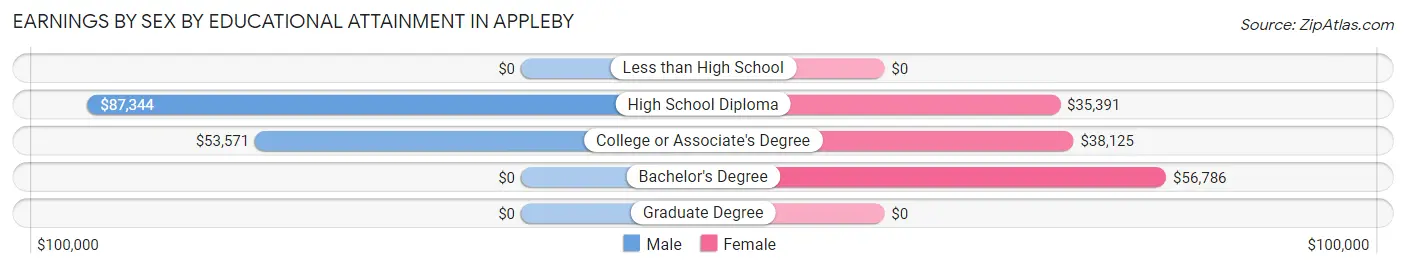
| Educational Attainment | Male Income | Female Income |
| Less than High School | - | - |
| High School Diploma | $87,344 | $35,391 |
| College or Associate's Degree | $53,571 | $38,125 |
| Bachelor's Degree | - | - |
| Graduate Degree | - | - |
| Total | $57,500 | $39,286 |
Family Income in Appleby
Family Income Brackets in Appleby
According to the Appleby family income data, there are 42 families falling into the $100,000 to $149,999 income range, which is the most common income bracket and makes up 32.1% of all families.
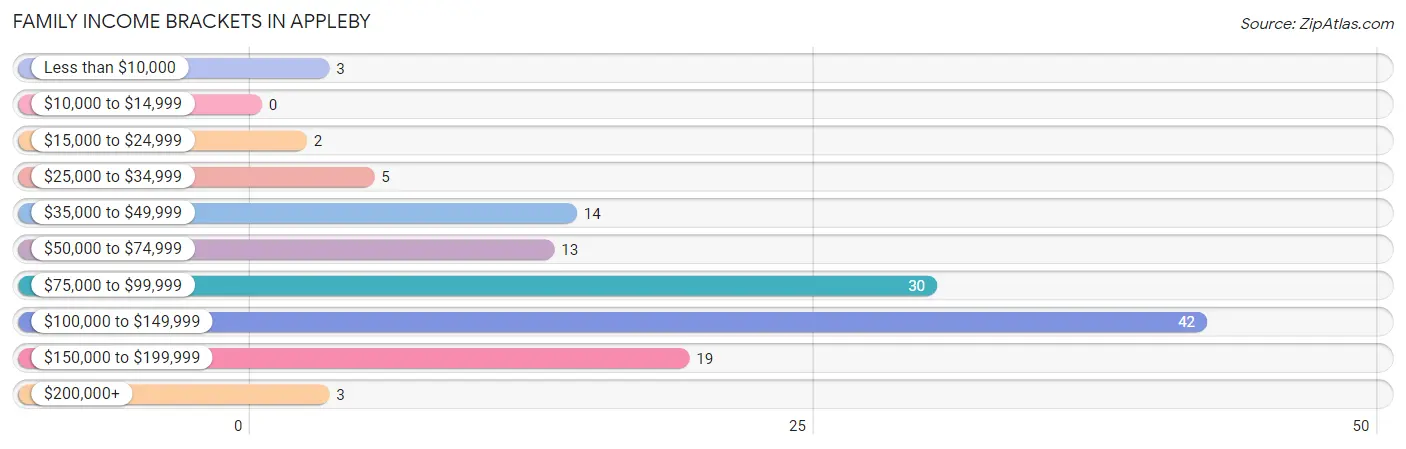
| Income Bracket | # Families | % Families |
| Less than $10,000 | 3 | 2.3% |
| $10,000 to $14,999 | 0 | 0.0% |
| $15,000 to $24,999 | 2 | 1.5% |
| $25,000 to $34,999 | 5 | 3.8% |
| $35,000 to $49,999 | 14 | 10.7% |
| $50,000 to $74,999 | 13 | 9.9% |
| $75,000 to $99,999 | 30 | 22.9% |
| $100,000 to $149,999 | 42 | 32.1% |
| $150,000 to $199,999 | 19 | 14.5% |
| $200,000+ | 3 | 2.3% |
Family Income by Famaliy Size in Appleby
4-person families (10 | 7.6%) account for the highest median family income in Appleby with $119,167 per family, while 2-person families (73 | 55.7%) have the highest median income of $37,375 per family member.
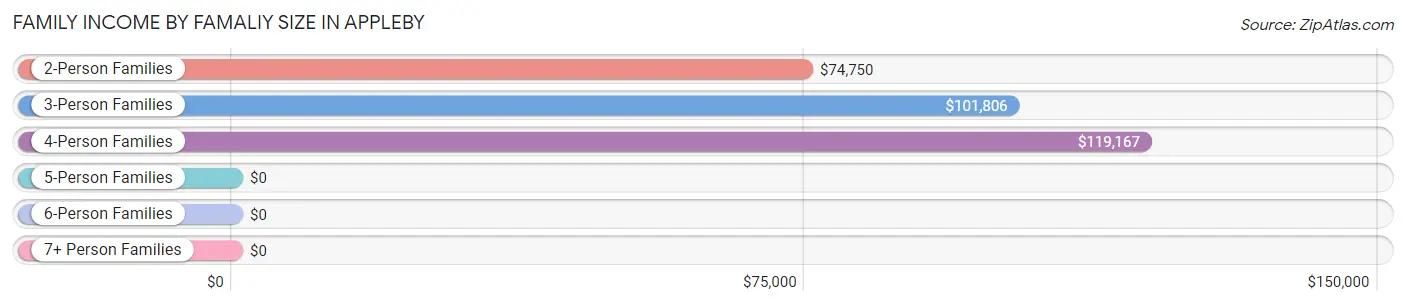
| Income Bracket | # Families | Median Income |
| 2-Person Families | 73 (55.7%) | $74,750 |
| 3-Person Families | 35 (26.7%) | $101,806 |
| 4-Person Families | 10 (7.6%) | $119,167 |
| 5-Person Families | 8 (6.1%) | $0 |
| 6-Person Families | 2 (1.5%) | $0 |
| 7+ Person Families | 3 (2.3%) | $0 |
| Total | 131 (100.0%) | $97,125 |
Family Income by Number of Earners in Appleby
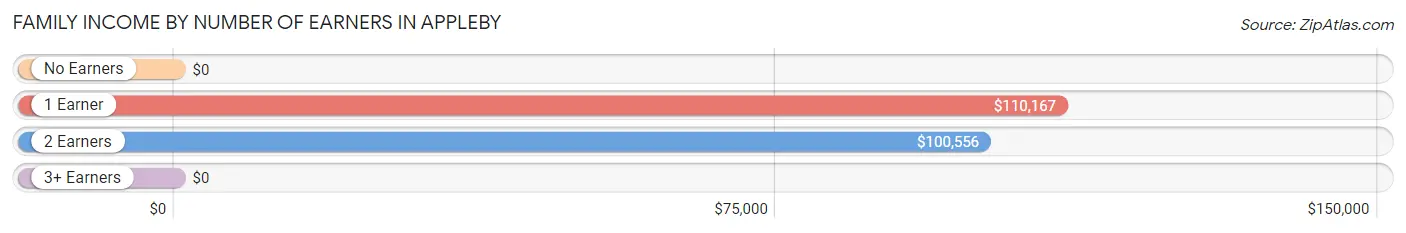
| Number of Earners | # Families | Median Income |
| No Earners | 12 (9.2%) | $0 |
| 1 Earner | 34 (26.0%) | $110,167 |
| 2 Earners | 82 (62.6%) | $100,556 |
| 3+ Earners | 3 (2.3%) | $0 |
| Total | 131 (100.0%) | $97,125 |
Household Income in Appleby
Household Income Brackets in Appleby
With 58 households falling in the category, the $50,000 to $74,999 income range is the most frequent in Appleby, accounting for 27.4% of all households. In contrast, only 2 households (0.9%) fall into the $10,000 to $14,999 income bracket, making it the least populous group.
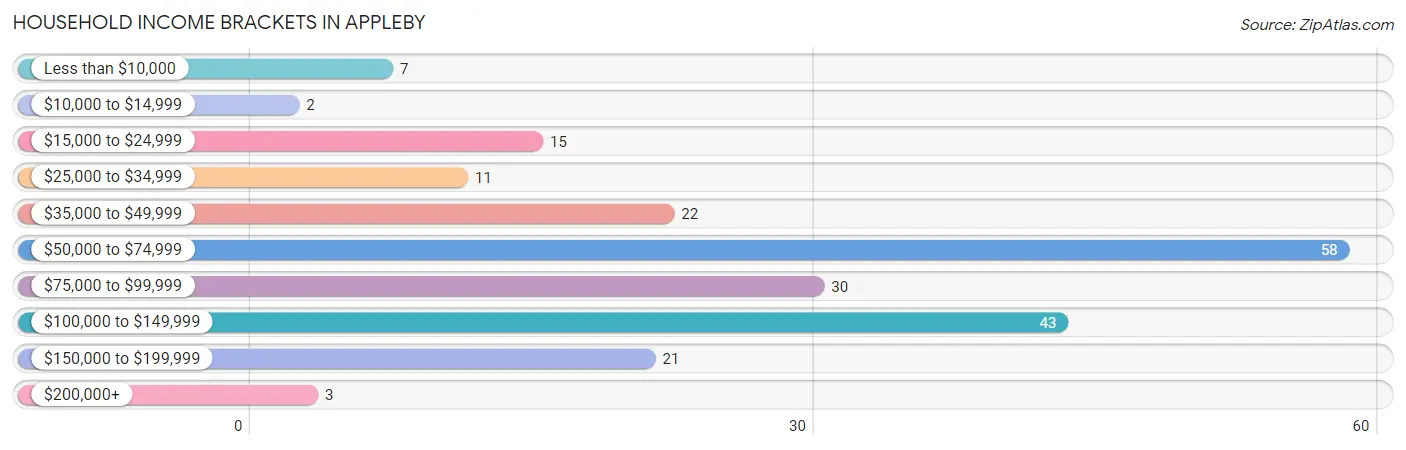
| Income Bracket | # Households | % Households |
| Less than $10,000 | 7 | 3.3% |
| $10,000 to $14,999 | 2 | 0.9% |
| $15,000 to $24,999 | 15 | 7.1% |
| $25,000 to $34,999 | 11 | 5.2% |
| $35,000 to $49,999 | 22 | 10.4% |
| $50,000 to $74,999 | 58 | 27.4% |
| $75,000 to $99,999 | 30 | 14.2% |
| $100,000 to $149,999 | 43 | 20.3% |
| $150,000 to $199,999 | 21 | 9.9% |
| $200,000+ | 3 | 1.4% |
Household Income by Householder Age in Appleby
The median household income in Appleby is $72,130, with the highest median household income of $86,667 found in the 25 to 44 years age bracket for the primary householder. A total of 102 households (48.1%) fall into this category. Meanwhile, the 15 to 24 years age bracket for the primary householder has the lowest median household income of $0, with 4 households (1.9%) in this group.
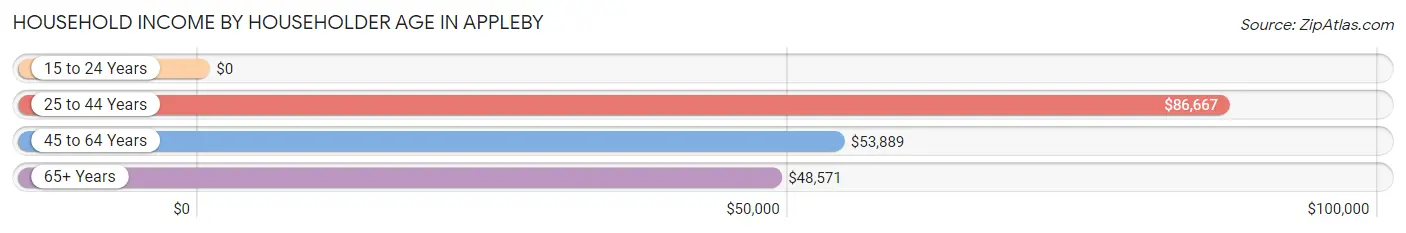
| Income Bracket | # Households | Median Income |
| 15 to 24 Years | 4 (1.9%) | $0 |
| 25 to 44 Years | 102 (48.1%) | $86,667 |
| 45 to 64 Years | 48 (22.6%) | $53,889 |
| 65+ Years | 58 (27.4%) | $48,571 |
| Total | 212 (100.0%) | $72,130 |
Poverty in Appleby
Income Below Poverty by Sex and Age in Appleby
With 4.5% poverty level for males and 6.4% for females among the residents of Appleby, 75 year old and over males and 55 to 64 year old females are the most vulnerable to poverty, with 2 males (28.6%) and 8 females (33.3%) in their respective age groups living below the poverty level.
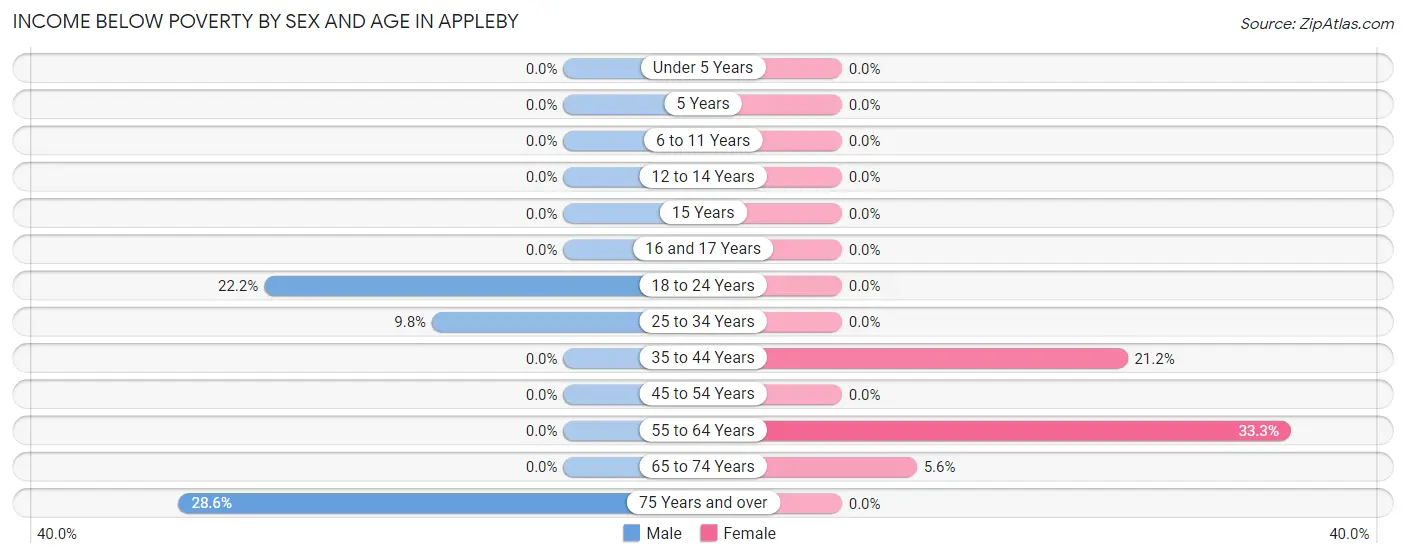
| Age Bracket | Male | Female |
| Under 5 Years | 0 (0.0%) | 0 (0.0%) |
| 5 Years | 0 (0.0%) | 0 (0.0%) |
| 6 to 11 Years | 0 (0.0%) | 0 (0.0%) |
| 12 to 14 Years | 0 (0.0%) | 0 (0.0%) |
| 15 Years | 0 (0.0%) | 0 (0.0%) |
| 16 and 17 Years | 0 (0.0%) | 0 (0.0%) |
| 18 to 24 Years | 4 (22.2%) | 0 (0.0%) |
| 25 to 34 Years | 4 (9.8%) | 0 (0.0%) |
| 35 to 44 Years | 0 (0.0%) | 7 (21.2%) |
| 45 to 54 Years | 0 (0.0%) | 0 (0.0%) |
| 55 to 64 Years | 0 (0.0%) | 8 (33.3%) |
| 65 to 74 Years | 0 (0.0%) | 2 (5.6%) |
| 75 Years and over | 2 (28.6%) | 0 (0.0%) |
| Total | 10 (4.5%) | 17 (6.4%) |
Income Above Poverty by Sex and Age in Appleby
According to the poverty statistics in Appleby, males aged under 5 years and females aged under 5 years are the age groups that are most secure financially, with 100.0% of males and 100.0% of females in these age groups living above the poverty line.
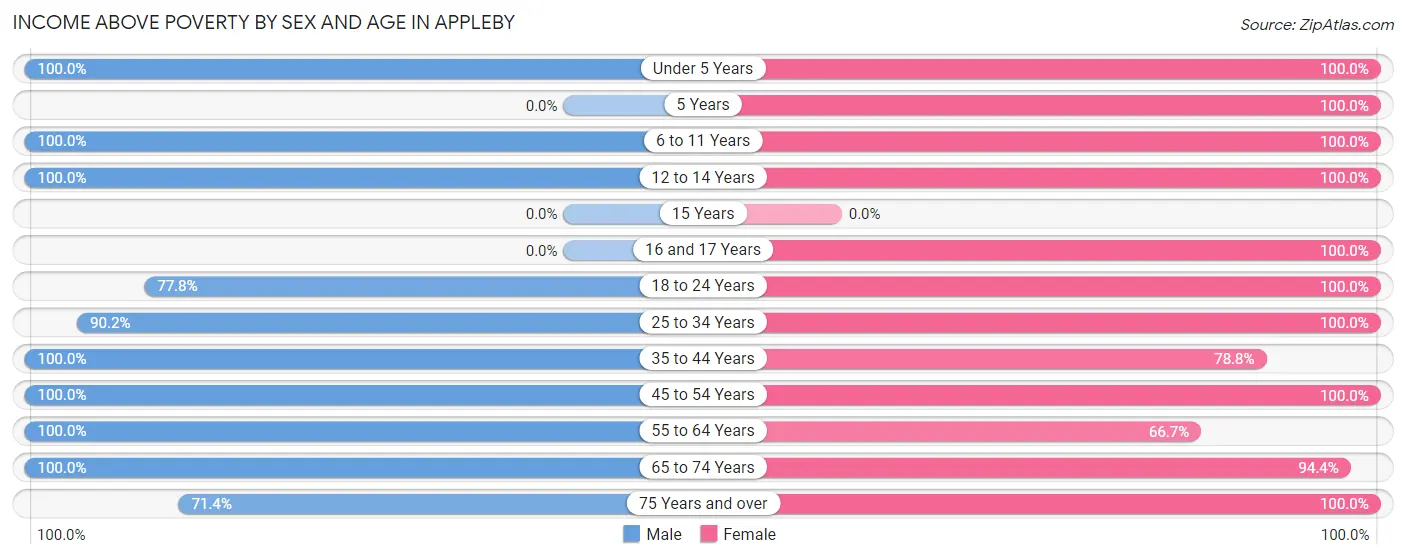
| Age Bracket | Male | Female |
| Under 5 Years | 14 (100.0%) | 16 (100.0%) |
| 5 Years | 0 (0.0%) | 8 (100.0%) |
| 6 to 11 Years | 21 (100.0%) | 35 (100.0%) |
| 12 to 14 Years | 12 (100.0%) | 5 (100.0%) |
| 15 Years | 0 (0.0%) | 0 (0.0%) |
| 16 and 17 Years | 0 (0.0%) | 3 (100.0%) |
| 18 to 24 Years | 14 (77.8%) | 7 (100.0%) |
| 25 to 34 Years | 37 (90.2%) | 62 (100.0%) |
| 35 to 44 Years | 47 (100.0%) | 26 (78.8%) |
| 45 to 54 Years | 8 (100.0%) | 24 (100.0%) |
| 55 to 64 Years | 31 (100.0%) | 16 (66.7%) |
| 65 to 74 Years | 25 (100.0%) | 34 (94.4%) |
| 75 Years and over | 5 (71.4%) | 13 (100.0%) |
| Total | 214 (95.5%) | 249 (93.6%) |
Income Below Poverty Among Married-Couple Families in Appleby
The poverty statistics for married-couple families in Appleby show that 2.3% or 2 of the total 86 families live below the poverty line. Families with no children have the highest poverty rate of 4.1%, comprising of 2 families. On the other hand, families with 1 or 2 children have the lowest poverty rate of 0.0%, which includes 0 families.
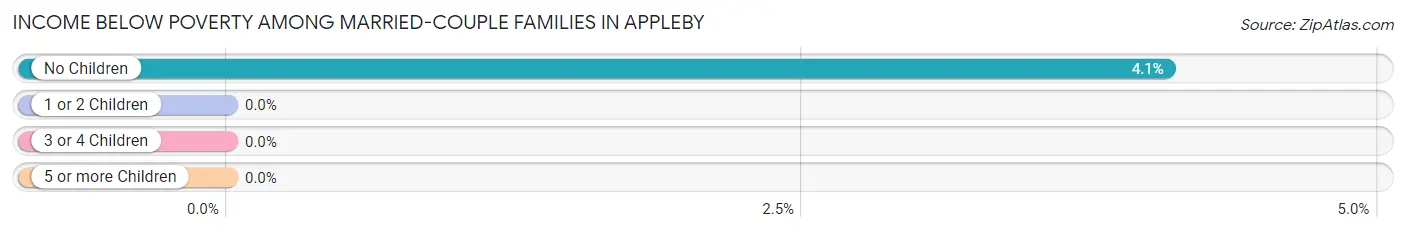
| Children | Above Poverty | Below Poverty |
| No Children | 47 (95.9%) | 2 (4.1%) |
| 1 or 2 Children | 27 (100.0%) | 0 (0.0%) |
| 3 or 4 Children | 10 (100.0%) | 0 (0.0%) |
| 5 or more Children | 0 (0.0%) | 0 (0.0%) |
| Total | 84 (97.7%) | 2 (2.3%) |
Income Below Poverty Among Single-Parent Households in Appleby
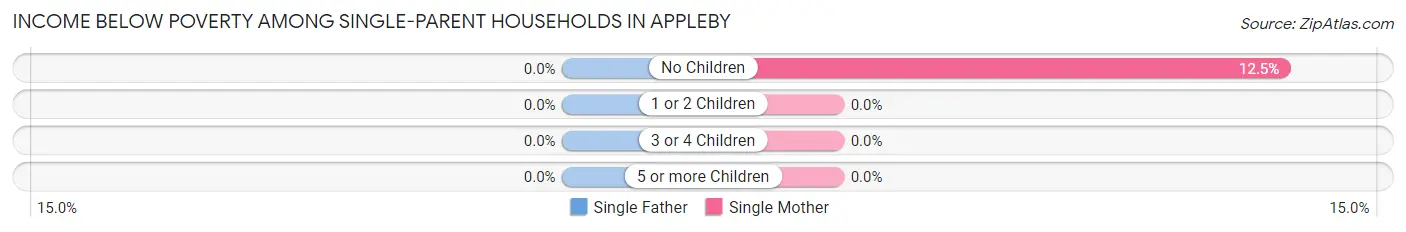
| Children | Single Father | Single Mother |
| No Children | 0 (0.0%) | 3 (12.5%) |
| 1 or 2 Children | 0 (0.0%) | 0 (0.0%) |
| 3 or 4 Children | 0 (0.0%) | 0 (0.0%) |
| 5 or more Children | 0 (0.0%) | 0 (0.0%) |
| Total | 0 (0.0%) | 3 (10.0%) |
Income Below Poverty Among Married-Couple vs Single-Parent Households in Appleby
The poverty data for Appleby shows that 2 of the married-couple family households (2.3%) and 3 of the single-parent households (6.7%) are living below the poverty level. Within the married-couple family households, those with no children have the highest poverty rate, with 2 households (4.1%) falling below the poverty line. Among the single-parent households, those with no children have the highest poverty rate, with 3 household (12.5%) living below poverty.
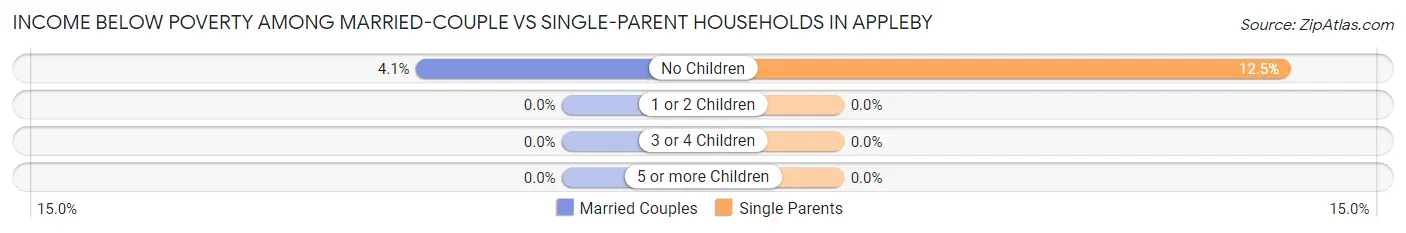
| Children | Married-Couple Families | Single-Parent Households |
| No Children | 2 (4.1%) | 3 (12.5%) |
| 1 or 2 Children | 0 (0.0%) | 0 (0.0%) |
| 3 or 4 Children | 0 (0.0%) | 0 (0.0%) |
| 5 or more Children | 0 (0.0%) | 0 (0.0%) |
| Total | 2 (2.3%) | 3 (6.7%) |
Race in Appleby
The most populous races in Appleby are White / Caucasian (339 | 69.2%), Hispanic or Latino (139 | 28.4%), and Two or more Races (87 | 17.8%).
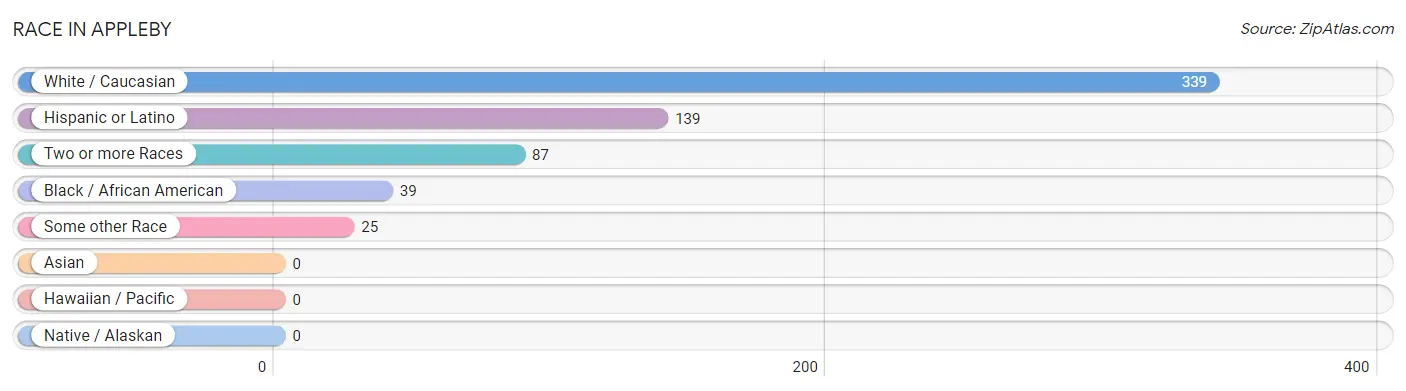
| Race | # Population | % Population |
| Asian | 0 | 0.0% |
| Black / African American | 39 | 8.0% |
| Hawaiian / Pacific | 0 | 0.0% |
| Hispanic or Latino | 139 | 28.4% |
| Native / Alaskan | 0 | 0.0% |
| White / Caucasian | 339 | 69.2% |
| Two or more Races | 87 | 17.8% |
| Some other Race | 25 | 5.1% |
| Total | 490 | 100.0% |
Ancestry in Appleby
The most populous ancestries reported in Appleby are Mexican (116 | 23.7%), Irish (41 | 8.4%), German (35 | 7.1%), English (34 | 6.9%), and American (31 | 6.3%), together accounting for 52.5% of all Appleby residents.
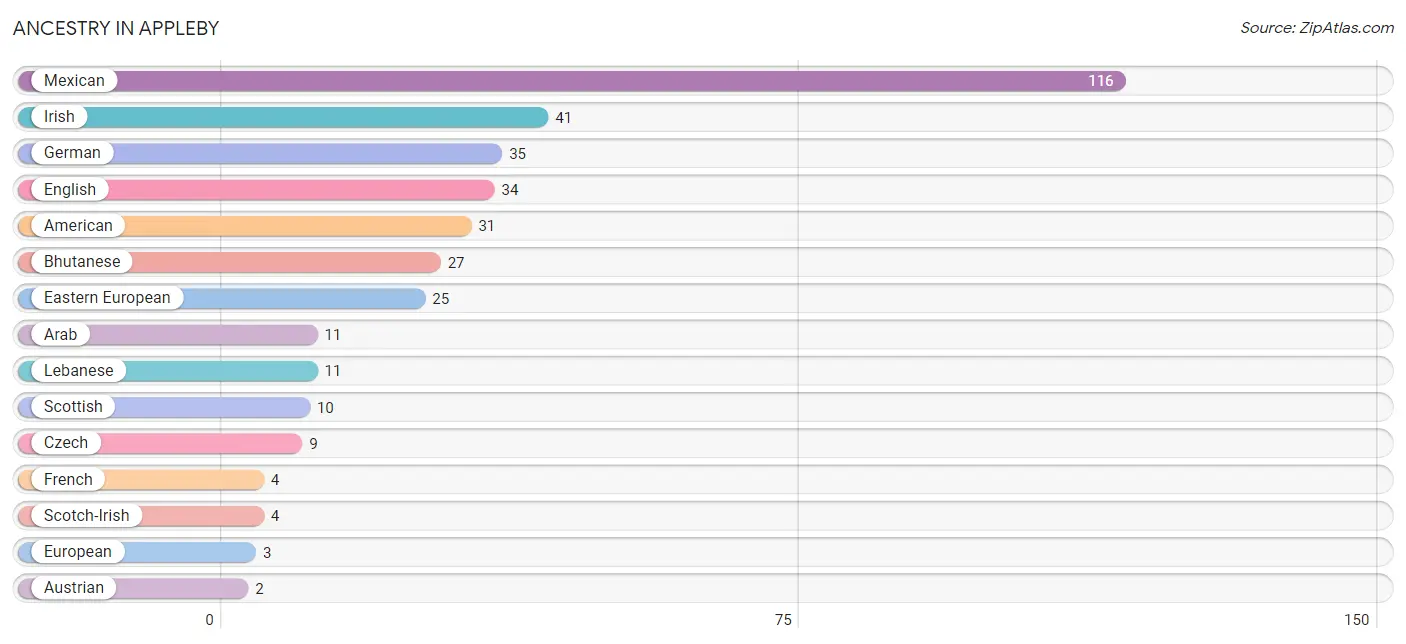
| Ancestry | # Population | % Population |
| American | 31 | 6.3% |
| Arab | 11 | 2.2% |
| Austrian | 2 | 0.4% |
| Bhutanese | 27 | 5.5% |
| Czech | 9 | 1.8% |
| Eastern European | 25 | 5.1% |
| English | 34 | 6.9% |
| European | 3 | 0.6% |
| French | 4 | 0.8% |
| German | 35 | 7.1% |
| Irish | 41 | 8.4% |
| Italian | 2 | 0.4% |
| Lebanese | 11 | 2.2% |
| Mexican | 116 | 23.7% |
| Polish | 2 | 0.4% |
| Scotch-Irish | 4 | 0.8% |
| Scottish | 10 | 2.0% | View All 17 Rows |
Immigrants in Appleby
The most numerous immigrant groups reported in Appleby came from Central America (15 | 3.1%), Latin America (15 | 3.1%), Mexico (11 | 2.2%), and Honduras (4 | 0.8%), together accounting for 9.2% of all Appleby residents.
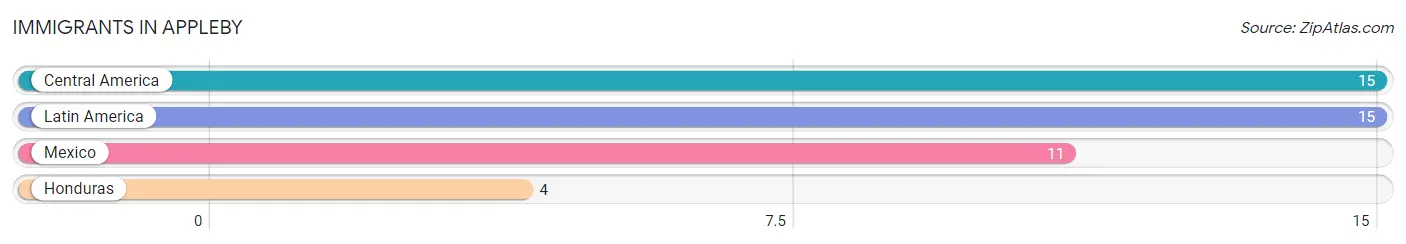
| Immigration Origin | # Population | % Population |
| Central America | 15 | 3.1% |
| Honduras | 4 | 0.8% |
| Latin America | 15 | 3.1% |
| Mexico | 11 | 2.2% | View All 4 Rows |
Sex and Age in Appleby
Sex and Age in Appleby
The most populous age groups in Appleby are 35 to 39 Years (35 | 15.6%) for men and 25 to 29 Years (50 | 18.8%) for women.
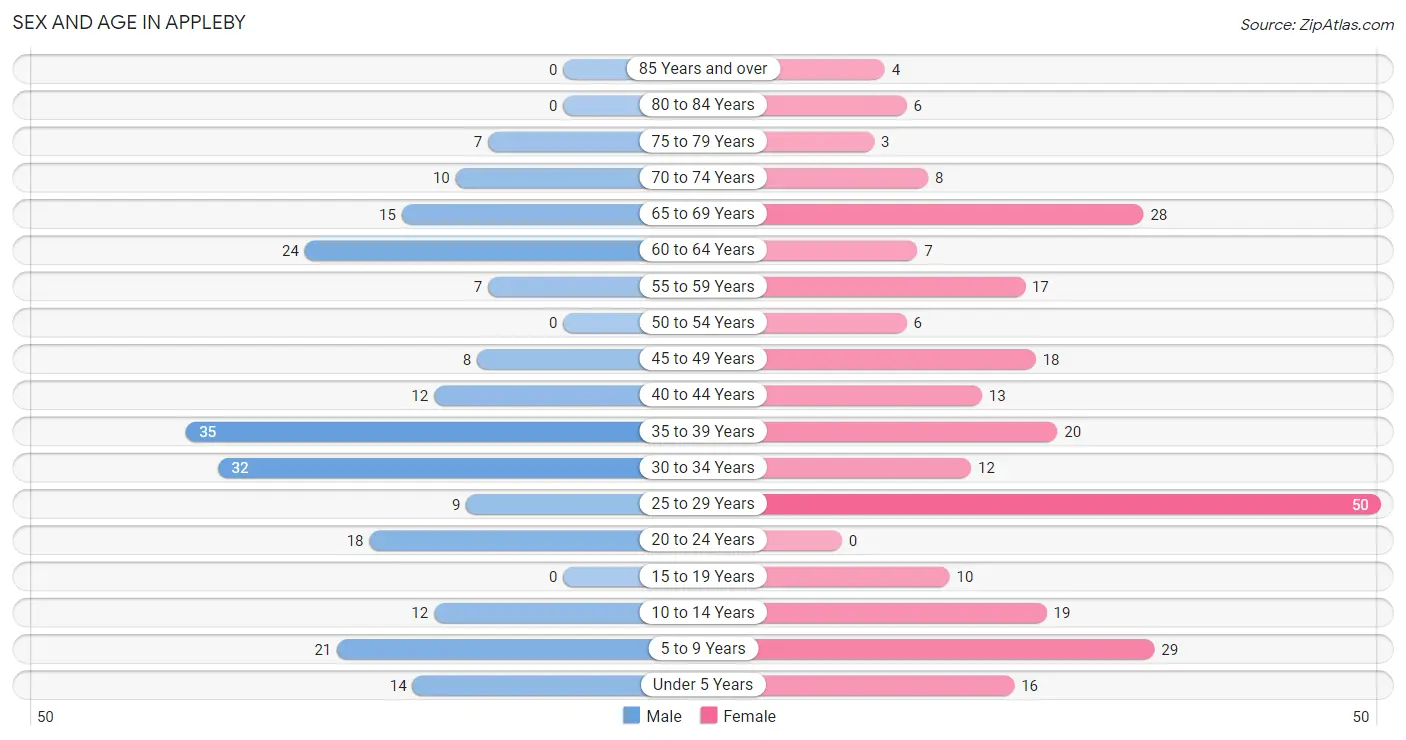
| Age Bracket | Male | Female |
| Under 5 Years | 14 (6.2%) | 16 (6.0%) |
| 5 to 9 Years | 21 (9.4%) | 29 (10.9%) |
| 10 to 14 Years | 12 (5.4%) | 19 (7.1%) |
| 15 to 19 Years | 0 (0.0%) | 10 (3.8%) |
| 20 to 24 Years | 18 (8.0%) | 0 (0.0%) |
| 25 to 29 Years | 9 (4.0%) | 50 (18.8%) |
| 30 to 34 Years | 32 (14.3%) | 12 (4.5%) |
| 35 to 39 Years | 35 (15.6%) | 20 (7.5%) |
| 40 to 44 Years | 12 (5.4%) | 13 (4.9%) |
| 45 to 49 Years | 8 (3.6%) | 18 (6.8%) |
| 50 to 54 Years | 0 (0.0%) | 6 (2.3%) |
| 55 to 59 Years | 7 (3.1%) | 17 (6.4%) |
| 60 to 64 Years | 24 (10.7%) | 7 (2.6%) |
| 65 to 69 Years | 15 (6.7%) | 28 (10.5%) |
| 70 to 74 Years | 10 (4.5%) | 8 (3.0%) |
| 75 to 79 Years | 7 (3.1%) | 3 (1.1%) |
| 80 to 84 Years | 0 (0.0%) | 6 (2.3%) |
| 85 Years and over | 0 (0.0%) | 4 (1.5%) |
| Total | 224 (100.0%) | 266 (100.0%) |
Families and Households in Appleby
Median Family Size in Appleby
The median family size in Appleby is 2.89 persons per family, with married-couple families (86 | 65.6%) accounting for the largest median family size of 3.19 persons per family. On the other hand, single female/mother families (30 | 22.9%) represent the smallest median family size with 2.00 persons per family.
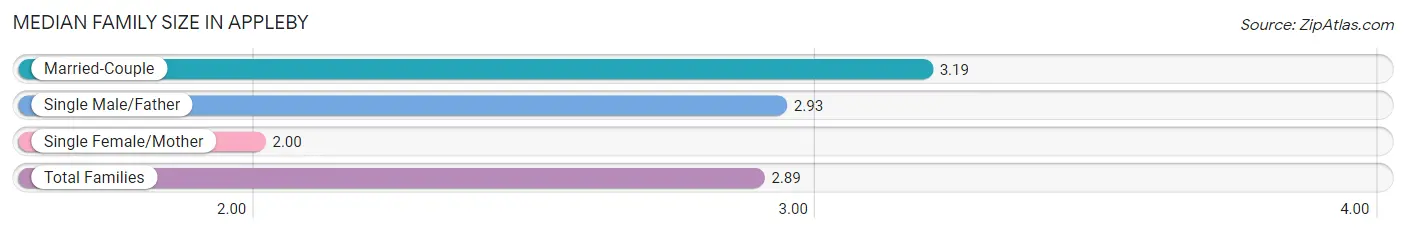
| Family Type | # Families | Family Size |
| Married-Couple | 86 (65.6%) | 3.19 |
| Single Male/Father | 15 (11.5%) | 2.93 |
| Single Female/Mother | 30 (22.9%) | 2.00 |
| Total Families | 131 (100.0%) | 2.89 |
Median Household Size in Appleby
The median household size in Appleby is 2.31 persons per household, with single male/father households (15 | 7.1%) accounting for the largest median household size of 3.4 persons per household. non-family households (81 | 38.2%) represent the smallest median household size with 1.26 persons per household.
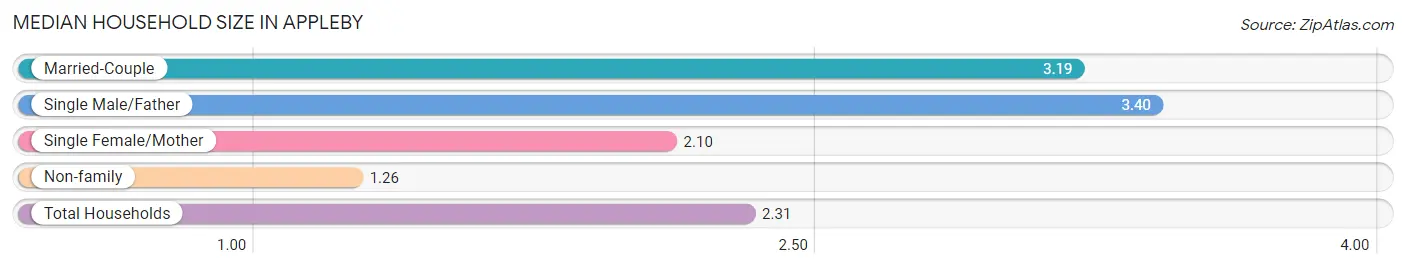
| Household Type | # Households | Household Size |
| Married-Couple | 86 (40.6%) | 3.19 |
| Single Male/Father | 15 (7.1%) | 3.40 |
| Single Female/Mother | 30 (14.1%) | 2.10 |
| Non-family | 81 (38.2%) | 1.26 |
| Total Households | 212 (100.0%) | 2.31 |
Household Size by Marriage Status in Appleby
Out of a total of 212 households in Appleby, 131 (61.8%) are family households, while 81 (38.2%) are nonfamily households. The most numerous type of family households are 2-person households, comprising 70, and the most common type of nonfamily households are 1-person households, comprising 54.
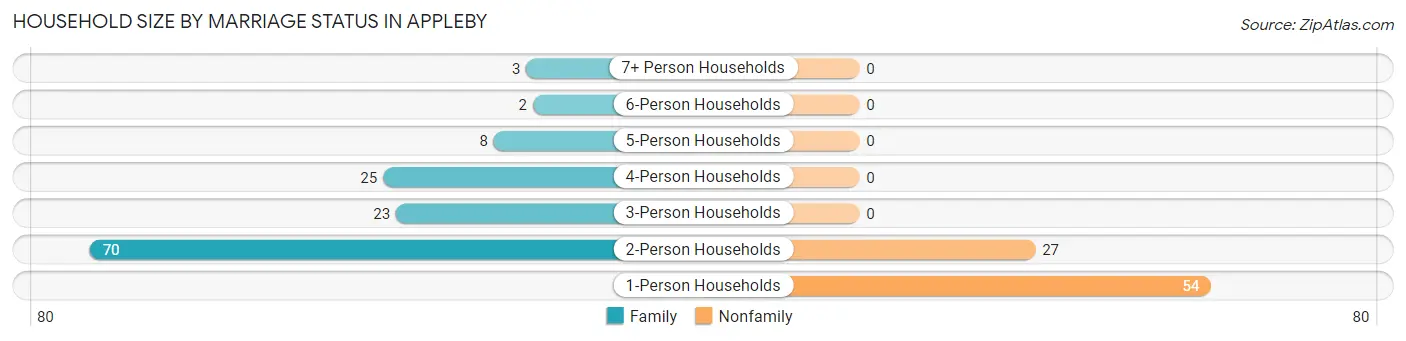
| Household Size | Family Households | Nonfamily Households |
| 1-Person Households | - | 54 (25.5%) |
| 2-Person Households | 70 (33.0%) | 27 (12.7%) |
| 3-Person Households | 23 (10.8%) | 0 (0.0%) |
| 4-Person Households | 25 (11.8%) | 0 (0.0%) |
| 5-Person Households | 8 (3.8%) | 0 (0.0%) |
| 6-Person Households | 2 (0.9%) | 0 (0.0%) |
| 7+ Person Households | 3 (1.4%) | 0 (0.0%) |
| Total | 131 (61.8%) | 81 (38.2%) |
Female Fertility in Appleby
Fertility by Age in Appleby
Average fertility rate in Appleby is 109.0 births per 1,000 women. Women in the age bracket of 20 to 34 years have the highest fertility rate with 226.0 births per 1,000 women. Women in the age bracket of 20 to 34 years acount for 100.0% of all women with births.
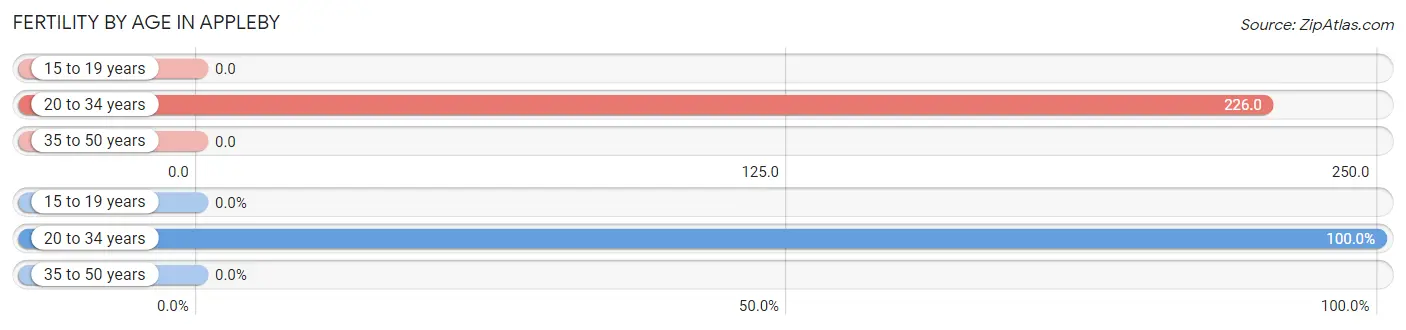
| Age Bracket | Women with Births | Births / 1,000 Women |
| 15 to 19 years | 0 (0.0%) | 0.0 |
| 20 to 34 years | 14 (100.0%) | 226.0 |
| 35 to 50 years | 0 (0.0%) | 0.0 |
| Total | 14 (100.0%) | 109.0 |
Fertility by Age by Marriage Status in Appleby
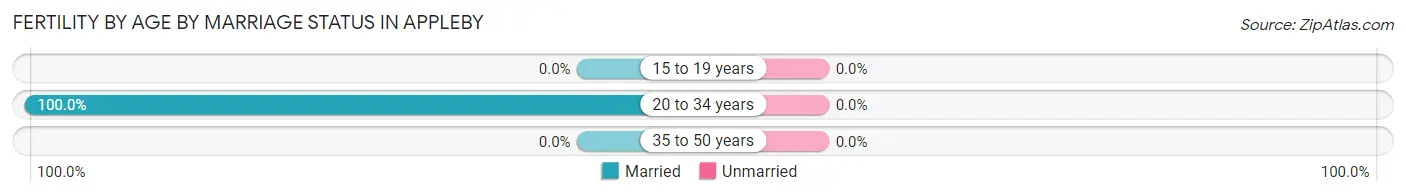
| Age Bracket | Married | Unmarried |
| 15 to 19 years | 0 (0.0%) | 0 (0.0%) |
| 20 to 34 years | 14 (100.0%) | 0 (0.0%) |
| 35 to 50 years | 0 (0.0%) | 0 (0.0%) |
| Total | 14 (100.0%) | 0 (0.0%) |
Fertility by Education in Appleby
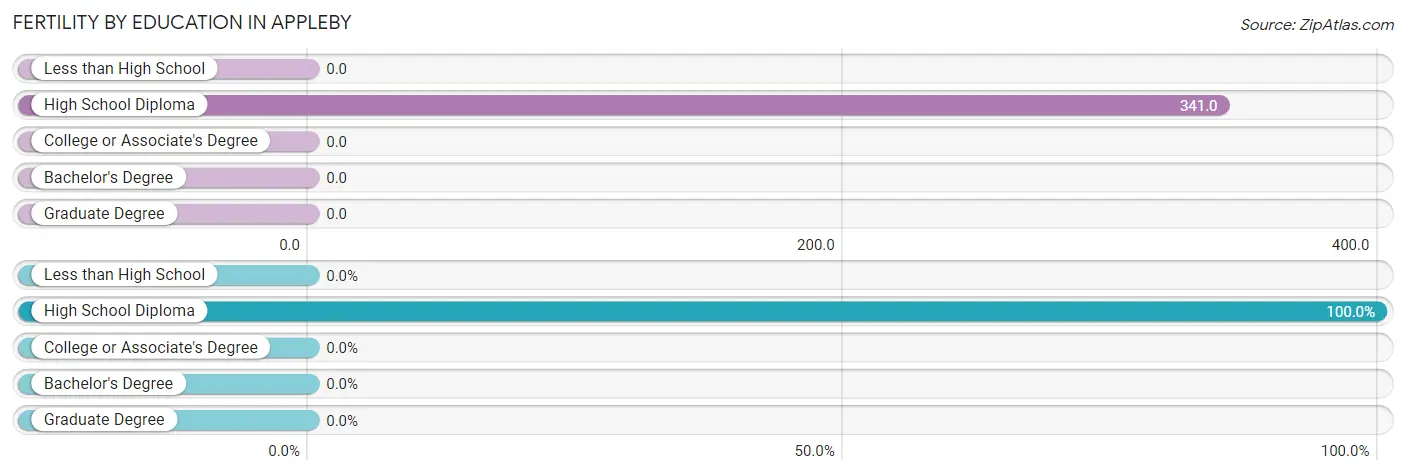
| Educational Attainment | Women with Births | Births / 1,000 Women |
| Less than High School | 0 (0.0%) | 0.0 |
| High School Diploma | 14 (100.0%) | 341.0 |
| College or Associate's Degree | 0 (0.0%) | 0.0 |
| Bachelor's Degree | 0 (0.0%) | 0.0 |
| Graduate Degree | 0 (0.0%) | 0.0 |
| Total | 14 (100.0%) | 109.0 |
Fertility by Education by Marriage Status in Appleby
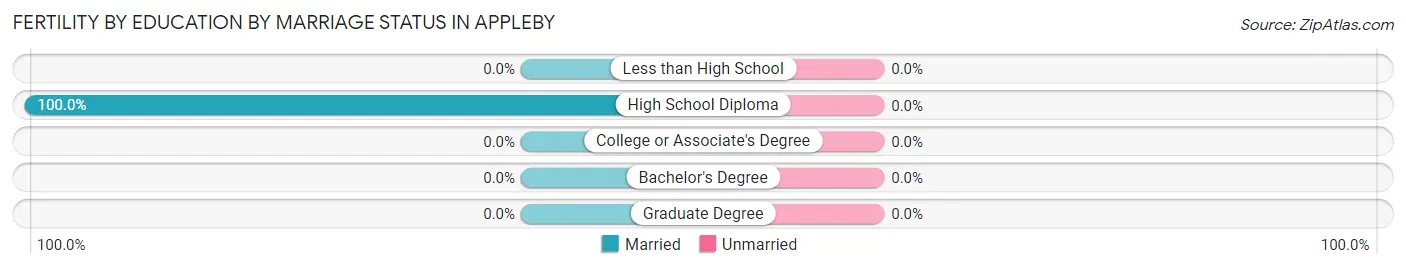
| Educational Attainment | Married | Unmarried |
| Less than High School | 0 (0.0%) | 0 (0.0%) |
| High School Diploma | 14 (100.0%) | 0 (0.0%) |
| College or Associate's Degree | 0 (0.0%) | 0 (0.0%) |
| Bachelor's Degree | 0 (0.0%) | 0 (0.0%) |
| Graduate Degree | 0 (0.0%) | 0 (0.0%) |
| Total | 14 (100.0%) | 0 (0.0%) |
Employment Characteristics in Appleby
Employment by Class of Employer in Appleby
Among the 265 employed individuals in Appleby, private company employees (154 | 58.1%), local government employees (56 | 21.1%), and state government employees (18 | 6.8%) make up the most common classes of employment.
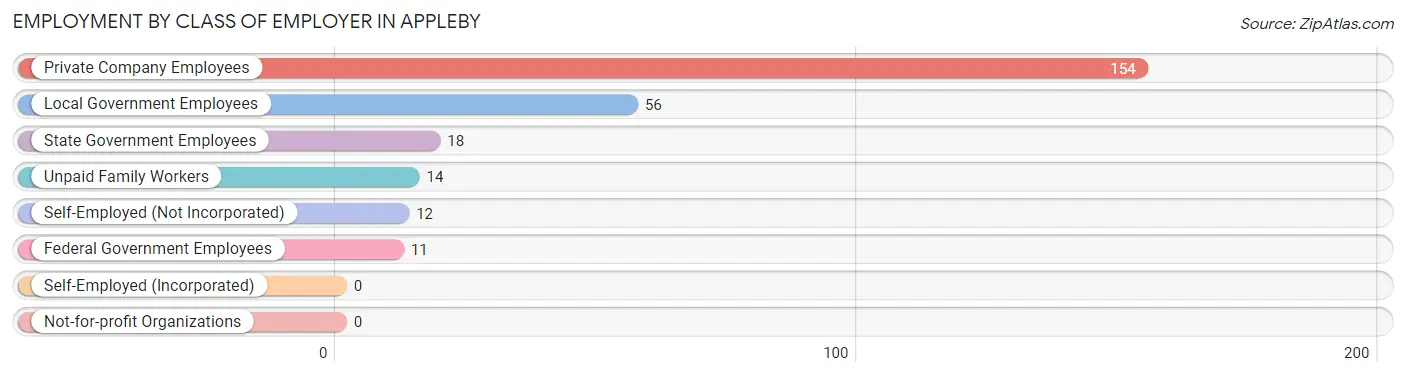
| Employer Class | # Employees | % Employees |
| Private Company Employees | 154 | 58.1% |
| Self-Employed (Incorporated) | 0 | 0.0% |
| Self-Employed (Not Incorporated) | 12 | 4.5% |
| Not-for-profit Organizations | 0 | 0.0% |
| Local Government Employees | 56 | 21.1% |
| State Government Employees | 18 | 6.8% |
| Federal Government Employees | 11 | 4.2% |
| Unpaid Family Workers | 14 | 5.3% |
| Total | 265 | 100.0% |
Employment Status by Age in Appleby
According to the labor force statistics for Appleby, out of the total population over 16 years of age (379), 74.9% or 284 individuals are in the labor force, with 5.6% or 16 of them unemployed. The age group with the highest labor force participation rate is 20 to 24 years, with 100.0% or 18 individuals in the labor force. Within the labor force, the 20 to 24 years age range has the highest percentage of unemployed individuals, with 33.3% or 6 of them being unemployed.
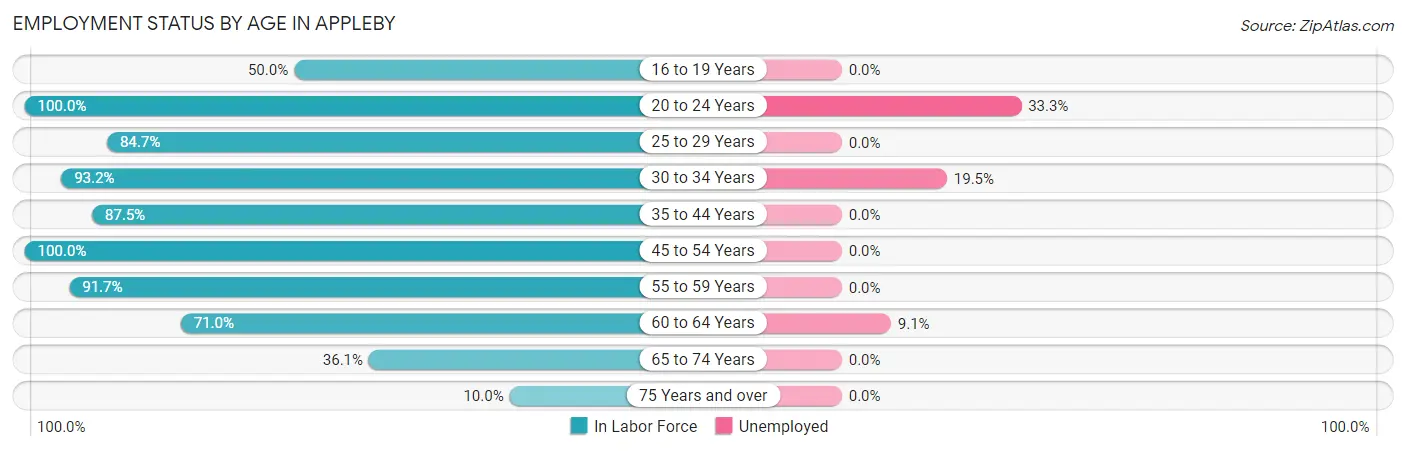
| Age Bracket | In Labor Force | Unemployed |
| 16 to 19 Years | 5 (50.0%) | 0 (0.0%) |
| 20 to 24 Years | 18 (100.0%) | 6 (33.3%) |
| 25 to 29 Years | 50 (84.7%) | 0 (0.0%) |
| 30 to 34 Years | 41 (93.2%) | 8 (19.5%) |
| 35 to 44 Years | 70 (87.5%) | 0 (0.0%) |
| 45 to 54 Years | 32 (100.0%) | 0 (0.0%) |
| 55 to 59 Years | 22 (91.7%) | 0 (0.0%) |
| 60 to 64 Years | 22 (71.0%) | 2 (9.1%) |
| 65 to 74 Years | 22 (36.1%) | 0 (0.0%) |
| 75 Years and over | 2 (10.0%) | 0 (0.0%) |
| Total | 284 (74.9%) | 16 (5.6%) |
Employment Status by Educational Attainment in Appleby
According to labor force statistics for Appleby, 87.8% of individuals (237) out of the total population between 25 and 64 years of age (270) are in the labor force, with 4.2% or 10 of them being unemployed. The group with the highest labor force participation rate are those with the educational attainment of bachelor's degree or higher, with 96.7% or 89 individuals in the labor force. Within the labor force, individuals with less than high school education have the highest percentage of unemployment, with 40.0% or 2 of them being unemployed.
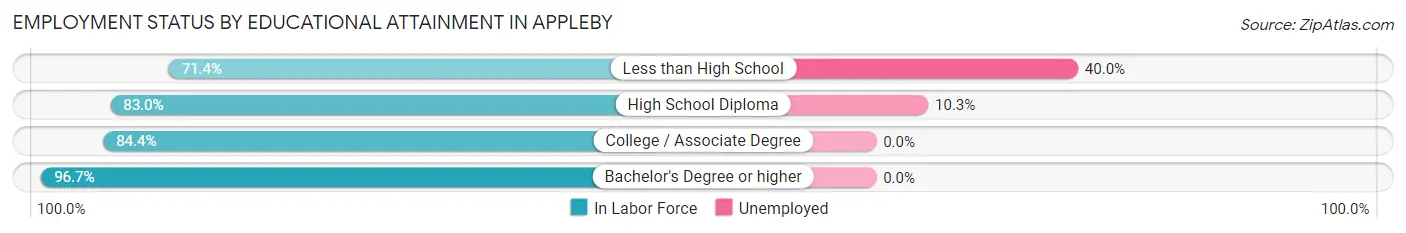
| Educational Attainment | In Labor Force | Unemployed |
| Less than High School | 5 (71.4%) | 3 (40.0%) |
| High School Diploma | 78 (83.0%) | 10 (10.3%) |
| College / Associate Degree | 65 (84.4%) | 0 (0.0%) |
| Bachelor's Degree or higher | 89 (96.7%) | 0 (0.0%) |
| Total | 237 (87.8%) | 11 (4.2%) |
Employment Occupations by Sex in Appleby
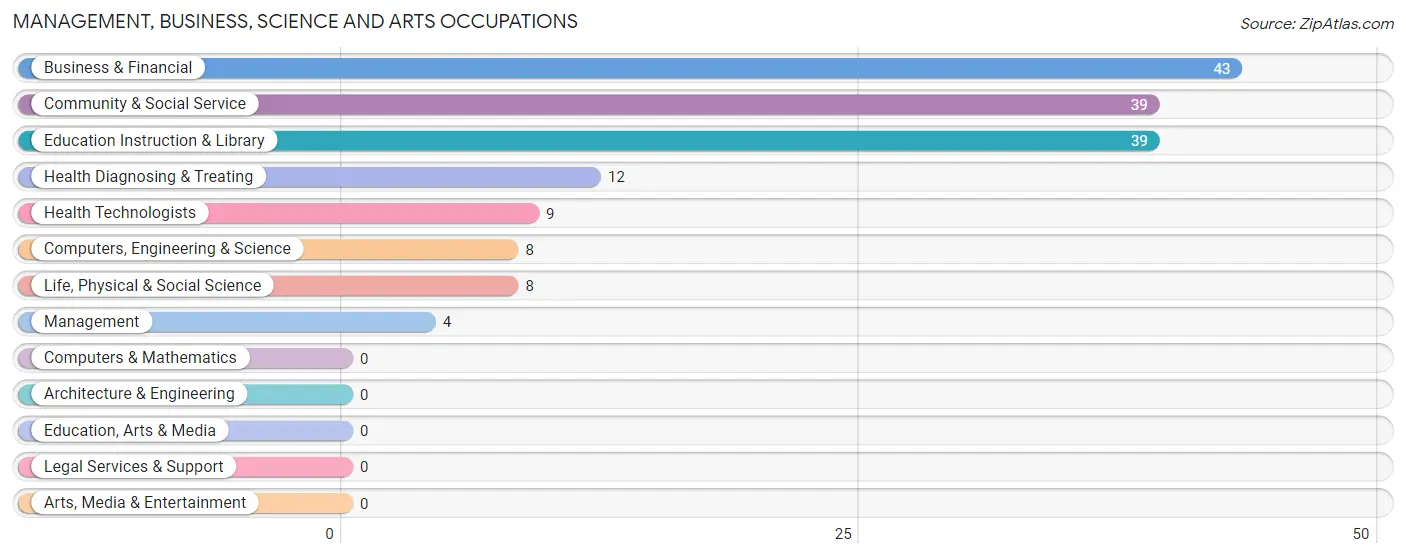
Management, Business, Science and Arts Occupations
The most common Management, Business, Science and Arts occupations in Appleby are Business & Financial (43 | 16.0%), Community & Social Service (39 | 14.5%), Education Instruction & Library (39 | 14.5%), Health Diagnosing & Treating (12 | 4.5%), and Health Technologists (9 | 3.4%).
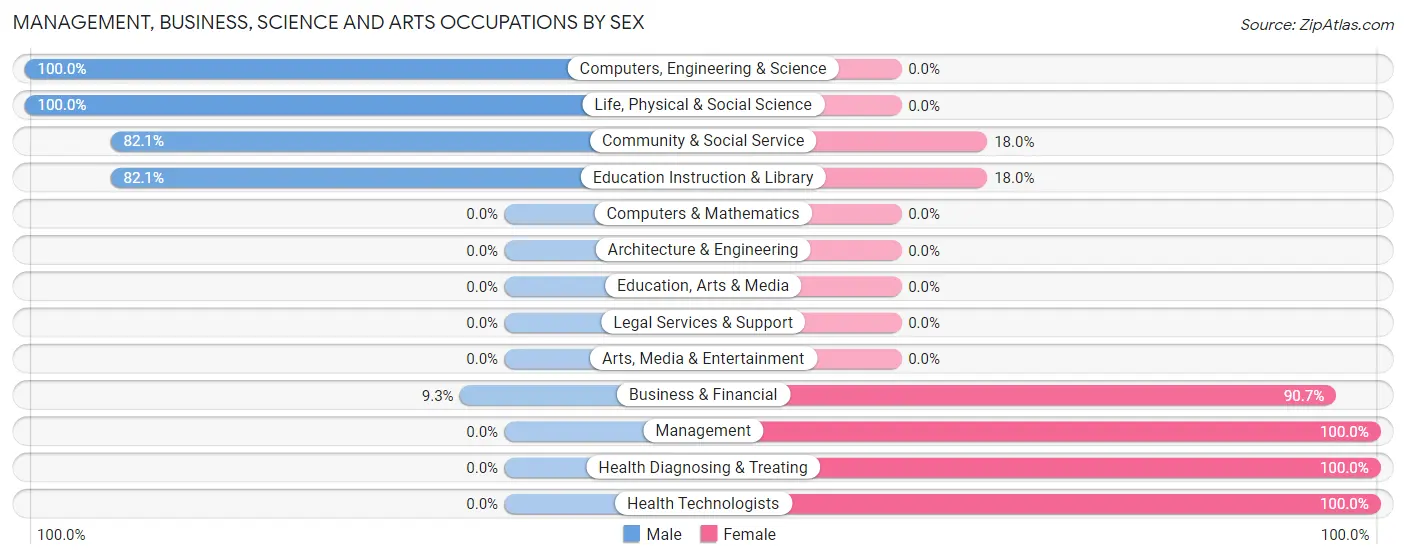
Management, Business, Science and Arts Occupations by Sex
Within the Management, Business, Science and Arts occupations in Appleby, the most male-oriented occupations are Computers, Engineering & Science (100.0%), Life, Physical & Social Science (100.0%), and Community & Social Service (82.1%), while the most female-oriented occupations are Management (100.0%), Health Diagnosing & Treating (100.0%), and Health Technologists (100.0%).
| Occupation | Male | Female |
| Management | 0 (0.0%) | 4 (100.0%) |
| Business & Financial | 4 (9.3%) | 39 (90.7%) |
| Computers, Engineering & Science | 8 (100.0%) | 0 (0.0%) |
| Computers & Mathematics | 0 (0.0%) | 0 (0.0%) |
| Architecture & Engineering | 0 (0.0%) | 0 (0.0%) |
| Life, Physical & Social Science | 8 (100.0%) | 0 (0.0%) |
| Community & Social Service | 32 (82.1%) | 7 (17.9%) |
| Education, Arts & Media | 0 (0.0%) | 0 (0.0%) |
| Legal Services & Support | 0 (0.0%) | 0 (0.0%) |
| Education Instruction & Library | 32 (82.1%) | 7 (17.9%) |
| Arts, Media & Entertainment | 0 (0.0%) | 0 (0.0%) |
| Health Diagnosing & Treating | 0 (0.0%) | 12 (100.0%) |
| Health Technologists | 0 (0.0%) | 9 (100.0%) |
| Total (Category) | 44 (41.5%) | 62 (58.5%) |
| Total (Overall) | 132 (49.2%) | 136 (50.7%) |
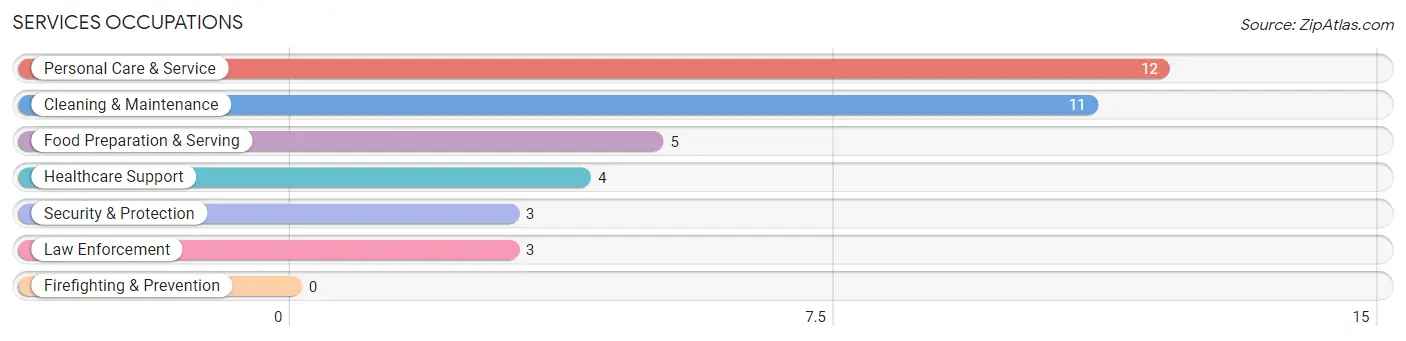
Services Occupations
The most common Services occupations in Appleby are Personal Care & Service (12 | 4.5%), Cleaning & Maintenance (11 | 4.1%), Food Preparation & Serving (5 | 1.9%), Healthcare Support (4 | 1.5%), and Security & Protection (3 | 1.1%).
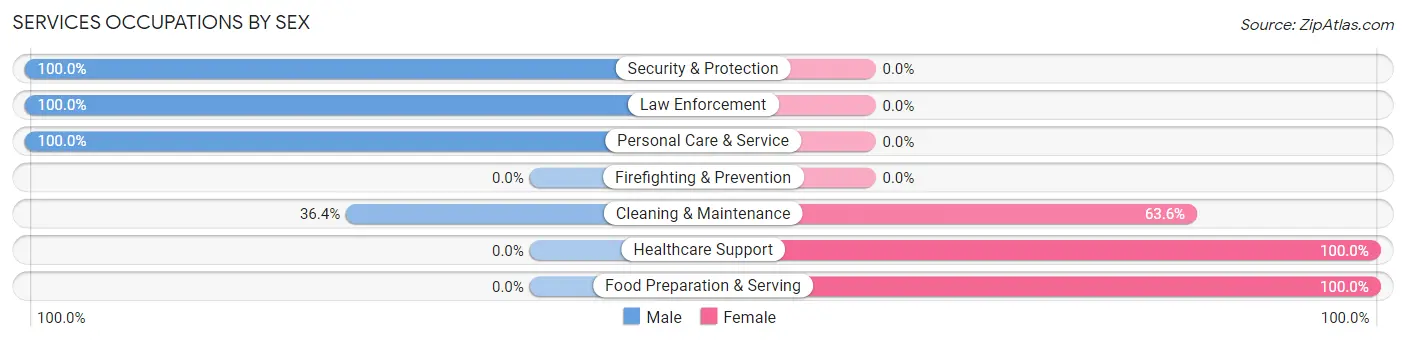
Services Occupations by Sex
Within the Services occupations in Appleby, the most male-oriented occupations are Security & Protection (100.0%), Law Enforcement (100.0%), and Personal Care & Service (100.0%), while the most female-oriented occupations are Healthcare Support (100.0%), Food Preparation & Serving (100.0%), and Cleaning & Maintenance (63.6%).
| Occupation | Male | Female |
| Healthcare Support | 0 (0.0%) | 4 (100.0%) |
| Security & Protection | 3 (100.0%) | 0 (0.0%) |
| Firefighting & Prevention | 0 (0.0%) | 0 (0.0%) |
| Law Enforcement | 3 (100.0%) | 0 (0.0%) |
| Food Preparation & Serving | 0 (0.0%) | 5 (100.0%) |
| Cleaning & Maintenance | 4 (36.4%) | 7 (63.6%) |
| Personal Care & Service | 12 (100.0%) | 0 (0.0%) |
| Total (Category) | 19 (54.3%) | 16 (45.7%) |
| Total (Overall) | 132 (49.2%) | 136 (50.7%) |
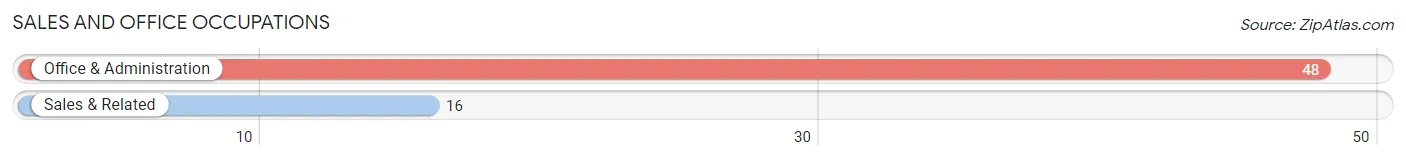
Sales and Office Occupations
The most common Sales and Office occupations in Appleby are Office & Administration (48 | 17.9%), and Sales & Related (16 | 6.0%).
Sales and Office Occupations by Sex
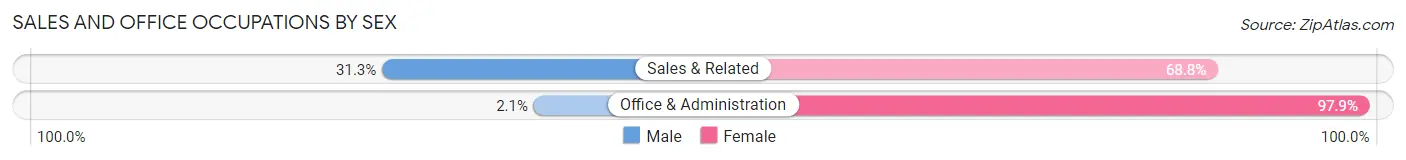
| Occupation | Male | Female |
| Sales & Related | 5 (31.2%) | 11 (68.8%) |
| Office & Administration | 1 (2.1%) | 47 (97.9%) |
| Total (Category) | 6 (9.4%) | 58 (90.6%) |
| Total (Overall) | 132 (49.2%) | 136 (50.7%) |
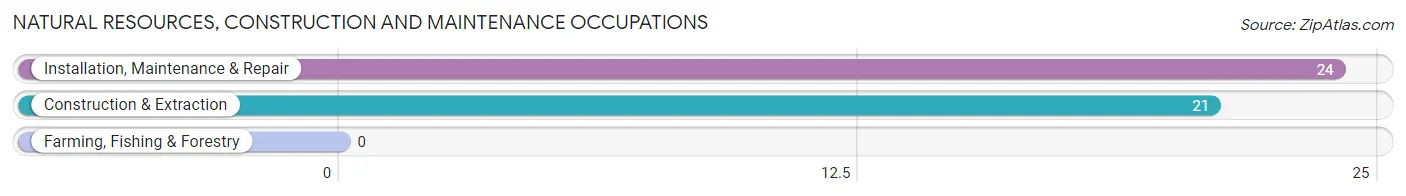
Natural Resources, Construction and Maintenance Occupations
The most common Natural Resources, Construction and Maintenance occupations in Appleby are Installation, Maintenance & Repair (24 | 9.0%), and Construction & Extraction (21 | 7.8%).
Natural Resources, Construction and Maintenance Occupations by Sex
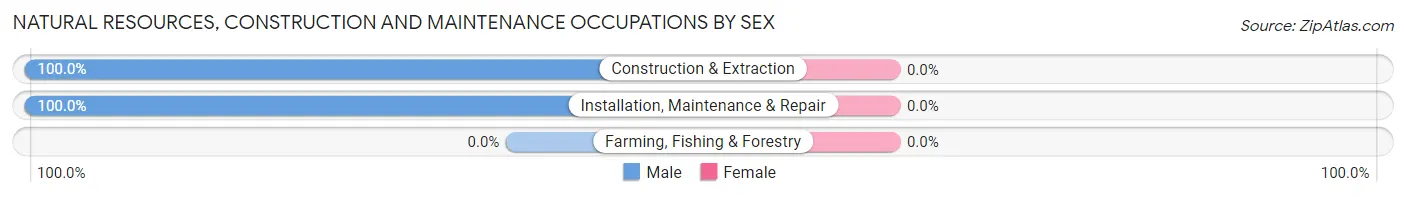
| Occupation | Male | Female |
| Farming, Fishing & Forestry | 0 (0.0%) | 0 (0.0%) |
| Construction & Extraction | 21 (100.0%) | 0 (0.0%) |
| Installation, Maintenance & Repair | 24 (100.0%) | 0 (0.0%) |
| Total (Category) | 45 (100.0%) | 0 (0.0%) |
| Total (Overall) | 132 (49.2%) | 136 (50.7%) |
Production, Transportation and Moving Occupations
The most common Production, Transportation and Moving occupations in Appleby are Production (14 | 5.2%), and Transportation (4 | 1.5%).
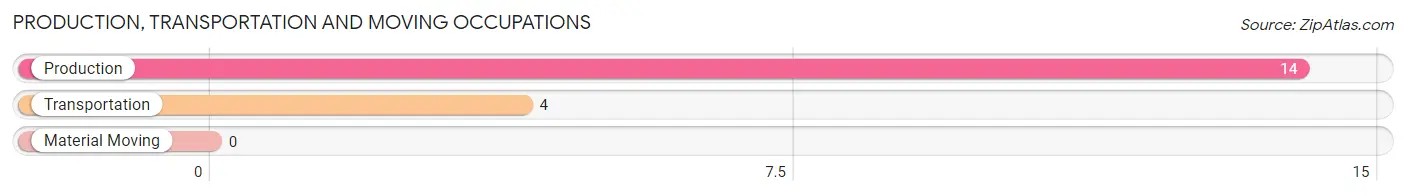
Production, Transportation and Moving Occupations by Sex
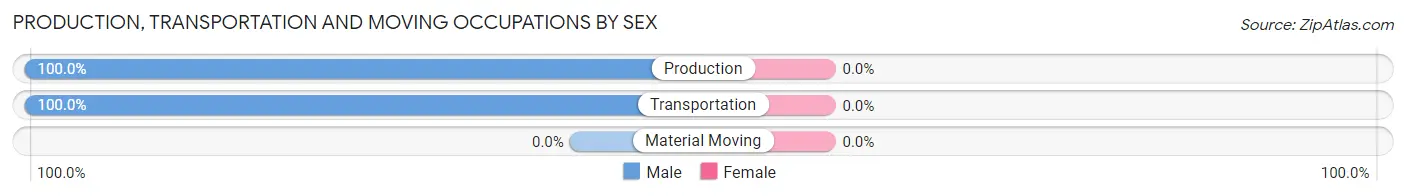
| Occupation | Male | Female |
| Production | 14 (100.0%) | 0 (0.0%) |
| Transportation | 4 (100.0%) | 0 (0.0%) |
| Material Moving | 0 (0.0%) | 0 (0.0%) |
| Total (Category) | 18 (100.0%) | 0 (0.0%) |
| Total (Overall) | 132 (49.2%) | 136 (50.7%) |
Employment Industries by Sex in Appleby
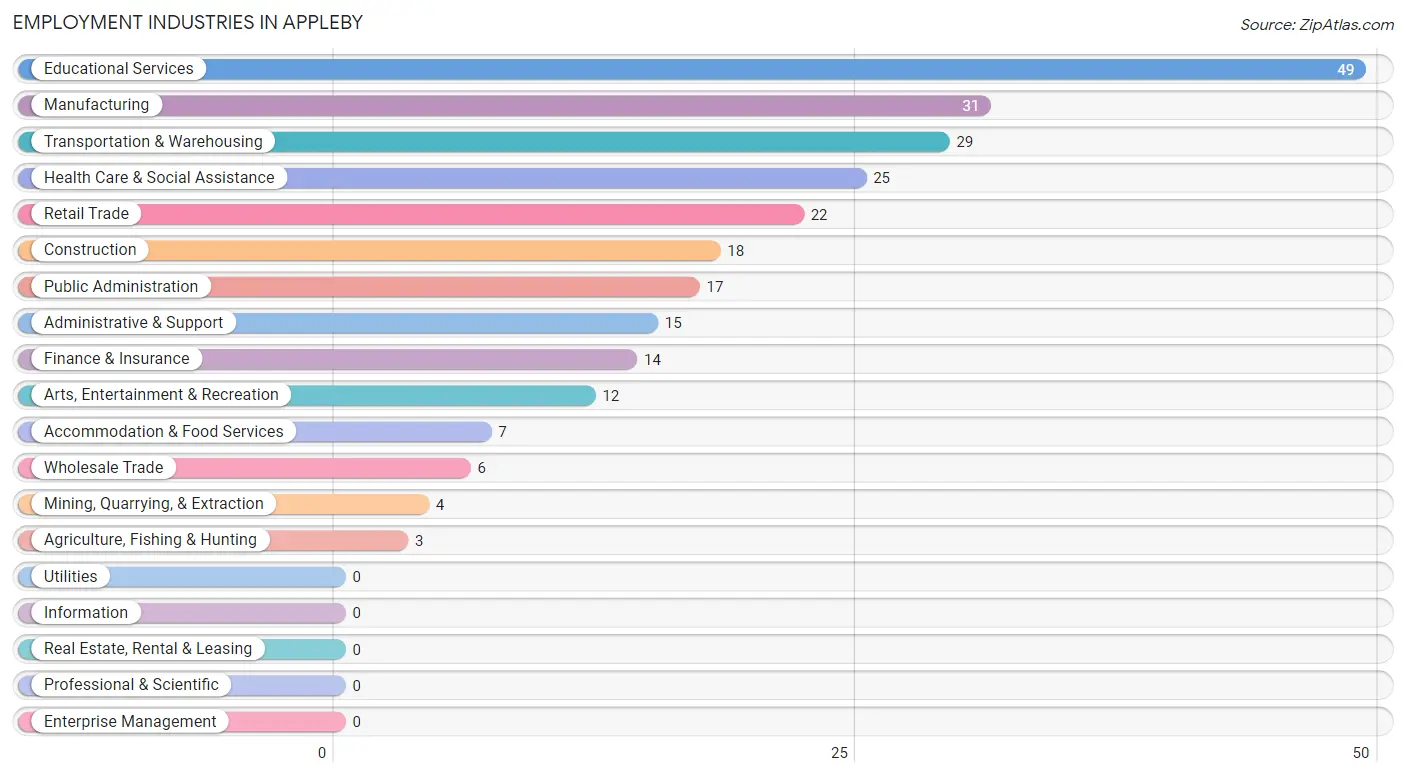
Employment Industries in Appleby
The major employment industries in Appleby include Educational Services (49 | 18.3%), Manufacturing (31 | 11.6%), Transportation & Warehousing (29 | 10.8%), Health Care & Social Assistance (25 | 9.3%), and Retail Trade (22 | 8.2%).
Employment Industries by Sex in Appleby
The Appleby industries that see more men than women are Agriculture, Fishing & Hunting (100.0%), Mining, Quarrying, & Extraction (100.0%), and Construction (100.0%), whereas the industries that tend to have a higher number of women are Wholesale Trade (100.0%), Finance & Insurance (100.0%), and Health Care & Social Assistance (100.0%).
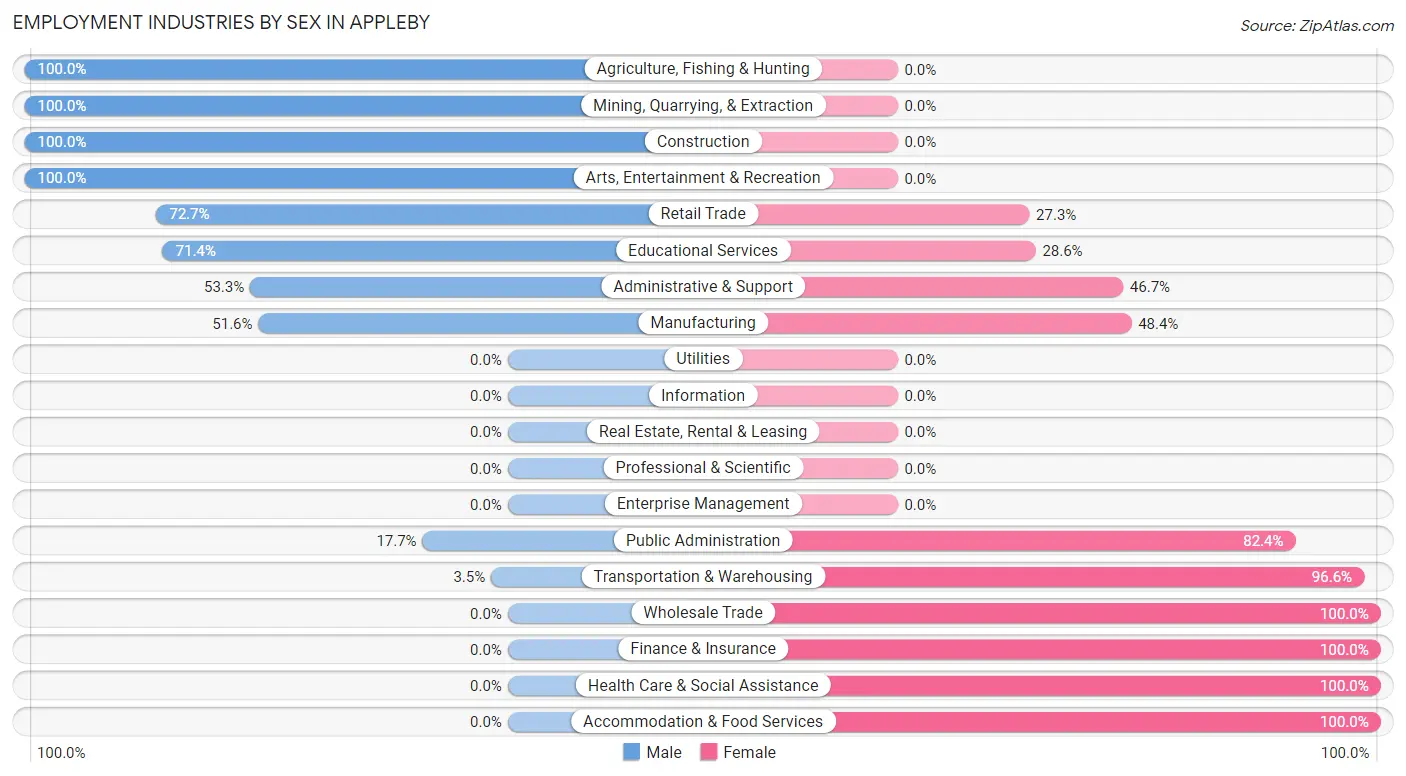
| Industry | Male | Female |
| Agriculture, Fishing & Hunting | 3 (100.0%) | 0 (0.0%) |
| Mining, Quarrying, & Extraction | 4 (100.0%) | 0 (0.0%) |
| Construction | 18 (100.0%) | 0 (0.0%) |
| Manufacturing | 16 (51.6%) | 15 (48.4%) |
| Wholesale Trade | 0 (0.0%) | 6 (100.0%) |
| Retail Trade | 16 (72.7%) | 6 (27.3%) |
| Transportation & Warehousing | 1 (3.5%) | 28 (96.6%) |
| Utilities | 0 (0.0%) | 0 (0.0%) |
| Information | 0 (0.0%) | 0 (0.0%) |
| Finance & Insurance | 0 (0.0%) | 14 (100.0%) |
| Real Estate, Rental & Leasing | 0 (0.0%) | 0 (0.0%) |
| Professional & Scientific | 0 (0.0%) | 0 (0.0%) |
| Enterprise Management | 0 (0.0%) | 0 (0.0%) |
| Administrative & Support | 8 (53.3%) | 7 (46.7%) |
| Educational Services | 35 (71.4%) | 14 (28.6%) |
| Health Care & Social Assistance | 0 (0.0%) | 25 (100.0%) |
| Arts, Entertainment & Recreation | 12 (100.0%) | 0 (0.0%) |
| Accommodation & Food Services | 0 (0.0%) | 7 (100.0%) |
| Public Administration | 3 (17.6%) | 14 (82.4%) |
| Total | 132 (49.2%) | 136 (50.7%) |
Education in Appleby
School Enrollment in Appleby
The most common levels of schooling among the 160 students in Appleby are elementary school (42 | 26.3%), graduate / professional (31 | 19.4%), and middle school (29 | 18.1%).
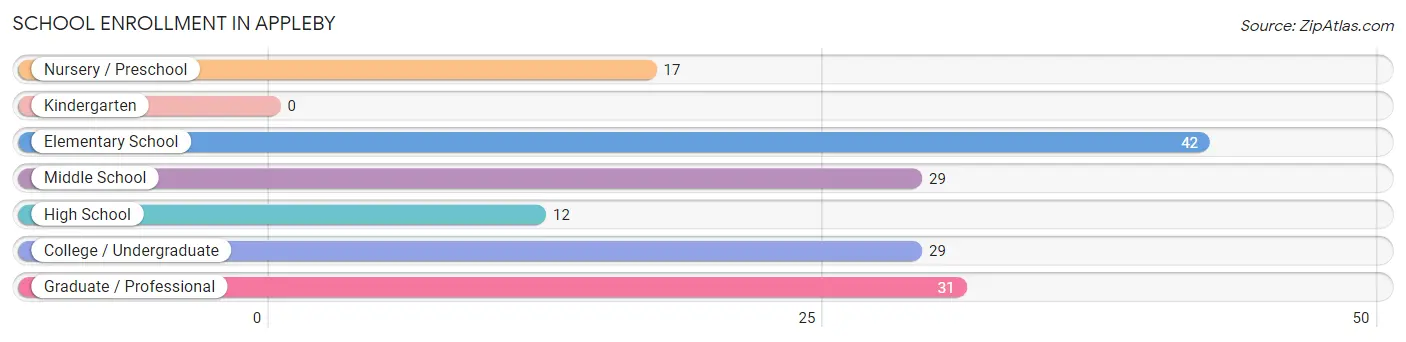
| School Level | # Students | % Students |
| Nursery / Preschool | 17 | 10.6% |
| Kindergarten | 0 | 0.0% |
| Elementary School | 42 | 26.3% |
| Middle School | 29 | 18.1% |
| High School | 12 | 7.5% |
| College / Undergraduate | 29 | 18.1% |
| Graduate / Professional | 31 | 19.4% |
| Total | 160 | 100.0% |
School Enrollment by Age by Funding Source in Appleby
Out of a total of 160 students who are enrolled in schools in Appleby, 14 (8.8%) attend a private institution, while the remaining 146 (91.2%) are enrolled in public schools. The age group of 3 to 4 year olds has the highest likelihood of being enrolled in private schools, with 3 (33.3% in the age bracket) enrolled. Conversely, the age group of 15 to 17 year olds has the lowest likelihood of being enrolled in a private school, with 3 (100.0% in the age bracket) attending a public institution.
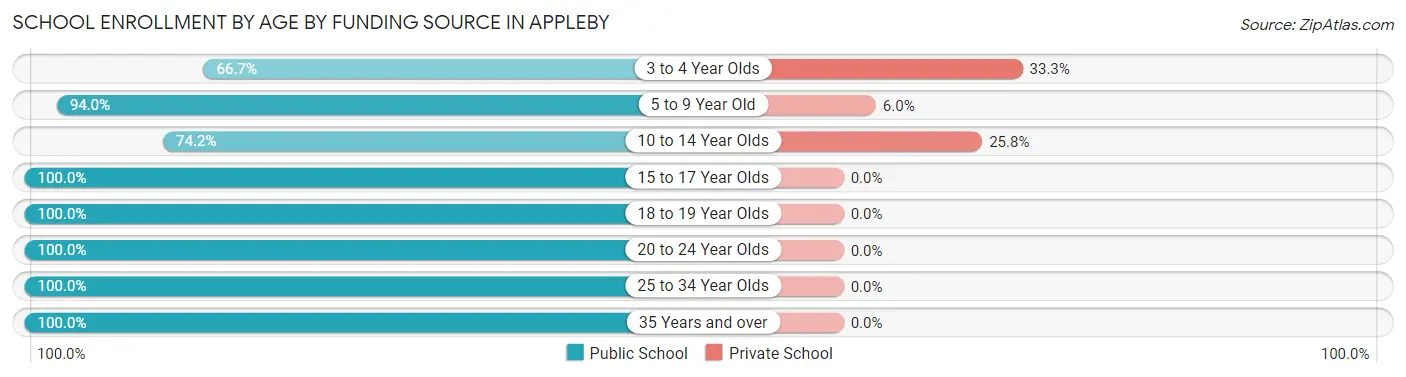
| Age Bracket | Public School | Private School |
| 3 to 4 Year Olds | 6 (66.7%) | 3 (33.3%) |
| 5 to 9 Year Old | 47 (94.0%) | 3 (6.0%) |
| 10 to 14 Year Olds | 23 (74.2%) | 8 (25.8%) |
| 15 to 17 Year Olds | 3 (100.0%) | 0 (0.0%) |
| 18 to 19 Year Olds | 7 (100.0%) | 0 (0.0%) |
| 20 to 24 Year Olds | 12 (100.0%) | 0 (0.0%) |
| 25 to 34 Year Olds | 14 (100.0%) | 0 (0.0%) |
| 35 Years and over | 34 (100.0%) | 0 (0.0%) |
| Total | 146 (91.3%) | 14 (8.8%) |
Educational Attainment by Field of Study in Appleby
Arts & humanities (38 | 27.0%), social sciences (35 | 24.8%), science & technology (19 | 13.5%), business (15 | 10.6%), and computers & mathematics (11 | 7.8%) are the most common fields of study among 141 individuals in Appleby who have obtained a bachelor's degree or higher.
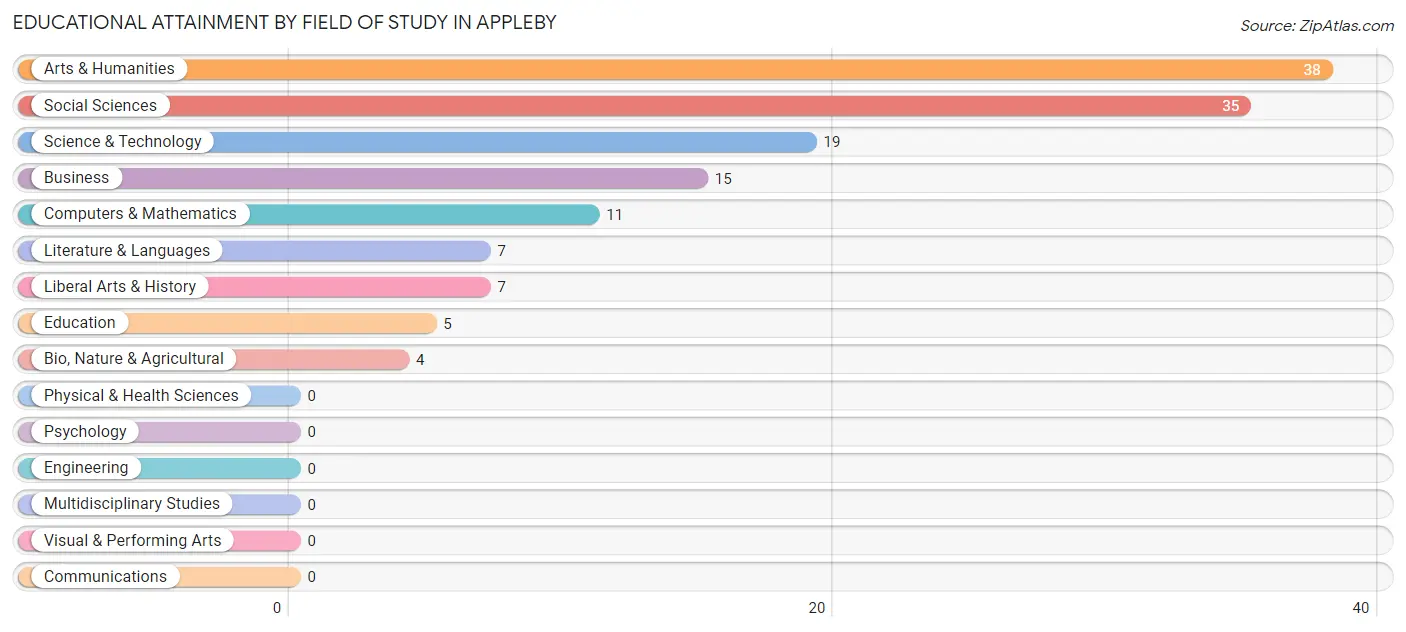
| Field of Study | # Graduates | % Graduates |
| Computers & Mathematics | 11 | 7.8% |
| Bio, Nature & Agricultural | 4 | 2.8% |
| Physical & Health Sciences | 0 | 0.0% |
| Psychology | 0 | 0.0% |
| Social Sciences | 35 | 24.8% |
| Engineering | 0 | 0.0% |
| Multidisciplinary Studies | 0 | 0.0% |
| Science & Technology | 19 | 13.5% |
| Business | 15 | 10.6% |
| Education | 5 | 3.5% |
| Literature & Languages | 7 | 5.0% |
| Liberal Arts & History | 7 | 5.0% |
| Visual & Performing Arts | 0 | 0.0% |
| Communications | 0 | 0.0% |
| Arts & Humanities | 38 | 27.0% |
| Total | 141 | 100.0% |
Transportation & Commute in Appleby
Vehicle Availability by Sex in Appleby
The most prevalent vehicle ownership categories in Appleby are males with 2 vehicles (99, accounting for 76.7%) and females with 2 vehicles (103, making up 72.8%).
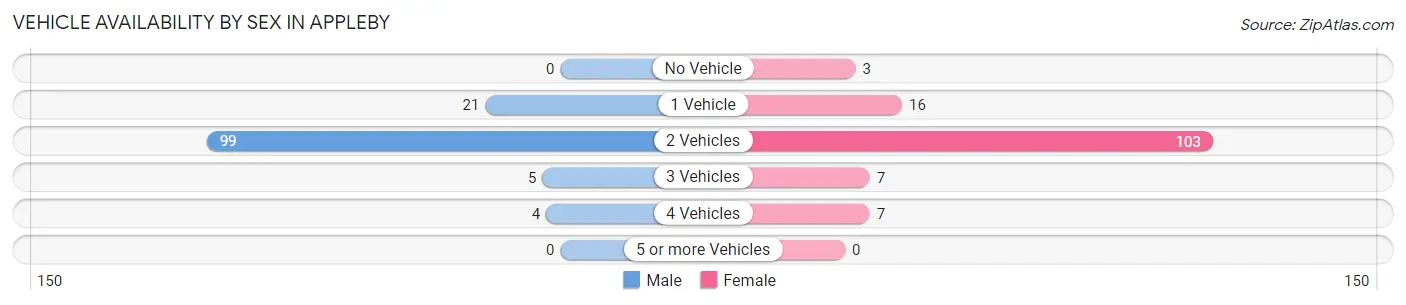
| Vehicles Available | Male | Female |
| No Vehicle | 0 (0.0%) | 3 (2.2%) |
| 1 Vehicle | 21 (16.3%) | 16 (11.8%) |
| 2 Vehicles | 99 (76.7%) | 103 (75.7%) |
| 3 Vehicles | 5 (3.9%) | 7 (5.1%) |
| 4 Vehicles | 4 (3.1%) | 7 (5.1%) |
| 5 or more Vehicles | 0 (0.0%) | 0 (0.0%) |
| Total | 129 (100.0%) | 136 (100.0%) |
Commute Time in Appleby
The most frequently occuring commute durations in Appleby are 15 to 19 minutes (112 commuters, 47.1%), 10 to 14 minutes (45 commuters, 18.9%), and 5 to 9 minutes (34 commuters, 14.3%).
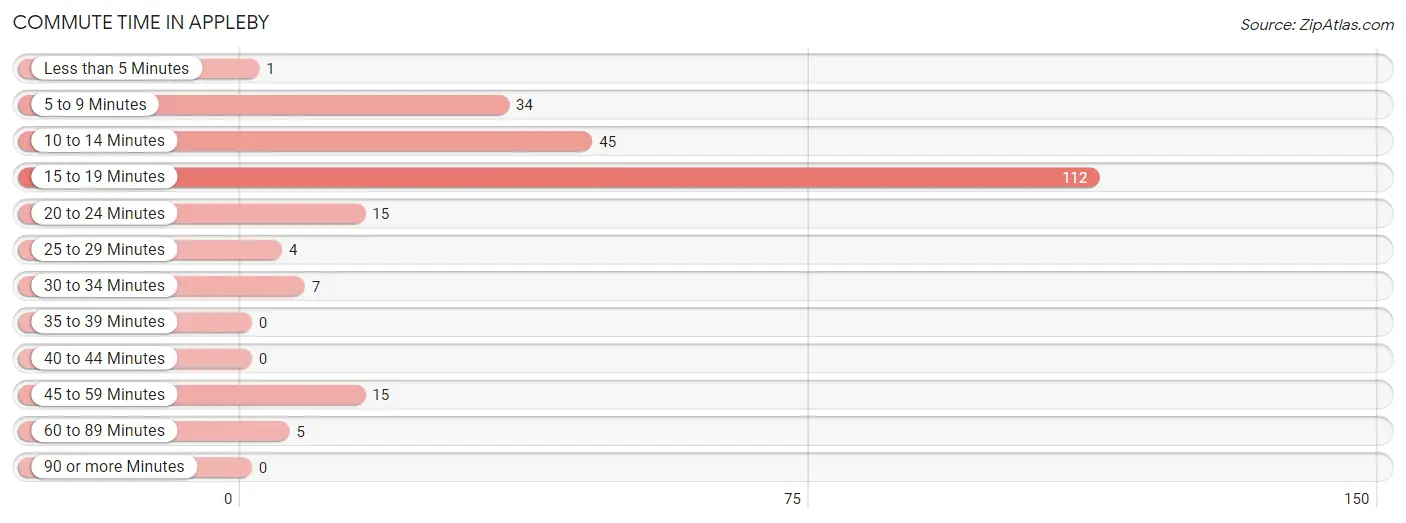
| Commute Time | # Commuters | % Commuters |
| Less than 5 Minutes | 1 | 0.4% |
| 5 to 9 Minutes | 34 | 14.3% |
| 10 to 14 Minutes | 45 | 18.9% |
| 15 to 19 Minutes | 112 | 47.1% |
| 20 to 24 Minutes | 15 | 6.3% |
| 25 to 29 Minutes | 4 | 1.7% |
| 30 to 34 Minutes | 7 | 2.9% |
| 35 to 39 Minutes | 0 | 0.0% |
| 40 to 44 Minutes | 0 | 0.0% |
| 45 to 59 Minutes | 15 | 6.3% |
| 60 to 89 Minutes | 5 | 2.1% |
| 90 or more Minutes | 0 | 0.0% |
Commute Time by Sex in Appleby
The most common commute times in Appleby are 15 to 19 minutes (54 commuters, 42.9%) for males and 15 to 19 minutes (58 commuters, 51.8%) for females.
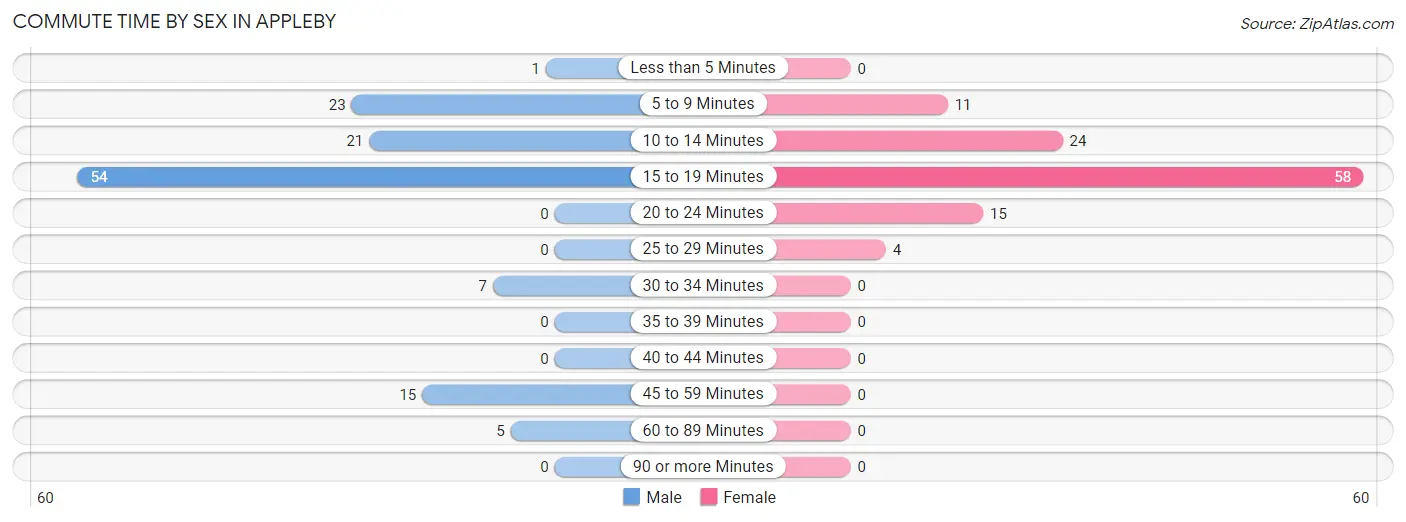
| Commute Time | Male | Female |
| Less than 5 Minutes | 1 (0.8%) | 0 (0.0%) |
| 5 to 9 Minutes | 23 (18.2%) | 11 (9.8%) |
| 10 to 14 Minutes | 21 (16.7%) | 24 (21.4%) |
| 15 to 19 Minutes | 54 (42.9%) | 58 (51.8%) |
| 20 to 24 Minutes | 0 (0.0%) | 15 (13.4%) |
| 25 to 29 Minutes | 0 (0.0%) | 4 (3.6%) |
| 30 to 34 Minutes | 7 (5.6%) | 0 (0.0%) |
| 35 to 39 Minutes | 0 (0.0%) | 0 (0.0%) |
| 40 to 44 Minutes | 0 (0.0%) | 0 (0.0%) |
| 45 to 59 Minutes | 15 (11.9%) | 0 (0.0%) |
| 60 to 89 Minutes | 5 (4.0%) | 0 (0.0%) |
| 90 or more Minutes | 0 (0.0%) | 0 (0.0%) |
Time of Departure to Work by Sex in Appleby
The most frequent times of departure to work in Appleby are 9:00 AM to 9:59 AM (35, 27.8%) for males and 7:30 AM to 7:59 AM (49, 43.8%) for females.
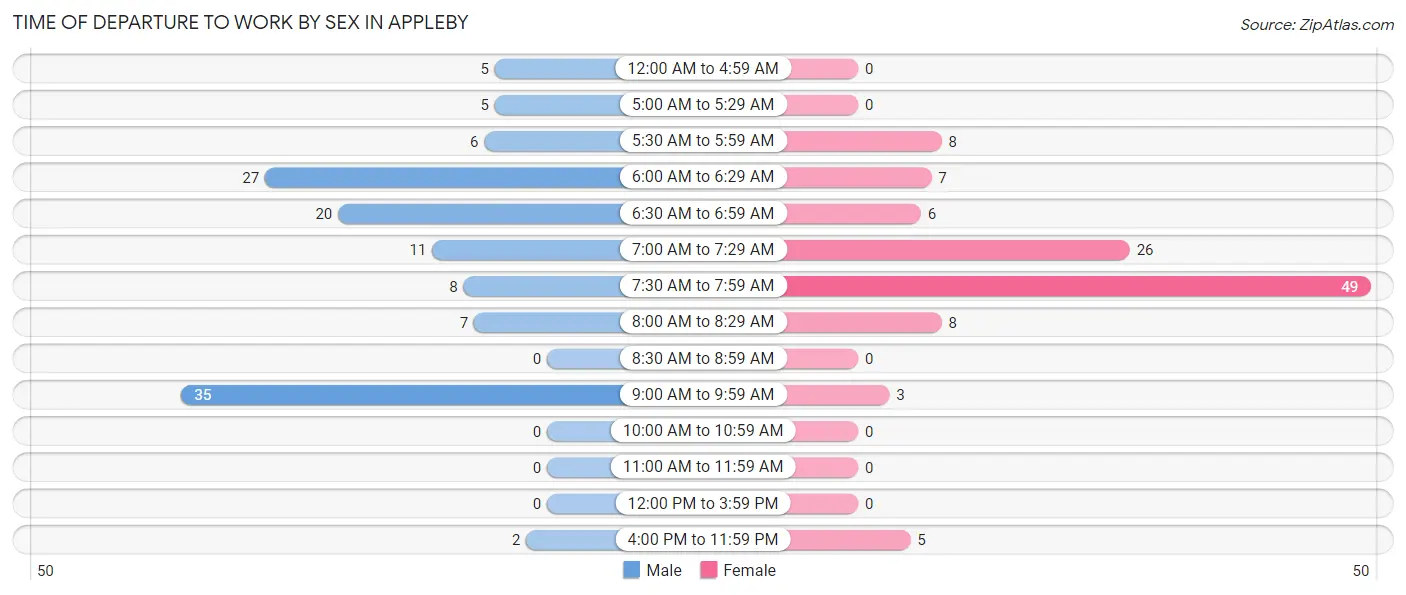
| Time of Departure | Male | Female |
| 12:00 AM to 4:59 AM | 5 (4.0%) | 0 (0.0%) |
| 5:00 AM to 5:29 AM | 5 (4.0%) | 0 (0.0%) |
| 5:30 AM to 5:59 AM | 6 (4.8%) | 8 (7.1%) |
| 6:00 AM to 6:29 AM | 27 (21.4%) | 7 (6.2%) |
| 6:30 AM to 6:59 AM | 20 (15.9%) | 6 (5.4%) |
| 7:00 AM to 7:29 AM | 11 (8.7%) | 26 (23.2%) |
| 7:30 AM to 7:59 AM | 8 (6.4%) | 49 (43.8%) |
| 8:00 AM to 8:29 AM | 7 (5.6%) | 8 (7.1%) |
| 8:30 AM to 8:59 AM | 0 (0.0%) | 0 (0.0%) |
| 9:00 AM to 9:59 AM | 35 (27.8%) | 3 (2.7%) |
| 10:00 AM to 10:59 AM | 0 (0.0%) | 0 (0.0%) |
| 11:00 AM to 11:59 AM | 0 (0.0%) | 0 (0.0%) |
| 12:00 PM to 3:59 PM | 0 (0.0%) | 0 (0.0%) |
| 4:00 PM to 11:59 PM | 2 (1.6%) | 5 (4.5%) |
| Total | 126 (100.0%) | 112 (100.0%) |
Housing Occupancy in Appleby
Occupancy by Ownership in Appleby
Of the total 212 dwellings in Appleby, owner-occupied units account for 173 (81.6%), while renter-occupied units make up 39 (18.4%).
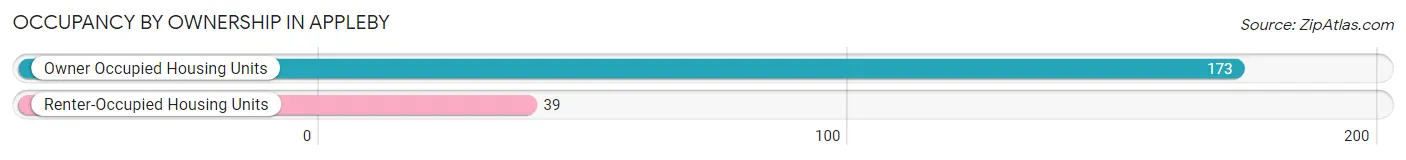
| Occupancy | # Housing Units | % Housing Units |
| Owner Occupied Housing Units | 173 | 81.6% |
| Renter-Occupied Housing Units | 39 | 18.4% |
| Total Occupied Housing Units | 212 | 100.0% |
Occupancy by Household Size in Appleby
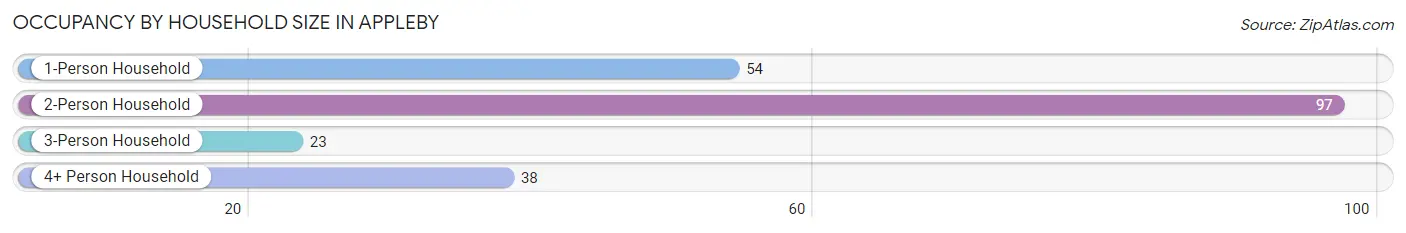
| Household Size | # Housing Units | % Housing Units |
| 1-Person Household | 54 | 25.5% |
| 2-Person Household | 97 | 45.8% |
| 3-Person Household | 23 | 10.8% |
| 4+ Person Household | 38 | 17.9% |
| Total Housing Units | 212 | 100.0% |
Occupancy by Ownership by Household Size in Appleby
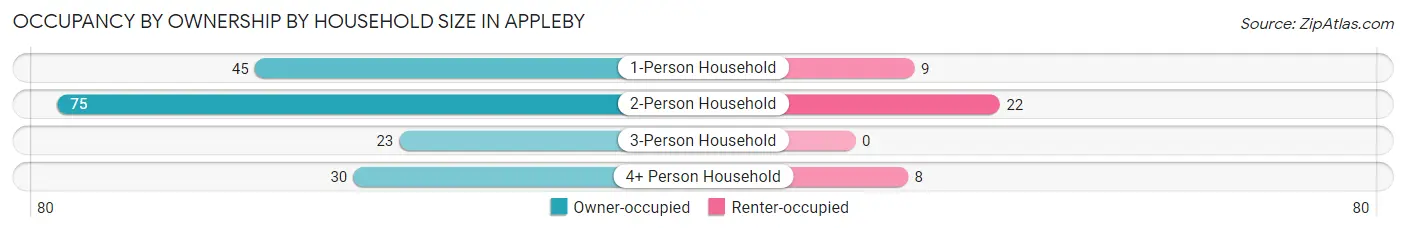
| Household Size | Owner-occupied | Renter-occupied |
| 1-Person Household | 45 (83.3%) | 9 (16.7%) |
| 2-Person Household | 75 (77.3%) | 22 (22.7%) |
| 3-Person Household | 23 (100.0%) | 0 (0.0%) |
| 4+ Person Household | 30 (78.9%) | 8 (21.0%) |
| Total Housing Units | 173 (81.6%) | 39 (18.4%) |
Occupancy by Educational Attainment in Appleby
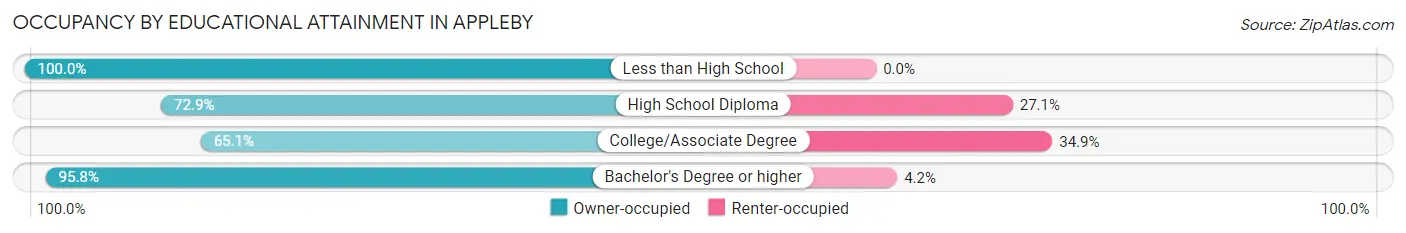
| Household Size | Owner-occupied | Renter-occupied |
| Less than High School | 5 (100.0%) | 0 (0.0%) |
| High School Diploma | 35 (72.9%) | 13 (27.1%) |
| College/Associate Degree | 41 (65.1%) | 22 (34.9%) |
| Bachelor's Degree or higher | 92 (95.8%) | 4 (4.2%) |
Occupancy by Age of Householder in Appleby
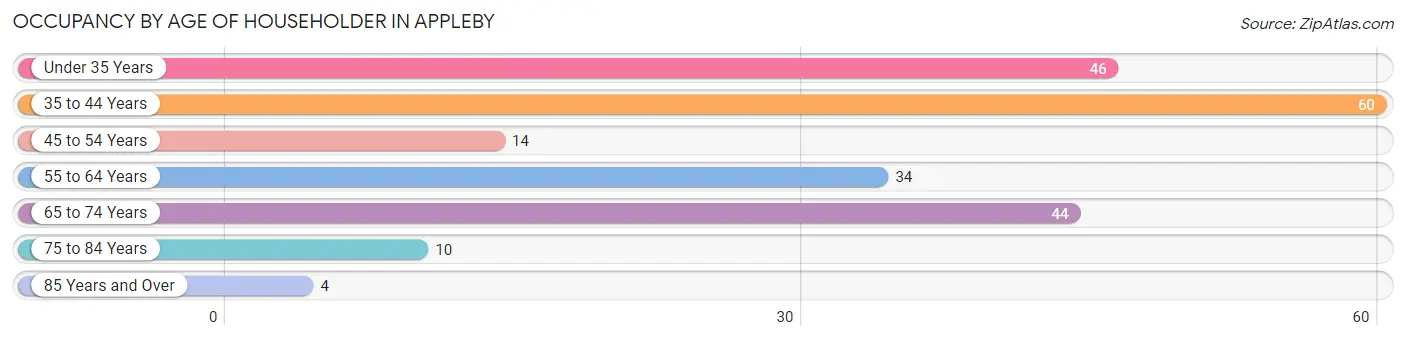
| Age Bracket | # Households | % Households |
| Under 35 Years | 46 | 21.7% |
| 35 to 44 Years | 60 | 28.3% |
| 45 to 54 Years | 14 | 6.6% |
| 55 to 64 Years | 34 | 16.0% |
| 65 to 74 Years | 44 | 20.7% |
| 75 to 84 Years | 10 | 4.7% |
| 85 Years and Over | 4 | 1.9% |
| Total | 212 | 100.0% |
Housing Finances in Appleby
Median Income by Occupancy in Appleby
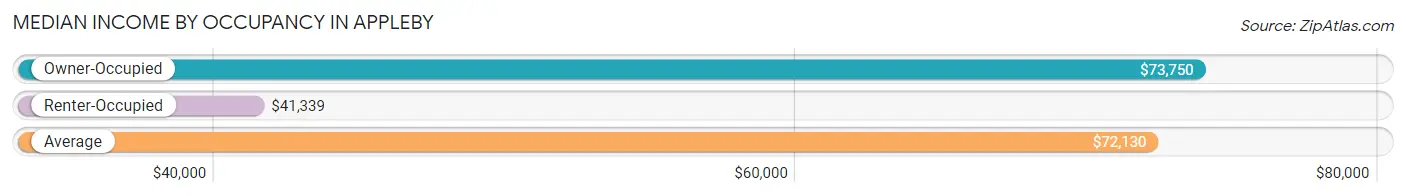
| Occupancy Type | # Households | Median Income |
| Owner-Occupied | 173 (81.6%) | $73,750 |
| Renter-Occupied | 39 (18.4%) | $41,339 |
| Average | 212 (100.0%) | $72,130 |
Occupancy by Householder Income Bracket in Appleby
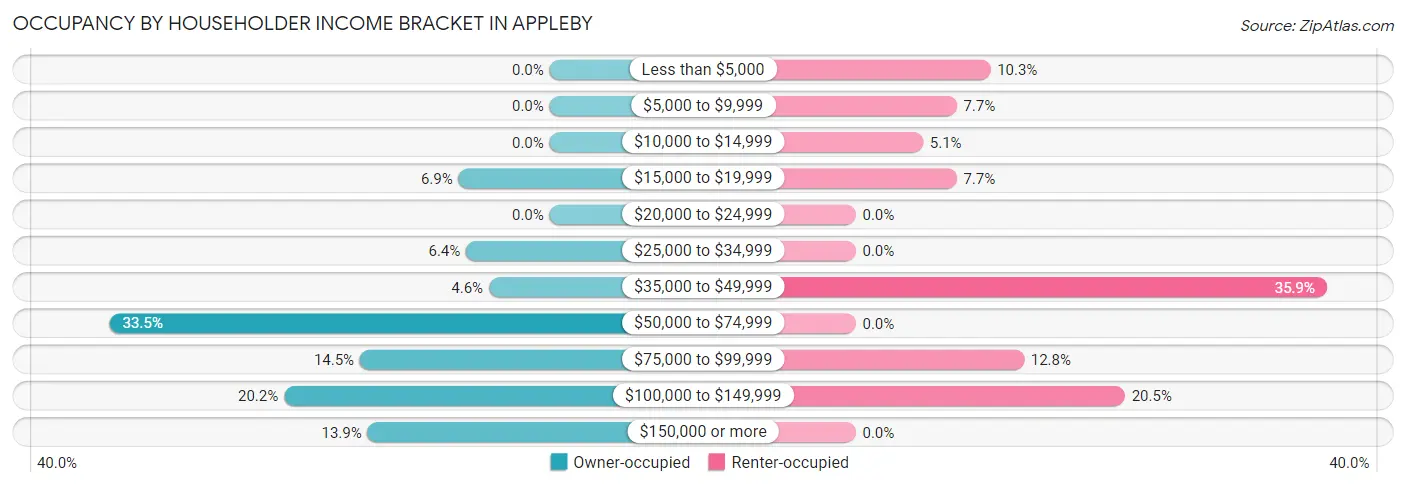
| Income Bracket | Owner-occupied | Renter-occupied |
| Less than $5,000 | 0 (0.0%) | 4 (10.3%) |
| $5,000 to $9,999 | 0 (0.0%) | 3 (7.7%) |
| $10,000 to $14,999 | 0 (0.0%) | 2 (5.1%) |
| $15,000 to $19,999 | 12 (6.9%) | 3 (7.7%) |
| $20,000 to $24,999 | 0 (0.0%) | 0 (0.0%) |
| $25,000 to $34,999 | 11 (6.4%) | 0 (0.0%) |
| $35,000 to $49,999 | 8 (4.6%) | 14 (35.9%) |
| $50,000 to $74,999 | 58 (33.5%) | 0 (0.0%) |
| $75,000 to $99,999 | 25 (14.4%) | 5 (12.8%) |
| $100,000 to $149,999 | 35 (20.2%) | 8 (20.5%) |
| $150,000 or more | 24 (13.9%) | 0 (0.0%) |
| Total | 173 (100.0%) | 39 (100.0%) |
Monthly Housing Cost Tiers in Appleby
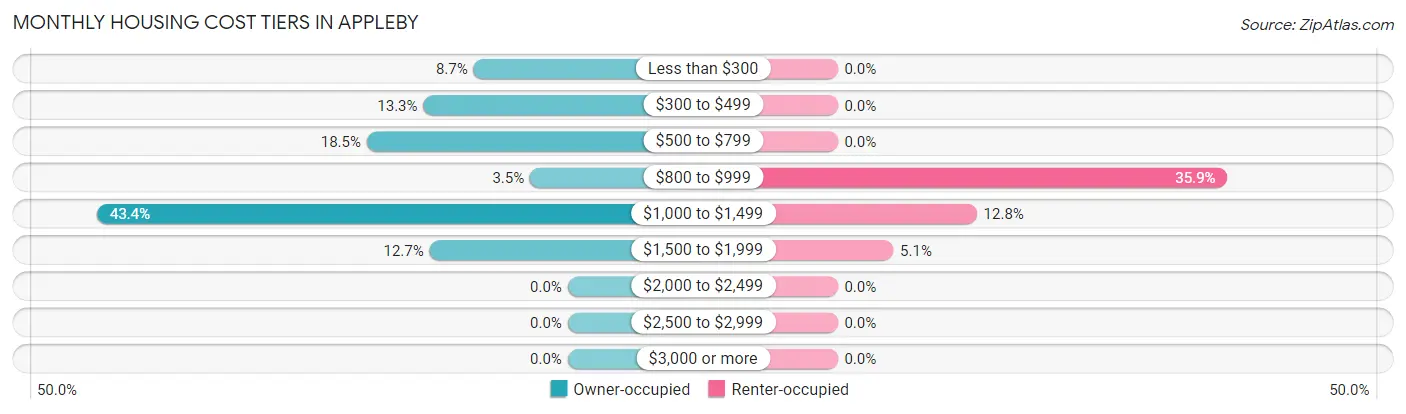
| Monthly Cost | Owner-occupied | Renter-occupied |
| Less than $300 | 15 (8.7%) | 0 (0.0%) |
| $300 to $499 | 23 (13.3%) | 0 (0.0%) |
| $500 to $799 | 32 (18.5%) | 0 (0.0%) |
| $800 to $999 | 6 (3.5%) | 14 (35.9%) |
| $1,000 to $1,499 | 75 (43.3%) | 5 (12.8%) |
| $1,500 to $1,999 | 22 (12.7%) | 2 (5.1%) |
| $2,000 to $2,499 | 0 (0.0%) | 0 (0.0%) |
| $2,500 to $2,999 | 0 (0.0%) | 0 (0.0%) |
| $3,000 or more | 0 (0.0%) | 0 (0.0%) |
| Total | 173 (100.0%) | 39 (100.0%) |
Physical Housing Characteristics in Appleby
Housing Structures in Appleby
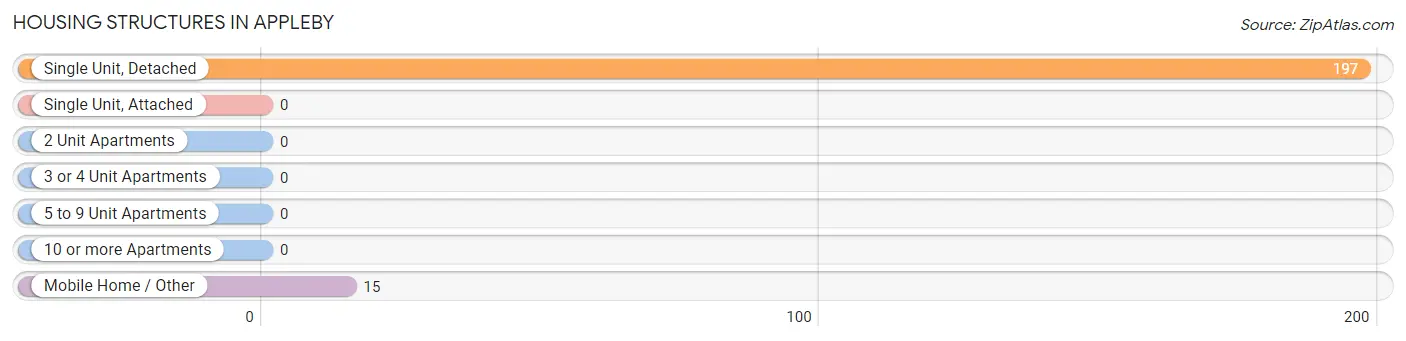
| Structure Type | # Housing Units | % Housing Units |
| Single Unit, Detached | 197 | 92.9% |
| Single Unit, Attached | 0 | 0.0% |
| 2 Unit Apartments | 0 | 0.0% |
| 3 or 4 Unit Apartments | 0 | 0.0% |
| 5 to 9 Unit Apartments | 0 | 0.0% |
| 10 or more Apartments | 0 | 0.0% |
| Mobile Home / Other | 15 | 7.1% |
| Total | 212 | 100.0% |
Housing Structures by Occupancy in Appleby
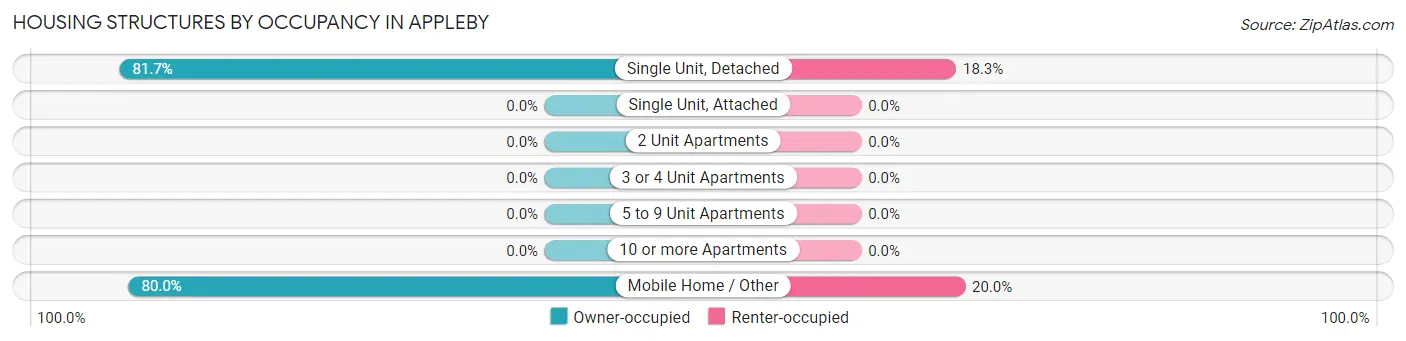
| Structure Type | Owner-occupied | Renter-occupied |
| Single Unit, Detached | 161 (81.7%) | 36 (18.3%) |
| Single Unit, Attached | 0 (0.0%) | 0 (0.0%) |
| 2 Unit Apartments | 0 (0.0%) | 0 (0.0%) |
| 3 or 4 Unit Apartments | 0 (0.0%) | 0 (0.0%) |
| 5 to 9 Unit Apartments | 0 (0.0%) | 0 (0.0%) |
| 10 or more Apartments | 0 (0.0%) | 0 (0.0%) |
| Mobile Home / Other | 12 (80.0%) | 3 (20.0%) |
| Total | 173 (81.6%) | 39 (18.4%) |
Housing Structures by Number of Rooms in Appleby
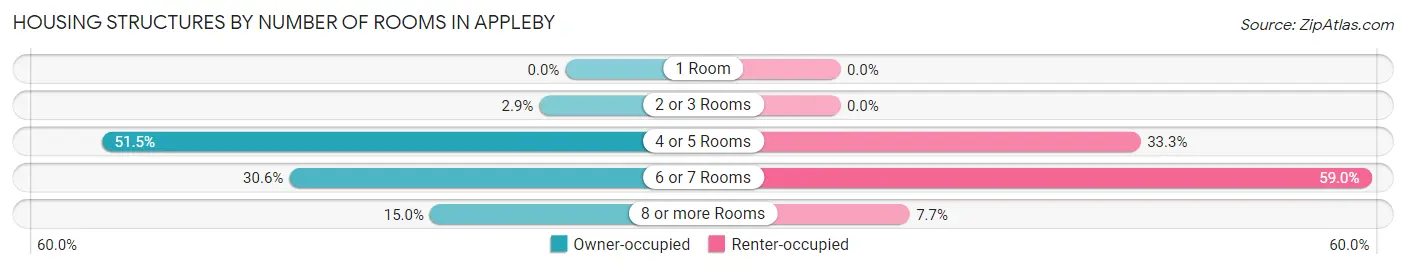
| Number of Rooms | Owner-occupied | Renter-occupied |
| 1 Room | 0 (0.0%) | 0 (0.0%) |
| 2 or 3 Rooms | 5 (2.9%) | 0 (0.0%) |
| 4 or 5 Rooms | 89 (51.4%) | 13 (33.3%) |
| 6 or 7 Rooms | 53 (30.6%) | 23 (59.0%) |
| 8 or more Rooms | 26 (15.0%) | 3 (7.7%) |
| Total | 173 (100.0%) | 39 (100.0%) |
Housing Structure by Heating Type in Appleby
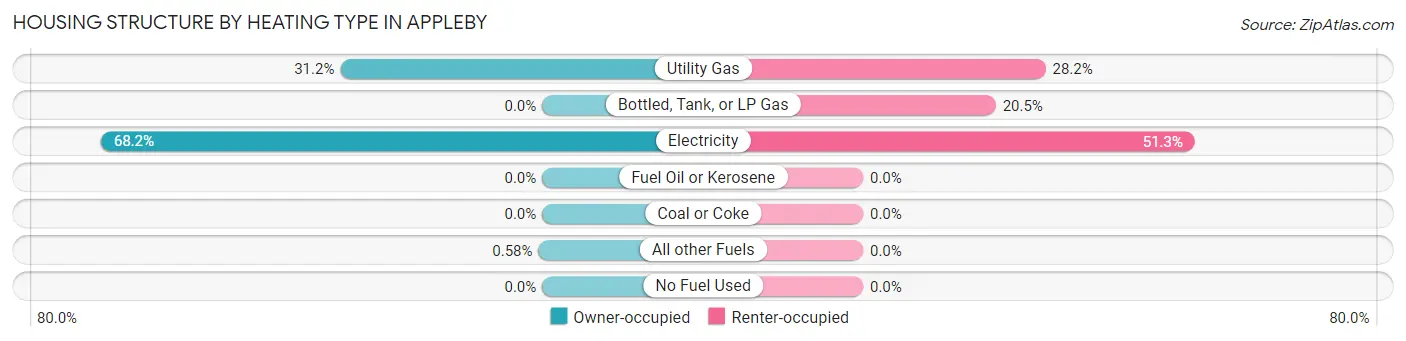
| Heating Type | Owner-occupied | Renter-occupied |
| Utility Gas | 54 (31.2%) | 11 (28.2%) |
| Bottled, Tank, or LP Gas | 0 (0.0%) | 8 (20.5%) |
| Electricity | 118 (68.2%) | 20 (51.3%) |
| Fuel Oil or Kerosene | 0 (0.0%) | 0 (0.0%) |
| Coal or Coke | 0 (0.0%) | 0 (0.0%) |
| All other Fuels | 1 (0.6%) | 0 (0.0%) |
| No Fuel Used | 0 (0.0%) | 0 (0.0%) |
| Total | 173 (100.0%) | 39 (100.0%) |
Household Vehicle Usage in Appleby
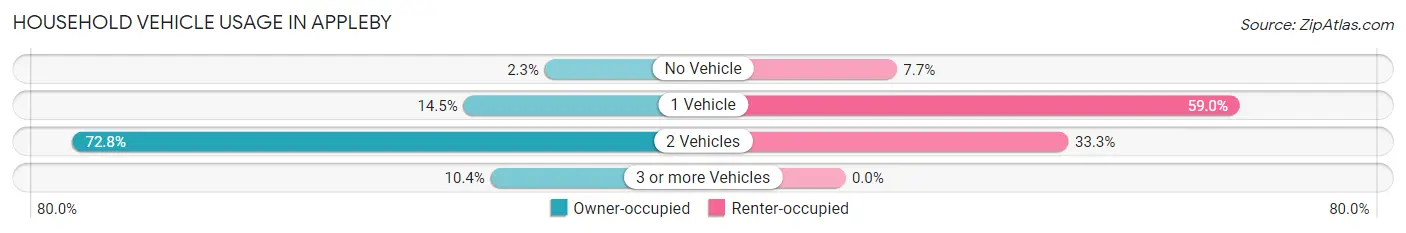
| Vehicles per Household | Owner-occupied | Renter-occupied |
| No Vehicle | 4 (2.3%) | 3 (7.7%) |
| 1 Vehicle | 25 (14.4%) | 23 (59.0%) |
| 2 Vehicles | 126 (72.8%) | 13 (33.3%) |
| 3 or more Vehicles | 18 (10.4%) | 0 (0.0%) |
| Total | 173 (100.0%) | 39 (100.0%) |
Real Estate & Mortgages in Appleby
Real Estate and Mortgage Overview in Appleby
| Characteristic | Without Mortgage | With Mortgage |
| Housing Units | 63 | 110 |
| Median Property Value | $195,800 | $206,500 |
| Median Household Income | $55,938 | $11 |
| Monthly Housing Costs | $441 | $0 |
| Real Estate Taxes | $1,625 | $0 |
Property Value by Mortgage Status in Appleby
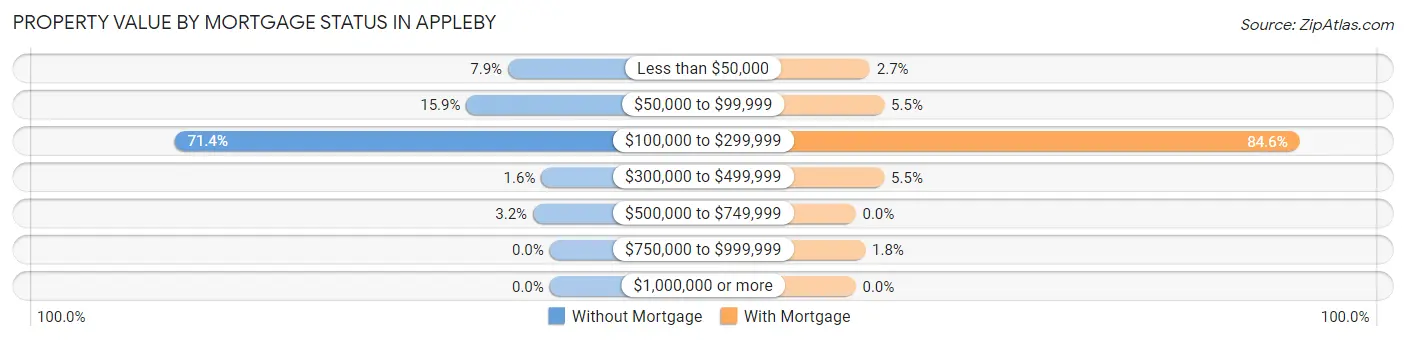
| Property Value | Without Mortgage | With Mortgage |
| Less than $50,000 | 5 (7.9%) | 3 (2.7%) |
| $50,000 to $99,999 | 10 (15.9%) | 6 (5.4%) |
| $100,000 to $299,999 | 45 (71.4%) | 93 (84.6%) |
| $300,000 to $499,999 | 1 (1.6%) | 6 (5.4%) |
| $500,000 to $749,999 | 2 (3.2%) | 0 (0.0%) |
| $750,000 to $999,999 | 0 (0.0%) | 2 (1.8%) |
| $1,000,000 or more | 0 (0.0%) | 0 (0.0%) |
| Total | 63 (100.0%) | 110 (100.0%) |
Household Income by Mortgage Status in Appleby
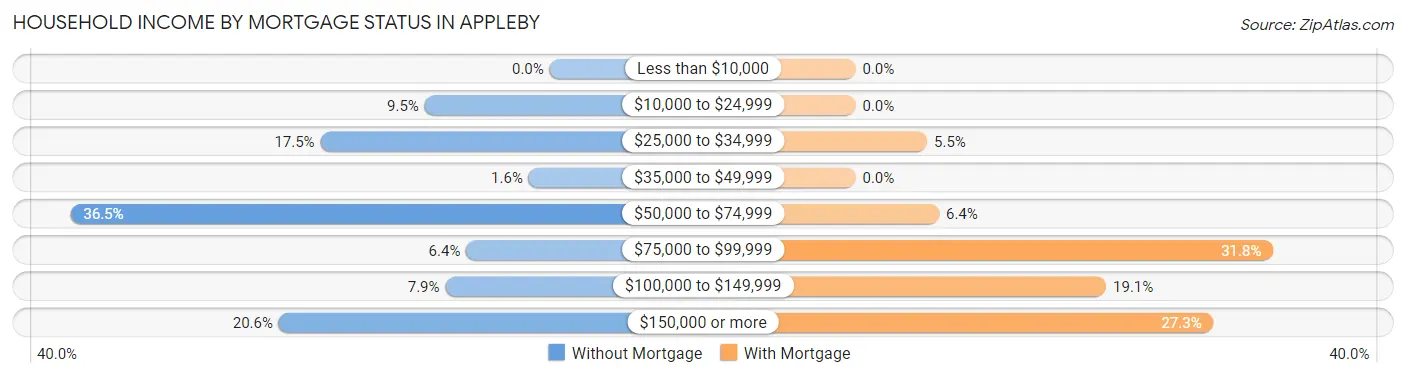
| Household Income | Without Mortgage | With Mortgage |
| Less than $10,000 | 0 (0.0%) | 0 (0.0%) |
| $10,000 to $24,999 | 6 (9.5%) | 0 (0.0%) |
| $25,000 to $34,999 | 11 (17.5%) | 6 (5.4%) |
| $35,000 to $49,999 | 1 (1.6%) | 0 (0.0%) |
| $50,000 to $74,999 | 23 (36.5%) | 7 (6.4%) |
| $75,000 to $99,999 | 4 (6.4%) | 35 (31.8%) |
| $100,000 to $149,999 | 5 (7.9%) | 21 (19.1%) |
| $150,000 or more | 13 (20.6%) | 30 (27.3%) |
| Total | 63 (100.0%) | 110 (100.0%) |
Property Value to Household Income Ratio in Appleby
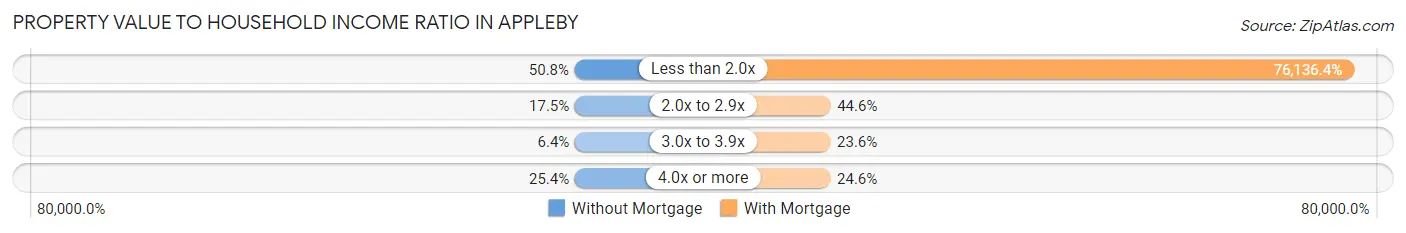
| Value-to-Income Ratio | Without Mortgage | With Mortgage |
| Less than 2.0x | 32 (50.8%) | 83,750 (76,136.4%) |
| 2.0x to 2.9x | 11 (17.5%) | 49 (44.6%) |
| 3.0x to 3.9x | 4 (6.4%) | 26 (23.6%) |
| 4.0x or more | 16 (25.4%) | 27 (24.5%) |
| Total | 63 (100.0%) | 110 (100.0%) |
Real Estate Taxes by Mortgage Status in Appleby
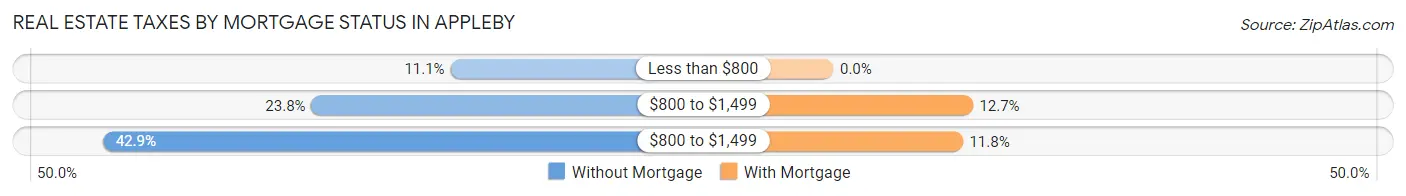
| Property Taxes | Without Mortgage | With Mortgage |
| Less than $800 | 7 (11.1%) | 0 (0.0%) |
| $800 to $1,499 | 15 (23.8%) | 14 (12.7%) |
| $800 to $1,499 | 27 (42.9%) | 13 (11.8%) |
| Total | 63 (100.0%) | 110 (100.0%) |
Health & Disability in Appleby
Health Insurance Coverage by Age in Appleby
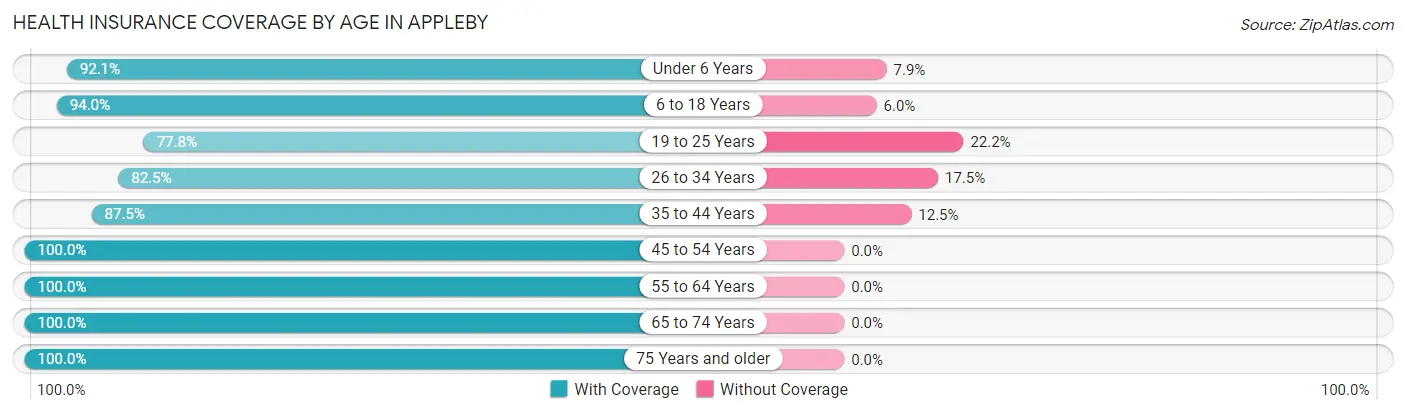
| Age Bracket | With Coverage | Without Coverage |
| Under 6 Years | 35 (92.1%) | 3 (7.9%) |
| 6 to 18 Years | 78 (94.0%) | 5 (6.0%) |
| 19 to 25 Years | 14 (77.8%) | 4 (22.2%) |
| 26 to 34 Years | 85 (82.5%) | 18 (17.5%) |
| 35 to 44 Years | 70 (87.5%) | 10 (12.5%) |
| 45 to 54 Years | 32 (100.0%) | 0 (0.0%) |
| 55 to 64 Years | 55 (100.0%) | 0 (0.0%) |
| 65 to 74 Years | 61 (100.0%) | 0 (0.0%) |
| 75 Years and older | 20 (100.0%) | 0 (0.0%) |
| Total | 450 (91.8%) | 40 (8.2%) |
Health Insurance Coverage by Citizenship Status in Appleby
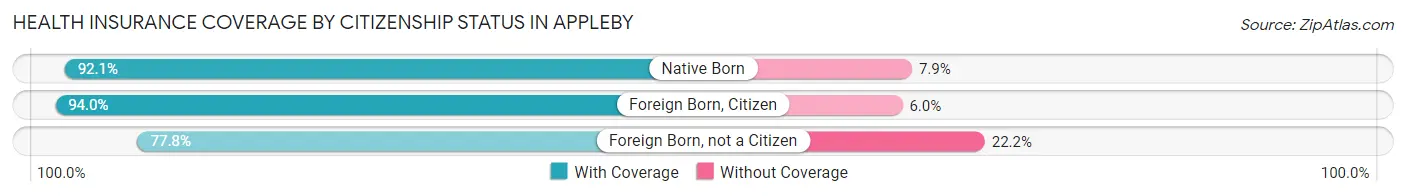
| Citizenship Status | With Coverage | Without Coverage |
| Native Born | 35 (92.1%) | 3 (7.9%) |
| Foreign Born, Citizen | 78 (94.0%) | 5 (6.0%) |
| Foreign Born, not a Citizen | 14 (77.8%) | 4 (22.2%) |
Health Insurance Coverage by Household Income in Appleby
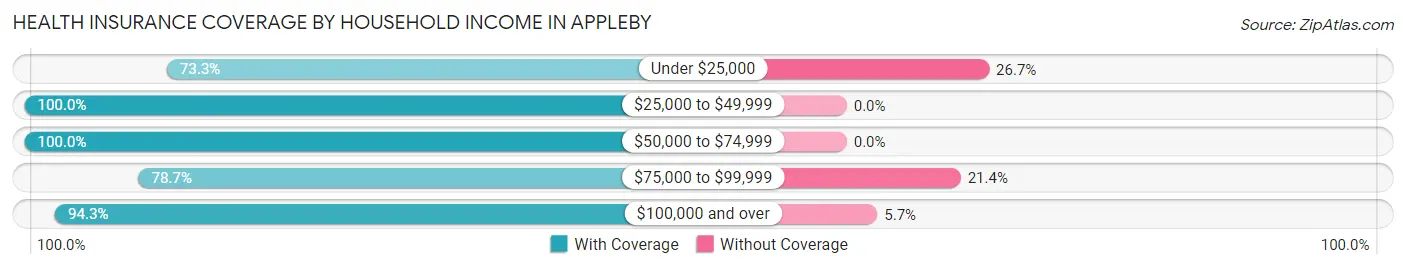
| Household Income | With Coverage | Without Coverage |
| Under $25,000 | 22 (73.3%) | 8 (26.7%) |
| $25,000 to $49,999 | 49 (100.0%) | 0 (0.0%) |
| $50,000 to $74,999 | 95 (100.0%) | 0 (0.0%) |
| $75,000 to $99,999 | 70 (78.6%) | 19 (21.3%) |
| $100,000 and over | 214 (94.3%) | 13 (5.7%) |
Public vs Private Health Insurance Coverage by Age in Appleby
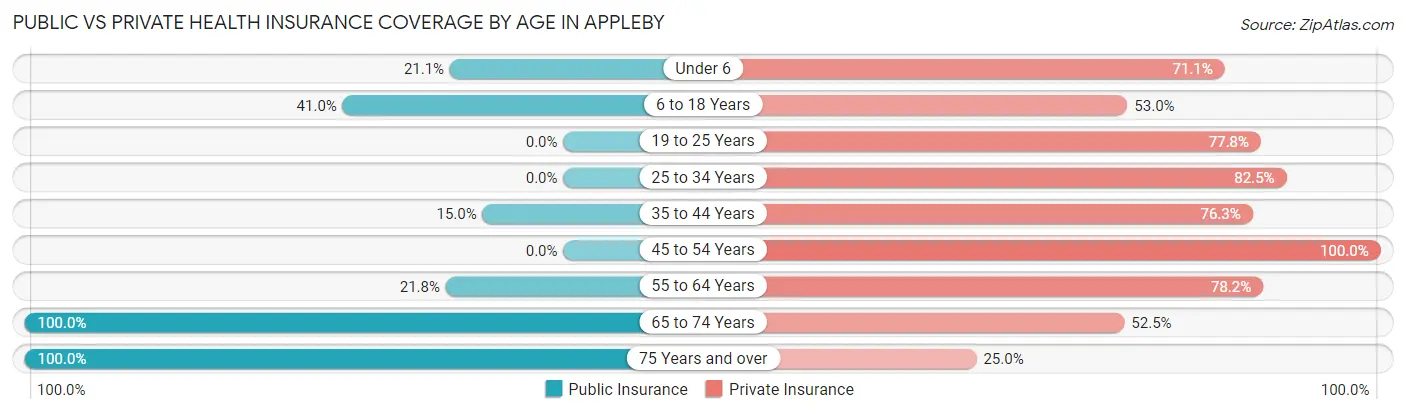
| Age Bracket | Public Insurance | Private Insurance |
| Under 6 | 8 (21.0%) | 27 (71.1%) |
| 6 to 18 Years | 34 (41.0%) | 44 (53.0%) |
| 19 to 25 Years | 0 (0.0%) | 14 (77.8%) |
| 25 to 34 Years | 0 (0.0%) | 85 (82.5%) |
| 35 to 44 Years | 12 (15.0%) | 61 (76.2%) |
| 45 to 54 Years | 0 (0.0%) | 32 (100.0%) |
| 55 to 64 Years | 12 (21.8%) | 43 (78.2%) |
| 65 to 74 Years | 61 (100.0%) | 32 (52.5%) |
| 75 Years and over | 20 (100.0%) | 5 (25.0%) |
| Total | 147 (30.0%) | 343 (70.0%) |
Disability Status by Sex by Age in Appleby
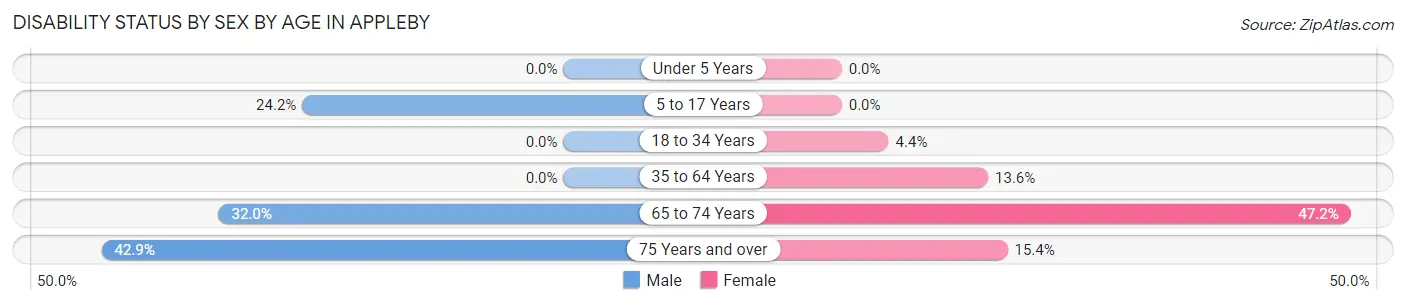
| Age Bracket | Male | Female |
| Under 5 Years | 0 (0.0%) | 0 (0.0%) |
| 5 to 17 Years | 8 (24.2%) | 0 (0.0%) |
| 18 to 34 Years | 0 (0.0%) | 3 (4.3%) |
| 35 to 64 Years | 0 (0.0%) | 11 (13.6%) |
| 65 to 74 Years | 8 (32.0%) | 17 (47.2%) |
| 75 Years and over | 3 (42.9%) | 2 (15.4%) |
Disability Class by Sex by Age in Appleby
Disability Class: Hearing Difficulty
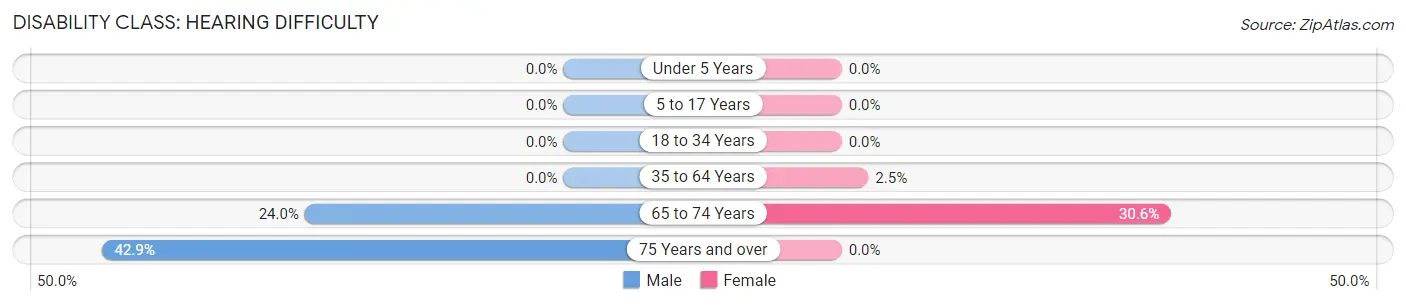
| Age Bracket | Male | Female |
| Under 5 Years | 0 (0.0%) | 0 (0.0%) |
| 5 to 17 Years | 0 (0.0%) | 0 (0.0%) |
| 18 to 34 Years | 0 (0.0%) | 0 (0.0%) |
| 35 to 64 Years | 0 (0.0%) | 2 (2.5%) |
| 65 to 74 Years | 6 (24.0%) | 11 (30.6%) |
| 75 Years and over | 3 (42.9%) | 0 (0.0%) |
Disability Class: Vision Difficulty
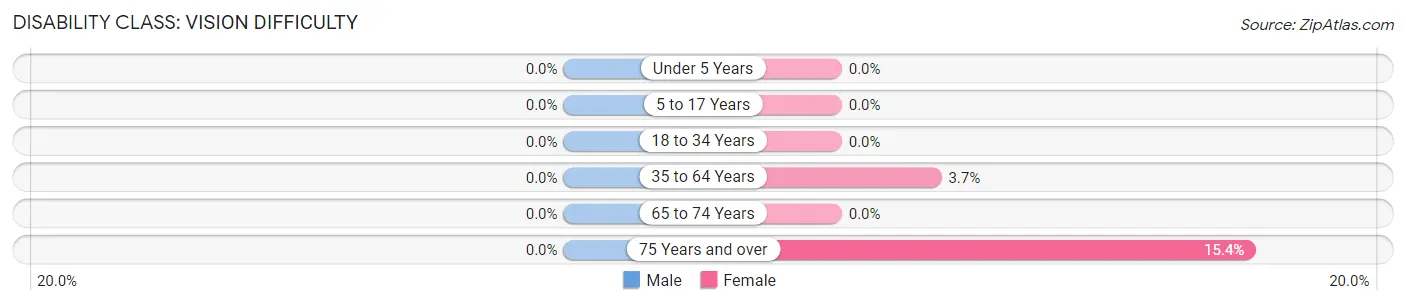
| Age Bracket | Male | Female |
| Under 5 Years | 0 (0.0%) | 0 (0.0%) |
| 5 to 17 Years | 0 (0.0%) | 0 (0.0%) |
| 18 to 34 Years | 0 (0.0%) | 0 (0.0%) |
| 35 to 64 Years | 0 (0.0%) | 3 (3.7%) |
| 65 to 74 Years | 0 (0.0%) | 0 (0.0%) |
| 75 Years and over | 0 (0.0%) | 2 (15.4%) |
Disability Class: Cognitive Difficulty
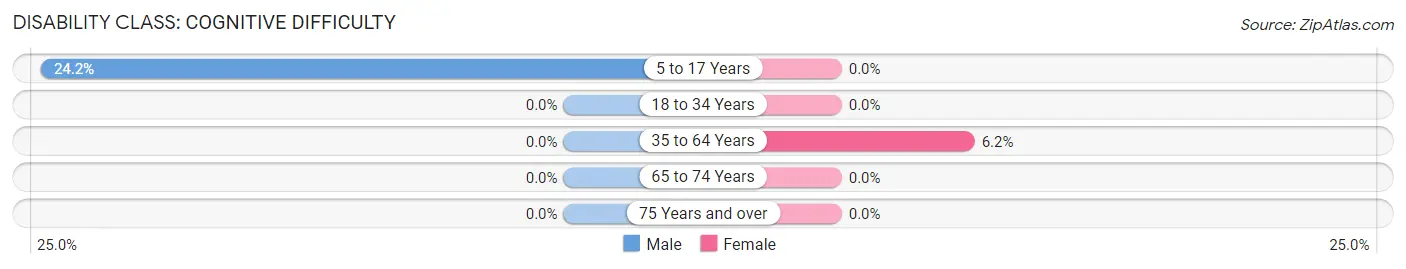
| Age Bracket | Male | Female |
| 5 to 17 Years | 8 (24.2%) | 0 (0.0%) |
| 18 to 34 Years | 0 (0.0%) | 0 (0.0%) |
| 35 to 64 Years | 0 (0.0%) | 5 (6.2%) |
| 65 to 74 Years | 0 (0.0%) | 0 (0.0%) |
| 75 Years and over | 0 (0.0%) | 0 (0.0%) |
Disability Class: Ambulatory Difficulty
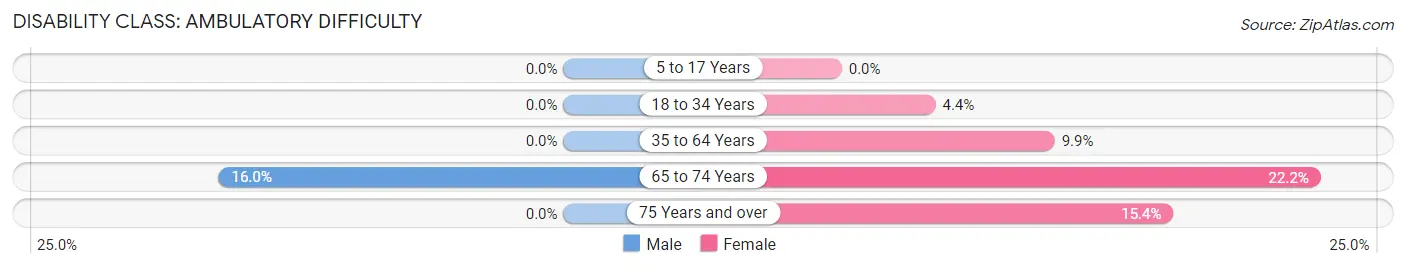
| Age Bracket | Male | Female |
| 5 to 17 Years | 0 (0.0%) | 0 (0.0%) |
| 18 to 34 Years | 0 (0.0%) | 3 (4.3%) |
| 35 to 64 Years | 0 (0.0%) | 8 (9.9%) |
| 65 to 74 Years | 4 (16.0%) | 8 (22.2%) |
| 75 Years and over | 0 (0.0%) | 2 (15.4%) |
Disability Class: Self-Care Difficulty
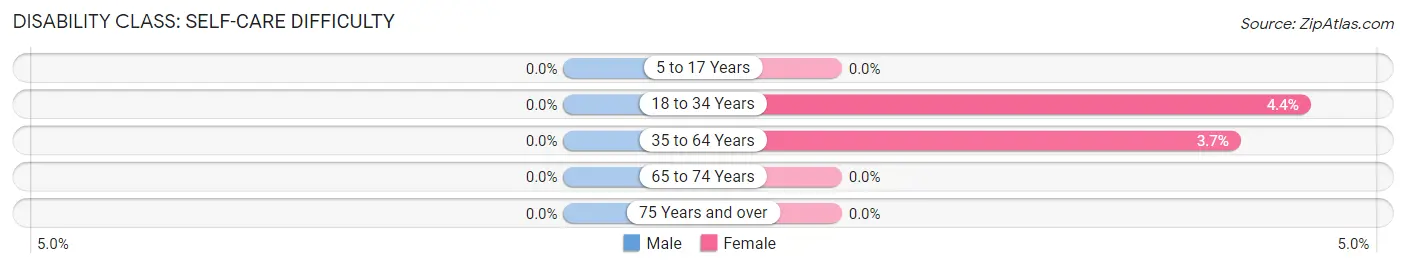
| Age Bracket | Male | Female |
| 5 to 17 Years | 0 (0.0%) | 0 (0.0%) |
| 18 to 34 Years | 0 (0.0%) | 3 (4.3%) |
| 35 to 64 Years | 0 (0.0%) | 3 (3.7%) |
| 65 to 74 Years | 0 (0.0%) | 0 (0.0%) |
| 75 Years and over | 0 (0.0%) | 0 (0.0%) |
Technology Access in Appleby
Computing Device Access in Appleby
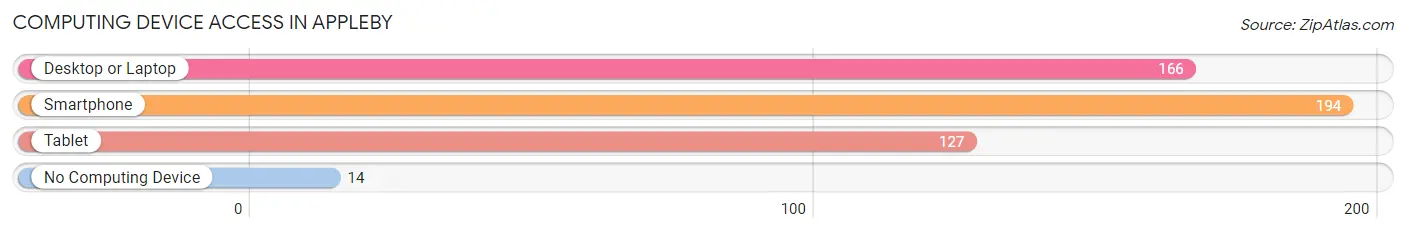
| Device Type | # Households | % Households |
| Desktop or Laptop | 166 | 78.3% |
| Smartphone | 194 | 91.5% |
| Tablet | 127 | 59.9% |
| No Computing Device | 14 | 6.6% |
| Total | 212 | 100.0% |
Internet Access in Appleby
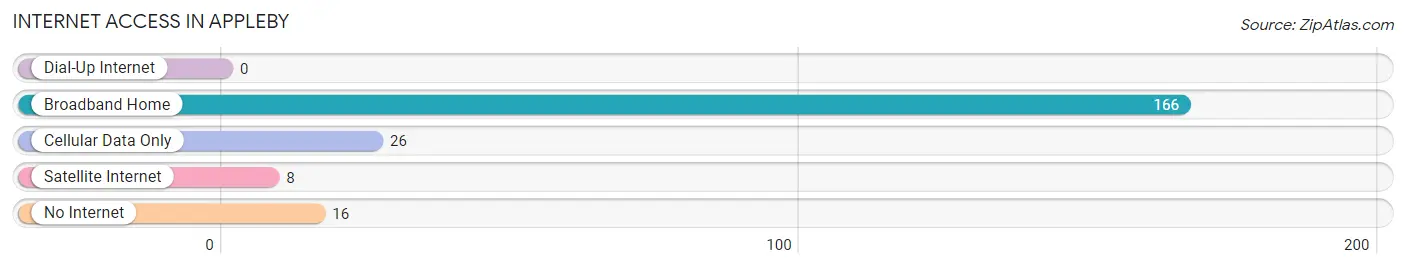
| Internet Type | # Households | % Households |
| Dial-Up Internet | 0 | 0.0% |
| Broadband Home | 166 | 78.3% |
| Cellular Data Only | 26 | 12.3% |
| Satellite Internet | 8 | 3.8% |
| No Internet | 16 | 7.5% |
| Total | 212 | 100.0% |
Appleby Summary
Appleby, Texas is a small town located in the northeastern corner of the state, near the border of Louisiana. It is part of the Nacogdoches County and is situated on the banks of the Sabine River. The town was founded in 1837 and was named after the first settler, William Appleby.
History
Appleby was founded in 1837 by William Appleby, who was a veteran of the Texas Revolution. He was granted a land grant from the Republic of Texas and established a homestead in the area. The town was originally known as Appleby’s Settlement, but was later changed to Appleby.
The town grew slowly but steadily over the years, and by the late 19th century, it had become a thriving community. The town was home to several businesses, including a general store, a blacksmith shop, a cotton gin, and a sawmill.
In the early 20th century, Appleby was a major center for the timber industry. The town was home to several sawmills and lumber companies, and the timber industry provided many jobs for the residents.
The town was also home to several churches, including the First Baptist Church, which was founded in 1845. The church is still active today and is the oldest church in Nacogdoches County.
Geography
Appleby is located in the northeastern corner of Texas, near the border of Louisiana. It is situated on the banks of the Sabine River, which is a major tributary of the Red River. The town is surrounded by rolling hills and is located in a rural area.
The climate in Appleby is humid subtropical, with hot summers and mild winters. The average annual temperature is around 70 degrees Fahrenheit, and the average annual precipitation is around 40 inches.
Economy
The economy of Appleby is largely based on agriculture and timber. The town is home to several farms, and the timber industry is still a major employer in the area.
The town is also home to several small businesses, including a general store, a hardware store, and a few restaurants.
Demographics
As of the 2010 census, the population of Appleby was 1,093. The racial makeup of the town was 94.3% White, 2.2% African American, 0.7% Native American, 0.3% Asian, and 2.5% from other races.
The median household income in Appleby was $31,250, and the median family income was $37,500. The per capita income was $17,857.
Conclusion
Appleby, Texas is a small town located in the northeastern corner of the state, near the border of Louisiana. It was founded in 1837 and has a rich history and culture. The economy of the town is largely based on agriculture and timber, and the town is home to several small businesses. The population of Appleby is 1,093, and the median household income is $31,250.
Common Questions
What is Per Capita Income in Appleby?
Per Capita income in Appleby is $35,137.
What is the Median Family Income in Appleby?
Median Family Income in Appleby is $97,125.
What is the Median Household income in Appleby?
Median Household Income in Appleby is $72,130.
What is Income or Wage Gap in Appleby?
Income or Wage Gap in Appleby is 29.8%.
Women in Appleby earn 70.2 cents for every dollar earned by a man.
What is Inequality or Gini Index in Appleby?
Inequality or Gini Index in Appleby is 0.33.
What is the Total Population of Appleby?
Total Population of Appleby is 490.
What is the Total Male Population of Appleby?
Total Male Population of Appleby is 224.
What is the Total Female Population of Appleby?
Total Female Population of Appleby is 266.
What is the Ratio of Males per 100 Females in Appleby?
There are 84.21 Males per 100 Females in Appleby.
What is the Ratio of Females per 100 Males in Appleby?
There are 118.75 Females per 100 Males in Appleby.
What is the Median Population Age in Appleby?
Median Population Age in Appleby is 35.1 Years.
What is the Average Family Size in Appleby
Average Family Size in Appleby is 2.9 People.
What is the Average Household Size in Appleby
Average Household Size in Appleby is 2.3 People.
How Large is the Labor Force in Appleby?
There are 284 People in the Labor Forcein in Appleby.
What is the Percentage of People in the Labor Force in Appleby?
74.9% of People are in the Labor Force in Appleby.
What is the Unemployment Rate in Appleby?
Unemployment Rate in Appleby is 5.6%.