Zip Codes with the Highest Percentage of Population Employed in Life, Physical & Social Science in Austin, TX
RELATED REPORTS & OPTIONS
Life, Physical & Social Science
Austin
Compare Zip Codes
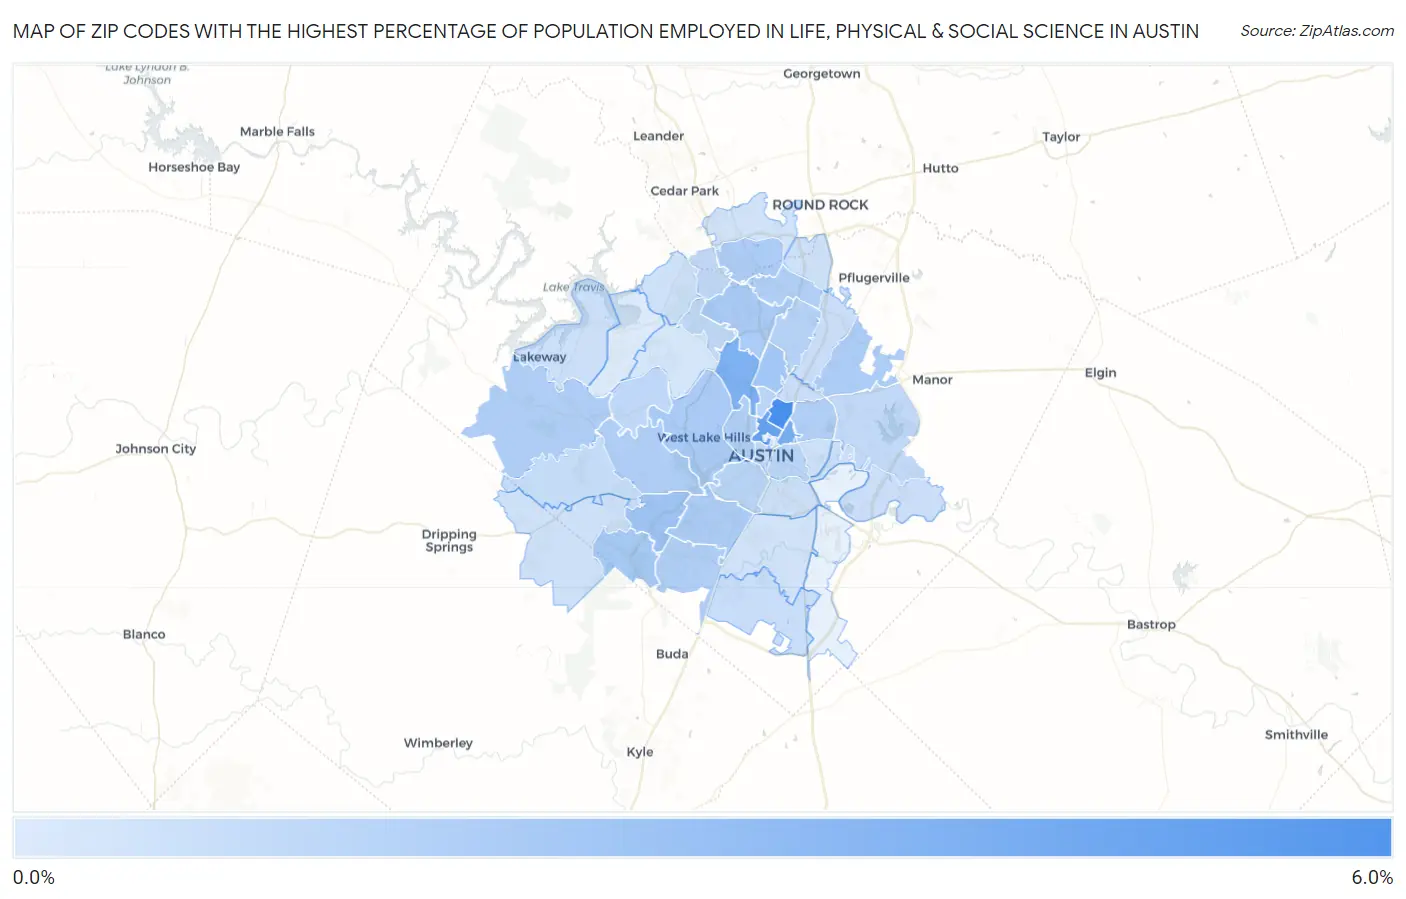
Map of Zip Codes with the Highest Percentage of Population Employed in Life, Physical & Social Science in Austin
0.11%
5.0%
Zip Codes with the Highest Percentage of Population Employed in Life, Physical & Social Science in Austin, TX
| Zip Code | % Employed | vs State | vs National | |
| 1. | 78751 | 5.0% | 0.84%(+4.21)#26 | 1.1%(+3.96)#750 |
| 2. | 78705 | 3.9% | 0.84%(+3.10)#42 | 1.1%(+2.86)#1,184 |
| 3. | 78722 | 3.4% | 0.84%(+2.60)#49 | 1.1%(+2.35)#1,464 |
| 4. | 78731 | 3.2% | 0.84%(+2.35)#59 | 1.1%(+2.10)#1,673 |
| 5. | 78749 | 2.0% | 0.84%(+1.19)#122 | 1.1%(+0.947)#3,574 |
| 6. | 78757 | 2.0% | 0.84%(+1.16)#125 | 1.1%(+0.908)#3,692 |
| 7. | 78739 | 1.8% | 0.84%(+1.00)#148 | 1.1%(+0.752)#4,166 |
| 8. | 78759 | 1.8% | 0.84%(+0.945)#160 | 1.1%(+0.696)#4,367 |
| 9. | 78746 | 1.7% | 0.84%(+0.891)#171 | 1.1%(+0.642)#4,579 |
| 10. | 78729 | 1.7% | 0.84%(+0.867)#176 | 1.1%(+0.619)#4,678 |
| 11. | 78745 | 1.7% | 0.84%(+0.850)#180 | 1.1%(+0.602)#4,767 |
| 12. | 78754 | 1.7% | 0.84%(+0.809)#188 | 1.1%(+0.560)#4,936 |
| 13. | 78738 | 1.6% | 0.84%(+0.774)#197 | 1.1%(+0.526)#5,085 |
| 14. | 78735 | 1.6% | 0.84%(+0.742)#204 | 1.1%(+0.494)#5,224 |
| 15. | 78723 | 1.6% | 0.84%(+0.711)#209 | 1.1%(+0.463)#5,363 |
| 16. | 78727 | 1.5% | 0.84%(+0.691)#217 | 1.1%(+0.442)#5,480 |
| 17. | 78748 | 1.5% | 0.84%(+0.673)#221 | 1.1%(+0.425)#5,567 |
| 18. | 78703 | 1.5% | 0.84%(+0.664)#226 | 1.1%(+0.416)#5,625 |
| 19. | 78758 | 1.4% | 0.84%(+0.511)#267 | 1.1%(+0.263)#6,456 |
| 20. | 78756 | 1.2% | 0.84%(+0.378)#310 | 1.1%(+0.130)#7,335 |
| 21. | 78702 | 1.2% | 0.84%(+0.376)#313 | 1.1%(+0.128)#7,358 |
| 22. | 78704 | 1.2% | 0.84%(+0.375)#315 | 1.1%(+0.126)#7,367 |
| 23. | 78733 | 1.1% | 0.84%(+0.240)#375 | 1.1%(-0.008)#8,365 |
| 24. | 78750 | 0.98% | 0.84%(+0.140)#417 | 1.1%(-0.108)#9,214 |
| 25. | 78724 | 0.97% | 0.84%(+0.132)#424 | 1.1%(-0.116)#9,276 |
| 26. | 78736 | 0.89% | 0.84%(+0.045)#464 | 1.1%(-0.203)#10,071 |
| 27. | 78701 | 0.87% | 0.84%(+0.032)#471 | 1.1%(-0.216)#10,205 |
| 28. | 78747 | 0.78% | 0.84%(-0.059)#526 | 1.1%(-0.308)#11,163 |
| 29. | 78752 | 0.68% | 0.84%(-0.160)#586 | 1.1%(-0.408)#12,257 |
| 30. | 78725 | 0.68% | 0.84%(-0.160)#588 | 1.1%(-0.408)#12,264 |
| 31. | 78753 | 0.68% | 0.84%(-0.162)#592 | 1.1%(-0.410)#12,284 |
| 32. | 78734 | 0.65% | 0.84%(-0.192)#622 | 1.1%(-0.440)#12,651 |
| 33. | 78741 | 0.64% | 0.84%(-0.205)#626 | 1.1%(-0.453)#12,815 |
| 34. | 78721 | 0.60% | 0.84%(-0.243)#656 | 1.1%(-0.492)#13,310 |
| 35. | 78737 | 0.56% | 0.84%(-0.281)#683 | 1.1%(-0.529)#13,753 |
| 36. | 78726 | 0.55% | 0.84%(-0.297)#695 | 1.1%(-0.545)#13,959 |
| 37. | 78728 | 0.53% | 0.84%(-0.308)#706 | 1.1%(-0.557)#14,096 |
| 38. | 78717 | 0.46% | 0.84%(-0.379)#765 | 1.1%(-0.628)#14,975 |
| 39. | 78744 | 0.46% | 0.84%(-0.385)#770 | 1.1%(-0.633)#15,045 |
| 40. | 78730 | 0.36% | 0.84%(-0.487)#865 | 1.1%(-0.735)#16,343 |
| 41. | 78732 | 0.11% | 0.84%(-0.732)#1,079 | 1.1%(-0.980)#19,014 |
1
Common Questions
What are the Top 10 Zip Codes with the Highest Percentage of Population Employed in Life, Physical & Social Science in Austin, TX?
Top 10 Zip Codes with the Highest Percentage of Population Employed in Life, Physical & Social Science in Austin, TX are:
What zip code has the Highest Percentage of Population Employed in Life, Physical & Social Science in Austin, TX?
78751 has the Highest Percentage of Population Employed in Life, Physical & Social Science in Austin, TX with 5.0%.
What is the Percentage of Population Employed in Life, Physical & Social Science in Austin, TX?
Percentage of Population Employed in Life, Physical & Social Science in Austin is 1.5%.
What is the Percentage of Population Employed in Life, Physical & Social Science in Texas?
Percentage of Population Employed in Life, Physical & Social Science in Texas is 0.84%.
What is the Percentage of Population Employed in Life, Physical & Social Science in the United States?
Percentage of Population Employed in Life, Physical & Social Science in the United States is 1.1%.